proposed rates 2012-2014 rates process...2 for over a year, we have been discussing the fundamental...
TRANSCRIPT

Proposed Rates2012-2014
Mandates & Reliability

2
For over a year, we have been discussing the fundamental reasons why LADWP needs to increase Power & Water rates
Legal mandates are driving a complete transformation of our Energy and Water supplies
The past year has provided clarity on most of these mandates
A century of delivering Water and Power requires major investment in replacing infrastructure to maintain reliability
2

3
LEGAL MANDATE / CONDITION FINAL ACTION / CERTAINTY
Renewable Portfolio Standard
Once Thru Cooling at Coastal Power Plants
Cap & Trade / Carbon Emissions
CA Dept Of Public Health confirmed reservoir cover deadline cannot be extended
Great Basin Unified Air Pollution Control District made clear it has no intentions of limiting LADWP’sobligations to reduce dust in Owens Valley, regardless of any link to LADWP water operations
3
A Year of Added Clarity of Mandates

4
We also learned that many of our customers support the investmentswe want to make
Power Investments Water Investments
Energy Efficiency Pipeline & Related Infrastructure
ReplacementRenewable Energy
Power ReliabilityLocal Water Supply
Accelerated Coal Replacement Water Conservation
4

5
Rebuilding Local Power Plants Renewable EnergyCoal Transition
Replacing the rapidly aging backbone of our electric transmission & distribution system (poles, cables, crossarms, etc)
Next Century PowerWe have developed a plan and the rates to support it
Power Supply Replacement Program
Power Reliability Program
5Implement Programs While Keeping
Rates Competitive for Our Customers
Energy EfficiencyCustomer Solar Programs
Customer Opportunities Program

Power Supply Replacement Program
Rebuilding Power PlantsComplete Haynes Unit 5 & 6
FY 12/13 – $123M- $772M
Begin Scattergood Unit 3FY 12/13 – $257MTotal Project Cost - $881M
Renewable Energy$20M increase to $336M total annual costAvg. 20% for 2011-2013 to comply with SB 1X (2) , with 330GWH short term renewable energy purchases
Our power supply was built over past 100 years. We will replace over 70% of it in the next 15 years. Consistent additional investment is needed to keep us on track.
6
PresentFuture
10%*
45%
6

Power Supply Replacement ProgramRebuilding Local Power Plants
We are eliminating ocean water cooling at 9 units at 3 coastal power plants to meet State requirements
7

8
Power Supply Replacement ProgramExpanding Renewable Energy
Additional investment over next 2 years is required to meet the Renewable Energy mandate of 33% by 2020
RPS Mandates:20% avg 2011-1325% by 201633% by 2020

9
LADWP plans to terminate Navajo coal project participation by 2015.Energy efficiency and renewable energy additions in next
2 years and beyond support early exit.
9
Power Supply Replacement ProgramCoal Transition – Part of an Integrated Plan

10
M Budget includes additional $95 million to restore funding to FY 2010-11 level to: •Reduce poor performing circuits•Replace aged transformers, poles, cables, cross-arms, substation equipment.
39,000 distribution system repairs remain backlogged. Additional investment is needed in future years to take replacement cycles to recommended levels.
Program Costs2011/12
Costs2012/13
Costs2013/14
Rebuilding LocalPower Plants $396 Million $428 Million $402 Million
Renewable Energy towards mandate of 33% by 2020 $315 Million $328 Million $363 Million
Total $711 Million $756 Million $764 Million
10
Power Supply Replacement CostsFY 2012 - 2014

11
Our Power System infrastructure is aging rapidly and needs accelerated repair and replacement
The maintenance backlog is growing:We have 41,000 “fix-it tickets” in the queue. It would
nearly take 3 million work hours to catch up
Power Reliability Program
11
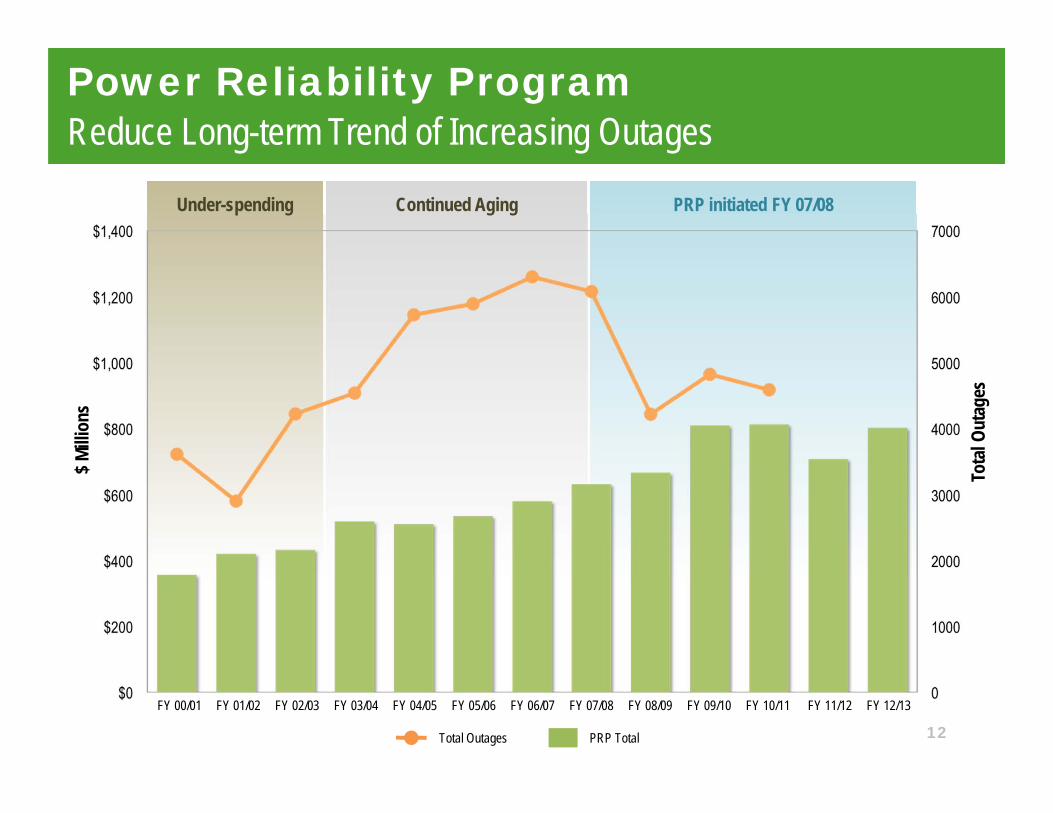
Power Reliability ProgramReduce Long-term Trend of Increasing Outages
FY 00/01 FY 01/02 FY 02/03 FY 03/04 FY 04/05 FY 05/06 FY 06/07 FY 07/08 FY 08/09 FY 09/10 FY 10/11 FY 11/12 FY 12/13
$ Milli
ons
Tota
l Out
ages
Total Outages PRP Total
Under-spending PRP initiated FY 07/08Continued Aging
12

1313
Next Century PowerCustomer Opportunity Programs: Energy Efficiency
FY 2011/12 FY 2012/13 FY 2013/14
Budget $55 M (forecast)
$127 M $138 M
Metric: Savings from 2010 consumption
0.5% 1.1% 1.3%
Key Investments Included in 2-Yr Rate Plan:
• Commercial Customer Lighting • Major Systems & Building Upgrade Assistance• Home Energy Conservation Programs • New Small Biz and Residential Programs to Reduce
Energy use during peak demand

Next Century PowerCustomer Opportunity Programs
14
Significant additions to Energy Efficiency program funding puts LADWP on a path to exceed the 10% State legislative (Assembly Bill 2021) goal by 2020.Detailed assessment will be performed in FY 12/13 to present specific plans ranging from 10% to 15% savings by 2020 for Board consideration.
$48 $51 $55
$87 $99
$41 $40
‐
500
1,000
1,500
2,000
2,500
3,000
3,500
4,000
$‐
$50
$100
$150
$200
$250
FY09‐10Actual
FY10‐11Actual
FY11‐12Estimate
FY12‐13 FY13‐14 FY14‐15 FY15‐16 FY16‐17 FY17‐18 FY18‐19 FY19‐20
GWh
$ in M
illions
Fiscal Year
Energy Efficiency Spending and GWh SavingsHistorical and Projected
Proposed Energy Efficiency BudgetIncremental Energy Efficiency ProgramGWh Savings for Incremental Energy Efficiency Program
>10% of load
Incremental funding required

1515
Increasing Local SolarFosters local jobs & economy;Provides customers power supply options
Solar Incentive Program (SB 1)Funds increased
Feed-In Tariff (SB 32)Launches this spring
Next Century PowerCustomer Opportunity Programs
0102030405060708090
$0$20$40$60$80$100$120$140$160$180
July‐99
July‐00
July‐01
July‐02
July‐03
July‐04
July‐05
July‐06
July‐07
July‐08
July‐09
July‐10
July‐11 A
nnual Energy (GWh)
Paid Incentives (M
illion $)
Date
Paid Solar Installations (Cumulative)
Incentive Amount Paid Cumulative Annual GWh
Program FY 2011/12
FY 2012/13
FY 2013/14
Local SolarSolar Incentive & Feed In Tariff
$65 M $65 M $66 M

16
Next Century PowerProposed Power Investments
Program FY 2011/12 FY 2012/13 FY 2013/14
Power Supply Replacement Program $711 M $756 M $764 M
Power Reliability Program $708 M $785 M $885 M
Customer Opportunity Programs $138 M $193 M $204 M
16
T Total $1,557 M $1,733 M $1,853 M

17
Allocation of Power Costs FY 2012/13
17
18
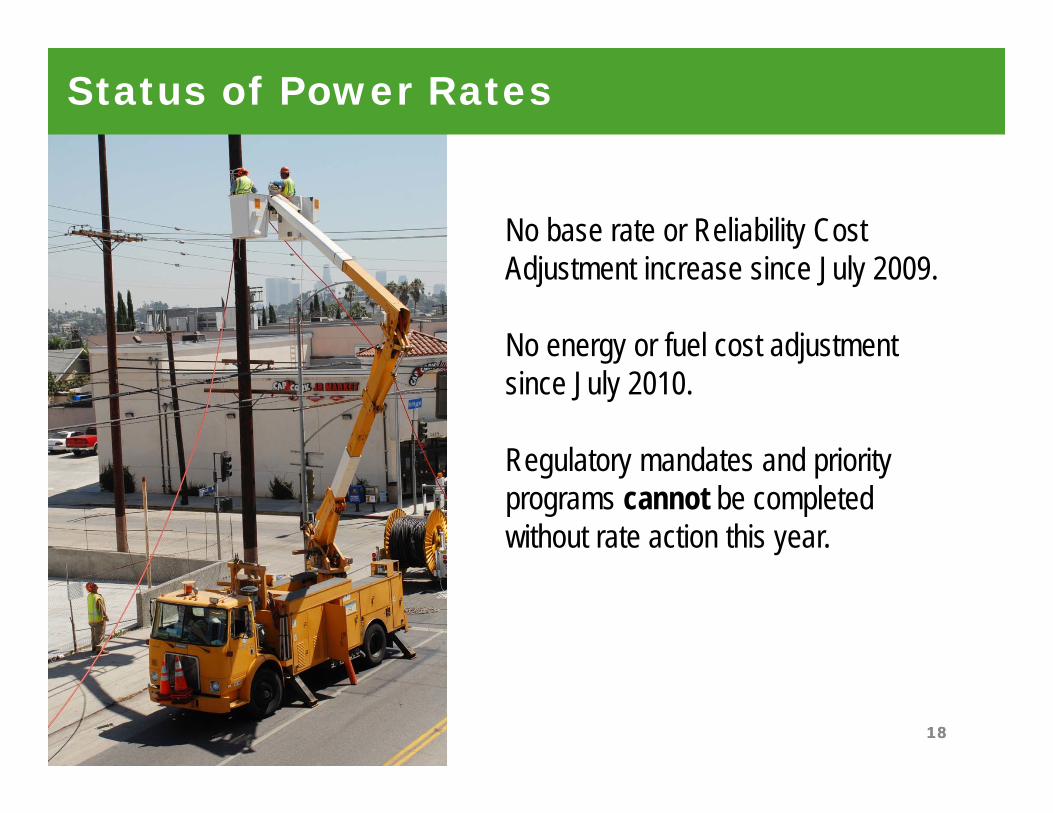
No base rate or Reliability Cost Adjustment increase since July 2009.
No energy or fuel cost adjustment since July 2010.
Regulatory mandates and priority programs cannot be completed without rate action this year.
Status of Power Rates
18

19
Revenue from Current Power Rates Won’t Cover Power System Costs
19
Revenue at Current Rates
* Capital Funding includes depreciation, net interest expense, and retained earnings

20
System Avg Rate
System Avg %
Change*
Typical residential(500 kWh/Month)
High-use single-family residential
(1,000 kWh/Month)
Small Commercial (1,000 kWh/Month)
Current Total 12.7¢ $65.79 $134.07 $136.40
Year 1
Power Rate Change(Effective July. 1, 2012)
0.6¢ 4.8% $1.45 (2.2%) $8.35 (6.2%) $6.20 (4.5%)
Year 2
Power Rate Change(Effective July 1, 2013)
0.8¢ 6.0% $2.10 (3.1%) $10.25 (7.2%) $8.50 (6.0%)
Total Two Year-Change 1.4¢ 10.8% $3.55 (5.4%) $18.60 (13.9%) $14.70(10.8%)
Recommended 2-Year Power Rate Change with Customer Bill Impacts
Note: Rate shown is System Average Rate. Actual rates vary by customer type and consumption levels.
Monthly Bill Impacts
20

21
Medium Commercial
(A2)
Large Commercial
(A3)
Large Commercial & Industrial
(A3 with High Load Factor)
Current Rate (¢/kWh)* 12.39¢ 12.31¢ 10.80¢
Year 1 Power Rate Change(Effective July. 1, 2012)
0.64¢ (5.2%) 0.60¢ (4.9%) 0.52¢ (4.8%)
Year 2 Power Rate Change(Effective July 1, 2013)
0.84¢ (6.4%) 0.78¢ (6.0%) 0.67¢ (5.9%)
Total 2-Yr Change 1.48¢ (12.0%)
1.38¢ (11.2%)
1.19¢(11.0%)
2-Year Power Rate Changes for Commercial Customers
Notes:•Medium Commercial (A2): 50,000 kWh/MONTH; 175kW; LF 40%•Large Commercial (A3): 300,000 kWh/MONTH; 1,000kW; LF 42%•Large Commercial & Industrial (A3 with High Load Factor): 240,000 kWh/MONTH; 570kW; LF 80%
Average Rate Changes (based on combination of demand and energy charges)
* Total bill excluding tax
21

22
Drivers of 1.4 cent increase per KWh in System Average Power Rate
0.30¢
0.23¢
0.07¢0.29¢0.29¢
0.23¢
Fiscal Year 2013/14 vs. Current Year
22
Power Supply Replacement Program
Rebuilding Local Power Plants
Renewable Energy: 33% by 2020
Fuel Increase
Power Reliability Program
Customer Opportunity Program
Energy Efficiency
Local Solar
MARKET

23
LADWP’s Power Rates Remain Competitive - Residential
LADWP Average Residential Customers Annualized Monthly Power BillComparing with Neighboring Cities (without Utility User Tax) As of November 2011
$69.34(Rate with Proposed Two Year Increases)
14.3% 10.9%
Additional Utility Users
Tax
$6.91 $5.45 $5.51 $5.08 $4.71 $4.79
Typical monthly residential bill (500 kWh)
10% 7.67% 7% 7% 6% 5.7%
Proposed %Proposed %
24
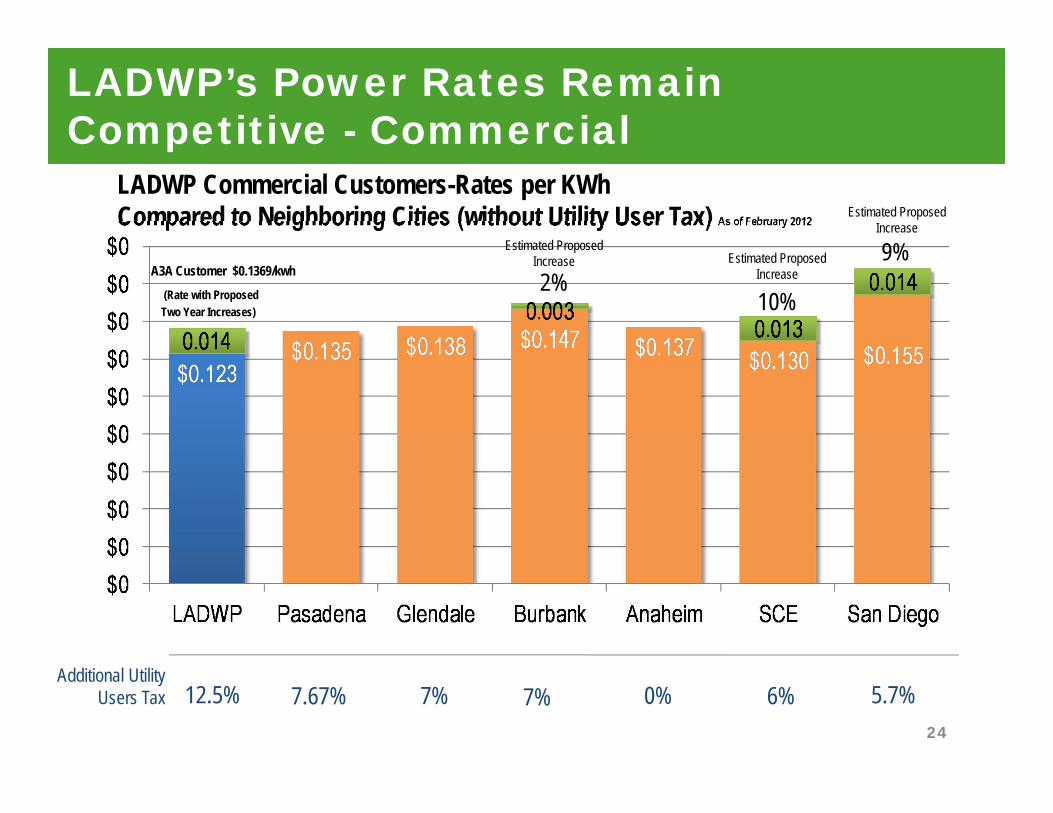
LADWP’s Power Rates Remain Competitive - Commercial
LADWP Commercial Customers-Rates per KWh Compared to Neighboring Cities (without Utility User Tax) As of February 2012
(Rate with Proposed Two Year Increases) 10%
9%
Additional Utility Users Tax
A3A Customer $0.1369/kwh
12.5% 7.67% 7% 7% 6% 5.7%
Estimated Proposed Increase
Estimated Proposed Increase
0%
2%Estimated Proposed
Increase

25
Over the next quarter century, we plan to transform our water supply sources
INCLUDE PIE CHARTS WITH WATER NOW VS. _____
* Excludes 100,000 AFY of water conservation
25

Recycled WaterStormwater CaptureCustomer Conservation ProgramsGroundwater Cleanup & Management
Regulatory ComplianceReservoir Covers & BypassesTrunkline Replacement
Replace aging pipeline and related infrastructure, including regulator stations, pumping stations, and maintaining the LA Aqueduct
Next Century WaterLocal Water Supply Program
Safe Drinking Water Program
Water System Reliability Program
26
Owens Valley Regulatory Compliance
Dust mitigation effortsEastern Sierra mitigations

27
Next Century WaterProposed Water Investments
Program FY 2011/12 FY 2012/13 FY 2013/14
Local Water Supply Program $71 M $137 M $165 M
Safe Drinking Water Program $188 M $214 M $316 M
Water System Reliability Program $275 M $300 M $345 M
Owens Valley Regulatory Compliance
$71 M $135 M $100 M
T Total $605 M $786 M $926 M
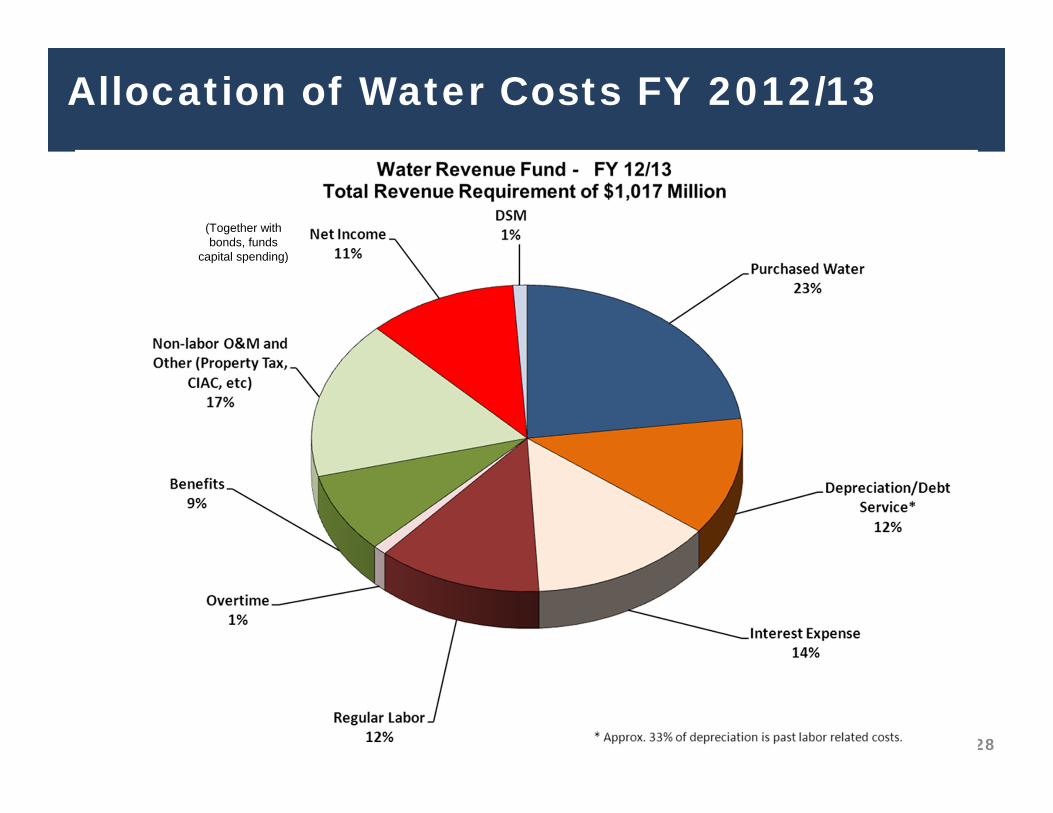
Allocation of Water Costs FY 2012/13
28
Debt Service/
(Together with bonds, funds
capital spending)

29
Current Total Bill System Wide Rate Change*
Year 1Water Rate Change(July 2012 – June 2013) vs. Q4 2012
-0.44%
Year 2 Water Rate Change(Effective July 1, 2013)
5.23%
Total 2-yr Change 4.79%
Recommended 2-Year Water Rate Change
Notes:* System Average Rate. Percentage rate changes may vary based on actual consumption and customer type.* Excludes rate impact of changes in purchased water.
Change Excludes Purchased Water
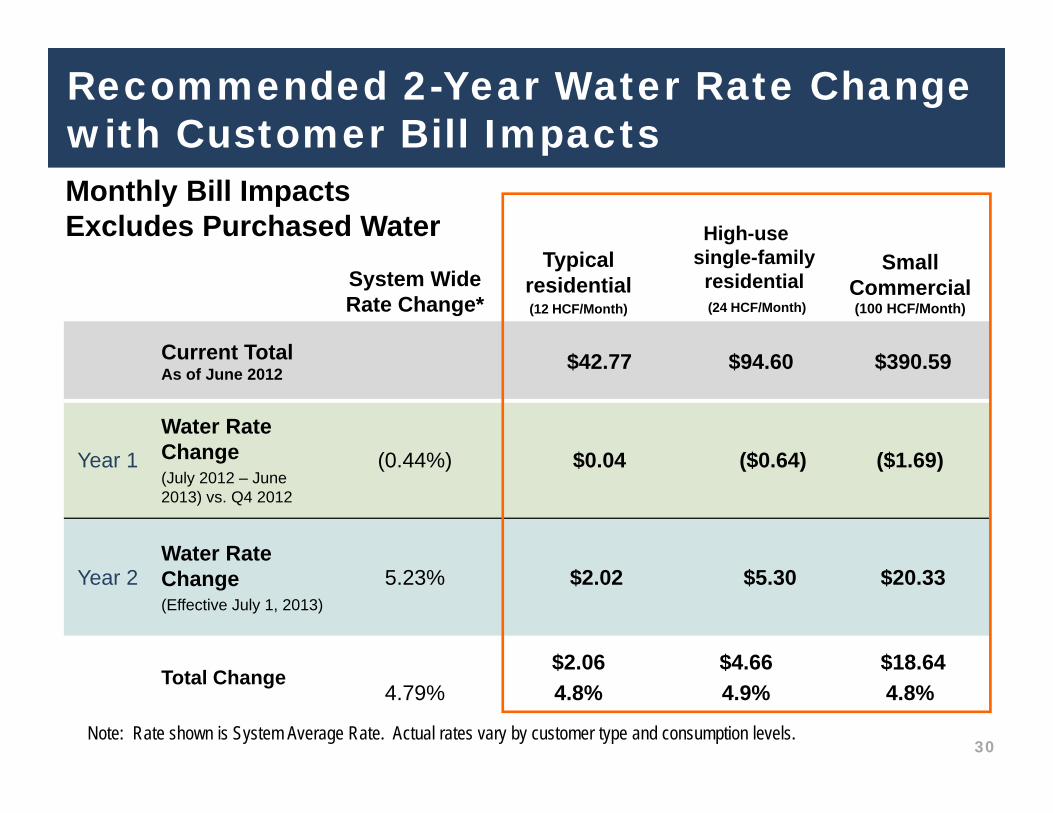
System Wide Rate Change*
Typical residential(12 HCF/Month)
High-use single-family residential (24 HCF/Month)
Small Commercial (100 HCF/Month)
Current TotalAs of June 2012 $42.77 $94.60 $390.59
Year 1Water Rate Change(July 2012 – June 2013) vs. Q4 2012
(0.44%) $0.04 ($0.64) ($1.69)
Year 2Water Rate Change(Effective July 1, 2013)
5.23% $2.02 $5.30 $20.33
Total Change4.79%
$2.06 4.8%
$4.664.9%
$18.644.8%
Recommended 2-Year Water Rate Change with Customer Bill Impacts
Note: Rate shown is System Average Rate. Actual rates vary by customer type and consumption levels.
Monthly Bill ImpactsExcludes Purchased Water
30

LA’s Dependence on Imported Water Varies From Year to Year, but has Increased Over Time
31
0
50,000
100,000
150,000
200,000
250,000
300,000
350,000
400,000
450,000
500,000
Acr
e-Fe
et
Fiscal Year
MWD Purchases
Projected

MWD’s water costs have increased significantly, and such increases are expected to continue
32
$0
$100
$200
$300
$400
$500
$600
$700
$800
$900
1978 1980 1982 1984 1986 1988 1990 1992 1994 1996 1998 2000 2002 2004 2006 2008 2010 2012
$ pe
r Acr
e Fo
ot
$ per Acre Foot
Historical and Approved MWD Tier 1 Imported Water Rates

Current Situation: Drastic Change in Dry Year following Near Record Wet Year
33

Additional Adjustment Is Required For Purchased Water
0
0.2
0.4
0.6
0.8
1
1.2
1.4
Rat
e pe
r HC
F
Quarterly Adjustment
Purchased Water Rate Factor
LADWP must spend $233 M in FY 2012-13 on purchased water.An increase of $68 million over last year 34
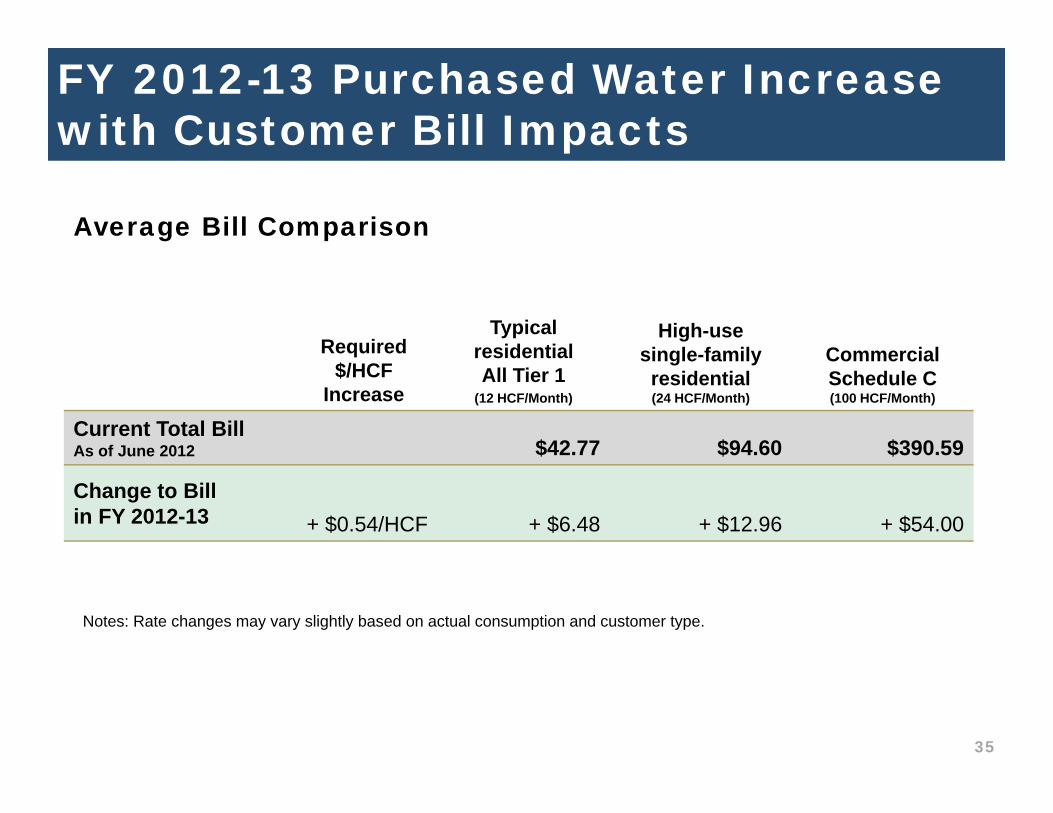
Required $/HCF
Increase
Typical residentialAll Tier 1
(12 HCF/Month)
High-use single-family residential (24 HCF/Month)
Commercial Schedule C(100 HCF/Month)
Current Total BillAs of June 2012 $42.77 $94.60 $390.59
Change to Bill in FY 2012-13 + $0.54/HCF + $6.48 + $12.96 + $54.00
FY 2012-13 Purchased Water Increase with Customer Bill Impacts
Notes: Rate changes may vary slightly based on actual consumption and customer type.
Average Bill Comparison
35
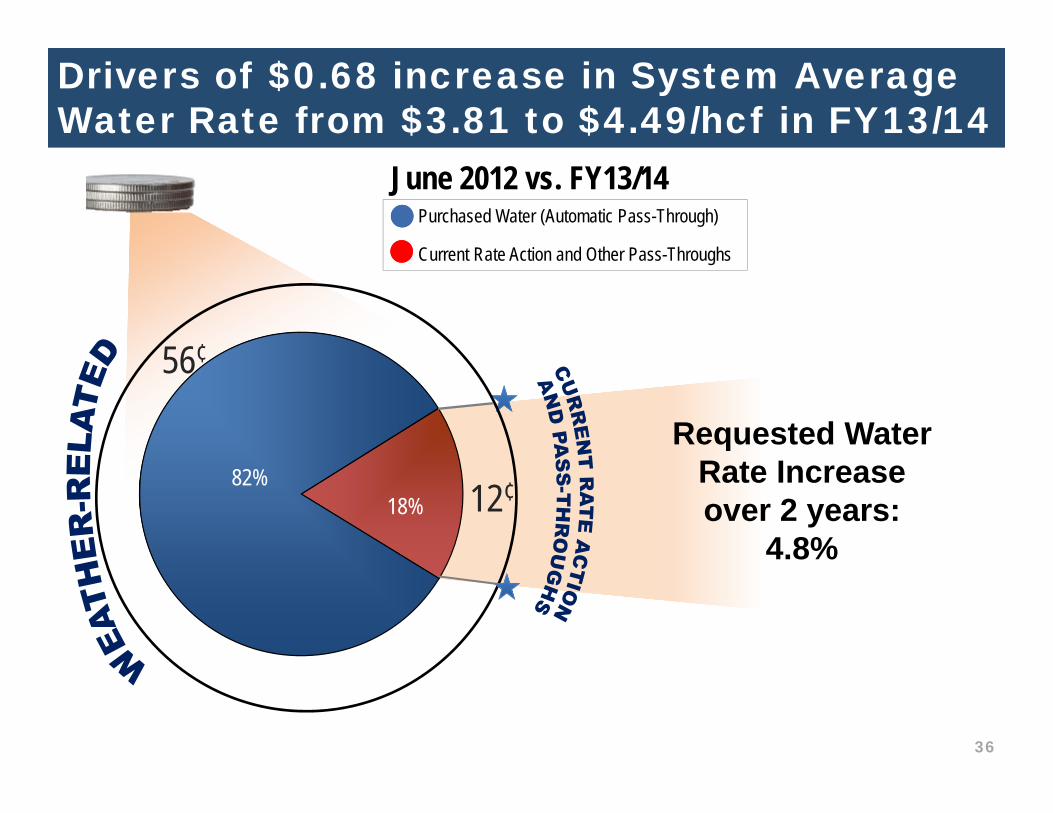
Drivers of $0.68 increase in System Average Water Rate from $3.81 to $4.49/hcf in FY13/14
June 2012 vs. FY13/14Purchased Water (Automatic Pass-Through)
Current Rate Action and Other Pass-Throughs
16%
56¢
12¢82%18%
36
Requested Water Rate Increase over 2 years:
4.8%

JUN JUL AUG SEP OCT
OCT:POWER RATES EFFECTIVE
WATER SYSTEM RATE TIMELINE
RPA WORKSHOP & REPORT PUBLISHED
AUG 15 BOARD APPROVES WATER RATE PLAN
AUG TBD EEC
AUG 22‐ 1ST READING ORDINANCE
AUG 29– 2ND READING ORDINANCE
JUL 1218 NOTICES MAILED RE: HEARING ON RATE INCREASE
JUNE 5: WATER RATE REPORT TO RPA
EEC HEARING ON RPA REPORT
AUG 15 BOARD APPROVES POWER RATE PLAN
AUG TBD EEC
AUG 22‐ 1ST READING ORDINANCE
AUG 29– 2ND READING ORDINANCE
WATER RATES EFFECTIVEJUL 1, 2013
JULY RPA WORKSHOP & REPORT PUBLISHED
POWER SYSTEM RATE TIMELINE
May 3 POWER RATE REPORTPROVIDED TO RPA
LADWP Rate Review/Approval Timeline
37

0%
5%
10%
15%
20%
25%
30%
35%
2012 2013 2014 Cumulative Increase
Announced Water Rate Increases
South Pasadena 16%
Glendale 6%
San Francisco 30%
Sierra Madre 23%
Sacramento 30%
Orange County (Proposed)(Golden State Water) 27%
City of Orange 20%
East Bay MunicipalUtility District 12%
Riverside 12%
LADWP is Not Alone in Increasing Water Rates