proposed waikato regiona pla cha nge l waikato and waipa ... · proposed waikato regional plan...
TRANSCRIPT
Proposed Waikato Regiona t
and Waipa River Catchments.Pla n L - WaikatoCha nge
Submission form on publicly notified - ProposedWaikato Regional Plan Change 1- Waikato and
Waipa River Catchments.
ffi covERsHEEr
FOR OFFICE USE ONLYSubmissionNumber
Entered lnitials
File Ref Sheet 1 of
FORM 5 Clause 6 of First Schedule, Resource Monagement Act 7991
Chief Executive,40l Grey Street, Private Bag 3038, Waikato Mail Centre, Hamilton 3240
Waikato Regional Council,401 Grey Street, Hamilton East, Hamilton
(07) 859 0998 Pleose Note: if you fox your submission, pleose post or deliver a copy also
healthyrivers (dwa i kato reeio n.sovt. nz
Pleose Note: Submissions received my emoil must contoin full contact details. We olso requestsend us o siqned oriqinol by post or courier.
www.waikatoregion. g ovt.nz/healthyrivers
We need to receive your submission by 5pm, 8 March 2017.
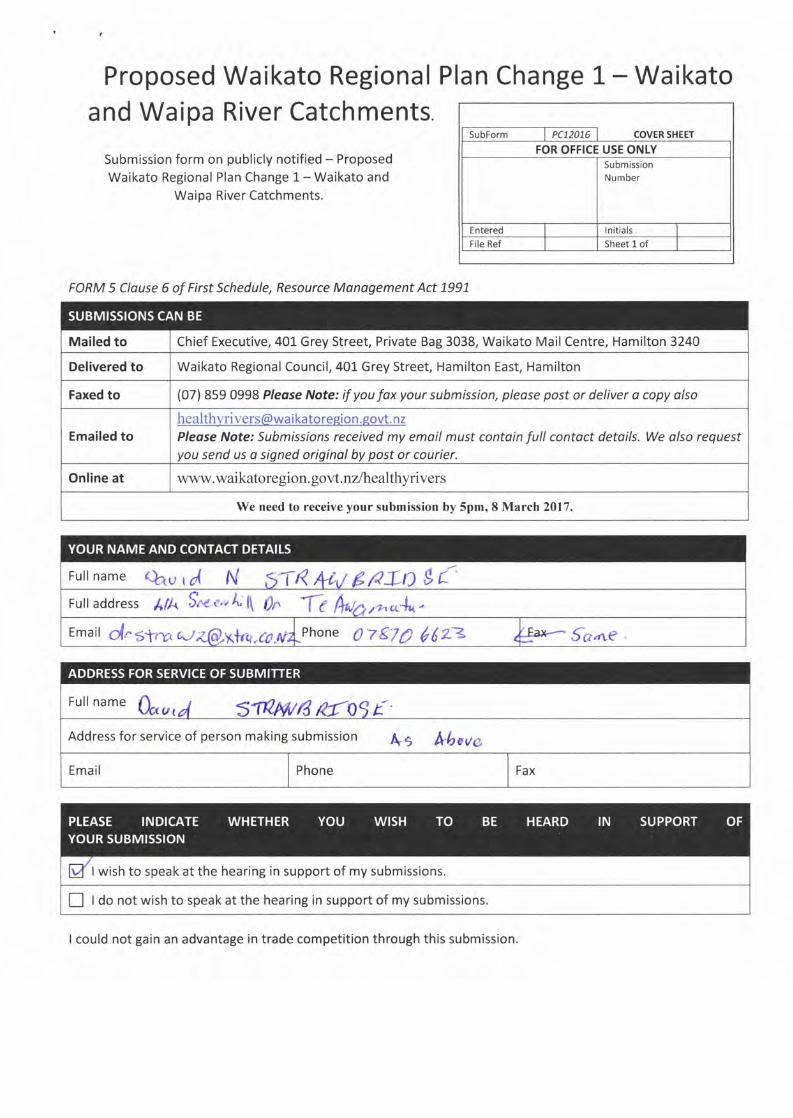
Full name QZg r r,{ N ,TR *tl € RIO I iFulladdress AIA Sre*,1l, f\ 0r, 17 {*nn,.^nlu'Email 6dr g, yry, r-) ?fr,X**,CO Phone 02876 662=
Full name n\fiiu I,6
09 E'Address for service of person making submission AS *hoUA
I wish to speak at the hearing in support of my submissions.
E t Ao not wish to speak at the hearing in support of my submissions.
I could not gain an advantage in trade competition through this submission.

Signature fu, /lN/( /u-'Date B/ z lu't
Personal information is used for the administration of the submission process and will be made public. All
information collected will be held by Waikato Regional Council, with submitters having the right to access and
correct personal information.

Proposed Waikato Regional Plan Submission
I own a 70ha Dairy Farm in the Waipa Catchment Block,
We milk between 220-250 cows (see Attached 44 Document
of cows, production per year from 1985-2016)
The Nitrogen Reference Point for 2OLS|LG was 55 kglh a/yr.
See attached full Report from New Zealand Farm Source.
My Plan for the future is not to reduce Further my Nitrogen
& Phosphate Application as see Attached a Sample ofFertiliser spread on Paddock 17 since 1985, you will see that I
have reduced over the last 30 years my Annual Rate ofFertiliser from 900 + kg/ha to 500 ke/ha.
lf we were to adopt all you recommendation of change, w€
will have to decrease stocking rate 20/25%, Fert. By another40% and by moving Fences away from Drains we would lose
another 4 ha's of land.
Ladies & Gentlemen, there is no more land, Council are in a
rush to turn some of our Best into Houses & Road ETC.
You are asking us as a business to carry on with less ofeverything, I give you an example!!
You ask Mercury Power Co. to mothball 1of their 5 Turbines
in each of the two Maraetai Dams, but still produce the same
output of Electricity, it is not Viable Financially.
David Strawbridge

Fertiliser Recommendation(v 1 32)
David N Strau,bridge(Borrordale) (CustNo: 3036195)
BonohdaleTrust (PrcpNo:4008733)
Plaparcd for (customer):
Property:
Rgcommendrtlon:D&:
Sprim 2016 Aut 2017
oa10m16Reprrcnt$rre: Martyn Ebbe0
Phono: O27 2W1157
Having @NidcGd .n .Eil.bb dfi rdadlt io you prqpdty Bdhnce Aori+{utirob lEmmn& tho lbllorling tuUls to bc.ppltrd.
250.000 Pastutezeal G2 lmpad50.000 Muiate Of Potesh
0.3(x) Cobaltcranularl0%TotAppR.!dHa: 300.gxl Totilionne3: ml,m ?O1625185r100
83
17
1.00ro0 a113.12 39,0aS,73 t0.00 $133.07 t9,04S.73
.250.000 Superten 10K
0.300 Cobalt cmnular 10%TotAppRstdHa: 260.3qt Totrltonnes: 17.ON 0182521040
't00
1.20lrxr la2{-t6 17,229.05 f,{l.tu $106.32 37,229.65
250,000 Supefisn roK1.000 Solsntum
TotAppRltorHa: 251.000 Totattonne.: 17.mE 0182:5210440
100
t00 $429.63 t7,332.98 30.00 $107.&1 37,3:t2.98
04070.!020 0

lg.{L^ G*+eI'f ,9iq
ZO,rl-v{7-&,2-!(
,-nt-61o.-W
-nz.rlQ
t-q'.)
r.1/- ?i'4>'(.t
4i'{
+a
\c,13)- ?t"
7it,-?r)-?{?-l L
tc/6-'-7)
h-11( -Q7
4&c1gI --nr'1
t-w
l+tt--uL
'-c-51
/et
/. i( S, co /y?, tc *o -' - ZZ - 3 / t
f *4 // e^fr- 6*rt'*- a'd*w'ffiru{, %,-r't,fr**/ l/ , f,/. ,?/ o
ro",* /rt 4-.J h,v,) o.,-r{ "// j!',,'. I)fu,) c*-ti "// j!- ,,'. lr*{"/-3 "*.y' /"/ /)-./ rr- -"/' *1.,.j,*,fr *{", L ,u/,' /e; "*,/* a.z
, - J t--' -l | .- ( n*C.c,t/ |ff_*-I 4vL /r/, '! n-- Tt/rT/''\tt,*4 ii' Tiii,rf ,r,r'- , /),'\t'" i'* T.-: r,A,y
uror-ro*r.J/ 2? .!{",.i'L,, k,' ,fi.*, U,,y'ri4 , /r/, u. (r./o*",, : lL ,; f,,",h r.*-.ry- { j,,,F _1./. t- s)_d- 1} ( t * *- t } t.,-, xi c-**?i y ,4-i *i .., ., l.'o, ' i t-
A ,.u*l '*/ o
'''..' f.* e,,/,, ct+1.': (*'t*,.') rt:t.i)d44,* 4 ,/ {Ct*f ;.<frr + Pfi F (".*, )n c,*l / 3o./. /"*, tyo t- Se 1or., ,u^i \/, cr-,1 q ,;t/.,'{r', s.t1?4r. r Ot)/ (l *,-/ )
k a/^l / /, ,
u'l c(^,,'{Z,L- 6 )
L ""*J /r"/ I f/ le,'f rulE / ry A € (s w ),e r*lL I ol ' ,o''/, 'fi,+ e,-s,,tr
*. trh % * j:: V,, .",'i#!'{r):,rt{\'l+ ,/ f *l ,qt s,fu_ rirf 5r// * rTgfr ccheu-,^Lib 4 /*, l/ Ai ,rh'h- ir.l-ib /Q /*, l/ A i rh 'E i
A a c k /"r/ "/ ,^Y/ 5u7"*'T,v
1.i rylL /f ?4* * t Ky/. 5u,"rTt'*/rL. J t K
tJAo c '1 / to H ra'sJ*"< ,Tll 'S /<-.
3o o \' lp ,f S'tVtr . r{-{.JrT ,\ilL / I ,rl ' t.-f s.u77- n t",:*,.n,,.'3o o \' lp ,f S'tVtr . r{-{.37, /4ilL ./ I ,f / ' s.-r, sula+. e '2< ts4v 4,,.,,1h''/#;*'nf 7 i6/ (."A/ */ J4*- 4. r**t*-

rcf
r0
.,i f t;\ r'f. I_il-{
+
T$
IF!rr^0,V
I
J'''r, l<.; *,-"' +.". in*{-h{),._,, ,.',1
-1ts
F-\TJ\
, i-i,}\-- i.
+(t
,1

7O.4629ha
D.N. Strawbridge
Annual Production
1985-86
1986-87
1987-88
1988-89
1989-90
1990-91
1991.-92
240 cows
235 cows
243 cows
233 cows
197 cows
215 cows
214 cows
DN.& R.Strawbridge
73515kg/ms
69754kg/ms
69520kg/ms64366kg/ms David
52424kg/ms David
69154kg/ms David & Russell
69154kg/ms David &Russell
7992-93
1993-94
1994-95
Borrowdale
199s-95
1996-97
1997-981998-99
1999-00
2000-01
2001.-o2
2002-032003-04
2004-05
2005-06
2046-07
2007-o82008-09
2009-10
2010-11
2071.-12
2072-73
20L3-1.4
20L4-75
2075-162016-20t7
611.47kelms
64825kg/ms
65001kg/ms
68302kg/ms75350kg/ms
85341kg/ms74623kg/ms
58248kg/ms775I2kg/ms
85395kg/ms92855kg/ms
94088kg/ms86310ke/ms
89070kg/ms
22O cows
21"5 cows
214 cows
Trust
225 cows
225 cows
259 cows
250 cows
230 cows
235 cows
244 cows
255 cows
259 cows
248 cows
248 cows
234 cows
232 cows
230 cows
230 cows
230 cows
236 cows
244 cows
235 cows
250 cows
250 cows
232 cows
David, Ruby & Dean
David, Ruby & Dean
David, Ruby & Dean
F & S Kaverman
Jason StrawbridgeJason StrawbridgeJason StrawbridgeJason & Angelia Duncan
Jason & Angelia Duncan
Owen & Shelly Bainbridge
Greg & Sonia Furness
Greg & Sonia Furness
Tom & Sandra Bolder
Ross & Carla Shaw
97445 Andrew & Belinda Prout72356 Andrew & Belinda Prout
90633 Andrew & Belinda Prout
85726 Andrew & Belinda Prout95413 Andrew & Belinda Prout
102540 Andrew & Belinda Prout92384 Andrew & Belinda Prout
93392 Andrew & Belinda Prout
117906 Tim & Lucy Dorn
L1,1,LL2 Tim & Lucy Dorn
97459 John & Mel Kersten
Ss.s:
54.s8
54.07
54.46
S7.60
ss.2oSo.sz
Sz.gg
So.sz
So.os
Ss.zg
54.40S3.so
Se.ro

it,, r' ,r:::ti!1ri
),1.
NEW ZEATANDr ii!: ." : . .. r'1 ,:ti
'111,112 KgMS
111 KG/HA/YR
334.21
ili
This Nitrogen Management Report provides you with your farm's Nitrogen Conversion Efficiency and Nitrogen LeachingRisk. This will help you to identify opportunities for further nitrogen use emciency on your farm. lt also gives you a betterunderstandingof thepotential businessriskstoyourfarm,particularlyinregionswherenitrogenlimitsettingisunderwayby regionalcouncils.
;rr*r\ Tf:9'u;ifhu]I,*'*
i;:F[iurrilij,.$$$fii,, lffi68ha
25s
",il ;itffi#iii::.ffi iiiliffi
+il+,,trTotal effective dairy farm area
Total cows calved
Total milk solids produced
Average kilograms of nitrogen applied per hectare (a_c.ross wholefarm)
Supplementary feed brought onto farm (dry weight)
Noie. ihe rnforrnaiion presented in this report is cnly a summary of a more detalled OVERSEER: frle. We recommcnd you seek furtheradvlcebeforemakinganychangestoyourfarrnsystem(s) lfthereareinaccuracresinthedatapresentedabove.pleasecontactyouiSustainable Dairy Advisor.
,,*'.#

YOUR NUMBERS ATAGLANCE
Nitrogen Leaching Risk
This indicates the risk of the loss of nitrogen from thefarming system into either the groundwater system orinto waterways.
,A small number indicates a lower risk of nitrogen loss.
55 KGIHA/YR 35@
WHY ISTHIS IMPORTANT?
0{t Knowyour numbers
rlr
=?t Understand how nitrogen limits may affect the way you farm
P ldentify opportuniries for efficiency/profitability gains
a\':
EYOU R FARM'S NITROGEN LEACHING OVER TIME
N itrogen Conversion EfEciencyThis is the percentage of nitrogen that is brought into thefarming system (fertiliser supplementary feed and cloverfixation) that is converted to products (milk and meat).
The higher the percentage, the more effcient the farm is
at using its nitrogen resources.
lndicative range: .lO%
to 45o/o.
aa Satisfy regulatory reporting requirements
Allows us to advocate for our farmers
Secure and support our brand reputation
lq,lttr'lyt
100
75
50
25
o2015116
5Oo/o of your ward are in this range

OVE RSE E R' NUTRI ENT BU DGETSOVERSEER@ is the preferred farm systems modelling tool used by fertiliser companies, farm consultants, regional councils
and the dairy industry to demonstrate improved nutrient management practice on New Zealand dairy farms. lt is well suited toproviding anassessment of relative change (year-on-year and farm-to-farm). Your data has been processed through OVERSEER@
by our eiperienced Ballance, QCONZ and Fonterra team in accordance with the OVERSEER@ Best Practice Data lnput Standard
and the entire process has been externally audited.
The information in this report is based on the Nitrogen Recording Pages you sent to Fonterra in mid-2016. lf this form was
incomplete, our processing teams may have made some assumptrons while processing the data through OVERSEER@ 6.2.2.
All numbers on the diagram below refer to kilograms of nitrogen per hectare per year (KG/HA/YR), often called units of N.
ClimateClimate information includingrainfall data as supplied by NIWA.
YOUR FARM'S NITROGEN MODEL
k* fttttt
@
-+.--7t@;r$W
Farm Management Decisions
Soilprocesses
lnformation on your farm'ssoil types has been collectedusing the best available soilsinformation.
These are the decisions you-makeevery day on your farm.
For example, whether to wintercows off, how to deal with effluent,your stocking rate and on-farminfrastructure etc.
Nitrogensurptus @This is the difference between the total units of nitrogenbrought onto the farm and the total units of nitrogen thatleave the farm as products.
A high amount of surplus nitrogen can indicate an inefficientconversion of available nitrogen into milk protein.
l[?nu,iX**n g-a