propulsive performance of a c h /h o rocket … · the test campaign has been carried out in...
TRANSCRIPT

CEAS 2015 paper no 136. Page | 1 This work is licensed under the Creative Commons Attribution International License (CC BY). Copyright © 2015 by author(s).
PROPULSIVE PERFORMANCE OF A C3H4/H2O2 ROCKET PROTOTYPE FOR FUTURE GREEN
BIPROPELLANT THRUSTERS
Angelo Pasini SITAEL S.p.A. PhD, Project Manager - Chemical Propulsion 5 Via A. Gherardesca, 56121, Ospedaletto, Pisa, Italy [email protected] Giovanni Pace (SITAEL S.p.A., [email protected]), Lucio Torre (SITAEL S.p.A., [email protected])
ABSTRACT
In the framework of the PulCheR project, an experimental test campaign on a 40 N bipropellant thruster prototype has been carried out with the aim of assessing the attainable propulsive
performance in steady state conditions of 98% concentration hydrogen peroxide and propyne. The preliminary atmospheric tests without the combustion chamber on the selected liquid/liquid coaxial
injectors show the lack of the hypergolicity of the innovative propellant combination when injected in
liquid phase at ambient temperature and the ignitability of the mixture when the decomposition of propyne is promoted by a spark plug. In the final tests on the bipropellant prototype, the tested
ignition device has not been able to start the combustion and, therefore, the experimental propulsive performance has not been assessed.
NOMENCLATURE
A = area
Cd = discharge coefficient CF = thrust coefficient
c* = characteristic velocity D, d = diameter
F = thrust
g = gravitational acceleration at sea level Isp = specific impulse
m = mass flow rate O/F = oxidizer/fuel mass ratio
p = pressure
R = gas constant of the exhaust gases Re = Reynolds number
T = temperature v = velocity
We = Weber number
= conical half angle
μ = dynamic viscosity
= surface tension
γ = specific heat ratio of the exhaust gases
ηc* = characteristic velocity efficiency (c*exp/ c*theo) ηcF = thrust coefficient efficiency (CF exp/ CF theo)
ηΔT = temperature efficiency ((Texp-Tamb)/(Tad-Tamb))
Subscript
ad = adiabatic reaction (decoposition/combustion) amb = ambient
b = bore
C, CC = combustion chamber
CEAS 2015 paper no 136. Page | 2 This work is licensed under the Creative Commons Attribution International License (CC BY). Copyright © 2015 by author(s).
e = exit
exp = experimental FUEL = fuel
i = inner, injector
o = outer OXID = fuel
t = throat theo = theoretical
Acronyms CV = Cavitating Venturi
ECHA = European CHemicals Agency F = Fuel
FM = FlowMeter
GPRTF = Green Propellant Rocket Test Facility (SITAEL S.p.A.) HTP = High Test Peroxide
LC = Load Cell LPG = Liquefied Petroleum Gas
O = Oxidizer REACH = Registration, Evaluation, Authorisation and Restriction of Chemicals
SVHC = Substances of Very High Concern
TC = Thermocouple
1 INTRODUCTION
PulCheR (Pulsed Chemical Rocket with Green High Performance Propellants)[1-3] is a R&D project
funded by the European Union Seventh Framework Programme (FP7/2007-2013) under grant
agreement n°313271. The two main goals of the project are the demonstration of the feasibility of a new propulsion concept and the identification of high performance green propellants for powering
future mono and bipropellant thrusters exploiting both the conventional propulsion concept and the new one proposed by the project.
The defence mechanism of a notable insect, the bombardier beetle,[4-6] has inspired the new propulsion concept. When assaulted, the bombardier beetle squirts a hot mixture of chemical liquids
out if its rear end obtained by the reaction of two chemicals, hydroquinones and hydrogen peroxide,
with a mixture of catalase and peroxidases dissolved in water. The flow of reactants into the reaction chamber and subsequent ejection to the atmosphere occurs cyclically at a rate of about 500 times per
second and with the total pulsation period lasting for only a fraction of a second. In the new propulsion concept, the propellants are fed in the combustion chamber at low pressure and the thrust
is generated by means of high frequency pulses. The radical innovation introduced by this concept is
the elimination of any external pressurizing system even if the thruster works at high pressure inside the combustion chamber. At each pulse, pressurization of the combustion chamber gases takes place
due to the decomposition or combustion reaction, and the final pressure is much higher than the one at which the propellants are stored. The pulsed chemical rocket concept is potentially able to
substitute many currently used propulsion systems for accessing space.[7,8] The feasibility of this
new propulsion concept is currently under investigation at breadboard level in both mono and bipropellant configurations.
The identification and the experimental investigation of green propellants with potential similar performance to the current state-of-the-art for monopropellant and bipropellant thrusters are
nowadays of particular interest.[9-10] In fact, the recent inclusion of hydrazine into the Candidate List of Substances of Very High Concern (SVHC),[11] in accordance with the REACH (Registration,
Evaluation, Authorisation and Restriction of Chemicals) regulation, by the European Chemical Agency

CEAS 2015 paper no 136. Page | 3 This work is licensed under the Creative Commons Attribution International License (CC BY). Copyright © 2015 by author(s).
(with the consequent phasing-out for non essential use foreseen in mid 2017 at earliest [12]) has
renewed the interest towards the so called “green” propellants.[13,14] Moreover, the use of non-toxic “green” propellants is attractive also in view of the economic benefits,
especially connected with the substantial cost saving in manufacturing and ground operating of
spacecraft, because the handling of toxic propellants requires expensive safety measures, dedicated special precautions and specific infrastructure provision.[15]
The substitution of hydrazine is dramatically critical for monopropellant thrusters but it also affects the choice of the propellants for the bipropellant engine since, later or soon, also its by-products will
be likely phased-out. The hunting of high performance green propellant combination for bipropellant thrusters is particularly tough since the current bipropellant propulsion systems require both the
steady state and the pulse mode operations that can be easily obtained only with hypergolic
propellants. The present paper reports the experimental results attained on a rocket bipropellant prototype
specifically designed for exploring the stationary (not-pulsed) propulsive performance of the green propellant combination of propyne and hydrogen peroxide. The main aim of the experimental
characterization of the propulsive performance in steady state condition is the identification of a
reference value for assessing the propulsive performance of the new propulsion concept proposed in the PulCheR project. The test campaign has been carried out in SITAEL’s Green Propellant Rocket
Test Facility.
2 TEST APPARATUS
2.1 Bipropellant Thruster Prototype Design Features
In the framework of the PulCheR project, a bipropellant thruster prototype has been designed with
the main aim of assessing the experimental steady state propulsive performance of the innovative propellant combination composed by Hydrogen Peroxide (98% by weight) and Propyne (99% by
weight). The theoretical adiabatic flame temperature and the corresponding theoretical characteristic velocity of the combustion products of hydrogen peroxide and propyne as a function of the
oxidizer/fuel mass ratio for different H2O2 concentration are reported in Figure 1. The resulting
theoretical specific impulse in vacuum and at sea level expected for the nominal design of the thruster demonstrator are shown in Figure 2. The design features of the bipropellant thruster
prototype are reported in Table 1.
Figure 1. Adiabatic flame temperature (left) and characteristic velocity (right) of the combustion products of hydrogen peroxide and propyne as a function of the oxidizer/fuel mass ratio for different
H2O2 concentration.
2 4 6 8 101600
1800
2000
2200
2400
2600
2800
3000
3200Flame Temperature at the Chamber
O/F Mass Ratio
Fla
me
Te
mp
era
ture
, K
C3H
4/H
2O
2(100.0%wt)
C3H
4/H
2O
2(98.0%wt)
C3H
4/H
2O
2(96.0%wt)
C3H
4/H
2O
2(94.0%wt)
C3H
4/H
2O
2(92.0%wt)
C3H
4/H
2O
2(90.0%wt)
2 4 6 8 101540
1560
1580
1600
1620
1640
1660
1680
1700Theoretical Characteristic Velocity
O/F Mass Ratio
Ch
ara
cte
ristic V
elo
city, m
/s
C3H
4/H
2O
2(100.0%wt)
C3H
4/H
2O
2(98.0%wt)
C3H
4/H
2O
2(96.0%wt)
C3H
4/H
2O
2(94.0%wt)
C3H
4/H
2O
2(92.0%wt)
C3H
4/H
2O
2(90.0%wt)

CEAS 2015 paper no 136. Page | 4 This work is licensed under the Creative Commons Attribution International License (CC BY). Copyright © 2015 by author(s).
Figure 2. Theoretical specific impulse in vacuum (left) and at sea level (right) of the combustion products of hydrogen peroxide and propyne as a function of the oxidizer/fuel mass ratio for different
H2O2 concentration.
Bipropellant Thruster Prototype Nominal Design
Propellants C3H4/H2O2(98%)
Nominal Mixture Ratio 4.76
Nominal Chamber Pressure 10 bar
Nominal Vacuum Thrust 40 N
Bell-Shaped Nozzle Expansion Ratio for Vacuum 330
Conical Nozzle Expansion Ratio for Atmospheric Test (Dt = 5 mm; De = 7.5 mm; =15°)
2.25
Table 1. Main features of the bipropellant thruster prototype.
The main parameters which have driven the geometry and materials choice have been the nominal
chamber pressure (pC, about 10 bar) and the adiabatic combustion temperature expected for the combination of these propellants (TC, about 2950 K). Two materials have been chosen for the
combustion chamber: TZM (titanium-zirconium-molybdenum) and Silicon Nitride which show very
interesting physical, mechanical and thermal properties. The melting point for both the materials is very near to the adiabatic flame temperature or even lower, as in the case of TZM. This aspect is a
critical issue for the firing time of the thruster which is very limited by the high convective heat transfer coefficient which results in the converging part of the nozzle near the throat. Indeed some
preliminary calculations have been carried out based on a simplified model of the combustion chamber. As a results, it came out that the firing time of the thrusters will have to be limited to a few
seconds, which is anyway enough to set a steady state condition in the combustion chamber, given
that the flow residence time is lower than 10 ms. Due to the lack of experimental results concerning the hypergolicity of the propellants, the prototype
has been designed in order to be capable of performing tests both with hypergolic propellants and with propellants that must be ignited by means of suitable devices such as a spark plug or a catalytic
bed. The main components of the prototype are shown in Figure 3. With the exception of the
combustion chamber and the coaxial injector, the other components of the bipropellant thruster have been made of a particular stainless steel (AISI 310S) which ensures a high mechanical resistance at
high temperature.
2 4 6 8 10300
310
320
330
340
350Theoretical Vacuum Specific Impulse
O/F Mass Ratio
Va
cu
um
Sp
ecific
Im
pu
lse
, s
pc=10 bar
Ae/A
t=330
C3H
4/H
2O
2(100.0%wt)
C3H
4/H
2O
2(98.0%wt)
C3H
4/H
2O
2(96.0%wt)
C3H
4/H
2O
2(94.0%wt)
C3H
4/H
2O
2(92.0%wt)
C3H
4/H
2O
2(90.0%wt)
2 4 6 8 10195
200
205
210
215
220Theoretical Specific Impulse at Sea Level
O/F Mass Ratio
Se
a L
eve
l S
pe
cific
Im
pu
lse
, s
pc=10 bar
Ae/A
t=2.25
C3H
4/H
2O
2(100.0%wt)
C3H
4/H
2O
2(98.0%wt)
C3H
4/H
2O
2(96.0%wt)
C3H
4/H
2O
2(94.0%wt)
C3H
4/H
2O
2(92.0%wt)
C3H
4/H
2O
2(90.0%wt)

CEAS 2015 paper no 136. Page | 5 This work is licensed under the Creative Commons Attribution International License (CC BY). Copyright © 2015 by author(s).
Figure 3. Main components of the bipropellant thruster prototype.
The mixing chamber, visible in Figure 4, is the core of the bipropellant prototype and it is interfaced
with the combustion chamber, the propellants injector and the L-shaped flange of the cradle.
Figure 4. The mixing chamber of Alta’s bipropellant prototype
The JIC 37° flare connection of the mixing chamber assures the possibility of interchanging the
combustion chamber. The coaxial injector, made of stainless steel, is provided by Spraying System Co. and is made up of two components: a fuel cap and an air cap for the injection. Moreover, the air
atomizing nozzles allow for two different mixing set-ups: the external mix set-up (see top of Figure 5) in which the propellants streams are mixed outside of the nozzle; the internal mix set-up in which the
fluids are mixed internally to produce a completely atomized spray (see bottom of Figure 5).
Figure 5. External mix set-up (top) and internal mix st-up (bottom).
Spark Plug
Pressure TapCentering Surface
37 JIC Interface
with Combustion
ChamberContact Surface with
L-shaped Flange
Cradle Interface ( L - shaped flange)
Combustion C hamber
Sleeve
Nut
Pressure Tap
Gasket
Mixing Chamber
Spark Plug / Cap
Coaxial Injector ( Fuel cap / Oxidizer cap )
Ring Nut

CEAS 2015 paper no 136. Page | 6 This work is licensed under the Creative Commons Attribution International License (CC BY). Copyright © 2015 by author(s).
The mixing chamber has a pressure tap used to check the pressure of the burnt mixture and a tap
provided for possibly hosting a spark plug in order to burn the injected mixture. The selected spark plug is the NGK CMR6A which can easily replace the tap and guarantee the sealing by means of the
integrated gasket. This spark plug is a compact (Bantam) type resistive plug (with resistance of about
10 kΩ) with a medium (6) heat rating number. A medium value for the heat rating number has been chosen given the gaseous flow temperature is not known a priori in the spark plug region. This choice
has been made in order to avoid overheating of the spark plug during the operation (that would happen for low heat rating numbers) but, at the same time, to avoid the fouling of the spark plug
(that would happen for high heat rating numbers). Moreover, the mixing chamber has the capability of hosting a cartridge of a catalytic bed with a
maximum length of 15 mm and a maximum volume of 2.5 cm3. Differently to the case of coaxial
injector where HTP is injected liquid phase, the liquid HTP passes through a catalyst in order to decompose itself and thus producing a hot steam which could easily mix with flashing propyne.
The cradle interface is made of AISI 316L and it is L-shaped in order to host the thruster and rigidly connect it to the one-degree of freedom force balance. The flange has a groove where the mixing
chamber is inserted so that its axis is aligned to the load cell and its axial placement is fixed by means
of a ring nut.
2.2 Propulsive Performance Assessment: Test Facility and Instrumentation
The experimental campaign has been carried out in SITAEL’s Green Propellant Rocket Test Facility
(GPRTF), an easily reconfigurable and expandable experimental apparatus especially designed for performance characterization of small monopropellant (H2O2),[16-21] bipropellant (H2O2-
hydrocarbon) and hybrid (H2O2-NfH2®)[22] rocket engine prototypes and catalytic reactors
operating at thrust levels in the 1-40 N and 25-100 N ranges. The facility mainly comprises the propellants feed systems and the thrust balance.
Concerning the oxidizer supply system, all of the hydrogen peroxide lines and the main tank are made of AISI 316 stainless steel internally coated with Teflon. Hydrogen peroxide is stored in a 2.5 liters
tank and is pressurized by gaseous Nitrogen. Its physical conditions are continuously monitored by
means of a J-type thermocouple and a gauge pressure transducer. If the peroxide starts to decompose, the tank can be vented to the atmosphere by means of a remotely controlled valve or, in
the absence of the operator, by the combination of a relief valve and a burst disc calibrated for opening at suitably spaced pressure values. The hydrogen peroxide mass flow rate is controlled by
means of interchangeable cavitating venturis and it is monitored by a Coriolis flowmeter. The
operation of the venturi is continuously monitored by a differential and a downstream pressure transducer.
The fuel feeding line mainly comprises the valves, relief valves, check valves, pressure transducers and thermocouple necessary for controlling the filling & drain processes and the injection of the fuel
inside the thruster (see Figure 6). All the lines and the main tank for propyne are made of AISI 316 stainless steel which is compatible with this type of hydrocarbon. Propyne is stored in a 4.5 liters tank
and is pressurized by gaseous Nitrogen. Its physical conditions are continuously monitored by means
of a K-type thermocouple which directly measures the propyne temperature and a gauge pressure transducer. Given the possibility for propyne to decompose, the tank can be vented to the
atmosphere by means of a remotely controlled valve in order to empty the nitrogen from the tank or, in the absence of the operator, by a relief valve calibrated for opening at suitable pressure value. The
propyne mass flow rate is fixed by means of interchangeable cavitating venturi. The operation of the
venturi can be continuously monitored by using two pressure transducers placed on each side of the venturi. Along the fuel firing line, before the cavitating venturi, is placed a turbine flow meter from
Flow Technology. For this experimental campaign, both the venturis have been designed by FlowMaxx Engineering in order to provide the nominal mass flow rate at an inlet pressure of 35
bar.[23]

CEAS 2015 paper no 136. Page | 7 This work is licensed under the Creative Commons Attribution International License (CC BY). Copyright © 2015 by author(s).
Figure 6. GPRTF fuel system.
The thruster is mounted on a one degree-of-freedom dynamometric force balance. In order to evaluate the performance of the thruster prototype and the following measurements are acquired:
the chamber pressure, by means of an absolute pressure transducer mounted in recessed
position for protection from the high temperatures; the injection pressure by means of two absolute pressure transducers (one per each
propellant line) with the pressure taps just before the injector;
the thrust, by means of a subminiature compression load cell.
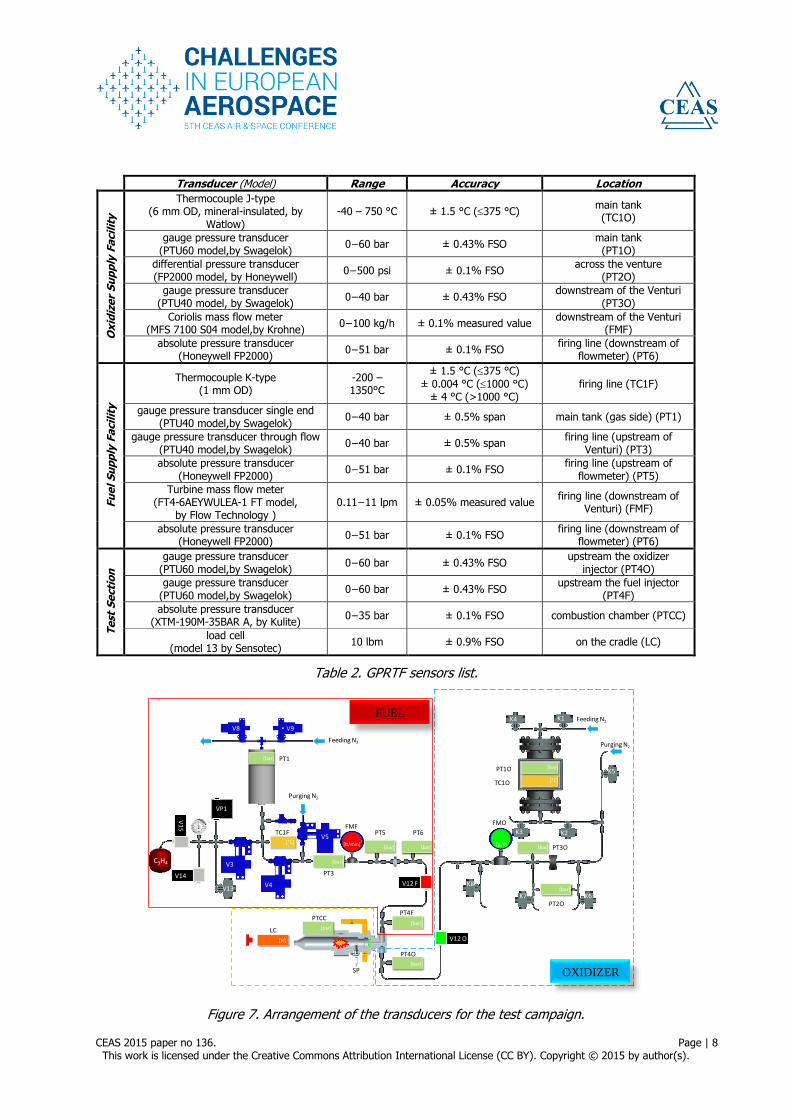
Table 2 summarizes the model, the physical range, the accuracy and the location of all the
transducers installed in the GPRTF and Figure 7 shows the sketch of the transducers arrangement used in the test campaign.
A DC source, capable of supplying different output voltages, provides the transducers with the required electric excitations. The data coming from the sensors and transducers installed in the
facility are acquired and transferred to a personal computer by means of a National Instruments acquisition board, capable of acquiring 32 analogic channels and 48 digital channels at a maximum
sampling rate of 1.25 MS/sec. The acquisition board is connected to different SCXI conditioning and
filtering modules, also produced by National Instruments. A LabVIEW data acquisition and control
program is used for real time display of the data and for recording all of the acquired signals. A 20 Samples/s acquisition rate has been selected for compatibility with the maximum speed of the
acquisition board and of the personal computer CPU, which represents the most stringent speed limitation of the present experimental configuration. Pressure, mass flow rate and thrust signals have
been low-pass filtered by means of a 10 Hz cut-off frequency analog Butterworth filter. A lower cut-
off frequency (4 Hz) has been used for the temperature signals.
Firing
Line
Feeding Line
Pressurization
Vacuum System
Tank
Cavitating
Venturi
Flow
Meter
Drain
Purge
PT1
TC1F
PT3PT5PT6
CEAS 2015 paper no 136. Page | 8 This work is licensed under the Creative Commons Attribution International License (CC BY). Copyright © 2015 by author(s).
Transducer (Model) Range Accuracy Location
Ox
idiz
er
Su
pp
ly F
acil
ity
Thermocouple J-type (6 mm OD, mineral-insulated, by
Watlow) -40 – 750 °C ± 1.5 °C (375 °C)
main tank (TC1O)
gauge pressure transducer (PTU60 model,by Swagelok)
0−60 bar ± 0.43% FSO main tank (PT1O)
differential pressure transducer (FP2000 model, by Honeywell)
0−500 psi ± 0.1% FSO across the venture
(PT2O)
gauge pressure transducer (PTU40 model, by Swagelok)
0−40 bar ± 0.43% FSO downstream of the Venturi
(PT3O)
Coriolis mass flow meter (MFS 7100 S04 model,by Krohne)
0−100 kg/h ± 0.1% measured value downstream of the Venturi
(FMF)
absolute pressure transducer (Honeywell FP2000)
0−51 bar ± 0.1% FSO firing line (downstream of
flowmeter) (PT6)
Fu
el
Su
pp
ly F
acil
ity
Thermocouple K-type (1 mm OD)
-200 – 1350°C
± 1.5 °C (375 °C)
± 0.004 °C (1000 °C) ± 4 °C (>1000 °C)
firing line (TC1F)
gauge pressure transducer single end (PTU40 model,by Swagelok)
0−40 bar ± 0.5% span main tank (gas side) (PT1)
gauge pressure transducer through flow (PTU40 model,by Swagelok)
0−40 bar ± 0.5% span firing line (upstream of
Venturi) (PT3)
absolute pressure transducer (Honeywell FP2000)
0−51 bar ± 0.1% FSO firing line (upstream of
flowmeter) (PT5)
Turbine mass flow meter (FT4-6AEYWULEA-1 FT model,
by Flow Technology ) 0.11−11 lpm ± 0.05% measured value
firing line (downstream of Venturi) (FMF)
absolute pressure transducer (Honeywell FP2000)
0−51 bar ± 0.1% FSO firing line (downstream of
flowmeter) (PT6)
Te
st S
ecti
on
gauge pressure transducer (PTU60 model,by Swagelok)
0−60 bar ± 0.43% FSO upstream the oxidizer
injector (PT4O)
gauge pressure transducer (PTU60 model,by Swagelok)
0−60 bar ± 0.43% FSO upstream the fuel injector
(PT4F)
absolute pressure transducer (XTM-190M-35BAR A, by Kulite)
0−35 bar ± 0.1% FSO combustion chamber (PTCC)
load cell (model 13 by Sensotec)
10 lbm ± 0.9% FSO on the cradle (LC)
Table 2. GPRTF sensors list.
Figure 7. Arrangement of the transducers for the test campaign.
Feeding N2
Purging N2
K1
K2
K4
K3
K7 K6
K8
K11
[bar]
[°C]
[bar]
[bar]
[bar]
[°C] [lt/min]
K5
[bar]
Feeding N2
V8 V9
V3
V4
V5
Purging N2
[bar]
V12 F
V12 O
V13
VP1
V1
5
V14
[bar]
[bar]
[bar] [bar][g/s]
[N]
C3H4
FMFFMO
TC1F
PT1
PT4F
PT4O
PT3
PT5 PT6
PTCC
SP
LC
PT1O
PT2O
PT3O
TC1O
OXIDIZER
FUEL
CEAS 2015 paper no 136. Page | 9 This work is licensed under the Creative Commons Attribution International License (CC BY). Copyright © 2015 by author(s).
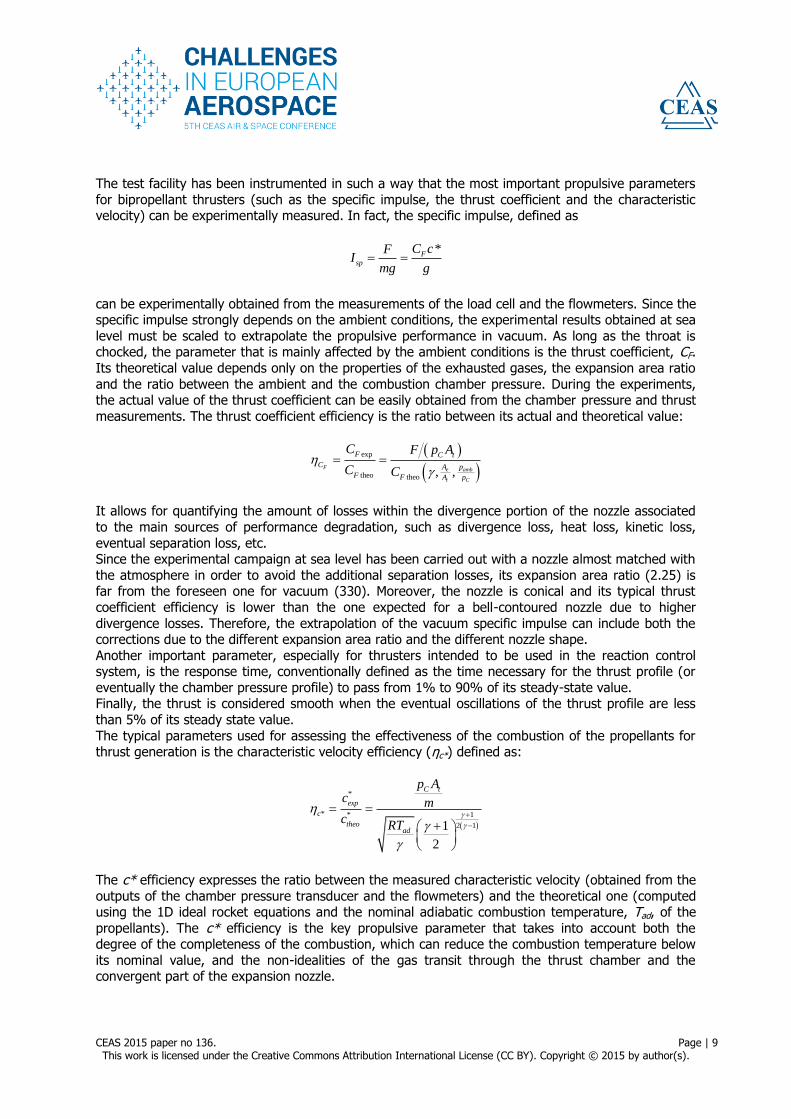
The test facility has been instrumented in such a way that the most important propulsive parameters
for bipropellant thrusters (such as the specific impulse, the thrust coefficient and the characteristic velocity) can be experimentally measured. In fact, the specific impulse, defined as
*F
sp
C cFI
mg g
can be experimentally obtained from the measurements of the load cell and the flowmeters. Since the specific impulse strongly depends on the ambient conditions, the experimental results obtained at sea
level must be scaled to extrapolate the propulsive performance in vacuum. As long as the throat is chocked, the parameter that is mainly affected by the ambient conditions is the thrust coefficient, CF.
Its theoretical value depends only on the properties of the exhausted gases, the expansion area ratio
and the ratio between the ambient and the combustion chamber pressure. During the experiments, the actual value of the thrust coefficient can be easily obtained from the chamber pressure and thrust
measurements. The thrust coefficient efficiency is the ratio between its actual and theoretical value:
exp
theo theo , ,F e amb
t C
F C t
C A pF F A p
C F p A
C C
It allows for quantifying the amount of losses within the divergence portion of the nozzle associated
to the main sources of performance degradation, such as divergence loss, heat loss, kinetic loss,
eventual separation loss, etc. Since the experimental campaign at sea level has been carried out with a nozzle almost matched with
the atmosphere in order to avoid the additional separation losses, its expansion area ratio (2.25) is far from the foreseen one for vacuum (330). Moreover, the nozzle is conical and its typical thrust
coefficient efficiency is lower than the one expected for a bell-contoured nozzle due to higher
divergence losses. Therefore, the extrapolation of the vacuum specific impulse can include both the corrections due to the different expansion area ratio and the different nozzle shape.
Another important parameter, especially for thrusters intended to be used in the reaction control system, is the response time, conventionally defined as the time necessary for the thrust profile (or
eventually the chamber pressure profile) to pass from 1% to 90% of its steady-state value. Finally, the thrust is considered smooth when the eventual oscillations of the thrust profile are less
than 5% of its steady state value.
The typical parameters used for assessing the effectiveness of the combustion of the propellants for thrust generation is the characteristic velocity efficiency (ηc*) defined as:
*
* * 1
2 11
2
C t
exp
c
theoad
p Ac m
cRT
The c* efficiency expresses the ratio between the measured characteristic velocity (obtained from the
outputs of the chamber pressure transducer and the flowmeters) and the theoretical one (computed using the 1D ideal rocket equations and the nominal adiabatic combustion temperature, Tad, of the
propellants). The c* efficiency is the key propulsive parameter that takes into account both the degree of the completeness of the combustion, which can reduce the combustion temperature below
its nominal value, and the non-idealities of the gas transit through the thrust chamber and the convergent part of the expansion nozzle.

CEAS 2015 paper no 136. Page | 10 This work is licensed under the Creative Commons Attribution International License (CC BY). Copyright © 2015 by author(s).
3 EXPERIMENTAL CAMPAIGN ON THE COAXIAL INJECTORS
The final type of injector selected for the steady-state bipropellant thruster is the coaxial injector. Since the propyne presents a quite high value of the vapor pressure at room temperature, the
flashing capability of the fuel can be used for a fine atomization of both the propellants in a suitable
design coaxial configuration. In order to investigate easily several configurations, the off-the-shelf air atomizing nozzles produced by Spray System Co. (see Figure 5) have been selected for a preliminary
screening of the injectors performed with simulant fluids (such as water for hydrogen peroxide and LPG for propyne). The main advantage of these air atomizing nozzles is the possibility of modifying
both the inner diameter and the height of the annulus by simply changing whether the air cap or the fluid cap, as shown in Figure 5. The external mix set-up permits to control independently the flows of
the propellants and it is mandatory in case of hypergolicity of the propellants. The internal mix set-up
produces a finer atomization of the propellants but the propellants streams are no more independent and they affect one another.
Figure 8. Nomenclature of the external mix set-up (left) and internal mix set-up (right).
Figure 8 (left) reports the nomenclature of the air atomizing nozzles for external mixing. The Fluid
Cap is identified with a code, PFDido, that includes information about the diameter of the internal bore and the inner diameter of the annulus, both reported in inch/1000: the code PF1650 means that the
diameter of the internal bore of the fluid cap is Di=16/1000 inch and the inner diameter of the annulus is do=50/1000 inch. The Air Cup code for external mix includes only the outer diameter of the
annulus, PADo: the code PA64 means that the outer diameter of the annulus is Do=64/1000 inch. The nomenclature for the internal mix set-up is shown in Figure 8 (right). The Fluid Cup
nomenclature is the same of the previous case while the Air Cup code (PADo-N-Db-deg) for the
internal mixing includes also information about the number (N) and the size (Db) of the bores in the dome and their cone angle: the code PA67-6-20-70 means that there are six bore with a diameter
Db=20/1000 inch with a cone angle of 70°. Before the experimental campaign on the bipropellant thruster demonstrator with the actual
propellants, a preliminary test campaign on the coaxial injectors has been carried out with the aim of
assessing the best configuration. This test campaign comprises two phases: assessment of the discharge coefficient of the coaxial injectors: for each of the nozzles
(whether inner bore or annulus) the discharge coefficient is evaluated using bidistilled water
as working fluid; assessment of the injection patterns of the coaxial injectors: for each configuration of the
coaxial injectors, the atomization and mixing of the propellants are investigated using non-
reacting simulant fluids by means of a high-speed camera. In order to obtain reliable results concerning the injection patterns of the coaxial injectors, the non-
reacting simulant fluids should have the physical properties relevant for the injection as close as
possible to the actual propellants. To mimick the behavior of hydrogen peroxide, water is typically used as simulant fluid. Except for the slightly higher density of hydrogen peroxide, these two fluids
present very close physical properties, as shown in Table 3. A mixture of propane (70%) and butane (30%) has been selected as non-reacting simulant fluid for the propyne. As reported in Table 3, the
properties at 15°C of the chosen LPG mixture are very close to the ones of propyne. Moreover, both
the propyne and the selected LPG mixture are very sensitive to the operating temperature and,
CEAS 2015 paper no 136. Page | 11 This work is licensed under the Creative Commons Attribution International License (CC BY). Copyright © 2015 by author(s).
therefore, an even better overlapping of the properties can be obtained by simulating propyne at
25°C with the propane-butane mixture at 15°C.
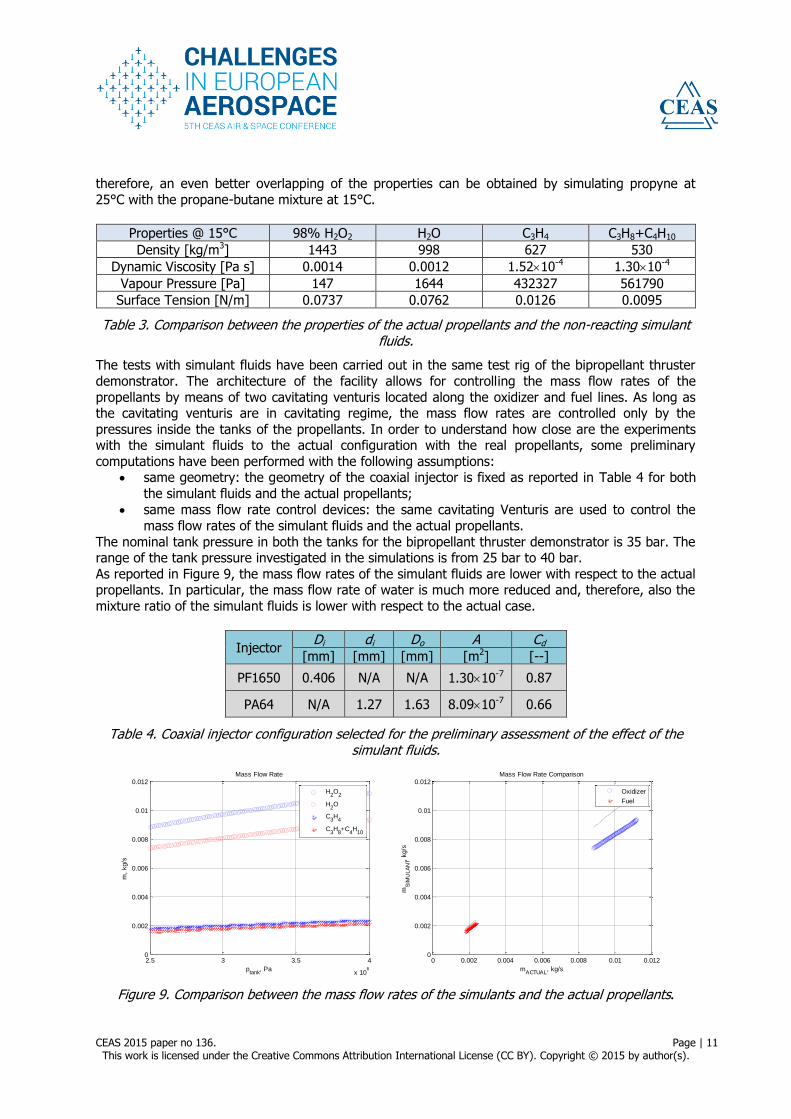
Properties @ 15°C 98% H2O2 H2O C3H4 C3H8+C4H10
Density [kg/m3] 1443 998 627 530
Dynamic Viscosity [Pa s] 0.0014 0.0012 1.5210-4 1.3010-4
Vapour Pressure [Pa] 147 1644 432327 561790
Surface Tension [N/m] 0.0737 0.0762 0.0126 0.0095
Table 3. Comparison between the properties of the actual propellants and the non-reacting simulant fluids.
The tests with simulant fluids have been carried out in the same test rig of the bipropellant thruster
demonstrator. The architecture of the facility allows for controlling the mass flow rates of the
propellants by means of two cavitating venturis located along the oxidizer and fuel lines. As long as the cavitating venturis are in cavitating regime, the mass flow rates are controlled only by the
pressures inside the tanks of the propellants. In order to understand how close are the experiments with the simulant fluids to the actual configuration with the real propellants, some preliminary
computations have been performed with the following assumptions: same geometry: the geometry of the coaxial injector is fixed as reported in Table 4 for both
the simulant fluids and the actual propellants;
same mass flow rate control devices: the same cavitating Venturis are used to control the
mass flow rates of the simulant fluids and the actual propellants.
The nominal tank pressure in both the tanks for the bipropellant thruster demonstrator is 35 bar. The range of the tank pressure investigated in the simulations is from 25 bar to 40 bar.
As reported in Figure 9, the mass flow rates of the simulant fluids are lower with respect to the actual propellants. In particular, the mass flow rate of water is much more reduced and, therefore, also the
mixture ratio of the simulant fluids is lower with respect to the actual case.
Injector Di di Do A Cd
[mm] [mm] [mm] [m2] [--]
PF1650 0.406 N/A N/A 1.3010-7 0.87
PA64 N/A 1.27 1.63 8.0910-7 0.66
Table 4. Coaxial injector configuration selected for the preliminary assessment of the effect of the simulant fluids.
Figure 9. Comparison between the mass flow rates of the simulants and the actual propellants.
2.5 3 3.5 4
x 106
0
0.002
0.004
0.006
0.008
0.01
0.012Mass Flow Rate
ptank
, Pa
m,
kg/s
H2O
2
H2O
C3H
4
C3H
8+C
4H
10
0 0.002 0.004 0.006 0.008 0.01 0.0120
0.002
0.004
0.006
0.008
0.01
0.012Mass Flow Rate Comparison
mACTUAL
, kg/s
mS
IMU
LA
NT,
kg/s
Oxidizer
Fuel

CEAS 2015 paper no 136. Page | 12 This work is licensed under the Creative Commons Attribution International License (CC BY). Copyright © 2015 by author(s).
Figure 10. Comparison between the pressure losses across the injectors with the simulants and the actual propellants.
Figure 11. Comparison between the velocities across the injectors with the simulants and the actual propellants.
Figure 12. Comparison between the Weber numbers of the injectors with the simulants and the actual propellants.
2.5 3 3.5 4
x 106
0
1
2
3
4
5
6
7x 10
5 Pressure Losses
ptank
, Pa
p,
Pa
H2O
2
H2O
C3H
4
C3H
8+C
4H
10
0 1 2 3 4 5 6 7
x 105
0
1
2
3
4
5
6
7x 10
5 Pressure Losses Comparison
pACTUAL
, Pa
p
SIM
ULA
NT,
Pa
Oxidizer
Fuel
2.5 3 3.5 4
x 106
5
10
15
20
25
30
35
40
45
50Velocity
p, Pa
v,
m/s
H2O
2
H2O
C3H
4
C3H
8+C
4H
10
5 10 15 20 25 30 35 40 455
10
15
20
25
30
35
40
45
50Velocity Comparison
vACTUAL
, m/s
v SIM
ULA
NT,
m/s
Oxidizer
Fuel
2.5 3 3.5 4
x 106
0
1
2
3
4
5
6x 10
4 WEBER
p, Pa
WE
BE
R
H2O
2
H2O
C3H
4
C3H
8+C
4H
10
0 0.5 1 1.5 2 2.5 3 3.5 4
x 104
0
1
2
3
4
5
6x 10
4 WEBER Comparison
WEBERACTUAL
WE
BE
RS
IMU
LA
NT
Oxidizer
Fuel

CEAS 2015 paper no 136. Page | 13 This work is licensed under the Creative Commons Attribution International License (CC BY). Copyright © 2015 by author(s).
Figure 13. Comparison between the Reynolds numbers of the injectors with the simulants and the actual propellants.
However, the values of the mixture ratio (4.7 for the actual propellants, 4.3 for the simulant fluids)
are still very close and the results of the simulant fluids can be still considered relevant for mimicking the actual injection patterns.
The other relevant parameters for the injection patterns are:
pressure drop across the injectors: 2
1
2 d i
mp
C A
as shown in Figure 10, for the oxidizer the pressure drop across the injector are almost the
same for hydrogen peroxide and water (the vapour pressure of both the fluids is negligible
with respect to the nominal tank pressure). Even if the pressure losses in the injector of the fuel differ for LPG and propyne (the vapor pressure of both the fluids is not negligible with
respect to the nominal tank pressure and is slightly different for the considered fluid), they are very close and the similarity condition is fulfilled;
injection velocity:
2i
pv
because of the lower density, the injection velocities for the simulant fluids are higher than
the ones of the actual propellants. Even in this case, the discrepancy is low and acceptable
(see Figure 11); Weber number:
2
iv dWe
this adimensional number is really critical for the determination of the injection patterns. For
the oxidizer, there is an almost perfect overlapping of the curves for the simulant fluids and the actual propellants. Moreover, the small gap for the fuel case is totally acceptable because
both the curves have the same order of magnitude and the difference for a fixed tank pressure is really small (see Figure 12);
Reynolds number:
iv dRe
Also the Reynolds number that takes into account the viscous forces confirms that the similarity criterion is fulfilled (see Figure 13).
2.5 3 3.5 4
x 106
0
1
2
3
4
5
6
7
8x 10
4 Reynolds
p, Pa
Reynold
s
H2O
2
H2O
C3H
4
C3H
8+C
4H
10
0 1 2 3 4 5 6 7 8
x 104
0
1
2
3
4
5
6
7
8x 10
4 Reynolds Comparison
ReynoldsACTUAL
Reynold
sS
IMU
LA
NT
Oxidizer
Fuel

CEAS 2015 paper no 136. Page | 14 This work is licensed under the Creative Commons Attribution International License (CC BY). Copyright © 2015 by author(s).
The results of this preliminary analysis are really promising since almost all the critical parameters
confirm the effectiveness of the similarity approach with the selected non-reacting simulant fluids, especially in terms of atomization and mixing capability of the fluids.
3.1 Assessment of the Discharge Coefficient with Water
The discharge coefficient of an injector of know geometry (such as the area of the injector Ai)
2d
i
mC
A p
can be simply obtained by measuring the mass flow rate passing through the injector (m) for a fixed pressure drop across the device (Δp), once the properties of the working fluid are known (such as the
density ρ).
Injector Di di Do A Δp mflowmeter mscale Cd(flowmeter) Cd(scale)
[mm] [mm] [mm] [m2] [bar] [g/s] [g/s] [--] [--]
PF16100 0.406 N/A N/A 1.3010-7
10.28 5.10 5.17 0.86 0.87
8.80 4.72 4.80 0.87 0.89
7.79 4.37 4.60 0.85 0.89
6.95 3.91 4.36 0.81 0.90
5.48 3.65 3.90 0.85 0.90
4.90 3.50 3.59 0.86 0.88
4.16 3.23 3.38 0.86 0.90
3.29 2.90 3.10 0.87 0.93
PF28100 0.711 N/A N/A 3.9710-7
1.46 6.44 6.60 0.95 0.97
2.29 8.01 8.44 0.94 0.99
3.05 9.48 9.76 0.96 0.99
3.85 10.64 10.97 0.96 0.99
4.58 11.70 12.19 0.97 1.00
PA64 N/A 1.27 1.63 8.0910-7
1.35 8.80 8.65 0.66 0.65
1.94 10.60 10.53 0.66 0.66
2.88 12.60 12.74 0.65 0.65
3.86 14.80 14.73 0.66 0.65
4.67 16.06 16.04 0.65 0.65
PA104 N/A 2.54 2.64 4.1310-7
1.58 3.48 3.67 0.47 0.49
2.42 4.60 4.95 0.50 0.543
3.27 5.30 5.58 0.50 0.52
4.38 6.40 6.76 0.52 0.55
5.30 7.10 7.42 0.53 0.55
PA108 N/A 2.54 2.80 1.0910-6
1.16 11.45 12.10 0.68 0.73
1.84 14.77 15.93 0.70 0.76
2.68 18.68 19.25 0.74 0.76
PA120 N/A 2.54 3.05 2.2310-6 4.26 13.10 13.02 0.64 0.63
10.86 23.20 20.54 0.70 0.62
Table 5. Discharge coefficient for the air atomizing nozzle produced by Spray System Co.
Table 5 reports the results of the test campaign with bidistilled water performed for the evaluation of
the discharge coefficient of the candidate Fluid Caps and Air Caps. The mass flow rate has been measured by means of two different approaches: using a Coriolis flowmeter; and collecting the water
in a vessel and, then, measuring its weight by means of a scale and the overall time of the experiment with a chronometer.
CEAS 2015 paper no 136. Page | 15 This work is licensed under the Creative Commons Attribution International License (CC BY). Copyright © 2015 by author(s).
In general, the internal bore of the Fluid Cap shows a quite high value of the discharge coefficient
that can range from 0.85 to 0.99. On the contrary, the discharge coefficient of the annulus is lower and its typical value is between 0.5 and 0.7. The discharge coefficients of the Fluid Caps PF1650 and
PF2850 have not been experimentally assessed, since they are supposed to be equal to PF16100 and
PF28100, respectively. Finally, the evaluation of the discharge coefficients of the Air Caps PA67-6-20-70 and PA120-6-35-60 is not trivial since the inner and outer streams are not independent. It has
been decided to test them directly with the simulant fluids.
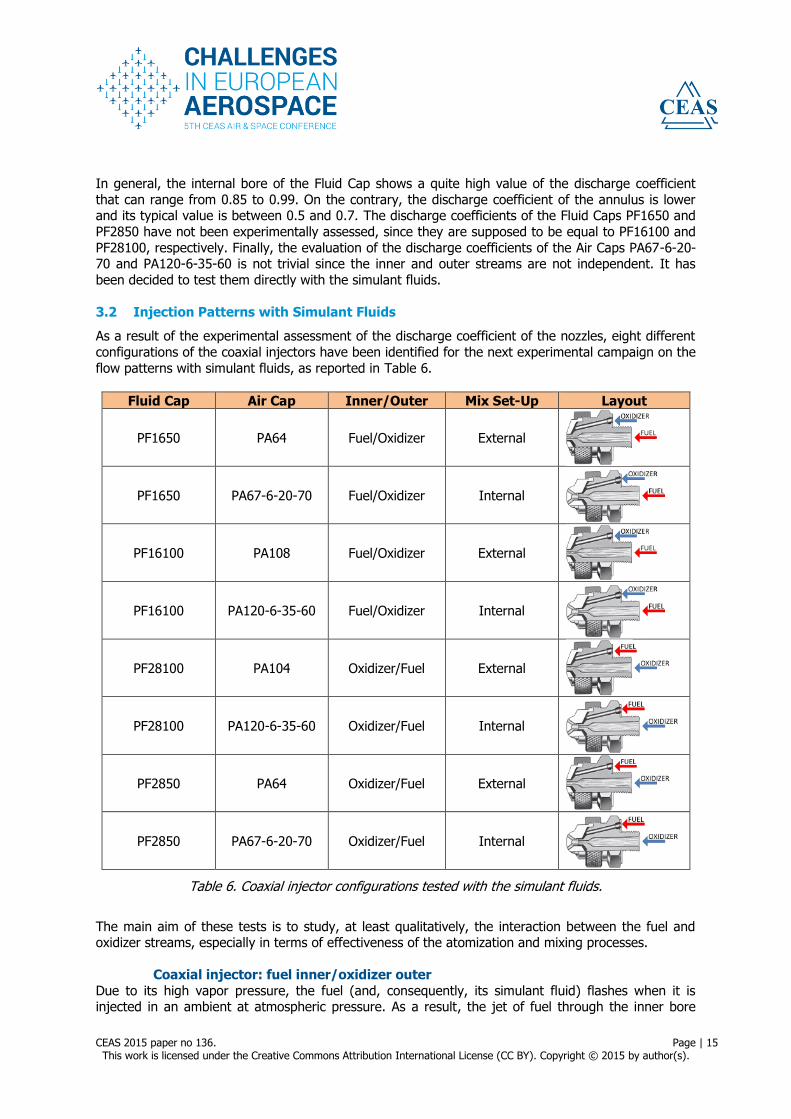
3.2 Injection Patterns with Simulant Fluids
As a result of the experimental assessment of the discharge coefficient of the nozzles, eight different
configurations of the coaxial injectors have been identified for the next experimental campaign on the
flow patterns with simulant fluids, as reported in Table 6.
Fluid Cap Air Cap Inner/Outer Mix Set-Up Layout
PF1650 PA64 Fuel/Oxidizer External
PF1650 PA67-6-20-70 Fuel/Oxidizer Internal
PF16100 PA108 Fuel/Oxidizer External
PF16100 PA120-6-35-60 Fuel/Oxidizer Internal
PF28100 PA104 Oxidizer/Fuel External
PF28100 PA120-6-35-60 Oxidizer/Fuel Internal
PF2850 PA64 Oxidizer/Fuel External
PF2850 PA67-6-20-70 Oxidizer/Fuel Internal
Table 6. Coaxial injector configurations tested with the simulant fluids.
The main aim of these tests is to study, at least qualitatively, the interaction between the fuel and oxidizer streams, especially in terms of effectiveness of the atomization and mixing processes.
Coaxial injector: fuel inner/oxidizer outer
Due to its high vapor pressure, the fuel (and, consequently, its simulant fluid) flashes when it is injected in an ambient at atmospheric pressure. As a result, the jet of fuel through the inner bore

CEAS 2015 paper no 136. Page | 16 This work is licensed under the Creative Commons Attribution International License (CC BY). Copyright © 2015 by author(s).
tends to expand in the radial direction, thus enhancing the mixing of the two streams and,
consequently, the atomization of the fluids. For each of the coaxial injector configurations, the typical test sequence comprises three injections:
a ten seconds injection of only the fuel (i.e. its simulant fluid);
a ten seconds injection of only the oxidizer (i.e. its simulant fluid);
a ten seconds injection of the fuel and the oxidizer together.
Figure 14. Jet patterns for PF1650+PA64: butane-propane mixture through the inner bore (top); water through the annulus (middle); water and butane-propane mixture together through the coaxial
injector (bottom).
The first configuration analyzed was the external mix set-up obtained with PF1650+PA64. Along the oxidizer line, the tank pressure was set to the nominal value (35 bar) and the mass flow rate
measured by the Coriolis flowmeter reached the desired value because the cavitating Venturi worked correctly. As expected, the pressure drop across the injector was between 1 bar and 1.5 bar.
The pressure inside the tank of the fuel was fixed to the nominal value. Both the inlet and outlet
pressure of the Venturi confirm that the device correctly worked in cavitating regime. The pressure losses across the fuel injector were significantly higher than the expected ones (13 bar instead of 6
bar) but still compatible with the nominal operating condition of the bipropellant thruster demonstrator. The more likely reason of this behaviour is the flashing of the fuel at the exit of the

CEAS 2015 paper no 136. Page | 17 This work is licensed under the Creative Commons Attribution International License (CC BY). Copyright © 2015 by author(s).
nozzle. Concerning the O/F ratio, the outputs of the cavitating Venturi assure that the tests were
performed almost at the nominal condition and, therefore, they can be considered relevant for the characterization of the injection patterns. Figure 14 reports pictures of the three injections. The
simulant of the fuel injected through the inner bore creates a jet that is expanding because the fluid
starts flashing. On the contrary, the water injected through the annulus produces a jet with a quite long compact length in which the liquid tends to close the gap of the annulus and form a compact full
jet. The combination of the two streams is really effective since there are a very good mixing and a fine atomization of the two non-reacting simulant fluids. Qualitatively, the flow patterns of this
configuration proved to be really effective.
Figure 15. Jet patterns for PF1650+PA67-6-20-70(left) and PF16100+PA120-6-35-60(right): butane-propane mixture through the inner bore (top); water through the annulus (middle); water and
butane-propane mixture together through the coaxial injector (bottom).
In the internal mix set-up configuration PF1650+PA67-6-20-70, the two streams are not independent. However, since the mass flow rates were effectively controlled by the two cavitating Venturis, the
interaction between the two streams is only in terms of change of the pressure losses and not in terms of mass flow rate or O/F ratio. The experimental data confirmed that the Venturis correctly
worked and, consequently, the O/F ratio obtained during the third injection with both the fluids was
very close to the nominal condition. The pictures that highlight the injection patterns of the three tests are reported in Figure 15 (left). Concerning the injection of only the simulant of the fuel, the jet
is now divided in six streams because of the six bores on the dome of the Air Cap. The flashing behaviour of the fluid is still evident in the progressive vaporization of six jets initially injected in liquid
phase. The test with only water shows that the six jets exiting from the bores present a quite long compact jet with high velocity. The combination of the two streams proved to be really effective for
CEAS 2015 paper no 136. Page | 18 This work is licensed under the Creative Commons Attribution International License (CC BY). Copyright © 2015 by author(s).
the atomization and mixing of the propellants, especially because the internal mixing configuration
allows first to finely mix the fluids inside the injector and then to obtain an atomized spray through the bores of the dome of the Air Cap (see the picture on the bottom of Figure 15 - left). Moreover,
with respect to the previous configuration (PF1650+PA64), the internal mix set-up produces a final
atomized spray that is more spread in radial direction and, therefore, it allows for obtaining the necessary high atomization of the propellants within a shorter distance from the outlet of the nozzle.
The next configuration tested has been the PF16100+PA108 injector. This configuration is very similar to the PF1650+PA64 because the inner bore of the Fluid Cup is the same. Only the height of
the annulus and the distance between the annulus and the inner bore are different. The injection patterns for the PF16100+PA108 configuration are very similar to the ones obtained with the
PF1650+PA64 configuration. However, the higher gap between the stream of the inner bore and
stream through the annulus implies a less effective atomization of the final spray. In conclusion, due to the slightly worse injection patterns the PF16100+PA108 configuration is less attractive than the
PF1650+PA64 configuration.
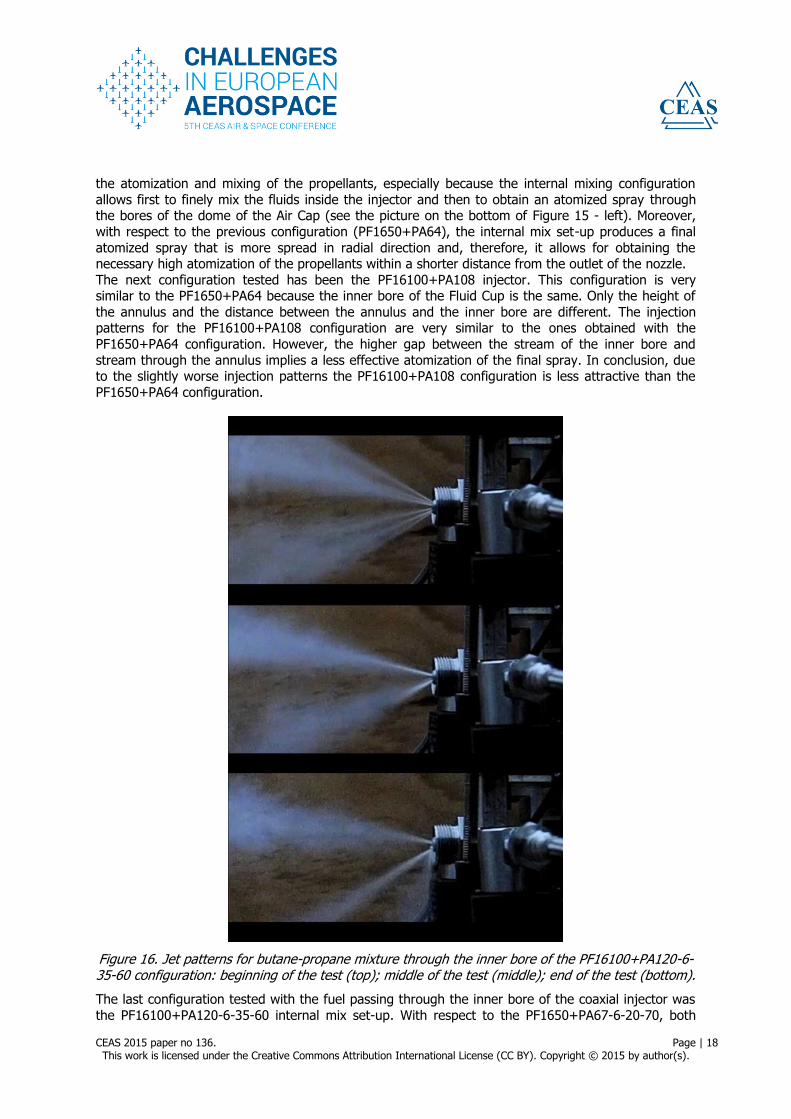
Figure 16. Jet patterns for butane-propane mixture through the inner bore of the PF16100+PA120-6-35-60 configuration: beginning of the test (top); middle of the test (middle); end of the test (bottom).
The last configuration tested with the fuel passing through the inner bore of the coaxial injector was
the PF16100+PA120-6-35-60 internal mix set-up. With respect to the PF1650+PA67-6-20-70, both
CEAS 2015 paper no 136. Page | 19 This work is licensed under the Creative Commons Attribution International License (CC BY). Copyright © 2015 by author(s).
the area of the annulus and the overall area of the bores on the dome of the injector are higher. Even
if in this configuration the spray is a finely atomized (see Figure 15, right-bottom), the resulting spray presents a wider cone angle of the jet with respect to the PF1650+PA67-6-20-70, probably because
of the reduced velocity of the water. In view of the final utilization inside the bipropellant thruster
demonstrator, the previous configuration seems to be better. Moreover, during the test with only the simulant fluid of the fuel, the reduced velocity across the six
bores of the dome allowed for occluding some of the bores because of the freezing of the flashing fluid, as shown in Figure 16. This problem did not occur during the test with both the fluids (see
Figure 15 - right). However, this fact together with the wider angle of the atomized spray with respect to the previous internal mix set-up configuration suggests that the best candidate for the
internal mix set-up with the fuel passing through the inner bore is the PF1650+PA67-6-20-70
configuration.
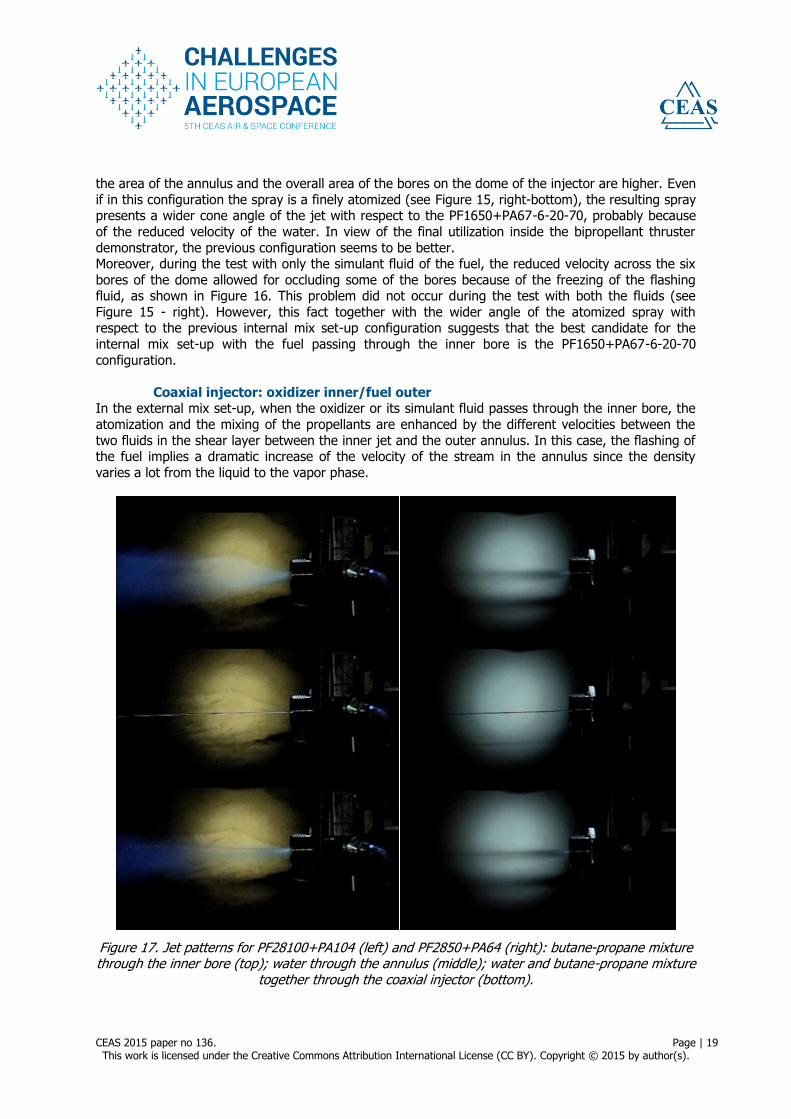
Coaxial injector: oxidizer inner/fuel outer In the external mix set-up, when the oxidizer or its simulant fluid passes through the inner bore, the
atomization and the mixing of the propellants are enhanced by the different velocities between the
two fluids in the shear layer between the inner jet and the outer annulus. In this case, the flashing of the fuel implies a dramatic increase of the velocity of the stream in the annulus since the density
varies a lot from the liquid to the vapor phase.
Figure 17. Jet patterns for PF28100+PA104 (left) and PF2850+PA64 (right): butane-propane mixture through the inner bore (top); water through the annulus (middle); water and butane-propane mixture
together through the coaxial injector (bottom).

CEAS 2015 paper no 136. Page | 20 This work is licensed under the Creative Commons Attribution International License (CC BY). Copyright © 2015 by author(s).
The first configuration tested has been the PF28100+PA104. This configuration is an external mix set-
up in which the two streams are independent. Due to the lower discharge coefficient of the annulus of the outer stream, the pressure losses of the oxidizer increased while the pressure drop of the fuel
decreased with respect to the previous configuration with switched streams (fuel inner/oxidizer
outer). The nominal flow rate was almost perfectly guaranteed in both the oxidizer and fuel line, together with the nominal O/F ratio. Concerning the jet patterns reported in Figure 17 (left), the
results were not promising. The injection of the fuel in the outer annulus produced a highly vaporized jet due to the flashing of the simulant fluid of the fuel. On the contrary, the jet of water through the
inner bore is fast and compact with a very long compact length. As reported in the bottom picture of Figure 17 (left), the interaction between the two streams was weak since the inner water jet
continued to be compact inside the flashed conical jet of the outer stream of LPG. The reason of the
low interaction may rely also the quite high gap between the inner bore (28/1000 inch) and the inner diameter of the annulus (100/1000 inch). This configuration was definitively not effective in terms of
the mixing and atomization of the two streams and, therefore, it is not recommended for the use in the bipropellant thruster demonstrator.
The last external mix set-up tested is the PF2850+PA64 configuration. In this coaxial injector, the
inner bore and the annulus are closer with respect to the PF28100+PA104 assembly. The jet patterns of the three injections are reported in Figure 17 (right). Even if in this configuration the inner bore
and the annulus were closer, the atomization and mixing resulting from the simultaneous injection of both the fluids were poor. In fact, the compact jet of water is still visible inside the annular jet of the
simulant fluids of the fuel. As for the PF28100+PA104, the external mix set-up with the low-vapour pressure fluid (oxidizer or its simulant) located in the inner bore proved to be not suitable for
obtaining a finely atomized spray. Therefore, this configuration is not recommended for the final
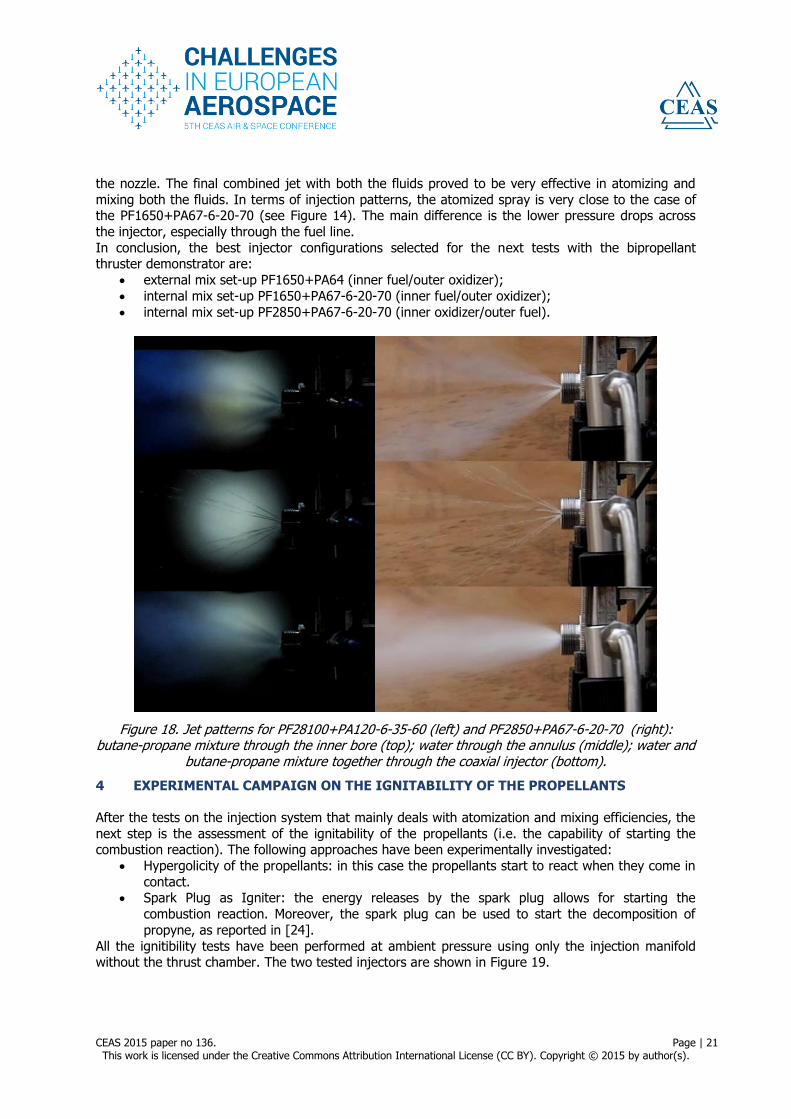
design of the bipropellant thruster. The results of the internal mix set-up for the PF28100+PA120-6-35-60 are shown in Figure 18 (left).
The Air Cap has been already tested in the previous experimental campaign, however in this configuration the streams of the propellants are switched from the inner to the outer and vice versa.
Despite the wider inner bore of Fluid Cap PF28100, the pressure drop for the water at the nominal
flow rate were quite high, such as 3 bar. On the contrary, the quite large gap of the annulus for the simulant of the fuel yielded to an inlet injector pressure lower than the vapor pressure of the working
fluid. This implies that the cavitating Venturi was in breakdown condition and the flow after the Venturi was likely a two-phase flow. At breakdown, the exit flow can be highly unstable and, even if
the estimation of the mass flow rate by means of the Cavitating Venturi is still reliable, it is better to
be far from this condition in order to avoid the onset of flow instabilities in the combustion chamber. In terms of spray patterns, the injection of only the fuel showed a rapid flashing of the propellants
that was injected already in two-phase flow, as shown in Figure 18 (left). The six compact jets of water (see middle of Figure 18 - left) were highly atomized when the coaxial injector was operated
with both the fluids (see bottom of Figure 18 - left). Even in this case, the spray cone angle was quite high, thus resulting in an undesired impinging of the propellants on the internal walls of the
combustion chamber. In conclusion, the experimental campaign on the PF28100+PA120-6-35-60
coaxial injector confirms that this configuration is not suitable for the use in the bipropellant thruster demonstrator mainly because the pressure losses across the injector do not allow for avoiding the
breakdown condition of the cavitating Venturi during the initial start-up transient. Finally, the internal mix set-up PF2850+PA67-6-20-70 was also tested with the simulant fluids. The
nominal value of the mass flow rate of the fuel produced a pressure drop equal to 3 bar. On the
contrary, the pressure losses across the fuel injector, equal to 4 bar, allowed for maintaining liquid the LPG between the outlet of the Venturi and the injector). During the test with both the fluids, the
interaction between the fluids, typical of the internal mix set-up, produced an increase of the pressure losses across the injector in both the lines. Figure 18 (right) shows the pictures of the three
consecutive injections. The fuel showed the typical flashing behaviour already highlighted in the previous experiments. The water jets across the six bores of the dome of the injector had a very
short compact length, since the jets started to break into droplets a few centimeter from the outlet of
CEAS 2015 paper no 136. Page | 21 This work is licensed under the Creative Commons Attribution International License (CC BY). Copyright © 2015 by author(s).
the nozzle. The final combined jet with both the fluids proved to be very effective in atomizing and
mixing both the fluids. In terms of injection patterns, the atomized spray is very close to the case of the PF1650+PA67-6-20-70 (see Figure 14). The main difference is the lower pressure drops across
the injector, especially through the fuel line.
In conclusion, the best injector configurations selected for the next tests with the bipropellant thruster demonstrator are:
external mix set-up PF1650+PA64 (inner fuel/outer oxidizer);
internal mix set-up PF1650+PA67-6-20-70 (inner fuel/outer oxidizer);
internal mix set-up PF2850+PA67-6-20-70 (inner oxidizer/outer fuel).
Figure 18. Jet patterns for PF28100+PA120-6-35-60 (left) and PF2850+PA67-6-20-70 (right): butane-propane mixture through the inner bore (top); water through the annulus (middle); water and
butane-propane mixture together through the coaxial injector (bottom).
4 EXPERIMENTAL CAMPAIGN ON THE IGNITABILITY OF THE PROPELLANTS
After the tests on the injection system that mainly deals with atomization and mixing efficiencies, the
next step is the assessment of the ignitability of the propellants (i.e. the capability of starting the combustion reaction). The following approaches have been experimentally investigated:
Hypergolicity of the propellants: in this case the propellants start to react when they come in
contact. Spark Plug as Igniter: the energy releases by the spark plug allows for starting the
combustion reaction. Moreover, the spark plug can be used to start the decomposition of
propyne, as reported in [24].
All the ignitibility tests have been performed at ambient pressure using only the injection manifold without the thrust chamber. The two tested injectors are shown in Figure 19.

CEAS 2015 paper no 136. Page | 22 This work is licensed under the Creative Commons Attribution International License (CC BY). Copyright © 2015 by author(s).
Figure 19. The two tested injectors: PF1650+PA64 (left) and PF1650+PA67-6-20-70 (right).
4.1 Hypergolicity Tests
Some tests have been performed in order to understand if the two fluids can directly react without
using any source of ignition. Figure 20 shows the injection of propyne only (top), HTP only (middle) and, finally, their contemporary injection (bottom) in order to show if the propellants are hypergolic.
The injector used in the tests reported in the following pictures is the PF1650+PA64 that is an external mix set-up more suitable in case of hypergolicity of the propellants. As visible from the
different pictures the propyne, centrally injected, tends to flash and produces a vapor coming out of the manifold. The HTP, injected coaxially to propyne, tends to remain liquid and shows a straight
liquid jet out of the manifold.
Figure 20. Injection of only propyne (top), injection of only HTP (middle) and contemporary injection of propyne and HTP (bottom) through the injector PF1650+PA64.
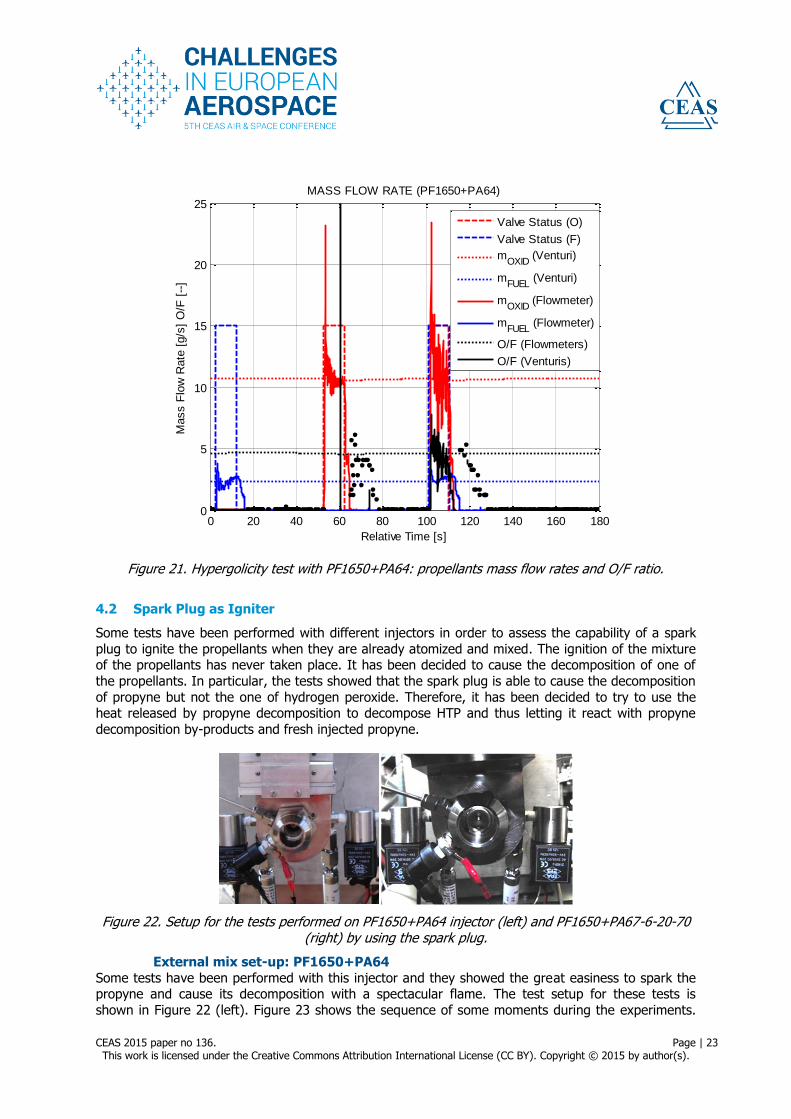
As visible from Figure 20 the two propellants, injected at the same time, appear to be partially mixed with some hydrogen peroxide drops coming out of the manifold. However the two propellants did not
react: they are not hypergolic. Therefore, some energy must be supplied in order to allow the
reaction between the two propellants. As shown in Figure 21, both the cavitating Venturis have been able to guarantee the correct mass flow rate and consequently the nominal O/F ratio.
CEAS 2015 paper no 136. Page | 23 This work is licensed under the Creative Commons Attribution International License (CC BY). Copyright © 2015 by author(s).
Figure 21. Hypergolicity test with PF1650+PA64: propellants mass flow rates and O/F ratio.
4.2 Spark Plug as Igniter
Some tests have been performed with different injectors in order to assess the capability of a spark
plug to ignite the propellants when they are already atomized and mixed. The ignition of the mixture of the propellants has never taken place. It has been decided to cause the decomposition of one of
the propellants. In particular, the tests showed that the spark plug is able to cause the decomposition
of propyne but not the one of hydrogen peroxide. Therefore, it has been decided to try to use the heat released by propyne decomposition to decompose HTP and thus letting it react with propyne
decomposition by-products and fresh injected propyne.
Figure 22. Setup for the tests performed on PF1650+PA64 injector (left) and PF1650+PA67-6-20-70 (right) by using the spark plug.
External mix set-up: PF1650+PA64
Some tests have been performed with this injector and they showed the great easiness to spark the propyne and cause its decomposition with a spectacular flame. The test setup for these tests is
shown in Figure 22 (left). Figure 23 shows the sequence of some moments during the experiments.
0 20 40 60 80 100 120 140 160 1800
5
10
15
20
25
Relative Time [s]
Mass F
low
Rate
[g/s
] O
/F [
--]
MASS FLOW RATE (PF1650+PA64)
Valve Status (O)
Valve Status (F)
mOXID
(Venturi)
mFUEL
(Venturi)
mOXID
(Flowmeter)
mFUEL
(Flowmeter)
O/F (Flowmeters)
O/F (Venturis)

CEAS 2015 paper no 136. Page | 24 This work is licensed under the Creative Commons Attribution International License (CC BY). Copyright © 2015 by author(s).
The figure clearly shows the ignition of the propyne and the consequent flame. The injection of HTP
(injected coaxially and externally to the propyne jet) causes the flame shape to be more cylindrical. From the pictures it can be noted that the HTP decomposition is not completed and some hydrogen
peroxide still remains in liquid phase out of the manifold.
Figure 23. Sequence of different moments during the ignition tests performed with the injector PF1650+PA64 (injection sequence: first propyne, its ignition and then HTP injection and combustion).
The typical ignition sequence comprises the following phase: a first firing pulse with propyne that
saturates the injection manifold; when the velocity of propyne decreases the propyne starts to
decompose; after the ignition of propyne the firing valve of the fuel is opened again to create an ignited jet of propyne; the final step is the opening of the oxidizer valve that yields to the combustion
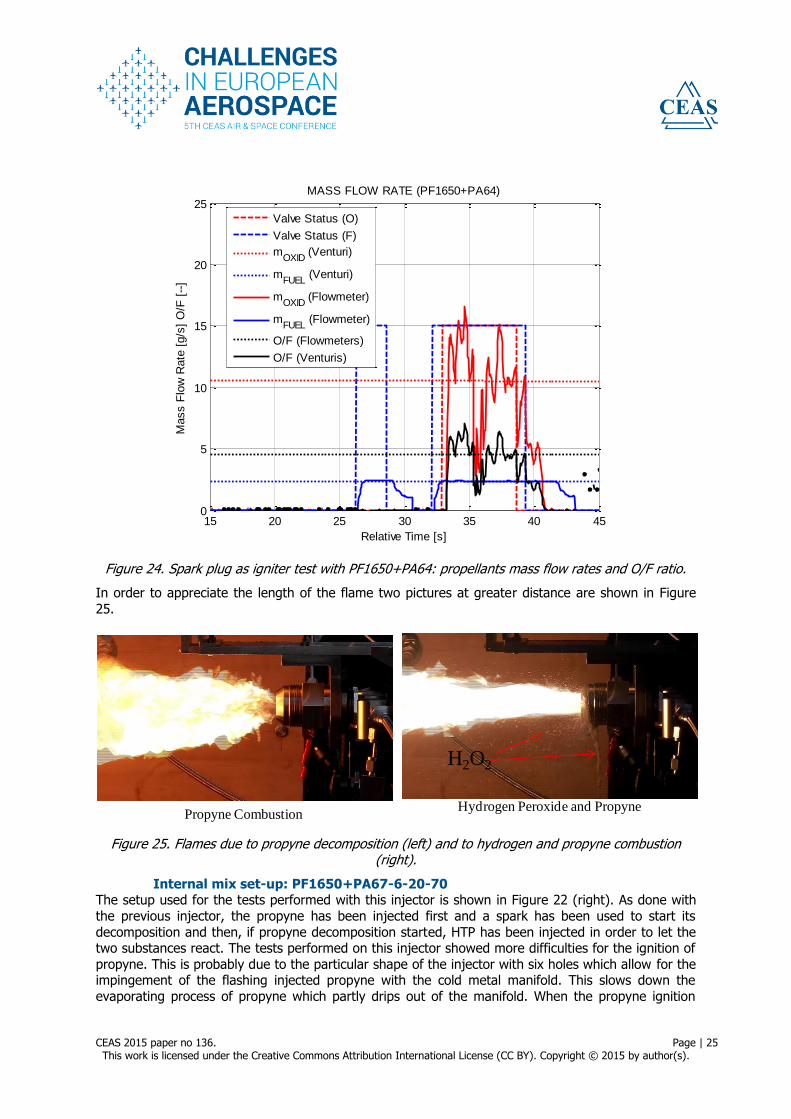
of both the propellants. As shown in Figure 24, the nominal value of the O/F ratio was obtained even if the output of the oxidizer flowmeter showed strong oscillations around the mean value. The
unstable behavior of the oxidizer mass flow rate is mainly due to the highly turbulent combustion and the low pressure drop across the injector.
C3H4
Propyne IgnitionPropyne Injection
Propyne Combustion Hydrogen Peroxide Injection
H2O2
H2O2
Hydrogen Peroxide and Propyne
CEAS 2015 paper no 136. Page | 25 This work is licensed under the Creative Commons Attribution International License (CC BY). Copyright © 2015 by author(s).
Figure 24. Spark plug as igniter test with PF1650+PA64: propellants mass flow rates and O/F ratio.
In order to appreciate the length of the flame two pictures at greater distance are shown in Figure
25.
Figure 25. Flames due to propyne decomposition (left) and to hydrogen and propyne combustion (right).
Internal mix set-up: PF1650+PA67-6-20-70 The setup used for the tests performed with this injector is shown in Figure 22 (right). As done with
the previous injector, the propyne has been injected first and a spark has been used to start its
decomposition and then, if propyne decomposition started, HTP has been injected in order to let the two substances react. The tests performed on this injector showed more difficulties for the ignition of
propyne. This is probably due to the particular shape of the injector with six holes which allow for the impingement of the flashing injected propyne with the cold metal manifold. This slows down the
evaporating process of propyne which partly drips out of the manifold. When the propyne ignition
15 20 25 30 35 40 450
5
10
15
20
25
Relative Time [s]
Mass F
low
Rate
[g/s
] O
/F [
--]
MASS FLOW RATE (PF1650+PA64)
Valve Status (O)
Valve Status (F)
mOXID
(Venturi)
mFUEL
(Venturi)
mOXID
(Flowmeter)
mFUEL
(Flowmeter)
O/F (Flowmeters)
O/F (Venturis)
Propyne Combustion
H2O2
Hydrogen Peroxide and Propyne

CEAS 2015 paper no 136. Page | 26 This work is licensed under the Creative Commons Attribution International License (CC BY). Copyright © 2015 by author(s).
happens, the liquid propyne spilled out produces a huge flame which hides the manifold before the
HTP is injected. Some pictures of the tests performed are shown in Figure 26.
Figure 26. Sequence of events during the ignition tests performed with the injector PF1650+PA67-6-20-70 (injection sequence: first propyne and its ignition and then HTP).
As in the previous case, part of the injected HTP, even passing through a high temperature region, is not able to totally decompose and react with propyne. The HTP dripping out from the manifold is
clearly visible. Only after three pulses the propyne has ignited. In this case, due to the higher
pressure losses across the oxidizer injector the mass flowrate measured by the Coriolis flowmeter has been smoother and the O/F has been constant at the nominal value. The resulting flame has been
particularly strong and uniform.
C3H4 (vapour)
C3H4 (liquid)Propyne Ignition
Ignition of liquid Propyne under the manifold Propyne combustion (also under the manifold)
Hydrogen Peroxide Injection
H2O2
Hydrogen Peroxide and Propyne
Propyne Injection
H2O2
CEAS 2015 paper no 136. Page | 27 This work is licensed under the Creative Commons Attribution International License (CC BY). Copyright © 2015 by author(s).
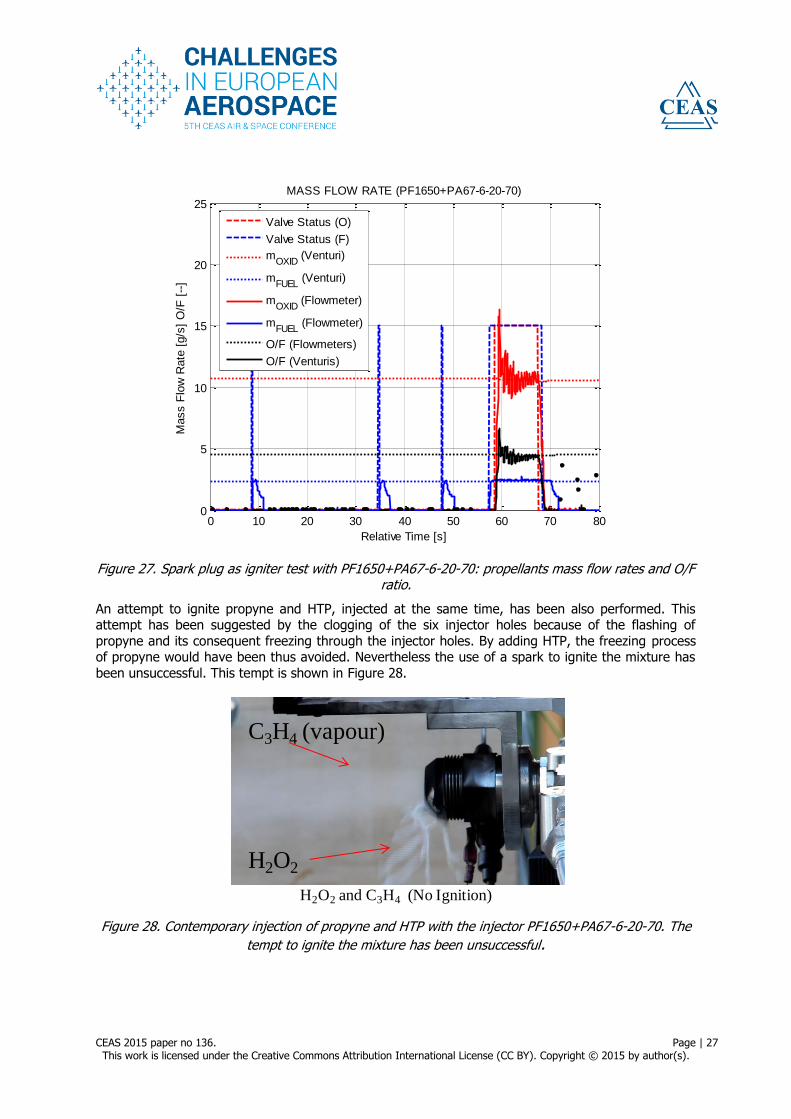
Figure 27. Spark plug as igniter test with PF1650+PA67-6-20-70: propellants mass flow rates and O/F ratio.
An attempt to ignite propyne and HTP, injected at the same time, has been also performed. This attempt has been suggested by the clogging of the six injector holes because of the flashing of
propyne and its consequent freezing through the injector holes. By adding HTP, the freezing process of propyne would have been thus avoided. Nevertheless the use of a spark to ignite the mixture has
been unsuccessful. This tempt is shown in Figure 28.
Figure 28. Contemporary injection of propyne and HTP with the injector PF1650+PA67-6-20-70. The
tempt to ignite the mixture has been unsuccessful.
0 10 20 30 40 50 60 70 800
5
10
15
20
25
Relative Time [s]
Mass F
low
Rate
[g/s
] O
/F [
--]
MASS FLOW RATE (PF1650+PA67-6-20-70)
Valve Status (O)
Valve Status (F)
mOXID
(Venturi)
mFUEL
(Venturi)
mOXID
(Flowmeter)
mFUEL
(Flowmeter)
O/F (Flowmeters)
O/F (Venturis)
H2O2 and C3H4 (No Ignition)
H2O2
C3H4 (vapour)
CEAS 2015 paper no 136. Page | 28 This work is licensed under the Creative Commons Attribution International License (CC BY). Copyright © 2015 by author(s).
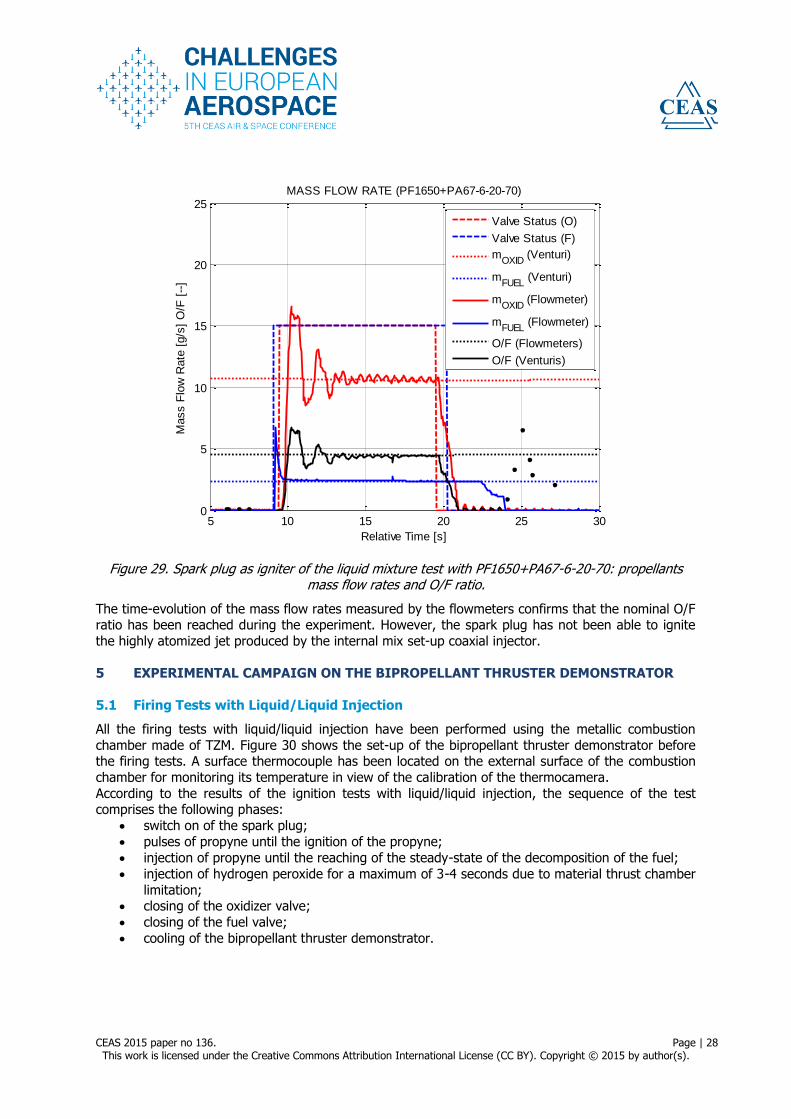
Figure 29. Spark plug as igniter of the liquid mixture test with PF1650+PA67-6-20-70: propellants mass flow rates and O/F ratio.
The time-evolution of the mass flow rates measured by the flowmeters confirms that the nominal O/F ratio has been reached during the experiment. However, the spark plug has not been able to ignite
the highly atomized jet produced by the internal mix set-up coaxial injector.
5 EXPERIMENTAL CAMPAIGN ON THE BIPROPELLANT THRUSTER DEMONSTRATOR
5.1 Firing Tests with Liquid/Liquid Injection
All the firing tests with liquid/liquid injection have been performed using the metallic combustion
chamber made of TZM. Figure 30 shows the set-up of the bipropellant thruster demonstrator before the firing tests. A surface thermocouple has been located on the external surface of the combustion
chamber for monitoring its temperature in view of the calibration of the thermocamera.
According to the results of the ignition tests with liquid/liquid injection, the sequence of the test comprises the following phases:
switch on of the spark plug;
pulses of propyne until the ignition of the propyne;
injection of propyne until the reaching of the steady-state of the decomposition of the fuel;
injection of hydrogen peroxide for a maximum of 3-4 seconds due to material thrust chamber
limitation; closing of the oxidizer valve;
closing of the fuel valve;
cooling of the bipropellant thruster demonstrator.
5 10 15 20 25 300
5
10
15
20
25
Relative Time [s]
Mass F
low
Rate
[g/s
] O
/F [
--]
MASS FLOW RATE (PF1650+PA67-6-20-70)
Valve Status (O)
Valve Status (F)
mOXID
(Venturi)
mFUEL
(Venturi)
mOXID
(Flowmeter)
mFUEL
(Flowmeter)
O/F (Flowmeters)
O/F (Venturis)
CEAS 2015 paper no 136. Page | 29 This work is licensed under the Creative Commons Attribution International License (CC BY). Copyright © 2015 by author(s).
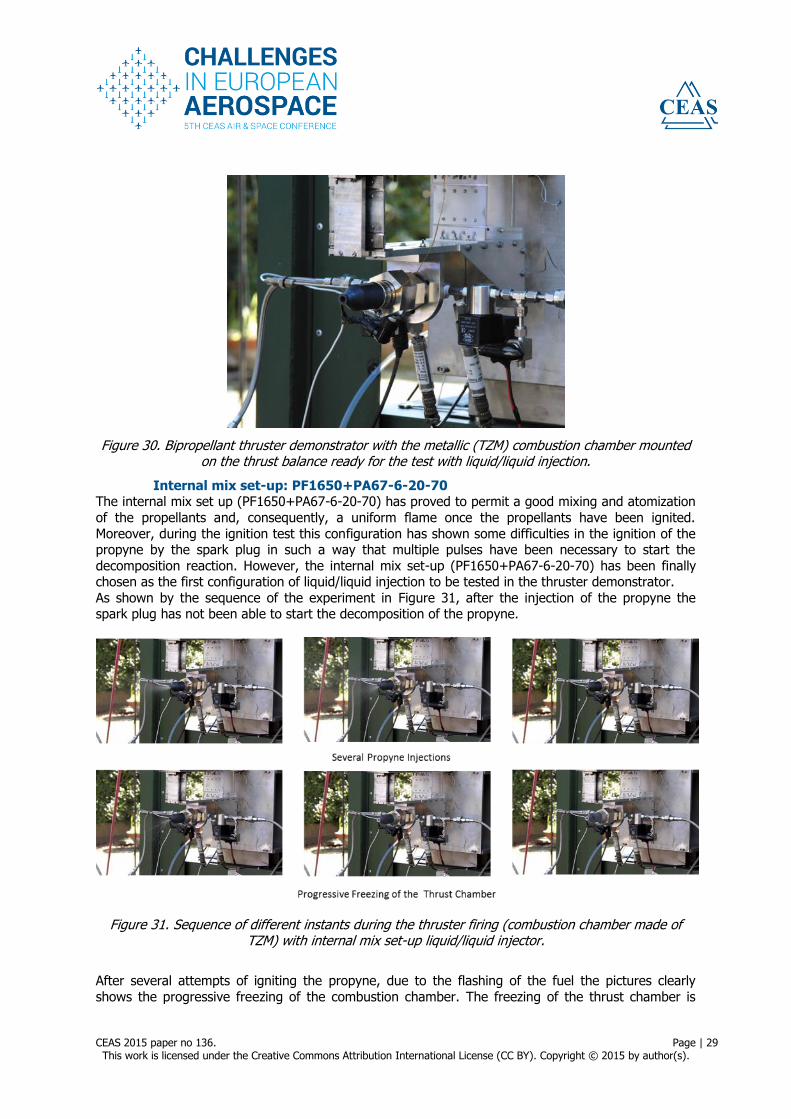
Figure 30. Bipropellant thruster demonstrator with the metallic (TZM) combustion chamber mounted on the thrust balance ready for the test with liquid/liquid injection.
Internal mix set-up: PF1650+PA67-6-20-70 The internal mix set up (PF1650+PA67-6-20-70) has proved to permit a good mixing and atomization
of the propellants and, consequently, a uniform flame once the propellants have been ignited.
Moreover, during the ignition test this configuration has shown some difficulties in the ignition of the propyne by the spark plug in such a way that multiple pulses have been necessary to start the
decomposition reaction. However, the internal mix set-up (PF1650+PA67-6-20-70) has been finally chosen as the first configuration of liquid/liquid injection to be tested in the thruster demonstrator.
As shown by the sequence of the experiment in Figure 31, after the injection of the propyne the spark plug has not been able to start the decomposition of the propyne.
Figure 31. Sequence of different instants during the thruster firing (combustion chamber made of TZM) with internal mix set-up liquid/liquid injector.
After several attempts of igniting the propyne, due to the flashing of the fuel the pictures clearly
shows the progressive freezing of the combustion chamber. The freezing of the thrust chamber is

CEAS 2015 paper no 136. Page | 30 This work is licensed under the Creative Commons Attribution International License (CC BY). Copyright © 2015 by author(s).
confirmed by the drastic reduction of the external surface temperature of the combustion chamber
reported in Figure 32. Since the ignition of the propyne has not been occurred, the oxidizer firing valve has never been
opened. Therefore, with respect to the test with only the injection manifold in which the spark plug
has been able to begin the decomposition of propyne, the presence of the thrust chamber has resulted in unsuccessful experiments characterized by the absence of any ignition.
Figure 32. Liquid/liquid injection with internal mix set-up: temperature of the external surface of the thrust chamber.
External mix set-up: PF1650+PA64
With respect to the internal mix set-up, during the preliminary experiments the external mix set up
(PF1650+PA64) has shown a jet pattern characterized by worst mixing and atomization efficiencies. Moreover, once ignited, the flame of the external mix set-up has been less uniform (see Figure 23
and Figure 26 for comparison) with more unreacted liquid hydrogen peroxide. However, this configuration has proved to be more prone and repeatable with respect to the ignition of the propyne
with the spark plug. This happens mainly because the fuel jet is axially directed and it creates a recirculation zone of saturated propyne that is more likely to be ignited by the energy released by the
spark plug. Figure 33 shows different instants during the firing with the external mix set- up
liquid/liquid injector. Even in this case, the ignition of propyne has not been occurred. On the contrary, the thrust chamber has been frozen again by the flashing of the fuel. Due to the absence of
the ignition of the fuel, the oxidizer has never been injected into the thrust chamber. The freezing of the thrust chamber is confirmed by the drastic reduction of the external surface temperature of the
combustion chamber reported in Figure 34.
In this configuration the flashing of the fuel and the consequent decrease of the thrust chamber temperature has been less intense because the fuel jet does not directly impinge the chamber walls
as in the case of the internal mix set-up. Even in this case, with respect to the test with only the injection manifold in which the spark plug has been able to begin the decomposition of propyne with
80 100 120 140 160 180 200-30
-25
-20
-15
-10
-5
0
5
10
15
Relative Time [s]
Tem
pera
ture
[°C
]
SURFACE TEMPERATURE (Liquid/Liquid INT MIX)
TSURFACE TEMPERATURE
Valve Status (O)
Valve Status (F)

CEAS 2015 paper no 136. Page | 31 This work is licensed under the Creative Commons Attribution International License (CC BY). Copyright © 2015 by author(s).
repeatability, the presence of the thrust chamber has resulted in unsuccessful experiments
characterized by the absence of any ignition. Therefore, it has been not possible to measure the propulsive performance of the thruster demonstrator in this configuration. The main issue remains
the spark plug and its capability of igniting the propyne.
Figure 33. Sequence of different instants during the thruster firing (combustion chamber made of TZM) with external mix set-up liquid/liquid injector.
Figure 34. Liquid/liquid injection with external mix set-up: temperature of the external surface of the thrust chamber.
0 20 40 60 80 100 120 140 160 180 200-30
-25
-20
-15
-10
-5
0
5
10
15
Relative Time [s]
Tem
pera
ture
[°C
]
SURFACE TEMPERATURE (Liquid/Liquid EXT MIX)
TSURFACE TEMPERATURE
Valve Status (O)
Valve Status (F)

CEAS 2015 paper no 136. Page | 32 This work is licensed under the Creative Commons Attribution International License (CC BY). Copyright © 2015 by author(s).
6 CONCLUSIONS
During the experimental campaign on the coaxial injectors, two injector configurations with satisfying jet patterns have been selected for the next tests with the bipropellant thruster demonstrator:
external mix set-up PF1650+PA64 (inner fuel/outer oxidizer);
internal mix set-up PF1650+PA67-6-20-70 (inner fuel/outer oxidizer).
The main results concerning the ignitability tests can be summarized as follows:
the selected propellants (98% hydrogen peroxide and propyne) are not hypergolic; in case of liquid/liquid injection into the atmosphere, the selected propellants can be
effectively ignited only if the spark plug is able to start the decomposition of the propyne.
After the ignition of the propyne the resulting flame is capable of sustaining the combustion
of propyne and hydrogen peroxide. The lack of hypergolicity and the necessity of starting the decomposition of one of the propellants
before the beginning of the combustion prove that propyne and hydrogen peroxide are not suitable for the implementation of the PulCheR concept with the tested ignition devices.
Despite the very promising ignition tests with the spark plug and the liquid/liquid injection, in the final
configuration of the thruster demonstrator with the metallic combustion chamber, the spark plug has not been able to start the decomposition of the propyne and, consequently, the combustion of the
propellants. The reason of this failure is still not clear and further investigations are required to identify a possible solution of the problem.
7 ACKNOWLEDGMENTS
The present work has been co-founded by the European Union Seventh Framework Programme
(FP7/2007-2013) under grant agreement n°313271. SITAEL S.p.A. (formely Alta S.p.A.) is proud to coordinate the project Consortium composed by leading companies in space technologies. Special
tanks go to all the people of GMYS-Space.
8 REFERENCES
[1] Pasini, A., Torre, L., Pace, G., Valentini, D., d'Agostino, L., 2013, “Pulsed Chemical Rocket with Green High Performance Propellants”, 49th AIAA/ASME/SAE/ASEE Joint Propulsion Conference & Exhibit, San Jose, California, 15-17 July, 2013. doi: 10.2514/6.2013-3756
[2] Torre, L., Pasini, A., Pace, G., Valentini, D., d’Agostino, L., Siciliano, P. F., Lecardonnel, L.,
“PulCheR – Pulsed Chemical Rocket with Green High Performance Propellants: Project Overview”,
Development Trends in Space Propulsion Systems, Warsaw, 18-19 Oct. 2013.
[3] Torre, L., Pasini, A., Pace, G., Valentini, D., d'Agostino, L., “PulCheR – Pulsed Chemical Rocket
with Green High Performance Propellants: First Year Project Overview”, ESA Space Propulsion 2014 Conference, Cologne, France, 19-22 May 2014.
[4] Aneshansley, D. J., Eisner, T., “Biochemistry at 100°C: Explosive Secretory Discharge of Bombardier Beetles (Brachinus)”, Science, 165:61-63 1, 1969.
[5] Eisner, T., Aneshansley, D. J., “Spray Aiming in the Bombardier Beetle: Photographic Evidence”,
Proc. Natl. Acad. Sci. USA, Vol. 96, pp. 9705–9709, 1999.
[6] Beheshti, N., McIntosh, A. C., “A biomimetic study of the explosive discharge of the bombardier
beetle”, Int. J. Des. Nature 1 61–9, 2007.
[7] Talley, D. G., Coy, E. B., “Constant Volume Limit of Pulsed Propulsion for a Constant γ Ideal Gas”,
AIAA 2000-3216, 36th AIAA/ASME/SAE/ASEE Joint Propulsion Conference Huntsville, Alabama, 17-19
July 2000.
[8] Talley, D. G., Coy, E. B., “Constant Volume Limit of Pulsed Propulsion for a Constant γ Ideal Gas”,
Journal of Propulsion and Power, Vol. 18, No. 2, pp. 400-406, 2002.

CEAS 2015 paper no 136. Page | 33 This work is licensed under the Creative Commons Attribution International License (CC BY). Copyright © 2015 by author(s).
[9] Briggs, G. P., Milthorpe, J. F., “Strategic Propellant Choices for an Australian Medium Launch
Vehicle”, 7th Australian Space Science Conference, Sydney, Australia, 2007.
[10] Valentian, D., Sippel, M.; Gronland, T., Baker, A., van den Meulen, G., Fratacci, G.; Caramelli, F.,
“Green propellants options for launchers, manned capsules and interplanetary missions”, 2nd International Conference on Green Propellants for Space Propulsion, Chia Laguna, Italy, 2004.
[11] European Chemicals Agency (ECHA), “Agreement of the Member State Committee on the
Identification of Hydrazine as a Substance of Very High Concern”, Adopted on 26 May 2011.
[12] Valencia-Bell, F., Smith, M., “Replacement of Conventional Spacecraft Propellants with Green
Propellants”, Space Propulsion Conference, Bordeaux, France, May 7-10, 2012.
[13] ESA Bulletin 154, May 2013, URL:
(http://www.esa.int/About_Us/ESA_Publications/ESA_Bulletin_154_May_2013).
[14] Marshall, W. M., Deans, M. C., “Recommended Figures of Merit for Green Monopropellants”, 49th AIAA/ASME/SAE/ASEE Joint Propulsion Conference & Exhibit, San Jose, California, 15-17 July, 2013.
[15] Bombelli, V., Simon, D., Marée, T. and Moerel, J.-L., “Economic Benefits of the use of Non-Toxic Monopropellants for Spacecraft Applications”, 39th AIAA/ASME/SAE/ASEE Joint Propulsion Conference, 20-23 July, Huntsville, AL, USA, 2003, AIAA paper n. 2003-4783. doi: 10.2514/6.2003-
4783.
[16] Pasini, A., Torre, L., Romeo, L., Cervone, A., d’Agostino, L., “Performance Characterization of
Pellet Catalytic Beds for Hydrogen Peroxide Monopropellant Rockets”, AIAA Journal of Propulsion and Power, Vol. 27, No. 2, pp. 428-436, Mar-Apr 2011.
[17] Pasini, A., Torre, L., Romeo, L., Cervone, A., Masi, L., d’Agostino, L., “High Mass Flux Tests on Catalytic Beds for H2O2 Monopropellant Thruster”, ESA Space Propulsion 2010 Conference, San
Sebastian, Spain, May 2010.
[18] Pt/CexZr1-x/Al2O3 Catalytic Bed”, 47th AIAA/ASME/SAE/ASEE Joint Propulsion Conference, San
Diego, California, USA, August 2011.
[19] Pasini, A., Torre, L., Romeo, L., Cervone, A., d’Agostino, L., “Testing and Characterization of a
Hydrogen Peroxide Monopropellant Thruster”, AIAA Journal of Propulsion and Power, Vol. 24, No. 3,
pp. 507-515, May-Jun 2008.
[20] Pasini, A., Torre, L., Pace, G., Valentini, D., “Stationary Propulsive Performance of a Green
Monopropellant Thruster Demonstrator for the PulCheR Project”, ESA Space Propulsion 2014 Conference, Cologne, France, 19-22 May 2014
[21] Dolci, S., Belli Dell’Amico, D., Pasini, A., Torre, L., Pace, G., and Valentini, D., "Platinum Catalysts
Development for 98% Hydrogen Peroxide Decomposition in Pulsed Monopropellant Thrusters", Journal of Propulsion and Power, Vol. 31, No. 4 (2015), pp. 1204-1216. doi: 10.2514/1.B35590
[22] Goudon, JP, Yvart, P., Richard, B., Torre, L., Pasini, A., Martin, F., “Solid Modulated Propulsion for Space Exploration”, ESA Space Propulsion 2012 Conference, Bordeaux, France, 7-10 May 2012.
[23] Pasini, A., Pace, G., Torre, L., “A Light Unsaturated Hydrocarbon and Hydrogen Peroxide as Future Green Propellants for Bipropellant Thrusters”, 51st AIAA/SAE/ASEE Joint Propulsion Conference, Orlando, Florida, USA, 27-29 July 2015. (submitted for publication)
[24] Happel, J., Marsel, C.J., 1953, “Acetylenic Compounds for Rocket Fuels”, New York University Bronx School of Engineering and Science, Report Number: 0832820, December.