prosiebensat.1 group: revenues grow and earnings improve ...report for q3 2004 page 5 09/30/2004...
TRANSCRIPT

Report for Q3 2004
ProSiebenSat.1 Group: Revenues Grow and Earnings Improve In the First Three Quarters 2004

Report for Q3 2004
Page 2
Contents
03 Key Figures
06 The ProSiebenSat.1 Group in the first
three quarters 2004
06 Economic conditions and the television market
08 Revenues and earnings
10 Sat.1
11 ProSieben
12 Kabel 1
12 N24
12 Diversification
13 Financial position, net assets, and results of
operations
15 Employees
15 ProSiebenSat.1 stock
17 Events subsequent to the reporting date
18 Outlook
19 Explanatory note and reconciliation
23 Consolidated Income Statement for ProSiebenSat.1
Media AG for Q1-Q3 2004 (IFRS)
24 Consolidated income statement for ProSiebenSat.1
Media AG Q3 2004 (IFRS)
25 Consolidated balance sheet of ProSiebenSat.1
Media AG as of Sept. 30, 2004
26 Statement of changes in shareholders‘ equity
27 Cash flow statement as of Sept. 30, 2004 (IFRS)

Report for Q3 2004
Page 3
09/30/2004 09/30/2003 Change
Total assets (EUR m) 2,010.9 1,968.9 2%
Shareholders´equity (EUR m) 960.2 572.6 68%
Liabilities (EUR m) 962.7 1,338.4 -28%
Equity ratio 48% 29% 66%
Pre-tax return on equity 13% -1% - / -
Programming assets (EUR m) 1,185.4 1,231.7 -4%
Programming assets of total assets 59% 63% -6%
Net financial debt incl. bond (Euro m) 444.1 837.6 -47%
Q1-Q3 2004 Q1-Q3 2003 Change
Cash flow (EUR m) 817.7 762.5 7%
Cash flow from operating activities (EUR m) 693.4 804.6 -14%
Cash flow from investing activities (EUR m) -737.3 -894.8 18%
Cash flow from financing activities (EUR m) 114.2 69.2 65%
Q1-Q3 2004 Q1-Q3 2003 Change
Key figures for the ProSiebenSat.1 Group
Revenues (EUR m) 1,294.3 1,240.8 4%
Gross profit (EUR m) 396.2 302.3 31%
Operating profit (EUR m) 181.3 52.4 246%
Financial loss (EUR m) -59.7 -55.6 -7%
Pre-tax profit/loss (EUR m) 121.6 -3.2 - / -
Consolidated profit/loss (EUR m) 75.3 -1.9 - / -
EBITDA (EUR m) 209.1 83.6 150%
EBIT (EUR m) 180.5 51.6 250%
Pre-tax profit margin 9% -0.3% - / -
Programming investments (EUR m) 724.2 901.4 -20%
Depreciation and amortization of intangible assets
and property, plant and equipment (EUR m) 27.8 31.2 -11%
Personnel expenses (EUR m) 152.2 155.6 -2%
Employees* 2,695 2,878 -6%
Key figures by stations Q1-Q3 2004 Q1-Q3 2003 Change
Sat.1
Total revenues (EUR m) 548.9 523.1 5%
Pre-tax profit/loss (EUR m) 60.3 -7.9 863%
EBITDA (EUR m) 65.8 2.9 2169%
Employees* 230 225 2%
ProSieben
Total revenues (EUR m) 527.1 480.2 10%
Pre-tax profit (EUR m) 115.5 82.0 41%
EBITDA (EUR m) 116.3 80.2 45%
Employees* 245 273 -10%
Kabel 1
Total revenues (EUR m) 134.0 132.8 1%
Pre-tax profit (EUR m) 13.9 4.4 216%
EBITDA (EUR m) 13.3 3.9 241%
Employees* 45 48 -6%
N24
Total revenues (EUR m) 52.0 50.8 2%
Pre-tax loss (EUR m) -1.4 -15.2 91%
EBITDA (EUR m) -0.5 -13.7 96%
Employees* 157 176 -11%
Key figures for SevenOne Intermedia Q1-Q3 2004 Q1-Q3 2003 Change
Total revenues (EUR m) 43.4 40.9 6%
Pre-tax profit (EUR m) 7.4 1.7 335%
EBITDA (EUR m) 9.5 4.3 121%
Employees* 110 103 7%
Key figures for Merchandising Q1-Q3 2004 Q1-Q3 2003 Change
Total revenues (EUR m) 36.4 40.8 -11%
Operating profit (EUR m) 5.0 3.6 39%
EBITDA (EUR m) 5.1 3.8 34%
Employees* 94 104 -10%
* Full-time equivalent jobs as of September 30
Key Figures for the ProSiebenSat.1 Group for Q1-Q3 2004 (IFRS)
Key cash flow figures for the ProSiebenSat.1 Group
Key balance sheet figures for the ProSiebenSat.1 Group

Report for Q3 2004
Page 4
09/30/2004 09/30/2003 Change
Total assets (EUR m) 2,010.9 1,968.9 2%
Shareholders´equity (EUR m) 960.2 572.6 68%
Liabilities (EUR m) 962.7 1,338.4 -28%
Equity ratio 48% 29% 66%
Pre-tax return on equity 0.4% -2% 120%
Programming assets (EUR m) 1,185.4 1,231.7 -4%
Programming assets of total assets 59% 63% -6%
Net financial debt incl. bond (EUR m) 444.1 837.6 -47%
Q3 2004 Q3 2003 Change
Cash flow (EUR m) 216.6 212.2 2%
Cash flow from operating activities (EUR m) 203.4 217.6 -7%
Cash flow from investing activities (EUR m) -221.6 -252.0 12%
Cash flow from financing activities (EUR m) -7.1 45.0 -116%
Q3 2004 Q3 2003 Change
Key figures for the ProSiebenSat.1 Group
Revenues (EUR m) 362.1 362.7 - / -
Gross profit (EUR m) 84.3 97.3 -13%
Operating profit (EUR m) 11.7 9.2 27%
Financial loss (EUR m) -7.3 -17.9 59%
Pre-tax profit/loss (EUR m) 4.3 -8.7 149%
Consolidated profit/loss (EUR m) 2.6 -6.0 143%
EBITDA (EUR m) 21.7 18.9 15%
EBIT (EUR m) 10.8 8.9 21%
Pre-tax profit margin 1.2% -2.4% 150%
Programming investments (EUR m) 193.4 253.4 -24%
Depreciation and amortization of intangible assets
and property, plant and equipment (EUR m) 10.0 9.8 2%
Personnel expenses (EUR m) 50.3 49.3 2%
Employees* 2,695 2,878 -6%
Key figures by stations Q3 2004 Q3 2003 Change
Sat.1
Total revenues (EUR m) 152.0 149.9 1%
Pre-tax loss (EUR m) -2.1 -2.9 28%
EBITDA (EUR m) 0.6 0.6 - / -
Employees* 230 225 2%
ProSieben
Total revenues (EUR m) 147.4 138.9 6%
Pre-tax profit (EUR m) 17.6 19.4 -9%
EBITDA (EUR m) 18.3 19.2 -5%
Employees* 245 273 -10%
Kabel 1
Total revenues (EUR m) 39.0 38.5 1%
Pre-tax profit/loss (EUR m) 1.5 -1.9 179%
EBITDA (EUR m) 1.3 -2.1 162%
Employees* 45 48 -6%
N24
Total revenues (EUR m) 17.2 17.8 -3%
Pre-tax loss (EUR m) -1.6 -2.0 20%
EBITDA (EUR m) -1.4 -1.6 13%
Employees* 157 176 -11%
Key figures for SevenOne Intermedia Q3 2004 Q3 2003 Change
Total revenues (EUR m) 15.9 13.8 15%
Pre-tax profit/loss (EUR m) 2.6 -1.7 253%
EBITDA (EUR m) 3.7 -0.6 717%
Employees* 110 103 7%
Key figures for Merchandising Q3 2004 Q3 2003 Change
Total revenues (EUR m) 11.4 13.5 -16%
Operating profit (EUR m) 1.0 1.9 -47%
EBITDA (EUR m) 1.1 2.0 -45%
Employees* 94 104 -10%
* Full-time equivalent jobs as of September 30
Key Figures for the ProSiebenSat.1 Group for Q3 2004 (IFRS)
Key cash flow figures for the ProSiebenSat.1 Group
Key balance sheet figures for the ProSiebenSat.1 Group
Report for Q3 2004
Page 5
09/30/2004 06/30/2004 03/31/2004
Total assets (EUR m) 2,010.9 1,997.4 1,910.3
Shareholders´equity (EUR m) 960.2 959.7 632.9
Liabilities (EUR m) 962.7 949.3 1,211.2
Equity ratio 48% 48% 33%
Pre-tax return on equity 0.4% 8% 7%
Programming assets (EUR m) 1,185.4 1,176.8 1,209.1
Programming assets of total assets 59% 59% 63%
Net financial debt incl. bond (Euro m) 444.1 423.3 793.6
Q3 2004 Q2 2004 Q1 2004
Cash flow (EUR m) 216.6 320.6 280.5
Cash flow from operating activities (EUR m) 203.4 311.9 178.1
Cash flow from investing activities (EUR m) -221.6 -211.9 -303.8
Cash flow from financing activities (EUR m) -7.1 50.7 70.6
Q3 2004 Q2 2004 Q1 2004
Revenues (EUR m) 362.1 496.0 436.2
Gross profit (EUR m) 84.3 178.4 133.5
Operating profit (EUR m) 11.7 109.3 60.3
Financial loss (EUR m) -7.3 -35.5 -16.9
Pre-tax profit (EUR m) 4.3 73.8 43.5
Consolidated profit (EUR m) 2.6 47.6 25.1
EBITDA (EUR m) 21.7 118.3 69.1
EBIT (EUR m) 10.8 109.3 60.4
Pre-tax profit margin 1.2% 14.9% 10.0%
Programming investments (EUR m) 193.4 227.6 303.2
Depreciation and amortization of intangible assets
and property, plant and equipment (EUR m) 10.0 9.1 8.7
Personnel expenses (EUR m) 50.3 52.0 49.9
Employees* 2,695 2,698 2,773
Key figures by stations Q3 2004 Q2 2004 Q1 2004
Sat.1
Total revenues (EUR m) 152.0 204.2 192.7
Pre-tax profit/loss (EUR m) -2.1 38.7 23.7
EBITDA (EUR m) 0.6 40.5 24.7
Employees* 230 223 222
ProSieben
Total revenues (EUR m) 147.4 205.2 174.5
Pre-tax profit (EUR m) 17.6 63.1 34.8
EBITDA (EUR m) 18.3 63.2 34.8
Employees* 245 254 261
Kabel 1
Total revenues (EUR m) 39.0 48.5 46.5
Pre-tax profit (EUR m) 1.5 9.6 2.8
EBITDA (EUR m) 1.3 9.4 2.6
Employees* 45 46 49
N24
Total revenues (EUR m) 17.2 17.4 17.4
Pre-tax profit/loss (EUR m) -1.6 0.1 0.1
EBITDA (EUR m) -1.4 0.4 0.5
Employees* 157 156 151
Key figures for SevenOne Intermedia Q3 2004 Q2 2004 Q1 2004
Total revenues (EUR m) 15.9 14.1 13.4
Pre-tax profit (EUR m) 2.6 2.5 2.3
EBITDA (EUR m) 3.7 3.0 2.8
Employees* 110 106 109
Key figures for Merchandising Q3 2004 Q2 2004 Q1 2004
Total revenues (EUR m) 11.4 12.6 12.4
Operating profit (EUR m) 1.0 1.8 2.2
EBITDA (EUR m) 1.1 1.9 2.1
Employees* 94 95 93
* Full-time equivalent jobs as of September 30, June 30, March 31
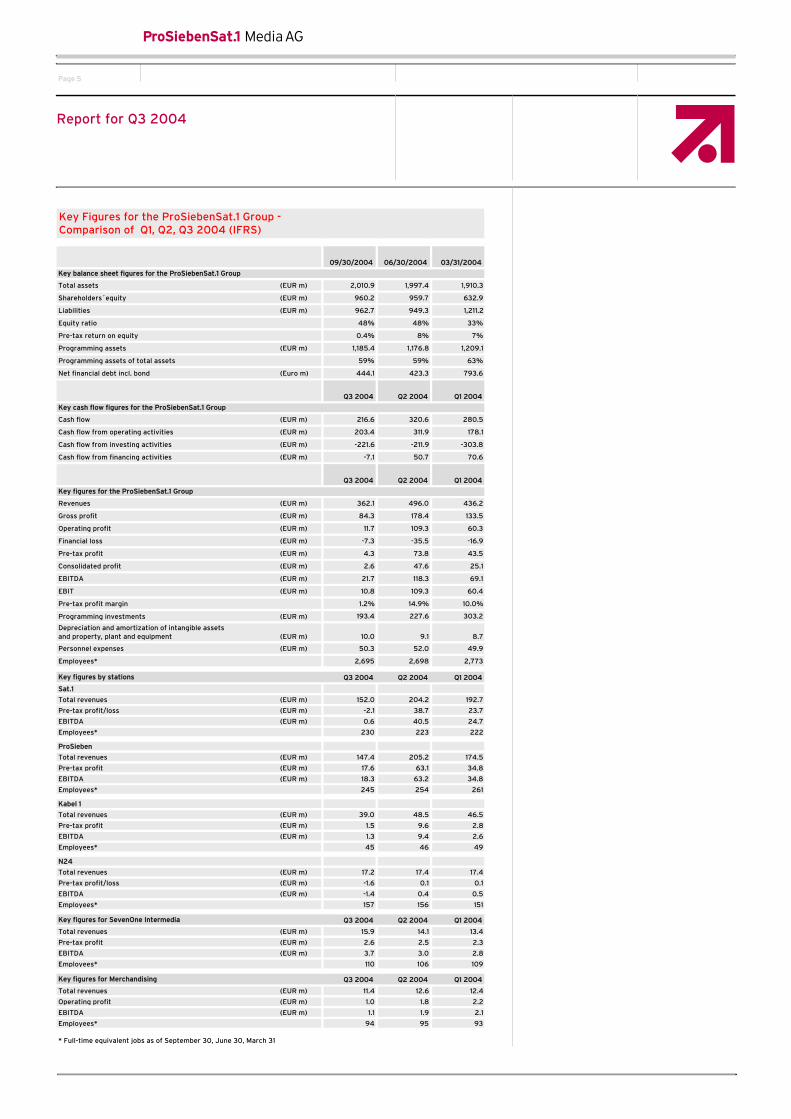
Key Figures for the ProSiebenSat.1 Group -Comparison of Q1, Q2, Q3 2004 (IFRS)
Key cash flow figures for the ProSiebenSat.1 Group
Key figures for the ProSiebenSat.1 Group
Key balance sheet figures for the ProSiebenSat.1 Group

Report for Q3 2004
Page 6
Economic conditions and the television market Economic revival still uncertain
The German economy stabilized appreciably in the first half. But
the economic revival was small compared to previous upswings,
and lost momentum in the third quarter. As for the world
economy, which had hitherto furnished most of the momentum
for Germany, the vigorous upswing has lost some power since
the spring. As before, extremely weak domestic demand remains
the major problem in the German market. Consumer spending
has been stagnant for some three years now, and no recovery is
in sight. Experts assume that growth will slow down further in the
second half, because domestic demand is not strong enough to
make up for flagging demand from abroad.
1Q-3Q 2004: ProSiebenSat.1 Group increases
profits significantly
Report for Q3 2004
The ProSiebenSat.1 Group performed well in every regard from
January through September of 2004. The Group was able to
optimize its structures, improve its performance, boost revenues
and significantly increase profits. All three full-service stations
are showing a pre-tax profit. N24’s earnings have improved sig-
nificantly, and the station is not far from breaking even.
The key figures for the first three quarters, compared against
the same period last year, were:
• Group revenues were up 4 percent to EUR 1.294 billion,
compared to the previous year’s EUR 1.241 billion.
• The consolidated net profit soared from EUR –1.9 million to
EUR 75.3 million.
• EBITDA grew from EUR 83.6 million to EUR 209.1 million, a
gain of 150 percent.
• For the first time in its history, Sat.1 showed a pre-tax
profit on the first three quarters, at EUR 60.3 million
(prior year: a loss of EUR 7.9 million).
• ProSieben boosted its revenues 10 percent, to EUR 527.1
million. Its 22 percent profit margin still makes it one of the
most profitable stations in the entire German television
market.
• Pre-tax profits at Kabel 1 more than tripled, to EUR 13.9
million (a 216 percent gain from the prior year’s
EUR 4.4 million).
• N24 boosted its pre-tax earnings from EUR –15.2 million to
EUR –1.4 million, an improvement of 91 percent.
• Debt was cut nearly one-third (–28 percent), from
EUR 1.338 billion to EUR 962.7 million.
• Net financial debt was down by nearly half, to
EUR 444.1 million (2003: EUR 837.6 million).
Konzernumsatz [Mio Euro]
0 200 400 600 800 1000 1200 1400
2003
2004
1. Quartal 2. Quartal 3. Quartal
2003
2004
ProSiebenSat.1 Group: Revenue development
(EUR m)
Q1
Q2
Q3
0 400 800 1200 1400
436.2 496.0 362.1
411.2 466.9 362.7
Q1-Q3:1,294.3
Q1-Q3:1,240.8
Konzernergebnis vor Steuern [Mio Euro]
-50 0 50 100
1. Quartal 2. Quartal 3. Quartal
2003
2004
ProSiebenSat.1 Group: Consolidated pre-tax profit
(EUR m)
Q1
Q2
Q3
-50 0 50 100
43.5 73.8 4.3
-8.7 -29.2 34.7
Q1-Q3: 121.6
Q1-Q3: -3.2

Report for Q3 2004
Page 7
ProSiebenSat.1 Group strengthens position
in the advertising market
In their latest expert assessment from the fall of this year,
Germany’s leading economic research institutions projected that
gross domestic product will grow 1.8 percent in 2004, and 1.5
percent in 2005. These six leading institutes present an expert
opinion on Germany’s economic situation every spring and every
fall. Along with the annual assessments by the German Council of
Economic Experts, these reports are among the most important
assessments of the German economy.
Gross advertising market performing better
According to the Nielsen Media Research market research institute,
the overall advertising market improved over the year. Total
advertising revenues in conventional media between January and
September 2004 were up EUR 701.1 million, to EUR 12.7 billion.
That is equivalent to a 5.8 percent growth rate (Q1-Q3 2003: EUR
12.0 billion). The advertising statistics reflect the dynamics of the
economy as a whole. The growth rate for the third quarter, at
4.5 percent, was well below the 6.4 percent that Nielsen Media
Research reported for the first half.
Among conventional media, television remains the medium with
the highest revenues. German TV stations brought in EUR 5.3
billion in income from advertising. That is a 3.7 percent gain over
the same period last year (Q1-Q3 2003: EUR 5.1 billion), and repre-
sents a 41.6 percent share of the total advertising market. But it
must be borne in mind that the gross figures from Nielsen Media
Research are not a precise indicator of actual advertising revenues,
because these figures include not only bulk discounts but also
self-promotion and agency commissions.
ProSiebenSat.1 Group boosts advertising market share
The ProSiebenSat.1 Group further expanded its share of the
German TV advertising market. In all, the Group’s gross revenues
climbed 4.8 percent, to EUR 2.3 billion, giving the family of stations
a 42.8 percent share of the gross TV advertising market for the
first nine months. The gain against the same period last year is
0.5 percentage points. Within the Group, Sat.1 achieved the highest
growth, adding 0.5 percentage points to last year’s figure to earn
an advertising market share of 19.0 percent. ProSieben added
0.1 percentage point to its share, to reach 18.3 percent. Kabel 1
had a share of 5.0 percent. N24 added 0.1 percentage point, to
reach 0.5 percent as of the end of September. All together, the
stations marketed by IP – RTL, Vox, Super RTL and n-tv – lost
2.3 percentage points, to end the third quarter with a combined
share of 37.3 percent. RTL had the marketing group’s biggest
loss, falling 2.5 percentage points behind the same period last
year. RTL 2, as an independently marketed station, earned a 6.2
percent share.
The traditionally weak third quarter was less dynamic in the TV
market as well. Although gross revenues were up 4.1 percent in
the first half, growth from July through September was only 2.6
percent. With growth of 5.1 percent at the end of the half and
3.9 percent in the third quarter, the ProSiebenSat.1 Group’s
performance was clearly above average, even despite the
Olympics in August.
ProSiebenSat.1 Group significantly increases viewer ratings
The growth of advertising revenues is a reflection of the Group’s
improved performance this year. In the first nine months, Sat.1,
ProSieben, Kabel 1 and N24 significantly increased their combined
audience share by a total of 0.4 percentage points. In the com-
mercially decisive viewer group between ages 14 and 49, the
Group earned a share of 29.1 percent. Thus, the Group expanded
its lead over the stations marketed by IP – RTL, Vox, Super RTL
and n-tv. By contrast, RTL stations lost 1.2 percentage points
against last year, achieving a combined 25.1 percent audience
share.
Sat.1 ended the first nine months of the year with an 11.4 percent
audience share, an improvement of 0.1 percentage point against
2003. The station garnered above-average shares on such pro-
gramming as the UEFA Champions League. At its peak, the first
knockout round between Real Madrid and Bayern München drew
more than 15 million viewers. Among 14 to 49-year-olds, this
represented an average share of 37.5 percent. Other ratings
successes included such series as “Edel & Starck” and “Der
Bulle von Tölz,” Sat.1 TV movie productions “Das Zimmer-

Report for Q3 2004
Page 8
Viewer market and economic situation
mädchen und der Millionär” (24.3%), blockbusters like “Pretty
Woman” (26.0%) and “Indiana Jones and the Last Crusade”
(28.0%), along with the popular show “Die Hit Giganten” (as
high as 23.7%).
ProSieben added 0.2 percentage points against the same period
last year to earn a 12.1 percent share of the age group from 14
to 49. The cornerstones for success were such feature film
hits as “Final Fantasy: The Spirits Within,” with a 23.2 percent
share, and above all the ProSieben co-production “Der Schuh
des Manitu.” With an average share of 51.9 percent of the 14-to-
49 audience, the hit film from ProSieben comedian Michael
“Bully” Herbig was the most successful broadcast ProSieben
has ever shown. No feature film on German private TV has ever
reached a bigger audience.
Kabel 1 also remained on a growth track. The station picked up
0.2 percentage points against the same period last year, to earn
a 5.1 percent audience share. Its best ratings came from such
film hits as the James Bond classic “Never Say Never” (12.2%) and
“Doc Hollywood” (10.9%). News channel N24 ended the first
nine months of 2004 with an 0.5 percent share, making it even
with its competitor n-tv.
Revenues and earnings Revenues and earnings up significantly for the first nine months
The ProSiebenSat.1 Group was able to boost revenues and earnings
significantly in the first nine months. One crucial factor in this
performance was the strong showing in television operations
during the first half of the year. But efficiency improvements
throughout the ProSiebenSat.1 Group were also an important
factor. Total revenues were up 4 percent to EUR 1.294 billion,
compared to EUR 1.241 billion for Q1-Q3 2003. Gross profits
were also up substantially, climbing from EUR 302.3 million in
the prior-year period to EUR 396.2 million in the current year,
representing an increase over the prior year of 31 percent. Ope-
rating earnings climbed from the prior-year period’s EUR 52.4
million to EUR 181.3 million between January and September of
the current year. Consolidated income from ordinary business
activities rose from EUR –3.2 million to EUR +121.6 million. That
yields a consolidated net profit of EUR 75.3 million for the Pro-
SiebenSat.1 Group. The comparable period last year was still showing
a loss of EUR –1.9 million.
The Group’s positive performance is also reflected in the other
key figures. EBITDA improved from EUR 83.6 million to EUR
209.1 million, a 150 percent gain. At the same time, EBIT rose
from EUR 51.6 million to EUR 180.5 million, a 250 percent gain.
Earnings per preferred share, both undiluted and diluted, improved
from EUR 0.00 in the first three quarters of 2003 to EUR 0.37 in
the equivalent period of 2004.
40.0
16.8
12.1
11.4
9.0
8.2
7.8
7.7
5.1
5.4
0.5
0.5
28.7
18.4
11.9
11.3
8.8
7.6
7.9
7.1
4.9
4.9
0.7
0.6
ProSiebenSat.1 Group
RTL
ProSieben
Sat.1
ARD
ZDF
ARD III
RTL 2
Kabel 1
Vox
n-tv
N24
0 5 10 15 20 25 30
Q1 - Q3 2004
Q1 - Q3 2003
Market share viewers 14 - 49
(in %)
Source: AGF/GfK Fernsehforschung / pc#tv aktuell / SevenOne Media Marketing & Research
(own calculations)
Report for Q3 2004
Page 9
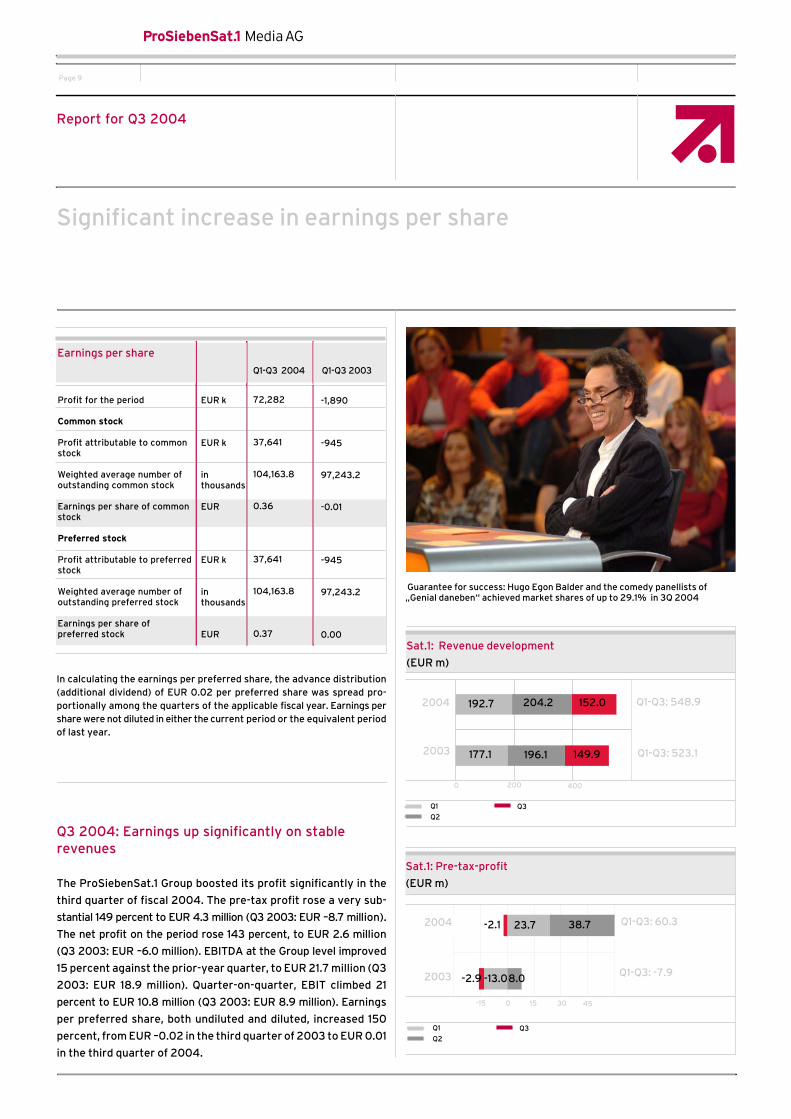
Significant increase in earnings per share
Q3 2004: Earnings up significantly on stable revenues
The ProSiebenSat.1 Group boosted its profit significantly in the
third quarter of fiscal 2004. The pre-tax profit rose a very sub-
stantial 149 percent to EUR 4.3 million (Q3 2003: EUR –8.7 million).
The net profit on the period rose 143 percent, to EUR 2.6 million
(Q3 2003: EUR –6.0 million). EBITDA at the Group level improved
15 percent against the prior-year quarter, to EUR 21.7 million (Q3
2003: EUR 18.9 million). Quarter-on-quarter, EBIT climbed 21
percent to EUR 10.8 million (Q3 2003: EUR 8.9 million). Earnings
per preferred share, both undiluted and diluted, increased 150
percent, from EUR –0.02 in the third quarter of 2003 to EUR 0.01
in the third quarter of 2004.
Guarantee for success: Hugo Egon Balder and the comedy panellists of „Genial daneben“ achieved market shares of up to 29.1% in 3Q 2004
In calculating the earnings per preferred share, the advance distribution (additional dividend) of EUR 0.02 per preferred share was spread pro-portionally among the quarters of the applicable fiscal year. Earnings per share were not diluted in either the current period or the equivalent period of last year.
-1,890
-945
97,243.2
-0.01
-945
97,243.2
0.00
Earnings per share
Q1-Q3 2004 Q1-Q3 2003
Profit for the period Common stock
Profit attributable to common stock
Weighted average number of outstanding common stock
Earnings per share of common stock
Preferred stock
Profit attributable to preferred stock
Weighted average number of outstanding preferred stock
Earnings per share of preferred stock
72,282
37,641
104,163.8
0.36
37,641
104,163.8
0.37
EUR k
EUR k
in thousands
EUR
EUR k
in thousands
EUR
Umsatz (Mio Euro)
0 200 400 600
2003
2004
1. Quartal 2. Quartal 3. Quartal
2003
2004
0 400
Sat.1: Revenue development
(EUR m)
Q1
Q2
Q3
200
192.7 204.2 152.0
177.1 196.1 149.9
Q1-Q3: 548.9
Q1-Q3: 523.1
Ergebnis vor Steuern (Mio Euro)
-30 -15 0 15 30 45 60
1. Quartal 2. Quartal 3. Quartal
2003
2004
15
Sat.1: Pre-tax-profit
(EUR m)
-15 450 30
Q1
Q2
Q3
-2.1 23.7 38.7 Q1-Q3: 60.3
-2.9 -13.0 8.0 Q1-Q3: -7.9

Report for Q3 2004
Page 10
All four channels increase revenues
Although the third quarter was dominated by the public broad-
casters’ coverage of sport, the Group’s revenues maintained the
same level as the prior year, at EUR 362.1 million (Q3 2003: EUR
362.7 million). The third quarter is traditionally the weakest period
in the seasonal television business. Last year, the third quarter
contributed only about 20 percent of the year’s total revenues.
The fourth quarter, by contrast, contributed around 31 percent.
Television: Every station a success
The rising audience shares also had a positive impact on the business
results for the entire Group. All four stations boosted their revenues
in the first nine months of the year. All three full-service stations
showed a profit. News station N24 increased its earnings signi-
ficantly against the year before, and will reach profitability in
„Carrie and Co.“ continue success story on ProSieben. The final episodes of the cult series „Sex and the City“ to be shown on ProSieben this Fall
2005, as planned.
Sat.1: First pre-tax profit on nine months
Sat.1’s business performance improved substantially. For the first
time in its history, the station showed a pre-tax profit on the first
three quarters. While pre-tax earnings for the prior-year period
were still EUR –7.9 million, the figure for the current year was a
substantial EUR +60.3 million. In other words, profits grew sig-
nificantly. The station’s total revenues climbed from EUR 523.1
million to EUR 548.9 million, a gain of 5 percent. This is equiva-
lent to a return on revenue of 11 percent (Q1-Q3 2003: –2%). Apart
from revenue growth, more efficient programming cost structures
were also a primary factor in improving profits. Programming
costs were lower mainly because the station discontinued its
Bundesliga Soccer coverage in the first quarter, but also by opti-
mization measures in Animation and Fiction operations.
Quarter-on-quarter, revenues climbed 1 percent to EUR 152.0
million (Q3 2003: EUR 149.9 million). The pre-tax loss on the third
quarter improved from EUR –2.9 million in 2003 to EUR –2.1 million
in 2004.
Umsatz (Mio Euro)
0 200 400 600
2003
2004
1. Quartal 2. Quartal 3. Quartal
Jan-Sept:527,1
Jan-Sept:480,2
2003
2004
Q1
Q2
Q3
0 200 400 600
ProSieben: Revenue development
(EUR m)
174.5 205.2 147.4
155.2 186.1 138.9
Q1-Q3: 527.1
Q1-Q3: 480.2
Ergebnis vor Steuern (Mio Euro)
2003
2004
Q1
Q2
Q3
0 100 200
34.8 63.1 17.6
15.1 47.5 19.4
Q1-Q3: 115.5
Q1-Q3: 82.0
ProSieben: Pre-tax profit
(EUR m)

Report for Q3 2004
Page 11
Kabel 1 remains the top address for film classics. Coming soon: „The Best Movies of All Times - The Show“
All full-service stations in the black
ProSieben: Biggest revenue gain of the four stations
The year thus far has been a very good one for ProSieben, which
achieved the highest revenue gains of all the four stations. In
the first nine months, the station gained 10 percent, to reach
EUR 527.1 million (Q1-Q3 2003: EUR 480.2 million). For the period
from January to September, pre-tax profits climbed from EUR
82.0 million in 2003 to EUR 115.5 million in 2004, a 41 percent
gain. With a return on revenues of some 22 percent, ProSieben
is easily one of Germany’s most profitable TV stations. In the
third quarter, revenues grew 6 percent, to EUR 147.4 million (Q3
2003: EUR 138.9 million). Pre-tax income was down, from EUR
19.4 million to EUR 17.6 million (a 9% drop). The decline was mainly
the result of higher consumption of programming assets, due to
new entertainment programs.
Umsatz (Mio Euro)
0 100 200
2003
2004
1. Quartal 2. Quartal 3. Quartal
Kabel 1: Revenue development
(EUR m)
2003
2004
Q1
Q2
Q3
0 100
46.5 48.5 39.0
46.4 47.9 38.5
Q1-Q3 : 134.0
Q1-Q3 : 132.8
150
Ergebnis vor Steuern (Mio Euro)
5 0 5 10 15
2003
2004
Kabel 1: Pre-tax profit
(EUR m)
0
Q1
Q2
Q3
-5 5 10 15
2.8 9.6 1.5
-1.9 2.3 4.0
Q1-Q3 : 13.9
Q1-Q3 : 4.4
Ergebnis vor Steuern (Mio Euro)
-20 -15 -10 -5 0
1 Quartal 2 Quartal 3 Quartal
-15,2
-1,42004
2003
-15 -5
2003
2004
-10 0
N24: Pre-tax profit
(EUR m)
Q1
Q2
Q3
-1.6 0.1 0.1
-2.0 -5.5 -7.7
Q1-Q3 : -1.4
Q1-Q3: -15.2
Umsatz (Mio Euro)
0
2003
2004
N24: Revenue development
(EUR m)
20
Q1
Q2
Q3
40 60
17.4 17.4 17.2
15.3 17.7 17.8
Q1-Q3 : 52.0
Q1-Q3 : 50.8

Report for Q3 2004
Page 12
Merchandising and multimedia activities consolidated in
Diversification unit
Claudia Eberl and Thomas Klug update viewers on current events on „N24 Morgenreport“
improved even more than revenues. Efficient cost manage-
ment is clearly evident in the station’s return on revenues, which
rose significantly from 3 percent in Q1-Q3 2003 to 10 percent in
Q1-Q3 2004. The station’s total revenues were EUR 134.0 mil-
lion, following EUR 132.8 million in the prior-year period (a 1%
increase). The pre-tax profit on the third quarter improved from
EUR –1.9 million to EUR 1.5 million (up 179%). Revenues for July
through September were EUR 39.0 million (Q3 2003: EUR 38.5
million). A major factor in the good results was lower program-
ming costs.
N24 turns in a positive performance
Station N24, which serves as the central news service provider
for Sat.1, ProSieben and Kabel 1, has performed very well this year.
In the first nine months, N24 generated a pre-tax loss of EUR
–1.4 million, and is thus approaching profitability. The improve-
Kabel 1: Revenues and earnings grow
Kabel 1 remains on a growth track. Pre-tax profits for the first
nine months were EUR 13.9 million, a gain of 216 percent against
the prior year’s figure (Q1-Q3 2003: EUR 4.4 million). Earnings
ment comes to 91 percent. The figure for the comparable period
of 2003 was still EUR –15.2 million. Pre-tax income for the third
quarter improved 20 percent from EUR –2.0 million to EUR –1.6
million. Revenues on the first three quarters increased from EUR
50.8 million in 2003 to EUR 52.0 million in 2004, a gain of about
2 percent. Lower internal revenues – N24 has transferred sports
coverage to Sat.1 – pulled third-quarter revenues down to EUR
17.2 million from the Q3 2003 figure of EUR 17.8 million (down
3%). Without that factor, the news station’s revenues would have
been slightly above the prior-year quarter (up 1%). N24 will
reach profitability in 2005.
New Diversification segment
The ProSiebenSat.1 Group has pooled its merchandising and multi-
media operations in a new Diversification segment. The restruc-
turing has two main goals. The first is to boost non-TV revenues
so as to make the Group less dependent on the advertising market.
The second is to improve collaboration between the two companies
SevenOne Intermedia and MM MerchandisingMedia, and improve
their efficiency.
Both Merchandising and SevenOne Intermedia have already been
showing rising profits this year. Merchandising’s operating
earnings rose from EUR 3.6 million to EUR 5.0 million, a gain of
39 percent. Quarter-on-quarter, operating earnings were down
from EUR 1.9 million in Q3 2003 to EUR 1.0 million in Q3 2004.
Revenues for the first nine months of 2004 amounted to EUR
36.4 million, after EUR 40.8 million in the prior-year period. Third-
quarter revenues declined from EUR 13.5 million to EUR 11.4 mil-
lion. The decrease in revenue was entirely due to a change in the
accounting method used for posting media purchases and allo-
cating intra-Group TV advertising revenues, so that such entries
will now have no net effect on income or expenses.
SevenOne Intermedia closed out the third quarter with a very
positive result. The company’s revenues and earnings were both
up significantly for the first nine months. Pre-tax profits grew from
EUR 1.7 million to EUR 7.4 million. That means that this figure
has more than quadrupled within a year. Revenues on the period
were up from EUR 40.9 million to EUR 43.4 million (a 6% gain).
The return on revenue was 17 percent. In the third quarter, the
company’s revenues came to EUR 15.9 million, following

Report for Q3 2004
Page 13
Cost base significantly reduced
Financial position, net worth, and results of operationsSignificant cuts in expenses
In the first nine months of 2004, the ProSiebenSat.1 Group was
able to reduce important expense items and thus enhance its
efficiency still further. The savings effect is clearest in the cost
of sales. During the first three quarters, this item was pared back
from EUR 938.5 million in 2003 to EUR 898.2 million in 2004
– a 4 percent reduction. The most important component of the
cost of sales is the consumption of programming assets, which
decreased 4 percent in the first nine months, to EUR 678.4
million (Q1-Q3 2003: EUR 706.2 million). Scheduled consump-
tion decreased from EUR 664.3 million to EUR 642.1 million
(down 3%). Unscheduled consumption came to EUR 36.3 million,
following EUR 41.8 million in the prior-year period (down 13%). In
addition, administrative and selling costs were also substantially
lower. Broad-based cost savings cut administrative costs alone
by 22 percent, to EUR 95.3 million (Q1-Q3 2003: EUR 122.4 mil-
lion). Selling costs were down 12 percent, to EUR 135.8 million
(Q1-Q3 2003: EUR 155.1 million). This decrease was due to adver-
tising expenses in particular.
Refinancing has positive impact
The net interest result was down substantially, from EUR 53.9
million in the first nine months of 2003 to EUR 45.0 million in the
current-year period (a 17% improvement). The key factor here
was a refinancing concept that was implemented in the second
quarter of 2004, with the goal of reducing net financial debt and
improving the maturity profile for outstanding financial debt. In
addition to a capital increase that resulted in gross proceeds of
EUR 282 million, the concept also included:
• a new syndicated loan in an amount of EUR 325 million,
• the tender of a bond due in 2006, in an amount of EUR 298
million (total par value EUR 338 million), and
• issuance of a new EUR 150 million bond that will be due in
2009.
EUR 13.8 million a year earlier (up 15%). Pre-tax profits for the
third quarter climbed from EUR –1.7 million to EUR +2.6 million.
The new Diversification segment expands the duties of the two
subsidiaries. MM MerchandisingMedia, formerly in charge of licen-
sing and merchandising, will now also handle the Group’s tele-
shopping activities. SevenOne Intermedia, formerly responsible
for online, teletext, mobile services, and audiotex, will now also
take charge of interactive and digital television, as well as customer
loyalty management.
A new addition to the Group portfolio of the Diversification seg-
ment is the subsidiary SevenOne International. This company was
founded in September 2004 with the task of marketing broad-
casting rights internationally for the ProSiebenSat.1 Group’s TV
productions. As the company that commissions the largest number
of new TV productions in Germany, the ProSiebenSat.1 Group is
thus making the most of the chance to market its own content
worldwide.

Report for Q3 2004
Page 14
Refinancing has positive effect on balance sheet
ProSiebenSat.1 Group earns good credit rating
In the third quarter, the rating agencies upgraded the credit
ratings of ProSiebenSat.1 Group. On September 28, Moody’s
Investor Service raised its rating from Ba2, outlook positive, to
Ba1, outlook stable. On August 13, Fitch Ratings raised its rating
from BB+, outlook stable, to BB+ outlook positive.
Due to the refinancing, the item of other finance expenses incre-
ased from EUR 5.6 million to EUR 21.1 million, and net financial
expenses overall increased from EUR 55.6 million to EUR 59.7
million. This is equivalent to a decline of 7 percent from the prior-
year period.
Cash and equivalents, and cash flow
At September 30, 2003, the ProSiebenSat.1 Group’s cash and
equivalents came to EUR 132.2 million, compared to EUR 46.4
million a year earlier. The rise of 185 percent was mainly the result
of higher cash balances held at banks. The increased bank balan-
ces were the result of the refinancing in the second quarter of
2004.
Despite higher revenues, the cash flow from ordinary opera-
ting activities in the first nine months of 2004 was less than
for the same period last year, falling from EUR 804.6 million to
EUR 693.4 million (down 14%). The chief reason for the decline was
a decrease in non-interest-bearing liabilities, especially trade
accounts payable.
The cash flow from investing activities was down from EUR
894.8 million for the comparable period to EUR 737.3 million
in 2004 (down 18%). The main reason for the decline was lower
capital expenditures on programming assets. Last year, the
ProSiebenSat.1 Group signed major film agreements to acquire a
secure supply of programming.
The cash flow from financing activities grew from EUR 69.2
million for January-September 2003 to EUR 114.2 million for
January-September 2004 (up 65%). The critical factor here
was the net inflow of funds from refinancing.
Balance sheet ratios improve further
Total assets were up 2 percent against September 30, 2003, to
EUR 2.011 billion (9/30/2003: EUR 1.969 billion). The improve-
ment in balance sheet ratios reflects both the refinancing opera-
tions associated with the capital increase and the restructuring
of bond debt.
Primarily because of the funds furnished by the capital increase
and the increase in profits, equity increased 68 percent to EUR
960.2 million (9/30/2003: EUR 572.6 million). Thus the equity
ratio came to 48 percent (9/30/2003: 29%). The return on
equity rose from –0.6 percent to +13 percent.
Capital reserves were up 79 percent against September 30, 2003,
to EUR 578.4 million (9/30/2003: EUR 322.3 million). This signi-
ficant rise results from the proceeds of the capital increase. The
costs of the capital increase were charged to the capital reserves.
New stock issues boosted subscribed capital 12 percent, to EUR
218.8 million (9/30/2003: EUR 194.5 million).
Net financial debt cut in half
Net financial debt was cut 47 percent to EUR 444.1 million (Q1-
Q3 2003: EUR 837.6 million), mainly due to optimized financing
structures. Total debt was down 28 percent, to EUR 962.7 million
(9/30/2003: EUR 1.338 billion). Provisions were up by just under
half, to EUR 87.2 million, primarily because of significant increases
in profits and the associated larger tax reserves (9/30/2003:
EUR 58.3 million).
The increase in total assets was primarily the consequence of a
4 percent increase in current assets to EUR 1.523 billion (9/3/
2003: EUR 1.461 billion). The critical factor was the substantial
rise in cash and equivalents from EUR 46.4 million to EUR 132.2
million, that resulted from the refinancing.
Representing 59 percent of total assets, programming assets
are the most important asset item. At EUR 1.185 billion on-balance-
sheet programming assets were 4 percent below the level from
last year (9/30/2003: EUR 1.232 billion). These assets consist of
feature films and series, along with commissioned productions
intended for one-time or multiple airings as well as advance

Report for Q3 2004
Page 15
Program content key asset
ProSiebenSat.1 stockShare price up 15.4 percent since start of year
The rise in the price of oil caused the stock market’s mood to
sour in the third quarter. These high prices pulled down world
markets and stoked new anxieties among investors. Domestic
stock exchanges were unable to escape the trend. The most
important index, the DAX or Deutsche Aktienindex, lost ground in
the third quarter, closing at 3,892.9 points – down 1.8 percent from
the beginning of the year. Apart from worries about the world
economy, problems in the German market also increasingly
troubled the DAX. Investors showed a lack of confidence in the
German economy.
payments. Feature films and series for which the license terms
have not yet begun are not included in the programming invest-
ments stated on the balance sheet. At EUR 724.2 million, program-
ming assets at September 30, 2004, were down 20 percent
from the same date last year (EUR 901.4 million). The signifi-
cantly higher value from last year resulted from the signing of
numerous major film agreements to help safeguard the pro-
gramming supply for the long term. The ProSiebenSat.1 Group
has a very good supply of high-quality feature films and series,
and has contracts with almost every major U.S. film studio.
EmployeesPersonnel expenses down 2 percent
As of September 30, 2004, the ProSiebenSat.1 Group had a total
of 2,695 employees, down about six percent from a year earlier. Most
of the decrease resulted from restructuring within the Group as
a whole. The changes included cancellation of some programs
and outsourcing of others. As of September 30, 2004, Sat.1 had
230 employees (vs. 225) and ProSieben had 245 (vs. 273). As of
the same date, Kabel 1 had 45 employees (vs. 48) and N24 had
157 (vs. 176). The Diversification segment had 204 employees
(vs. 207). With 912 employees (vs. 917), ProSiebenSat.1 Produk-
tion was the unit with the largest staff. ProSiebenSat.1 Media AG
had 347 employees (vs. 370); 386 employees (vs. 377) were in
marketing (SevenOne Media and SevenOne Interactive).
Personnel expenses for the first nine months were EUR 152.2
million. This is equivalent to a decline of about 2 percent from the
figure of EUR 155.6 million for the same period last year.
Only the MDAX has escaped the trend so far. Over the last nine
months the MDAX rose 12.2 percent, to close at 5,014.36 on
September 30. Experts view the rise as a renaissance of standard
stock. Many cyclical MDAX companies profited substantially from
the economic recovery of the first two quarters.
Over the year, ProSiebenSat.1 stock has significantly out-perfor-
med both the DAX and the MDAX. As of September 30, it was up
15.4 percent from the beginning of the year, to EUR 14.84. The
price started off the third quarter on the downside. By the time
the first half results were announced on August 13, the stock
had fallen back to its price at the beginning of the year. But the
share price gained a lot of ground on the good figures of the first
half, and had almost returned to the first half closing price by the
0
0
0
0
Jan.
03
ProSiebenSat.1 Media AG
Apr.
03
Jul.
03
DAXMDAX
100,00
150,00
200,00
250,00
Oct.
03
Jan.
04
Apr.
04
Jul.
04
Sept.
04
EURO STOXX-Media
Source: Reuters
ProSiebenSat.1 stock:
Share price performance Jan. 1, 2003 – Sept. 30, 2004

Report for Q3 2004
Page 16
P7S1 Holding increases stake in ProSiebenSat.1 Media AG
end of the quarter. The ProSiebenSat.1 stock also outperformed
its European peer group as a whole. While the stock picked up 15.4
percent year-on-year, the Euro-Stoxx-Media index gained only
2.2 percent.
Change in shareholder structure
The ongoing implementation of the insolvency plan for Kirch-
Media GmbH & Co. KGaA (Taurus TV GmbH) has caused another
change in the shareholder structure of ProSiebenSat.1 Media AG.
In September, KirchMedia sold its remaining stake in ProSieben-
Sat.1 Media AG to P7S1 Holding L.P. and Axel Springer AG. As a
result, P7S1 Holding L.P. increased its holdings of capital stock
from 37.5 percent to 50.5 percent. Axel Springer AG’s holdings
of capital stock rose from 10.2 percent to 12.0 percent. Kirch-
Media GmbH & Co. KGaA no longer holds an interest in ProSieben-
Sat.1 Media AG. The free float remains unchanged at 37.5
percent.
Staff changes
At the beginning of October, Hubertus Meyer-Burckhardt took
full responsibility for media policy and regulation on the Executive
Board. He had formerly shared these responsibilities with Jürgen
Doetz. Mr. Doetz resigned from active service on the Executive
Board upon reaching the retirement age of 60 stipulated for the
Board. But he will remain associated with the ProSiebenSat.1
Group in an advisory capacity.
The Supervisory Board of ProSiebenSat.1 Media AG also under-
went changes. Ynon Kreiz has been a member of the board since
October 25. Mr. Kreiz, a media businessman residing in London,
succeeded Michael Jaffé as an alternate member elected by the
shareholders’ meeting. Mr. Jaffé resigned once KirchMedia sold
its remaining stake in ProSiebenSat.1 Media AG.
Research and development
Ongoing research and market analysis is a top priority for the
ProSiebenSat.1 Group. The results of research on audiences and
the advertising market, and in new technologies, furnish important
information for the Company’s strategic orientation.
Field test for interactive TV
In September, the ProSiebenSat.1 Group began a field test on its
stations for a concept that is unique in the world. The core
element of “Betty” technology is a new generation of TV remote
controls. Unlike all previous interactive TV concepts, Betty
works with existing televisions. It does not need a set-top box
and can be used with both analog and digital TV reception. Using
a wireless feedback channel to the telephone jack, Betty enables
viewers to use such added-value services as gaming, voting and
shopping, and to call up information. The ProSiebenSat.1 Group’s
partners in the project are Betty Mitmach TV GmbH and Service-
plan Agenturgruppe für innovative Kommunikation.

Report for Q3 2004
Page 17
ProSiebenSat.1 Group is holding firm to
its profit expectation
Events subsequent to the reporting dateProSiebenSat.1 Group has best October in 4 years
The ProSiebenSat.1 Group’s stations got off to a successful start
into the economically vital fourth quarter, with the best October in
four years. The Group earned an audience share of 30.9 percent.
The gain means that Sat.1, ProSieben, Kabel 1 and N24 picked up
0.6 percentage points against the same month last year among
the commercially decisive target group of 14 to 49 year old view-
ers. The Group had 30.3 percent in October 2003, 29.1 percent
in October 2002, and 29.3 percent in October 2001. The broad-
casting corporation also gained further ground in comparison
to its successful September figures, picking up 0.5 percentage
points.
Sat.1 logged a gain of 0.3 percentage points to its October 2003
ratings, to reach 12.2 percent. The station’s showing in comparison
to September was even better, a gain of 0.4 percentage points.
An important contributing factor here was the new fall schedule,
including such shows as “Mein grosser dicker peinlicher Verlobter”
(as high as 23.9%) and “Schillerstrasse” (as high as 21.7%), as
well as the UEFA Champions League.
ProSieben, at 12.9 percent in October, had its second-strongest
audience share of the year (March 2004: 13.0%). This was an
increase of 0.3 percentage points over both September’s figure
and October of last year. Among the ratings highlights were two
blockbusters – “The Fifth Element” (23.4%) and “Save the Last
Dance” (19.4%) – as well as “Sex and the City” (as high as 20.3%)
and “Popstars” (as high as 15.1%).
Kabel 1 logged 5.3 percent in October, remaining stable against
October of 2003. The station’s share in September of this year was
5.5 percent. News station N24, with a share of 0.5 percent,
pulled ahead of competitor n-tv for the first time in the monthly
figures; the competing station lost 0.1 percentage points, to 0.4
percent.
Among 14 to 49-year-olds, RTL earned a share of 17.7 percent
in October, following 17.6 percent in September. The new figure
represents a drop of 0.6 percentage points against October
2003 for the station. Vox at 6.0 percent was nearly at the same
level as September, when the station reached 6.1 percent. Super
RTL earned 2.6 percent, compared to 2.5 percent in September
and 2.4 percent in October of 2003. The October 2003 figure for
n-tv was 0.5 percent. RTL 2 lost 1.0 percentage point from Sep-
tember, to earn a 7.3 percent share – the same as it had in Octo-
ber 2003.
Upcoming station highlights
Sat.1 started out the fall with a new slogan and a new design.
“Sat.1 shows ‘em all” stands for the station’s new self-confidence
and innovative strength. Sat.1 will be showing off both char-
actristics in the economically vital fourth quarter. The interna-
tional co-production “Die Nibelungen” by hit director Uli Edel
continues Sat.1’s string of outstanding event productions. Other
ratings bulwarks are the station’s other in-house productions:
from successful Sat.1 Movies on Tuesdays to the crime series
“Der Bulle von Tölz.” In light entertainment, the station’s per-
formance is reinforced with variety and comedy programs like
“Die Hit Giganten,” “Genial daneben” and “Schillerstrasse.”
Major films, like the Oscar-winning “Nowhere in Africa” or “The
Others,” with Nicole Kidman, show promise of attracting excep-
tional viewer interest. The UEFA Champions League rounds out
Sat.1’s broad range of programming.
ProSieben began the vital fourth quarter with the best October
showing in four years among the 14-to-49 viewer group that
advertisers prize. In the next few weeks, the No. 1 movie station
will be showing such blockbusters as “Rat Race,” “40 Days and
40 Nights” and the comedy “Zoolander.” Additionally, ProSieben
shows some of the biggest international TV series, including the
final episodes of the cult hit “Sex and the City” and the U.S. hit
“NIP/Tuck.” It is also strengthening its in-house production ope-
rations, under the “made by ProSieben” label. With “Das Blut der
Templer,” the station is also promoting high-quality event televi-
sion. Other programming highlights are the BBC documentary
“Space Odyssey – Mission to the Planets” and an expanded ver-
sion of the successful show series “Die 100 nervigsten … .”
Kabel 1 will remain the place to go for film classics. In a Forsa sur-
vey, 20.7 percent of the 14-to-49 audience recently rated the
station tops in “best classic films.” Kabel 1 is responding by exten-
ding “Die Besten Filme aller Zeiten – Die Show,” an established
programming brand in the entertainment segment. The Group’s

Report for Q3 2004
Page 18
very good supply of licensed programming is one of the cor-
nerstones of the station’s expansion of its core competence in
feature films. In the next few weeks Kabel 1 will be showing time-
less quality films from Hollywood, with “Groundhog Day,” the
Mafia epic “GoodFellas” and “Mary Shelley’s Frankenstein.”
With its new slogan “We get down to business,” N24 devotes the
next few weeks to informative programming with a strong opi-
nion content. The new weekly magazine show “Der Aktionär TV”
extensively explores the current week on the stock exchange,
provides information on the domestic and international stock
market, and analyzes individual sectors. Host Michel Friedman
also provides strong opinions and strong talk on current issues
in his “Studio Friedman” program.
Outlook
Visibility in the advertising market remains as low as ever, and is
clowded by advertisers’ predilection to book on short notice. Con-
ditions in the advertising business are still affected by adverse
consumer attitudes in Germany. At the moment there are no
indications that consumer confidence will improve. Instead, the
rising price of oil and the disuccions about at the Karstadt and
Opel conglomerates spark concerns that consumers will remain
unforthcoming.
Because of this uncertainty it is very difficult to make any predic-
tions about the TV advertising market. The ProSiebenSat.1 Group
continues to assume that the television advertising market will
close out 2004 with growth. The ZAW – the German advertising
association – expects a gain of 2 percent. The World Advertising
Research Center (WARC) anticipates growth of 1.8 percent. But
the RTL Group, the ProSiebenSat.1 Group’s major competitor,
apparently takes a far dimmer view of the market, and projects
zero growth. In the wake of a very good first half and a significantly
less dynamic second half, the ProSiebenSat.1 Group now expects
that the net television advertising market will show a growth
rate between 0 and 2 percent in 2004. The Group itself will finish
out the year with above-average growth rates in revenues, and a
significant improvement in earnings. The ProSiebenSat.1 Group
Outlook
Explanatory note
The report for Q1-Q3 and the third quarter of 2004 has been pre-
pared in accordance with International Accounting Standard IAS
34, in conjunction with IFRS 1.
The financial statements for the first quarter of 2004 were the
first that the ProSiebenSat.1 Group has presented under Inter-
national Financial Reporting Standards (IFRS). On June 6, 2002,
the Council of the European Union issued a decision that requires
all companies oriented on the capital markets to prepare their
consolidated financial statements under IFRS for fiscal years
beginning after December 31, 2004. The ProSiebenSat.1 Group
already began the transition last year. This report for for Q1-Q3
and third quarter of 2004 employs the same reporting and valu-
ation methods as were used in the ProSiebenSat.1 Group‘s IFRS
annual financial statements as of December 31, 2003.
German accounting principles differ in a number of regards from
IFRS. In the case of the ProSiebenSat.1 Group, for example, diffe-
rences appear in the reporting of leased assets and deferred taxes.
Reconciliation under IFRS 1
The following reconciliations of equity and profit or loss for the
reporting period reflect all changes that result from the diffe-
rences in accounting principles between IFRS and the German
Commercial Code (HGB). The major items are explained below.
Business combinations
Under IFRS 3, goodwill and separable intangible assets with an
indeterminate useful life expectancy are not to be amortized,
but instead must be reviewed annually for impairment, which
is known as the impairment-only approach. The ProSieben-
is holding firm to its profit expectations, even if revenues fail to
grow in the second half. The Group also expects to achieve its
cost-cutting targets for the year as a whole.

Report for Q3 2004
Page 19
Explanatory note and reconciliation
656.7
-50.6
-29.8
-14.6
6.1
-5.9
2.9
36.3
0.1
601.2
Reconciliation
Shareholders´ equity as of Dec 31, 2003 EUR m
Equity per German Commercial Code (HGB)
Discount on Euvia loan
Reporting/Valuation of derivatives
Valuation of provisions and liabilities
Reporting/Valuation of bonds
Leases
Impairment-only approach for Kabel 1 goodwill
Deferred taxes
Miscellaneous
Equity per IFRS
617.4
-51.8
-16.8
7.8
-6.1
-4.7
-1.7
35.9
0.8
580.8
Reconciliation
Shareholders´ equity as of Dec 31, 2002 EUR m
Equity per German Commercial Code (HGB)
Discount on Euvia loan
Valuation of provisions and liabilities
Reporting/Valuation of bonds
Leases
Valuation at equity Euvia
Reporting/Valuation of derivatives
Deferred taxes
Miscellaneous
Equity per IFRS
606.4
-50.9
-14.7
6.5
-6.0
-5.2
-5.2
2.1
38.0
1.6
572.6
Equity per German Commercial Code (HGB)
Discount on Euvia loan
Valuation of provisions and liabilities
Reporting/Valuation of bonds
Leases
Valuation at equity Euvia
Reporting/Valuation of derivatives
Impairment-only approach for Kabel 1 goodwill
Deferred taxes (incl. adjustment to tax rate for full year)
Miscellaneous
Equity per IFRS
Reconciliation
Shareholders´ equity as of Sept 30, 2003 EUR m
45.0
-5.9
4.5
2.9
-1.7
1.2
-7.5
0.9
39.4
Reconciliation
Group net profit for 2003 EUR m
Group net profit per German Commercial Code (HGB)
Reporting/Valuation of derivatives
Valuation at equity Euvia
Impairment-only approach for Kabel 1 goodwill
Reporting/Valuation of bonds
Addition to Euvia loan
Deferred taxes
Miscellaneous
Group net profit per IFRS
Report for Q3 2004
Page 20
-7.6
2.1
2.1
-1.3
0.1
0.9
0.1
2.1
-0.4
-1.9
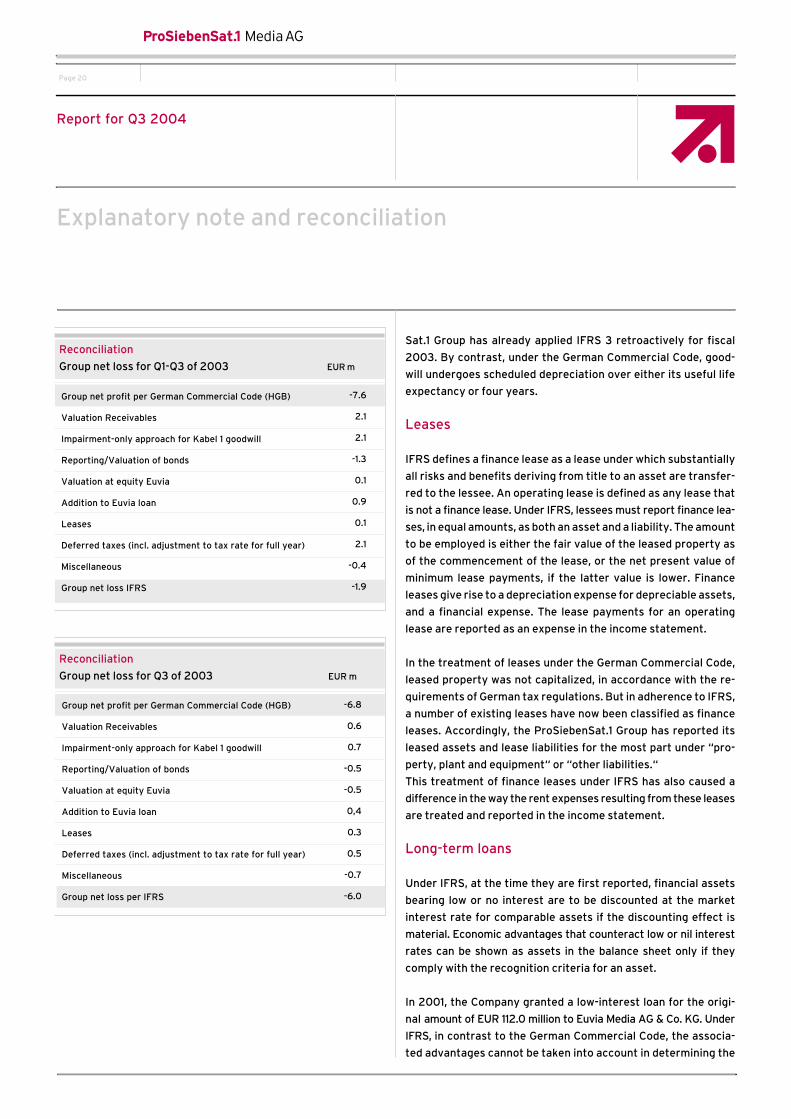
Reconciliation
Group net loss for Q1-Q3 of 2003 EUR m
Group net profit per German Commercial Code (HGB)
Valuation Receivables
Impairment-only approach for Kabel 1 goodwill
Reporting/Valuation of bonds
Valuation at equity Euvia
Addition to Euvia loan
Leases
Deferred taxes (incl. adjustment to tax rate for full year)
Miscellaneous
Group net loss IFRS
Explanatory note and reconciliation
Sat.1 Group has already applied IFRS 3 retroactively for fiscal
2003. By contrast, under the German Commercial Code, good-
will undergoes scheduled depreciation over either its useful life
expectancy or four years.
Leases
IFRS defines a finance lease as a lease under which substantially
all risks and benefits deriving from title to an asset are transfer-
red to the lessee. An operating lease is defined as any lease that
is not a finance lease. Under IFRS, lessees must report finance lea-
ses, in equal amounts, as both an asset and a liability. The amount
to be employed is either the fair value of the leased property as
of the commencement of the lease, or the net present value of
minimum lease payments, if the latter value is lower. Finance
leases give rise to a depreciation expense for depreciable assets,
and a financial expense. The lease payments for an operating
lease are reported as an expense in the income statement.
In the treatment of leases under the German Commercial Code,
leased property was not capitalized, in accordance with the re-
quirements of German tax regulations. But in adherence to IFRS,
a number of existing leases have now been classified as finance
leases. Accordingly, the ProSiebenSat.1 Group has reported its
leased assets and lease liabilities for the most part under “pro-
perty, plant and equipment“ or “other liabilities.“
This treatment of finance leases under IFRS has also caused a
difference in the way the rent expenses resulting from these leases
are treated and reported in the income statement.
Long-term loans
Under IFRS, at the time they are first reported, financial assets
bearing low or no interest are to be discounted at the market
interest rate for comparable assets if the discounting effect is
material. Economic advantages that counteract low or nil interest
rates can be shown as assets in the balance sheet only if they
comply with the recognition criteria for an asset.
In 2001, the Company granted a low-interest loan for the origi-
nal amount of EUR 112.0 million to Euvia Media AG & Co. KG. Under
IFRS, in contrast to the German Commercial Code, the associa-
ted advantages cannot be taken into account in determining the
-6.8
0.6
0.7
-0.5
-0.5
0,4
0.3
0.5
-0.7
-6.0
Reconciliation
Group net loss for Q3 of 2003 EUR m
Group net profit per German Commercial Code (HGB)
Valuation Receivables
Impairment-only approach for Kabel 1 goodwill
Reporting/Valuation of bonds
Valuation at equity Euvia
Addition to Euvia loan
Leases
Deferred taxes (incl. adjustment to tax rate for full year)
Miscellaneous
Group net loss per IFRS

Report for Q3 2004
Page 21
value of the low-interest loan to Euvia Media. Hence the loan to
Euvia Media has been discounted under IFRS.
Borrowing costs
Under German accounting standards, costs incurred in direct
connection with borrowings (for example, through bonds) rep-
resent an immediate expense for the period in question. Under
IFRS, borrowing costs are charged as expenses spread over the
life of the loan.
Other provisions
German accounting principles require provisions to be set aside
for doubtful debts and potential losses on pending transactions. Such
provisions may also be formed for internal costs — for example
maintenance costs incurred during the first three months of the
subsequent year, or for other defined expenses. Provisions are
to be accrued under IFRS if a present external obligation exists;
if it is probable that an outflow of resources will be necessary
in order to fulfill that obligation; and if a reliable estimate can
be made of the amount of the obligation. Provisions are formed
according to the best-estimate method, and discounted to pre-
sent value if they are maintained for the long term and if the dis-
counting effect is material. The terms under which the present
external obligation may be reduced by income directly or indi-
rectly associated with that obligation may differ under IFRS from
the terms under the German Commercial Code.
Deferred taxes
Under German accounting principles, a deferred tax item must be
formed for differences between the consolidated income state-
ment and income as calculated for tax purposes, if those diffe-
rences are likely to net out against one another in the future. Under
IFRS, deferred tax assets and liabilities are to be recognized for
temporary differences between the value of an asset or liabi-
lity as carried in the balance sheet, and the assessment basis on
which that item will be taxed, except for goodwill (unless amor-
tization of goodwill is tax-deductible) and certain transactions
that do not affect either the taxable profit or the accounting pro-
fit. Additionally, IFRS requires deferred tax assets to be reported
for tax loss carry-forwards, if there is an adequate probability
Explanatory note and reconciliation
that these tax loss carry-forwards will be applied against taxable
profit in the future.
The differences in carrying values for deferred taxes at the
ProSiebenSat.1 Group are largely the consequence of capitali-
zing deferred taxes that result in part from differences between
IFRS and German tax reporting principles, and in part from tax
loss carry-forwards.
Derivative financial instruments
Under German accounting standards, derivative financial instru-
ments are reported as anticipated transactions in the balance
sheet only if their valuation as of the reporting date indicates a
potential loss, and if they cannot be allocated to a compensatory
valuation unit that combines both the derivative and the under-
lying transaction, in a procedure that is roughly equivalent to
hedge accounting under IAS. Unrealized gains do not appear in
the income statement because of the principle that gains are not
to be shown until they have been realized through a sale.
Under IFRS, reporting for financial instruments is governed by
IAS 32 and IAS 39, which require derivatives to be reported in the
balance sheet at their fair value. Changes in fair value are normally
applied to the income statement. Hedge accounting may be applied
under certain narrowly defined conditions. In those cases, there
are regular subsequent revaluations of the derivative with no
impact on the income statement.
The ProSiebenSat.1 Group has hedges against interest-rate risks
and foreign-currency risks. Interest-rate risks arise from liabili-
ties with variable interest rates. The Company uses interest-
rate swaps to hedge these risks. Some financial statements
have included euro-denominated interest-rate swaps for which
hedge accounting could not be applied under IFRS. Accordingly,
these swaps were reported at fair value as “other liabilities.“
Consequently, subsequent changes in the current market value
of these interest-rate swaps will be entered without effect on
income or expense.
The ProSiebenSat.1 Group incurs foreign-currency risks primarily
through license payments denominated in US dollars. The Com-
pany hedges these risks by entering into forward exchange deals

Report for Q3 2004
Page 22
Explanatory note and reconciliation
and currency options. Its expectation is that most of the deriva-
tive financial instruments used for foreign-exchange management
will meet the requirements for hedge accounting under IFRS.
Under IFRS those forward-exchange transactions that meet
the requirements for hedging are reported at fair value under
equity and under “other liabilities,“ with no net impact on profits.
Forward-exchange transactions that do not qualify for hedging
are reported at fair value in the balance sheet, with an impact on
profits. Under IFRS, currency options are capitalized as “other
assets“ for the amount of their option premium. In subsequent
valuations, any changes in fair value are charged to the income
statement.
This report contains forward-looking statements that reflect the current views of the management of ProSiebenSat.1 Media AG regarding future events. These forward-looking statements include any statement in this report that reproduces or is founded upon intentions, expectations or predictions (as well as the underlying assumptions) of the Company. These statements are based on plans, estimates and projections currently available to the management of ProSiebenSat.1 Media AG. Therefore, they refer only to the date on which they are made. Forward-looking statements are inherently subject to risks and uncertainties (for example, owing to future developments in the German advertising market) that may cause actual outcomes to differ materially from such forward-looking statements or the results they imply. ProSiebenSat.1 Media AG assumes no obligation to update such statements to reflect new information or future events, nor does it intend to provide such updates.

Report for Q3 2004
Page 23
Consolidated Income Statement
for ProSiebenSat.1 Media AG for Q1 - Q3 2004 (IFRS)
Q1-Q3 2004 Q1-Q3 2003 Change Change
EUR k EUR k EUR k in percent
1. Revenues 1,294,344 1,240,822 53,522 4%
2. Cost of sales -898,151 -938,479 -40,328 -4%
3. GGross profit 396,193 302,343 93,850 31%
4. Selling expenses -135,794 -155,122 -19,328 -12%
5. Administrative expenses -95,338 -122,361 -27,023 -22%
6. Other operating income 16,281 27,522 -11,241 -41%
7. OOperating profit 181,342 52,382 128,960 246%
8. Income from companies in which equity investments are held 51 50 1 2%
9. Income from other securities and from loans of financial assets 5,179 4,004 1,175 29%
10. Income from associated companies 2,020 611 1,409 231%
11. Write-downs of financial assets and marketable securities -877 -750 127 17%
12. Net interest result -44,960 -53,875 8,915 17%
13. Other financial expenses -21,119 -5,597 15,522 277%
14. FFinancial loss -59,706 -55,557 -4,149 -7%
15. IIncome from ordinary business activities 121,636 -3,175 124,811 - / -
16. Income taxes -46,199 1,024 47,223 - / -
17. PProfit/loss 75,437 -2,151 77,588 - / -
18. Minority interests -155 261 -416 -159%
19. CConsolidated profit/loss 75,282 -1,890 77,172 - / -
Q1-Q3 2004 Q1-Q3 2003 Change Change
EUR EUR EUR in percent
Basic and diluted earnings per share of common stock according
to IAS 33 0.36 -0.01 0.37 - / -
Basic and diluted earnings per share of preferred stock
according to IAS 33 0.37 0.00 0.37 - / -
Consolidated Income Statement for ProSiebenSat.1 Media AG for Q1-Q3 2004 (IFRS)

Report for Q3 2004
Page 24
Consolidated Income Statement
for ProSiebenSat.1 Media AG for Q3 2004 (IFRS)
Q3 2004 Q3 2003 Change Change
EUR k EUR k EUR k in percent
1. Revenues 362,053 362,659 -606 - / -
2. Cost of sales -277,719 -265,327 12,392 5%
3. GGross profit 84,334 97,332 -12,998 -13%
4. Selling expenses -48,845 -53,739 -4,894 -9%
5. Administrative expenses -29,670 -41,162 -11,492 -28%
6. Other operating income 5,847 6,745 -898 -13%
7. OOperating profit 11,666 9,176 2,490 27%
8. Income from companies in which equity investments are held 51 50 1 2%
9. Income from other securities and from loans of financial assets 2,016 1,375 641 47%
10. Income from associated companies 793 132 661 501%
11. Write-downs of financial assets and marketable securities -877 -250 627 251%
12. Net interest result -13,258 -17,399 4,141 24%
13. Other financial expenses 3,953 -1,770 -5,723 -323%
14. FFinancial loss -7,322 -17,862 10,540 59%
15. IIncome from ordninary business activities 4,344 -8,686 13,030 150%
16. Income taxes -1,656 2,801 4,457 159%
17. PProfit/loss 2,688 -5,885 8,573 146%
18. Minority interests -84 -80 -4 -5%
19. CConsolidated profit/loss 2,604 -5,965 8,569 144%
Q3 2004 Q3 2003 Change Change
EUR EUR EUR in percent
Basic and diluted earnings per share of common stock
according to IAS 33 0.01 -0.03 0.04 133%
Basic and diluted earnings per share of preferred stock
according to IAS 33 0.01 -0.02 0.03 150%
Consolidated Income Statement for ProSiebenSat.1 Media AG for Q3 2004 (IFRS)

Report for Q3 2004
Page 25
Consolidated Balance Sheet of ProSiebenSat.1 Media AG
as of Sept. 30, 2004 (IFRS)
09/30/2004 09/30/2003 Change 12/31/2003 Changge
EUR k EUR k EUR k EUR k EUR
A. Noncurrent assets
I. Intangible assets 62,228 61,807 421 60,583 1,64
II. Property, plant and equipment 242,639 262,298 -19,659 258,639 -16,00
III. Financial assets 147,315 136,993 10,322 145,727 1,58
452,182 461,098 -8,916 464,949 -12,76
B. Current assets
I. Programming assets 1,185,434 1,231,664 -46,230 1,148,177 37,25
II. Inventories 5,756 5,352 404 5,777 -2
III. Accounts receivable and other assets 198,758 177,014 21,744 172,557 26,20
IV. Marketable securities 615 945 -330 921 -30
V. Cash, cash at bank 132,164 46,364 85,800 61,862 70,30
1,522,727 1,461,339 61,388 1,389,294 133,43
C. Deferred taxes 35,953 46,448 -10,495 43,613 -7,66
2,010,862 1,968,885 41,977 1,897,856 113,0006
09/30/2004 09/30/2003 Change 12/31/2003 Changge
EUR k EUR k EUR k EUR k EUR
A. Shareholders' equity
I. Subscribed capital 218,797 194,486 24,311 194,486 24,31
II. Capital reserves 578,421 322,319 256,102 322,319 256,10
III. Group equity generated 170,842 59,403 111,439 97,505 73,33
IV. Accumulated other Group equity -7,902 -3,606 -4,296 -13,160 5,25
960,158 572,602 387,556 601,150 359,00
B. Minority interests 780 -398 1,178 625 15
C. Provisions 87,195 58,322 28,873 65,397 21,79
D. Liabilities (1) 962,729 1,338,359 -375,630 1,230,684 -267,95
2,010,862 1,968,885 41,977 1,897,856 113,0006
(1) Sept. 30, 2004: including interest-bearing liabilities EUR m 702 (remaining term 1 year or less: EUR m 142; remaining term 1 to
5 years: EUR m 64; remaining term > 5 years: EUR m 496)
Sept. 30, 2003: including interest-bearing liabilities EUR m 1,024 (remaining term 1 year or less: EUR m 174; remaining term 1 to
5 years: EUR m 494; remaining term > 5 years EUR m 356)
Dec. 31, 2003: including interest-bearing liabilities EUR m 866 (remaining term 1 year or less: EUR m 146; remaining term 1 to
5 years: EUR m 366; remaining term > 5 years EUR m 354)
Assets
Total assets
Consolidated Balance Sheet of ProSiebenSat.1 Media AG as of Sept. 30, 2004 (IFRS)
Total liabilities and shareholders' equity
Liabilities and shareholders' equity

Report for Q3 2004
Page 26
Statement of Changes in Shareholders‘ Equity
Foreign currency
translation adjustment
Other transactions not
recognized in the income
statement, incl. OCI
EUR k EUR k EUR k EUR k EUR k EUR k
194,486 322,319 63,238 526 228 580,797
- / - - / - -1,945 - / - - / - -1,945
- / - - / - - / - - / - -3,381 -3,381
- / - - / - - / - -979 - / - -979
- / - - / - -1,890 - / - - / - -1,890
September 30, 2003 194,486 322,319 59,403 -453 -3,153 572,602
Foreign currency
translation adjustment
Other transactions not
recognized in the income
statement, incl. OCI
EUR k EUR k EUR k EUR k EUR k EUR k
194,486 322,319 97,505 -234 -12,926 601,150
24,311 256,102 - / - - / - - / - 280,413
- / - - / - -1,945 - / - - / - -1,945
- / - - / - - / - - / - 5,258 5,258
- / - - / - 75,282 - / - - / - 75,282
September 30, 2004 218,797 578,421 170,842 -234 -7,668 960,158
Dividends paid
Hedge accounting
Shareholders'
equity
Hedge accounting
Dividends paid
Group equity
generated
December 31, 2003
Capital increase
Statement of Changes in Shareholders' Equity of the ProSiebenSat.1 Group forQ1-Q3 2003 (IFRS)
Group equity
generated
Capital
reserves
Accumulated other Group equity
Consolidated profit
Statement of Changes in Shareholders' Equity of the ProSiebenSat.1 Group forQ1-Q3 2004 (IFRS)
Subscribed
capital
Shareholders'
equity
Subscribed
capital
Capital
reserves
Accumulated other Group equity
December 31, 2002
Other changes
Consolidated loss

Report for Q3 2004
Page 27
Cash Flow Statement as of September 30, 2004 (IFRS)
Q1-Q3 2004 Q1-Q3 2003
EUR k EUR k
75,282 -1,890
28,632 32,199
678,414 705,984
35,255 7,349
17 14,406
-/- 4,159
101 311
817,701 762,518
21 -394
-25,895 26,979
-98,460 15,544
693,367 804,647
7,463 4,191
-13,973 -8,139
-9,454 -4,178
2,682 14,724
-724,167 -901,364
153 -45
-737,296 -894,811
-43,929 -90,164
-1,945 -1,945
-164,237 71,182
280,413 -/-
114,231 69,237
70,302 -20,927
61,862 67,291
132,164 46,364
Q1-Q3 2004 Q1-Q3 2003
EUR k EUR k
-39,696 36,146
-57,844 -60,959
1,873 977Cash flow from interest income
Cash flow from income taxes
Effects of changes in scope of consolidation and other changes in equity
Free cash flow
The cash flow from operating activities includes the following receipts and paymentsaccording to IAS 7:
Cash and cash equivalents as of September 30, 2004
Cash flow from investing activities
Cash flow from financing activities
Change in cash and cash equivalents
Cash and cash equivalents at beginning of year
ProSiebenSat.1 Group Cash Flow Statement for Q1-Q3 2004 (IFRS)
Expenditures for programming assets
Consolidated profit/loss
Proceeds from disposal of noncurrent assets
Change in non-interest-bearing liabilities
Change in non-interest-bearing receivables and other assets
Expenditures for intangible assets and property, plant and equipment
Cash flow from operating activities
Expenditures for purchase of financial assets
Net admission from capital increase
Cash flow from interest expenses
Proceeds from disposal of programming assets
Dividend
Change of interest-bearing liabilities
Profit from sale of fixed assets
Depreciation, amortization and impairment/write-ups of noncurrent and current assets
Change in inventories
Consumption/write-ups of programming assets
Change in tax provisions (incl. change in deferred tax assets)
Cash flow
Change in other provisions
Profit from sale of programming assets