prospectus class 4 shares · prospectus class 4 shares ... are not predictive of future investment...
TRANSCRIPT
1. With respect to the Class 1, Class 1A, Class 2 and Class 4 shares prospectuses only, the information under the heading “Portfolio managers” in the “Management” section of the Global Small Capitalization Fund summary portion of the prospectus is amended in its entirety to read as follows:
Portfolio managers The individuals primarily responsible for the portfolio management of the fund are:
Portfolio manager/ Series title (if applicable)
Portfolio manager experience in this fund
Primary title with investment adviser
J. Blair Frank 15 years Partner – Capital Research Global Investors
Bradford F. Freer Less than 1 year Partner – Capital Research Global Investors
Claudia P. Huntington 5 years Partner – Capital Research Global Investors
Harold H. La 10 years Partner – Capital Research Global Investors
Aidan O’Connell 4 years Partner – Capital Research Global Investors
Gregory W. Wendt 6 years Partner – Capital Research Global Investors
2. With respect to the Class 1, Class 1A, Class 2 and Class 4 shares prospectuses only, the information under the heading “Portfolio managers” in the “Management” section of the New World Fund summary portion of the prospectus is amended in its entirety to read as follows:
Portfolio managers The individuals primarily responsible for the portfolio management of the fund are:
Portfolio manager/ Series title (if applicable)
Portfolio manager experience in this fund
Primary title with investment adviser
Carl M. Kawaja Vice President 19 years Partner – Capital World Investors
Bradford F. Freer 1 year Partner – Capital Research Global Investors
Nicholas J. Grace 6 years Partner – Capital Research Global Investors
Robert H. Neithart 6 years Partner – Capital Fixed Income Investors
Tomonori Tani Less than 1 year Partner – Capital World Investors
3. With respect to the Class 1, Class 1A, Class 2 and Class 4 shares prospectuses only, the information under the heading “Portfolio managers” in the “Management” section of the Blue Chip Income and Growth Fund summary portion of the prospectus is amended in its entirety to read as follows:
Portfolio managers The individuals primarily responsible for the portfolio management of the fund are:
Portfolio manager/ Series title (if applicable)
Portfolio manager experience in this fund
Primary title with investment adviser
Christopher D. Buchbinder 11 years Partner – Capital Research Global Investors
James B. Lovelace 11 years Partner – Capital Research Global Investors
Lawrence R. Solomon Less than 1 year Partner – Capital Research Global Investors
James Terrile 6 years Partner – Capital Research Global Investors
American Funds Insurance Series® Prospectus Supplement
July 2, 2018
(for Class 1, Class 1A, Class 2, Class 3 and Class 4 shares prospectuses each dated May 1, 2018)

4. With respect to the Class 1, Class 1A, Class 2 and Class 4 shares prospectuses only, the information under the heading “Portfolio managers” in the “Management” section of the Global Growth and Income Fund summary portion of the prospectus is amended in its entirety to read as follows:
Portfolio managers The individuals primarily responsible for the portfolio management of the fund are:
Portfolio manager/ Series title (if applicable)
Portfolio manager experience in this fund
Primary title with investment adviser
Michael Cohen Less than 1 year Partner – Capital World Investors
Bradford F. Freer 4 years Partner – Capital Research Global Investors
Nicholas J. Grace 2 years Partner – Capital Research Global Investors
Andrew B. Suzman 9 years Partner – Capital World Investors
5. The information under the heading “Portfolio managers” in the “Management” section of the Growth-Income Fund summary portion of the prospectus is amended in its entirety to read as follow: Portfolio managers The individuals primarily responsible for the portfolio management of the fund are:
Portfolio manager/ Series title (if applicable)
Portfolio manager experience in this fund
Primary title with investment adviser
Donald D. O’Neal Vice Chairman of the Board 13 years Partner – Capital International Investors
Dylan Yolles Vice President 13 years Partner – Capital International Investors
J. Blair Frank 12 years Partner – Capital Research Global Investors
Claudia P. Huntington 24 years Partner – Capital Research Global Investors
S. Keiko McKibben 4 years Partner – Capital Research Global Investors
William L. Robbins 6 years Partner – Capital International Investors
6. The information under the heading “Portfolio managers” in the “Management” section of the Asset Allocation Fund summary portion of the prospectus is amended in its entirety to read as follow: Portfolio managers The individuals primarily responsible for the portfolio management of the fund are:
Portfolio manager/ Series title (if applicable)
Portfolio manager experience in this fund
Primary title with investment adviser
Alan N. Berro President 18 years Partner – Capital World Investors
David A. Daigle 9 years Partner – Capital Fixed Income Investors
Peter Eliot 2 years Partner – Capital International Investors
Jeffrey T. Lager 11 years Partner – Capital International Investors
Jin Lee Less than 1 year Partner – Capital World Investors
James R. Mulally 12 years Partner – Capital Fixed Income Investors
John R. Queen 2 years Partner – Capital Fixed Income Investors
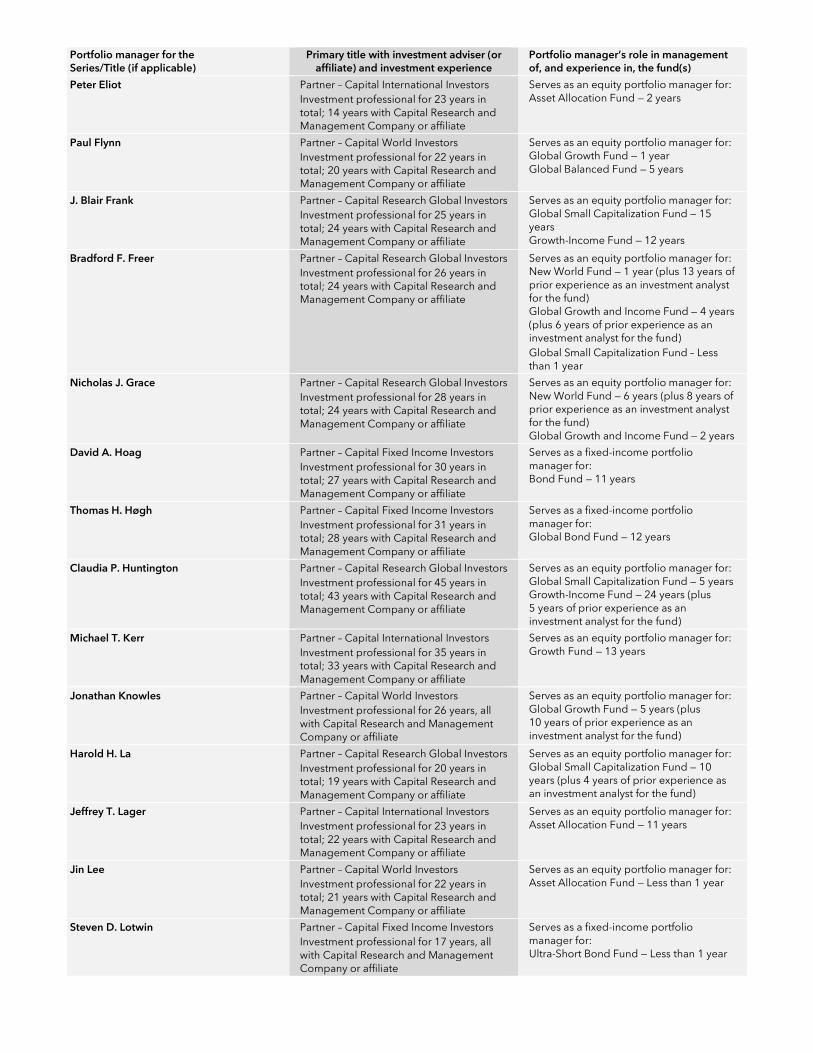
7. The table under the heading “The Capital SystemSM” in the “Management and organization” section of the prospectus is amended in its entirety to read as follows: Portfolio manager for the Series/Title (if applicable)
Primary title with investment adviser (or affiliate) and investment experience
Portfolio manager’s role in management of, and experience in, the fund(s)
Donald D. O’Neal Vice Chairman of the Board
Partner – Capital International Investors Investment professional for 33 years, all with Capital Research and Management Company or affiliate
Serves as an equity portfolio manager for: Growth-Income Fund — 13 years
Alan N. Berro President Partner – Capital World Investors Investment professional for 32 years in total; 27 years with Capital Research and Management Company or affiliate
Serves as an equity portfolio manager for: Asset Allocation Fund — 18 years
Carl M. Kawaja Vice President Partner – Capital World Investors Investment professional for 31 years in total; 27 years with Capital Research and Management Company or affiliate
Serves as an equity portfolio manager for: New World Fund — 19 years

Portfolio manager for the Series/Title (if applicable)
Primary title with investment adviser (or affiliate) and investment experience
Portfolio manager’s role in management of, and experience in, the fund(s)
Sung Lee Vice President Partner – Capital Research Global Investors Investment professional for 24 years, all with Capital Research and Management Company or affiliate
Serves as an equity portfolio manager for: International Fund — 12 years International Growth and Income Fund — 10 years
Dylan Yolles Vice President Partner – Capital International Investors Investment professional for 21 years in total; 18 years with Capital Research and Management Company or affiliate
Serves as an equity portfolio manager for: Growth-Income Fund — 13 years (plus 5 years of prior experience as an investment analyst for the fund)
Hilda L. Applbaum Partner – Capital World Investors Investment professional for 31 years in total; 23 years with Capital Research and Management Company or affiliate
Serves as an equity/fixed-income portfolio manager for: Global Balanced Fund — 7 years
Pramod Atluri Vice President – Capital Fixed Income Investors Investment professional for 20 years in total; 2 years with Capital Research and Management Company or affiliate
Serves as a fixed-income portfolio manager for: Bond Fund — 2 years
L. Alfonso Barroso Partner – Capital Research Global Investors Investment professional for 24 years, all with Capital Research and Management Company or affiliate
Serves as an equity portfolio manager for: International Fund — 9 years
David J. Betanzos Partner – Capital Fixed Income Investors Investment professional for 18 years in total; 16 years with Capital Research and Management Company or affiliate
Serves as a fixed-income portfolio manager for: Capital Income Builder — 4 years Mortgage Fund — 4 years U.S. Government/AAA-Rated Securities Fund — 3 years
Mark A. Brett Partner – Capital Fixed Income Investors Investment professional for 39 years in total; 25 years with Capital Research and Management Company or affiliate
Serves as a fixed-income portfolio manager for: Global Balanced Fund — 7 years Global Bond Fund — 3 years
Christopher D. Buchbinder Partner – Capital Research Global Investors Investment professional for 23 years, all with Capital Research and Management Company or affiliate
Serves as an equity portfolio manager for: Blue Chip Income and Growth Fund — 11 years
Mark L. Casey Partner – Capital International Investors Investment professional for 18 years, all with Capital Research and Management Company or affiliate
Serves as an equity portfolio manager for: Growth Fund — 1 year (plus 11 years of prior experience as an investment analyst for the fund)
Thomas H. Chow Vice President – Capital Fixed Income Investors Investment professional for 29 years in total; 3 years with Capital Research and Management Company or affiliate
Serves as a fixed-income portfolio manager for: High-Income Bond Fund — 3 years
Michael Cohen Partner – Capital World Investors Investment professional for 28 years in total; 18 years with Capital Research and Management Company or affiliate
Serves as an equity portfolio manager for: Global Growth and Income Fund — Less than 1 year
Patrice Collette Partner – Capital World Investors Investment professional for 24 years in total, 18 years with Capital Research and Management Company or affiliate
Serves as an equity portfolio manager for: Global Growth Fund — 3 years (plus 14 years of prior experience as an investment analyst for the fund)
David A. Daigle Partner – Capital Fixed Income Investors Investment professional for 24 years, all with Capital Research and Management Company or affiliate
Serves as a fixed-income portfolio manager for: Asset Allocation Fund — 9 years Global Bond Fund — 3 years High-Income Bond Fund — 9 years (plus 9 years of prior experience as an investment analyst for the fund)
Gerald Du Manoir Partner – Capital International Investors Investment professional for 28 years, all with Capital Research and Management Company or affiliate
Serves as an equity portfolio manager for: Capital Income Builder — 1 year
Portfolio manager for the Series/Title (if applicable)
Primary title with investment adviser (or affiliate) and investment experience
Portfolio manager’s role in management of, and experience in, the fund(s)
Peter Eliot Partner – Capital International Investors Investment professional for 23 years in total; 14 years with Capital Research and Management Company or affiliate
Serves as an equity portfolio manager for: Asset Allocation Fund — 2 years
Paul Flynn Partner – Capital World Investors Investment professional for 22 years in total; 20 years with Capital Research and Management Company or affiliate
Serves as an equity portfolio manager for: Global Growth Fund — 1 year Global Balanced Fund — 5 years
J. Blair Frank Partner – Capital Research Global Investors Investment professional for 25 years in total; 24 years with Capital Research and Management Company or affiliate
Serves as an equity portfolio manager for: Global Small Capitalization Fund — 15 years Growth-Income Fund — 12 years
Bradford F. Freer Partner – Capital Research Global Investors Investment professional for 26 years in total; 24 years with Capital Research and Management Company or affiliate
Serves as an equity portfolio manager for: New World Fund — 1 year (plus 13 years of prior experience as an investment analyst for the fund) Global Growth and Income Fund — 4 years (plus 6 years of prior experience as an investment analyst for the fund) Global Small Capitalization Fund – Less than 1 year
Nicholas J. Grace Partner – Capital Research Global Investors Investment professional for 28 years in total; 24 years with Capital Research and Management Company or affiliate
Serves as an equity portfolio manager for: New World Fund — 6 years (plus 8 years of prior experience as an investment analyst for the fund) Global Growth and Income Fund — 2 years
David A. Hoag Partner – Capital Fixed Income Investors Investment professional for 30 years in total; 27 years with Capital Research and Management Company or affiliate
Serves as a fixed-income portfolio manager for: Bond Fund — 11 years
Thomas H. Høgh Partner – Capital Fixed Income Investors Investment professional for 31 years in total; 28 years with Capital Research and Management Company or affiliate
Serves as a fixed-income portfolio manager for: Global Bond Fund — 12 years
Claudia P. Huntington Partner – Capital Research Global Investors Investment professional for 45 years in total; 43 years with Capital Research and Management Company or affiliate
Serves as an equity portfolio manager for: Global Small Capitalization Fund — 5 years Growth-Income Fund — 24 years (plus 5 years of prior experience as an investment analyst for the fund)
Michael T. Kerr Partner – Capital International Investors Investment professional for 35 years in total; 33 years with Capital Research and Management Company or affiliate
Serves as an equity portfolio manager for: Growth Fund — 13 years
Jonathan Knowles Partner – Capital World Investors Investment professional for 26 years, all with Capital Research and Management Company or affiliate
Serves as an equity portfolio manager for: Global Growth Fund — 5 years (plus 10 years of prior experience as an investment analyst for the fund)
Harold H. La Partner – Capital Research Global Investors Investment professional for 20 years in total; 19 years with Capital Research and Management Company or affiliate
Serves as an equity portfolio manager for: Global Small Capitalization Fund — 10 years (plus 4 years of prior experience as an investment analyst for the fund)
Jeffrey T. Lager Partner – Capital International Investors Investment professional for 23 years in total; 22 years with Capital Research and Management Company or affiliate
Serves as an equity portfolio manager for: Asset Allocation Fund — 11 years
Jin Lee Partner – Capital World Investors Investment professional for 22 years in total; 21 years with Capital Research and Management Company or affiliate
Serves as an equity portfolio manager for: Asset Allocation Fund — Less than 1 year
Steven D. Lotwin Partner – Capital Fixed Income Investors Investment professional for 17 years, all with Capital Research and Management Company or affiliate
Serves as a fixed-income portfolio manager for: Ultra-Short Bond Fund — Less than 1 year

Portfolio manager for the Series/Title (if applicable)
Primary title with investment adviser (or affiliate) and investment experience
Portfolio manager’s role in management of, and experience in, the fund(s)
James B. Lovelace Partner – Capital Research Global Investors Investment professional for 36 years, all with Capital Research and Management Company or affiliate
Serves as an equity portfolio manager for: Blue Chip Income and Growth Fund — 11 years
Jesper Lyckeus Partner – Capital Research Global Investors Investment professional for 23 years in total; 22 years with Capital Research and Management Company or affiliate
Serves as an equity portfolio manager for: International Fund — 11 years (plus 8 years of prior experience as an investment analyst for the fund) International Growth and Income Fund — 10 years
Fergus N. MacDonald Partner – Capital Fixed Income Investors Investment professional for 26 years in total; 15 years with Capital Research and Management Company or affiliate
Serves as a fixed-income portfolio manager for: Mortgage Fund — 7 years U.S. Government/AAA-Rated Securities Fund — 8 years
S. Keiko McKibben Partner – Capital Research Global Investors Investment professional for 22 years in total; 20 years with Capital Research and Management Company or affiliate
Serves as an equity portfolio manager for: Growth-Income Fund — 4 years (plus 10 years of prior experience as an investment analyst for the fund)
James R. Mulally Partner – Capital Fixed Income Investors Investment professional for 42 years in total; 38 years with Capital Research and Management Company or affiliate
Serves as a fixed-income portfolio manager for: Asset Allocation Fund — 12 years
Robert H. Neithart Partner – Capital Fixed Income Investors Investment professional for 31 years, all with Capital Research and Management Company or affiliate
Serves as a fixed-income portfolio manager for: New World Fund — 6 years (plus 2 years of prior experience as an investment analyst for the fund) Global Balanced Fund — 7 years Global Bond Fund — 5 years
Aidan O’Connell Partner – Capital Research Global Investors Investment professional for 20 years in total; 14 years with Capital Research and Management Company or affiliate
Serves as an equity portfolio manager for: Global Small Capitalization Fund — 4 years (plus 9 years of prior experience as an investment analyst for the fund)
John R. Queen Partner – Capital Fixed Income Investors Investment professional for 27 years in total; 15 years with Capital Research and Management Company or affiliate
Serves as a fixed-income portfolio manager for: Asset Allocation Fund — 2 years
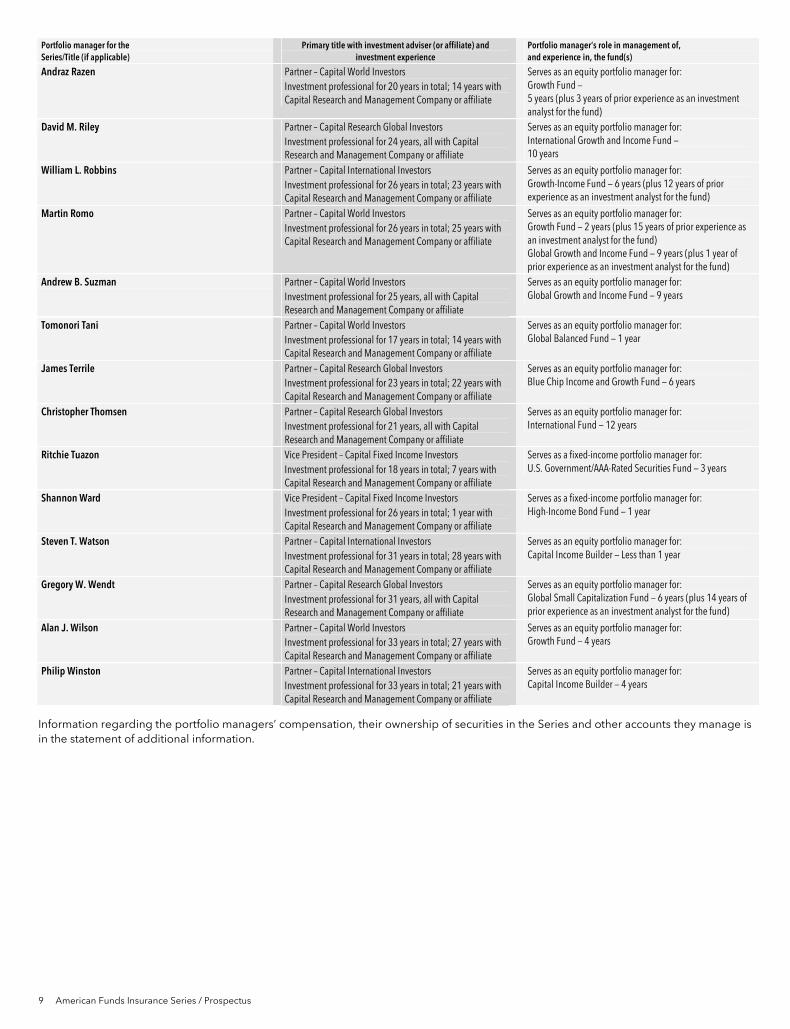
Andraz Razen Partner – Capital World Investors Investment professional for 20 years in total; 14 years with Capital Research and Management Company or affiliate
Serves as an equity portfolio manager for: Growth Fund — 5 years (plus 3 years of prior experience as an investment analyst for the fund)
David M. Riley Partner – Capital Research Global Investors Investment professional for 24 years, all with Capital Research and Management Company or affiliate
Serves as an equity portfolio manager for: International Growth and Income Fund — 10 years
William L. Robbins Partner – Capital International Investors Investment professional for 26 years in total; 23 years with Capital Research and Management Company or affiliate
Serves as an equity portfolio manager for: Growth-Income Fund — 6 years (plus 12 years of prior experience as an investment analyst for the fund)
Martin Romo Partner – Capital Research Global Investors Investment professional for 26 years in total; 25 years with Capital Research and Management Company or affiliate
Serves as an equity portfolio manager for: Growth Fund — 2 years (plus 15 years of prior experience as an investment analyst for the fund)
Lawrence R. Solomon Partner – Capital Research Global Investors Investment professional for 34 years in total; 33 years with Capital Research and Management Company or affiliate
Serves as an equity portfolio manager for: Blue Chip Income and Growth Fund — Less than 1 year
Andrew B. Suzman Partner – Capital World Investors Investment professional for 25 years, all with Capital Research and Management Company or affiliate
Serves as an equity portfolio manager for: Global Growth and Income Fund — 9 years

Portfolio manager for the Series/Title (if applicable)
Primary title with investment adviser (or affiliate) and investment experience
Portfolio manager’s role in management of, and experience in, the fund(s)
Tomonori Tani Partner – Capital World Investors Investment professional for 17 years in total; 14 years with Capital Research and Management Company or affiliate
Serves as an equity portfolio manager for: New World Fund — Less than 1 year Global Balanced Fund — 1 year
James Terrile Partner – Capital Research Global Investors Investment professional for 23 years in total; 22 years with Capital Research and Management Company or affiliate
Serves as an equity portfolio manager for: Blue Chip Income and Growth Fund — 6 years
Christopher Thomsen Partner – Capital Research Global Investors Investment professional for 21 years, all with Capital Research and Management Company or affiliate
Serves as an equity portfolio manager for: International Fund — 12 years
Ritchie Tuazon Vice President – Capital Fixed Income Investors Investment professional for 18 years in total; 7 years with Capital Research and Management Company or affiliate
Serves as a fixed-income portfolio manager for: U.S. Government/AAA-Rated Securities Fund — 3 years
Shannon Ward Vice President – Capital Fixed Income Investors Investment professional for 26 years in total; 1 year with Capital Research and Management Company or affiliate
Serves as a fixed-income portfolio manager for: High-Income Bond Fund — 1 year
Steven T. Watson Partner – Capital International Investors Investment professional for 31 years in total; 28 years with Capital Research and Management Company or affiliate
Serves as an equity portfolio manager for: Capital Income Builder — Less than 1 year
Gregory W. Wendt Partner – Capital Research Global Investors Investment professional for 31 years, all with Capital Research and Management Company or affiliate
Serves as an equity portfolio manager for: Global Small Capitalization Fund — 6 years (plus 14 years of prior experience as an investment analyst for the fund)
Alan J. Wilson Partner – Capital World Investors Investment professional for 33 years in total; 27 years with Capital Research and Management Company or affiliate
Serves as an equity portfolio manager for: Growth Fund — 4 years
Philip Winston Partner – Capital International Investors Investment professional for 33 years in total; 21 years with Capital Research and Management Company or affiliate
Serves as an equity portfolio manager for: Capital Income Builder — 4 years
Keep this supplement with your prospectus.
Lit. No. INA8BS-042-0718O CGD/8024-S68780

Capital Income Builder®
Table of contents
Capital Income Builder 1
Investment objectives, strategies and risks 4
Management and organization 6Purchases and redemptions of shares 10Plan of distribution 12Fund expenses 12Investment results 12Distributions and taxes 12Financial highlights 13
American Funds Insurance Series®
Prospectus Class 4 shares
May 1, 2018
The U.S. Securities and Exchange Commission has not approved or disapproved of these securities. Further, it has not determinedthat this prospectus is accurate or complete. Any representation to the contrary is a criminal offense.

1 American Funds Insurance Series / Prospectus
Capital Income Builder Investment objectives The fund has two primary investment objectives. It seeks (1) to provide a level of current income that exceeds the average yield on U.S. stocks generally and (2) to provide a growing stream of income over the years. The fund’s secondary objective is to provide growth of capital.
Fees and expenses of the fund This table describes the fees and expenses that you may pay if you buy and hold an interest in Class 4 shares of the fund. It does not reflect insurance contract fees and expenses. If insurance contract fees and expenses were reflected, expenses shown would be higher.
Annual fund operating expenses (expenses that you pay each year as a percentage of the value of your investment) Class 4 Management fee 0.50% Distribution fees 0.25 Other expenses 0.29 Total annual fund operating expenses 1.04
Example This example is intended to help you compare the cost of investing in Class 4 shares of the fund with the cost of investing in other mutual funds.
The example assumes that you invest $10,000 in the fund for the time periods indicated and then redeem all of your shares at the end of those periods. The example also assumes that your investment has a 5% return each year and that the fund’s operating expenses remain the same. The example does not reflect insurance contract expenses. If insurance contract expenses were reflected, expenses shown would be higher. Although your actual costs may be higher or lower, based on these assumptions your costs would be:
1 year 3 years 5 years 10 years Class 4 $106 $331 $574 $1,271
Portfolio turnover The fund pays transaction costs, such as commissions, when it buys and sells securities (or “turns over” its portfolio). A higher portfolio turnover rate may indicate higher transaction costs. These costs, which are not reflected in annual fund operating expenses or in the example, affect the fund’s investment results. During the most recent fiscal year, the fund’s portfolio turnover rate was 88% of the average value of its portfolio.
Principal investment strategies The fund normally will invest at least 90% of its assets in income-producing securities (with at least 50% of its assets in common stocks and other equity securities). The fund invests primarily in a broad range of income-producing securities, including common stocks and bonds. In seeking to provide a level of current income that exceeds the average yield on U.S. stocks, the fund generally looks to the average yield on stocks of companies listed on the S&P 500 Index. The fund may also invest significantly in common stocks, bonds and other securities of issuers domiciled outside the United States.
The investment adviser uses a system of multiple portfolio managers in managing the fund’s assets. Under this approach, the portfolio of the fund is divided into segments managed by individual managers who decide how their respective segments will be invested.
The fund relies on the professional judgment of its investment adviser to make decisions about the fund’s portfolio investments. The basic investment philosophy of the investment adviser is to seek to invest in attractively valued securities that, in its opinion, represent good, long-term investment opportunities. The investment adviser believes that an important way to accomplish this is through fundamental analysis, which may include meeting with company executives and employees, suppliers, customers and competitors. Securities may be sold when the investment adviser believes that they no longer represent relatively attractive investment opportunities.

American Funds Insurance Series / Prospectus 2
Principal risks
This section describes the principal risks associated with the fund’s principal investment strategies. You may lose money by investing in the fund. The likelihood of loss may be greater if you invest for a shorter period of time. Investors in the fund should have a long-term perspective and be able to tolerate potentially sharp declines in value.
Market conditions — The prices of, and the income generated by, the common stocks, bonds and other securities held by the fund may decline – sometimes rapidly or unpredictably – due to various factors, including events or conditions affecting the general economy or particular industries; overall market changes; local, regional or global political, social or economic instability; governmental or governmental agency responses to economic conditions; and currency exchange rate, interest rate and commodity price fluctuations.
Issuer risks — The prices of, and the income generated by, securities held by the fund may decline in response to various factors directly related to the issuers of such securities, including reduced demand for an issuer’s goods or services, poor management performance and strategic initiatives such as mergers, acquisitions or dispositions and the market response to any such initiatives.
Investing in income-oriented stocks — Income provided by the fund may be reduced by changes in the dividend policies of, and the capital resources available for dividend payments at, the companies in which the fund invests.
Investing in debt instruments — The prices of, and the income generated by, bonds and other debt securities held by the fund may be affected by changing interest rates and by changes in the effective maturities and credit ratings of these securities.
Rising interest rates will generally cause the prices of bonds and other debt securities to fall. Falling interest rates may cause an issuer to redeem, call or refinance a debt security before its stated maturity, which may result in the fund having to reinvest the proceeds in lower yielding securities. Longer maturity debt securities generally have greater sensitivity to changes in interest rates and may be subject to greater price fluctuations than shorter maturity debt securities.
Bonds and other debt securities are also subject to credit risk, which is the possibility that the credit strength of an issuer will weaken and/or an issuer of a debt security will fail to make timely payments of principal or interest and the security will go into default. Lower quality debt securities generally have higher rates of interest and may be subject to greater price fluctuations than higher quality debt securities. Credit risk is gauged, in part, by the credit ratings of the debt securities in which the fund invests. However, ratings are only the opinions of the rating agencies issuing them and are not guarantees as to credit quality or an evaluation of market risk. The fund’s investment adviser relies on its own credit analysts to research issuers and issues in seeking to mitigate various credit and default risks.
Investing outside the United States — Securities of issuers domiciled outside the United States, or with significant operations or revenues outside the United States, may lose value because of adverse political, social, economic or market developments (including social instability, regional conflicts, terrorism and war) in the countries or regions in which the issuers operate or generate revenue. These securities may also lose value due to changes in foreign currency exchange rates against the U.S. dollar and/or currencies of other countries. Issuers of these securities may be more susceptible to actions of foreign governments, such as the imposition of price controls or punitive taxes, that could adversely impact the value of these securities. Securities markets in certain countries may be more volatile and/or less liquid than those in the United States. Investments outside the United States may also be subject to different accounting practices and different regulatory, legal and reporting standards and practices, and may be more difficult to value, than those in the United States. In addition, the value of investments outside the United States may be reduced by foreign taxes, including foreign withholding taxes on interest and dividends. Further, there may be increased risks of delayed settlement of securities purchased or sold by the fund. The risks of investing outside the United States may be heightened in connection with investments in emerging markets.
Management — The investment adviser to the fund actively manages the fund’s investments. Consequently, the fund is subject to the risk that the methods and analyses employed by the investment adviser in this process may not produce the desired results. This could cause the fund to lose value or its investment results to lag relevant benchmarks or other funds with similar objectives.
Your investment in the fund is not a bank deposit and is not insured or guaranteed by the Federal Deposit Insurance Corporation or any other governmental agency, entity or person. You should consider how this fund fits into your overall investment program.

3 American Funds Insurance Series / Prospectus
Investment results The following bar chart shows how the investment results of the Class 4 shares of the fund have varied from year to year, and the following table shows how the fund’s average annual total returns for various periods compare with a broad measure of securities market results and other applicable measures of market results. This information provides some indication of the risks of investing in the fund. The 70%/30% MSCI ACWI/Bloomberg Barclays Index is a composite blend of 70% of the MSCI All Country World Index (ACWI) and 30% of the Bloomberg Barclays U.S. Aggregate Index and represents a broad measure of the global stock and bond markets, including market sectors in which the fund may invest. The Lipper Global Equity Income Funds Average includes funds that disclose investment objectives and/or strategies reasonably comparable to those of the fund. Past investment results (before and after taxes) are not predictive of future investment results. Figures shown reflect fees and expenses associated with an investment in the fund, but do not reflect insurance contract fees and expenses. If insurance contract fees and expenses were included, results would have been lower. Updated information on the fund’s investment results can be obtained by visiting americanfunds.com/afis.
Calendar year total returns
Highest/Lowest quarterly results during this period were:
Highest 4.48% (quarter ended March 31, 2017)
Lowest –5.09% (quarter ended September 30, 2015)
(%)
5
10
15
–10
0
–5
–15
–20’15 ’16 ’17
12.65
3.78
–1.79
Average annual total returns For the periods ended December 31, 2017: 1 year Lifetime
Fund (inception – 5/1/14) 12.65% 3.78% MSCI All Country World Index (reflects no deduction for sales charges, account fees, expenses or U.S. federal income taxes) 23.97 8.10
Bloomberg Barclays U.S. Aggregate Index (reflects no deduction for sales charges, account fees, expenses or U.S. federal income taxes) 3.54 2.64
70%/30% MSCI ACWI/Bloomberg Barclays Index (reflects no deduction for sales charges, account fees, expenses or U.S. federal income taxes) 17.50 6.55
Lipper Global Equity Income Funds Average (reflects no deduction for sales charges, account fees or U.S. federal income taxes) 17.29 5.42
Management Investment adviser Capital Research and Management CompanySM Portfolio managers The individuals primarily responsible for the portfolio management of the fund are:
Portfolio manager/ Series title (if applicable)
Portfolio manager experience in this fund
Primary title with investment adviser
David J. Betanzos 4 years Partner – Capital Fixed Income Investors Gerald Du Manoir 1 year Partner – Capital International Investors Steven T. Watson Less than 1 year Partner – Capital International Investors Philip Winston 4 years Partner – Capital International Investors
Tax information See your variable insurance contract prospectus for information regarding the federal income tax treatment of your variable insurance contract and related distributions.
Payments to broker-dealers and other financial intermediaries If you purchase shares of the fund through a broker-dealer or other financial intermediary (such as an insurance company), the fund and the fund’s distributor or its affiliates may pay the intermediary for the sale of fund shares and related services. These payments may create a conflict of interest by influencing the broker-dealer or other intermediary and your individual financial advisor to recommend the fund over another investment. Ask your individual financial advisor or visit your financial intermediary’s website for more information. The fund is not sold directly to the general public but instead is offered as an underlying investment option for variable insurance contracts. In addition to payments described above, the fund and its related companies may make payments to the sponsoring insurance company (or its affiliates) for distribution and/or other services. These payments may be a factor that the insurance company considers in including the fund as an underlying investment option in the variable insurance contract. The prospectus (or other offering document) for your variable insurance contract may contain additional information about these payments.

American Funds Insurance Series / Prospectus 4
Investment objectives, strategies and risks
Capital Income Builder The fund has two primary investment objectives. It seeks (1) to provide a level of current income that exceeds the average yield on U.S. stocks generally and (2) to provide a growing stream of income over the years. The fund’s secondary objective is to provide growth of capital. While it has no present intention to do so, the fund’s board may change the fund’s investment objectives without shareholder approval upon 60 days’ written notice to shareholders.
The fund invests primarily in a broad range of income-producing securities, including common stocks and bonds. In seeking to provide a level of current income that exceeds the average yield on U.S. stocks, the fund generally looks to the average yield on stocks of companies listed on the S&P 500 Index. The fund may also invest significantly in common stocks, bonds and other securities of issuers domiciled outside the United States, including developing countries.
The fund normally will invest at least 90% of its assets in income-producing securities (with at least 50% of its assets in common stocks and other equity securities, including preferred stocks and convertible preferred stocks). Generally, the fund may invest in common stocks of companies with a broad range of capitalizations. In addition, the fund may invest in bonds and other debt securities of any maturity or duration, including securities issued and guaranteed by the U.S. government, securities issued by federal agencies and instrumentalities and securities backed by mortgages or other assets. The fund’s debt obligations will consist primarily of investment-grade bonds (rated Baa3 or better or BBB- or better by Nationally Recognized Statistical Rating Organizations, or NRSROs, designated by the fund’s investment adviser or unrated but determined to be of equivalent quality by the fund’s investment adviser). The fund may invest to a limited extent in lower quality, higher yielding debt securities (rated Ba1 or below and BB+ or below by NRSROs or unrated but determined to be of equivalent quality by the fund’s investment adviser). Such securities are sometimes referred to as “junk bonds.”
The fund may also hold cash or money market instruments, including commercial paper and short-term securities issued by the U.S. government, its agencies and instrumentalities. The percentage of the fund invested in such holdings varies and depends on various factors, including market conditions and purchases and redemptions of fund shares. The investment adviser may determine that it is appropriate to invest a substantial portion of the fund’s assets in such instruments in response to certain circumstances, such as periods of market turmoil. In addition, for temporary defensive purposes, the fund may invest without limitation in such instruments. A larger amount of such holdings could moderate a fund’s investment results in a period of rising market prices. Alternatively, a larger percentage of such holdings could reduce the magnitude of a fund’s loss in a period of falling market prices and provide liquidity to make additional investments or to meet redemptions.
The following are principal risks associated with the fund’s investment strategies.
Market conditions — The prices of, and the income generated by, the common stocks, bonds and other securities held by the fund may decline – sometimes rapidly or unpredictably – due to various factors, including events or conditions affecting the general economy or particular industries; overall market changes; local, regional or global political, social or economic instability; governmental or governmental agency responses to economic conditions; and currency exchange rate, interest rate and commodity price fluctuations.
Issuer risks — The prices of, and the income generated by, securities held by the fund may decline in response to various factors directly related to the issuers of such securities, including reduced demand for an issuer’s goods or services, poor management performance and strategic initiatives such as mergers, acquisitions or dispositions and the market response to any such initiatives.
Investing in income-oriented stocks — Income provided by the fund may be reduced by changes in the dividend policies of, and the capital resources available for dividend payments at, the companies in which the fund invests.
Investing in debt instruments — The prices of, and the income generated by, bonds and other debt securities held by the fund may be affected by changing interest rates and by changes in the effective maturities and credit ratings of these securities.
Rising interest rates will generally cause the prices of bonds and other debt securities to fall. Falling interest rates may cause an issuer to redeem, call or refinance a debt security before its stated maturity, which may result in the fund having to reinvest the proceeds in lower yielding securities. Longer maturity debt securities generally have greater sensitivity to changes in interest rates and may be subject to greater price fluctuations than shorter maturity debt securities.
Bonds and other debt securities are also subject to credit risk, which is the possibility that the credit strength of an issuer will weaken and/or an issuer of a debt security will fail to make timely payments of principal or interest and the security will go into default. Lower quality debt securities generally have higher rates of interest and may be subject to greater price fluctuations than higher quality debt securities. Credit risk is gauged, in part, by the credit ratings of the debt securities in which the fund invests. However, ratings are only the opinions of the rating agencies issuing them and are not guarantees as to credit quality or an evaluation of market risk. The fund’s investment adviser relies on its own credit analysts to research issuers and issues in seeking to mitigate various credit and default risks.
Investing outside the United States — Securities of issuers domiciled outside the United States, or with significant operations or revenues outside the United States, may lose value because of adverse political, social, economic or market developments (including social instability, regional conflicts, terrorism and war) in the countries or regions in which the issuers operate or generate revenue. These securities may also lose value due to changes in foreign currency exchange rates against the U.S. dollar and/or currencies of other countries. Issuers of these securities may be more susceptible to actions of foreign governments, such as the imposition of price controls or punitive taxes, that could adversely impact the value of these securities. Securities markets in certain countries may be more volatile and/or less liquid than those in the United States. Investments outside the United States may also be subject to different accounting practices and different regulatory, legal and reporting standards and practices, and may be more difficult to value, than those in the United States. In addition, the value of investments outside the United States may be reduced by foreign taxes, including foreign withholding

5 American Funds Insurance Series / Prospectus
taxes on interest and dividends. Further, there may be increased risks of delayed settlement of securities purchased or sold by the fund. The risks of investing outside the United States may be heightened in connection with investments in emerging markets.
Management — The investment adviser to the fund actively manages the fund’s investments. Consequently, the fund is subject to the risk that the methods and analyses employed by the investment adviser in this process may not produce the desired results. This could cause the fund to lose value or its investment results to lag relevant benchmarks or other funds with similar objectives.
The following are certain additional risks associated with the fund’s investment strategies.
Investing in emerging markets — Investing in emerging markets may involve risks in addition to and greater than those generally associated with investing in the securities markets of developed countries. For instance, developing countries may have less developed legal and accounting systems than those in developed countries. The governments of these countries may be less stable and more likely to impose capital controls, nationalize a company or industry, place restrictions on foreign ownership and on withdrawing sale proceeds of securities from the country, and/or impose punitive taxes that could adversely affect the prices of securities. In addition, the economies of these countries may be dependent on relatively few industries that are more susceptible to local and global changes. Securities markets in these countries can also be relatively small and have substantially lower trading volumes. As a result, securities issued in these countries may be more volatile and less liquid, and may be more difficult to value, than securities issued in countries with more developed economies and/or markets. Less certainty with respect to security valuations may lead to additional challenges and risks in calculating the fund’s net asset value. Additionally, there may be increased settlement risks for transactions in local securities.
Exposure to country, region, industry or sector — Subject to the fund’s investment limitations, the fund may have significant exposure to a particular country, region, industry or sector. Such exposure may cause the fund to be more impacted by risks relating to the country, region, industry or sector than a fund without such levels of exposure. For example, if the fund has significant exposure in a particular country, then social, economic, regulatory or other issues that negatively affect that country may have a greater impact on the fund than on a fund that is more geographically diversified.
Interest rate risk — The values and liquidity of the securities held by the fund may be affected by changing interest rates. For example, the values of these securities may decline when interest rates rise and increase when interest rates fall. Longer maturity debt securities generally have greater sensitivity to changes in interest rates and may be subject to greater price fluctuations than shorter maturity debt securities. The fund may invest in variable and floating rate securities. Although the values of such securities are generally less sensitive to interest rate changes than those of other debt securities, the value of variable and floating rate securities may decline if their interest rates do not rise as quickly, or as much, as general interest rates. Conversely, floating rate securities will not generally increase in value if interest rates decline. During periods of extremely low short-term interest rates, the fund may not be able to maintain a positive yield and, given the current historically low interest rate environment, risks associated with rising rates are currently heightened.
Liquidity risk — Certain fund holdings may be deemed to be less liquid or illiquid because they cannot be readily sold without significantly impacting the value of the holdings. Liquidity risk may result from the lack of an active market for a holding, legal or contractual restrictions on resale, or the reduced number and capacity of market participants to make a market in such holding. Market prices for less liquid or illiquid holdings may be volatile, and reduced liquidity may have an adverse impact on the market price of such holdings. Additionally, the sale of less liquid or illiquid holdings may involve substantial delays (including delays in settlement) and additional costs and the fund may be unable to sell such holdings when necessary to meet its liquidity needs.
In addition to the principal investment strategies described above, the fund has other investment practices that are described in the statement of additional information, which includes a description of other risks related to the fund’s principal investment strategies and other investment practices. The fund’s investment results will depend on the ability of the fund’s investment adviser to navigate the risks discussed above as well as those described in the statement of additional information.
Fund comparative indexes — The MSCI All Country World Index is a free float-adjusted market capitalization-weighted index that is designed to measure equity market results in the global developed and emerging markets, consisting of more than 40 developed and emerging market country indexes. Results reflect dividends gross of withholding taxes through December 31, 2000, and dividends net of withholding taxes thereafter. This index is unmanaged, and its results include reinvested dividends and/or distributions but do not reflect the effect of sales charges, commissions, account fees, expenses or U.S. federal income taxes. The Bloomberg Barclays U.S. Aggregate Index represents the U.S. investment-grade fixed-rate bond market. This index is unmanaged, and its results include reinvested dividends and/or distributions but do not reflect the effect of sales charges, commissions, account fees, expenses or U.S. federal income taxes. The 70%/30% MSCI ACWI/Bloomberg Barclays Index blends the MSCI All Country World Index with the Bloomberg Barclays U.S. Aggregate Index by weighting their cumulative total returns at 70% and 30%, respectively. This assumes the blend is rebalanced monthly. The Lipper Global Equity Income Funds Average is composed of funds that, by prospectus language and portfolio practice, seek relatively high current income and growth of income by investing at least 65% of their portfolios in dividend-paying equity securities of domestic and foreign corporations. The results of the underlying funds in the average include the reinvestment of dividends and capital gain distributions, as well as brokerage commissions paid by the funds for portfolio transactions and other fund expenses, but do not reflect the effect of sales charges, account fees or U.S. federal income taxes.

American Funds Insurance Series / Prospectus 6
Management and organization Investment adviser Capital Research and Management Company, an experienced investment management organization founded in 1931, serves as the investment adviser to the Series and other mutual funds, including the American Funds. Capital Research and Management Company is a wholly owned subsidiary of The Capital Group Companies, Inc. and is located at 333 South Hope Street, Los Angeles, California 90071. Capital Research and Management Company manages the investment portfolios and business affairs of the Series. The total management fee paid by each fund to its investment adviser for the most recent fiscal year, in each case expressed as a percentage of average net assets of that fund, appears in the Annual Fund Operating Expenses table for each fund. Please see the statement of additional information for further details. A discussion regarding the basis for the approval of the Series’ Investment Advisory and Service Agreement by the Series’ board of trustees is contained in the Series’ annual report to shareholders for the fiscal year ended December 31, 2017.
Capital Research and Management Company manages equity assets through three equity investment divisions and fixed-income assets through its fixed-income investment division, Capital Fixed Income Investors. The three equity investment divisions — Capital World Investors, Capital Research Global Investors and Capital International Investors — make investment decisions independently of one another.
The equity investment divisions may, in the future, be incorporated as wholly owned subsidiaries of Capital Research and Management Company. In that event, Capital Research and Management Company would continue to be the investment adviser, and day-to-day investment management of equity assets would continue to be carried out through one or more of these subsidiaries. Although not currently contemplated, Capital Research and Management Company could incorporate its fixed-income investment division in the future and engage it to provide day-to-day investment management of fixed-income assets. Capital Research and Management Company and each of the funds it advises have received an exemptive order from the U.S. Securities and Exchange Commission that allows Capital Research and Management Company to use, upon approval of the funds’ boards, its management subsidiaries and affiliates to provide day-to-day investment management services to the funds, including making changes to the management subsidiaries and affiliates providing such services. The Series’ shareholders approved this arrangement; however, there is no assurance that Capital Research and Management Company will incorporate its investment divisions or exercise any authority granted to it under the exemptive order.
In addition, shareholders of the Series have approved a proposal to reorganize the Series into a Delaware statutory trust. However, the Series reserved the right to delay implementing the reorganization and has elected to do so.
Portfolio holdings A description of the funds’ policies and procedures regarding disclosure of information about their portfolio holdings is available in the statement of additional information.
The Capital SystemSM Capital Research and Management Company uses a system of multiple portfolio managers in managing mutual fund assets. Under this approach, the portfolio of a fund is divided into segments managed by individual managers who decide how their respective segments will be invested. In addition to the portfolio managers below, Capital Research and Management Company’s investment analysts may make investment decisions with respect to a portion of a fund’s portfolio. Investment decisions are subject to a fund’s objective(s), policies and restrictions and the oversight of the appropriate investment-related committees of Capital Research and Management Company and its investment divisions.
Certain senior members of Capital Fixed Income Investors, the investment adviser’s fixed income investment division, serve on the Portfolio Strategy Group. The group utilizes a research-driven process with input from the investment adviser’s analysts, portfolio managers and economists to define investment themes on a range of macroeconomic factors, including duration, yield curve and sector allocation. Where applicable, the investment decisions made by a fund’s fixed income portfolio managers are informed by the investment themes discussed by the group.

7 American Funds Insurance Series / Prospectus
The primary individual portfolio managers for each of the funds are:
Portfolio manager for the Series/Title (if applicable)
Primary title with investment adviser (or affiliate) and investment experience
Portfolio manager’s role in management of, and experience in, the fund(s)
Donald D. O’Neal Vice Chairman of the Board Partner – Capital Research Global Investors Investment professional for 33 years, all with Capital Research and Management Company or affiliate
Serves as an equity portfolio manager for: Growth-Income Fund — 13 years
Alan N. Berro President Partner – Capital World Investors Investment professional for 32 years in total; 27 years with Capital Research and Management Company or affiliate
Serves as an equity portfolio manager for: Asset Allocation Fund — 18 years
Carl M. Kawaja Vice President Partner – Capital World Investors Investment professional for 31 years in total; 27 years with Capital Research and Management Company or affiliate
Serves as an equity portfolio manager for: New World Fund — 19 years
Sung Lee Vice President Partner – Capital Research Global Investors Investment professional for 24 years, all with Capital Research and Management Company or affiliate
Serves as an equity portfolio manager for: International Fund — 12 years International Growth and Income Fund — 10 years
Dylan Yolles Vice President Partner – Capital International Investors Investment professional for 21 years in total; 18 years with Capital Research and Management Company or affiliate
Serves as an equity portfolio manager for: Growth-Income Fund — 13 years (plus 5 years of prior experience as an investment analyst for the fund)
Hilda L. Applbaum Partner – Capital World Investors Investment professional for 31 years in total; 23 years with Capital Research and Management Company or affiliate
Serves as an equity/fixed-income portfolio manager for: Global Balanced Fund — 7 years
Pramod Atluri Vice President – Capital Fixed Income Investors Investment professional for 20 years in total; 2 years with Capital Research and Management Company or affiliate
Serves as a fixed-income portfolio manager for: Bond Fund — 2 years
L. Alfonso Barroso Partner – Capital Research Global Investors Investment professional for 24 years, all with Capital Research and Management Company or affiliate
Serves as an equity portfolio manager for: International Fund — 9 years
David J. Betanzos Partner – Capital Fixed Income Investors Investment professional for 18 years in total; 16 years with Capital Research and Management Company or affiliate
Serves as a fixed-income portfolio manager for: Capital Income Builder — 4 years Mortgage Fund — 4 years U.S. Government/AAA-Rated Securities Fund — 3 years
Mark A. Brett Partner – Capital Fixed Income Investors Investment professional for 39 years in total; 25 years with Capital Research and Management Company or affiliate
Serves as a fixed-income portfolio manager for: Global Balanced Fund — 7 years Global Bond Fund — 3 years
Christopher D. Buchbinder Partner – Capital Research Global Investors Investment professional for 23 years, all with Capital Research and Management Company or affiliate
Serves as an equity portfolio manager for: Blue Chip Income and Growth Fund — 11 years
Mark L. Casey Partner – Capital World Investors Investment professional for 18 years, all with Capital Research and Management Company or affiliate
Serves as an equity portfolio manager for: Growth Fund — 1 year (plus 11 years of prior experience as an investment analyst for the fund)
Thomas H. Chow Vice President – Capital Fixed Income Investors Investment professional for 29 years in total; 3 years with Capital Research and Management Company or affiliate
Serves as a fixed-income portfolio manager for: High-Income Bond Fund — 3 years
Patrice Collette Partner – Capital World Investors Investment professional for 24 years in total, 18 years with Capital Research and Management Company or affiliate
Serves as an equity portfolio manager for: Global Growth Fund — 3 years (plus 14 years of prior experience as an investment analyst for the fund)
David A. Daigle Partner – Capital Fixed Income Investors Investment professional for 24 years, all with Capital Research and Management Company or affiliate
Serves as a fixed-income portfolio manager for: Asset Allocation Fund — 9 years Global Bond Fund — 3 years High-Income Bond Fund — 9 years (plus 9 years of prior experience as an investment analyst for the fund)
Gerald Du Manoir Partner – Capital International Investors Investment professional for 28 years, all with Capital Research and Management Company or affiliate
Serves as an equity portfolio manager for: Capital Income Builder — 1 year
Paul Flynn Partner – Capital World Investors Investment professional for 22 years in total; 20 years with Capital Research and Management Company or affiliate
Serves as an equity portfolio manager for: Global Growth Fund — 1 year Global Balanced Fund — 5 years
J. Blair Frank Partner – Capital Research Global Investors Investment professional for 25 years in total; 24 years with Capital Research and Management Company or affiliate
Serves as an equity portfolio manager for: Global Small Capitalization Fund — 15 years Growth-Income Fund — 12 years

American Funds Insurance Series / Prospectus 8
Portfolio manager for the Series/Title (if applicable)
Primary title with investment adviser (or affiliate) and investment experience
Portfolio manager’s role in management of, and experience in, the fund(s)
Bradford F. Freer Partner – Capital World Investors Investment professional for 26 years in total; 24 years with Capital Research and Management Company or affiliate
Serves as an equity portfolio manager for: New World Fund — 1 year (plus 13 years of prior experience as an investment analyst for the fund) Global Growth and Income Fund — 4 years (plus 6 years of prior experience as an investment analyst for the fund)
Nicholas J. Grace Partner – Capital World Investors Investment professional for 28 years in total; 24 years with Capital Research and Management Company or affiliate
Serves as an equity portfolio manager for: New World Fund — 6 years (plus 8 years of prior experience as an investment analyst for the fund) Global Growth and Income Fund — 2 years
David A. Hoag Partner – Capital Fixed Income Investors Investment professional for 30 years in total; 27 years with Capital Research and Management Company or affiliate
Serves as a fixed-income portfolio manager for: Bond Fund — 11 years
Thomas H. Høgh Partner – Capital Fixed Income Investors Investment professional for 31 years in total; 28 years with Capital Research and Management Company or affiliate
Serves as a fixed-income portfolio manager for: Global Bond Fund — 12 years
Claudia P. Huntington Partner – Capital Research Global Investors Investment professional for 45 years in total; 43 years with Capital Research and Management Company or affiliate
Serves as an equity portfolio manager for: Global Small Capitalization Fund — 5 years Growth-Income Fund — 24 years (plus 5 years of prior experience as an investment analyst for the fund)
Michael T. Kerr Partner – Capital World Investors Investment professional for 35 years in total; 33 years with Capital Research and Management Company or affiliate
Serves as an equity portfolio manager for: Growth Fund — 13 years
Jonathan Knowles Partner – Capital World Investors Investment professional for 26 years, all with Capital Research and Management Company or affiliate
Serves as an equity portfolio manager for: Global Growth Fund — 5 years (plus 10 years of prior experience as an investment analyst for the fund)
Lawrence Kymisis Partner – Capital Research Global Investors Investment professional for 23 years in total; 15 years with Capital Research and Management Company or affiliate
Serves as an equity portfolio manager for: Global Small Capitalization Fund — 6 years
Harold H. La Partner – Capital Research Global Investors Investment professional for 20 years in total; 19 years with Capital Research and Management Company or affiliate
Serves as an equity portfolio manager for: Global Small Capitalization Fund — 10 years (plus 4 years of prior experience as an investment analyst for the fund)
Jeffrey T. Lager Partner – Capital World Investors Investment professional for 23 years in total; 22 years with Capital Research and Management Company or affiliate
Serves as an equity portfolio manager for: Asset Allocation Fund — 11 years
Steven D. Lotwin Partner – Capital Fixed Income Investors Investment professional for 17 years, all with Capital Research and Management Company or affiliate
Serves as a fixed-income portfolio manager for: Ultra-Short Bond Fund — Less than 1 year
James B. Lovelace Partner – Capital Research Global Investors Investment professional for 36 years, all with Capital Research and Management Company or affiliate
Serves as an equity portfolio manager for: Blue Chip Income and Growth Fund — 11 years
Jesper Lyckeus Partner – Capital Research Global Investors Investment professional for 23 years in total; 22 years with Capital Research and Management Company or affiliate
Serves as an equity portfolio manager for: International Fund — 11 years (plus 8 years of prior experience as an investment analyst for the fund) International Growth and Income Fund — 10 years
Fergus N. MacDonald Partner – Capital Fixed Income Investors Investment professional for 26 years in total; 15 years with Capital Research and Management Company or affiliate
Serves as a fixed-income portfolio manager for: Mortgage Fund — 7 years U.S. Government/AAA-Rated Securities Fund — 8 years
James R. Mulally Partner – Capital Fixed Income Investors Investment professional for 42 years in total; 38 years with Capital Research and Management Company or affiliate
Serves as a fixed-income portfolio manager for: Asset Allocation Fund — 12 years
Robert H. Neithart Partner – Capital Fixed Income Investors Investment professional for 31 years, all with Capital Research and Management Company or affiliate
Serves as a fixed-income portfolio manager for: New World Fund — 6 years (plus 2 years of prior experience as an investment analyst for the fund) Global Balanced Fund — 7 years Global Bond Fund — 5 years
Aidan O’Connell Partner – Capital Research Global Investors Investment professional for 20 years in total; 14 years with Capital Research and Management Company or affiliate
Serves as an equity portfolio manager for: Global Small Capitalization Fund — 4 years (plus 9 years of prior experience as an investment analyst for the fund)
John R. Queen Partner – Capital Fixed Income Investors Investment professional for 27 years in total; 15 years with Capital Research and Management Company or affiliate
Serves as a fixed-income portfolio manager for: Asset Allocation Fund — 2 years
9 American Funds Insurance Series / Prospectus
Portfolio manager for the Series/Title (if applicable)
Primary title with investment adviser (or affiliate) and investment experience
Portfolio manager’s role in management of, and experience in, the fund(s)
Andraz Razen Partner – Capital World Investors Investment professional for 20 years in total; 14 years with Capital Research and Management Company or affiliate
Serves as an equity portfolio manager for: Growth Fund — 5 years (plus 3 years of prior experience as an investment analyst for the fund)
David M. Riley Partner – Capital Research Global Investors Investment professional for 24 years, all with Capital Research and Management Company or affiliate
Serves as an equity portfolio manager for: International Growth and Income Fund — 10 years
William L. Robbins Partner – Capital International Investors Investment professional for 26 years in total; 23 years with Capital Research and Management Company or affiliate
Serves as an equity portfolio manager for: Growth-Income Fund — 6 years (plus 12 years of prior experience as an investment analyst for the fund)
Martin Romo Partner – Capital World Investors Investment professional for 26 years in total; 25 years with Capital Research and Management Company or affiliate
Serves as an equity portfolio manager for: Growth Fund — 2 years (plus 15 years of prior experience as an investment analyst for the fund) Global Growth and Income Fund — 9 years (plus 1 year of prior experience as an investment analyst for the fund)
Andrew B. Suzman Partner – Capital World Investors Investment professional for 25 years, all with Capital Research and Management Company or affiliate
Serves as an equity portfolio manager for: Global Growth and Income Fund — 9 years
Tomonori Tani Partner – Capital World Investors Investment professional for 17 years in total; 14 years with Capital Research and Management Company or affiliate
Serves as an equity portfolio manager for: Global Balanced Fund — 1 year
James Terrile Partner – Capital Research Global Investors Investment professional for 23 years in total; 22 years with Capital Research and Management Company or affiliate
Serves as an equity portfolio manager for: Blue Chip Income and Growth Fund — 6 years
Christopher Thomsen Partner – Capital Research Global Investors Investment professional for 21 years, all with Capital Research and Management Company or affiliate
Serves as an equity portfolio manager for: International Fund — 12 years
Ritchie Tuazon Vice President – Capital Fixed Income Investors Investment professional for 18 years in total; 7 years with Capital Research and Management Company or affiliate
Serves as a fixed-income portfolio manager for: U.S. Government/AAA-Rated Securities Fund — 3 years
Shannon Ward Vice President – Capital Fixed Income Investors Investment professional for 26 years in total; 1 year with Capital Research and Management Company or affiliate
Serves as a fixed-income portfolio manager for: High-Income Bond Fund — 1 year
Steven T. Watson Partner – Capital International Investors Investment professional for 31 years in total; 28 years with Capital Research and Management Company or affiliate
Serves as an equity portfolio manager for: Capital Income Builder — Less than 1 year
Gregory W. Wendt Partner – Capital Research Global Investors Investment professional for 31 years, all with Capital Research and Management Company or affiliate
Serves as an equity portfolio manager for: Global Small Capitalization Fund — 6 years (plus 14 years of prior experience as an investment analyst for the fund)
Alan J. Wilson Partner – Capital World Investors Investment professional for 33 years in total; 27 years with Capital Research and Management Company or affiliate
Serves as an equity portfolio manager for: Growth Fund — 4 years
Philip Winston Partner – Capital International Investors Investment professional for 33 years in total; 21 years with Capital Research and Management Company or affiliate
Serves as an equity portfolio manager for: Capital Income Builder — 4 years
Information regarding the portfolio managers’ compensation, their ownership of securities in the Series and other accounts they manage is in the statement of additional information.

American Funds Insurance Series / Prospectus 10
Purchases and redemptions of shares Shares of the Series are currently offered only to insurance company separate accounts as well as so-called “feeder funds” under master-feeder arrangements sponsored by insurance companies as underlying investments for such insurance companies’ variable annuity contracts and variable life insurance policies. All such shares may be purchased or redeemed by the insurance company separate accounts (or feeder funds) at net asset value without any sales or redemption charges. These purchases and redemptions are made at the price next determined after such purchases and redemptions of units of the separate accounts (or feeder funds). The Series typically expects to pay redemption proceeds one business day following receipt and acceptance of a redemption order. However, payment may take longer than one business day and may take up to seven days as generally permitted by the Investment Company Act of 1940, as amended (“1940 Act”). Under the 1940 Act, the Series may be permitted to pay redemption proceeds beyond seven days under certain limited circumstances.
Under normal conditions, the Series typically expects to meet shareholder redemptions by monitoring the Series’ portfolio and redemption activities and by regularly holding a reserve of highly liquid assets, such as cash or cash equivalents. The Series may use additional methods to meet shareholder redemptions, if they become necessary. These methods may include, but are not limited to, the sale of portfolio assets, the use of overdraft protection afforded by the Series’ custodian bank, borrowing from a line of credit and making payment with fund securities or other fund assets rather than in cash (as further discussed in the following paragraph).
Although payment of redemptions normally will be in cash, the Series may pay the redemption price wholly or partly with portfolio securities or other fund assets under conditions and circumstances determined by the Series’ board of trustees. On the same redemption date, some shareholders may be paid in whole or in part in securities (which may differ among those shareholders), while other shareholders may be paid entirely in cash. The disposal of the securities received in-kind may be subject to brokerage costs and, until sold, such securities remain at market risk and liquidity risk, including the risk that such securities are or become difficult to sell. If the Series pays your redemption with illiquid or less liquid securities, you will bear the risk of not being able to sell such securities.

11 American Funds Insurance Series / Prospectus
Frequent trading of fund shares The Series and American Funds Distributors, Inc., the Series’ distributor, reserve the right to reject any purchase order for any reason. The funds are not designed to serve as vehicles for frequent trading. Frequent trading of fund shares may lead to increased costs to the funds and less efficient management of the funds’ portfolios, potentially resulting in dilution of the value of the shares held by long-term shareholders. Accordingly, purchases, including those that are part of exchange activity, that the Series or American Funds Distributors has determined could involve actual or potential harm to a fund may be rejected.
The Series, through its transfer agent, American Funds Service Company, has agreements with the Series’ insurance relationships to maintain its surveillance procedures that are designed to detect frequent trading in fund shares. The agreements generally require the insurance companies to (i) provide, upon request from a fund, the Series or their agent, certain identifying and account information regarding contract owners who invest in fund shares through an insurance company account and (ii) execute instructions from a fund, the Series or their agent to restrict further purchases or exchanges of fund shares by a contract owner who the Series has identified as having engaged in potentially harmful market timing or frequent trading. Under these procedures, various analytics are used to evaluate factors that may be indicative of frequent trading. For example, transactions in fund shares that exceed certain monetary thresholds may be scrutinized. American Funds Service Company may work with the insurance company separate accounts or feeder funds to apply their procedures that American Funds Service Company believes are reasonably designed to enforce the frequent trading policies of the Series. You should refer to disclosures provided by the insurance company with which you have a contract to determine the specific trading restrictions that apply to you.
Under its procedures, American Funds Service Company also may review transactions that occur close in time to other transactions in the same account or in multiple accounts under common ownership or influence. Trading activity that is identified through these procedures or as a result of any other information available to the funds will be evaluated to determine whether such activity might constitute frequent trading. These procedures may be modified from time to time as appropriate to improve the detection of frequent trading, to facilitate monitoring for frequent trading in particular retirement plans or other accounts and to comply with applicable laws.
In addition to the Series’ broad ability to restrict potentially harmful trading as described previously, the Series’ board of trustees has adopted a “purchase blocking policy” under which any contract owner redeeming units representing a beneficial interest in any fund other than Ultra-Short Bond Fund (including redemptions that are part of an exchange transaction) having a value of $5,000 or more will be precluded from investing units of beneficial interest in that fund (including investments that are part of an exchange transaction) for 30 calendar days after the redemption transaction. Under this purchase blocking policy, certain purchases will not be prevented and certain redemptions will not trigger a purchase block, such as:
• purchases and redemptions of units representing a beneficial interest in a fund having a value of less than $5,000;
• retirement plan contributions, loans and distributions (including hardship withdrawals) identified as such on the retirement plan recordkeeper’s system;
• purchases and redemptions in community foundation accounts;
• purchase transactions involving in-kind transfers of fund shares, if the entity maintaining the contract owner’s account is able to identify the transaction as one of these types of transactions; and
• systematic redemptions and purchases if the entity maintaining the contract owner’s account is able to identify the transaction as a systematic redemption or purchase.
Generally, purchases and redemptions will not be considered “systematic” unless the transaction is prescheduled for a specific date.
The Series reserves the right to waive the purchase blocking policy if American Funds Service Company determines that its surveillance procedures are adequate to detect frequent trading in fund shares in such accounts.
If American Funds Service Company identifies any activity that may constitute frequent trading, it reserves the right to contact the insurance company separate account or feeder fund and request that the separate account or feeder fund either provide information regarding an account owner’s transactions or restrict the account owner’s trading. If American Funds Service Company is not satisfied that insurance company separate account or feeder fund has taken appropriate action, American Funds Service Company may terminate the separate account’s or feeder fund’s ability to transact in fund shares.
There is no guarantee that all instances of frequent trading in fund shares will be prevented.
Notwithstanding the Series’ surveillance procedures and purchase blocking policy described above, all transactions in fund shares remain subject to the right of the Series, American Funds Distributors and American Funds Service Company to restrict potentially abusive trading generally (including the types of transactions described above that will not be prevented or trigger a block under the purchase blocking policy). See the statement of additional information for more information about how American Funds Service Company may address other potentially abusive trading activity in the Series.
Valuing shares The net asset value of each share class of a fund is the value of a single share of that class. Each fund calculates the net asset value each day the New York Stock Exchange is open for trading as of approximately 4 p.m. New York time, the normal close of regular trading. If, for example, the New York Stock Exchange closes at 1 p.m. New York time, the funds’ net asset values would still be determined as of 4 p.m. New York time. In this example, portfolio securities traded on the New York Stock Exchange would be valued at their closing prices unless the investment adviser determines that a “fair value” adjustment is appropriate due to subsequent events.
Equity securities are valued primarily on the basis of market quotations, and debt securities are valued primarily on the basis of prices from third-party pricing services. Futures contracts are valued primarily on the basis of settlement prices. The funds have adopted procedures for making fair value determinations if market quotations or prices from third-party pricing services, as applicable, are not readily available
American Funds Insurance Series / Prospectus 12
or are not considered reliable. For example, if events occur between the close of markets outside the United States and the close of regular trading on the New York Stock Exchange that, in the opinion of the investment adviser, materially affect the value of any of the funds’ equity securities that trade principally in those international markets, those securities will be valued in accordance with fair value procedures. Similarly, fair value procedures may be employed if an issuer defaults on its debt securities and there is no market for its securities. Use of these procedures is intended to result in more appropriate net asset values and, where applicable, to reduce potential arbitrage opportunities otherwise available to short-term investors.
Because certain of the funds may hold securities that are listed primarily on foreign exchanges that trade on weekends or days when the funds do not price their shares, the values of securities held in the funds may change on days when you will not be able to purchase or redeem fund shares.
Shares of the funds will be purchased or sold at the net asset value next determined after receipt of requests from the appropriate insurance company. Requests received by the appropriate insurance company prior to 4 p.m. New York time and communicated by the insurance company to the Series or its agent will be purchased or sold at that day’s net asset value.
Plan of distribution The Series has adopted a plan of distribution or “12b-1 plan” for Class 4 shares. Under the plan, the Series may finance activities primarily intended to sell shares, provided the categories of expenses are approved in advance by the Series’ board of trustees. The plan provides for annual expenses of .25% for Class 4 shares. Amounts paid under the 12b-1 plan are used by insurance company contract issuers to cover distribution expenses and/or the expenses of certain contract owner services. The 12b-1 fees paid by the Series, as a percentage of average net assets, for the most recent fiscal year, are indicated in the prospectus in the Annual Fund Operating Expenses table for each fund. Since these fees are paid out of the Series’ assets on an ongoing basis, over time they may cost you more than paying other types of sales charges or service fees and reduce the return of an investment in Class 4 shares.
Fund expenses In periods of market volatility, assets of the funds may decline significantly, causing total annual fund operating expenses (as a percentage of the value of your investment) to become higher than the numbers shown in the Annual Fund Operating Expenses tables in this prospectus.
The “Other expenses” items in the Annual Fund Operating Expenses tables in this prospectus are based on expenses as of each fund’s most recently completed fiscal year. These items include third-party expenses, such as custodial, legal, audit, accounting, regulatory reporting and pricing vendor services, and an administrative services fee payable to the Series’ investment adviser for administrative services provided by the Series’ investment adviser and its affiliates. In addition, the “Other expenses” items for Class 4 shares include fees for administrative services provided by the insurance companies that include Class 4 shares of any of the funds as underlying investments in their variable contracts. Each fund will pay an insurance administration fee of .25% of Class 4 share assets to these insurance companies for providing certain services pursuant to an insurance administrative services plan adopted by the Series.
For all share classes, “Other expenses” items in the Annual Fund Operating Expenses table in this prospectus include fees for administrative services provided by the fund’s investment adviser and its affiliates. Administrative services are provided by the investment adviser and its affiliates to help assist third parties providing non-distribution services to fund shareholders. These services include providing in depth information on the fund and market developments that impact fund investments. Administrative services also include, but are not limited to, coordinating, monitoring, assisting and overseeing third parties that provide services to fund shareholders.
The Administrative Services Agreement between the fund and the investment adviser provides the fund the ability to charge an administrative services fee of .05% for all share classes. The fund's investment adviser currently receives an administrative services fee at the annual rate of .01% of the average daily net assets of the fund attributable to all share classes (which could be increased as noted above).
Investment results All fund results in the “Investment results” section of this prospectus reflect the reinvestment of dividends and capital gains distributions, if any. Unless otherwise noted, fund results reflect any fee waivers and/or expense reimbursements in effect during the period presented.
Distributions and taxes Each fund of the Series intends to qualify as a “regulated investment company” under the Internal Revenue Code. In any fiscal year in which a fund so qualifies and distributes to shareholders its investment company taxable income and net realized capital gain, the fund itself is relieved of federal income tax.
It is the Series’ policy to distribute to the shareholders (the insurance company separate accounts) all of its investment company taxable income and capital gain for each fiscal year.
See the applicable contract prospectus for information regarding the federal income tax treatment of the contracts and distributions to the separate accounts.

13 American Funds Insurance Series / Prospectus
Financial highlights The Financial Highlights table is intended to help you understand a fund’s results for the past five fiscal years. For Ultra-Short Bond Fund, the table includes information for periods prior to the fund's conversion on May 1, 2016 from a cash management fund to an ultra-short-term bond fund. Certain information reflects financial results for a single share of a particular class. The total returns in the table represent the rate that an investor would have earned or lost on an investment in a fund (assuming reinvestment of all dividends and capital gain distributions). Where indicated, figures in the table reflect the impact, if any, of certain waivers from Capital Research and Management Company. For more information about these waivers, see the fund’s statement of additional information and annual report. The information in the Financial Highlights table has been audited by PricewaterhouseCoopers LLP, whose current report, along with the funds’ financial statements, is included in the statement of additional information, which is available upon request. Figures shown do not reflect insurance contract fees and expenses. If insurance contract fees and expenses were reflected, results would be lower.
Income (loss) from investment operations1 Dividends and distributions
Period ended
Net asset value,
beginning of period
Net investment
income (loss)
Net gains (losses) on securities
(both realized
and unrealized)
Total from investment operations
Dividends (from net
investment income)
Distributions (from
capital gains)
Total dividends
and distributions
Net asset value, end of period
Total return
Net assets, end of period
(in millions)
Ratio of expenses
to average net assets
Ratio of net
income (loss) to average
net assets
Global Growth Fund
Class 1:
12/31/17 $24.05 $.26 $7.30 $7.56 $(.26) $ (.84) $(1.10) $30.51 31.80% $2,010 .55% .94% 12/31/16 26.39 .25 (.14) .11 (.29) (2.16) (2.45) 24.05 .87 1,630 .56 1.00 12/31/15 27.48 .25 1.80 2.05 (.35) (2.79) (3.14) 26.39 7.24 1,626 .55 .90 12/31/14 30.11 .312 .40 .71 (.40) (2.94) (3.34) 27.48 2.52 1,558 .55 1.082 12/31/13 23.58 .31 6.62 6.93 (.40) — (.40) 30.11 29.51 1,508 .55 1.17
Class 1A: 12/31/173,4 24.50 .11 6.94 7.05 (.25) (.84) (1.09) 30.46 29.135 2 .806 .396
Class 2: 12/31/17 23.85 .19 7.23 7.42 (.19) (.84) (1.03) 30.24 31.47 4,012 .80 .69 12/31/16 26.19 .18 (.14) .04 (.22) (2.16) (2.38) 23.85 .62 3,483 .81 .76 12/31/15 27.30 .18 1.78 1.96 (.28) (2.79) (3.07) 26.19 6.94 3,817 .80 .66 12/31/14 29.92 .242 .41 .65 (.33) (2.94) (3.27) 27.30 2.31 3,992 .80 .852 12/31/13 23.44 .24 6.58 6.82 (.34) — (.34) 29.92 29.18 4,379 .80 .91
Class 4: 12/31/17 23.81 .10 7.22 7.32 (.16) (.84) (1.00) 30.13 31.11 211 1.05 .37 12/31/16 26.16 .12 (.14) (.02) (.17) (2.16) (2.33) 23.81 .37 94 1.06 .50 12/31/15 27.34 .09 1.81 1.90 (.29) (2.79) (3.08) 26.16 6.69 91 1.05 .34 12/31/14 30.07 .072 .50 .57 (.36) (2.94) (3.30) 27.34 2.01 19 1.05 .262 12/31/13 23.58 .13 6.77 6.90 (.41) — (.41) 30.07 29.36 1 1.06 .43
Global Small Capitalization Fund
Class 1: 12/31/17 $20.24 $.12 $5.17 $5.29 $(.15) $ — $ (.15) $25.38 26.22% $1,639 .73% .54% 12/31/16 24.41 .12 .17 .29 (.11) (4.35) (4.46) 20.24 2.35 1,532 .74 .57 12/31/15 26.09 .04 .36 .40 — (2.08) (2.08) 24.41 .50 1,706 .73 .15 12/31/14 25.69 .09 .52 .61 (.09) (.12) (.21) 26.09 2.36 1,411 .74 .34 12/31/13 20.16 .04 5.70 5.74 (.21) — (.21) 25.69 28.60 1,241 .74 .17
Class 1A: 12/31/173,4 20.70 .08 4.71 4.79 (.13) — (.13) 25.36 23.195 —7 .966 .356
Class 2: 12/31/17 19.72 .06 5.04 5.10 (.10) — (.10) 24.72 25.89 2,551 .98 .27 12/31/16 23.90 .07 .15 .22 (.05) (4.35) (4.40) 19.72 2.10 2,303 .99 .31 12/31/15 25.64 (.03) .37 .34 — (2.08) (2.08) 23.90 .27 2,492 .98 (.10) 12/31/14 25.25 .03 .51 .54 (.03) (.12) (.15) 25.64 2.12 2,738 .99 .10 12/31/13 19.86 (.01) 5.60 5.59 (.20) — (.20) 25.25 28.28 2,955 .99 (.05)
Class 4: 12/31/17 19.91 —8 5.09 5.09 (.09) — (.09) 24.91 25.62 125 1.23 —9 12/31/16 24.11 .01 .16 .17 (.02) (4.35) (4.37) 19.91 1.85 42 1.24 .03 12/31/15 25.92 (.10) .37 .27 — (2.08) (2.08) 24.11 (.02) 34 1.23 (.37) 12/31/14 25.57 (.05) .54 .49 (.02) (.12) (.14) 25.92 1.88 12 1.24 (.17) 12/31/13 20.16 (.12) 5.74 5.62 (.21) — (.21) 25.57 28.01 4 1.24 (.50)

American Funds Insurance Series / Prospectus 14
Income (loss) from investment operations1 Dividends and distributions
Period ended
Net asset value,
beginning of period
Net investment
income (loss)
Net gains (losses) on securities
(both realized
and unrealized)
Total from investment operations
Dividends (from net
investment income)
Distributions (from
capital gains)
Total dividends
and distributions
Net asset value, end of period
Total return
Net assets, end of period
(in millions)
Ratio of expenses
to average net assets
Ratio of net
income (loss) to average
net assets
Growth Fund
Class 1: 12/31/17 $67.29 $.55 $17.89 $18.44 $ (.55) $(7.33) $ (7.88) $77.85 28.62% $ 8,100 .35% .75% 12/31/16 68.02 .67 5.40 6.07 (.67) (6.13) (6.80) 67.29 9.77 6,931 .35 1.03 12/31/15 80.15 .64 5.08 5.72 (.61) (17.24) (17.85) 68.02 7.12 6,796 .35 .87 12/31/14 78.54 .882 5.79 6.67 (1.16) (3.90) (5.06) 80.15 8.78 7,118 .35 1.122 12/31/13 60.90 .64 17.84 18.48 (.84) — (.84) 78.54 30.43 7,003 .35 .93
Class 1A:
12/31/173,4 68.84 .35 16.38 16.73 (.50) (7.33) (7.83) 77.74 25.475 3 .596 .476
Class 2:
12/31/17 66.92 .37 17.76 18.13 (.37) (7.33) (7.70) 77.35 28.28 15,716 .60 .50 12/31/16 67.69 .51 5.36 5.87 (.51) (6.13) (6.64) 66.92 9.49 13,978 .60 .78 12/31/15 79.84 .46 5.06 5.52 (.43) (17.24) (17.67) 67.69 6.86 14,414 .60 .62 12/31/14 77.94 .682 5.75 6.43 (.63) (3.90) (4.53) 79.84 8.51 15,413 .60 .872 12/31/13 60.45 .47 17.68 18.15 (.66) — (.66) 77.94 30.11 16,334 .60 .68
Class 3: 12/31/17 67.67 .42 17.98 18.40 (.42) (7.33) (7.75) 78.32 28.39 212 .53 .57 12/31/16 68.37 .56 5.42 5.98 (.55) (6.13) (6.68) 67.67 9.56 183 .53 .85 12/31/15 80.47 .51 5.11 5.62 (.48) (17.24) (17.72) 68.37 6.92 194 .53 .69 12/31/14 78.62 .742 5.79 6.53 (.78) (3.90) (4.68) 80.47 8.58 208 .53 .942 12/31/13 60.97 .52 17.84 18.36 (.71) — (.71) 78.62 30.20 216 .53 .75
Class 4: 12/31/17 66.41 .18 17.61 17.79 (.31) (7.33) (7.64) 76.56 27.99 954 .85 .25 12/31/16 67.26 .34 5.32 5.66 (.38) (6.13) (6.51) 66.41 9.22 458 .85 .53 12/31/15 79.74 .29 5.02 5.31 (.55) (17.24) (17.79) 67.26 6.59 394 .85 .42 12/31/14 78.32 .372 5.87 6.24 (.92) (3.90) (4.82) 79.74 8.25 24 .85 .472 12/31/13 60.90 .29 17.90 18.19 (.77) — (.77) 78.32 29.96 5 .85 .40
International Fund
Class 1:
12/31/17 $16.82 $.26 $ 5.16 $ 5.42 $(.30) $ (.23) $ (.53) $21.71 32.46% $5,014 .53% 1.33% 12/31/16 18.08 .27 .30 .57 (.28) (1.55) (1.83) 16.82 3.78 3,652 .54 1.57 12/31/15 20.35 .29 (1.03) (.74) (.35) (1.18) (1.53) 18.08 (4.25) 3,427 .54 1.41 12/31/14 21.22 .30 (.81) (.51) (.36) — (.36) 20.35 (2.41) 3,282 .54 1.43 12/31/13 17.68 .27 3.59 3.86 (.32) — (.32) 21.22 21.91 3,324 .54 1.41
Class 1A: 12/31/173,4 17.17 .09 4.93 5.02 (.29) (.23) (.52) 21.67 29.465 2 .776 .436
Class 2: 12/31/17 16.76 .22 5.13 5.35 (.25) (.23) (.48) 21.63 32.14 4,422 .78 1.10 12/31/16 18.02 .23 .30 .53 (.24) (1.55) (1.79) 16.76 3.53 3,710 .79 1.35 12/31/15 20.29 .24 (1.03) (.79) (.30) (1.18) (1.48) 18.02 (4.53) 3,978 .79 1.17 12/31/14 21.15 .25 (.81) (.56) (.30) — (.30) 20.29 (2.65) 4,374 .79 1.19 12/31/13 17.62 .22 3.58 3.80 (.27) — (.27) 21.15 21.64 5,916 .79 1.15
Class 3: 12/31/17 16.85 .23 5.17 5.40 (.27) (.23) (.50) 21.75 32.23 31 .71 1.17 12/31/16 18.11 .24 .30 .54 (.25) (1.55) (1.80) 16.85 3.57 27 .72 1.42 12/31/15 20.38 .25 (1.03) (.78) (.31) (1.18) (1.49) 18.11 (4.44) 32 .72 1.24 12/31/14 21.24 .27 (.82) (.55) (.31) — (.31) 20.38 (2.56) 38 .72 1.28 12/31/13 17.70 .23 3.59 3.82 (.28) — (.28) 21.24 21.67 46 .72 1.22
Class 4: 12/31/17 16.64 .11 5.16 5.27 (.26) (.23) (.49) 21.42 31.89 289 1.03 .55 12/31/16 17.93 .18 .29 .47 (.21) (1.55) (1.76) 16.64 3.21 66 1.04 1.03 12/31/15 20.23 .17 (1.00) (.83) (.29) (1.18) (1.47) 17.93 (4.75) 46 1.04 .88 12/31/14 21.16 .07 (.68) (.61) (.32) — (.32) 20.23 (2.88) 18 1.04 .31 12/31/13 17.68 (.01) 3.79 3.78 (.30) — (.30) 21.16 21.48 2 1.04 (.07)

15 American Funds Insurance Series / Prospectus
Income (loss) from investment operations1 Dividends and distributions
Period ended
Net asset value,
beginning of
period
Net investment
income (loss)
Net gains (losses) on securities
(both realized
and unrealized)
Total from investment operations
Dividends (from net
investment income)
Distributions (from capital gains)
Total dividends
and distributions
Net asset value, end of period
Total return
Net assets, end of period
(in millions)
Ratio of
expenses to average net assets
Ratio of net
income (loss) to average
net assets
New World Fund
Class 1: 12/31/17 $19.72 $.26 $5.59 $5.85 $(.27) — $ (.27) $25.30 29.73% $2,050 .77% 1.14% 12/31/16 18.87 .24 .81 1.05 (.20) — (.20) 19.72 5.59 1,743 .78 1.25 12/31/15 20.72 .19 (.71) (.52) (.17) (1.16) (1.33) 18.87 (2.96) 1,562 .79 .92 12/31/14 25.08 .292 (1.92) (1.63) (.29) (2.44) (2.73) 20.72 (7.63) 1,433 .78 1.232 12/31/13 22.93 .34 2.31 2.65 (.39) (.11) (.50) 25.08 11.66 1,388 .78 1.45
Class 1A:
12/31/173,4 20.14 .13 5.24 5.37 (.26) — (.26) 25.25 26.725 1 1.006 .536
Class 2:
12/31/17 19.54 .20 5.55 5.75 (.22) — (.22) 25.07 29.44 1,055 1.02 .89 12/31/16 18.71 .19 .79 .98 (.15) — (.15) 19.54 5.26 911 1.03 1.00 12/31/15 20.54 .14 (.69) (.55) (.12) (1.16) (1.28) 18.71 (3.14) 961 1.04 .68 12/31/14 24.88 .242 (1.91) (1.67) (.23) (2.44) (2.67) 20.54 (7.87) 1,084 1.03 1.012 12/31/13 22.75 .28 2.29 2.57 (.33) (.11) (.44) 24.88 11.38 1,307 1.03 1.22
Class 4: 12/31/17 19.51 .14 5.52 5.66 (.18) — (.18) 24.99 29.06 427 1.27 .61 12/31/16 18.69 .14 .80 .94 (.12) — (.12) 19.51 5.04 240 1.28 .75 12/31/15 20.56 .08 (.68) (.60) (.11) (1.16) (1.27) 18.69 (3.37) 171 1.29 .39 12/31/14 24.99 .092 (1.83) (1.74) (.25) (2.44) (2.69) 20.56 (8.13) 64 1.28 .402 12/31/13 22.93 .14 2.41 2.55 (.38) (.11) (.49) 24.99 11.20 8 1.29 .56
Blue Chip Income and Growth Fund
Class 1: 12/31/17 $13.53 $.32 $1.96 $2.28 $(.32) $ (.53) $ (.85) $14.96 17.30% $5,581 .41% 2.27% 12/31/16 12.62 .31 1.97 2.28 (.29) (1.08) (1.37) 13.53 19.06 5,099 .41 2.39 12/31/15 14.69 .31 (.64) (.33) (.29) (1.45) (1.74) 12.62 (2.72) 3,638 .41 2.23 12/31/14 13.12 .462 1.59 2.05 (.48) — (.48) 14.69 15.69 3,542 .42 3.312 12/31/13 10.05 .27 3.06 3.33 (.26) — (.26) 13.12 33.26 2,814 .42 2.27
Class 1A: 12/31/173,4 13.75 .28 1.75 2.03 (.31) (.53) (.84) 14.94 15.215 1 .656 2.016
Class 2: 12/31/17 13.39 .28 1.94 2.22 (.28) (.53) (.81) 14.80 17.04 3,551 .66 2.02 12/31/16 12.51 .28 1.94 2.22 (.26) (1.08) (1.34) 13.39 18.70 3,412 .66 2.16 12/31/15 14.57 .27 (.62) (.35) (.26) (1.45) (1.71) 12.51 (2.93) 3,228 .66 1.97 12/31/14 13.02 .442 1.55 1.99 (.44) — (.44) 14.57 15.36 3,722 .67 3.142 12/31/13 9.97 .23 3.05 3.28 (.23) — (.23) 13.02 33.00 3,755 .67 2.03
Class 4:
12/31/17 13.39 .25 1.93 2.18 (.27) (.53) (.80) 14.77 16.70 247 .91 1.76 12/31/16 12.53 .24 1.96 2.20 (.26) (1.08) (1.34) 13.39 18.49 132 .91 1.81 12/31/15 14.63 .24 (.63) (.39) (.26) (1.45) (1.71) 12.53 (3.21) 32 .91 1.75 12/31/14 13.12 .342 1.63 1.97 (.46) — (.46) 14.63 15.13 9 .92 2.332 12/31/13 10.05 .18 3.15 3.33 (.26) — (.26) 13.12 33.27 —7 .86 1.39
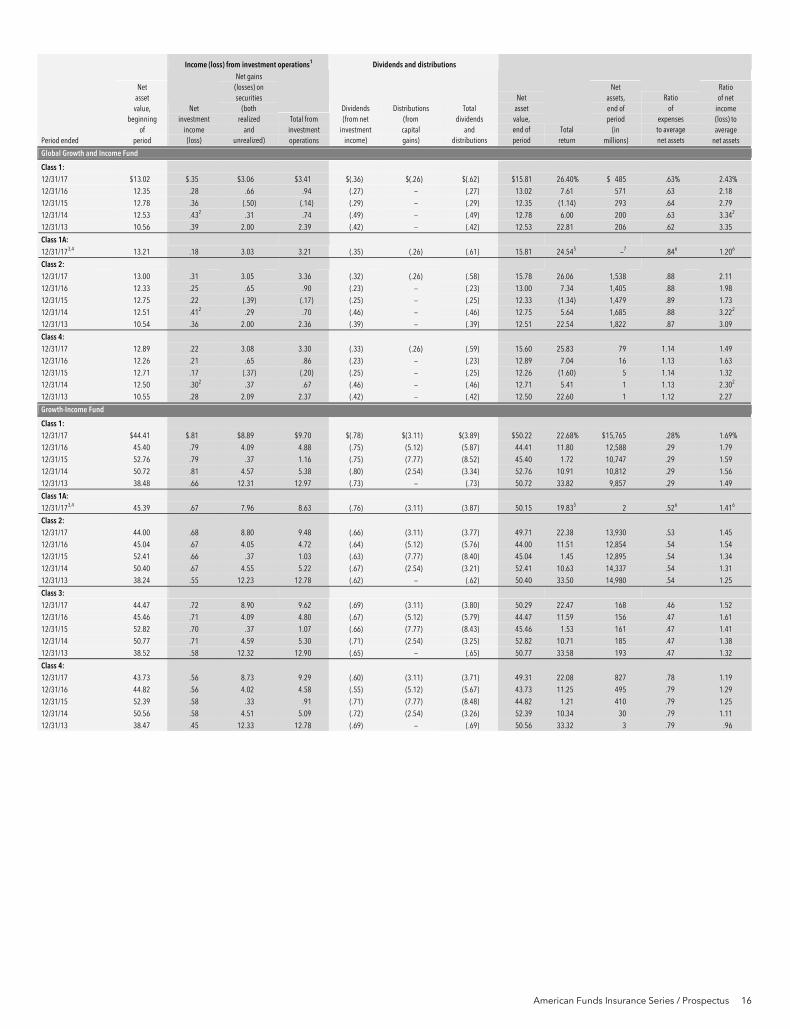
American Funds Insurance Series / Prospectus 16
Income (loss) from investment operations1 Dividends and distributions
Period ended
Net asset value,
beginning of
period
Net investment
income (loss)
Net gains (losses) on securities
(both realized
and unrealized)
Total from investment operations
Dividends (from net
investment income)
Distributions (from capital gains)
Total dividends
and distributions
Net asset value, end of period
Total return
Net assets, end of period
(in millions)
Ratio of
expenses to average net assets
Ratio of net
income (loss) to average
net assets
Global Growth and Income Fund
Class 1: 12/31/17 $13.02 $.35 $3.06 $3.41 $(.36) $(.26) $(.62) $15.81 26.40% $ 485 .63% 2.43% 12/31/16 12.35 .28 .66 .94 (.27) — (.27) 13.02 7.61 571 .63 2.18 12/31/15 12.78 .36 (.50) (.14) (.29) — (.29) 12.35 (1.14) 293 .64 2.79 12/31/14 12.53 .432 .31 .74 (.49) — (.49) 12.78 6.00 200 .63 3.342 12/31/13 10.56 .39 2.00 2.39 (.42) — (.42) 12.53 22.81 206 .62 3.35
Class 1A:
12/31/173,4 13.21 .18 3.03 3.21 (.35) (.26) (.61) 15.81 24.545 —7 .846 1.206
Class 2:
12/31/17 13.00 .31 3.05 3.36 (.32) (.26) (.58) 15.78 26.06 1,538 .88 2.11 12/31/16 12.33 .25 .65 .90 (.23) — (.23) 13.00 7.34 1,405 .88 1.98 12/31/15 12.75 .22 (.39) (.17) (.25) — (.25) 12.33 (1.34) 1,479 .89 1.73 12/31/14 12.51 .412 .29 .70 (.46) — (.46) 12.75 5.64 1,685 .88 3.222 12/31/13 10.54 .36 2.00 2.36 (.39) — (.39) 12.51 22.54 1,822 .87 3.09
Class 4: 12/31/17 12.89 .22 3.08 3.30 (.33) (.26) (.59) 15.60 25.83 79 1.14 1.49 12/31/16 12.26 .21 .65 .86 (.23) — (.23) 12.89 7.04 16 1.13 1.63 12/31/15 12.71 .17 (.37) (.20) (.25) — (.25) 12.26 (1.60) 5 1.14 1.32 12/31/14 12.50 .302 .37 .67 (.46) — (.46) 12.71 5.41 1 1.13 2.302 12/31/13 10.55 .28 2.09 2.37 (.42) — (.42) 12.50 22.60 1 1.12 2.27
Growth-Income Fund
Class 1: 12/31/17 $44.41 $.81 $8.89 $9.70 $(.78) $(3.11) $(3.89) $50.22 22.68% $15,765 .28% 1.69% 12/31/16 45.40 .79 4.09 4.88 (.75) (5.12) (5.87) 44.41 11.80 12,588 .29 1.79 12/31/15 52.76 .79 .37 1.16 (.75) (7.77) (8.52) 45.40 1.72 10,747 .29 1.59 12/31/14 50.72 .81 4.57 5.38 (.80) (2.54) (3.34) 52.76 10.91 10,812 .29 1.56 12/31/13 38.48 .66 12.31 12.97 (.73) — (.73) 50.72 33.82 9,857 .29 1.49
Class 1A: 12/31/173,4 45.39 .67 7.96 8.63 (.76) (3.11) (3.87) 50.15 19.835 2 .526 1.416
Class 2: 12/31/17 44.00 .68 8.80 9.48 (.66) (3.11) (3.77) 49.71 22.38 13,930 .53 1.45 12/31/16 45.04 .67 4.05 4.72 (.64) (5.12) (5.76) 44.00 11.51 12,854 .54 1.54 12/31/15 52.41 .66 .37 1.03 (.63) (7.77) (8.40) 45.04 1.45 12,895 .54 1.34 12/31/14 50.40 .67 4.55 5.22 (.67) (2.54) (3.21) 52.41 10.63 14,337 .54 1.31 12/31/13 38.24 .55 12.23 12.78 (.62) — (.62) 50.40 33.50 14,980 .54 1.25
Class 3:
12/31/17 44.47 .72 8.90 9.62 (.69) (3.11) (3.80) 50.29 22.47 168 .46 1.52 12/31/16 45.46 .71 4.09 4.80 (.67) (5.12) (5.79) 44.47 11.59 156 .47 1.61 12/31/15 52.82 .70 .37 1.07 (.66) (7.77) (8.43) 45.46 1.53 161 .47 1.41 12/31/14 50.77 .71 4.59 5.30 (.71) (2.54) (3.25) 52.82 10.71 185 .47 1.38 12/31/13 38.52 .58 12.32 12.90 (.65) — (.65) 50.77 33.58 193 .47 1.32
Class 4: 12/31/17 43.73 .56 8.73 9.29 (.60) (3.11) (3.71) 49.31 22.08 827 .78 1.19 12/31/16 44.82 .56 4.02 4.58 (.55) (5.12) (5.67) 43.73 11.25 495 .79 1.29 12/31/15 52.39 .58 .33 .91 (.71) (7.77) (8.48) 44.82 1.21 410 .79 1.25 12/31/14 50.56 .58 4.51 5.09 (.72) (2.54) (3.26) 52.39 10.34 30 .79 1.11 12/31/13 38.47 .45 12.33 12.78 (.69) — (.69) 50.56 33.32 3 .79 .96

17 American Funds Insurance Series / Prospectus
Income (loss) from investment operations1 Dividends and distributions
Period ended
Net asset value,
beginning of
period
Net investment
income (loss)
Net gains (losses) on securities
(both realized
and unrealized)
Total from investment operations
Dividends (from net
investment income)
Distributions (from capital gains)
Total dividends
and distributions
Net asset value, end of period
Total return
Net assets, end of period
(in millions)
Ratio of
expenses to average net assets
Ratio of net
income (loss) to average
net assets
International Growth and Income Fund
Class 1: 12/31/17 $14.48 $.46 $3.20 $3.66 $(.42) — $(.42) $17.72 25.31% $1,121 .66% 2.75% 12/31/16 14.72 .43 (.19) .24 (.42) (.06) (.48) 14.48 1.71 820 .68 2.93 12/31/15 16.27 .42 (1.25) (.83) (.38) (.34) (.72) 14.72 (5.34) 707 .68 2.60 12/31/14 17.48 .582 (1.09) (.51) (.53) (.17) (.70) 16.27 (2.93) 740 .68 3.322 12/31/13 15.29 .44 2.50 2.94 (.47) (.28) (.75) 17.48 19.39 696 .69 2.63
Class 1A:
12/31/173,4 14.69 .34 3.08 3.42 (.41) — (.41) 17.70 23.365 2 .916 1.996
Class 2:
12/31/17 14.43 .43 3.17 3.60 (.37) — (.37) 17.66 25.03 276 .91 2.60 12/31/16 14.68 .40 (.21) .19 (.38) (.06) (.44) 14.43 1.44 244 .93 2.72 12/31/15 16.22 .38 (1.24) (.86) (.34) (.34) (.68) 14.68 (5.60) 254 .93 2.32 12/31/14 17.43 .562 (1.10) (.54) (.50) (.17) (.67) 16.22 (3.15) 248 .93 3.212 12/31/13 15.25 .38 2.51 2.89 (.43) (.28) (.71) 17.43 19.09 257 .94 2.28
Class 4: 12/31/17 14.38 .37 3.18 3.55 (.35) — (.35) 17.58 24.72 63 1.16 2.24 12/31/16 14.63 .36 (.19) .17 (.36) (.06) (.42) 14.38 1.18 37 1.18 2.43 12/31/15 16.19 .33 (1.23) (.90) (.32) (.34) (.66) 14.63 (5.82) 32 1.18 2.02 12/31/14 17.45 .262 (.85) (.59) (.50) (.17) (.67) 16.19 (3.39) 20 1.18 1.522 12/31/13 15.29 .03 2.87 2.90 (.46) (.28) (.74) 17.45 19.16 1 1.19 .18
Capital Income Builder
Class 1: 12/31/17 $ 9.46 $.32 $ .93 $1.25 $(.31) — $(.31) $10.40 13.29% $254 .54% 3.21% 12/31/16 9.40 .32 .07 .39 (.33) — (.33) 9.46 4.17 156 .54 3.39 12/31/15 9.81 .28 (.40) (.12) (.29) — (.29) 9.40 (1.23) 80 .56 2.88 12/31/143,9 10.00 .19 (.18) .01 (.19) (.01) (.20) 9.81 .125 20 .566 2.876
Class 1A: 12/31/173,4 9.57 .27 .84 1.11 (.29) — (.29) 10.39 11.725 1 .796 2.636
Class 2: 12/31/17 9.46 .29 .93 1.22 (.28) — (.28) 10.40 13.04 1 .79 2.82 12/31/16 9.40 .27 .11 .38 (.32) — (.32) 9.46 4.08 —7 .80 2.82 12/31/15 9.81 .31 (.43) (.12) (.29) — (.29) 9.40 (1.23)11 —7 .4611 3.1211 12/31/143,9 10.00 .20 (.19) .01 (.19) (.01) (.20) 9.81 .125,11 —7 .476,11 2.946,11
Class 4:
12/31/17 9.45 .27 .92 1.19 (.26) — (.26) 10.38 12.65 338 1.04 2.72 12/31/16 9.38 .27 .08 .35 (.28) — (.28) 9.45 3.78 256 1.04 2.88 12/31/15 9.80 .25 (.42) (.17) (.25) — (.25) 9.38 (1.79) 157 1.05 2.55 12/31/143,9 10.00 .14 (.16) (.02) (.17) (.01) (.18) 9.80 (.21)5 55 1.066 2.086
Asset Allocation Fund
Class 1: 12/31/17 $21.68 $.44 $3.06 $3.50 $(.41) $(1.06) $(1.47) $23.71 16.51% $16,556 .29% 1.90% 12/31/16 20.62 .42 1.54 1.96 (.39) (.51) (.90) 21.68 9.69 13,008 .29 1.97 12/31/15 22.23 .40 (.02) .38 (.40) (1.59) (1.99) 20.62 1.64 10,913 .29 1.85 12/31/14 22.49 .44 .81 1.25 (.39) (1.12) (1.51) 22.23 5.66 11,997 .30 1.95 12/31/13 18.43 .35 4.07 4.42 (.36) — (.36) 22.49 24.04 10,515 .31 1.71
Class 1A: 12/31/173,4 21.97 .39 2.78 3.17 (.39) (1.06) (1.45) 23.69 14.785 4 .536 1.696
Class 2: 12/31/17 21.49 .37 3.04 3.41 (.35) (1.06) (1.41) 23.49 16.23 5,480 .54 1.64 12/31/16 20.45 .36 1.53 1.89 (.34) (.51) (.85) 21.49 9.41 5,144 .54 1.72 12/31/15 22.06 .34 (.01) .33 (.35) (1.59) (1.94) 20.45 1.40 5,008 .54 1.60 12/31/14 22.33 .37 .81 1.18 (.33) (1.12) (1.45) 22.06 5.40 5,494 .55 1.69 12/31/13 18.31 .30 4.03 4.33 (.31) — (.31) 22.33 23.69 5,760 .56 1.47
Class 3: 12/31/17 21.70 .39 3.07 3.46 (.37) (1.06) (1.43) 23.73 16.29 38 .47 1.72 12/31/16 20.64 .38 1.54 1.92 (.35) (.51) (.86) 21.70 9.49 35 .47 1.79 12/31/15 22.25 .36 (.02) .34 (.36) (1.59) (1.95) 20.64 1.46 36 .47 1.67 12/31/14 22.51 .39 .81 1.20 (.34) (1.12) (1.46) 22.25 5.47 40 .48 1.76 12/31/13 18.45 .32 4.06 4.38 (.32) — (.32) 22.51 23.81 42 .49 1.54
Class 4:
12/31/17 21.43 .32 3.02 3.34 (.31) (1.06) (1.37) 23.40 15.91 3,582 .79 1.40 12/31/16 20.40 .31 1.53 1.84 (.30) (.51) (.81) 21.43 9.16 2,861 .79 1.47 12/31/15 22.11 .30 (.02) .28 (.40) (1.59) (1.99) 20.40 1.14 2,414 .79 1.45 12/31/14 22.46 .34 .79 1.13 (.36) (1.12) (1.48) 22.11 5.16 32 .80 1.55 12/31/13 18.43 .27 4.12 4.39 (.36) — (.36) 22.46 23.89 1 .79 1.22

American Funds Insurance Series / Prospectus 18
Income (loss) from investment operations1 Dividends and distributions
Period ended
Net asset value,
beginning of
period
Net investment
income (loss)
Net gains (losses) on securities
(both realized
and unrealized)
Total from investment operations
Dividends (from net
investment income)
Distributions (from capital gains)
Total dividends
and distributions
Net asset value, end of period
Total return
Net assets, end of period
(in millions)
Ratio of
expenses to average net assets
Ratio of net
income (loss) to average
net assets
Global Balanced Fund
Class 1: 12/31/17 $11.08 $.21 $1.99 $2.20 $(.15) $(.38) $(.53) $12.75 19.91% $ 93 .72% 1.68% 12/31/16 10.74 .19 .32 .51 (.17) — (.17) 11.08 4.73 64 .72 1.73 12/31/15 11.11 .20 (.28) (.08) (.14) (.15) (.29) 10.74 (.69) 47 .72 1.80 12/31/14 11.37 .252 (.03) .22 (.18) (.30) (.48) 11.11 1.87 37 .71 2.142 12/31/13 10.34 .22 1.07 1.29 (.18) (.08) (.26) 11.37 12.56 36 .70 2.05
Class 1A:
12/31/173,4 11.18 .16 1.92 2.08 (.14) (.38) (.52) 12.74 18.715 —7 .946 1.276
Class 2:
12/31/17 11.06 .18 1.98 2.16 (.12) (.38) (.50) 12.72 19.57 210 .96 1.43 12/31/16 10.72 .16 .32 .48 (.14) — (.14) 11.06 4.48 178 .97 1.48 12/31/15 11.09 .18 (.28) (.10) (.12) (.15) (.27) 10.72 (.95) 171 .97 1.60 12/31/14 11.35 .222 (.03) .19 (.15) (.30) (.45) 11.09 1.63 179 .96 1.882 12/31/13 10.33 .20 1.06 1.26 (.16) (.08) (.24) 11.35 12.23 156 .95 1.79
Class 4: 12/31/17 11.00 .13 1.99 2.12 (.11) (.38) (.49) 12.63 19.38 51 1.22 1.07 12/31/16 10.69 .12 .33 .45 (.14) — (.14) 11.00 4.21 10 1.24 1.12 12/31/15 11.09 .06 (.17) (.11) (.14) (.15) (.29) 10.69 (1.00) 1 1.34 .58 12/31/14 11.35 .242 (.02) .22 (.18) (.30) (.48) 11.09 1.8811 —7 .6711 2.072,11 12/31/13 10.33 .22 1.06 1.28 (.18) (.08) (.26) 11.35 12.4911 —7 .7111 1.9811
Bond Fund
Class 1: 12/31/17 $10.80 $.24 $ .18 $ .42 $(.24) $(.16) $(.40) $10.82 3.88% $6,434 .38% 2.19% 12/31/16 10.70 .21 .14 .35 (.21) (.04) (.25) 10.80 3.27 6,829 .38 1.91 12/31/15 11.08 .22 (.17) .05 (.21) (.22) (.43) 10.70 .45 5,731 .38 1.95 12/31/14 10.73 .23 .37 .60 (.25) —8 (.25) 11.08 5.59 4,977 .39 2.03 12/31/13 11.29 .22 (.43) (.21) (.23) (.12) (.35) 10.73 (1.89) 4,506 .39 2.01
Class 1A: 12/31/173,4 10.82 .22 .15 .37 (.23) (.16) (.39) 10.80 3.465 1 .626 2.016
Class 2: 12/31/17 10.67 .21 .18 .39 (.21) (.16) (.37) 10.69 3.67 3,966 .63 1.94 12/31/16 10.58 .18 .13 .31 (.18) (.04) (.22) 10.67 2.95 3,959 .63 1.65 12/31/15 10.95 .18 (.15) .03 (.18) (.22) (.40) 10.58 .28 4,135 .63 1.69 12/31/14 10.61 .20 .36 .56 (.22) —8 (.22) 10.95 5.28 4,565 .64 1.79 12/31/13 11.17 .19 (.43) (.24) (.20) (.12) (.32) 10.61 (2.16) 4,763 .64 1.76
Class 4:
12/31/17 10.70 .19 .16 .35 (.21) (.16) (.37) 10.68 3.29 297 .88 1.72 12/31/16 10.61 .15 .15 .30 (.17) (.04) (.21) 10.70 2.80 102 .88 1.41 12/31/15 11.01 .16 (.16) — (.18) (.22) (.40) 10.61 (.08) 59 .88 1.47 12/31/14 10.69 .16 .39 .55 (.23) —8 (.23) 11.01 5.15 29 .89 1.43 12/31/13 11.29 .17 (.43) (.26) (.22) (.12) (.34) 10.69 (2.34) 3 .89 1.58
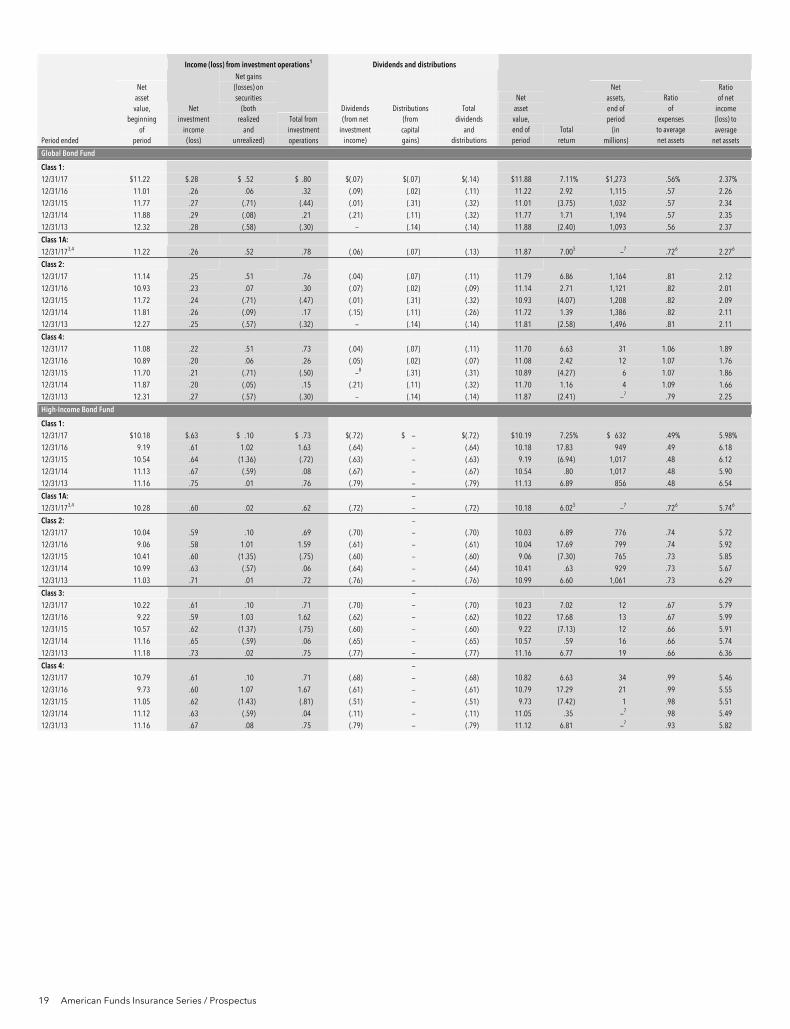
19 American Funds Insurance Series / Prospectus
Income (loss) from investment operations1 Dividends and distributions
Period ended
Net asset value,
beginning of
period
Net investment
income (loss)
Net gains (losses) on securities
(both realized
and unrealized)
Total from investment operations
Dividends (from net
investment income)
Distributions (from capital gains)
Total dividends
and distributions
Net asset value, end of period
Total return
Net assets, end of period
(in millions)
Ratio of
expenses to average net assets
Ratio of net
income (loss) to average
net assets
Global Bond Fund
Class 1: 12/31/17 $11.22 $.28 $ .52 $ .80 $(.07) $(.07) $(.14) $11.88 7.11% $1,273 .56% 2.37% 12/31/16 11.01 .26 .06 .32 (.09) (.02) (.11) 11.22 2.92 1,115 .57 2.26 12/31/15 11.77 .27 (.71) (.44) (.01) (.31) (.32) 11.01 (3.75) 1,032 .57 2.34 12/31/14 11.88 .29 (.08) .21 (.21) (.11) (.32) 11.77 1.71 1,194 .57 2.35 12/31/13 12.32 .28 (.58) (.30) — (.14) (.14) 11.88 (2.40) 1,093 .56 2.37
Class 1A:
12/31/173,4 11.22 .26 .52 .78 (.06) (.07) (.13) 11.87 7.005 —7 .726 2.276
Class 2:
12/31/17 11.14 .25 .51 .76 (.04) (.07) (.11) 11.79 6.86 1,164 .81 2.12 12/31/16 10.93 .23 .07 .30 (.07) (.02) (.09) 11.14 2.71 1,121 .82 2.01 12/31/15 11.72 .24 (.71) (.47) (.01) (.31) (.32) 10.93 (4.07) 1,208 .82 2.09 12/31/14 11.81 .26 (.09) .17 (.15) (.11) (.26) 11.72 1.39 1,386 .82 2.11 12/31/13 12.27 .25 (.57) (.32) — (.14) (.14) 11.81 (2.58) 1,496 .81 2.11
Class 4: 12/31/17 11.08 .22 .51 .73 (.04) (.07) (.11) 11.70 6.63 31 1.06 1.89 12/31/16 10.89 .20 .06 .26 (.05) (.02) (.07) 11.08 2.42 12 1.07 1.76 12/31/15 11.70 .21 (.71) (.50) —8 (.31) (.31) 10.89 (4.27) 6 1.07 1.86 12/31/14 11.87 .20 (.05) .15 (.21) (.11) (.32) 11.70 1.16 4 1.09 1.66 12/31/13 12.31 .27 (.57) (.30) — (.14) (.14) 11.87 (2.41) —7 .79 2.25
High-Income Bond Fund
Class 1: 12/31/17 $10.18 $.63 $ .10 $ .73 $(.72) $ — $(.72) $10.19 7.25% $ 632 .49% 5.98% 12/31/16 9.19 .61 1.02 1.63 (.64) — (.64) 10.18 17.83 949 .49 6.18 12/31/15 10.54 .64 (1.36) (.72) (.63) — (.63) 9.19 (6.94) 1,017 .48 6.12 12/31/14 11.13 .67 (.59) .08 (.67) — (.67) 10.54 .80 1,017 .48 5.90 12/31/13 11.16 .75 .01 .76 (.79) — (.79) 11.13 6.89 856 .48 6.54
Class 1A: — 12/31/173,4 10.28 .60 .02 .62 (.72) — (.72) 10.18 6.025 —7 .726 5.746
Class 2: — 12/31/17 10.04 .59 .10 .69 (.70) — (.70) 10.03 6.89 776 .74 5.72 12/31/16 9.06 .58 1.01 1.59 (.61) — (.61) 10.04 17.69 799 .74 5.92 12/31/15 10.41 .60 (1.35) (.75) (.60) — (.60) 9.06 (7.30) 765 .73 5.85 12/31/14 10.99 .63 (.57) .06 (.64) — (.64) 10.41 .63 929 .73 5.67 12/31/13 11.03 .71 .01 .72 (.76) — (.76) 10.99 6.60 1,061 .73 6.29
Class 3: —
12/31/17 10.22 .61 .10 .71 (.70) — (.70) 10.23 7.02 12 .67 5.79 12/31/16 9.22 .59 1.03 1.62 (.62) — (.62) 10.22 17.68 13 .67 5.99 12/31/15 10.57 .62 (1.37) (.75) (.60) — (.60) 9.22 (7.13) 12 .66 5.91 12/31/14 11.16 .65 (.59) .06 (.65) — (.65) 10.57 .59 16 .66 5.74 12/31/13 11.18 .73 .02 .75 (.77) — (.77) 11.16 6.77 19 .66 6.36
Class 4: — 12/31/17 10.79 .61 .10 .71 (.68) — (.68) 10.82 6.63 34 .99 5.46 12/31/16 9.73 .60 1.07 1.67 (.61) — (.61) 10.79 17.29 21 .99 5.55 12/31/15 11.05 .62 (1.43) (.81) (.51) — (.51) 9.73 (7.42) 1 .98 5.51 12/31/14 11.12 .63 (.59) .04 (.11) — (.11) 11.05 .35 —7 .98 5.49 12/31/13 11.16 .67 .08 .75 (.79) — (.79) 11.12 6.81 —7 .93 5.82
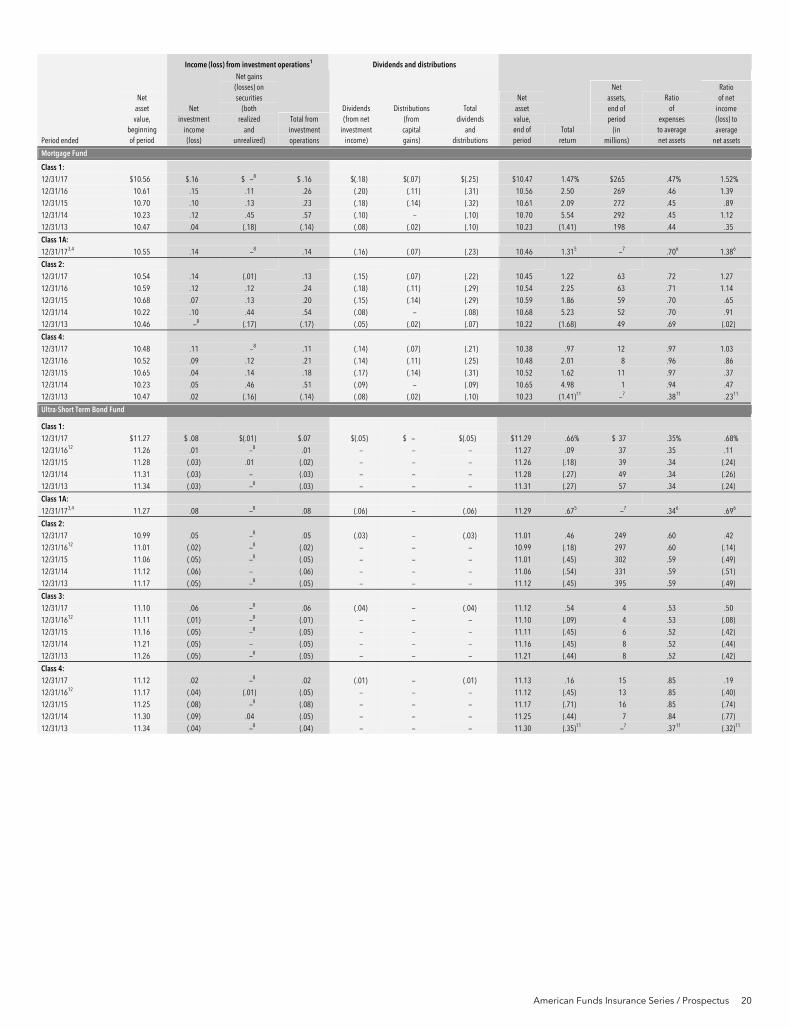
American Funds Insurance Series / Prospectus 20
Income (loss) from investment operations1 Dividends and distributions
Period ended
Net asset value,
beginning of period
Net investment
income (loss)
Net gains (losses) on securities
(both realized
and unrealized)
Total from investment operations
Dividends (from net
investment income)
Distributions (from capital gains)
Total dividends
and distributions
Net asset value, end of period
Total return
Net assets, end of period
(in millions)
Ratio of
expenses to average net assets
Ratio of net
income (loss) to average
net assets
Mortgage Fund
Class 1: 12/31/17 $10.56 $.16 $ —8 $ .16 $(.18) $(.07) $(.25) $10.47 1.47% $265 .47% 1.52% 12/31/16 10.61 .15 .11 .26 (.20) (.11) (.31) 10.56 2.50 269 .46 1.39 12/31/15 10.70 .10 .13 .23 (.18) (.14) (.32) 10.61 2.09 272 .45 .89 12/31/14 10.23 .12 .45 .57 (.10) — (.10) 10.70 5.54 292 .45 1.12 12/31/13 10.47 .04 (.18) (.14) (.08) (.02) (.10) 10.23 (1.41) 198 .44 .35
Class 1A:
12/31/173,4 10.55 .14 —8 .14 (.16) (.07) (.23) 10.46 1.315 —7 .706 1.386
Class 2:
12/31/17 10.54 .14 (.01) .13 (.15) (.07) (.22) 10.45 1.22 63 .72 1.27 12/31/16 10.59 .12 .12 .24 (.18) (.11) (.29) 10.54 2.25 63 .71 1.14 12/31/15 10.68 .07 .13 .20 (.15) (.14) (.29) 10.59 1.86 59 .70 .65 12/31/14 10.22 .10 .44 .54 (.08) — (.08) 10.68 5.23 52 .70 .91 12/31/13 10.46 —8 (.17) (.17) (.05) (.02) (.07) 10.22 (1.68) 49 .69 (.02)
Class 4: 12/31/17 10.48 .11 —8 .11 (.14) (.07) (.21) 10.38 .97 12 .97 1.03 12/31/16 10.52 .09 .12 .21 (.14) (.11) (.25) 10.48 2.01 8 .96 .86 12/31/15 10.65 .04 .14 .18 (.17) (.14) (.31) 10.52 1.62 11 .97 .37 12/31/14 10.23 .05 .46 .51 (.09) — (.09) 10.65 4.98 1 .94 .47 12/31/13 10.47 .02 (.16) (.14) (.08) (.02) (.10) 10.23 (1.41)11 —7 .3811 .2311
Ultra-Short Term Bond Fund
Class 1: 12/31/17 $11.27 $ .08 $(.01) $.07 $(.05) $ — $(.05) $11.29 .66% $ 37 .35% .68% 12/31/1612 11.26 .01 —8 .01 — — — 11.27 .09 37 .35 .11 12/31/15 11.28 (.03) .01 (.02) — — — 11.26 (.18) 39 .34 (.24) 12/31/14 11.31 (.03) — (.03) — — — 11.28 (.27) 49 .34 (.26) 12/31/13 11.34 (.03) —8 (.03) — — — 11.31 (.27) 57 .34 (.24)
Class 1A:
12/31/173,4 11.27 .08 —8 .08 (.06) — (.06) 11.29 .675 —7 .346 .696
Class 2: 12/31/17 10.99 .05 —8 .05 (.03) — (.03) 11.01 .46 249 .60 .42 12/31/1612 11.01 (.02) —8 (.02) — — — 10.99 (.18) 297 .60 (.14) 12/31/15 11.06 (.05) —8 (.05) — — — 11.01 (.45) 302 .59 (.49) 12/31/14 11.12 (.06) — (.06) — — — 11.06 (.54) 331 .59 (.51) 12/31/13 11.17 (.05) —8 (.05) — — — 11.12 (.45) 395 .59 (.49)
Class 3: 12/31/17 11.10 .06 —8 .06 (.04) — (.04) 11.12 .54 4 .53 .50 12/31/1612 11.11 (.01) —8 (.01) — — — 11.10 (.09) 4 .53 (.08) 12/31/15 11.16 (.05) —8 (.05) — — — 11.11 (.45) 6 .52 (.42) 12/31/14 11.21 (.05) — (.05) — — — 11.16 (.45) 8 .52 (.44) 12/31/13 11.26 (.05) —8 (.05) — — — 11.21 (.44) 8 .52 (.42)
Class 4: 12/31/17 11.12 .02 —8 .02 (.01) — (.01) 11.13 .16 15 .85 .19 12/31/1612 11.17 (.04) (.01) (.05) — — — 11.12 (.45) 13 .85 (.40) 12/31/15 11.25 (.08) —8 (.08) — — — 11.17 (.71) 16 .85 (.74) 12/31/14 11.30 (.09) .04 (.05) — — — 11.25 (.44) 7 .84 (.77) 12/31/13 11.34 (.04) —8 (.04) — — — 11.30 (.35)11 —7 .3711 (.32)11

21 American Funds Insurance Series / Prospectus
Income (loss) from investment operations1 Dividends and distributions
Period ended
Net asset value,
beginning of
period
Net investment
income (loss)
Net gains (losses) on securities
(both realized
and unrealized)
Total from investment operations
Dividends (from net
investment income)
Distributions (from capital gains)
Total dividends
and distributions
Net asset value, end of period
Total return
Net assets, end of period
(in millions)
Ratio of
expenses to average net assets
Ratio of net
income (loss) to average
net assets
U.S. Government/AAA-Rated Securities Fund
Class 1: 12/31/17 $12.05 $.21 $ .01 $ .22 $(.19) $ — $(.19) $12.08 1.83% $1,558 .36% 1.68% 12/31/16 12.31 .16 .03 .19 (.20) (.25) (.45) 12.05 1.44 1,467 .36 1.31 12/31/15 12.40 .13 .09 .22 (.21) (.10) (.31) 12.31 1.93 1,426 .35 1.02 12/31/14 11.94 .15 .48 .63 (.17) — (.17) 12.40 5.24 1,723 .35 1.24 12/31/13 12.75 .08 (.44) (.36) (.11) (.34) (.45) 11.94 (2.87) 1,584 .35 .67
Class 1A:
12/31/173,4 12.05 .18 .03 .21 (.18) — (.18) 12.08 1.735 —7 .586 1.536
Class 2:
12/31/17 11.93 .17 .02 .19 (.16) — (.16) 11.96 1.59 1,473 .61 1.43 12/31/16 12.20 .13 .02 .15 (.17) (.25) (.42) 11.93 1.19 1,503 .61 1.05 12/31/15 12.29 .10 .09 .19 (.18) (.10) (.28) 12.20 1.59 1,579 .60 .79 12/31/14 11.83 .12 .47 .59 (.13) — (.13) 12.29 5.01 1,717 .60 1.00 12/31/13 12.63 .05 (.43) (.38) (.08) (.34) (.42) 11.83 (3.08) 1,801 .60 .42
Class 3: 12/31/17 12.07 .18 .03 .21 (.17) — (.17) 12.11 1.72 10 .54 1.50 12/31/16 12.34 .14 .02 .16 (.18) (.25) (.43) 12.07 1.24 11 .54 1.12 12/31/15 12.43 .11 .09 .20 (.19) (.10) (.29) 12.34 1.64 11 .53 .85 12/31/14 11.96 .13 .48 .61 (.14) — (.14) 12.43 5.11 13 .53 1.08 12/31/13 12.76 .06 (.43) (.37) (.09) (.34) (.43) 11.96 (3.00) 14 .53 .47
Class 4: 12/31/17 11.96 .14 .01 .15 (.13) — (.13) 11.98 1.28 62 .86 1.18 12/31/16 12.22 .10 .03 .13 (.14) (.25) (.39) 11.96 .99 57 .86 .82 12/31/15 12.34 .07 .08 .15 (.17) (.10) (.27) 12.22 1.29 46 .85 .56 12/31/14 11.93 .06 .51 .57 (.16) — (.16) 12.34 4.76 21 .85 .50 12/31/13 12.75 .08 (.44) (.36) (.12) (.34) (.46) 11.93 (2.95) —7 .84 .68

American Funds Insurance Series / Prospectus 22
Period ended December 31
Portfolio turnover rate for all share classes excluding mortgage dollar roll transactions 2017 2016 2015 2014 2013
Capital Income Builder 59% 41% 38% 24%5,10
Asset Allocation Fund 39 43 28 42
Global Balanced Fund 28 43 36 40
Bond Fund 153 108 141 121
Global Bond Fund 74 70 88 134
Mortgage Fund 98 113 138 108
U.S. Government/AAA-Rated Securities Fund 120 273 352 88
Not available
Period ended December 31 Portfolio turnover rate for all share classes including mortgage dollar roll transactions, if applicable 2017 2016 2015 2014 2013
Global Growth Fund 31% 27% 29% 22% 39%
Global Small Capitalization Fund 33 40 36 28 36
Growth Fund 24 26 20 29 19
International Fund 29 31 37 18 21
New World Fund 56 32 39 36 43
Blue Chip Income and Growth Fund 34 30 26 37 30
Global Growth and Income Fund 41 57 37 28 31
Growth-Income Fund 27 27 25 25 19
International Growth and Income Fund 51 32 35 34 34
Capital Income Builder 88 53 128 355,10
Asset Allocation Fund 85 83 76 88 74
Global Balanced Fund 41 65 76 73 81
Bond Fund 502 375 434 365 354
Global Bond Fund 105 154 159 200 213
High-Income Bond Fund 78 89 66 54 64
Mortgage Fund 680 713 1103 790 715
Ultra-Short Bond Fund —13 —12,13 N/A N/A N/A
U.S. Government/AAA-Rated Securities Fund 551 539 901 387 621 1 Based on average shares outstanding. 2 For the year ended December 31, 2014, reflects the impact of a corporate action event that resulted in a one-time increase to net investment income. If the corporate action event
had not occurred, the net investment income per share and ratio of net income to average net assets would have been lower for all share classes. 3 Based on operations for a period that is less than a full year. 4 Class 1A shares began investment operations on January 6, 2017. 5 Not annualized. 6 Annualized. 7 Amount less than $1 million. 8 Amount less than $.01. 9 Amount less than .01%. 10 For the period May 1, 2014, commencement of operations, through December 31, 2014. 11 All or a significant portion of assets in this class consisted of seed capital invested by Capital Research and Management Company and/or its affiliates. Certain fees (including,
where applicable, fees for distribution services) are not charged or accrued on these seed capital assets. If such fees were paid by the fund on seed capital assets, fund expenses would have been higher and net income and total return would have been lower.
12 On May 1, 2016, the fund converted from a cash management fund to an ultra-short-term bond fund and changed its name from Cash Management Fund to Ultra-Short Bond Fund.
13 Amount is either less than 1% or there is no turnover.

Investment Company File No. 811-03857
Other fund information Shares of the Series are currently offered to insurance company separate accounts funding both variable annuity contracts and variable life insurance policies. Interests of various contract owners participating in the Series may be in conflict. The board of trustees of the Series will monitor for the existence of any material conflicts and determine what action, if any, should be taken. Shares may be purchased or redeemed by the separate accounts without any sales or redemption charges at net asset value.
Annual/Semi-annual report to shareholders The shareholder reports contain additional information about the Series, including financial statements, investment results, portfolio holdings, a discussion of market conditions and the Series’ investment strategies, and the independent registered public accounting firm’s report (in the annual report).
Statement of additional information (SAI) and codes of ethics The current SAI, as amended from time to time, contains more detailed information about the Series, including the funds’ financial statements, and is incorporated by reference into this prospectus. This means that the current SAI, for legal purposes, is part of this prospectus. The codes of ethics describe the personal investing policies adopted by the Series, the Series’ investment adviser and its affiliated companies.
The codes of ethics and current SAI are on file with the U.S. Securities and Exchange Commission (SEC). These and other related materials about the Series are available for review or to be copied at the SEC’s Public Reference Room in Washington, D.C., (202) 551-8090, on the EDGAR database on the SEC’s website at sec.gov or, after payment of a duplicating fee, via email request to [email protected] or by writing to the SEC’s Public Reference Section, 100 F Street, NE, Washington, D.C. 20549-1520.
The current SAI and annual/semi-annual reports to shareholders can be found online at americanfunds.com/afis and may be available on the website of the company that issued your insurance contract. You also may request a free copy of these documents or the codes of ethics by calling American Funds at (800) 421-9900, ext. 65413 or writing to the Secretary at 333 South Hope Street, Los Angeles, California 90071.