prosppects and challengges - sesric · state of agrofood industries in the ... bangladesh 411...
TRANSCRIPT
State of AgroFood Industries in the OIC M b C iOIC Member CountriesProspects and Challenges p g
STATE OF AGRO‐FOOD INDUSTRIES IN OIC MEMBER COUNTRIES ‐ PROSPECTS AND
CHALLENGES
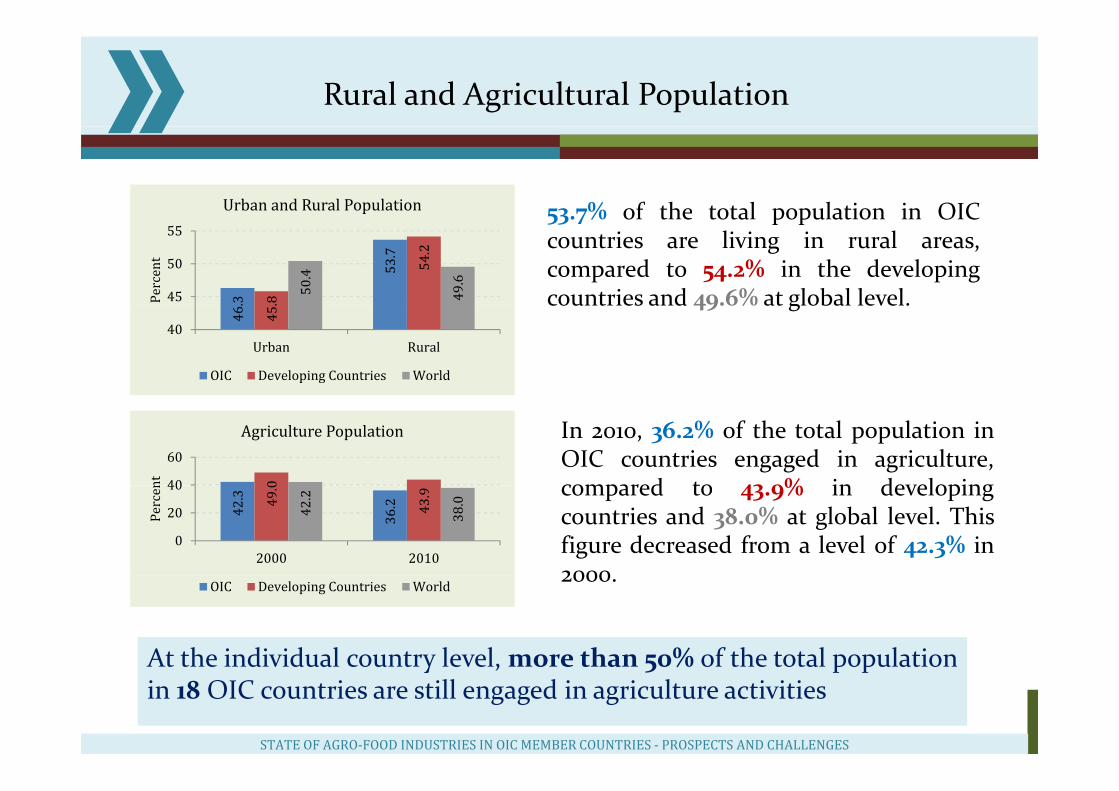
Rural and Agricultural Population
53.7% of the total population in OICUrban and Rural Population 53.7% of the total population in OICcountries are living in rural areas,compared to 54.2% in the developingcountries and 49.6% at global level..3
53.7
.8
54.2
50.4
49.6
45
50
55
Percent
49 % g
46 45
40Urban Rural
OIC Developing Countries World
040
60
nt
Agriculture Population In 2010, 36.2% of the total population inOIC countries engaged in agriculture,compared to 43 9% in developing
42.3
36.249
.0
43.9
42.2
38.0
0
20
40
2000 2010
Percen compared to 43.9% in developing
countries and 38.0% at global level. Thisfigure decreased from a level of 42.3% in2000
OIC Developing Countries World
At the individual country level, more than 50% of the total population
2000.
At the individual country level, more than 50% of the total populationin 18 OIC countries are still engaged in agriculture activities
STATE OF AGRO‐FOOD INDUSTRIES IN OIC MEMBER COUNTRIES ‐ PROSPECTS AND CHALLENGES
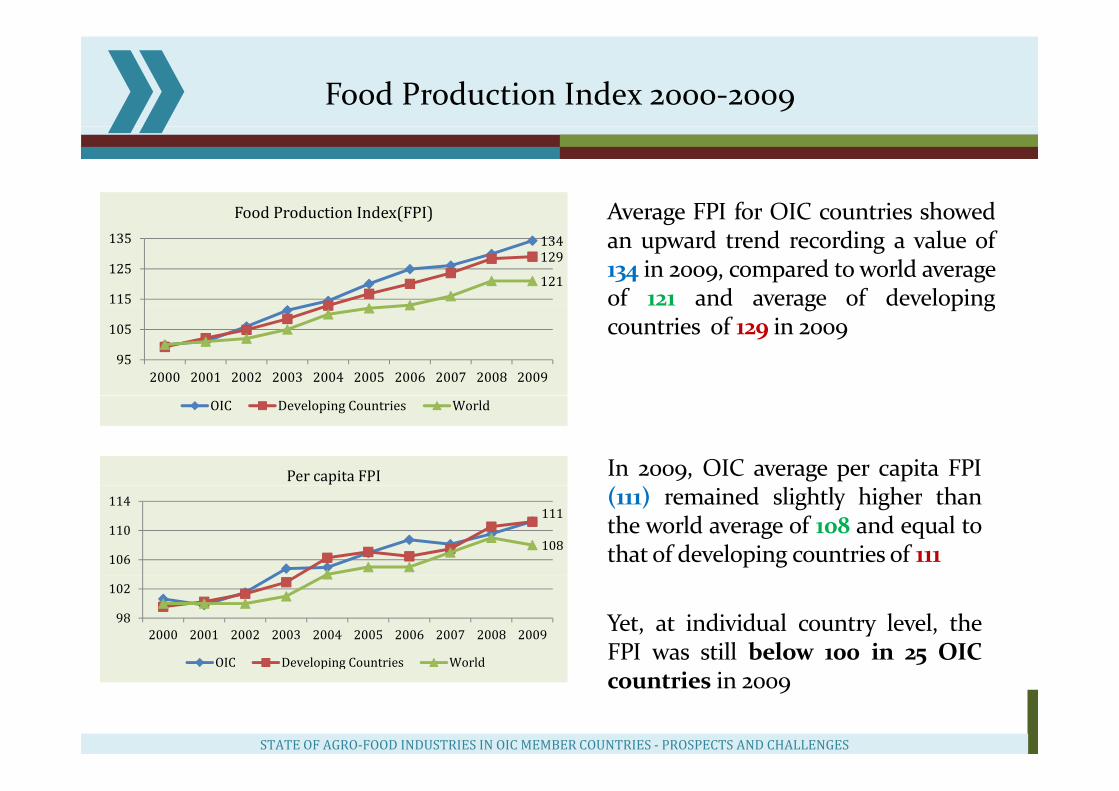
Food Production Index 2000‐2009
Average FPI for OIC countries showedFood Production Index(FPI) Average FPI for OIC countries showedan upward trend recording a value of134 in 2009, compared to world averageof 121 and average of developing
134129
121115
125
135
Food Production Index(FPI)
g p gcountries of 129 in 2009
95
105
2000 2001 2002 2003 2004 2005 2006 2007 2008 2009
OIC Developing Countries World
Per capita FPI In 2009, OIC average per capita FPI
111
108106
110
114 (111) remained slightly higher thanthe world average of 108 and equal tothat of developing countries of 111
98
102
2000 2001 2002 2003 2004 2005 2006 2007 2008 2009
OIC Developing Countries World
Yet, at individual country level, theFPI was still below 100 in 25 OICOIC Developing Countries World
STATE OF AGRO‐FOOD INDUSTRIES IN OIC MEMBER COUNTRIES ‐ PROSPECTS AND CHALLENGES
countries in 2009
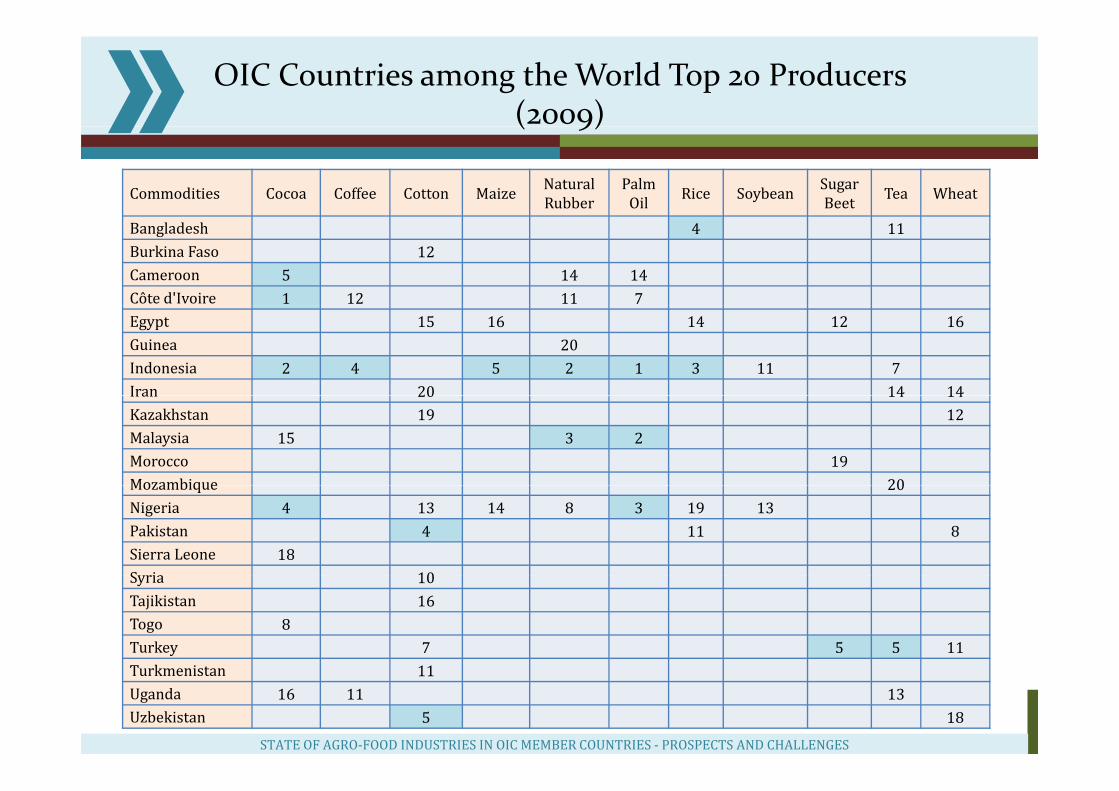
OIC Countries among the World Top 20 Producers(2009)( 9)
Commodities Cocoa Coffee Cotton Maize NaturalRubber
PalmOil Rice Soybean Sugar
Beet Tea Wheat
Bangladesh 4 11Burkina Faso 12Cameroon 5 14 14Côte d'Ivoire 1 12 11 7Egypt 15 16 14 12 16Guinea 20Indonesia 2 4 5 2 1 3 11 7Iran 20 14 14Iran 20 14 14Kazakhstan 19 12Malaysia 15 3 2Morocco 19Mozambique 20Mozambique 20Nigeria 4 13 14 8 3 19 13Pakistan 4 11 8Sierra Leone 18S ria 10Syria 10Tajikistan 16Togo 8Turkey 7 5 5 11
k
STATE OF AGRO‐FOOD INDUSTRIES IN OIC MEMBER COUNTRIES ‐ PROSPECTS AND CHALLENGES
Turkmenistan 11Uganda 16 11 13Uzbekistan 5 18
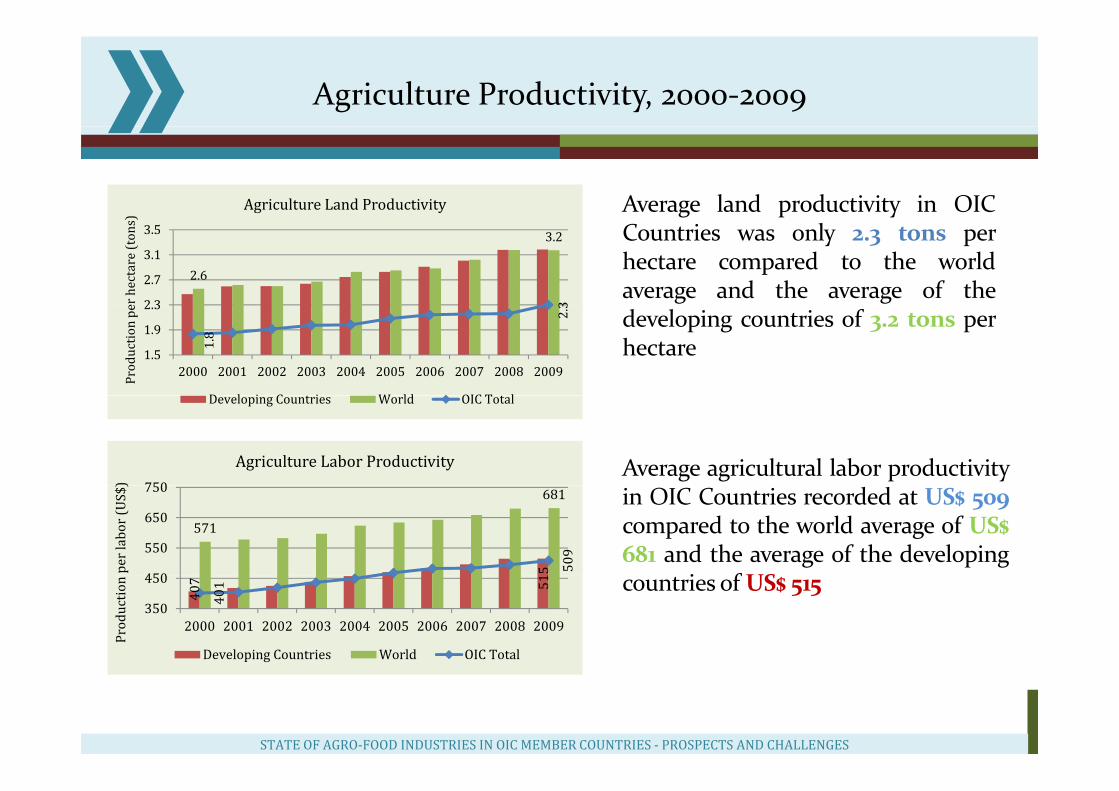
Agriculture Productivity, 2000‐2009
Average land productivity in OICAgriculture Land Productivity g p yCountries was only 2.3 tons perhectare compared to the worldaverage and the average of the
2.6
3.2
32 3
2.7
3.1
3.5
er hectare (tons)
developing countries of 3.2 tons perhectare1.
8
2.3
1.5
1.9
2.3
2000 2001 2002 2003 2004 2005 2006 2007 2008 2009Production pe
D l i C i W ld OIC T l
750)
Agriculture Labor Productivity
Developing Countries World OIC Total
Average agricultural labor productivity
5571
681
509
450
550
650
750
per labor (U
S$)
in OIC Countries recorded at US$ 509compared to the world average of US$681 and the average of the developing
i f US
407 51
401
350
450
2000 2001 2002 2003 2004 2005 2006 2007 2008 2009
Production
Developing Countries World OIC Total
countries of US$ 515
STATE OF AGRO‐FOOD INDUSTRIES IN OIC MEMBER COUNTRIES ‐ PROSPECTS AND CHALLENGES
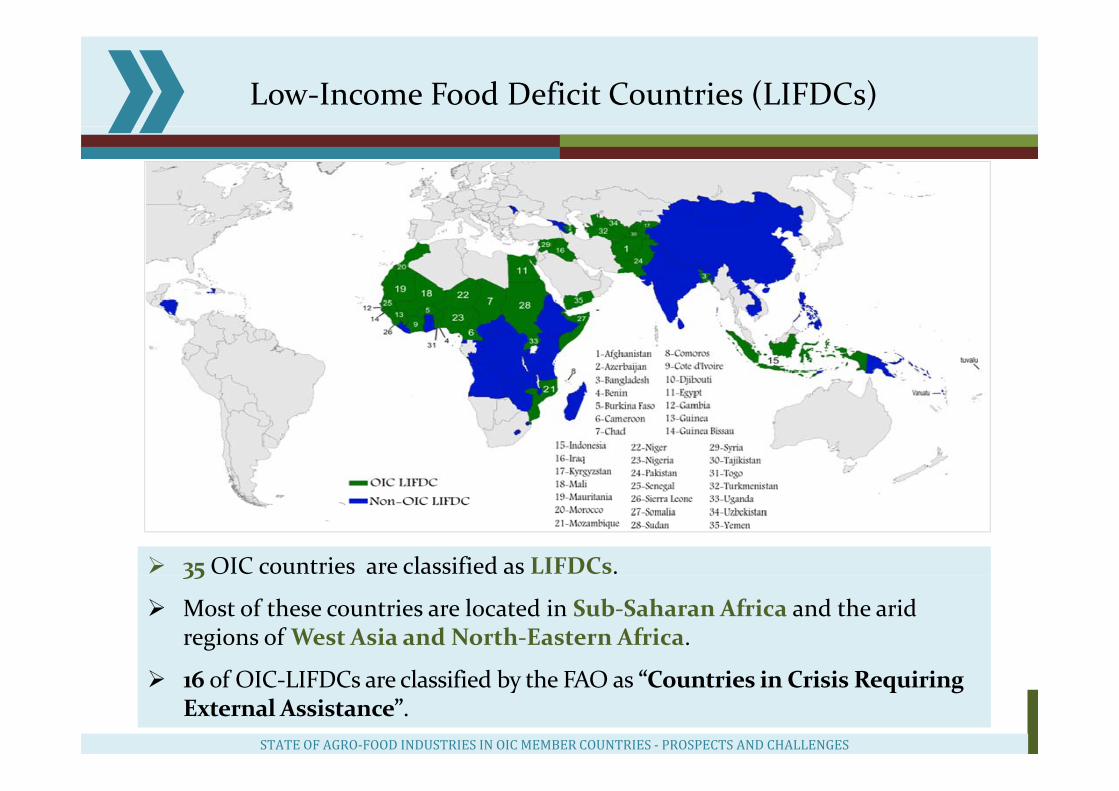
Low‐Income Food Deficit Countries (LIFDCs)
35OIC countries are classified as LIFDCs.35
Most of these countries are located in Sub‐Saharan Africa and the arid regions of West Asia and North‐Eastern Africa.
16 of OIC‐LIFDCs are classified by the FAO as “Countries in Crisis Requiring External Assistance”.
STATE OF AGRO‐FOOD INDUSTRIES IN OIC MEMBER COUNTRIES ‐ PROSPECTS AND CHALLENGES
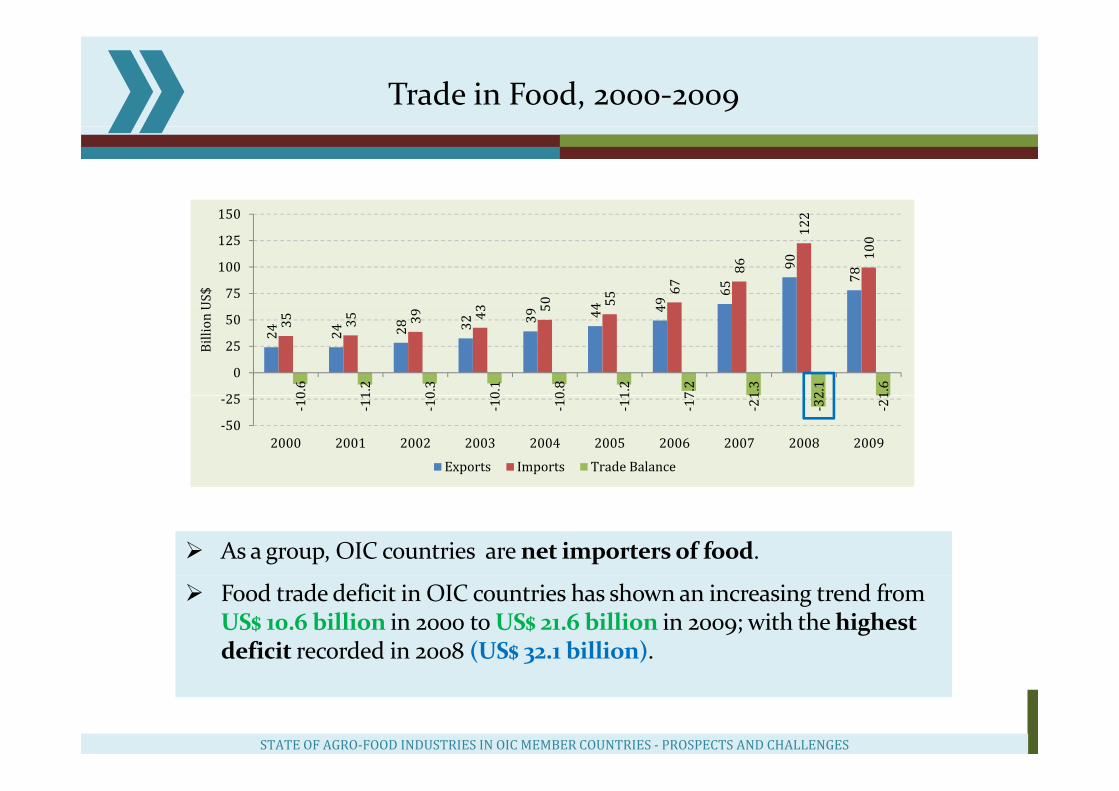
Trade in Food, 2000‐2009
2150
4 49
65
90
78
3 50 55
67
86
122
100
75
100
125
150US$
24 24 28 32 39 44 4
35 35 39 43 5
0.6
1.2
0.3
0.1
0.8
1.2
7.2
1.3
2.1
1.6
25
0
25
50
Billion U
‐10
‐11
‐10
‐10
‐10
‐11
‐17
‐21
‐32
‐21
‐50
‐25
2000 2001 2002 2003 2004 2005 2006 2007 2008 2009
Exports Imports Trade Balance
As a group, OIC countries are net importers of food.
Food trade deficit in OIC countries has shown an increasing trend from US$ 10.6 billion in 2000 to US$ 21.6 billion in 2009; with the highest deficit recorded in 2008 (US$ 32.1 billion).
STATE OF AGRO‐FOOD INDUSTRIES IN OIC MEMBER COUNTRIES ‐ PROSPECTS AND CHALLENGES
Importance of Processing
D l i f d i d t i ld h i t Developing agro‐food industries could have impacts on:
a. improving food supplies by preventing quantitative and qualitative losses;
b. increasing self‐reliance by reducing imports;
c. providing employment, especially in rural areas;
d d dd. reducing income disparities;
e. stimulating rural development;
f i i f i h i th h t f fi i h d d if. increasing foreign exchange earnings through export of finished and semi‐finished products;
g. reducing migration to urban areas;
h. increasing investment opportunities in rural and urban areas.
STATE OF AGRO‐FOOD INDUSTRIES IN OIC MEMBER COUNTRIES ‐ PROSPECTS AND CHALLENGES
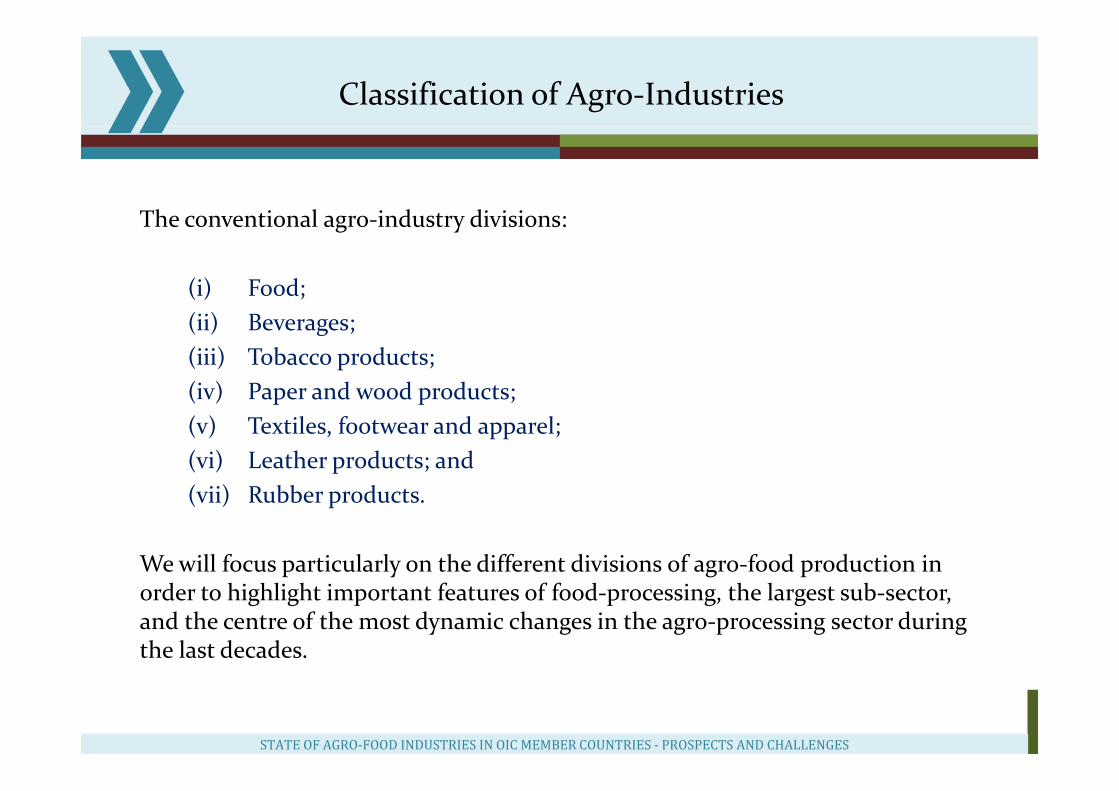
Classification of Agro‐Industries
The conventional agro industry divisions:The conventional agro‐industry divisions:
(i) Food;(ii) Beverages; (iii) Tobacco products;(iv) Paper and wood products; (iv) Paper and wood products; (v) Textiles, footwear and apparel; (vi) Leather products; and( ) bb d(vii) Rubber products.
We will focus particularly on the different divisions of agro‐food production in p y g porder to highlight important features of food‐processing, the largest sub‐sector,and the centre of the most dynamic changes in the agro‐processing sector during the last decades.
STATE OF AGRO‐FOOD INDUSTRIES IN OIC MEMBER COUNTRIES ‐ PROSPECTS AND CHALLENGES
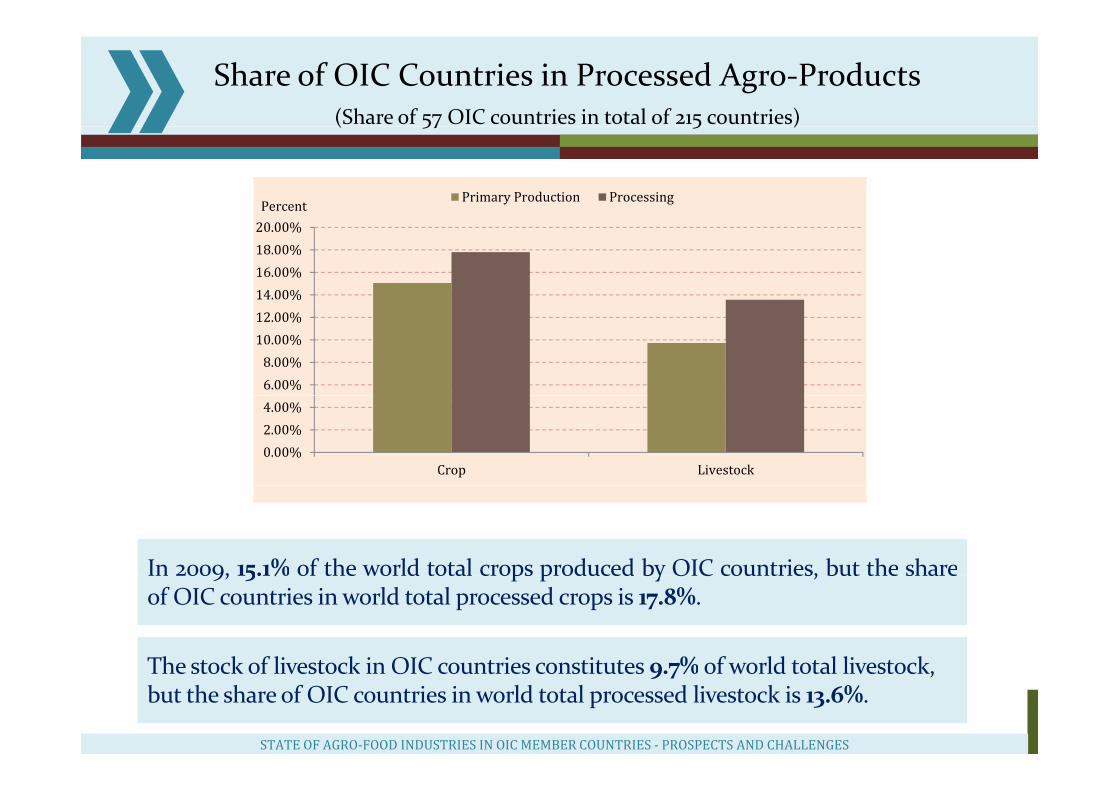
Share of OIC Countries in Processed Agro‐Products(Share of 57 OIC countries in total of 215 countries)( 57 5 )
Percent Primary Production Processing
14.00%16.00%18.00%20.00%
6.00%8.00%10.00%12.00%
0.00%2.00%4.00%
Crop Livestock
In 2009, 15.1% of the world total crops produced by OIC countries, but the share
The stock of livestock in OIC countries constitutes 9 7% of world total livestock
In 2009, 15.1% of the world total crops produced by OIC countries, but the shareof OIC countries in world total processed crops is 17.8%.
The stock of livestock in OIC countries constitutes 9.7% of world total livestock, but the share of OIC countries in world total processed livestock is 13.6%.
STATE OF AGRO‐FOOD INDUSTRIES IN OIC MEMBER COUNTRIES ‐ PROSPECTS AND CHALLENGES
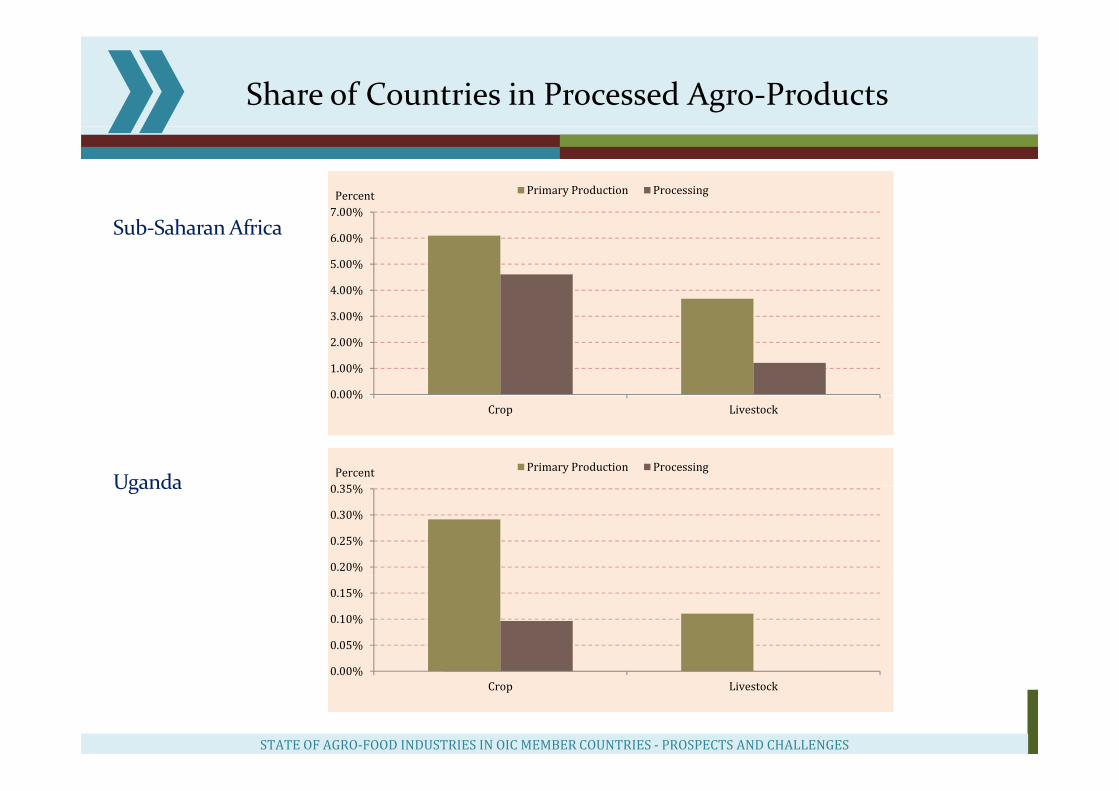
Share of Countries in Processed Agro‐Products
7.00%Percent Primary Production Processing
4.00%
5.00%
6.00%
%Sub‐SaharanAfrica
0 00%
1.00%
2.00%
3.00%
0.00%Crop Livestock
0 35%Percent Primary Production Processing
Uganda
0.20%
0.25%
0.30%
0.35%Uganda
0.05%
0.10%
0.15%
STATE OF AGRO‐FOOD INDUSTRIES IN OIC MEMBER COUNTRIES ‐ PROSPECTS AND CHALLENGES
0.00%Crop Livestock
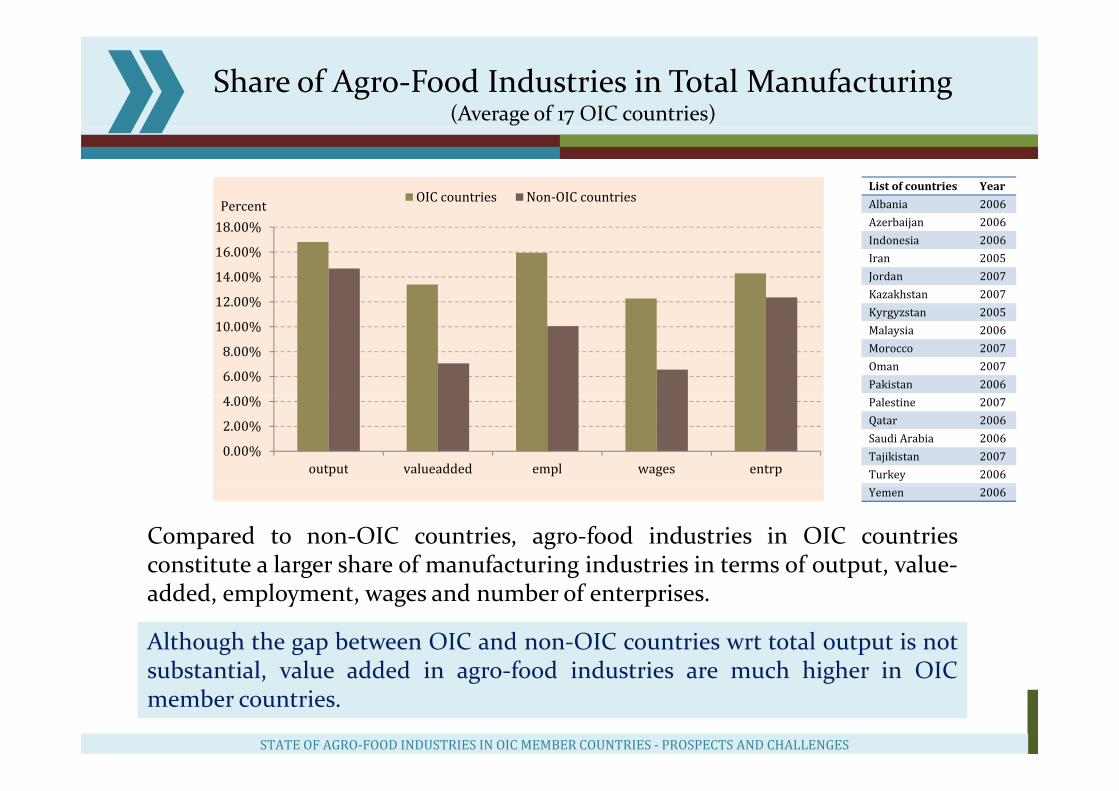
Share of Agro‐Food Industries in Total Manufacturing(Average of 17 OIC countries)
Percent OIC countries Non‐OIC countriesList of countries Year
Albania 2006
12.00%
14.00%
16.00%
18.00% Azerbaijan 2006Indonesia 2006Iran 2005Jordan 2007Kazakhstan 2007
6.00%
8.00%
10.00%
12.00%Kyrgyzstan 2005Malaysia 2006Morocco 2007Oman 2007Pakistan 2006
0.00%
2.00%
4.00%
output valueadded empl wages entrp
Palestine 2007Qatar 2006Saudi Arabia 2006Tajikistan 2007Turkey 2006
Compared to non‐OIC countries, agro‐food industries in OIC countriesconstitute a larger share of manufacturing industries in terms of output, value‐
Yemen 2006
Although the gap between OIC and non‐OIC countries wrt total output is notb t ti l l dd d i f d i d t i h hi h i OIC
g g p ,added, employment, wages and number of enterprises.
substantial, value added in agro‐food industries are much higher in OICmember countries.
STATE OF AGRO‐FOOD INDUSTRIES IN OIC MEMBER COUNTRIES ‐ PROSPECTS AND CHALLENGES
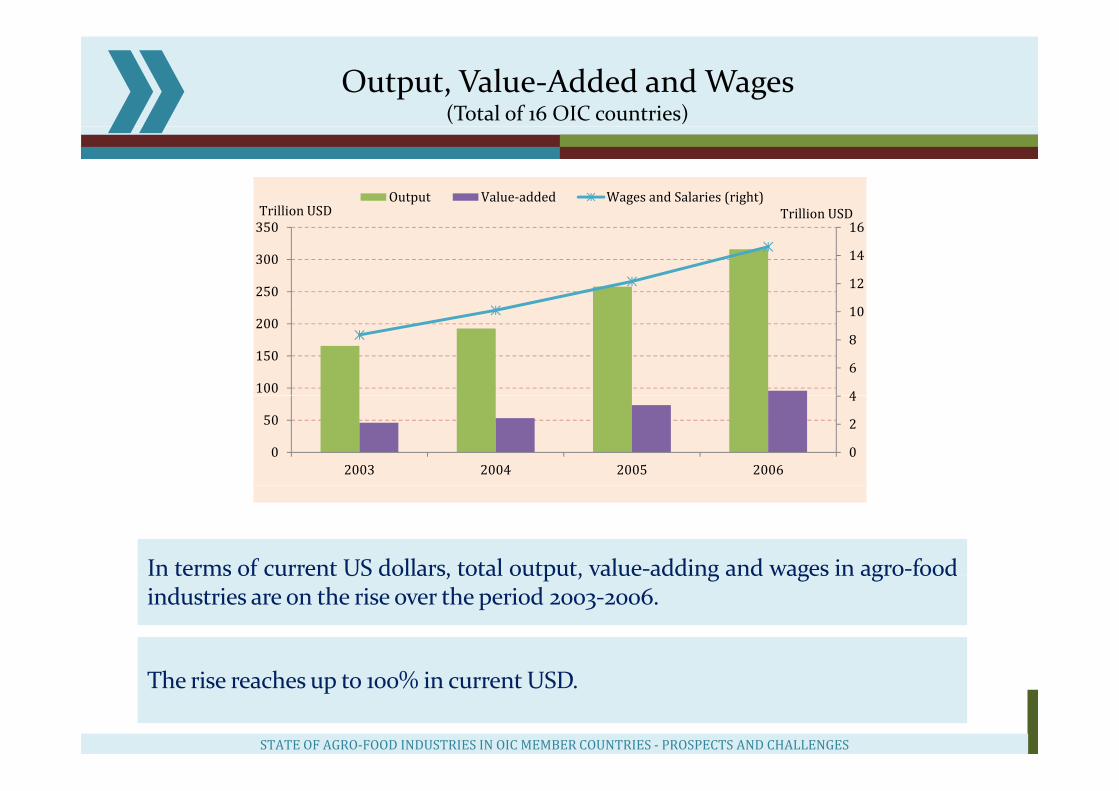
Output, Value‐Added and Wages (Total of 16 OIC countries)
Trillion USDTrillion USDOutput Value‐added Wages and Salaries (right)
12
14
16
250
300
350Trillion USD
4
6
8
10
100
150
200
0
2
4
0
50
2003 2004 2005 2006
In terms of current US dollars, total output, value‐adding and wages in agro‐foodIn terms of current US dollars, total output, value adding and wages in agro foodindustries are on the rise over the period 2003‐2006.
The rise reaches up to 100% in current USD.
STATE OF AGRO‐FOOD INDUSTRIES IN OIC MEMBER COUNTRIES ‐ PROSPECTS AND CHALLENGES
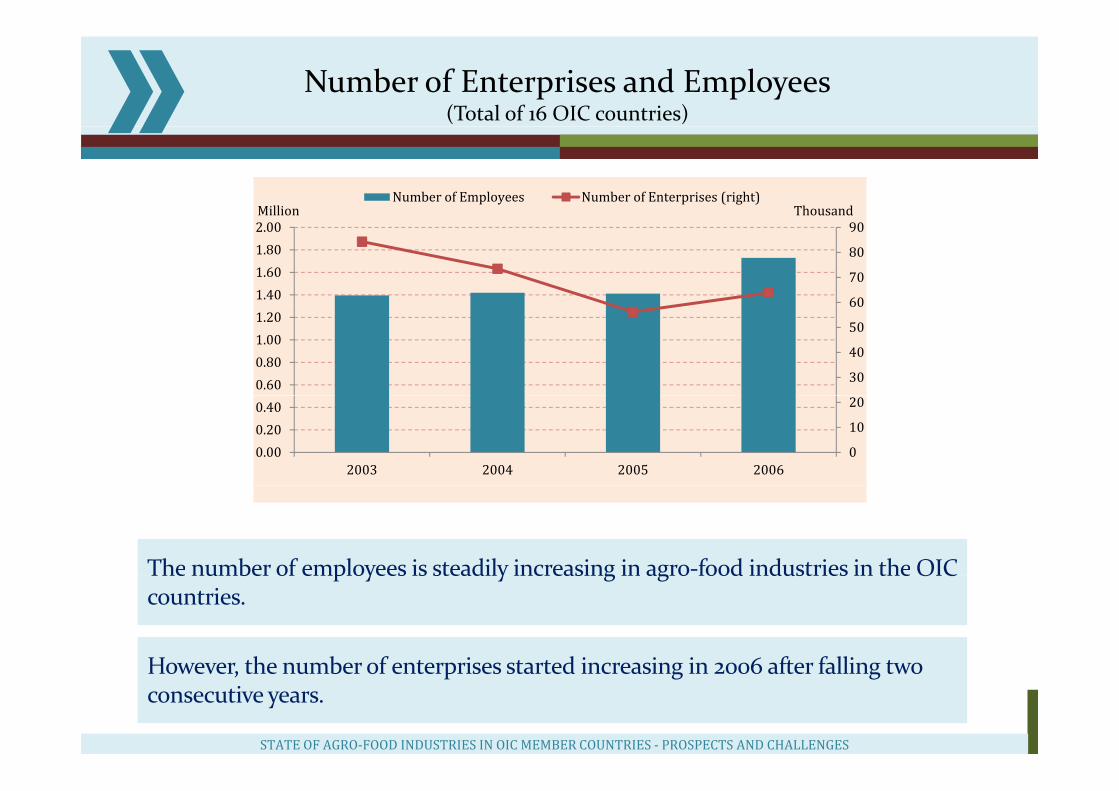
Number of Enterprises and Employees(Total of 16 OIC countries)
ThousandMillionNumber of Employees Number of Enterprises (right)
60
70
80
90
1.401.601.802.00
30
40
50
60
0.600.801.001.20
0
10
20
0.000.200.40
2003 2004 2005 2006
The number of employees is steadily increasing in agro‐food industries in the OIC
However the number of enterprises started increasing in 2006 after falling two
The number of employees is steadily increasing in agro food industries in the OICcountries.
However, the number of enterprises started increasing in 2006 after falling two consecutive years.
STATE OF AGRO‐FOOD INDUSTRIES IN OIC MEMBER COUNTRIES ‐ PROSPECTS AND CHALLENGES
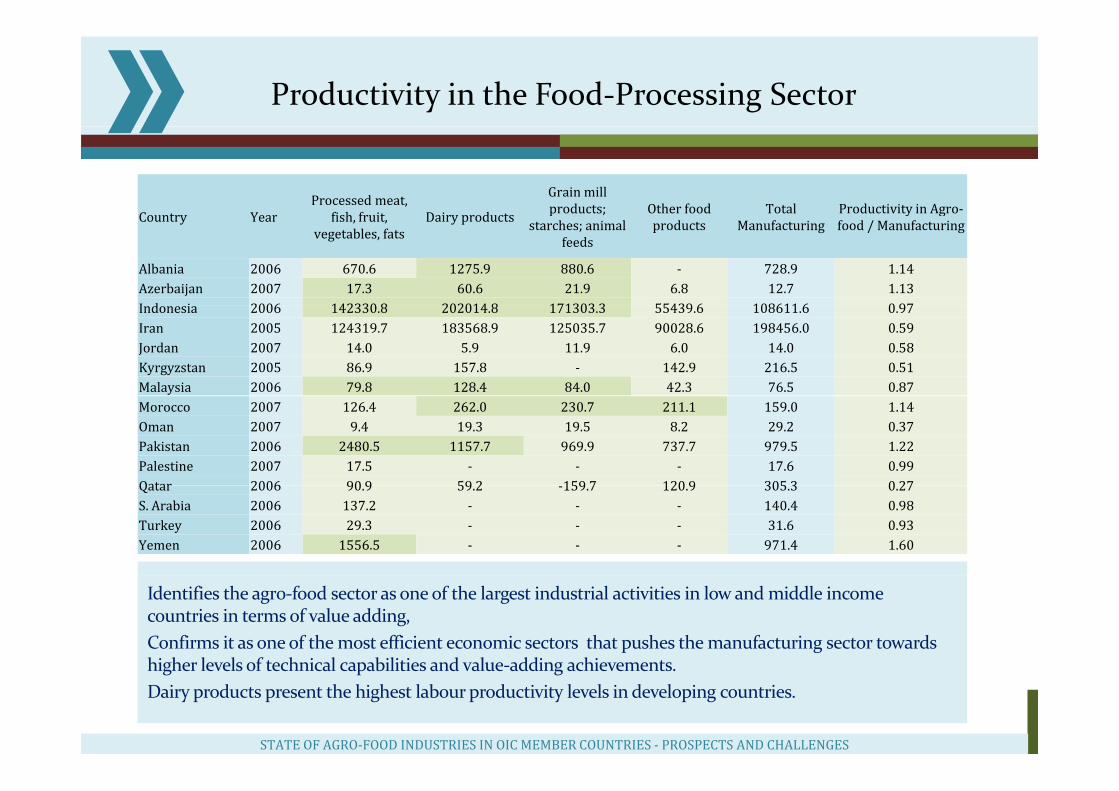
Productivity in the Food‐Processing Sector
Country YearProcessed meat,
fish fruit Dairy products
Grain mill products; Other food Total Productivity in Agro‐Country Year fish, fruit,
vegetables, fatsDairy products p
starches; animal feeds
products Manufacturingy g
food / Manufacturing
Albania 2006 670.6 1275.9 880.6 ‐ 728.9 1.14Azerbaijan 2007 17.3 60.6 21.9 6.8 12.7 1.13I d i 2006 142330 8 202014 8 171303 3 55439 6 108611 6 0 97Indonesia 2006 142330.8 202014.8 171303.3 55439.6 108611.6 0.97Iran 2005 124319.7 183568.9 125035.7 90028.6 198456.0 0.59Jordan 2007 14.0 5.9 11.9 6.0 14.0 0.58Kyrgyzstan 2005 86.9 157.8 ‐ 142.9 216.5 0.51Malaysia 2006 79.8 128.4 84.0 42.3 76.5 0.87Morocco 2007 126.4 262.0 230.7 211.1 159.0 1.14Oman 2007 9.4 19.3 19.5 8.2 29.2 0.37Pakistan 2006 2480.5 1157.7 969.9 737.7 979.5 1.22Palestine 2007 17.5 ‐ ‐ ‐ 17.6 0.99Qatar 2006 90 9 59 2 159 7 120 9 305 3 0 27Qatar 2006 90.9 59.2 ‐159.7 120.9 305.3 0.27S. Arabia 2006 137.2 ‐ ‐ ‐ 140.4 0.98Turkey 2006 29.3 ‐ ‐ ‐ 31.6 0.93Yemen 2006 1556.5 ‐ ‐ ‐ 971.4 1.60
Identifies the agr0‐food sector as one of the largest industrial activities in low and middle income countries in terms of value adding, Confirms it as one of the most efficient economic sectors that pushes the manufacturing sector towards higher levels of technical capabilities and value adding achievements higher levels of technical capabilities and value‐adding achievements. Dairy products present the highest labour productivity levels in developing countries.
STATE OF AGRO‐FOOD INDUSTRIES IN OIC MEMBER COUNTRIES ‐ PROSPECTS AND CHALLENGES
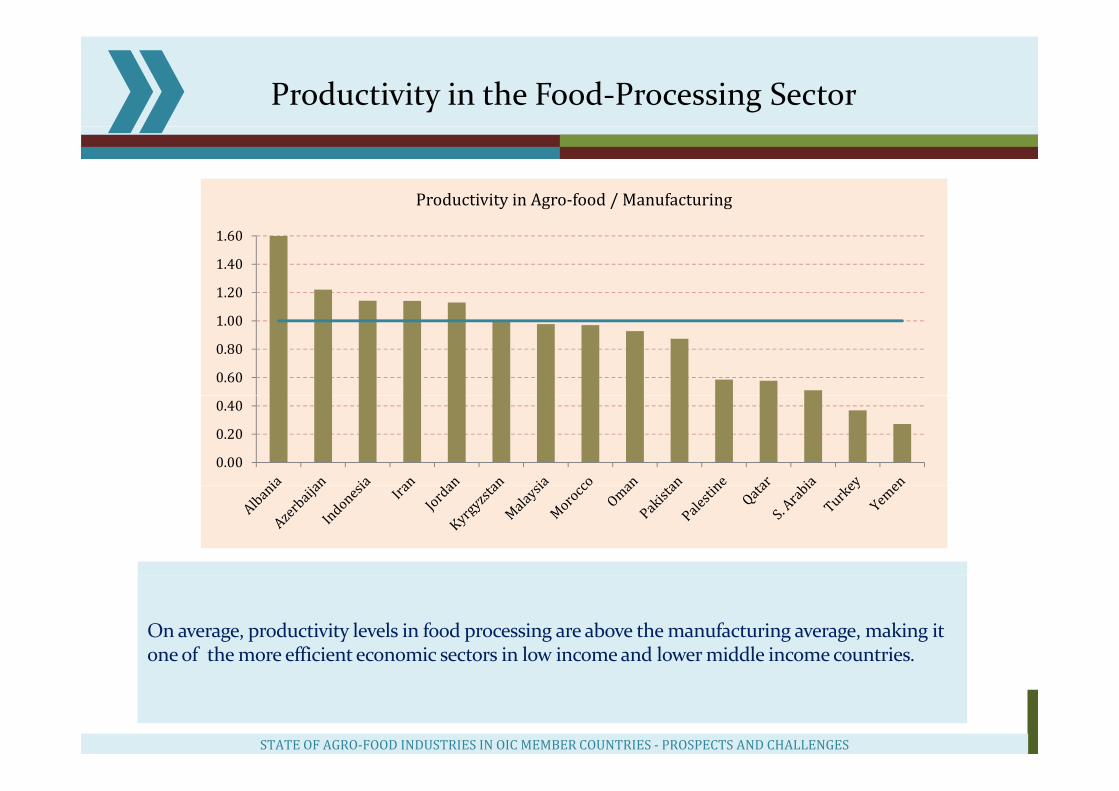
Productivity in the Food‐Processing Sector
Productivity in Agro‐food / Manufacturing
1.20
1.40
1.60
0.60
0.80
1.00
0.00
0.20
0.40
On average, productivity levels in food processing are above the manufacturing average, making it one of the more efficient economic sectors in low income and lower middle income countries.
STATE OF AGRO‐FOOD INDUSTRIES IN OIC MEMBER COUNTRIES ‐ PROSPECTS AND CHALLENGES
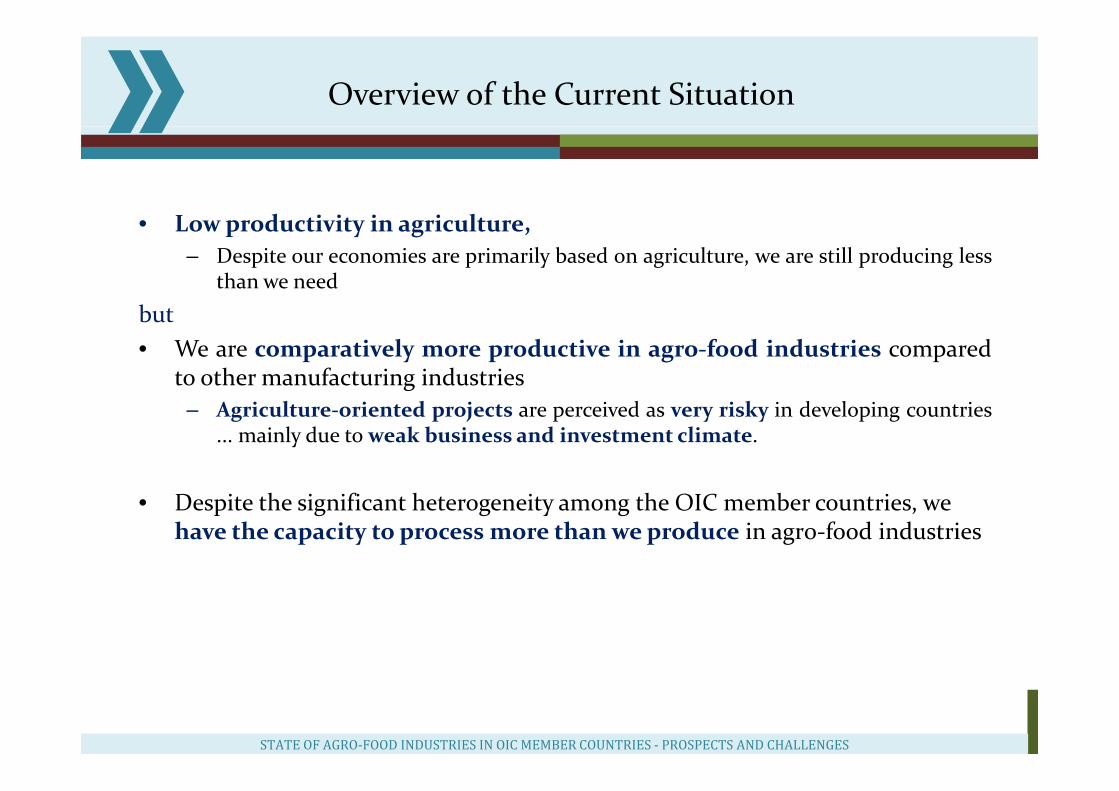
Overview of the Current Situation
L d i i i i l• Low productivity in agriculture,– Despite our economies are primarily based on agriculture, we are still producing less
than we needbbut• We are comparatively more productive in agro‐food industries compared
to other manufacturing industries– Agriculture‐oriented projects are perceived as very risky in developing countries
... mainly due toweak business and investment climate.
• Despite the significant heterogeneity among the OIC member countries, wehave the capacity to process more thanwe produce in agr0‐food industries
STATE OF AGRO‐FOOD INDUSTRIES IN OIC MEMBER COUNTRIES ‐ PROSPECTS AND CHALLENGES
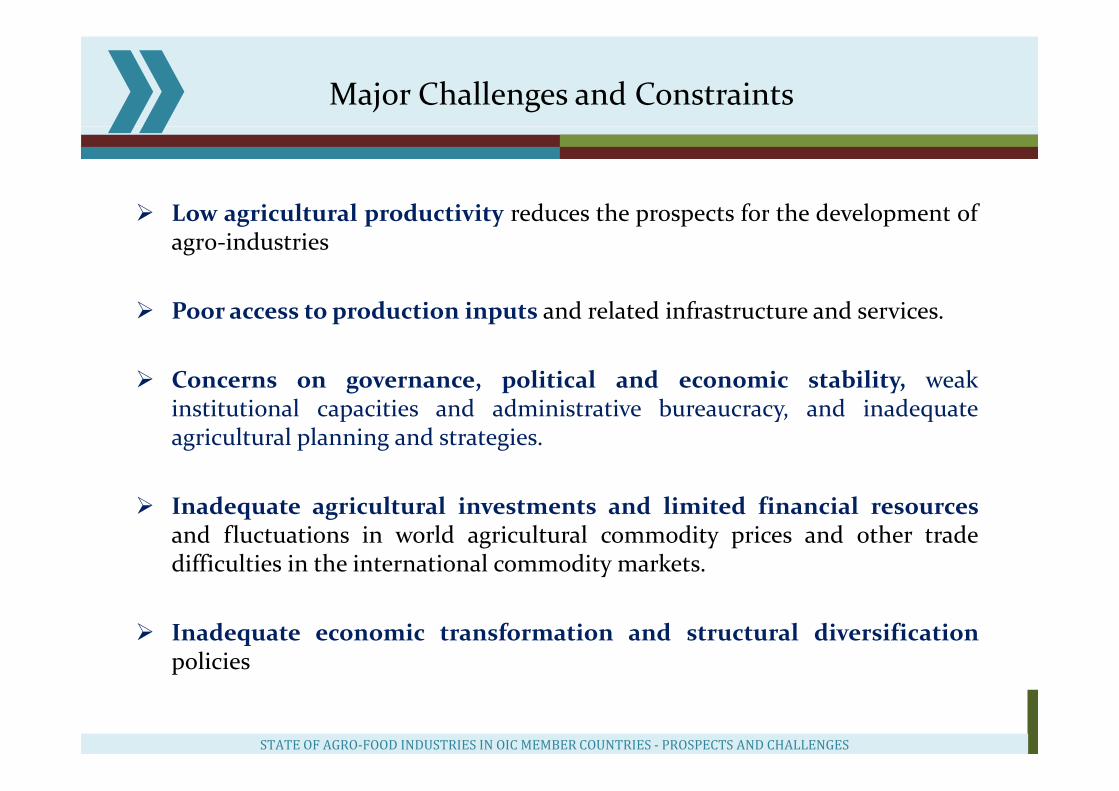
Major Challenges and Constraints
Low agricultural productivity reduces the prospects for the development ofLow agricultural productivity reduces the prospects for the development ofagr0‐industries
P t d ti i t d l t d i f t t d iPoor access to production inputs and related infrastructure and services.
Concerns on governance, political and economic stability, weakinstitutional capacities and administrative bureaucracy, and inadequateagricultural planning and strategies.
Inadequate agricultural investments and limited financial resourcesand fluctuations in world agricultural commodity prices and other tradedifficulties in the international commodity markets.y
Inadequate economic transformation and structural diversificationpoliciespolicies
STATE OF AGRO‐FOOD INDUSTRIES IN OIC MEMBER COUNTRIES ‐ PROSPECTS AND CHALLENGES

Policy Recommendations ‐ I
At the national level, efforts should be made to increase agricultural productivity.g
At the OIC cooperation level, efforts should be made to enhance and direct more intra‐OIC investment in food processing sector.
An OIC Agro‐Business Fund should be established to encourage investments in food sector and food security programs.
Improving business and investment environment at the national level should be considered a high priority with emphasis on the promotion of OIC investors in member countries through introducing specific measures in national regulatory frameworks.
Stimulating private sector participation by supporting small agro‐producers and SMEs and enabling easy market access
Establishing regional inter‐country cooperation and strengthening the national centers to select appropriate technologies
I i i f d ( i l d Improving infrastructure and energy access (transport capacity, rural roads, warehouse and storage facilities etc.)
STATE OF AGRO‐FOOD INDUSTRIES IN OIC MEMBER COUNTRIES ‐ PROSPECTS AND CHALLENGES
Policy Recommendations ‐ II
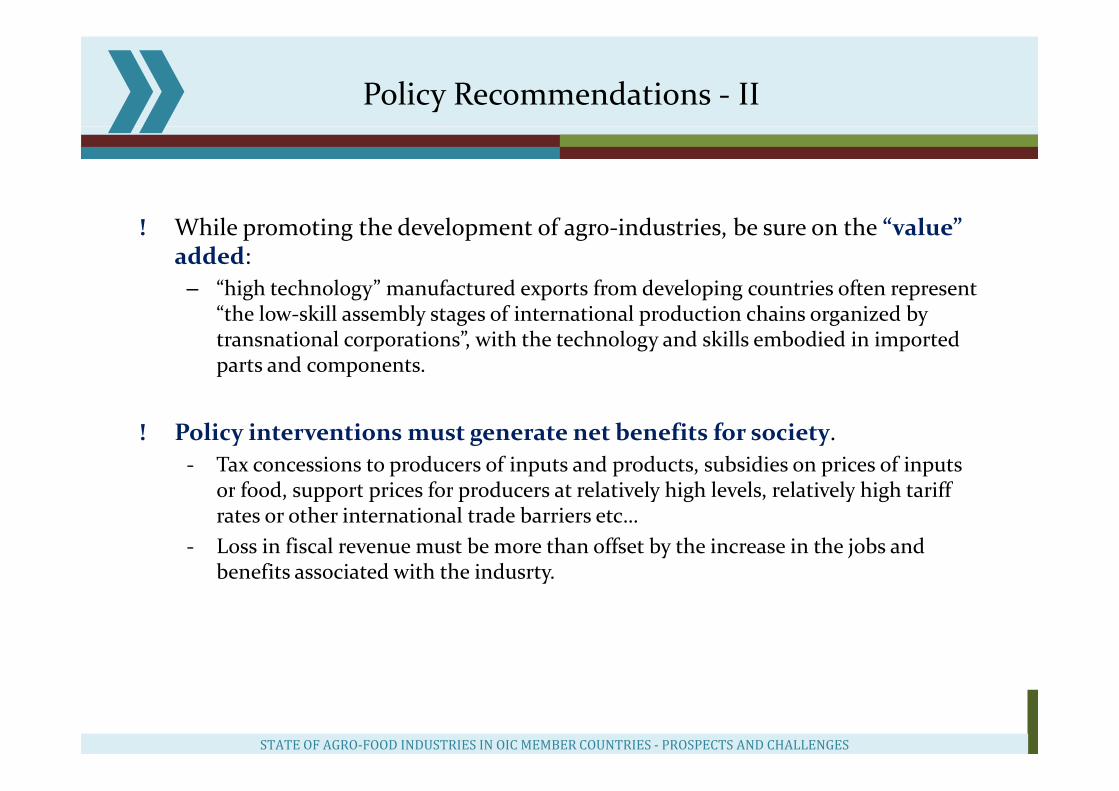
! While promoting the development of agro‐industries, be sure on the “value” added:
– “high technology” manufactured exports from developing countries often represent“ h l k ll bl f l d h d b“the low‐skill assembly stages of international production chains organized by transnational corporations”, with the technology and skills embodied in imported parts and components.
! Policy interventions must generate net benefits for society.‐ Tax concessions to producers of inputs and products, subsidies on prices of inputs
f d t i f d t l ti l hi h l l l ti l hi h t iffor food, support prices for producers at relatively high levels, relatively high tariffrates or other international trade barriers etc…
‐ Loss in fiscal revenue must be more than offset by the increase in the jobs andbenefits associated with the indusrty benefits associated with the indusrty.
STATE OF AGRO‐FOOD INDUSTRIES IN OIC MEMBER COUNTRIES ‐ PROSPECTS AND CHALLENGES

Thank you for your attentionThank you for your attention
STATE OF AGRO‐FOOD INDUSTRIES IN OIC MEMBER COUNTRIES ‐ PROSPECTS AND CHALLENGES