prota user manual - prota - stock market charting and...
TRANSCRIPT
!
!
ProTA User Manual
!
For Mac OS X Version 4
BeeSoft © 2017, BeeSoft
Contents
Legal 3
Getting Started 4
TickerPicker 11
Data Downloader 23
Chart Suites 26
Content Tables 35
Content Table Columns 44
Charts 69
Indicators 90
Line Studies 142
Custom Indicators 149
Smartlists 152
Trading Systems 156
ProTAscript 177
Preferences 222
Appendix I - File Archives 228
Appendix II - Universal Text Importer (UTI) 232
Appendix III – Holidays & Mappings 242
!2
Legal
! License Agreement and Disclaimer
Read the following before using this software. If you do not agree to the terms and conditions in this agreement, promptly return the software to the original place of purchase for a refund.
By using this software you agree to the following terms and conditions:
• BeeSoft retains title to and ownership of all the products contained herein. • You may make archival copies for personal backup purposes only. • You may not rent or lease the program. • You may not re-sell or transfer your rights without the express written permission of BeeSoft. • You may install the software on multiple computers if you are primary user of said computers.
BeeSoft warranties that the enclosed programs will perform generally in compliance with the included documentation but BeeSoft does not warrant that the program and manuals are free from all programming bugs, errors, or omissions.
The user will assume the entire risk of using the programs. Any liability will be limited exclusively to the replacement of the product or a refund of the original purchase price. In no event will BeeSoft be liable to you for damages, including any loss of profits, lost revenues, lost savings, lost data, or any other incidental or consequential damages arising out of the use of the program.
Even though BeeSoft has tested the software and reviewed the documentation, BeeSoft makes no warranty or representation, either expressed or implied, with respect to software, its quality, performance, merchantability, or fitness for a particular purpose. As a result, this software is sold "as-is," and you, the purchaser, are assuming the entire risk as to the quality and performance.
The products contained in this package are proprietary products of BeeSoft and are protected by international copyright law. All rights reserved.
The Yahoo! Finance data is to be used for PERSONAL USE ONLY. As of this writing, the Yahoo terms of service forbid commercial redistribution of data you obtain via Yahoo! Finance.
Quoting section 12. of the Yahoo Terms of Service (https://policies.yahoo.com/us/en/yahoo/terms/utos/index.htm):
You agree not to reproduce, duplicate, copy, sell, trade, resell or exploit for any commercial purposes, any portion or use of, or access to, the Yahoo Services.
!Trademarks
ProTA is a trademark of BeeSoft. Macintosh, Finder, Safari are trademarks of Apple Computer, Inc. Microsoft, Excel, Word are trademarks of Microsoft Corporation. Yahoo! is a trademark of Yahoo!, Inc.
All other products and logos mentioned in this documentation are trademarks of their respective owners.
!3
Getting Started
!Welcome
Thank you for selecting ProTA 4 for Mac OS X.
ProTA (pronounced Pro – Tee – A) is a market charting and technical analysis program written exclusively Mac OS X. ProTA was designed from the ground up to take full advantage of the elegant Macintosh interface. A combination of modern programming techniques, OS X compliant interface design, and close attention to our customers’ feedback has resulted in software that truly represents the state-of-the-art in Macintosh-based investment software.
ProTA balances "powerful features" and "ease-of-use" in a way that both beginners and seasoned traders will appreciate. In fact, ProTA is so easy to use, you may be tempted to skip this manual altogether. We recommend, however, that you set aside time to review the entire manual. You'll be much better prepared to command ProTA's features, make better trades, and improve your profitability.
At a minimum, new users should read the complete Getting Started chapter. If you are upgrading from the previous version of ProTA, a separate document Transitioning from ProTA 3 highlights the major changes and new features in ProTA 4.
Tip. You can access these manuals from within ProTA by clicking the Help menu in the menubar.
About This Manual
This manual assumes some familiarity with the overall Mac OSX interface as well as a basic understanding of the markets and technical analysis. While the ProTA User's Manual attempts to explain all features in full detail, neither ProTA nor this manual is intended to be a complete tutorial for market technical analysis.
ProTA is an acronym for Professional Technical Analysis. Several of ProTA’s “pro” features, Custom Indicators, Trading Systems and Smartlists, may be beyond the immediate reach of the budding technical analyst. If you are new to technical analysis software such as ProTA, we recommend learning the basics of the software before moving on to these advanced techniques.
Enjoy!
!4
!System Requirements
To use ProTA, you'll need the following equipment and software:
• Mac OS X version 10.7 or higher.
• 100MB of hard drive space for the installation plus associated data.
• Intel processor.
• A display with minimum resolution width of 1280 pixels.
!Installing ProTA
1. Download the latest version of ProTA from www.beesoft.net.
2. The software is packaged as a compressed folder (zip) file. If you are using Apple’s Safari web browser, the zip is automatically decompressed after it has been downloaded. If you are not using Safari, simply double-click on the downloaded zip file to decompress it.
3. Open the downloaded folder which includes the ProTA application and a Read Me file. Drag the ProTA icon to your Applications folder, replacing any older version of ProTA.
4. Open your Applications folder, then double-click the ProTA icon to launch the program.
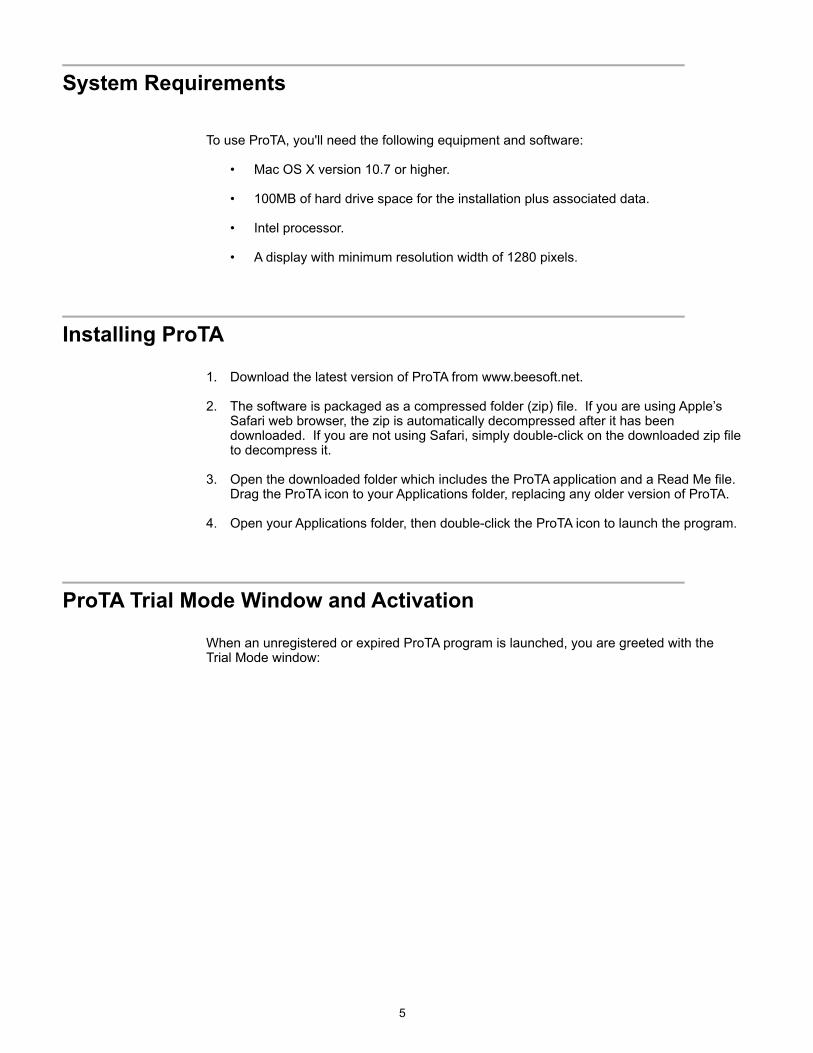
!ProTA Trial Mode Window and Activation
When an unregistered or expired ProTA program is launched, you are greeted with the Trial Mode window:
!5
!
Trial Mode
If you have not yet purchased an activation code, click the Evaluate in Trial Mode button to use the program in free Trial Mode.
Trial Mode is identical to the registered version with one exception: Your database is always limited to tracking the tickers that shipped with the Trial Mode. Otherwise, all features are fully functional for your evaluation.
Activating
Activating ProTA unlocks the database to be used with an unlimited number of tickers.
Click See Pricing or Purchase Activation Code to visit www.beesoft.net to purchase an activation code.
• Click the Enter Activation Code button.
!6
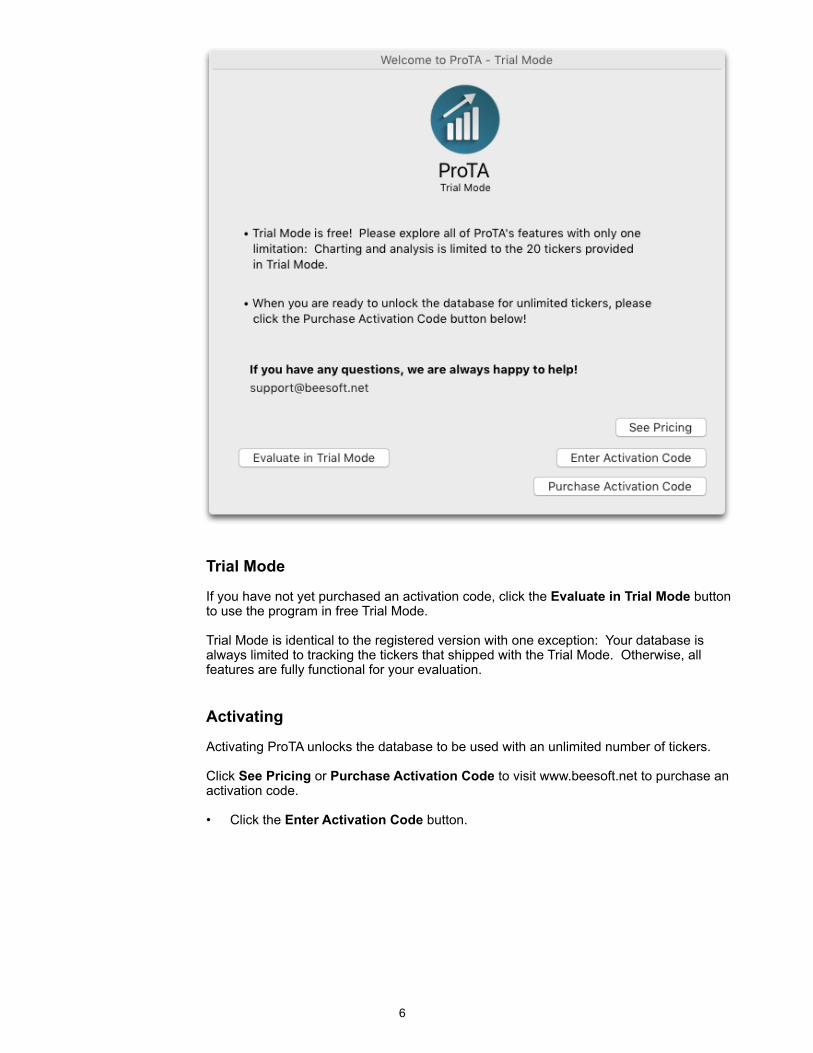
! • Enter the name and activation code exactly as it was provided to you, then click the
Activate button.
• Keep your registration information in a safe and private place! You may need it again for future installations and upgrades.
Upgrading ProTA 3 files
If you are a previous owner of ProTA 3 or ProTA Gold 3, please note the ProTA 3 database is NOT compatible with ProTA 4. ProTA 3 files need to be upgraded to be used in ProTA 4.
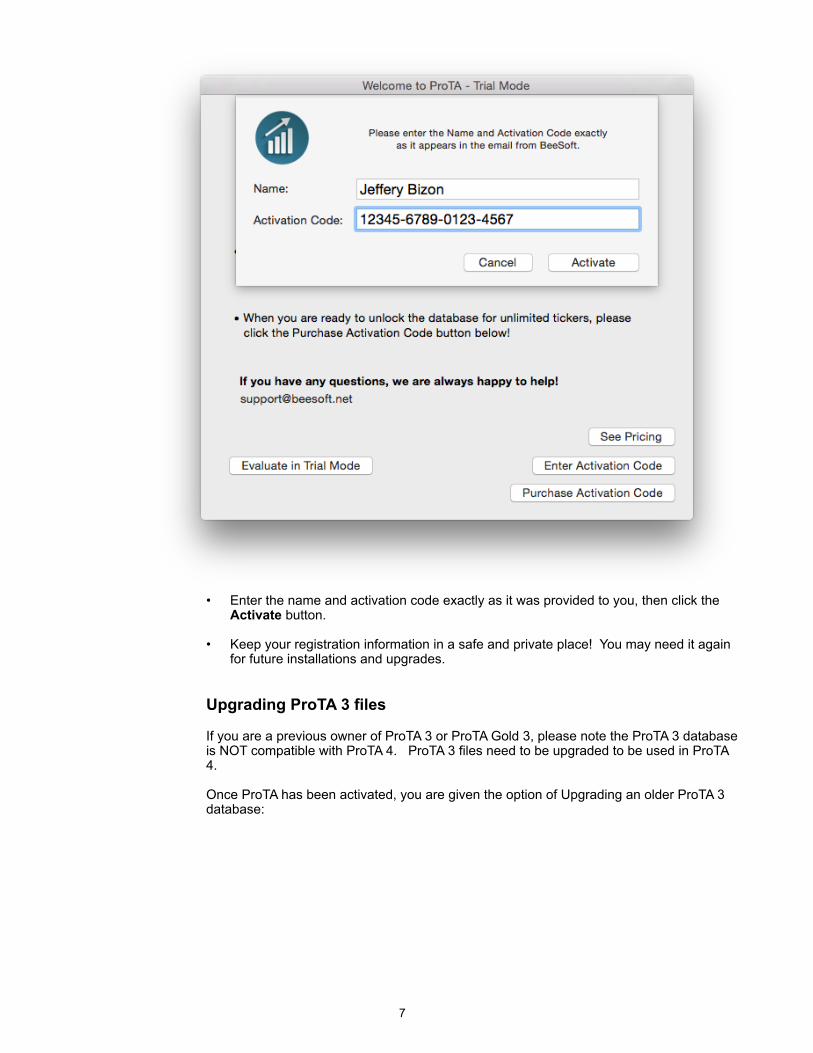
Once ProTA has been activated, you are given the option of Upgrading an older ProTA 3 database:
!7
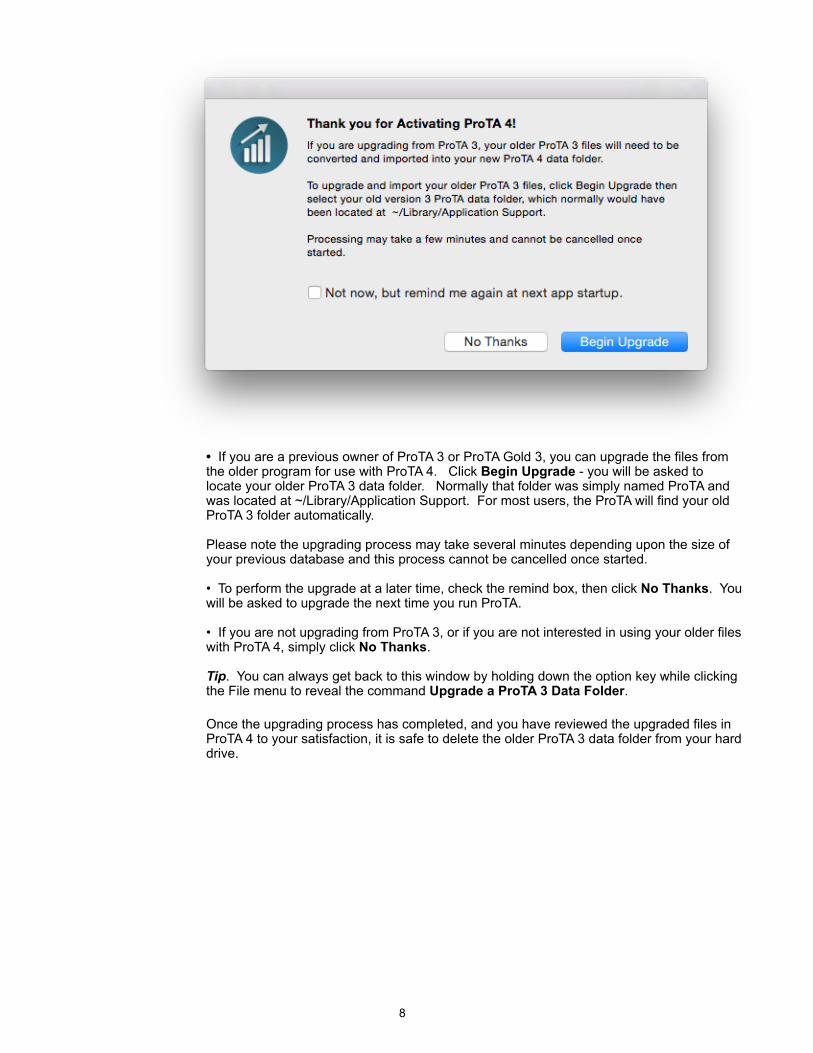
! • If you are a previous owner of ProTA 3 or ProTA Gold 3, you can upgrade the files from the older program for use with ProTA 4. Click Begin Upgrade - you will be asked to locate your older ProTA 3 data folder. Normally that folder was simply named ProTA and was located at ~/Library/Application Support. For most users, the ProTA will find your old ProTA 3 folder automatically.
Please note the upgrading process may take several minutes depending upon the size of your previous database and this process cannot be cancelled once started.
• To perform the upgrade at a later time, check the remind box, then click No Thanks. You will be asked to upgrade the next time you run ProTA.
• If you are not upgrading from ProTA 3, or if you are not interested in using your older files with ProTA 4, simply click No Thanks.
Tip. You can always get back to this window by holding down the option key while clicking the File menu to reveal the command Upgrade a ProTA 3 Data Folder.
Once the upgrading process has completed, and you have reviewed the upgraded files in ProTA 4 to your satisfaction, it is safe to delete the older ProTA 3 data folder from your hard drive.
!8
!ProTA Files
The entire ProTA installation consists of 3 items:
1. ProTA application. The application can reside anywhere, though your Applications folder is probably the best location.
2. com.beesoft.prota4.plist file. This is the Preferences file, located at: ~/Library/Preferences/com.beesoft.prota4.plist
3. ProTA folder. Contains all of your data files and saved work. By default it is located in your Documents folder.
Important. ProTA places your data files in specific locations within the ProTA folder structure. It is important that you do not rename or relocate any of the files or folders residing in the ProTA folder. All file maintenance can and should be administered from within the program. If you need to restore data from a backup, it is important you restore the entire ProTA folder as an intact whole.
Tip. Your ProTA folder can potentially consume many megabytes of hard disk space as your database grows. You can relocate the entire ProTA folder to another (larger) hard drive by moving the entire folder (while ProTA is NOT running). The next time you run ProTA, the program will ask you to locate your ProTA folder.
Advanced Tip. Most users will only need the single, default ProTA data folder, located in your Documents folder. Advanced users might find it useful to maintain more than one ProTA database. Hold down the option-key when launching ProTA to create additional ProTA databases or to selected between multiple ProTA databases. Only one ProTA database is usable at a time.
Uninstalling ProTA
To completely remove ProTA from your hard drive, simply drag the above 3 items to the Trash.
Backing Up Your Work
On a periodic basis, it is a good idea to make a backup copy of the ProTA related files that reside on your hard drive.
To backup your ProTA work, drag the ProTA folder to your backup medium. The preferences file stores window locations as well as your serial number, so for completeness, it is also recommended to backup the com.beesoft.prota4.plist file.
Note. The ProTA data folder is a set of inter-related and connected database files. It is important to backup and restore the entire ProTA folder intact as if it were a single integral whole unit. If you are interested in archiving/restoring a single file, please see the File Archives Appendix.
!9
!ProTA Workflow
The ProTA environment was designed to provide fast and intuitive access to all of ProTA’s features. This section covers the basic elements of the ProTA workflow. Each section here and items in bold are more deeply explored in their own chapters that follow.
Quotes Database
• TickerPicker (command-T). ProTA maintains a quotes database of prices and other market information locally on your hard drive. The name of this database is the TickerPicker. In order to chart or otherwise analyze a new security, the first step is always to create a quote file in the TickerPicker.
• Data Downloader (command-D). Each evening and throughout the trading day, ProTA’s Data Downloader will automatically keep your TickerPicker files up to date with fresh data, sourced from Yahoo! Finance.
(Optionally, you can also import data from 3rd-party web vendors (such as eoddata.com) using ProTA’s Universal Text Importer. Virtually any comma or tab delimited text files can be imported.)
Charting and Analysis
• Chart Suites (command-0). ProTA’s primary feature is the charting and technical analysis that takes place in Chart Suite windows. Chart Suites contain a Content Table and an associated Chart for each row in the table.
The Content Table can be a custom listing of tickers of your choosing, or it can be tied to a Smartlist you have created (see below).
Charts can be customized in many ways with Indicators, Custom Indicators, Trading Systems, and a variety of hand-placed Line Studies.
Authoring Custom Analysis
• Smartlists (Tools menu). Specify criteria to highlight an interesting subset of your entire TickerPicker database. “All Stocks Up > 2% Today” or “Buy Signal From My New Trading System” are easily defined in a Smartlist.
• Custom Indicators (Tools menu). Dozens of industry standard technical indicators are built into ProTA. Custom Indicators allow you to customize the existing indicators or write your own analytics from the ground up using a simple formula-building language ProTAscript.
• Trading Systems (Tools menu). Specify rules to Enter Long, Exit Long, Enter Short, Exit Short, Stops and Execution rules. ProTA computes and charts all trades along with a wide variety of statistics based on the historical results of your models.
• System Tests (Tools menu). Test your Trading Systems against a single ticker, a Batch of Tickers or allow ProTA to optimize the parameters of your models by testing thousands of parameter combinations and then viewing the model results in a sortable table of trading statistics.
Good luck with your investments!
!10
TickerPicker
!Overview
Quote files are the source documents ProTA uses as the basis for all charting, portfolio, scanning, system testing, and data displays. You cannot view a Chart Suite, apply a Trading System, etc. unless the desired ticker has been added your TickerPicker quotes database.
Internally, a separate ProTA quote file is maintained on your hard drive for each security you track. Each quote file contains the basic source information for the security including ticker symbol, name, type, decimal display, and years of historical daily pricing data.
The primary interface to your quotes database is the TickerPicker window. The TickerPicker window allows you to create, delete, edit and otherwise access your quotes database.
Note. It is important you do not rename or relocate any of the files or folders residing in the ProTA folder. All file maintenance can be easily administered from within the program.
!TickerPicker Window
The TickerPicker window is the primary interface to your quotes database. It serves as a simple summary listing of every quote file in your database as well as providing the tools to view, edit, add and delete quote files.
Open the TickerPicker in any of the following ways:
• Choose TickerPicker from the Quotes menu.
• Press command-T.
• ! Click this button when present in a ProTA window.
!11
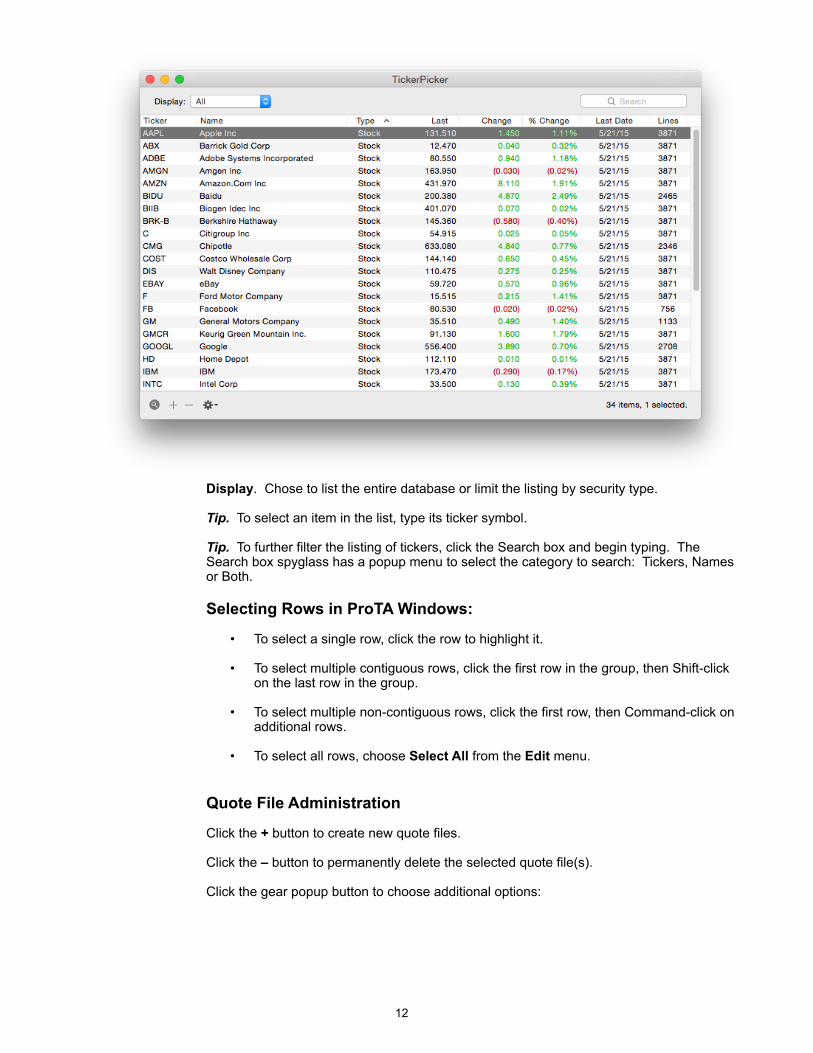
! Display. Chose to list the entire database or limit the listing by security type.
Tip. To select an item in the list, type its ticker symbol.
Tip. To further filter the listing of tickers, click the Search box and begin typing. The Search box spyglass has a popup menu to select the category to search: Tickers, Names or Both.
Selecting Rows in ProTA Windows:
• To select a single row, click the row to highlight it.
• To select multiple contiguous rows, click the first row in the group, then Shift-click on the last row in the group.
• To select multiple non-contiguous rows, click the first row, then Command-click on additional rows.
• To select all rows, choose Select All from the Edit menu.
Quote File Administration
Click the + button to create new quote files.
Click the – button to permanently delete the selected quote file(s).
Click the gear popup button to choose additional options:
!12
!
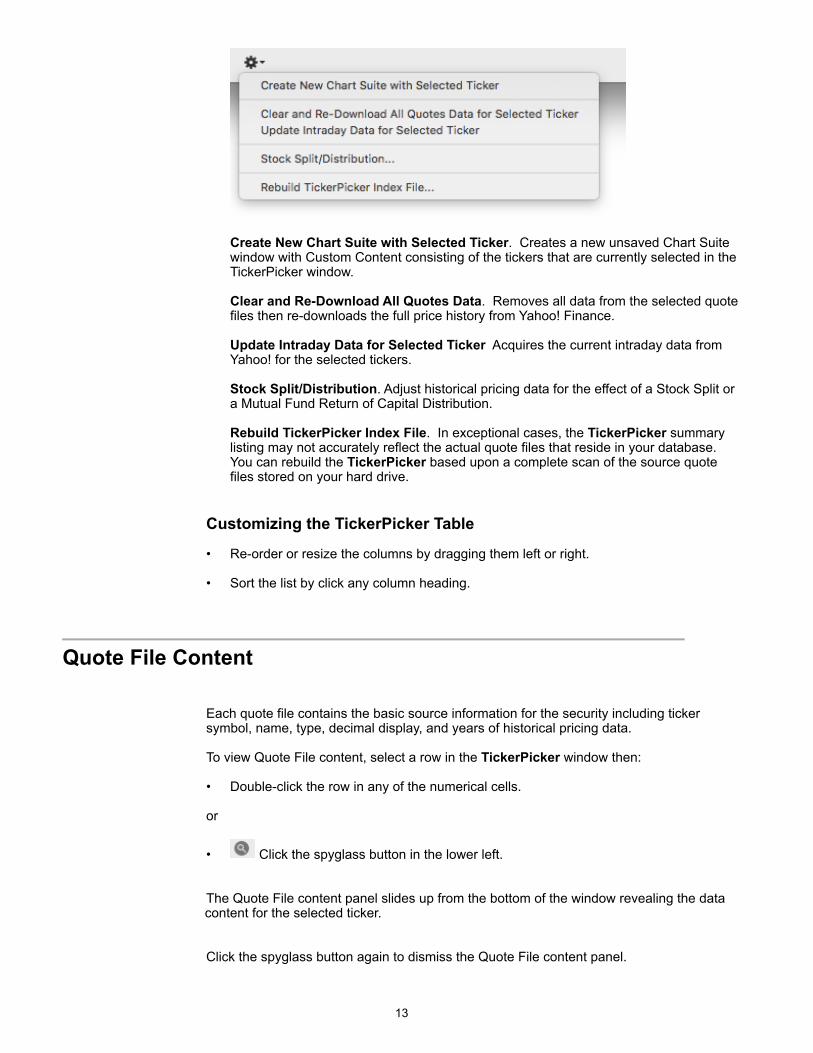
Create New Chart Suite with Selected Ticker. Creates a new unsaved Chart Suite window with Custom Content consisting of the tickers that are currently selected in the TickerPicker window.
Clear and Re-Download All Quotes Data. Removes all data from the selected quote files then re-downloads the full price history from Yahoo! Finance.
Update Intraday Data for Selected Ticker Acquires the current intraday data from Yahoo! for the selected tickers.
Stock Split/Distribution. Adjust historical pricing data for the effect of a Stock Split or a Mutual Fund Return of Capital Distribution.
Rebuild TickerPicker Index File. In exceptional cases, the TickerPicker summary listing may not accurately reflect the actual quote files that reside in your database. You can rebuild the TickerPicker based upon a complete scan of the source quote files stored on your hard drive.
Customizing the TickerPicker Table
• Re-order or resize the columns by dragging them left or right.
• Sort the list by click any column heading.
!Quote File Content
Each quote file contains the basic source information for the security including ticker symbol, name, type, decimal display, and years of historical pricing data.
To view Quote File content, select a row in the TickerPicker window then:
• Double-click the row in any of the numerical cells.
or
• ! Click the spyglass button in the lower left.
The Quote File content panel slides up from the bottom of the window revealing the data content for the selected ticker.
Click the spyglass button again to dismiss the Quote File content panel.
!13
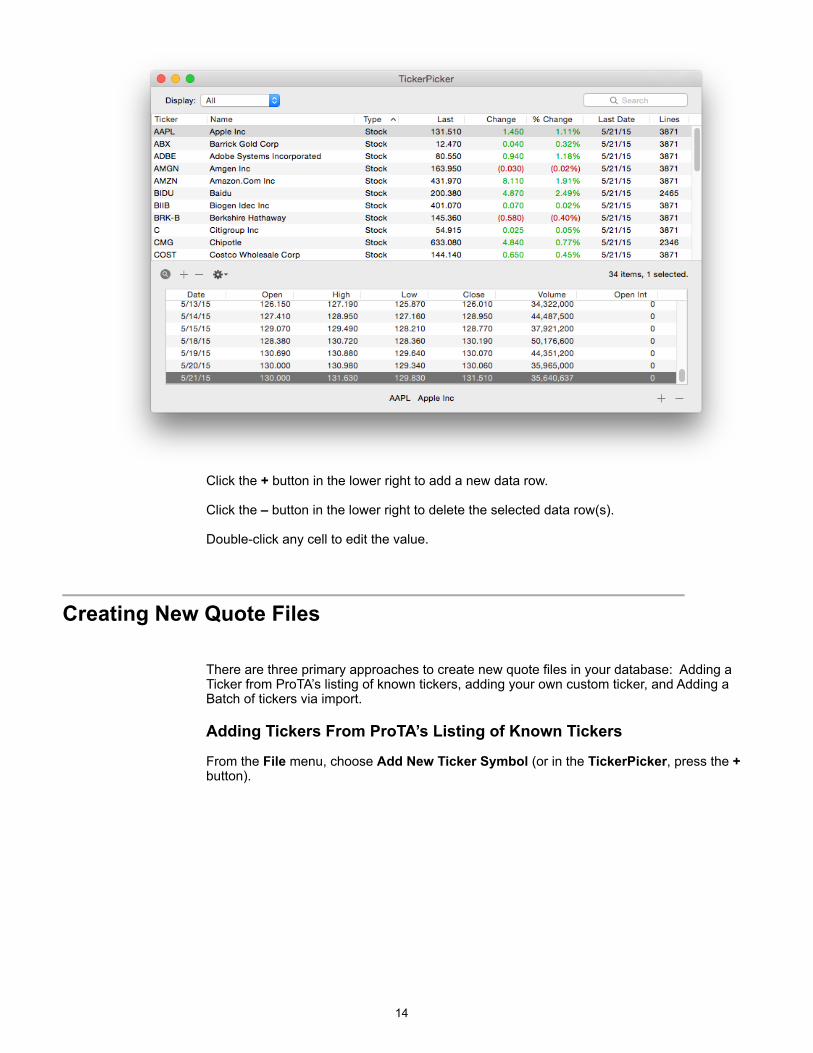
! Click the + button in the lower right to add a new data row.
Click the – button in the lower right to delete the selected data row(s).
Double-click any cell to edit the value.
!Creating New Quote Files
There are three primary approaches to create new quote files in your database: Adding a Ticker from ProTA’s listing of known tickers, adding your own custom ticker, and Adding a Batch of tickers via import.
Adding Tickers From ProTA’s Listing of Known Tickers
From the File menu, choose Add New Ticker Symbol (or in the TickerPicker, press the + button).
!14
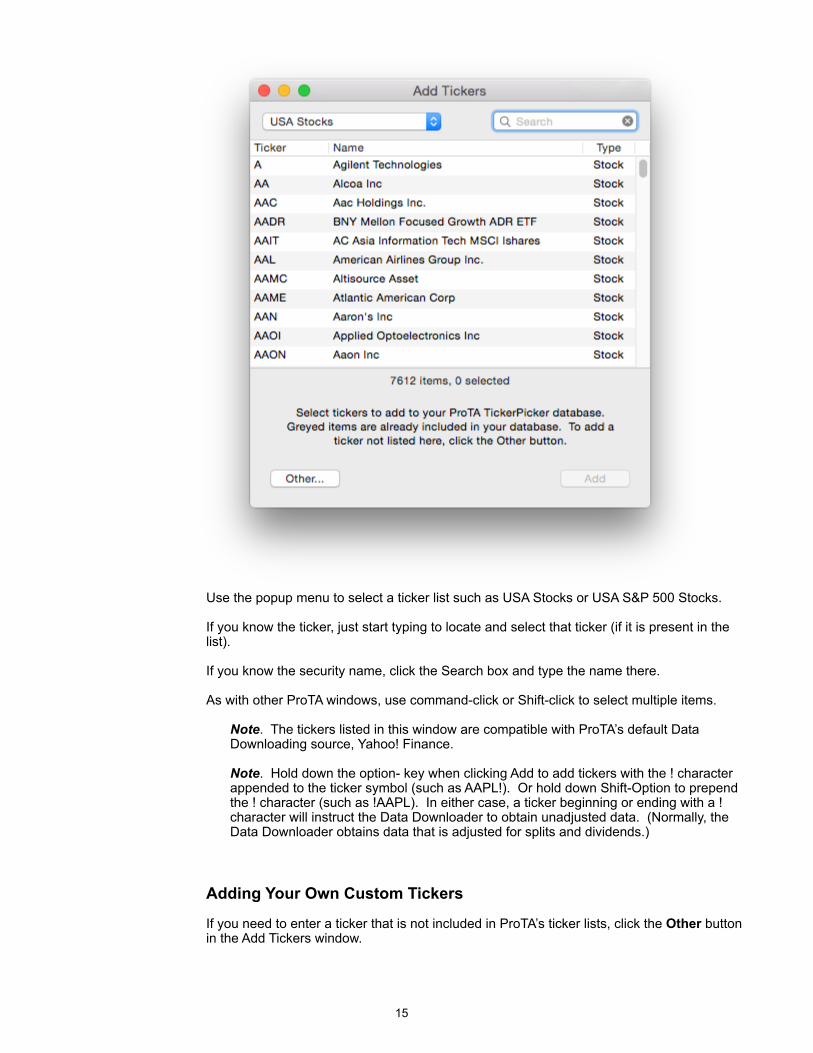
! Use the popup menu to select a ticker list such as USA Stocks or USA S&P 500 Stocks.
If you know the ticker, just start typing to locate and select that ticker (if it is present in the list).
If you know the security name, click the Search box and type the name there.
As with other ProTA windows, use command-click or Shift-click to select multiple items.
Note. The tickers listed in this window are compatible with ProTA’s default Data Downloading source, Yahoo! Finance.
Note. Hold down the option- key when clicking Add to add tickers with the ! character appended to the ticker symbol (such as AAPL!). Or hold down Shift-Option to prepend the ! character (such as !AAPL). In either case, a ticker beginning or ending with a ! character will instruct the Data Downloader to obtain unadjusted data. (Normally, the Data Downloader obtains data that is adjusted for splits and dividends.)
Adding Your Own Custom Tickers
If you need to enter a ticker that is not included in ProTA’s ticker lists, click the Other button in the Add Tickers window.
!15
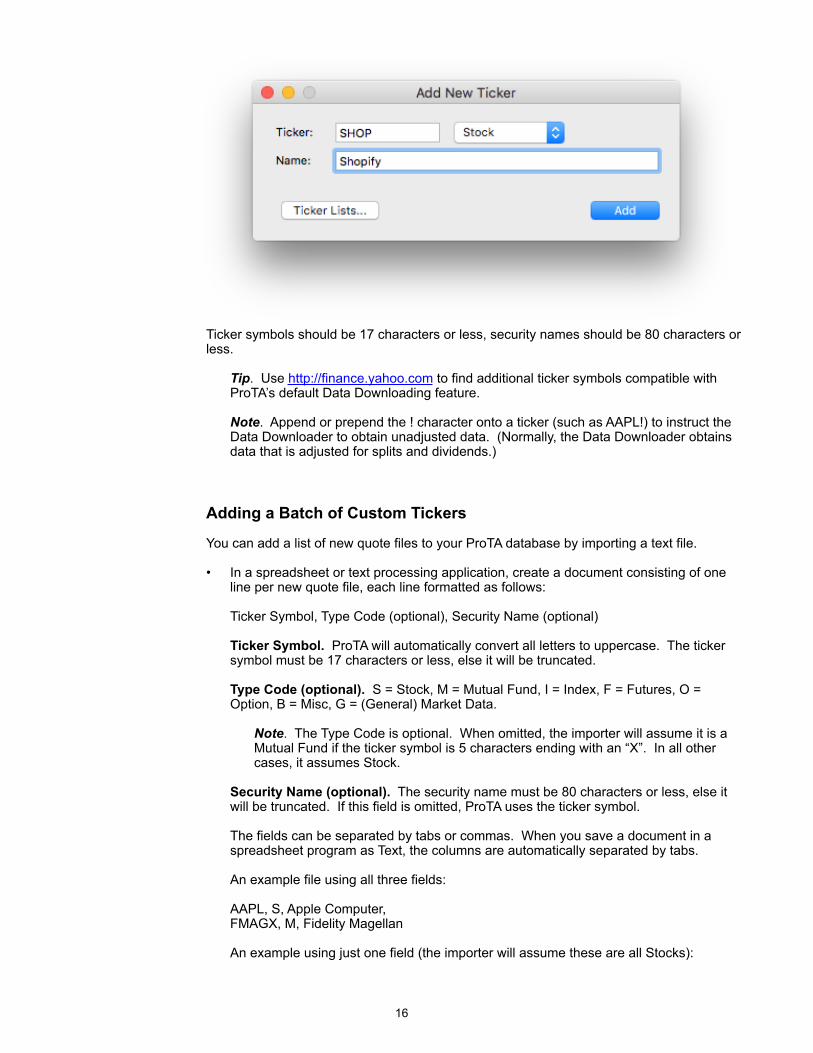
! Ticker symbols should be 17 characters or less, security names should be 80 characters or less.
Tip. Use http://finance.yahoo.com to find additional ticker symbols compatible with ProTA’s default Data Downloading feature.
Note. Append or prepend the ! character onto a ticker (such as AAPL!) to instruct the Data Downloader to obtain unadjusted data. (Normally, the Data Downloader obtains data that is adjusted for splits and dividends.)
Adding a Batch of Custom Tickers
You can add a list of new quote files to your ProTA database by importing a text file.
• In a spreadsheet or text processing application, create a document consisting of one line per new quote file, each line formatted as follows:
Ticker Symbol, Type Code (optional), Security Name (optional)
Ticker Symbol. ProTA will automatically convert all letters to uppercase. The ticker symbol must be 17 characters or less, else it will be truncated.
Type Code (optional). S = Stock, M = Mutual Fund, I = Index, F = Futures, O = Option, B = Misc, G = (General) Market Data.
Note. The Type Code is optional. When omitted, the importer will assume it is a Mutual Fund if the ticker symbol is 5 characters ending with an “X”. In all other cases, it assumes Stock.
Security Name (optional). The security name must be 80 characters or less, else it will be truncated. If this field is omitted, ProTA uses the ticker symbol.
The fields can be separated by tabs or commas. When you save a document in a spreadsheet program as Text, the columns are automatically separated by tabs.
An example file using all three fields:
AAPL, S, Apple Computer, FMAGX, M, Fidelity Magellan
An example using just one field (the importer will assume these are all Stocks):
!16
AAPL MSFT IBM
• Save the document as a text file.
Tip. If you are using Apple’s TextEdit application, you can make a plain text document by choosing Make Plain Text from the Format menu. Then save the document.
Tip. If you are using Microsoft Excel, you can place the three fields in columns A through C, then choose Save As. In the Save As window, use the Format popup menu to select either Text (Tab delimited) or CSV (Comma delimited).
• From the Quotes menu, choose Universal Text Importer. Press the + button, then select the Text file from the Open dialog box.
Please see the Universal Text Importer chapter for more complete instructions regarding text imports.
! Editing a Quote File Spec
When a security changes ticker or name, you can reflect that change in your TickerPicker database. In the TickerPicker window:
• Double-click the ticker or security name to edit. Type in the new text and press Return to save the changes.
• Double-click the Type cell to change a ticker’s Type category. Choose the new Type from the popup menu.
!Updating Quote File Data
For most users, ProTA’s Data Downloader will automatically obtain historical and current data for you. Please see the Data Downloader chapter for configuration and usage details.
!Alternative Methods to Update Quote File Data
ProTA quote files can be updated via manual data entry in a manner similar to that of a spreadsheet.
• View the Quote File’s content (via the TickerPicker spyglass button, see above).
Adding Data
• Click the + button in the lower right to add a new row of data.
• On the new row. enter the date. Use the tab key to advance to the next cell right. Enter the remaining quote values for the row.
!17
• Press Enter or Return. The new quote record is immediately sorted in the window, by date. Unlike a spreadsheet document, ProTA saves changes to your quote files as soon as they are entered.
Editing Data
Any cell in a ProTA quote file can be edited in a manner similar to that of a spreadsheet.
• Double-click the mouse in any cell, then type, backspace, or otherwise edit the value in the cell in the same manner as any OS X edit field.
Deleting Data
• Highlight the row(s) to be deleted. Use command-click or shift-click to select multiple rows.
• Click the - button in the lower right.
Updating via Copy/Paste
Data from a spreadsheet program or text data in a comma or tab delimited format can be pasted directly into a ProTA quote file window. The columns displayed in the spreadsheet must be in the same order as the fields in ProTA’s TickerPicker window (Date, Open, High, etc.).
• Select and Copy all of the data in the spreadsheet program or text processor.
• Switch to ProTA. View the destination Quote File contents.
• Click the Quote File contents table to select it, then choose Paste from the Edit menu.
ProTA follows several simple rules when Pasting data from the clipboard:
• Lines of text that do not begin with a valid date are skipped.
• Control characters and line feed characters that sometimes reside in PC-compatible source files are safely ignored.
• Invalid quote field values will be converted to zeros. For example, any price field that contains alpha-characters.
• When an incoming row has the same date as an existing row, the incoming row replaces the old row.
• All rows are automatically sorted in the quote file, by date.
Updating via Text File Import
You can update individual quote files or update a group of quote files via import from a text file. Both processes are handled by ProTA's Universal Text Importer, which is covered in full detail in its own chapter.
• From the Quotes menu, select Universal Text Importer.
!18
!Adjust a Quote File for a Split/Distribution
A company will split its stock to decrease the price and improve liquidity. A stock split will create a large gap in the pricing and volume data in your quote file. Frequently, a mutual fund will pay a return of capital distribution which affects subsequent pricing of the fund.
There are two approaches to dealing with splits and distributions: Reacquire split-adjusted data or Manually adjust the existing historical data yourself.
Require Adjusted Data
If your data source provides split-adjusted data information, it is usually easiest to simply remove all of the data from your quote file, then reacquire the split-adjusted data. ProTA’s Data Downloader performs this type of automatic adjusting for historical data downloads.
• In the TickerPicker, select the ticker’s row.
• Click the Gear widget at the bottom and choose Clear and Re-Download Quotes Data.
Manually Adjusting For Stock Split/Distribution
• In the TickerPicker, select the ticker’s row.
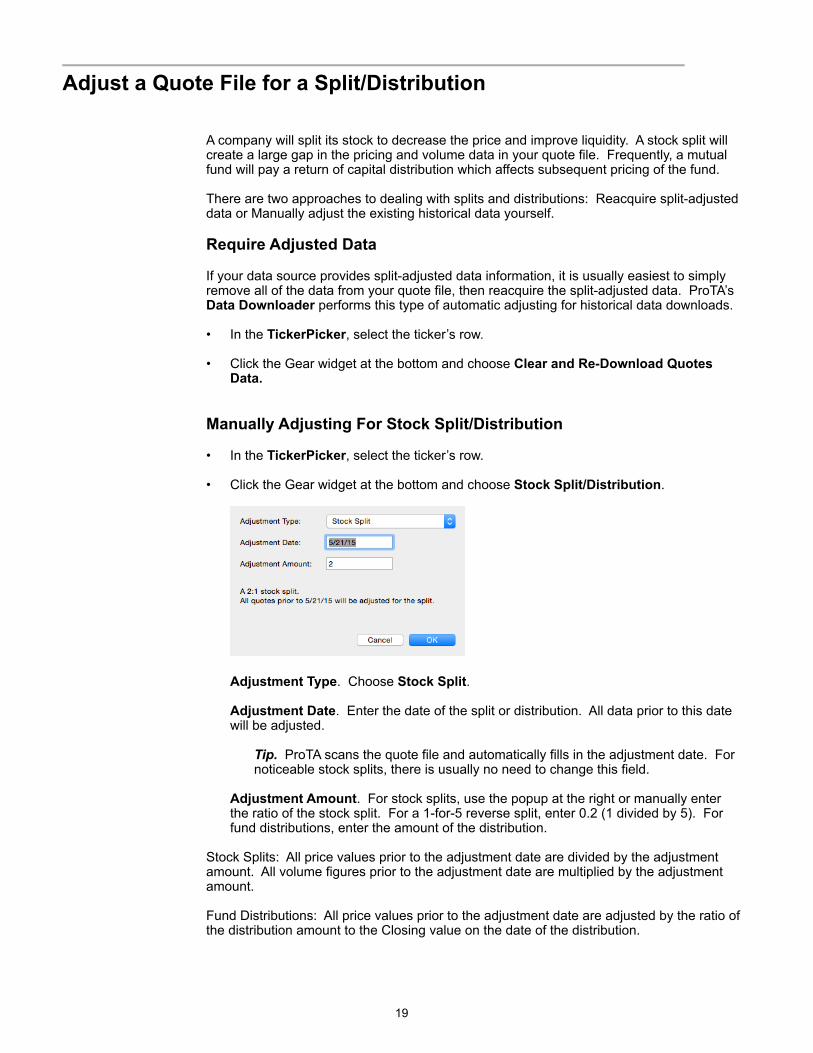
• Click the Gear widget at the bottom and choose Stock Split/Distribution.
!
Adjustment Type. Choose Stock Split.
Adjustment Date. Enter the date of the split or distribution. All data prior to this date will be adjusted.
Tip. ProTA scans the quote file and automatically fills in the adjustment date. For noticeable stock splits, there is usually no need to change this field.
Adjustment Amount. For stock splits, use the popup at the right or manually enter the ratio of the stock split. For a 1-for-5 reverse split, enter 0.2 (1 divided by 5). For fund distributions, enter the amount of the distribution.
Stock Splits: All price values prior to the adjustment date are divided by the adjustment amount. All volume figures prior to the adjustment date are multiplied by the adjustment amount.
Fund Distributions: All price values prior to the adjustment date are adjusted by the ratio of the distribution amount to the Closing value on the date of the distribution.
!19
For example, a fund priced at $12.50 on 8/6/96 pays a $1.00 distribution and falls to $11.00 on 8/7/96. Enter 8/7/96 as the adjustment date and 1.00 as the adjustment amount. ProTA will reduce all price values prior to 8/7/96 by 8.333% (1.00/(11.00 + 1.00)).
!Batch Processing Multiple Quote Files
The Batch Processing tools allow you to perform operations for a set of quote files.
• From the Tools menu, choose Batch Processing.
• Select one of the four Batch Processing actions at the left.
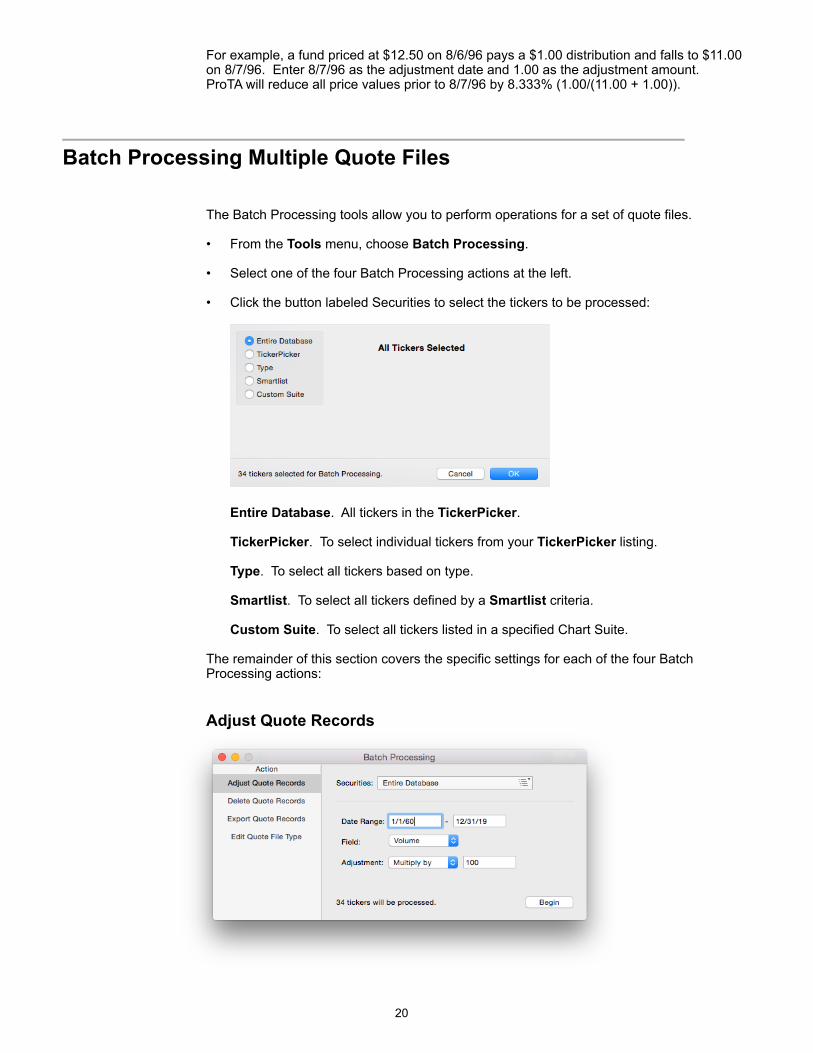
• Click the button labeled Securities to select the tickers to be processed:
!
Entire Database. All tickers in the TickerPicker.
TickerPicker. To select individual tickers from your TickerPicker listing.
Type. To select all tickers based on type.
Smartlist. To select all tickers defined by a Smartlist criteria.
Custom Suite. To select all tickers listed in a specified Chart Suite.
The remainder of this section covers the specific settings for each of the four Batch Processing actions:
Adjust Quote Records
!
!20
Date Range. Specify the beginning and editing dates (inclusive) to adjust within each quote file. Select a wide range of dates such as 1/1/1960 – 12/31/2019 to adjust all records within each quote file.
Field(s). Choose the Field to adjust. Select OHLC to adjust four fields: Open, High, Low and Close.
Adjustment. Choose the operation and an amount for the adjustments.
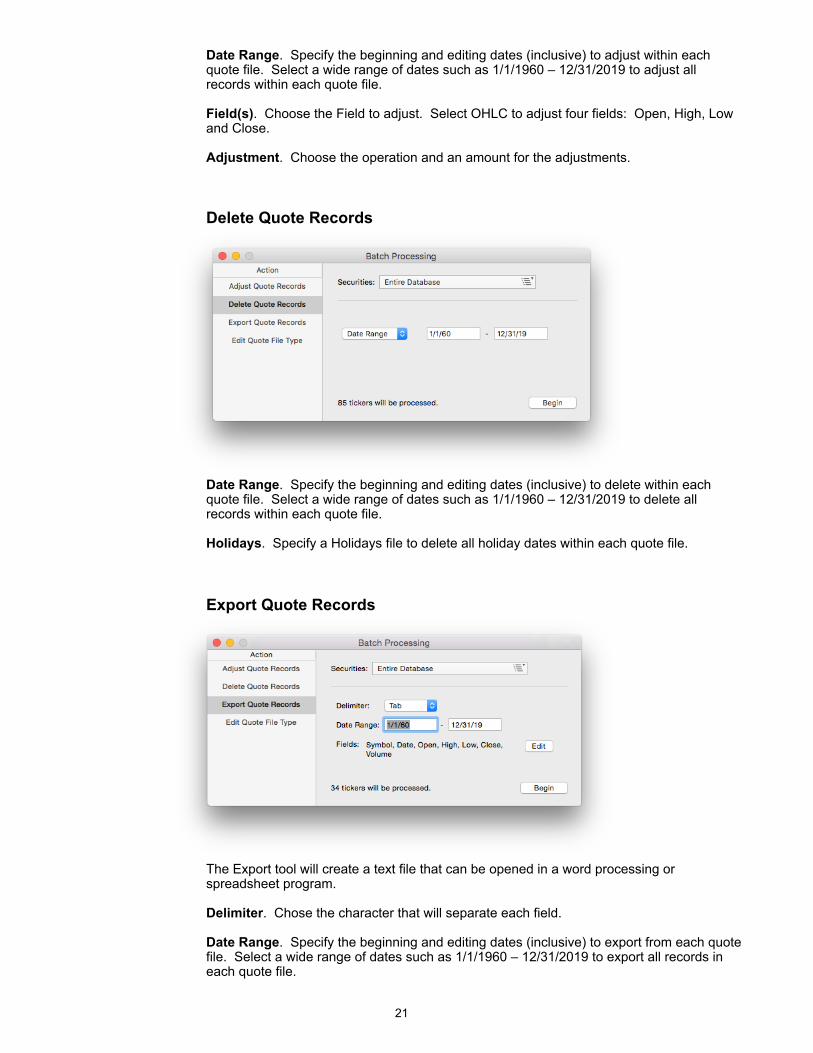
Delete Quote Records
! Date Range. Specify the beginning and editing dates (inclusive) to delete within each quote file. Select a wide range of dates such as 1/1/1960 – 12/31/2019 to delete all records within each quote file.
Holidays. Specify a Holidays file to delete all holiday dates within each quote file.
Export Quote Records
! The Export tool will create a text file that can be opened in a word processing or spreadsheet program.
Delimiter. Chose the character that will separate each field.
Date Range. Specify the beginning and editing dates (inclusive) to export from each quote file. Select a wide range of dates such as 1/1/1960 – 12/31/2019 to export all records in each quote file.
!21
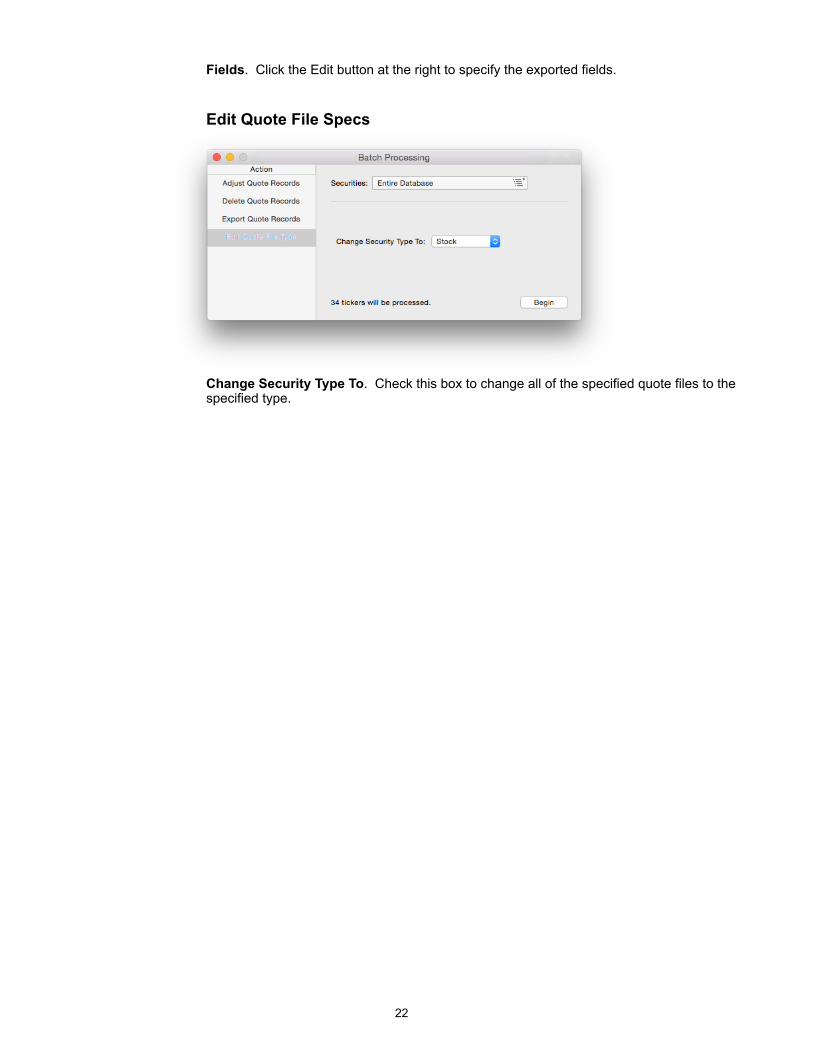
Fields. Click the Edit button at the right to specify the exported fields.
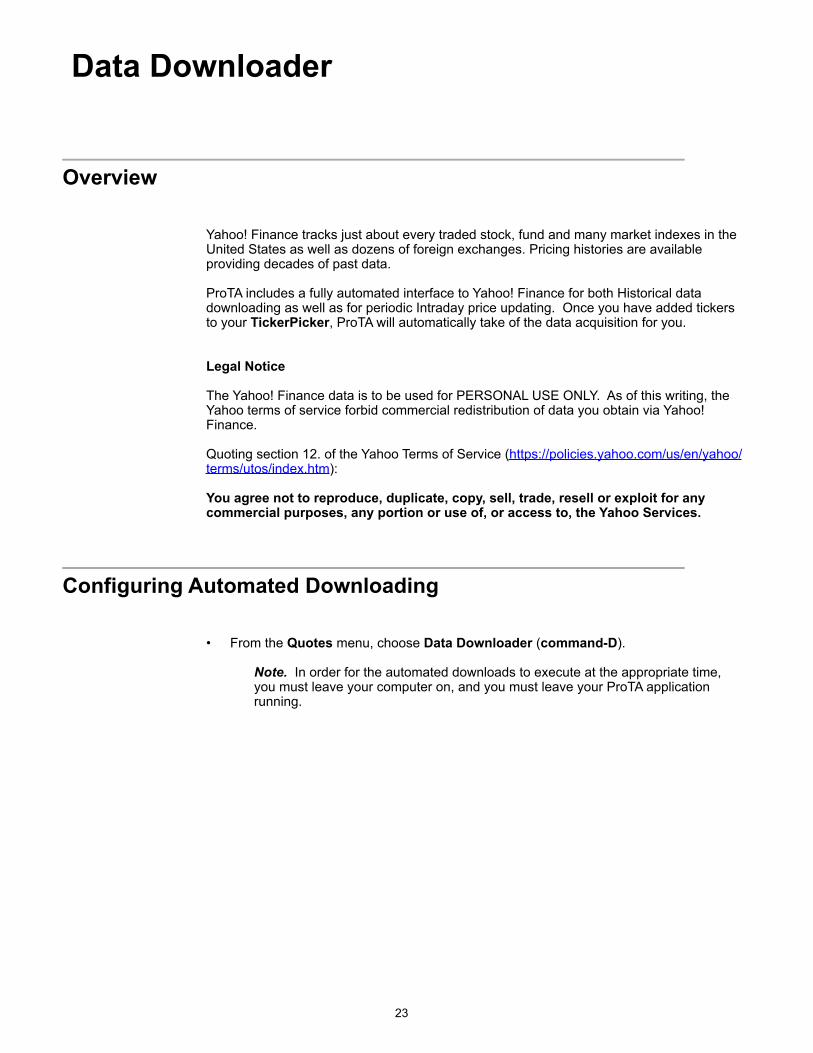
Edit Quote File Specs
! Change Security Type To. Check this box to change all of the specified quote files to the specified type.
!22
Data Downloader
!Overview
Yahoo! Finance tracks just about every traded stock, fund and many market indexes in the United States as well as dozens of foreign exchanges. Pricing histories are available providing decades of past data.
ProTA includes a fully automated interface to Yahoo! Finance for both Historical data downloading as well as for periodic Intraday price updating. Once you have added tickers to your TickerPicker, ProTA will automatically take of the data acquisition for you.
Legal Notice
The Yahoo! Finance data is to be used for PERSONAL USE ONLY. As of this writing, the Yahoo terms of service forbid commercial redistribution of data you obtain via Yahoo! Finance.
Quoting section 12. of the Yahoo Terms of Service (https://policies.yahoo.com/us/en/yahoo/terms/utos/index.htm):
You agree not to reproduce, duplicate, copy, sell, trade, resell or exploit for any commercial purposes, any portion or use of, or access to, the Yahoo Services.
!Configuring Automated Downloading
• From the Quotes menu, choose Data Downloader (command-D).
Note. In order for the automated downloads to execute at the appropriate time, you must leave your computer on, and you must leave your ProTA application running.
!23
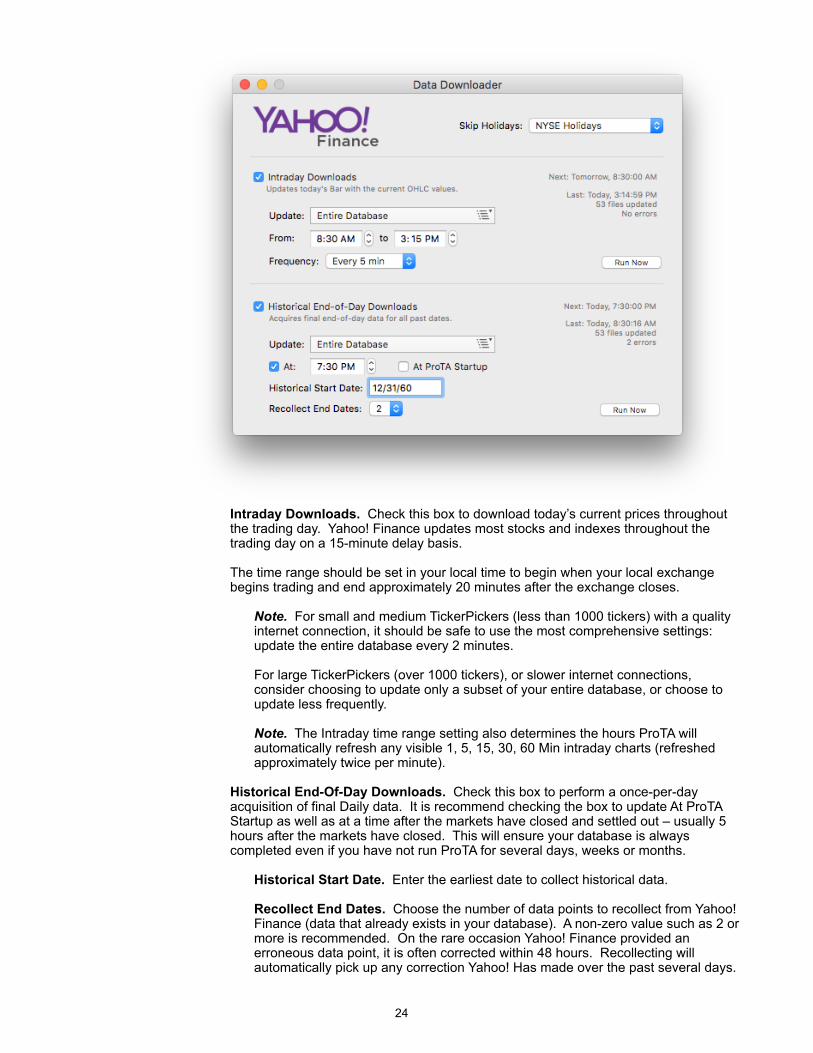
! Intraday Downloads. Check this box to download today’s current prices throughout the trading day. Yahoo! Finance updates most stocks and indexes throughout the trading day on a 15-minute delay basis.
The time range should be set in your local time to begin when your local exchange begins trading and end approximately 20 minutes after the exchange closes.
Note. For small and medium TickerPickers (less than 1000 tickers) with a quality internet connection, it should be safe to use the most comprehensive settings: update the entire database every 2 minutes.
For large TickerPickers (over 1000 tickers), or slower internet connections, consider choosing to update only a subset of your entire database, or choose to update less frequently.
Note. The Intraday time range setting also determines the hours ProTA will automatically refresh any visible 1, 5, 15, 30, 60 Min intraday charts (refreshed approximately twice per minute).
Historical End-Of-Day Downloads. Check this box to perform a once-per-day acquisition of final Daily data. It is recommend checking the box to update At ProTA Startup as well as at a time after the markets have closed and settled out – usually 5 hours after the markets have closed. This will ensure your database is always completed even if you have not run ProTA for several days, weeks or months.
Historical Start Date. Enter the earliest date to collect historical data.
Recollect End Dates. Choose the number of data points to recollect from Yahoo! Finance (data that already exists in your database). A non-zero value such as 2 or more is recommended. On the rare occasion Yahoo! Finance provided an erroneous data point, it is often corrected within 48 hours. Recollecting will automatically pick up any correction Yahoo! Has made over the past several days.
!24
Note. ProTA will compare the End Date to the last date in each quote file. If the End Date is greater than the last date in the quote file, ProTA will request the missing data from Yahoo. If the quote file is empty, ProTA will request data from the Start Date through the End Date.
Note. In additional to Quotes data, each Stock can have up to 23 Fundamental Data values associated with it. These values are automatically pulled from Yahoo! during ProTA’s data acquisition sessions.
!Manual Download Sessions
Occasionally there will be a need to run a download session immediately rather than waiting for one of the Automated sessions trigger.
Running a Download Session Immediately
• From the Quotes menu, choose Data Downloader (command-D).
• Click one of the two Run Now buttons to begin a custom download session right now. Before the download begins, you will be asked to choose which tickers to include in the download session.
• For any chart, choose Update Intraday Data Now from the Quotes menu.
Reacquiring All Data For a Ticker
Under certain circumstances, you may need to remove all of the data for a ticker and reacquire fresh data. Some examples are a stock split, or if you notice a gap in your data, or perhaps there is a bad data point in the historical data. You can clear out all of the data for that ticker and reacquire it from Yahoo!:
• For any chart, choose Clear and Re-Download Quotes Data from the Quotes menu.
• In the TickerPicker (command-T) window, select the ticker, then click the Gear widget at the bottom to select Clear and Re-Download Quotes Data.
Visting Yahoo! Finance
• While viewing any chart, choose Visit Yahoo’s Web Page For TICKER from the Quotes menu.
!Reviewing Download Session Logs
Short summaries of the most recent Intraday and Historical download session are displayed on the right side of the Data Downloader window.
ProTA also retains a cumulative Log of all recent download sessions.
• In the Data Downloader (command-D) window, hover the mouse over the right side of the window to reveal the Show Log button.
or
• Choose Logs from the Tools menu.
!25
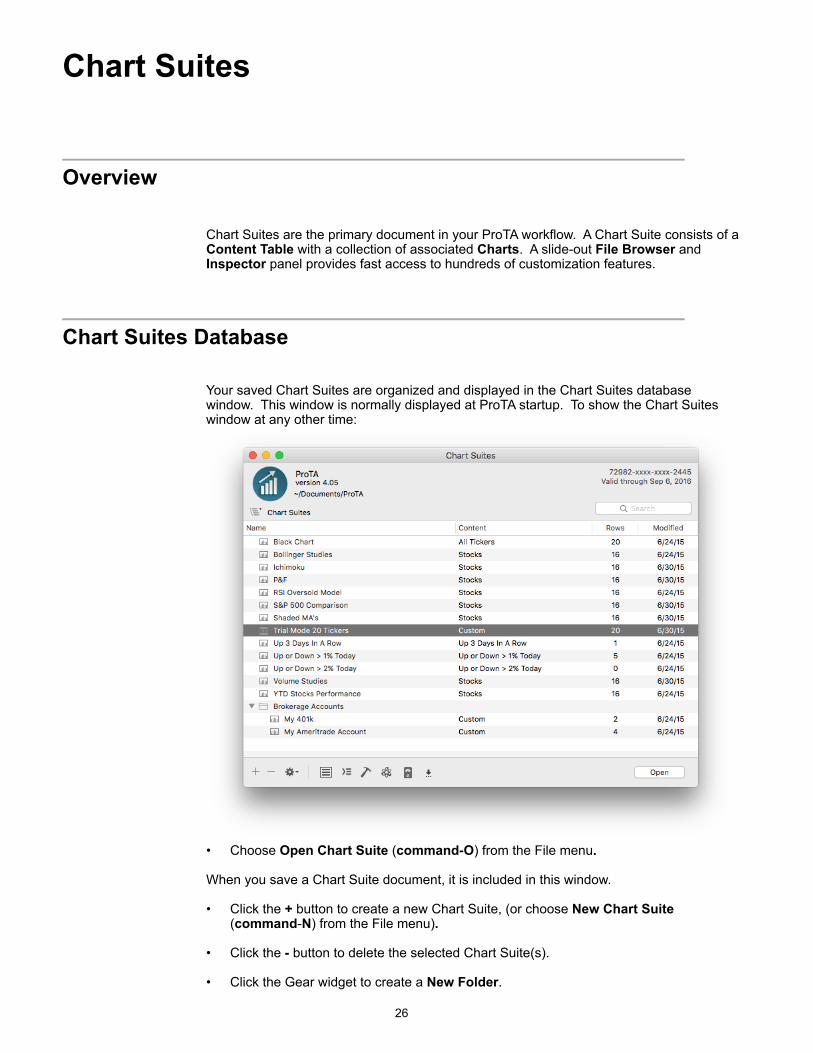
Chart Suites
!Overview
Chart Suites are the primary document in your ProTA workflow. A Chart Suite consists of a Content Table with a collection of associated Charts. A slide-out File Browser and Inspector panel provides fast access to hundreds of customization features.
! Chart Suites Database
Your saved Chart Suites are organized and displayed in the Chart Suites database window. This window is normally displayed at ProTA startup. To show the Chart Suites window at any other time:
! • Choose Open Chart Suite (command-O) from the File menu.
When you save a Chart Suite document, it is included in this window.
• Click the + button to create a new Chart Suite, (or choose New Chart Suite (command-N) from the File menu).
• Click the - button to delete the selected Chart Suite(s).
• Click the Gear widget to create a New Folder.
!26
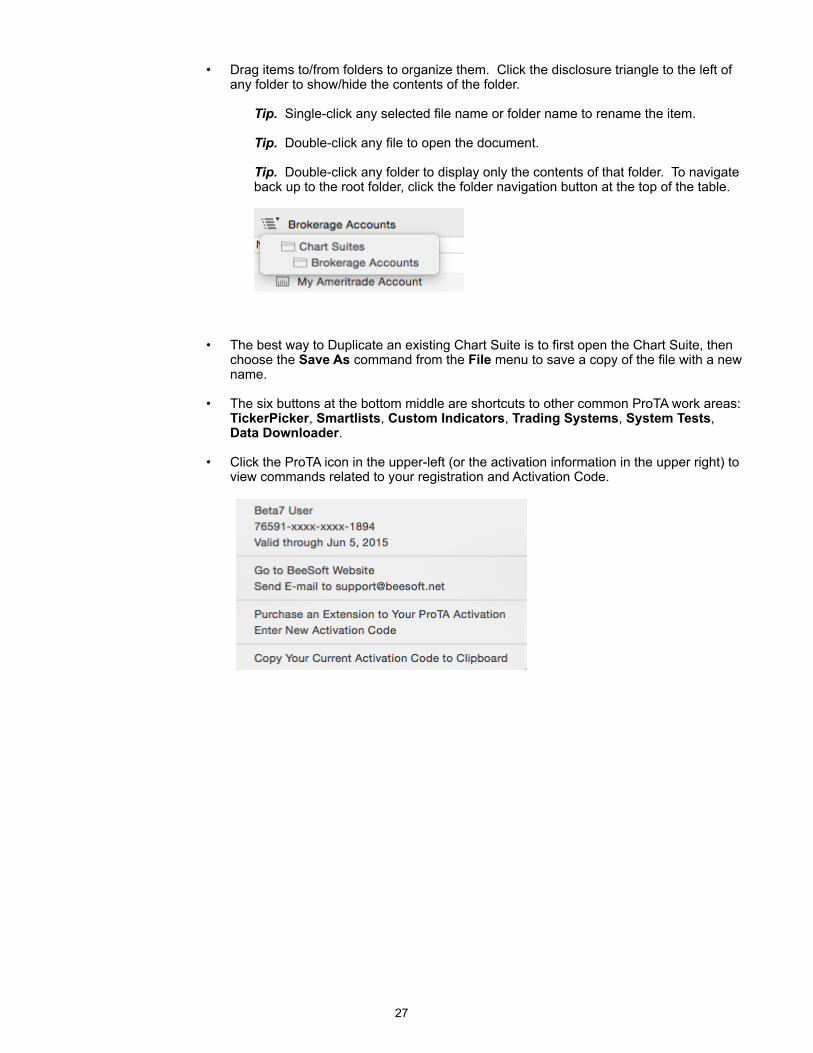
• Drag items to/from folders to organize them. Click the disclosure triangle to the left of any folder to show/hide the contents of the folder.
Tip. Single-click any selected file name or folder name to rename the item.
Tip. Double-click any file to open the document.
Tip. Double-click any folder to display only the contents of that folder. To navigate back up to the root folder, click the folder navigation button at the top of the table.
!
• The best way to Duplicate an existing Chart Suite is to first open the Chart Suite, then choose the Save As command from the File menu to save a copy of the file with a new name.
• The six buttons at the bottom middle are shortcuts to other common ProTA work areas: TickerPicker, Smartlists, Custom Indicators, Trading Systems, System Tests, Data Downloader.
• Click the ProTA icon in the upper-left (or the activation information in the upper right) to view commands related to your registration and Activation Code.
!
!27

!Anatomy of a Chart Suite
• Choose New Chart Suite (command-N) from the File menu.
!
Content Table. A customizable listing of the charts included in the Chart Suite. Discussed in detail in the following chapter.
Charts. Each row in the Content Table has an associated chart. A single chart is displayed above – up to 25 charts can be shown at once in a grid. Please see the separate Charts chapter for details.
Toolbar. Shortcut access to the primary tools used to manage and customize Charts.
File Browser. Detailed access to the analytics that define the Chart Suite: Tickers, Smartlists, Standard Indicators, Custom Indicators, Trading Systems, Chart Templates, Columns Templates.
Inspector. Customize colors, styles, and parameters of the selected Chart or Content Table item.
Tip. You can customize the layout, display and content for all newly created Chart Suites. Choose Preferences from the ProTA menu. To set a default window size for newly created Chart Suites, resize any existing Chart Suite window, then choose Save Current Window Size as Default from the Window menu.
!28
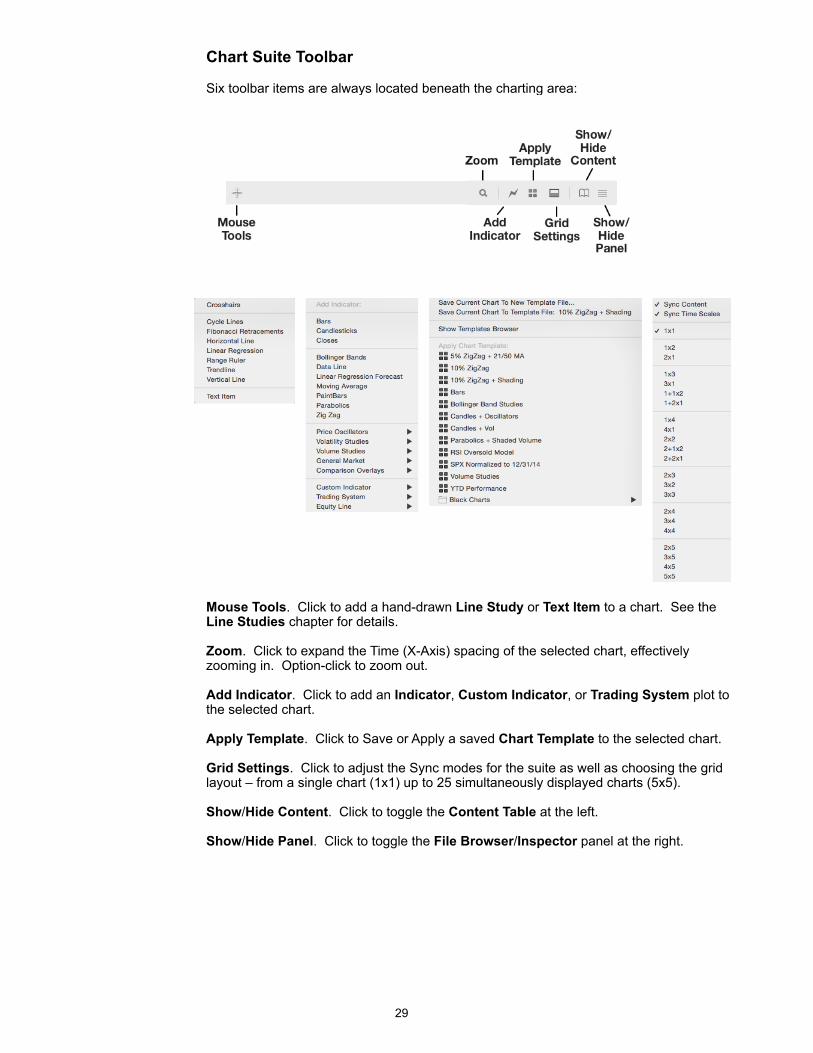
Chart Suite Toolbar
Six toolbar items are always located beneath the charting area:
!
!
Mouse Tools. Click to add a hand-drawn Line Study or Text Item to a chart. See the Line Studies chapter for details.
Zoom. Click to expand the Time (X-Axis) spacing of the selected chart, effectively zooming in. Option-click to zoom out.
Add Indicator. Click to add an Indicator, Custom Indicator, or Trading System plot to the selected chart.
Apply Template. Click to Save or Apply a saved Chart Template to the selected chart.
Grid Settings. Click to adjust the Sync modes for the suite as well as choosing the grid layout – from a single chart (1x1) up to 25 simultaneously displayed charts (5x5).
Show/Hide Content. Click to toggle the Content Table at the left.
Show/Hide Panel. Click to toggle the File Browser/Inspector panel at the right.
!29
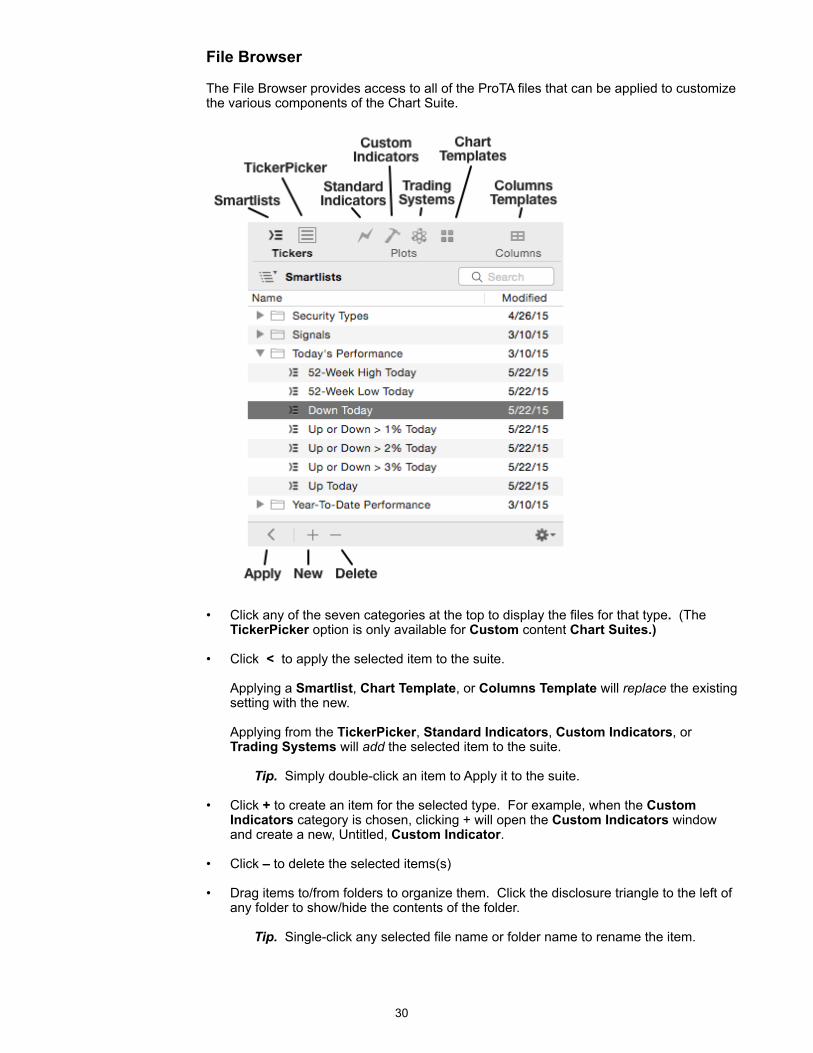
File Browser
The File Browser provides access to all of the ProTA files that can be applied to customize the various components of the Chart Suite.
!
• Click any of the seven categories at the top to display the files for that type. (The TickerPicker option is only available for Custom content Chart Suites.)
• Click < to apply the selected item to the suite.
Applying a Smartlist, Chart Template, or Columns Template will replace the existing setting with the new.
Applying from the TickerPicker, Standard Indicators, Custom Indicators, or Trading Systems will add the selected item to the suite.
Tip. Simply double-click an item to Apply it to the suite.
• Click + to create an item for the selected type. For example, when the Custom Indicators category is chosen, clicking + will open the Custom Indicators window and create a new, Untitled, Custom Indicator.
• Click – to delete the selected items(s)
• Drag items to/from folders to organize them. Click the disclosure triangle to the left of any folder to show/hide the contents of the folder.
Tip. Single-click any selected file name or folder name to rename the item.
!30
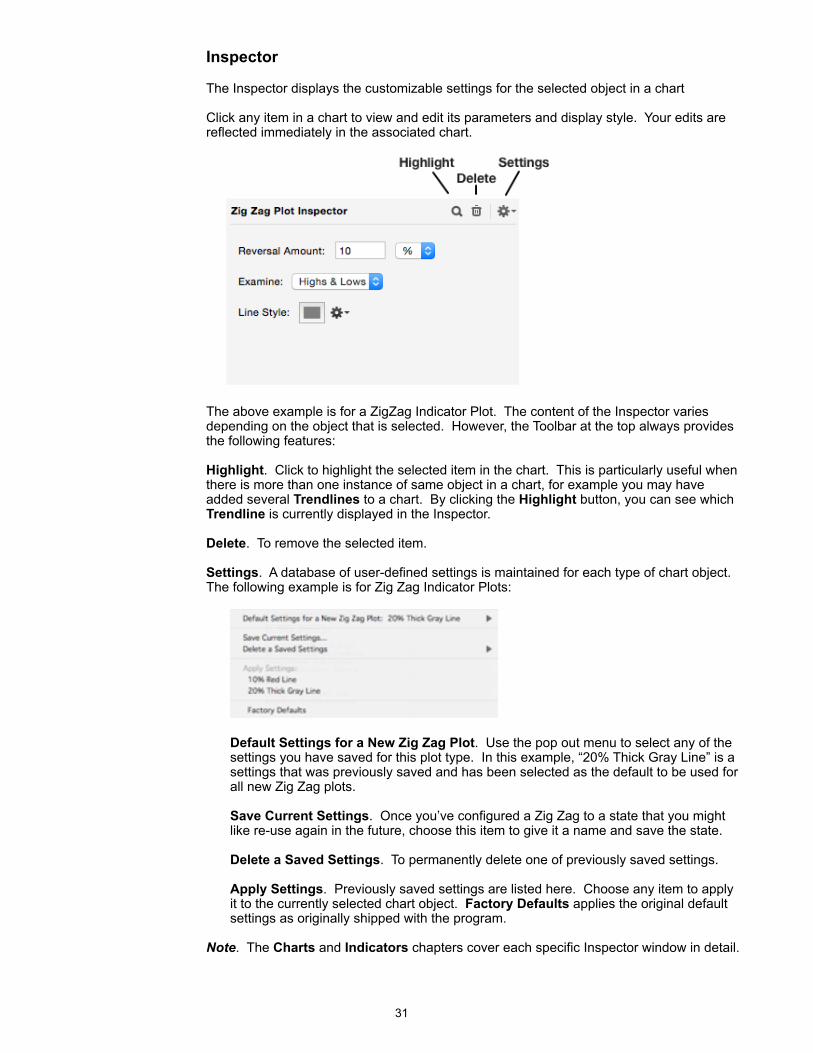
Inspector
The Inspector displays the customizable settings for the selected object in a chart
Click any item in a chart to view and edit its parameters and display style. Your edits are reflected immediately in the associated chart.
!
The above example is for a ZigZag Indicator Plot. The content of the Inspector varies depending on the object that is selected. However, the Toolbar at the top always provides the following features:
Highlight. Click to highlight the selected item in the chart. This is particularly useful when there is more than one instance of same object in a chart, for example you may have added several Trendlines to a chart. By clicking the Highlight button, you can see which Trendline is currently displayed in the Inspector.
Delete. To remove the selected item.
Settings. A database of user-defined settings is maintained for each type of chart object. The following example is for Zig Zag Indicator Plots:
!
Default Settings for a New Zig Zag Plot. Use the pop out menu to select any of the settings you have saved for this plot type. In this example, “20% Thick Gray Line” is a settings that was previously saved and has been selected as the default to be used for all new Zig Zag plots.
Save Current Settings. Once you’ve configured a Zig Zag to a state that you might like re-use again in the future, choose this item to give it a name and save the state.
Delete a Saved Settings. To permanently delete one of previously saved settings.
Apply Settings. Previously saved settings are listed here. Choose any item to apply it to the currently selected chart object. Factory Defaults applies the original default settings as originally shipped with the program.
Note. The Charts and Indicators chapters cover each specific Inspector window in detail.
!31
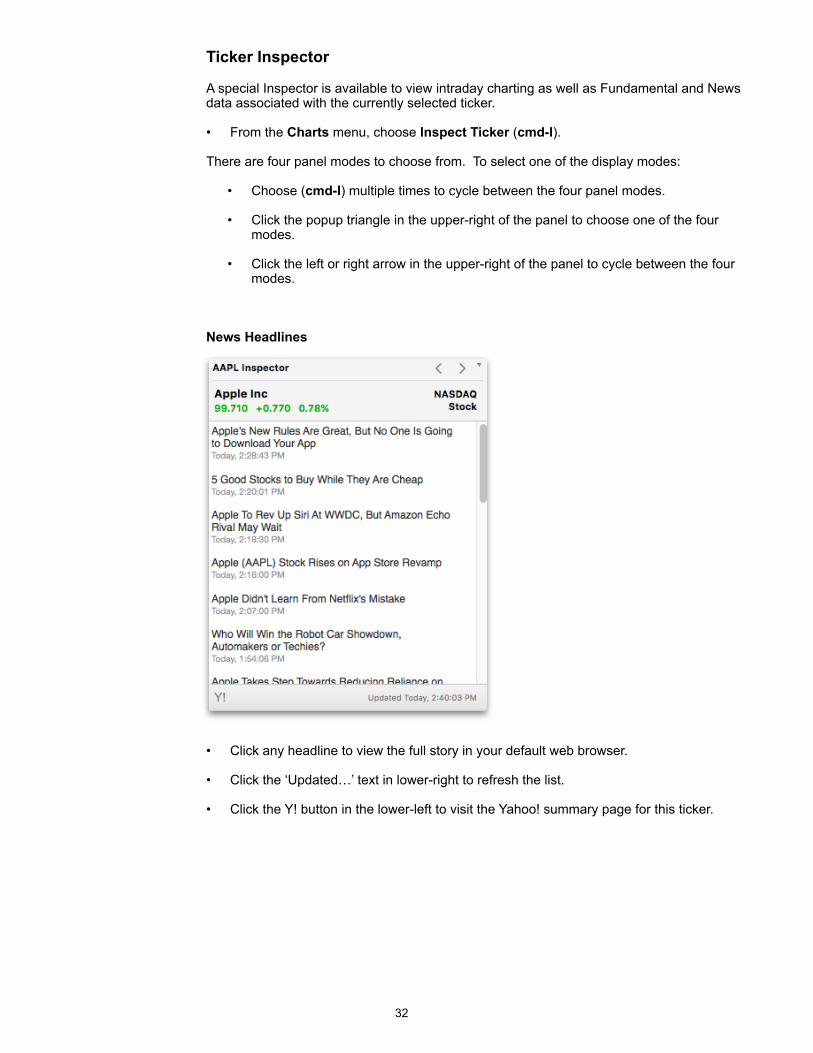
Ticker Inspector
A special Inspector is available to view intraday charting as well as Fundamental and News data associated with the currently selected ticker.
• From the Charts menu, choose Inspect Ticker (cmd-I).
There are four panel modes to choose from. To select one of the display modes:
• Choose (cmd-I) multiple times to cycle between the four panel modes.
• Click the popup triangle in the upper-right of the panel to choose one of the four modes.
• Click the left or right arrow in the upper-right of the panel to cycle between the four modes.
News Headlines
!
• Click any headline to view the full story in your default web browser.
• Click the ‘Updated…’ text in lower-right to refresh the list.
• Click the Y! button in the lower-left to visit the Yahoo! summary page for this ticker.
!32
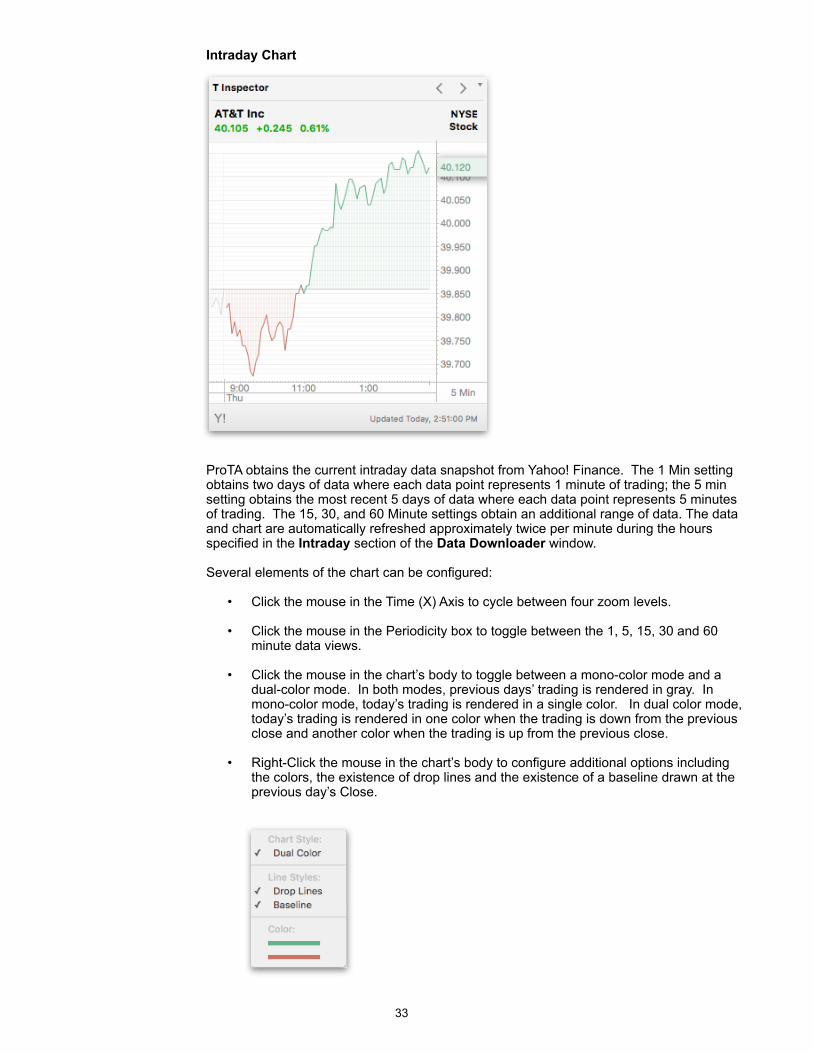
Intraday Chart
!
ProTA obtains the current intraday data snapshot from Yahoo! Finance. The 1 Min setting obtains two days of data where each data point represents 1 minute of trading; the 5 min setting obtains the most recent 5 days of data where each data point represents 5 minutes of trading. The 15, 30, and 60 Minute settings obtain an additional range of data. The data and chart are automatically refreshed approximately twice per minute during the hours specified in the Intraday section of the Data Downloader window.
Several elements of the chart can be configured:
• Click the mouse in the Time (X) Axis to cycle between four zoom levels.
• Click the mouse in the Periodicity box to toggle between the 1, 5, 15, 30 and 60 minute data views.
• Click the mouse in the chart’s body to toggle between a mono-color mode and a dual-color mode. In both modes, previous days’ trading is rendered in gray. In mono-color mode, today’s trading is rendered in a single color. In dual color mode, today’s trading is rendered in one color when the trading is down from the previous close and another color when the trading is up from the previous close.
• Right-Click the mouse in the chart’s body to configure additional options including the colors, the existence of drop lines and the existence of a baseline drawn at the previous day’s Close.
!
!33
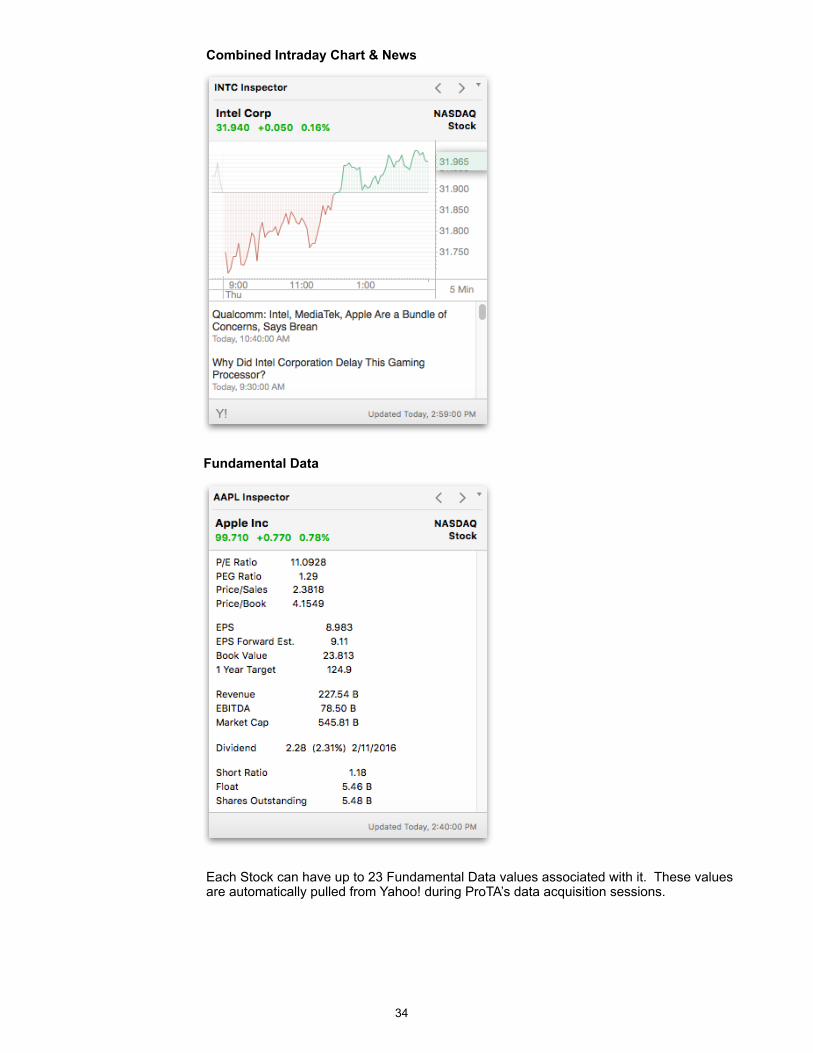
Combined Intraday Chart & News
!
Fundamental Data
!
Each Stock can have up to 23 Fundamental Data values associated with it. These values are automatically pulled from Yahoo! during ProTA’s data acquisition sessions.
!34
Content Tables
!Overview
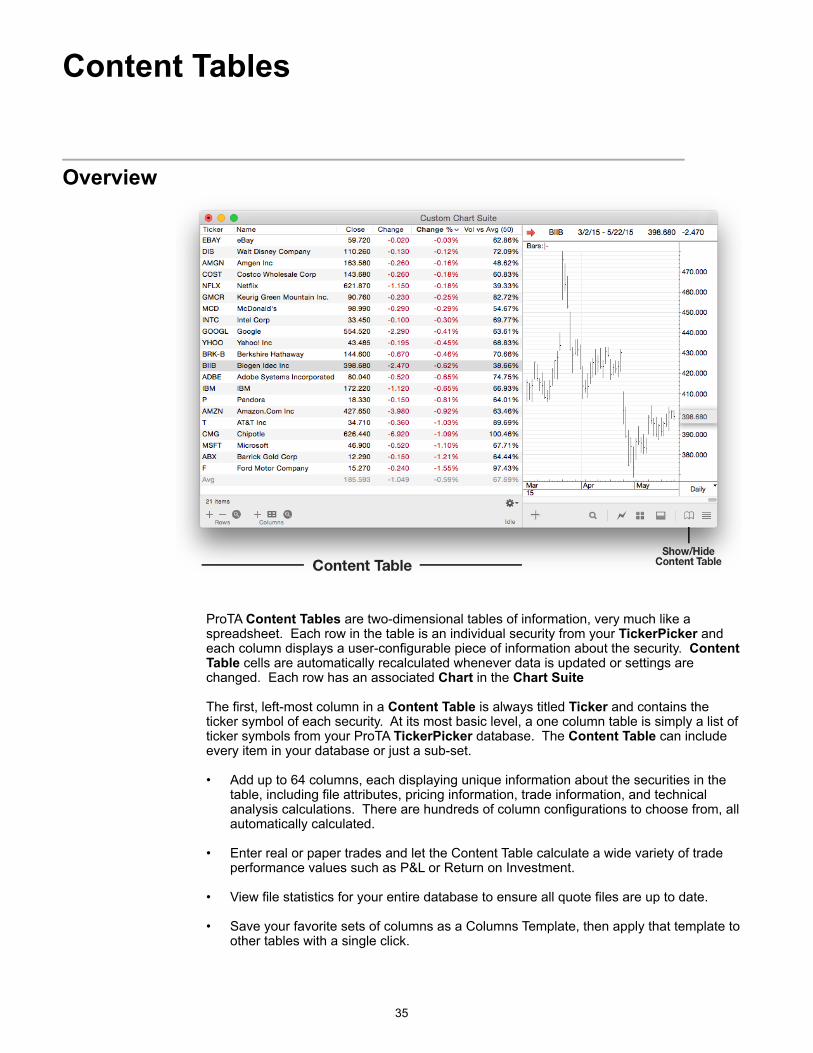
!
ProTA Content Tables are two-dimensional tables of information, very much like a spreadsheet. Each row in the table is an individual security from your TickerPicker and each column displays a user-configurable piece of information about the security. Content Table cells are automatically recalculated whenever data is updated or settings are changed. Each row has an associated Chart in the Chart Suite
The first, left-most column in a Content Table is always titled Ticker and contains the ticker symbol of each security. At its most basic level, a one column table is simply a list of ticker symbols from your ProTA TickerPicker database. The Content Table can include every item in your database or just a sub-set.
• Add up to 64 columns, each displaying unique information about the securities in the table, including file attributes, pricing information, trade information, and technical analysis calculations. There are hundreds of column configurations to choose from, all automatically calculated.
• Enter real or paper trades and let the Content Table calculate a wide variety of trade performance values such as P&L or Return on Investment.
• View file statistics for your entire database to ensure all quote files are up to date.
• Save your favorite sets of columns as a Columns Template, then apply that template to other tables with a single click.
!35
! Content Table Modes
ProTA Content Tables exist in one of two possible modes: Custom Mode and Smartlist Mode. The distinction between the two modes primary relates to the rows (tickers) composing the table.
Custom Mode
In Custom Mode, you manually add or remove tickers from the list, ‘hand-picking’ the securities, curating the list to include the specific tickers that make sense for this list.
Some examples when you will use Custom Mode:
• A list of Hot Stocks you are tracking this month.
• A table mirroring the tickers in your brokerage accounts.
• A list of all Technology Stocks in your database.
• Any Content Table that will hold information such as Date Purchase, Number of Shares, Purchase Price.
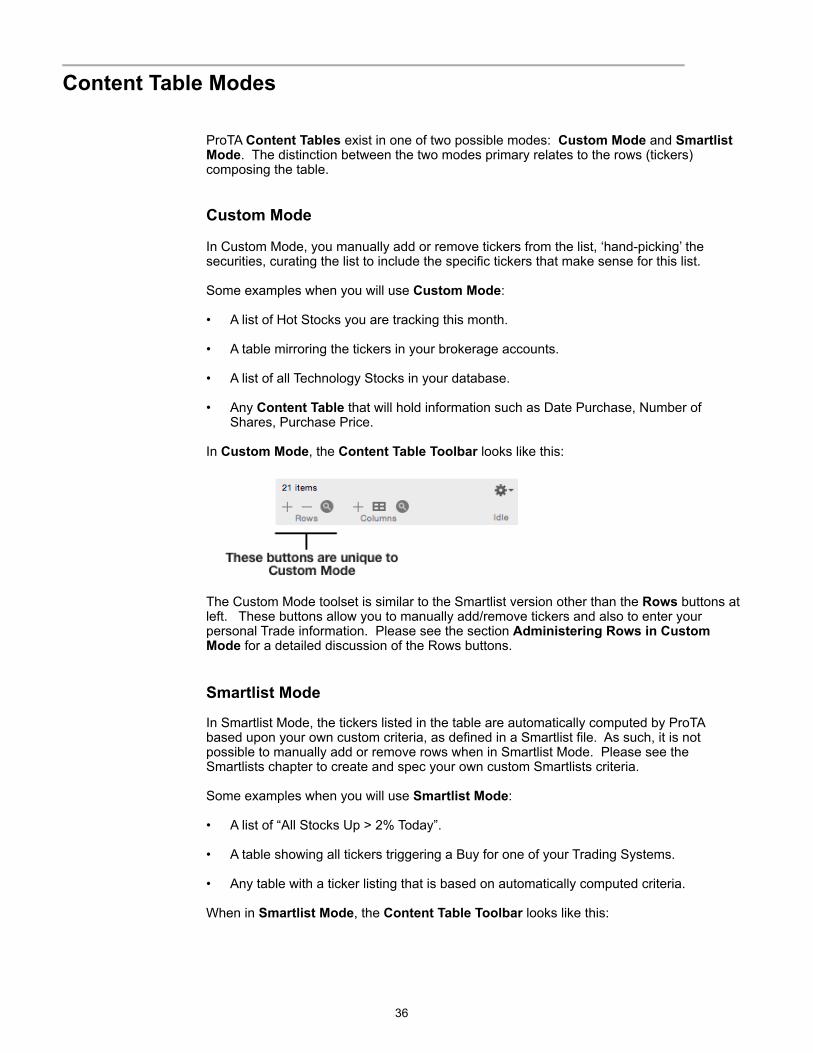
In Custom Mode, the Content Table Toolbar looks like this:
!
The Custom Mode toolset is similar to the Smartlist version other than the Rows buttons at left. These buttons allow you to manually add/remove tickers and also to enter your personal Trade information. Please see the section Administering Rows in Custom Mode for a detailed discussion of the Rows buttons.
Smartlist Mode
In Smartlist Mode, the tickers listed in the table are automatically computed by ProTA based upon your own custom criteria, as defined in a Smartlist file. As such, it is not possible to manually add or remove rows when in Smartlist Mode. Please see the Smartlists chapter to create and spec your own custom Smartlists criteria.
Some examples when you will use Smartlist Mode:
• A list of “All Stocks Up > 2% Today”.
• A table showing all tickers triggering a Buy for one of your Trading Systems.
• Any table with a ticker listing that is based on automatically computed criteria.
When in Smartlist Mode, the Content Table Toolbar looks like this:
!36
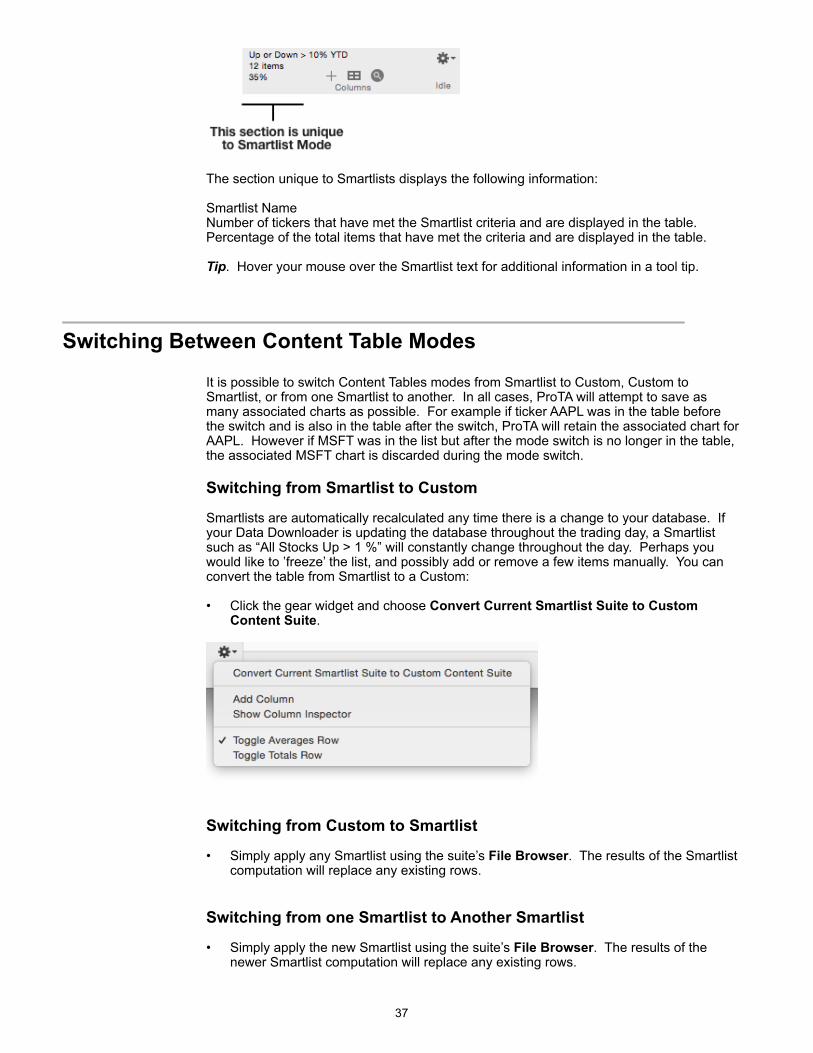
!
The section unique to Smartlists displays the following information:
Smartlist Name Number of tickers that have met the Smartlist criteria and are displayed in the table. Percentage of the total items that have met the criteria and are displayed in the table.
Tip. Hover your mouse over the Smartlist text for additional information in a tool tip.
! Switching Between Content Table Modes
It is possible to switch Content Tables modes from Smartlist to Custom, Custom to Smartlist, or from one Smartlist to another. In all cases, ProTA will attempt to save as many associated charts as possible. For example if ticker AAPL was in the table before the switch and is also in the table after the switch, ProTA will retain the associated chart for AAPL. However if MSFT was in the list but after the mode switch is no longer in the table, the associated MSFT chart is discarded during the mode switch.
Switching from Smartlist to Custom
Smartlists are automatically recalculated any time there is a change to your database. If your Data Downloader is updating the database throughout the trading day, a Smartlist such as “All Stocks Up > 1 %” will constantly change throughout the day. Perhaps you would like to ’freeze’ the list, and possibly add or remove a few items manually. You can convert the table from Smartlist to a Custom:
• Click the gear widget and choose Convert Current Smartlist Suite to Custom Content Suite.
!
Switching from Custom to Smartlist
• Simply apply any Smartlist using the suite’s File Browser. The results of the Smartlist computation will replace any existing rows.
Switching from one Smartlist to Another Smartlist
• Simply apply the new Smartlist using the suite’s File Browser. The results of the newer Smartlist computation will replace any existing rows.
!37
! Administering Rows in Custom Mode
In Custom Mode, you can manually add and remove rows. Each row represents one security with an associated chart. You can add the same security more than once if desired.
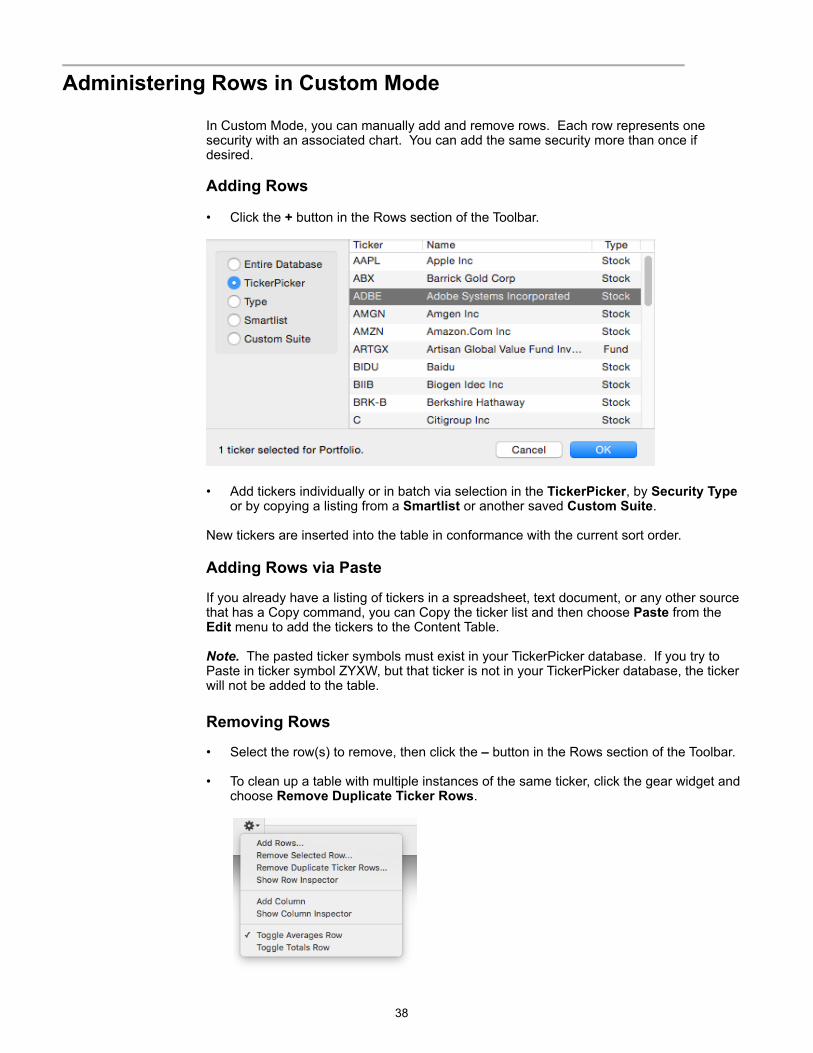
Adding Rows
• Click the + button in the Rows section of the Toolbar.
!
• Add tickers individually or in batch via selection in the TickerPicker, by Security Type or by copying a listing from a Smartlist or another saved Custom Suite.
New tickers are inserted into the table in conformance with the current sort order.
Adding Rows via Paste
If you already have a listing of tickers in a spreadsheet, text document, or any other source that has a Copy command, you can Copy the ticker list and then choose Paste from the Edit menu to add the tickers to the Content Table.
Note. The pasted ticker symbols must exist in your TickerPicker database. If you try to Paste in ticker symbol ZYXW, but that ticker is not in your TickerPicker database, the ticker will not be added to the table.
Removing Rows
• Select the row(s) to remove, then click the – button in the Rows section of the Toolbar.
• To clean up a table with multiple instances of the same ticker, click the gear widget and choose Remove Duplicate Ticker Rows.
!
!38
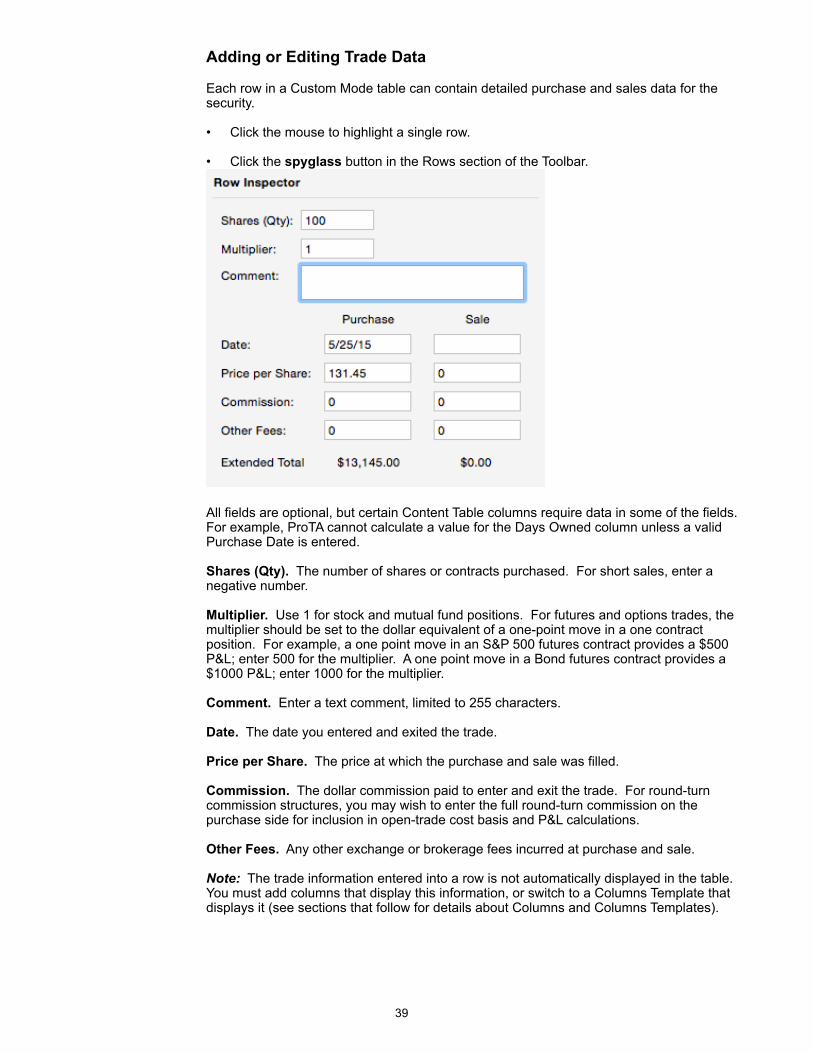
Adding or Editing Trade Data
Each row in a Custom Mode table can contain detailed purchase and sales data for the security.
• Click the mouse to highlight a single row.
• Click the spyglass button in the Rows section of the Toolbar.
!
All fields are optional, but certain Content Table columns require data in some of the fields. For example, ProTA cannot calculate a value for the Days Owned column unless a valid Purchase Date is entered.
Shares (Qty). The number of shares or contracts purchased. For short sales, enter a negative number.
Multiplier. Use 1 for stock and mutual fund positions. For futures and options trades, the multiplier should be set to the dollar equivalent of a one-point move in a one contract position. For example, a one point move in an S&P 500 futures contract provides a $500 P&L; enter 500 for the multiplier. A one point move in a Bond futures contract provides a $1000 P&L; enter 1000 for the multiplier.
Comment. Enter a text comment, limited to 255 characters.
Date. The date you entered and exited the trade.
Price per Share. The price at which the purchase and sale was filled.
Commission. The dollar commission paid to enter and exit the trade. For round-turn commission structures, you may wish to enter the full round-turn commission on the purchase side for inclusion in open-trade cost basis and P&L calculations.
Other Fees. Any other exchange or brokerage fees incurred at purchase and sale.
Note: The trade information entered into a row is not automatically displayed in the table. You must add columns that display this information, or switch to a Columns Template that displays it (see sections that follow for details about Columns and Columns Templates).
!39

!Adding a Column to a Content Table
There are hundreds of column configurations to choose from. Up to 64 can be displayed in a single Content Table. This section covers the logistics of adding a column. The next chapter, Content Table Columns, describes each of the column configurations/calculations.
The first, left-most column is always the Ticker column. You can add or locate columns anywhere to the right of the Ticker column.
• Click the + button in the Columns section of the Toolbar.
!
Use the list at the left to select the type of column to add. A brief description is provided at the right. The options on the right allow you to customize the specific attributes of each column type. See the next chapter, Content Table Columns, for complete details regarding each column type.
!Editing a Column in a Content Table
You can edit the parameters of an existing column, or change the column type altogether.
• Click the spyglass button in the Columns section of the Toolbar. The Inspector will display information for the selected Column. The selected Column’s heading is shaded gray while it is being Inspected. Use the < and > buttons at the top of the Inspector panel to navigate the selected Column.
See the section Adding a Column to a Content Table directly above for an example of the editing panel. See the chapter Content Table Columns for complete details regarding each column type.
If the table is sorted by the edited column, the list is automatically re-sorted when the column parameters or type are changed.
Note: The left-most column is always the Ticker column. It cannot be edited or removed.
!40
!Removing a Column from a Content Table
Individual columns in a Content Table can be deleted one at a time.
• Click the spyglass button in the Columns section of the Toolbar. The Inspector will display information for the selected Column. Use the < and > buttons at the top of the Inspector panel to navigate the selected column. Click the Trashcan button in the Inspector to remove the selected column.
Note: The left-most column is always the Ticker column. It cannot be edited or removed.
! Moving and Sizing a Column in a Content Table
The left-right ordering and width of any column can be adjusted by dragging the mouse.
• To move a column left or right, click on the column heading and drag it to a new location. The columns will shift around as you drag the mouse left and right. Release the mouse to drop the column into its new location.
• To resize a column’s width, move the cursor to the dividing line between any two column headings. The cursor will change to the sizing arrows. Click and drag the mouse left or right to resize the column.
! Sorting a Content Table
You can sort a Portfolio by any column in ascending or descending order.
• Click any column heading to make it the primary sort key.
• Click the column heading a second time to reverse the sort order.
Note: ProTA uses a stable-sort algorithm. When you change sort columns, if there are any duplicate cells in the new column, those equivalent rows will remain sorted in the order from the previous sort column.
For example, you might want to sort a Portfolio by security type (stocks, funds) and then within those groupings, have it sorted by ticker symbol. First click the Ticker column to sort by ticker, then click the security Type column.
!41
! Columns Templates
A Columns Template is a description of a Content Table’s columns and formatting information. Columns Templates provide a handy way to quickly switch between various sets of columns. For example, you might save a template composed of several columns that compute “Year to Date Performance”, another template with columns that show various “52 Week Range Analysis”, etc.
When you apply a Columns Template, the columns displayed, sort order, and general formatting of the table all change to reflect the new template. The actual ticker symbols included in the table, the associated charts, and any trade data you may have entered does not change.
A Columns Template can also be specified to initialize all new Chart Suite documents – see Preferences.
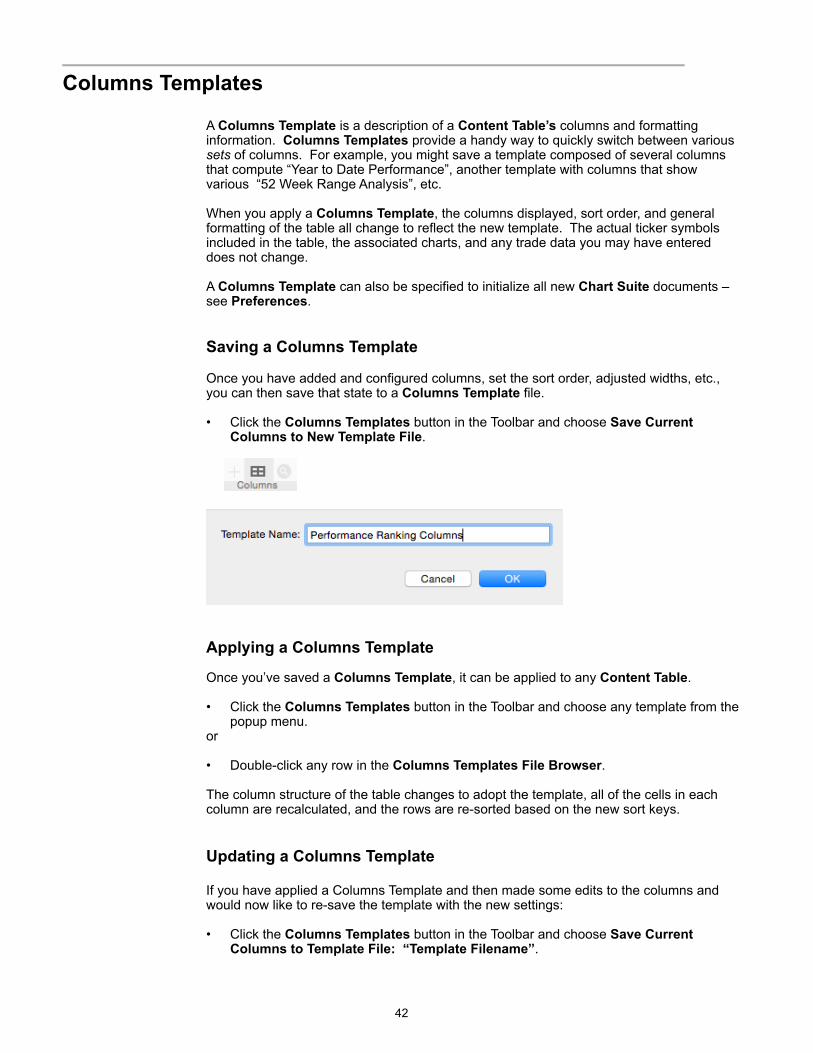
Saving a Columns Template
Once you have added and configured columns, set the sort order, adjusted widths, etc., you can then save that state to a Columns Template file.
• Click the Columns Templates button in the Toolbar and choose Save Current Columns to New Template File.
!
!
Applying a Columns Template
Once you’ve saved a Columns Template, it can be applied to any Content Table.
• Click the Columns Templates button in the Toolbar and choose any template from the popup menu.
or
• Double-click any row in the Columns Templates File Browser.
The column structure of the table changes to adopt the template, all of the cells in each column are recalculated, and the rows are re-sorted based on the new sort keys.
Updating a Columns Template
If you have applied a Columns Template and then made some edits to the columns and would now like to re-save the template with the new settings:
• Click the Columns Templates button in the Toolbar and choose Save Current Columns to Template File: “Template Filename”.
!42
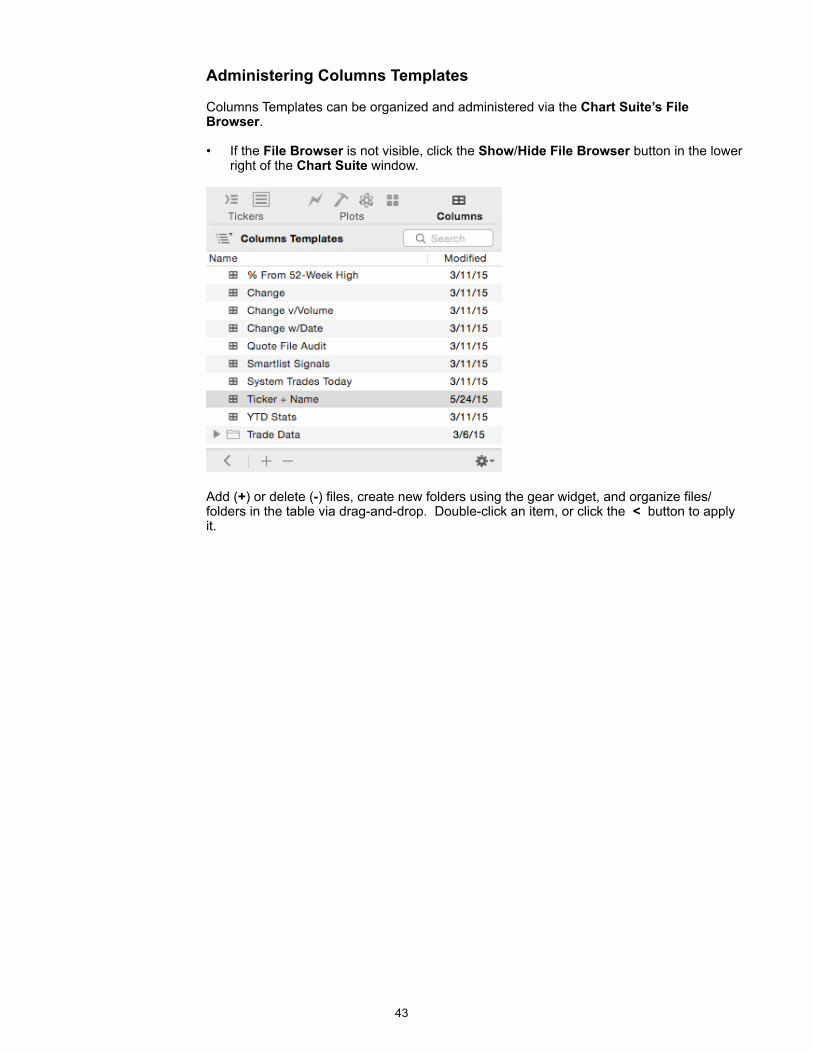
Administering Columns Templates
Columns Templates can be organized and administered via the Chart Suite’s File Browser.
• If the File Browser is not visible, click the Show/Hide File Browser button in the lower right of the Chart Suite window.
!
Add (+) or delete (-) files, create new folders using the gear widget, and organize files/folders in the table via drag-and-drop. Double-click an item, or click the < button to apply it.
!43
Content Table Columns
!Overview
This chapter covers the wide variety of customizable columns you can add to your Content Tables.
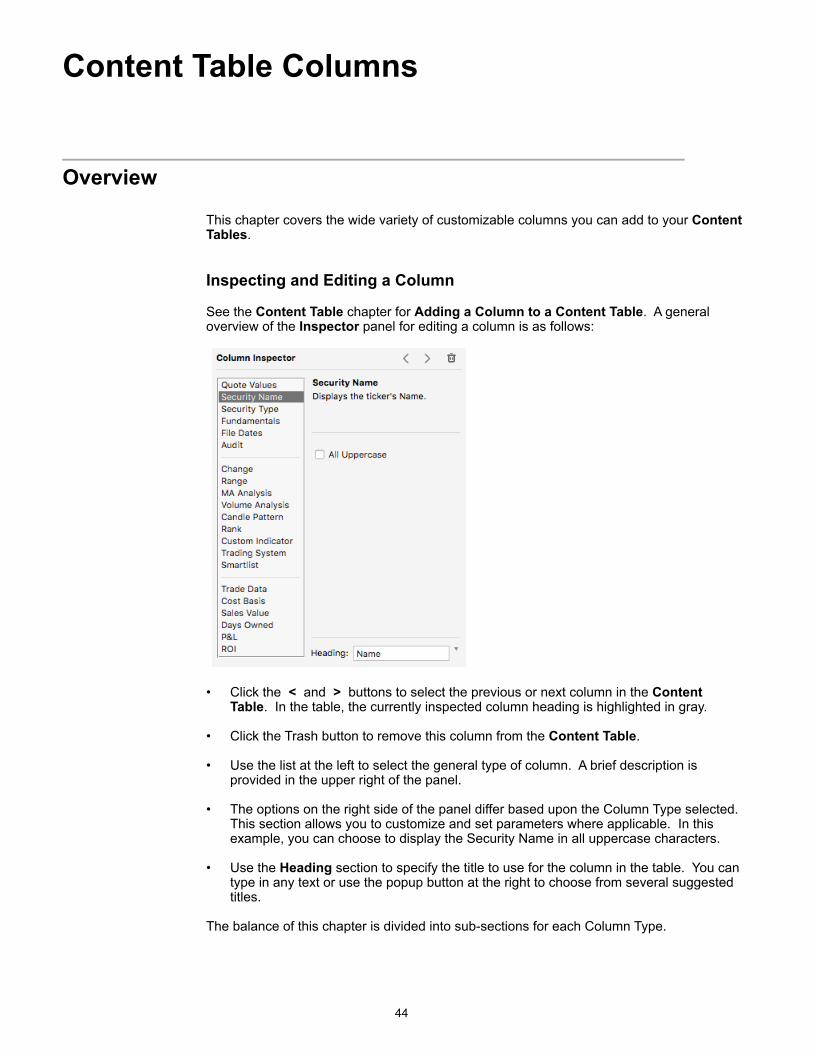
Inspecting and Editing a Column
See the Content Table chapter for Adding a Column to a Content Table. A general overview of the Inspector panel for editing a column is as follows:
!
• Click the < and > buttons to select the previous or next column in the Content Table. In the table, the currently inspected column heading is highlighted in gray.
• Click the Trash button to remove this column from the Content Table.
• Use the list at the left to select the general type of column. A brief description is provided in the upper right of the panel.
• The options on the right side of the panel differ based upon the Column Type selected. This section allows you to customize and set parameters where applicable. In this example, you can choose to display the Security Name in all uppercase characters.
• Use the Heading section to specify the title to use for the column in the table. You can type in any text or use the popup button at the right to choose from several suggested titles.
The balance of this chapter is divided into sub-sections for each Column Type.
!44

!Quote Values
Displays the specified quote field value for the specified date.
!
Field. Choose the field to reference in the quote file.
Date. Choose the date to reference in the quote file.
Latest. The most recent date in the quote file.
One Day Prior. The 2nd-to-last record in the quote file.
One Week Prior. Seven calendar days prior to the last date in the quote file. If the target date is not found, the first date in the file prior to the target date is used.
One Month Prior. One month prior to the last date in the quote file. If the target date is not found, the first date in the file prior to the target date is used.
One Year Prior. One year prior to the last date in the quote file. If the target date is not found, the first date in the file prior to the target date is used.
End of Last Month. Last day of the previous month (based on today's date). If the target date is not found, the first date in the file prior to the target date is used.
First of This Month. First day of the current month (based on today's date). If the target date is not found, the first date in the file subsequent to the target date is used.
End of Last Year. Last day of the previous year (based on today's date). If the target date is not found, the first date in the file prior to the target date is used.
First of This Year. First day of the current year (based on today's date). If the target date is not found, the first date in the file subsequent to the target date is used.
First Date in File. The earliest date in the quote file.
Purchase Date. The Date Purchased field for the row.
Specified Date. The date entered to the right of the menu.
!45
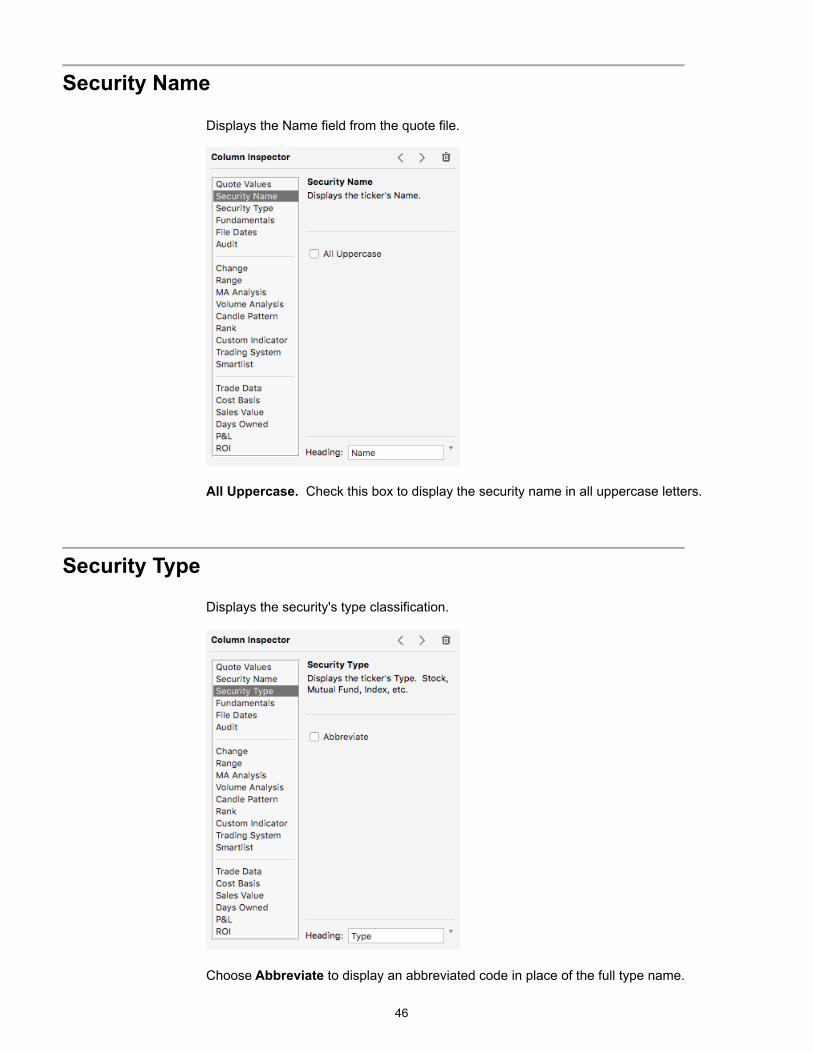
!Security Name
Displays the Name field from the quote file.
!
All Uppercase. Check this box to display the security name in all uppercase letters.
!Security Type
Displays the security's type classification.
!
Choose Abbreviate to display an abbreviated code in place of the full type name.
!46
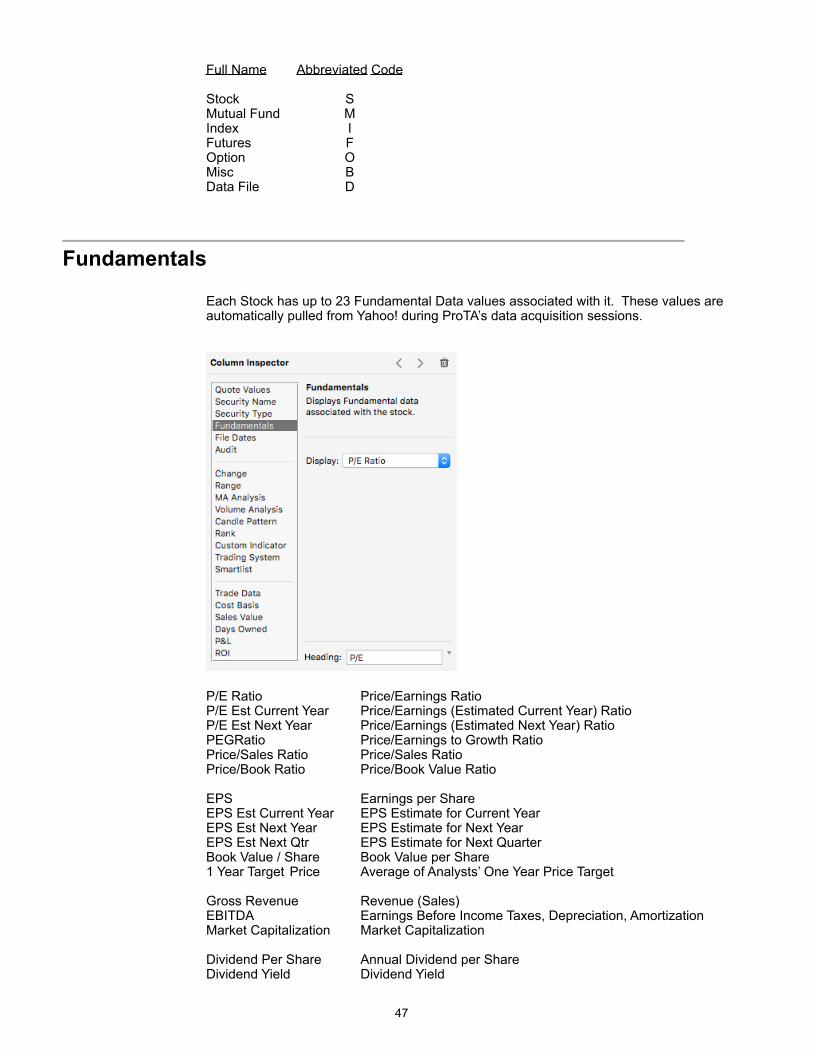
Full Name Abbreviated Code
Stock S Mutual Fund M Index I Futures F Option O Misc B Data File D
!Fundamentals
Each Stock has up to 23 Fundamental Data values associated with it. These values are automatically pulled from Yahoo! during ProTA’s data acquisition sessions.
!
P/E Ratio Price/Earnings Ratio P/E Est Current Year Price/Earnings (Estimated Current Year) Ratio P/E Est Next Year Price/Earnings (Estimated Next Year) Ratio PEGRatio Price/Earnings to Growth Ratio Price/Sales Ratio Price/Sales Ratio Price/Book Ratio Price/Book Value Ratio
EPS Earnings per Share EPS Est Current Year EPS Estimate for Current Year EPS Est Next Year EPS Estimate for Next Year EPS Est Next Qtr EPS Estimate for Next Quarter Book Value / Share Book Value per Share 1 Year Target Price Average of Analysts’ One Year Price Target
Gross Revenue Revenue (Sales) EBITDA Earnings Before Income Taxes, Depreciation, Amortization Market Capitalization Market Capitalization
Dividend Per Share Annual Dividend per Share Dividend Yield Dividend Yield
!47
Dividend Date Date of Last Dividend Ex-Dividend Date Last Ex-Dividend Date
Short Ratio Short Ratio Float Shares Number of Floating Shares Shares Outstanding Shares Outstanding Stock Exchange Listed Stock Exchange
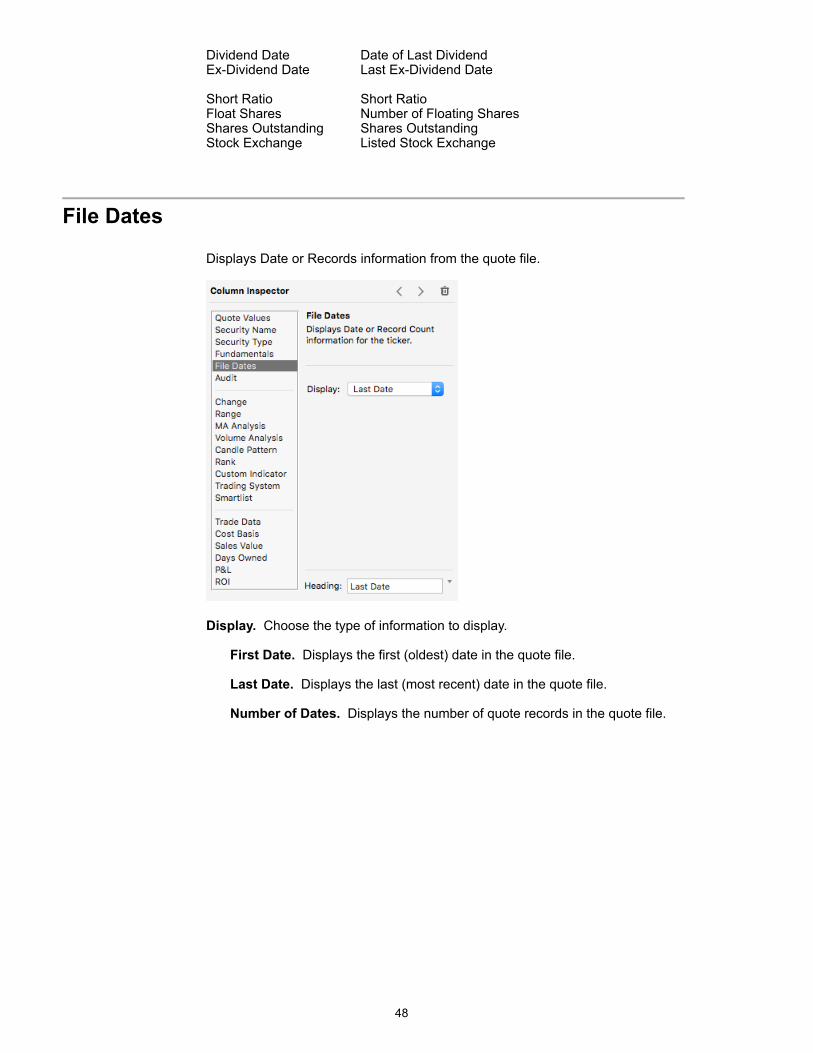
! File Dates
Displays Date or Records information from the quote file.
!
Display. Choose the type of information to display.
First Date. Displays the first (oldest) date in the quote file.
Last Date. Displays the last (most recent) date in the quote file.
Number of Dates. Displays the number of quote records in the quote file.
!48
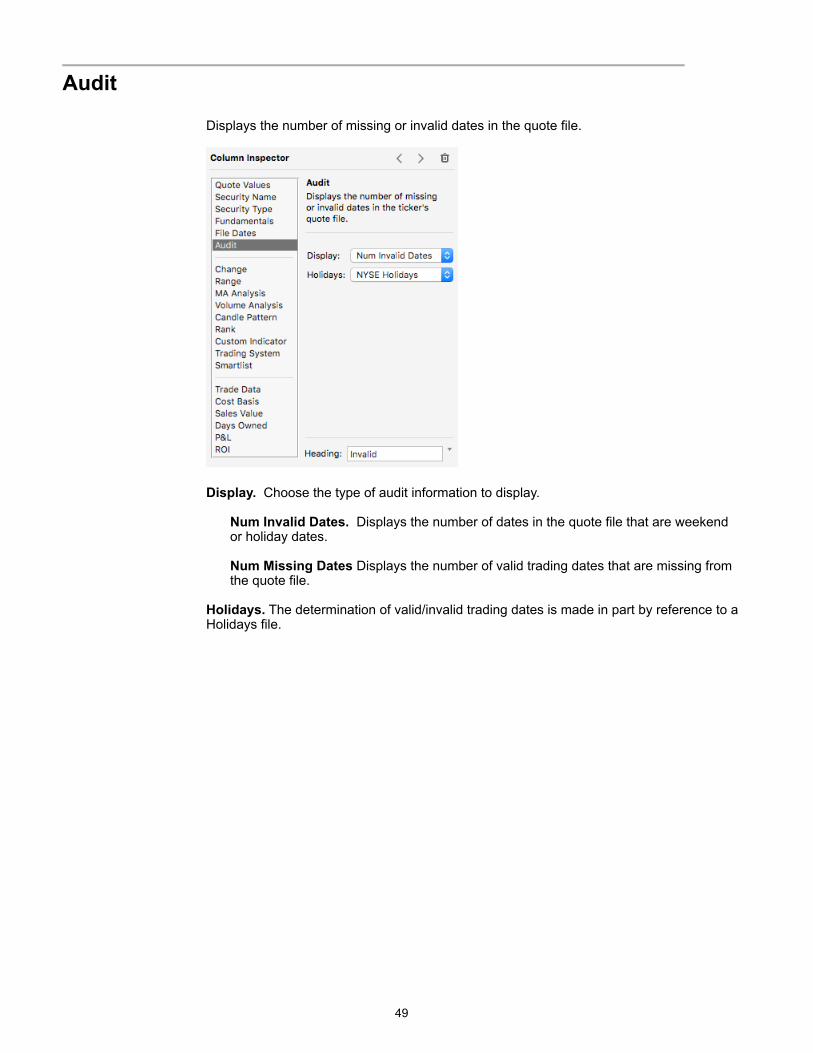
! Audit
Displays the number of missing or invalid dates in the quote file.
!
Display. Choose the type of audit information to display.
Num Invalid Dates. Displays the number of dates in the quote file that are weekend or holiday dates.
Num Missing Dates Displays the number of valid trading dates that are missing from the quote file.
Holidays. The determination of valid/invalid trading dates is made in part by reference to a Holidays file.
!49
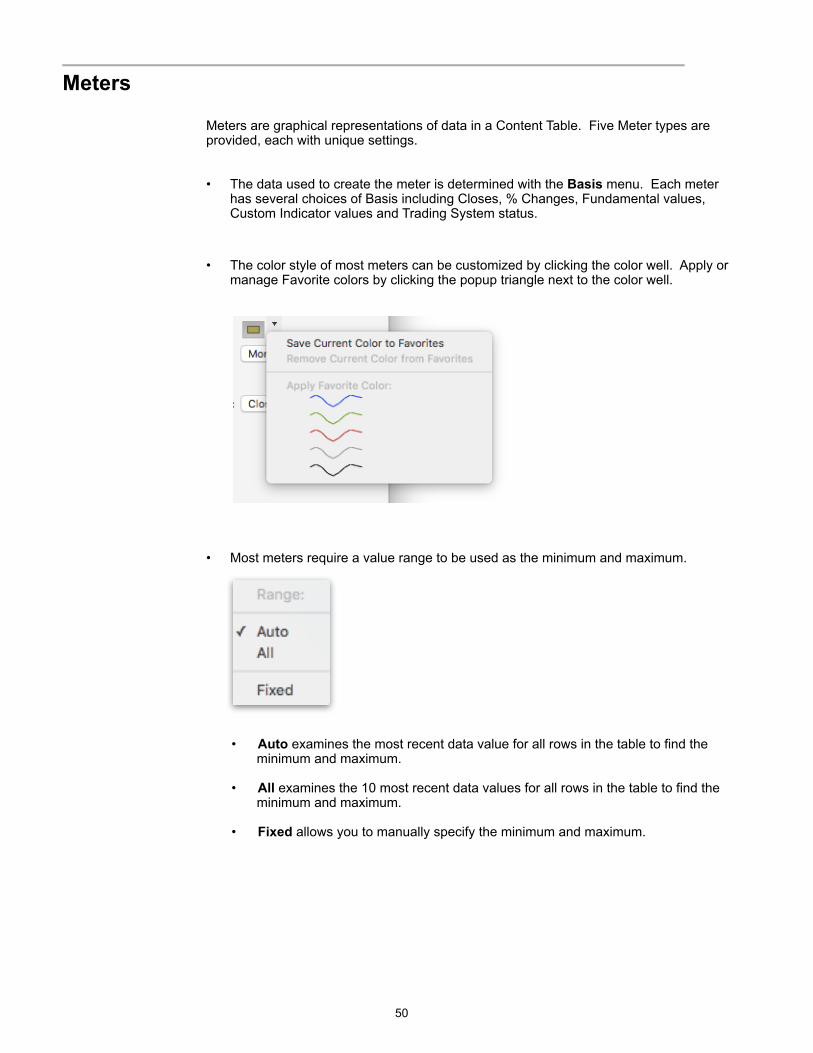
! Meters
Meters are graphical representations of data in a Content Table. Five Meter types are provided, each with unique settings.
• The data used to create the meter is determined with the Basis menu. Each meter has several choices of Basis including Closes, % Changes, Fundamental values, Custom Indicator values and Trading System status.
• The color style of most meters can be customized by clicking the color well. Apply or manage Favorite colors by clicking the popup triangle next to the color well.
!
• Most meters require a value range to be used as the minimum and maximum.
!
• Auto examines the most recent data value for all rows in the table to find the minimum and maximum.
• All examines the 10 most recent data values for all rows in the table to find the minimum and maximum.
• Fixed allows you to manually specify the minimum and maximum.
!50
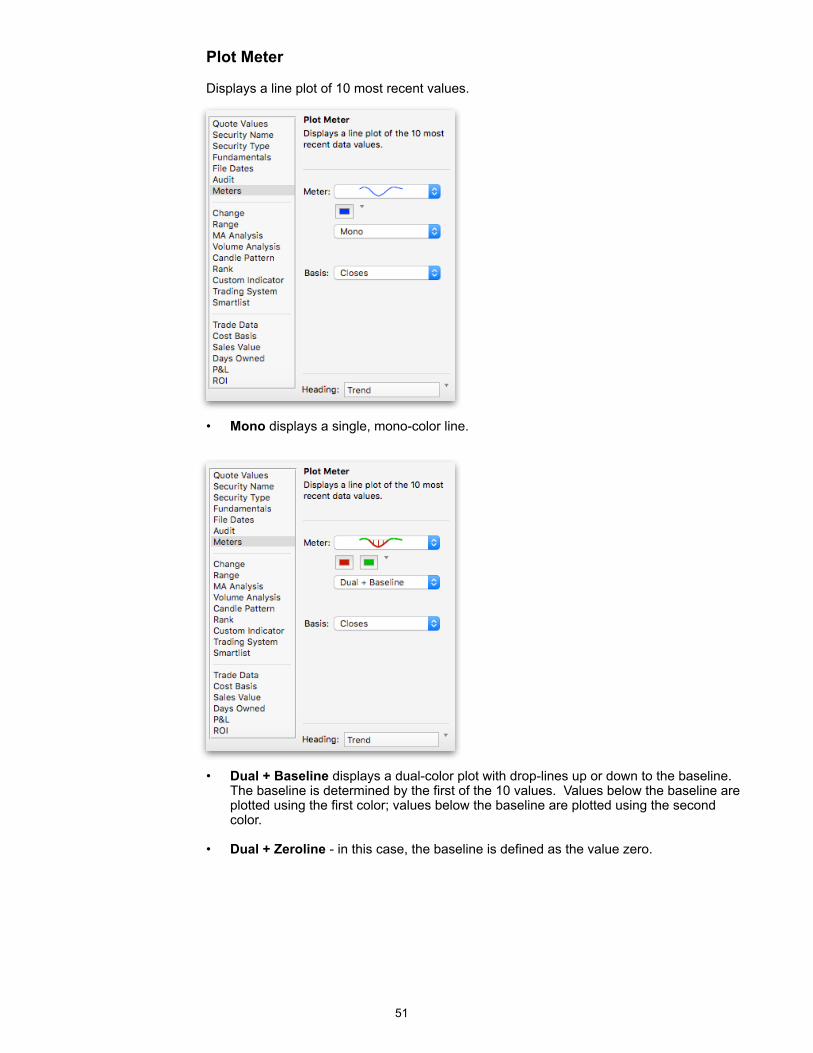
Plot Meter
Displays a line plot of 10 most recent values.
!
• Mono displays a single, mono-color line.
!
• Dual + Baseline displays a dual-color plot with drop-lines up or down to the baseline. The baseline is determined by the first of the 10 values. Values below the baseline are plotted using the first color; values below the baseline are plotted using the second color.
• Dual + Zeroline - in this case, the baseline is defined as the value zero.
!51
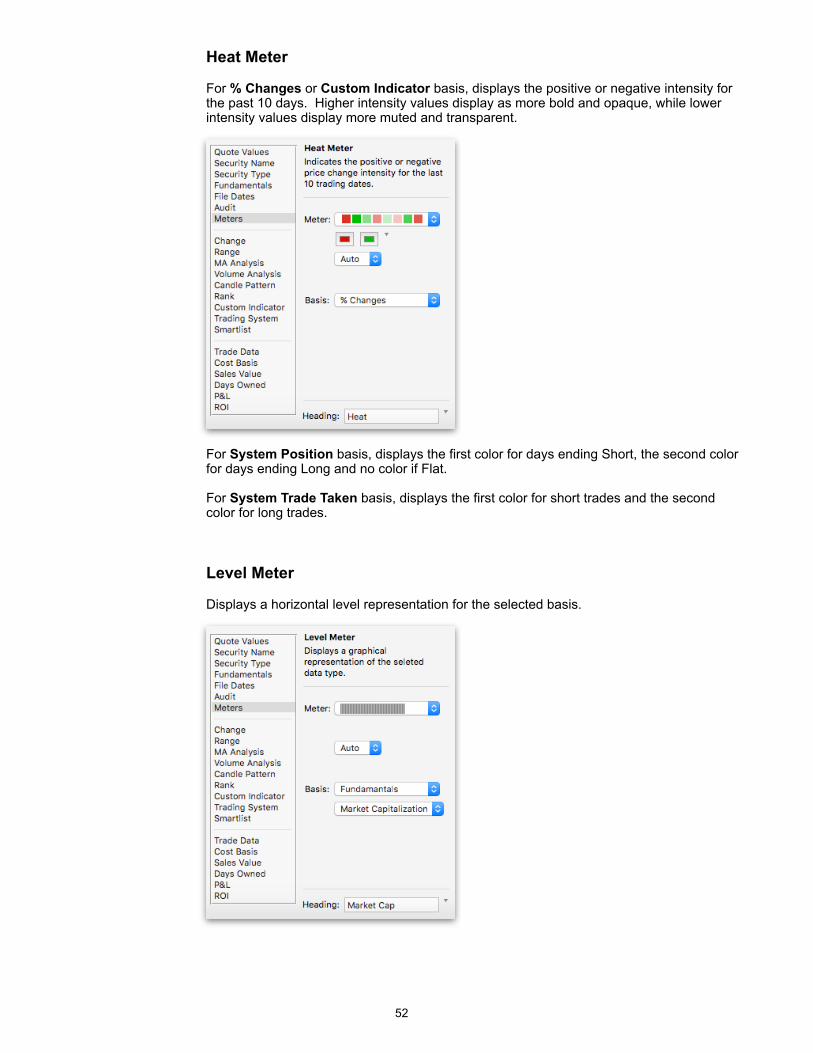
Heat Meter
For % Changes or Custom Indicator basis, displays the positive or negative intensity for the past 10 days. Higher intensity values display as more bold and opaque, while lower intensity values display more muted and transparent.
!
For System Position basis, displays the first color for days ending Short, the second color for days ending Long and no color if Flat.
For System Trade Taken basis, displays the first color for short trades and the second color for long trades.
Level Meter
Displays a horizontal level representation for the selected basis.
!
!52
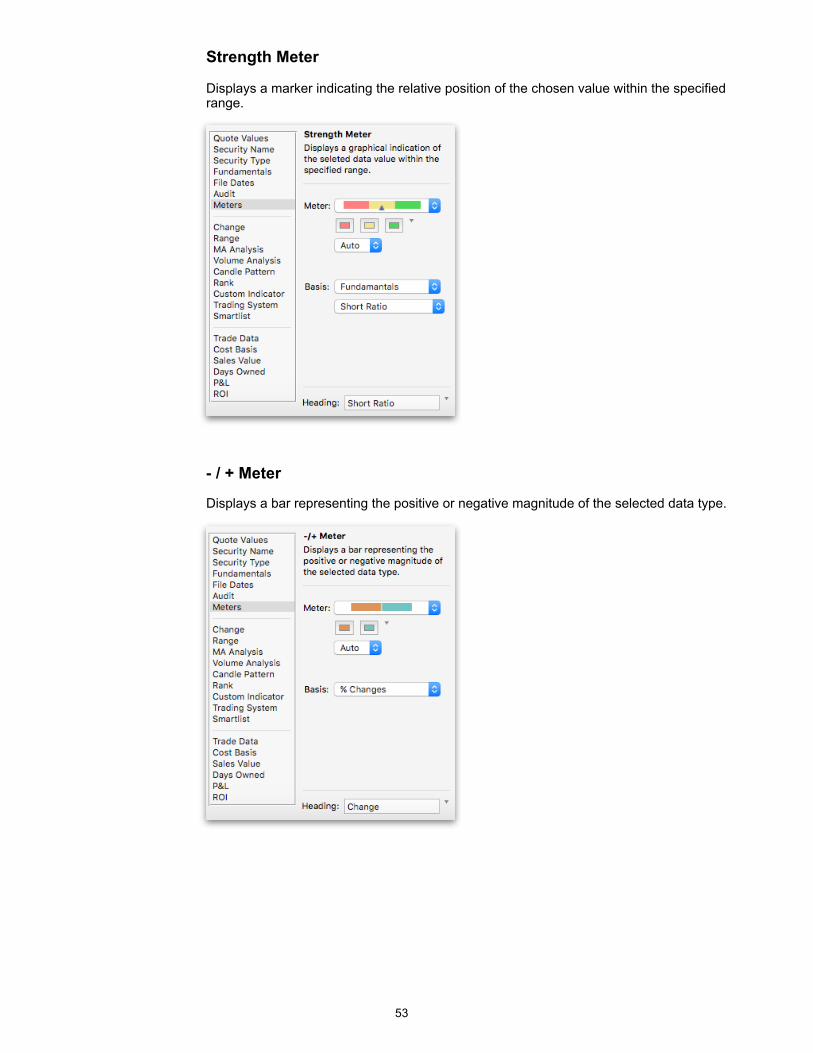
Strength Meter
Displays a marker indicating the relative position of the chosen value within the specified range.
!
- / + Meter
Displays a bar representing the positive or negative magnitude of the selected data type.
!
!53
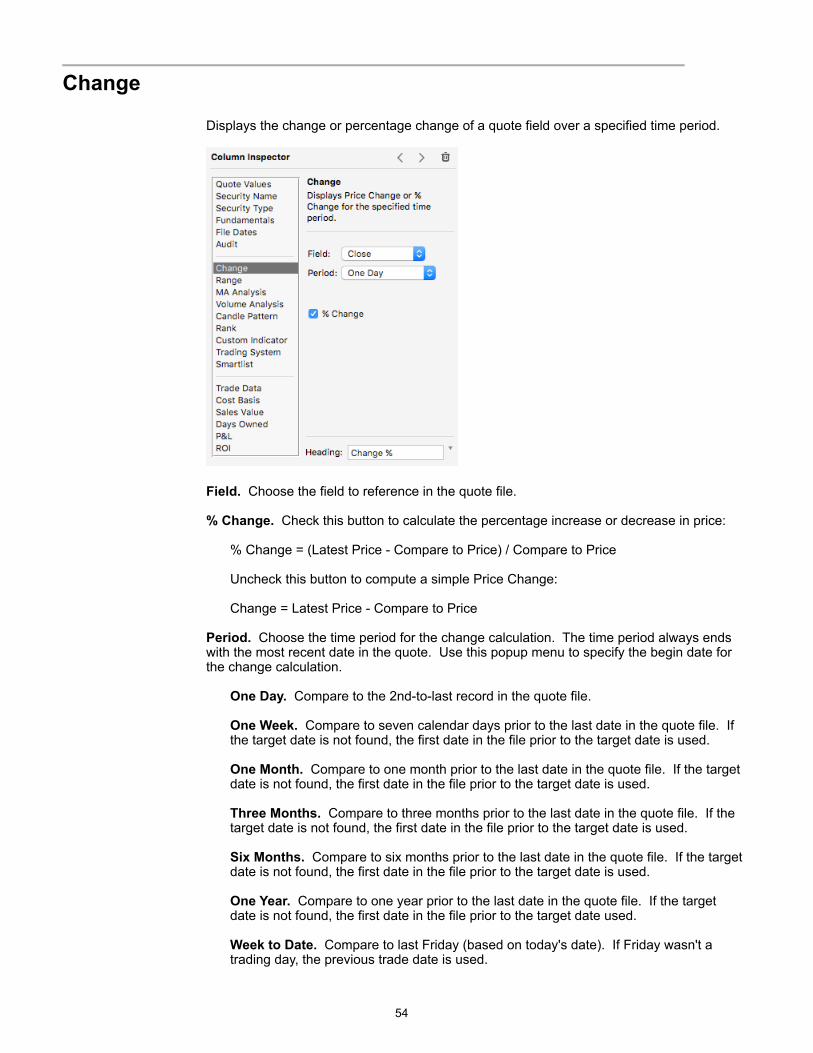
!Change
Displays the change or percentage change of a quote field over a specified time period.
!
Field. Choose the field to reference in the quote file.
% Change. Check this button to calculate the percentage increase or decrease in price:
% Change = (Latest Price - Compare to Price) / Compare to Price
Uncheck this button to compute a simple Price Change:
Change = Latest Price - Compare to Price
Period. Choose the time period for the change calculation. The time period always ends with the most recent date in the quote. Use this popup menu to specify the begin date for the change calculation.
One Day. Compare to the 2nd-to-last record in the quote file.
One Week. Compare to seven calendar days prior to the last date in the quote file. If the target date is not found, the first date in the file prior to the target date is used.
One Month. Compare to one month prior to the last date in the quote file. If the target date is not found, the first date in the file prior to the target date is used.
Three Months. Compare to three months prior to the last date in the quote file. If the target date is not found, the first date in the file prior to the target date is used.
Six Months. Compare to six months prior to the last date in the quote file. If the target date is not found, the first date in the file prior to the target date is used.
One Year. Compare to one year prior to the last date in the quote file. If the target date is not found, the first date in the file prior to the target date used.
Week to Date. Compare to last Friday (based on today's date). If Friday wasn't a trading day, the previous trade date is used.
!54
Month to Date. Compare to the last day of the previous month (based on today's date). If that wasn't a trading day, the first date in the file prior to the target date is used.
Year to Date. Compare to the last day of the previous year (based on today's date). If that wasn't a trading day, the first date in the file prior to the target date is used
All Dates in File. Compare to the earliest date in the quote file.
Since Purchase. Compare to the date specified in the Date Purchased field of the row.
Since Specified Date. Compare to the date entered to the right of the menu.
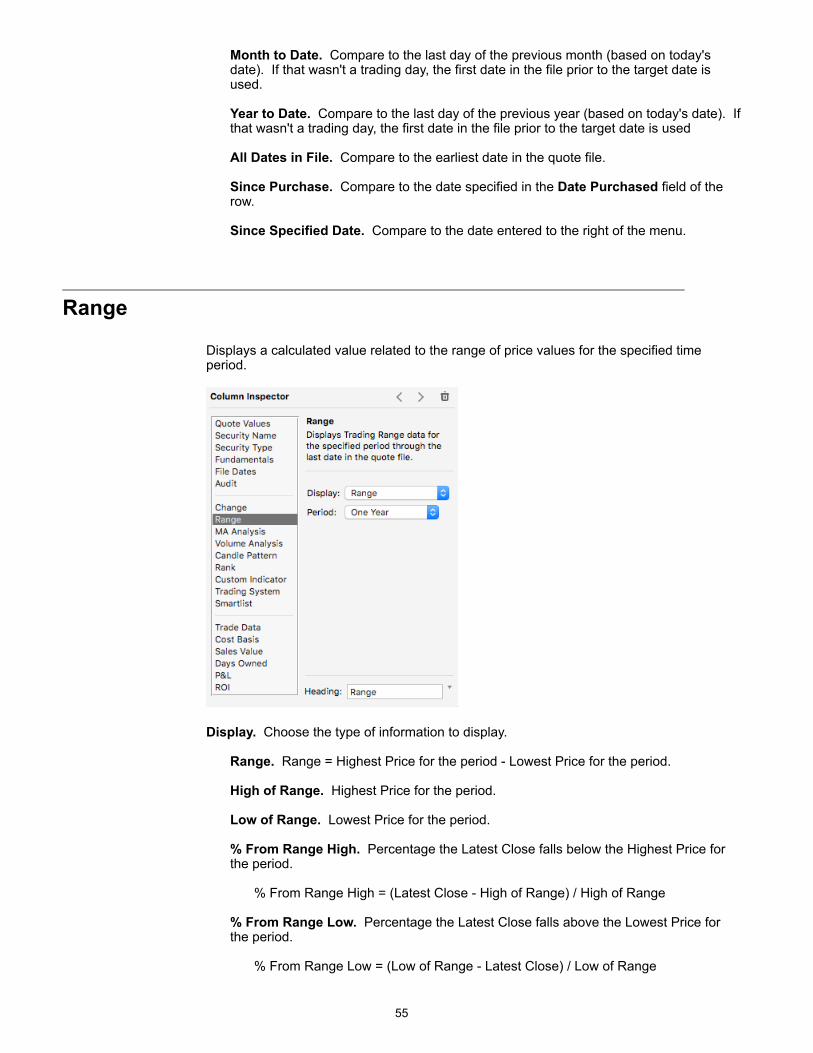
!Range
Displays a calculated value related to the range of price values for the specified time period.
!
Display. Choose the type of information to display.
Range. Range = Highest Price for the period - Lowest Price for the period.
High of Range. Highest Price for the period.
Low of Range. Lowest Price for the period.
% From Range High. Percentage the Latest Close falls below the Highest Price for the period.
% From Range High = (Latest Close - High of Range) / High of Range
% From Range Low. Percentage the Latest Close falls above the Lowest Price for the period.
% From Range Low = (Low of Range - Latest Close) / Low of Range
!55
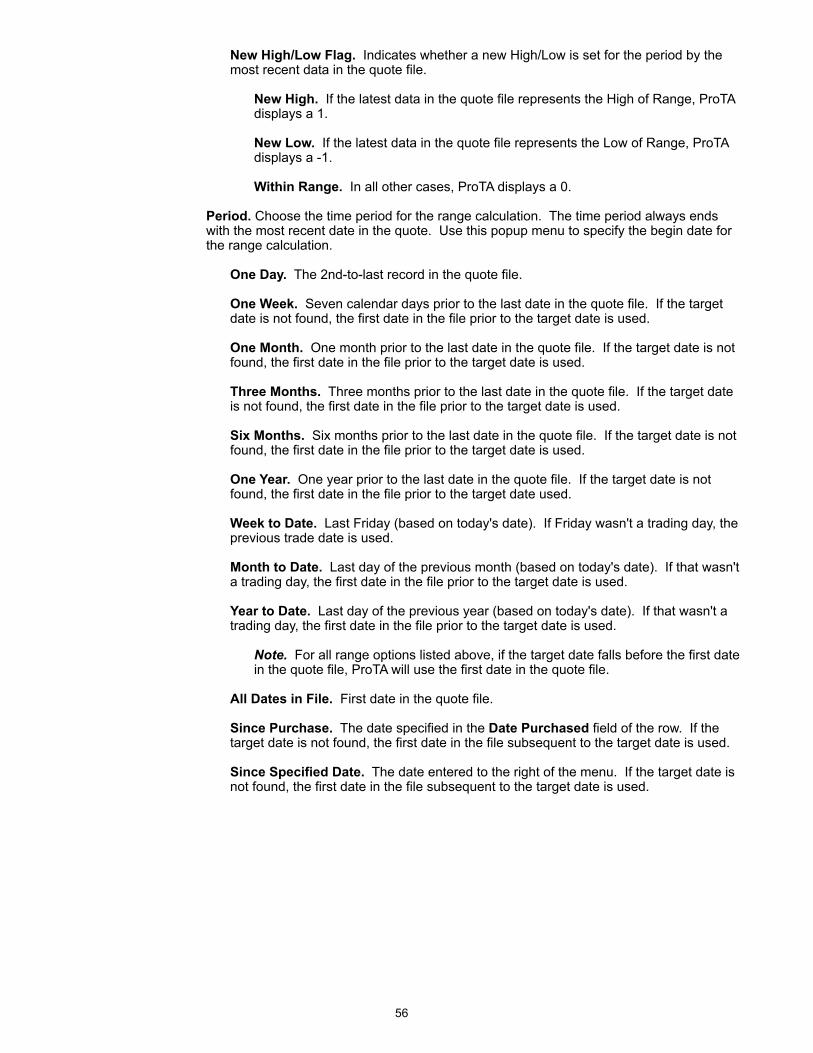
New High/Low Flag. Indicates whether a new High/Low is set for the period by the most recent data in the quote file.
New High. If the latest data in the quote file represents the High of Range, ProTA displays a 1.
New Low. If the latest data in the quote file represents the Low of Range, ProTA displays a -1.
Within Range. In all other cases, ProTA displays a 0.
Period. Choose the time period for the range calculation. The time period always ends with the most recent date in the quote. Use this popup menu to specify the begin date for the range calculation.
One Day. The 2nd-to-last record in the quote file.
One Week. Seven calendar days prior to the last date in the quote file. If the target date is not found, the first date in the file prior to the target date is used.
One Month. One month prior to the last date in the quote file. If the target date is not found, the first date in the file prior to the target date is used.
Three Months. Three months prior to the last date in the quote file. If the target date is not found, the first date in the file prior to the target date is used.
Six Months. Six months prior to the last date in the quote file. If the target date is not found, the first date in the file prior to the target date is used.
One Year. One year prior to the last date in the quote file. If the target date is not found, the first date in the file prior to the target date used.
Week to Date. Last Friday (based on today's date). If Friday wasn't a trading day, the previous trade date is used.
Month to Date. Last day of the previous month (based on today's date). If that wasn't a trading day, the first date in the file prior to the target date is used.
Year to Date. Last day of the previous year (based on today's date). If that wasn't a trading day, the first date in the file prior to the target date is used.
Note. For all range options listed above, if the target date falls before the first date in the quote file, ProTA will use the first date in the quote file.
All Dates in File. First date in the quote file.
Since Purchase. The date specified in the Date Purchased field of the row. If the target date is not found, the first date in the file subsequent to the target date is used.
Since Specified Date. The date entered to the right of the menu. If the target date is not found, the first date in the file subsequent to the target date is used.
!56
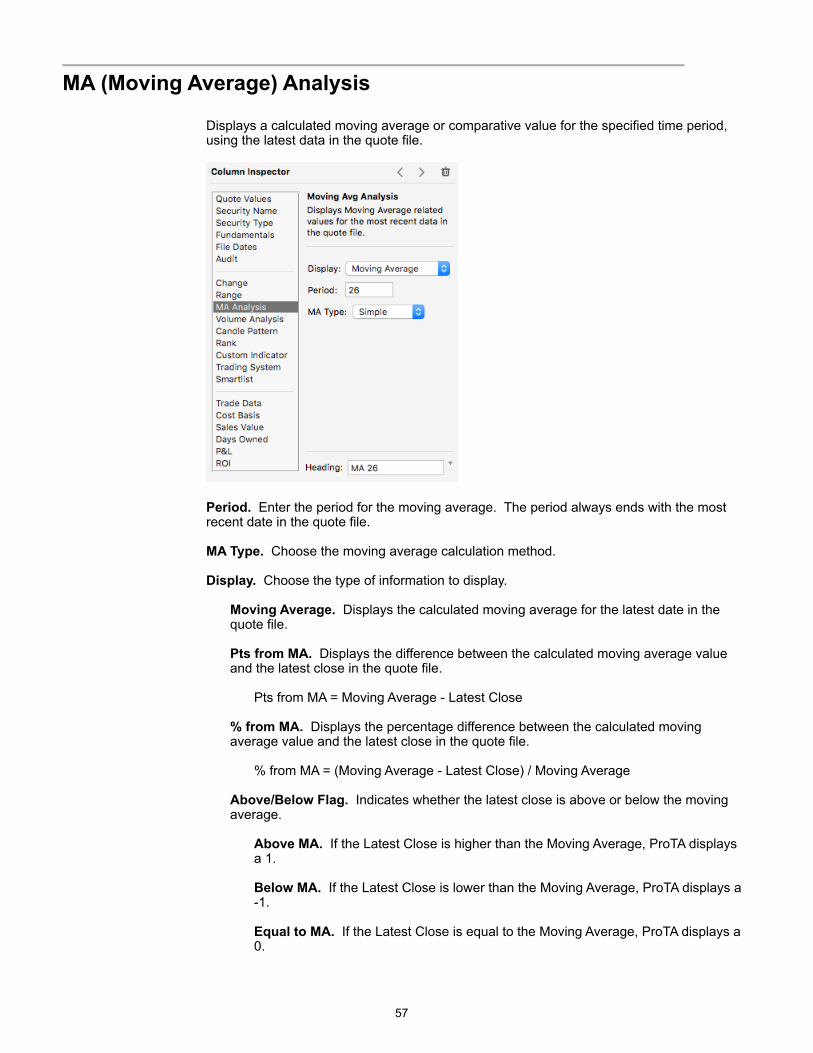
! MA (Moving Average) Analysis
Displays a calculated moving average or comparative value for the specified time period, using the latest data in the quote file.
!
Period. Enter the period for the moving average. The period always ends with the most recent date in the quote file.
MA Type. Choose the moving average calculation method.
Display. Choose the type of information to display.
Moving Average. Displays the calculated moving average for the latest date in the quote file.
Pts from MA. Displays the difference between the calculated moving average value and the latest close in the quote file.
Pts from MA = Moving Average - Latest Close
% from MA. Displays the percentage difference between the calculated moving average value and the latest close in the quote file.
% from MA = (Moving Average - Latest Close) / Moving Average
Above/Below Flag. Indicates whether the latest close is above or below the moving average.
Above MA. If the Latest Close is higher than the Moving Average, ProTA displays a 1.
Below MA. If the Latest Close is lower than the Moving Average, ProTA displays a -1.
Equal to MA. If the Latest Close is equal to the Moving Average, ProTA displays a 0.
!57
Crossover Flag. Indicates a crossing of the moving average line, based on the latest and prior closing values.
Crossed Above MA. If the Prior Close was lower than the Prior Moving Average and the Latest Close is higher than the Latest Moving Average, ProTA displays a 1.
Crossed Below MA. If the Prior Close was higher than the Prior Moving Average and the Latest Close is lower than the Latest Moving Average, ProTA displays a -1.
No Crossover. In all other cases, ProTA displays a 0.
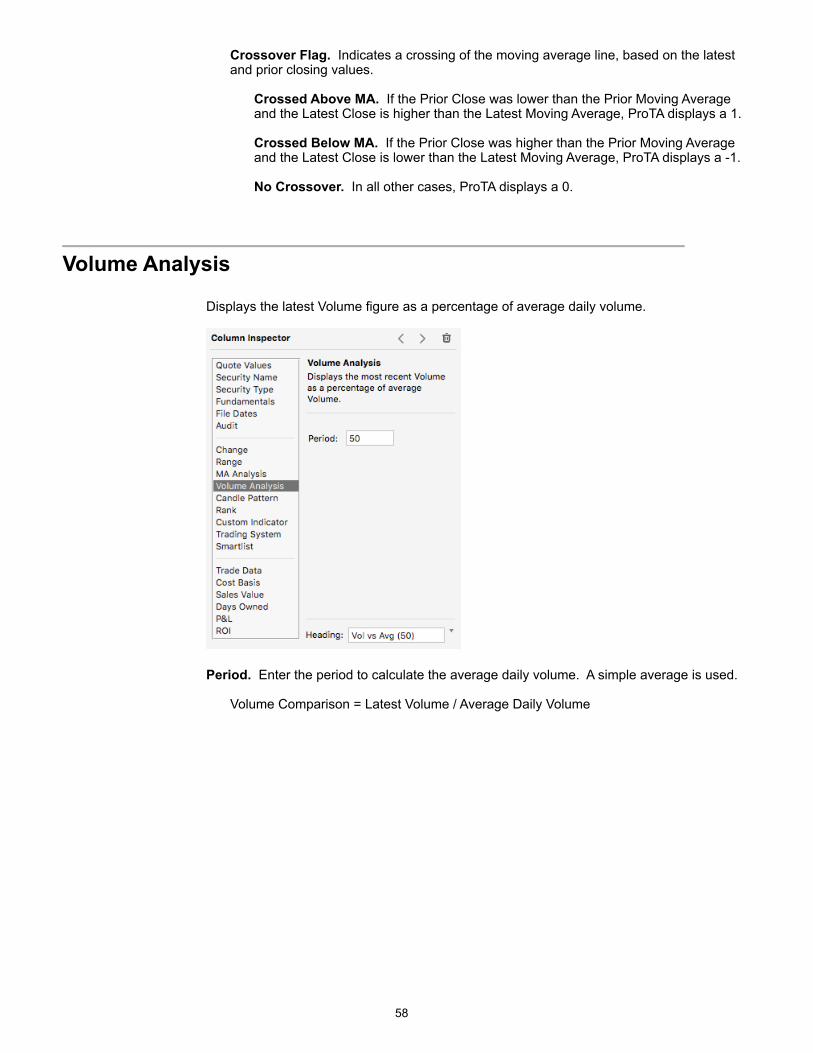
!Volume Analysis
Displays the latest Volume figure as a percentage of average daily volume.
!
Period. Enter the period to calculate the average daily volume. A simple average is used.
Volume Comparison = Latest Volume / Average Daily Volume
!58
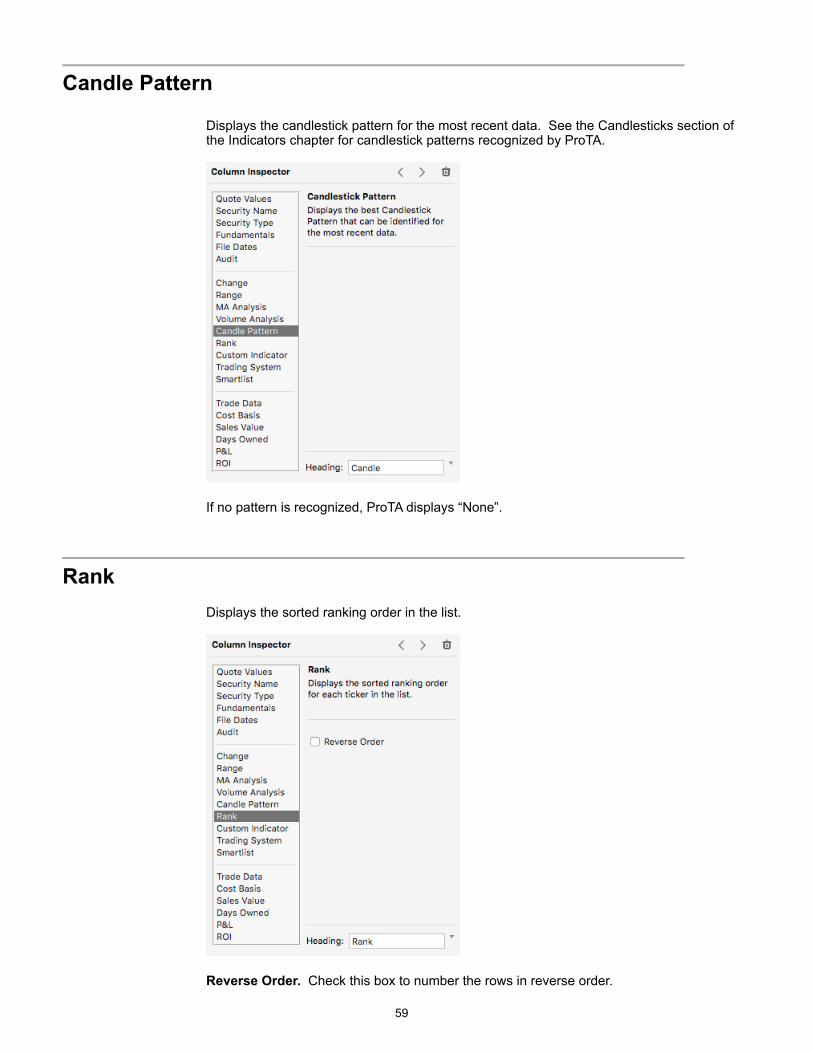
!Candle Pattern
Displays the candlestick pattern for the most recent data. See the Candlesticks section of the Indicators chapter for candlestick patterns recognized by ProTA.
!
If no pattern is recognized, ProTA displays “None”.
! Rank
Displays the sorted ranking order in the list.
!
Reverse Order. Check this box to number the rows in reverse order.
!59
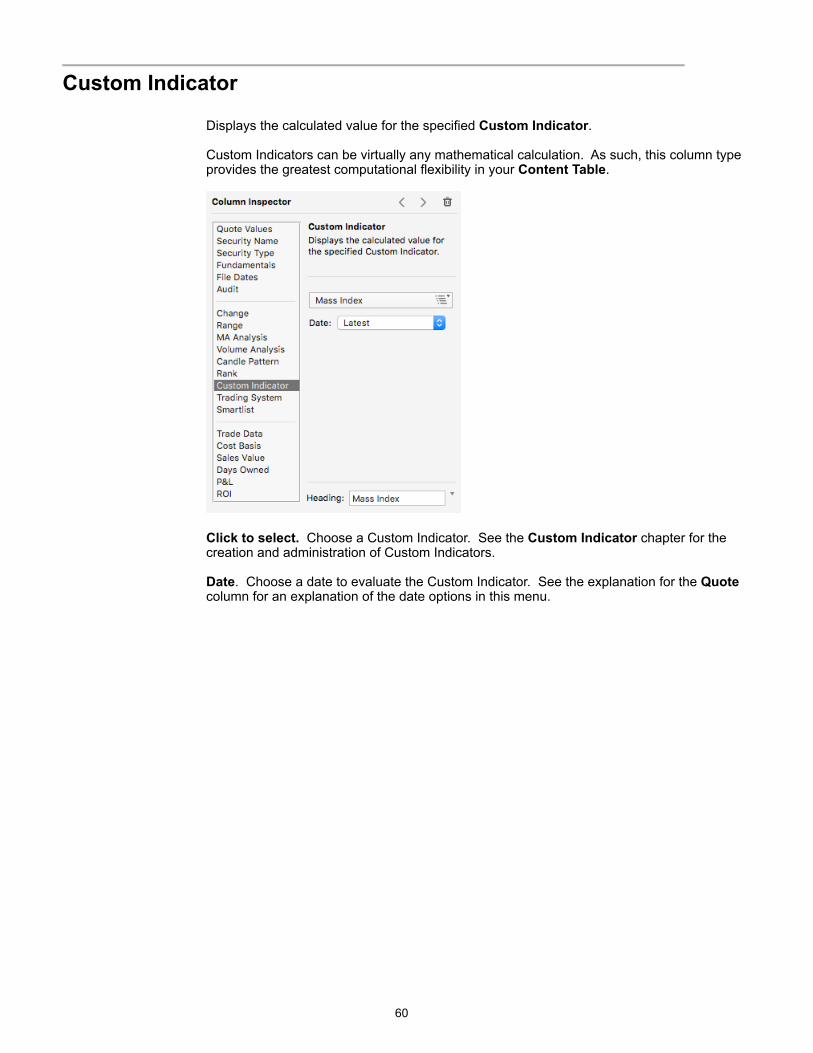
!Custom Indicator
Displays the calculated value for the specified Custom Indicator.
Custom Indicators can be virtually any mathematical calculation. As such, this column type provides the greatest computational flexibility in your Content Table.
!
Click to select. Choose a Custom Indicator. See the Custom Indicator chapter for the creation and administration of Custom Indicators.
Date. Choose a date to evaluate the Custom Indicator. See the explanation for the Quote column for an explanation of the date options in this menu.
!60
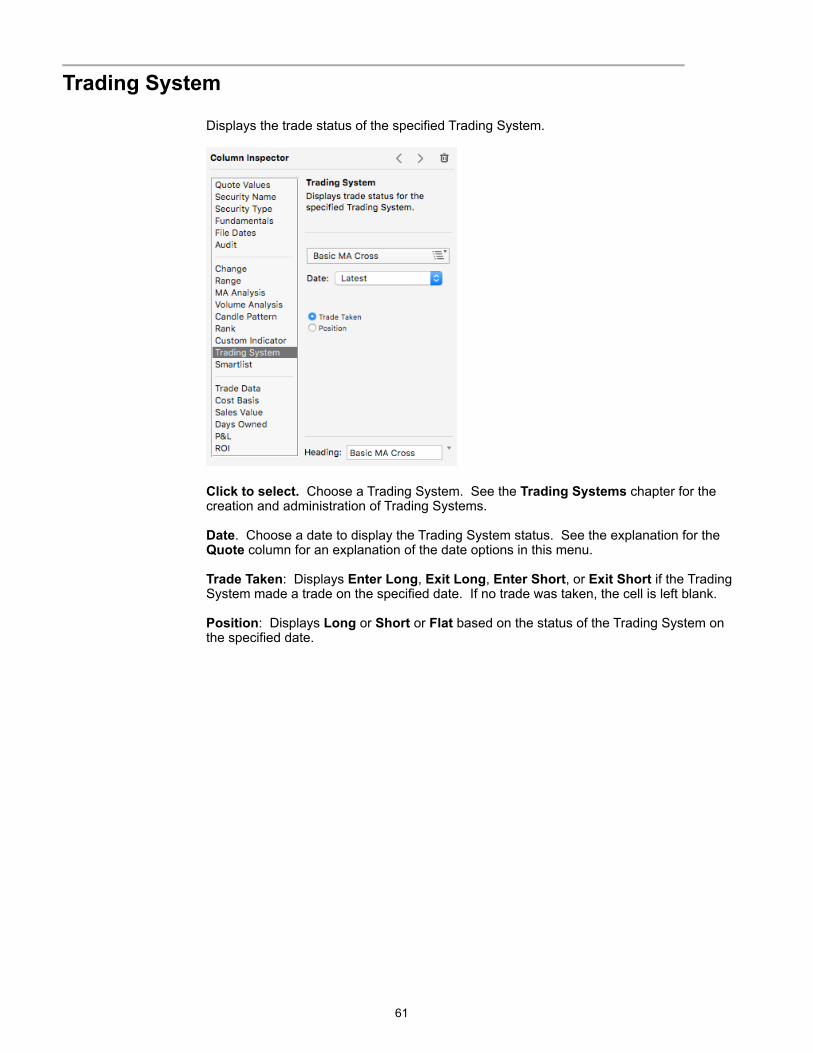
!Trading System
Displays the trade status of the specified Trading System.
!
Click to select. Choose a Trading System. See the Trading Systems chapter for the creation and administration of Trading Systems.
Date. Choose a date to display the Trading System status. See the explanation for the Quote column for an explanation of the date options in this menu.
Trade Taken: Displays Enter Long, Exit Long, Enter Short, or Exit Short if the Trading System made a trade on the specified date. If no trade was taken, the cell is left blank.
Position: Displays Long or Short or Flat based on the status of the Trading System on the specified date.
!61
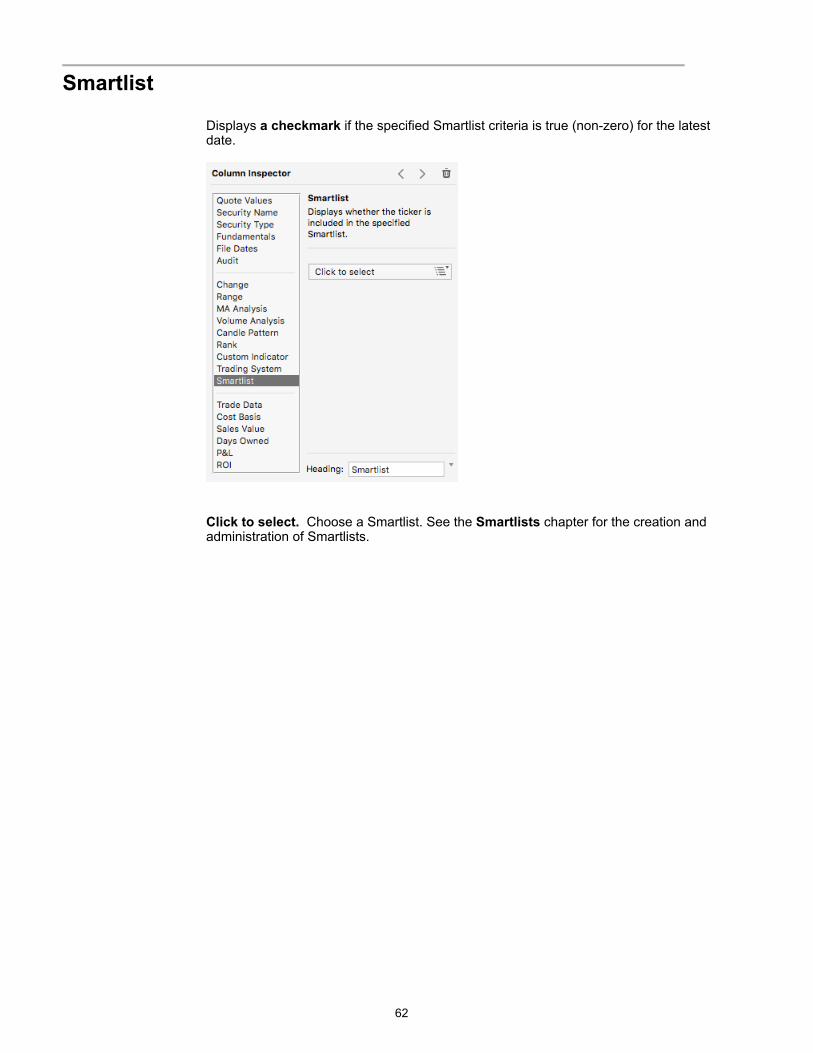
!Smartlist
Displays a checkmark if the specified Smartlist criteria is true (non-zero) for the latest date.
!
Click to select. Choose a Smartlist. See the Smartlists chapter for the creation and administration of Smartlists.
!62
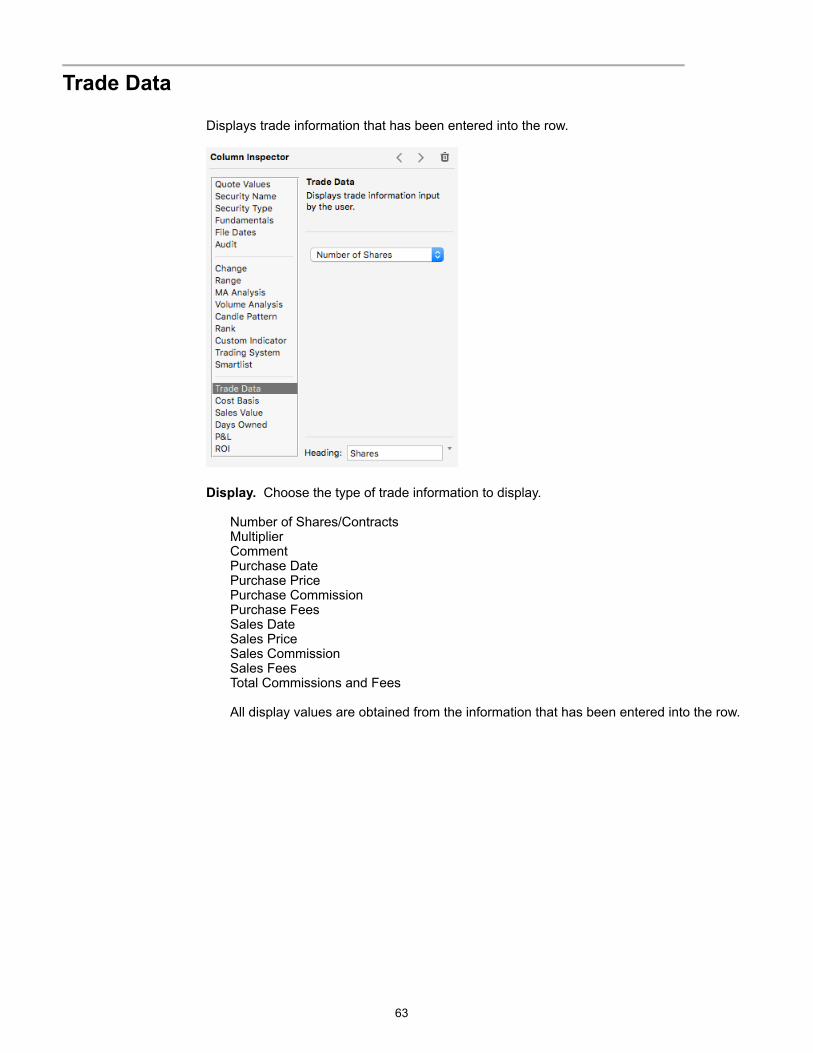
! Trade Data
Displays trade information that has been entered into the row.
!
Display. Choose the type of trade information to display.
Number of Shares/Contracts Multiplier Comment Purchase Date Purchase Price Purchase Commission Purchase Fees Sales Date Sales Price Sales Commission Sales Fees Total Commissions and Fees
All display values are obtained from the information that has been entered into the row.
!63
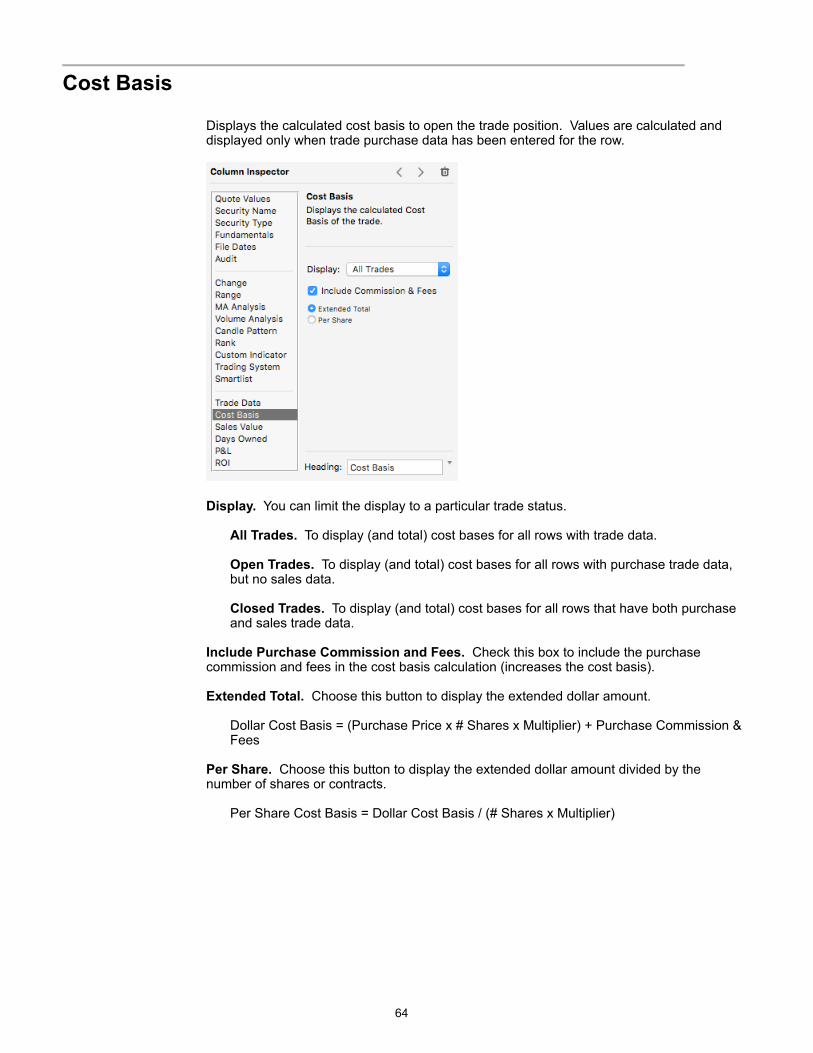
! Cost Basis
Displays the calculated cost basis to open the trade position. Values are calculated and displayed only when trade purchase data has been entered for the row.
!
Display. You can limit the display to a particular trade status.
All Trades. To display (and total) cost bases for all rows with trade data.
Open Trades. To display (and total) cost bases for all rows with purchase trade data, but no sales data.
Closed Trades. To display (and total) cost bases for all rows that have both purchase and sales trade data.
Include Purchase Commission and Fees. Check this box to include the purchase commission and fees in the cost basis calculation (increases the cost basis).
Extended Total. Choose this button to display the extended dollar amount.
Dollar Cost Basis = (Purchase Price x # Shares x Multiplier) + Purchase Commission & Fees
Per Share. Choose this button to display the extended dollar amount divided by the number of shares or contracts.
Per Share Cost Basis = Dollar Cost Basis / (# Shares x Multiplier)
!64
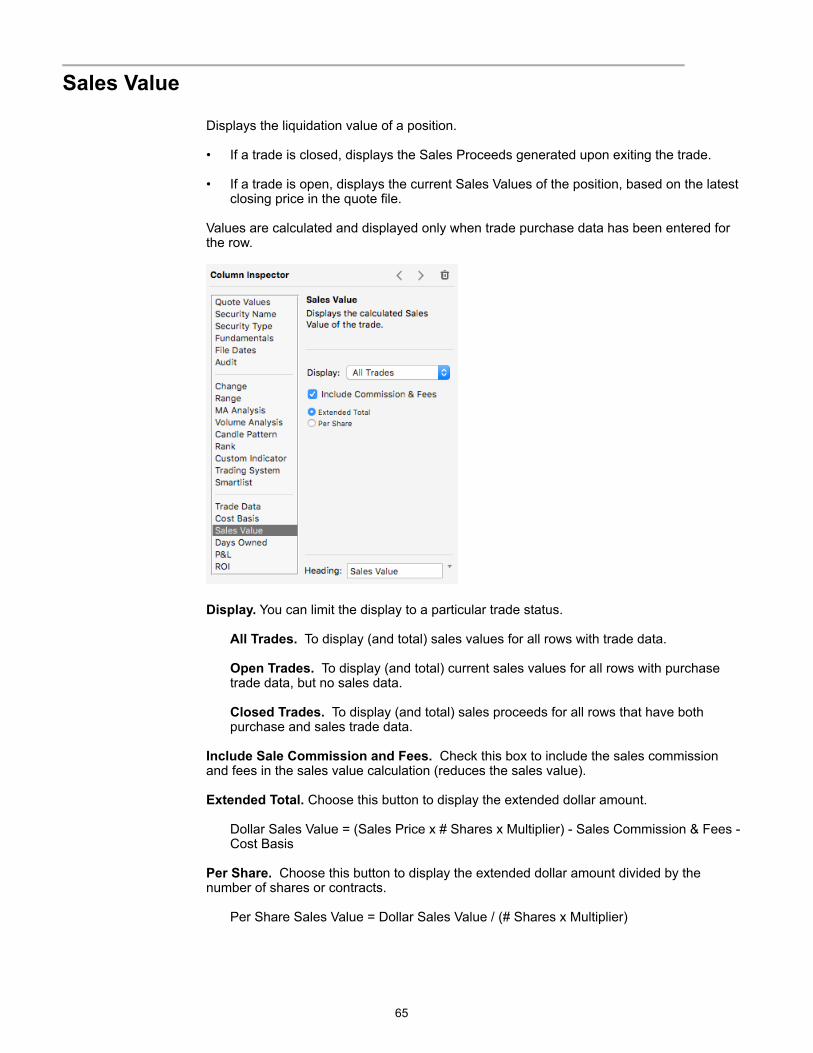
! Sales Value
Displays the liquidation value of a position.
• If a trade is closed, displays the Sales Proceeds generated upon exiting the trade.
• If a trade is open, displays the current Sales Values of the position, based on the latest closing price in the quote file.
Values are calculated and displayed only when trade purchase data has been entered for the row.
!
Display. You can limit the display to a particular trade status.
All Trades. To display (and total) sales values for all rows with trade data.
Open Trades. To display (and total) current sales values for all rows with purchase trade data, but no sales data.
Closed Trades. To display (and total) sales proceeds for all rows that have both purchase and sales trade data.
Include Sale Commission and Fees. Check this box to include the sales commission and fees in the sales value calculation (reduces the sales value).
Extended Total. Choose this button to display the extended dollar amount.
Dollar Sales Value = (Sales Price x # Shares x Multiplier) - Sales Commission & Fees - Cost Basis
Per Share. Choose this button to display the extended dollar amount divided by the number of shares or contracts.
Per Share Sales Value = Dollar Sales Value / (# Shares x Multiplier)
!65
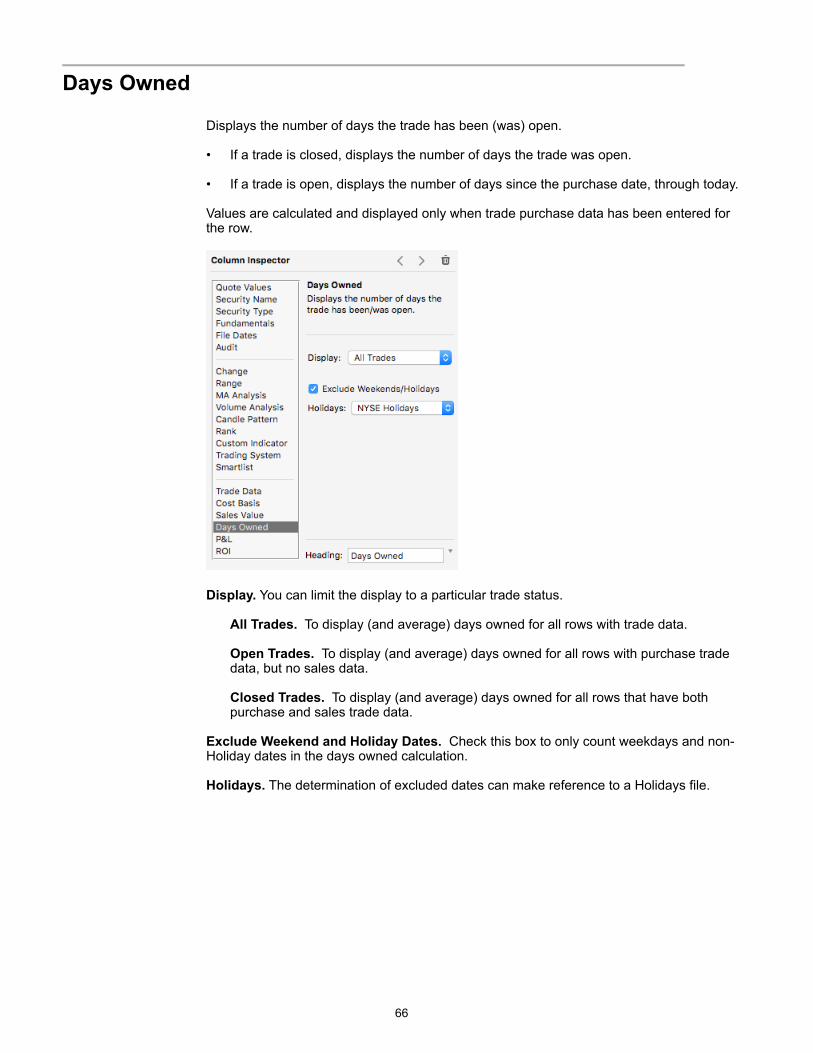
! Days Owned
Displays the number of days the trade has been (was) open.
• If a trade is closed, displays the number of days the trade was open.
• If a trade is open, displays the number of days since the purchase date, through today.
Values are calculated and displayed only when trade purchase data has been entered for the row.
!
Display. You can limit the display to a particular trade status.
All Trades. To display (and average) days owned for all rows with trade data.
Open Trades. To display (and average) days owned for all rows with purchase trade data, but no sales data.
Closed Trades. To display (and average) days owned for all rows that have both purchase and sales trade data.
Exclude Weekend and Holiday Dates. Check this box to only count weekdays and non-Holiday dates in the days owned calculation.
Holidays. The determination of excluded dates can make reference to a Holidays file.
!66
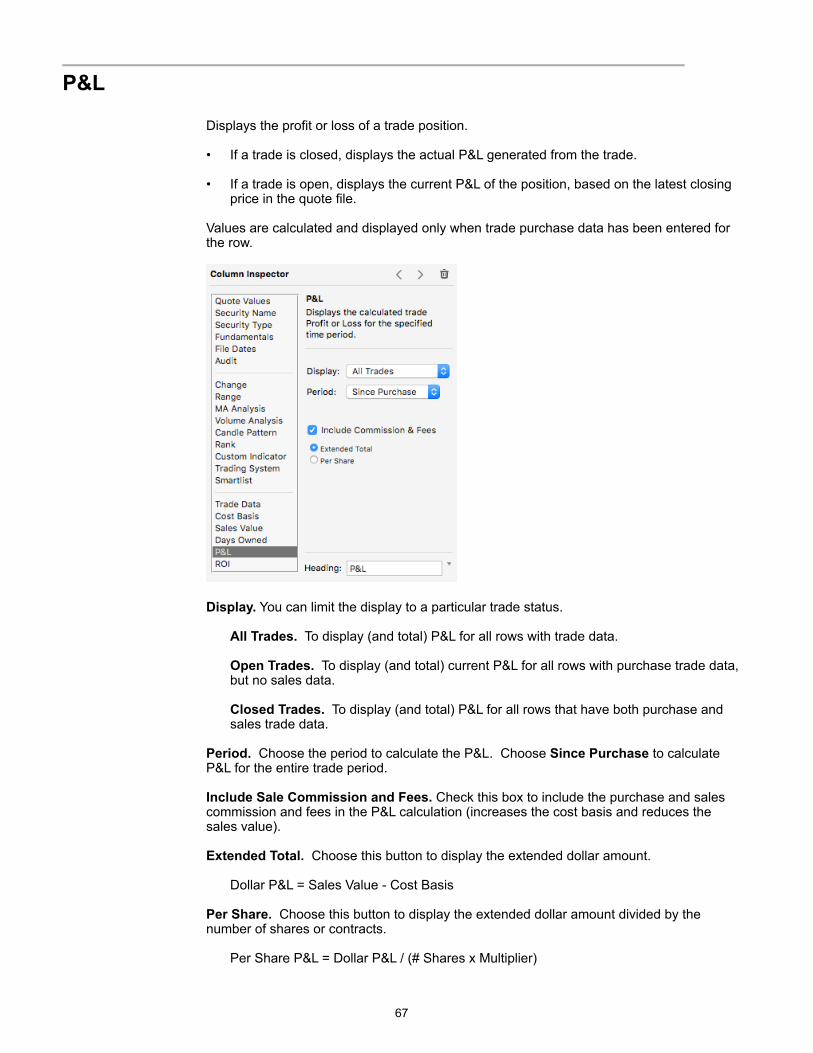
! P&L
Displays the profit or loss of a trade position.
• If a trade is closed, displays the actual P&L generated from the trade.
• If a trade is open, displays the current P&L of the position, based on the latest closing price in the quote file.
Values are calculated and displayed only when trade purchase data has been entered for the row.
!
Display. You can limit the display to a particular trade status.
All Trades. To display (and total) P&L for all rows with trade data.
Open Trades. To display (and total) current P&L for all rows with purchase trade data, but no sales data.
Closed Trades. To display (and total) P&L for all rows that have both purchase and sales trade data.
Period. Choose the period to calculate the P&L. Choose Since Purchase to calculate P&L for the entire trade period.
Include Sale Commission and Fees. Check this box to include the purchase and sales commission and fees in the P&L calculation (increases the cost basis and reduces the sales value).
Extended Total. Choose this button to display the extended dollar amount.
Dollar P&L = Sales Value - Cost Basis
Per Share. Choose this button to display the extended dollar amount divided by the number of shares or contracts.
Per Share P&L = Dollar P&L / (# Shares x Multiplier)
!67
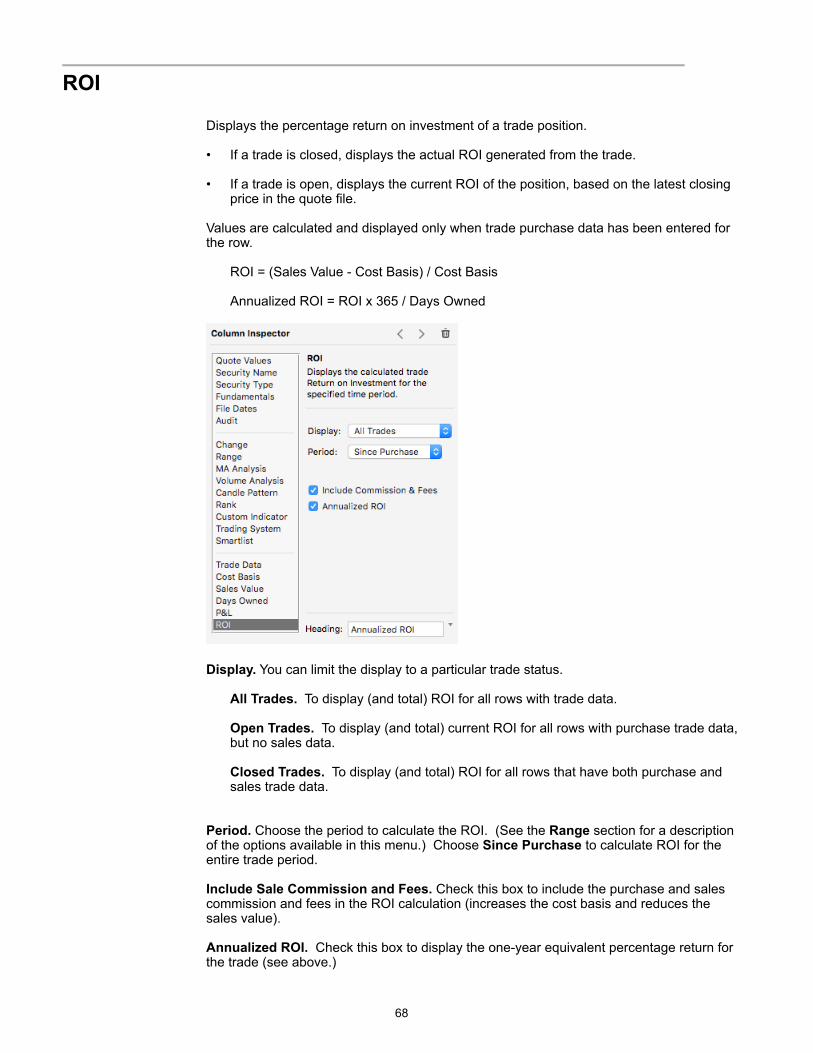
! ROI
Displays the percentage return on investment of a trade position.
• If a trade is closed, displays the actual ROI generated from the trade.
• If a trade is open, displays the current ROI of the position, based on the latest closing price in the quote file.
Values are calculated and displayed only when trade purchase data has been entered for the row.
ROI = (Sales Value - Cost Basis) / Cost Basis
Annualized ROI = ROI x 365 / Days Owned
!
Display. You can limit the display to a particular trade status.
All Trades. To display (and total) ROI for all rows with trade data.
Open Trades. To display (and total) current ROI for all rows with purchase trade data, but no sales data.
Closed Trades. To display (and total) ROI for all rows that have both purchase and sales trade data.
Period. Choose the period to calculate the ROI. (See the Range section for a description of the options available in this menu.) Choose Since Purchase to calculate ROI for the entire trade period.
Include Sale Commission and Fees. Check this box to include the purchase and sales commission and fees in the ROI calculation (increases the cost basis and reduces the sales value).
Annualized ROI. Check this box to display the one-year equivalent percentage return for the trade (see above.)
!68
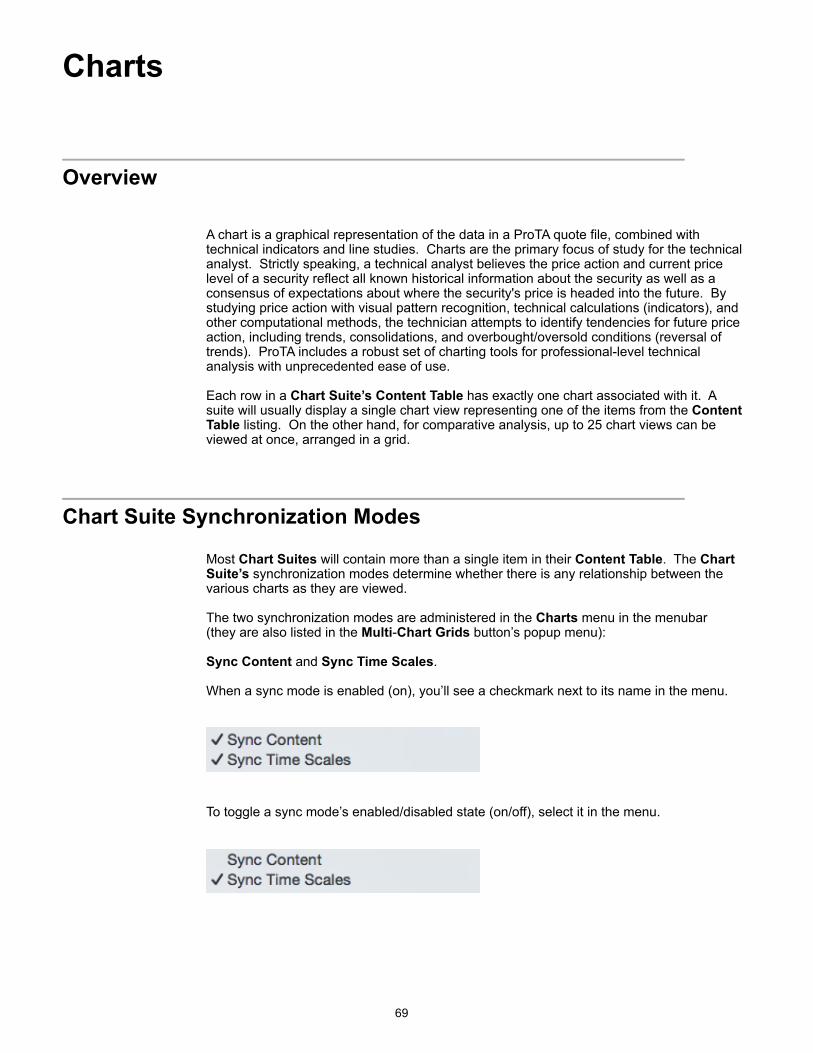
Charts
!Overview
A chart is a graphical representation of the data in a ProTA quote file, combined with technical indicators and line studies. Charts are the primary focus of study for the technical analyst. Strictly speaking, a technical analyst believes the price action and current price level of a security reflect all known historical information about the security as well as a consensus of expectations about where the security's price is headed into the future. By studying price action with visual pattern recognition, technical calculations (indicators), and other computational methods, the technician attempts to identify tendencies for future price action, including trends, consolidations, and overbought/oversold conditions (reversal of trends). ProTA includes a robust set of charting tools for professional-level technical analysis with unprecedented ease of use.
Each row in a Chart Suite’s Content Table has exactly one chart associated with it. A suite will usually display a single chart view representing one of the items from the Content Table listing. On the other hand, for comparative analysis, up to 25 chart views can be viewed at once, arranged in a grid.
! Chart Suite Synchronization Modes
Most Chart Suites will contain more than a single item in their Content Table. The Chart Suite’s synchronization modes determine whether there is any relationship between the various charts as they are viewed.
The two synchronization modes are administered in the Charts menu in the menubar (they are also listed in the Multi-Chart Grids button’s popup menu):
Sync Content and Sync Time Scales.
When a sync mode is enabled (on), you’ll see a checkmark next to its name in the menu.
!
To toggle a sync mode’s enabled/disabled state (on/off), select it in the menu.
!
!69
Sync Content
Enabled. When Sync Content is enabled, all chart views are computed and rendered with identical settings. This mode provides the ability to view all of the charts in the suite with the same analyses.
What to expect when Sync Content is enabled:
• As you select various charts in the Content Table, each new chart coming into view is initialized with the settings from the previous chart.
• If the chart suite has multiple chart views displayed in a grid, each view is synchronized with the same settings.
• When you add, edit or remove an Indicator, change colors, resize a pane, apply a Template, etc., each visible chart view is synchronized with the same edits.
Tip. Another way to think about the Sync Content enabled mode is as a “template” mode. Each chart view has the same template applied to it.
Disabled. When Sync Contents is disabled, all chart views in the suite operate independently with no relation to one another. This mode treats a suite as a collection of individual charts, each with their own unique analyses.
What to expect when Sync Content is disabled:
• As you select various charts in the Content Table, each new chart coming into view is initialized with the same settings from the last time you viewed/edited it. If the chart has not yet been viewed in this suite, it is initialized with default settings as specified in the Preferences window.
• If the chart suite has multiple chart views displayed in a grid, each view is treated as an individual entity allowing you to view one chart as Bars and another as Candlesticks for example.
• When you add, edit or remove an Indicator, change colors, resize a pane, apply a Template, only the selected chart is edited. Other charts are unaffected.
Note. Line Studies and Text annotations are almost always chart-specific. For example, Trendlines drawn at specific highs or lows for ticker AAA are not going to be valid/desirable when you switch to ticker BBB. As such, Line Studies and Texts are not normally included in the content synchronization process. This allows you to retain unique Trendlines on each chart, even when Sync Content is enabled.
Sync Time Scales
Enabled. When Sync Time Scales is enabled, all chart views are scrolled, zoomed and otherwise formatted so the time scales are synchronized. This mode provides the ability to view all of the charts in the suite with the same time frame.
What to expect when Sync Time Scales is enabled:
• As you select various charts in the Content Table, each new chart coming into view is initialized with the x-axis settings from the previous chart.
• If the chart suite has multiple chart views displayed in a grid, each view is synchronized with the same time scale.
• When you adjust the scrollbar, zoom in/out, etc., each chart view is dynamically synced with the same x-axis settings.
!70
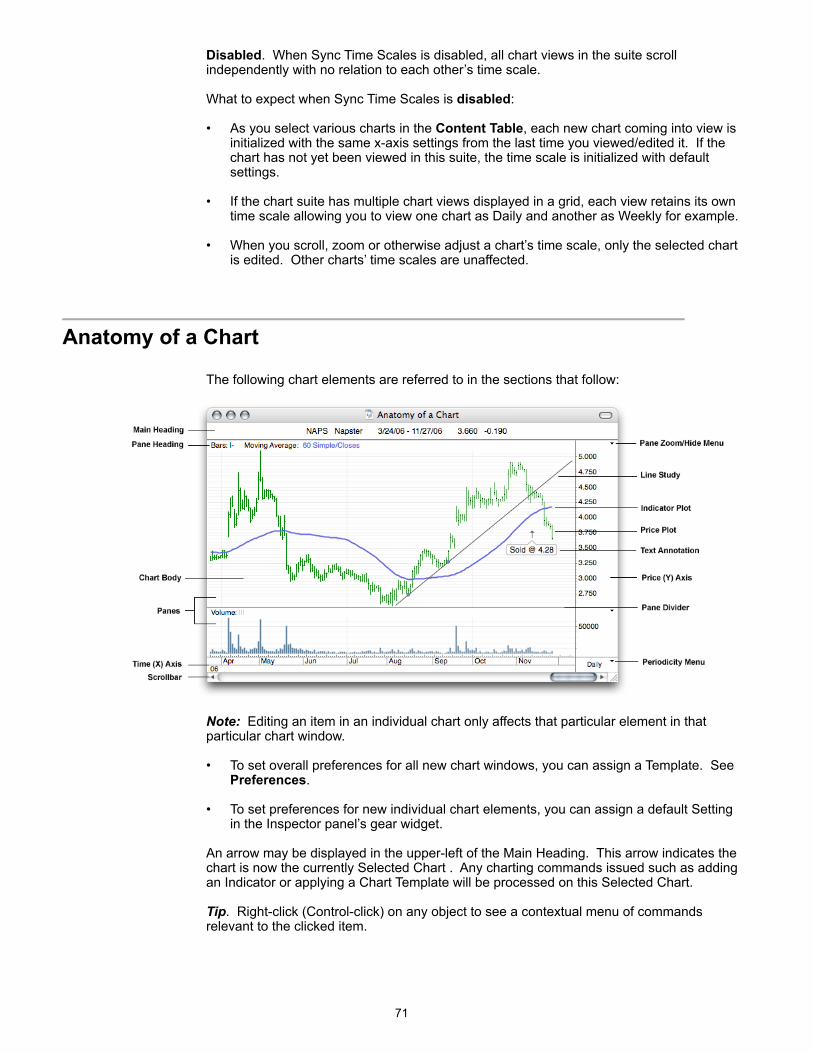
Disabled. When Sync Time Scales is disabled, all chart views in the suite scroll independently with no relation to each other’s time scale.
What to expect when Sync Time Scales is disabled:
• As you select various charts in the Content Table, each new chart coming into view is initialized with the same x-axis settings from the last time you viewed/edited it. If the chart has not yet been viewed in this suite, the time scale is initialized with default settings.
• If the chart suite has multiple chart views displayed in a grid, each view retains its own time scale allowing you to view one chart as Daily and another as Weekly for example.
• When you scroll, zoom or otherwise adjust a chart’s time scale, only the selected chart is edited. Other charts’ time scales are unaffected.
!Anatomy of a Chart
The following chart elements are referred to in the sections that follow:
!
Note: Editing an item in an individual chart only affects that particular element in that particular chart window.
• To set overall preferences for all new chart windows, you can assign a Template. See Preferences.
• To set preferences for new individual chart elements, you can assign a default Setting in the Inspector panel’s gear widget.
An arrow may be displayed in the upper-left of the Main Heading. This arrow indicates the chart is now the currently Selected Chart . Any charting commands issued such as adding an Indicator or applying a Chart Template will be processed on this Selected Chart.
Tip. Right-click (Control-click) on any object to see a contextual menu of commands relevant to the clicked item.
!71
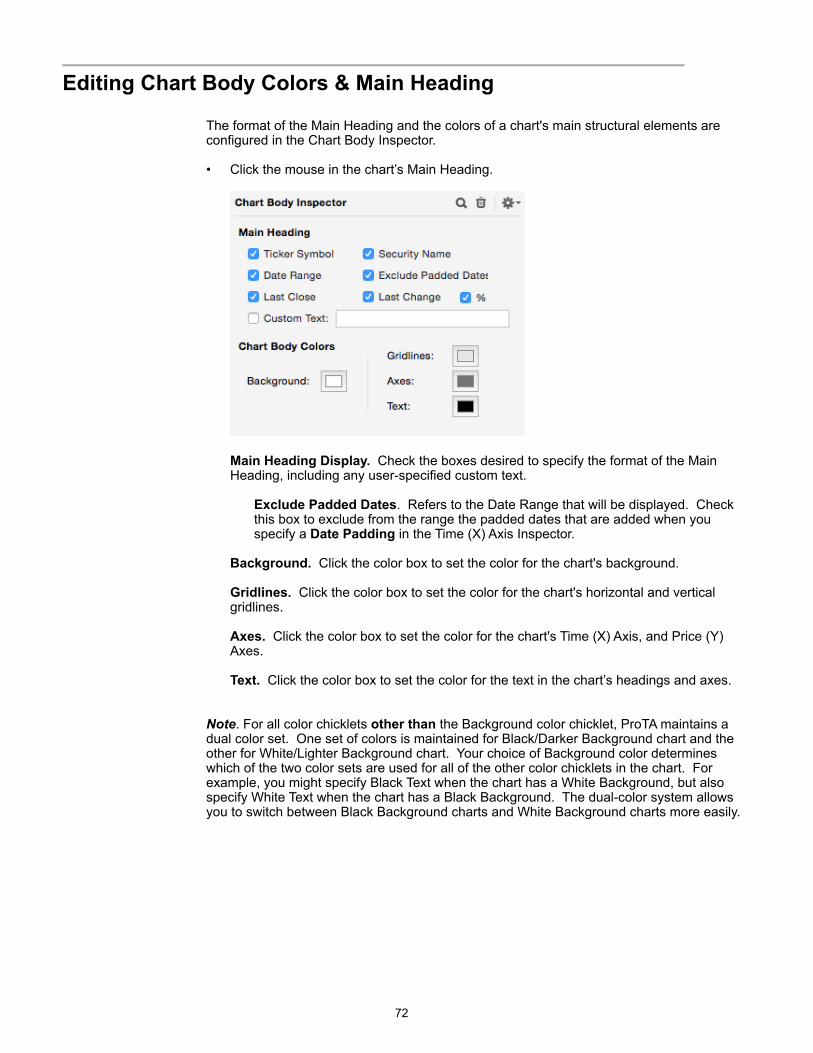
!Editing Chart Body Colors & Main Heading
The format of the Main Heading and the colors of a chart's main structural elements are configured in the Chart Body Inspector.
• Click the mouse in the chart’s Main Heading.
!
Main Heading Display. Check the boxes desired to specify the format of the Main Heading, including any user-specified custom text.
Exclude Padded Dates. Refers to the Date Range that will be displayed. Check this box to exclude from the range the padded dates that are added when you specify a Date Padding in the Time (X) Axis Inspector.
Background. Click the color box to set the color for the chart's background.
Gridlines. Click the color box to set the color for the chart's horizontal and vertical gridlines.
Axes. Click the color box to set the color for the chart's Time (X) Axis, and Price (Y) Axes.
Text. Click the color box to set the color for the text in the chart’s headings and axes.
Note. For all color chicklets other than the Background color chicklet, ProTA maintains a dual color set. One set of colors is maintained for Black/Darker Background chart and the other for White/Lighter Background chart. Your choice of Background color determines which of the two color sets are used for all of the other color chicklets in the chart. For example, you might specify Black Text when the chart has a White Background, but also specify White Text when the chart has a Black Background. The dual-color system allows you to switch between Black Background charts and White Background charts more easily.
!72
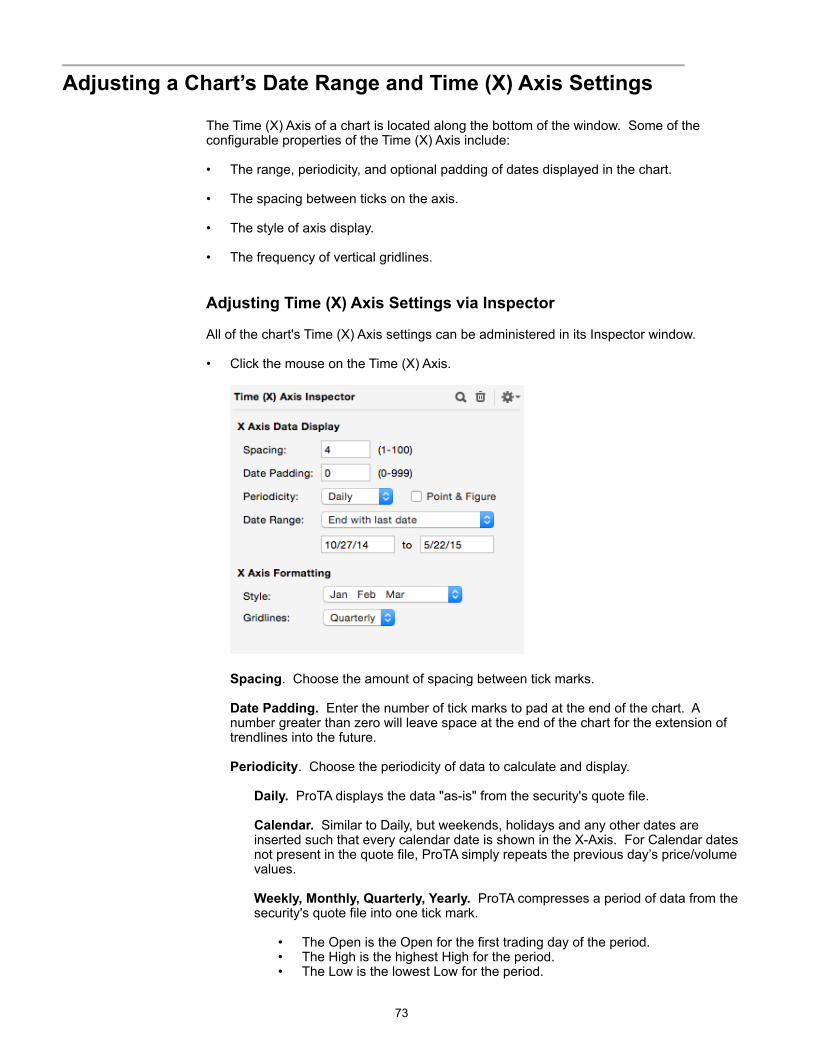
!Adjusting a Chart’s Date Range and Time (X) Axis Settings
The Time (X) Axis of a chart is located along the bottom of the window. Some of the configurable properties of the Time (X) Axis include:
• The range, periodicity, and optional padding of dates displayed in the chart.
• The spacing between ticks on the axis.
• The style of axis display.
• The frequency of vertical gridlines.
Adjusting Time (X) Axis Settings via Inspector
All of the chart's Time (X) Axis settings can be administered in its Inspector window.
• Click the mouse on the Time (X) Axis.
!
Spacing. Choose the amount of spacing between tick marks.
Date Padding. Enter the number of tick marks to pad at the end of the chart. A number greater than zero will leave space at the end of the chart for the extension of trendlines into the future.
Periodicity. Choose the periodicity of data to calculate and display.
Daily. ProTA displays the data "as-is" from the security's quote file.
Calendar. Similar to Daily, but weekends, holidays and any other dates are inserted such that every calendar date is shown in the X-Axis. For Calendar dates not present in the quote file, ProTA simply repeats the previous day’s price/volume values.
Weekly, Monthly, Quarterly, Yearly. ProTA compresses a period of data from the security's quote file into one tick mark.
• The Open is the Open for the first trading day of the period. • The High is the highest High for the period. • The Low is the lowest Low for the period.
!73
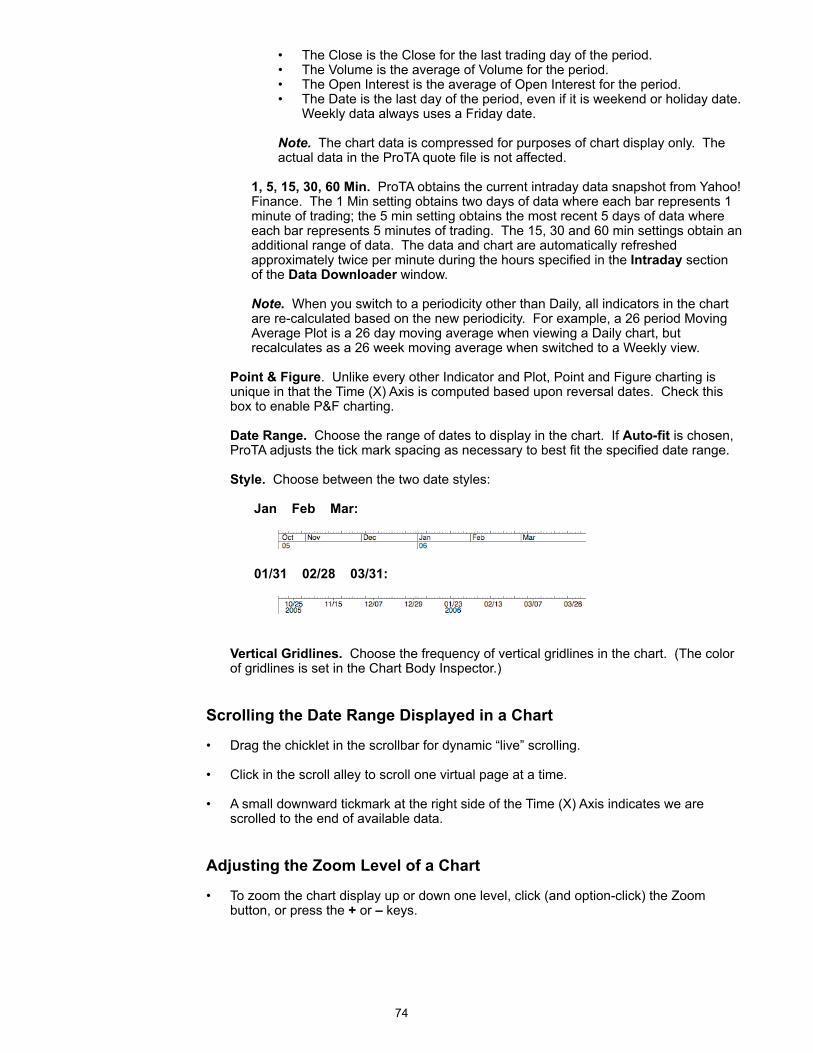
• The Close is the Close for the last trading day of the period. • The Volume is the average of Volume for the period. • The Open Interest is the average of Open Interest for the period. • The Date is the last day of the period, even if it is weekend or holiday date.
Weekly data always uses a Friday date.
Note. The chart data is compressed for purposes of chart display only. The actual data in the ProTA quote file is not affected.
1, 5, 15, 30, 60 Min. ProTA obtains the current intraday data snapshot from Yahoo! Finance. The 1 Min setting obtains two days of data where each bar represents 1 minute of trading; the 5 min setting obtains the most recent 5 days of data where each bar represents 5 minutes of trading. The 15, 30 and 60 min settings obtain an additional range of data. The data and chart are automatically refreshed approximately twice per minute during the hours specified in the Intraday section of the Data Downloader window.
Note. When you switch to a periodicity other than Daily, all indicators in the chart are re-calculated based on the new periodicity. For example, a 26 period Moving Average Plot is a 26 day moving average when viewing a Daily chart, but recalculates as a 26 week moving average when switched to a Weekly view.
Point & Figure. Unlike every other Indicator and Plot, Point and Figure charting is unique in that the Time (X) Axis is computed based upon reversal dates. Check this box to enable P&F charting.
Date Range. Choose the range of dates to display in the chart. If Auto-fit is chosen, ProTA adjusts the tick mark spacing as necessary to best fit the specified date range.
Style. Choose between the two date styles:
Jan Feb Mar:
!
01/31 02/28 03/31:
!
Vertical Gridlines. Choose the frequency of vertical gridlines in the chart. (The color of gridlines is set in the Chart Body Inspector.)
Scrolling the Date Range Displayed in a Chart
• Drag the chicklet in the scrollbar for dynamic “live” scrolling.
• Click in the scroll alley to scroll one virtual page at a time.
• A small downward tickmark at the right side of the Time (X) Axis indicates we are scrolled to the end of available data.
Adjusting the Zoom Level of a Chart
• To zoom the chart display up or down one level, click (and option-click) the Zoom button, or press the + or – keys.
!74
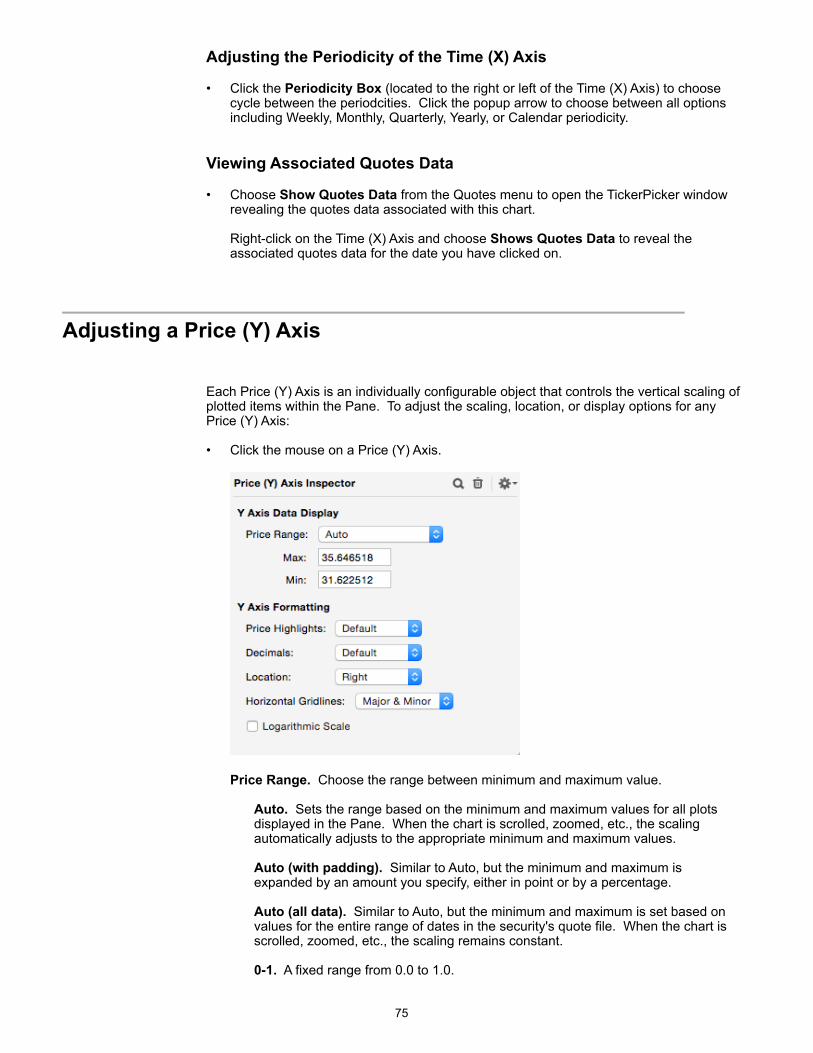
Adjusting the Periodicity of the Time (X) Axis
• Click the Periodicity Box (located to the right or left of the Time (X) Axis) to choose cycle between the periodcities. Click the popup arrow to choose between all options including Weekly, Monthly, Quarterly, Yearly, or Calendar periodicity.
Viewing Associated Quotes Data
• Choose Show Quotes Data from the Quotes menu to open the TickerPicker window revealing the quotes data associated with this chart.
Right-click on the Time (X) Axis and choose Shows Quotes Data to reveal the associated quotes data for the date you have clicked on.
!Adjusting a Price (Y) Axis
Each Price (Y) Axis is an individually configurable object that controls the vertical scaling of plotted items within the Pane. To adjust the scaling, location, or display options for any Price (Y) Axis:
• Click the mouse on a Price (Y) Axis.
!
Price Range. Choose the range between minimum and maximum value.
Auto. Sets the range based on the minimum and maximum values for all plots displayed in the Pane. When the chart is scrolled, zoomed, etc., the scaling automatically adjusts to the appropriate minimum and maximum values.
Auto (with padding). Similar to Auto, but the minimum and maximum is expanded by an amount you specify, either in point or by a percentage.
Auto (all data). Similar to Auto, but the minimum and maximum is set based on values for the entire range of dates in the security's quote file. When the chart is scrolled, zoomed, etc., the scaling remains constant.
0-1. A fixed range from 0.0 to 1.0.
!75
0-100. A fixed range from 0 to 100.
0-Auto. The lower boundary is fixed at 0, while the upper boundary is computed following the Auto rules (see above).
-1 - 1. A fixed range from -1.0 to 1.0.
-100 - 100. A fixed range from -100 to 100.
Manual. A user-specified, fixed range. When the chart is scrolled, zoomed, etc., the scaling remains constant based on the values you've entered.
Price Highlights. Choose the style to display the most recent values for plotted items, or choose None.
Decimals. Choose the decimal format for Y-values.
Location. A Price (Y) Axis can be located on either side of the Pane, or Hidden from view.
Horizontal Gridlines. Choose the frequency of horizontal gridlines in the Pane. (The color of gridlines is set in the Chart Body Inspector.)
Logarithmic Scale. Check this box to use logarithmic scaling. With logarithmic scaling, the vertical chart space between the price levels of 10 and 20 (a 100% increase) is the same as the spacing between 20 and 40 (a 100% increase).
Logarithmic scaling is most useful when viewing long-term charts. 20 years ago, a one-day 50 point move in the Dow Jones Industrial Average represented a huge market move. Today it is commonplace. Logarithmic scaling displays price movements such that a 10% rally 20 years ago (at lower price levels) covers the same vertical chart space as a 10% rally today (at higher price levels.)
!Administering Price Plots & Indicators
The Indicators menu and button popup include over 50 built-in price plots and indicators as well as all of the Custom Indicators and Trading Systems you’ve developed. Each is fully configurable in terms of color, line style, and computational parameters.
This section covers the general logistics of administering plots in a chart. The next chapter, Indicators, describes each of the price plots and indicators in detail.
Adding a Price Plot or Indicator
Each chart can contain an unlimited number of Price Plots and Indicators.
• From the Indicators menu, choose the price plot or indicator to add.
or
• From the File Browser menu, click the Apply button ( < ) or double-click an item from the Standard Indicators, Custom Indicators, or Trading Systems categories.
Price-based plots are overlaid onto the price-based Y-Axis if one exists. All other plots are added to a new pane/new y-axis at the bottom of the chart.
!76
Note. Selections from the Indicators menu always result in the addition of a new plot; existing plots of the same type are not replaced. This allows you to, for example, add one Moving Average set to a Period 12, then add another Moving Average set to a Period 50.
Selecting and Editing a Price Plot or Indicator
You can re-configure the color, line style, or computational parameters of any plotted item in a chart window.
• Move the mouse over the price plot or indicator. The cursor changes to a pointing finger.
• Click the mouse on the plot. The Indicator’s specifications are shown in the Inspector window.
• As edits are made in the Inspector, the chart is redrawn to reflect the new specifications.
Tip. Use the left and right arrow keys on the keyboard to cycle the selection/Inspector window through all of the editable items in the chart.
Moving a Price Plot or Indicator
You can move any plotted item to another location within the chart:
• Move the mouse over the price plot or indicator. The cursor changes to a pointing finger.
• Click and hold the mouse on the plot. When the mouse is held down on a plotted item, the plot is highlighted.
• Drag the mouse. As the drag begins, the cursor changes to the hand cursor and the plot’s original Pane and Y-Axis are shaded.
• Drag the mouse to another Pane (destination Pane) within the chart window. The Pane and Y-Axis of the destination is now shaded. Drag the mouse to the extreme left or right of the chart to specify a specific Y-Axis as the destination.
Tip. To move the plot into a brand new Pane, drag the mouse to the Main Heading or to the Time (X) Axis.
• Release the mouse to move the plot.
If the original source Pane is left empty after the move, the source Pane is deleted from the chart. All remaining Panes are proportionally resized to fill the vertical chart space.
Note. To move a copy of the plot, hold down the option key when pressing the mouse button on the plot.
Note. To move a copy of the plot to a different chart, use Copy/Paste from the Edit menu.
Note. To adjust the drawing order of overlapping plots, right-click any plot and choose Move Forward or Move Backward..
Removing a Price Plot or Indicator
You can remove any plotted item from a chart window.
• Move the mouse over the price plot or indicator. The cursor changes to a pointing finger.
!77
• Click the mouse on the plot. The Indicator’s specifications are shown in the Inspector window.
• Click the Trashcan button in the Inspector.
Tip. Another way to remove a plot is to click on the plot, then drag the mouse outside the bounds of the window. Release the mouse to remove the plot.
If there are no plots left in the Pane, the Pane is also deleted from the chart. All remaining Panes are proportionally resized to fill the vertical chart space.
Exporting Price Plot or Indicator Data
You can export the data values related to any price plot or indicator via Copy/Paste.
• Right-Click the mouse on the plot. Choose Copy from the Edit menu. Then Paste the data into a spreadsheet or text application.
!Administering Line Studies
ProTA includes seven varieties of Line Study. You add and position Line Studies graphically with the mouse, much like drawing with a "smart" pencil.
This section covers the general logistics of administering Line Studies in a chart. A separate chapter, Line Studies, describes each in detail.
Adding a Line Study
!
• Click the Mouse Tools button in the Toolbar to see the popup menu of Line Studies to choose from. Select one of the seven Line Studies.
• The cursor will change to the line drawing cursor. Each Line Study has a unique drawing method, but generally, the drawing procedure begins by pressing and holding the mouse down in the chart area. While dragging the mouse, the Pane Heading displays information about the line study including the Date and Price (Y) Value associated with the mouse's position. Some Line Studies require multiple mouse clicks to define the anchor points that define the study. See the chapter, Line Studies, for details.
Note. Each Line Study resides in a single Pane in the chart. When there are multiple Price (Y) Axes in the Pane, the Line Study is scaled based on the first Price (Y) Scale that was used in the Pane.
Selecting, Editing and Removing a Line Study
The steps for selecting, editing and removing a Line Study are similar to those for Indicators. See the Administering Price Plots and Indicators section immediately above.
Moving a Line Study
!78
You can move any line study to a new position within its Pane.
• Move the mouse over the line study. The cursor changes to a pointing finger.
• Click the mouse on the line study. Drag the mouse to the new location for the line study. As the mouse is moved, the Pane Heading displays information about the line study's new position.
• Release the mouse to move the line study to its new position.
Note. With a Cycle Lines, Fibonacci Retracements, or Trendline line study, you can drag either of the two anchor points in addition to moving the entire line.
Note. To move a copy of the Line Study, hold down the option key when pressing the mouse button on the line. This is particularly useful to create a second Trendline parallel to the original.
!Administering Text Items
You can annotate text, symbols or a linked combination of both to any chart.
Adding a Text Item
!
• Click the Mouse Tools button in the Toolbar then choose Text Item. The cursor changes to the text insertion cursor.
• Click the mouse at the location in the chart to annotate the text/symbol. While the mouse is held down, the Pane Heading displays the Date and Price (Y) Value of the mouse position.
• Release the mouse to add the text/symbol.
!79
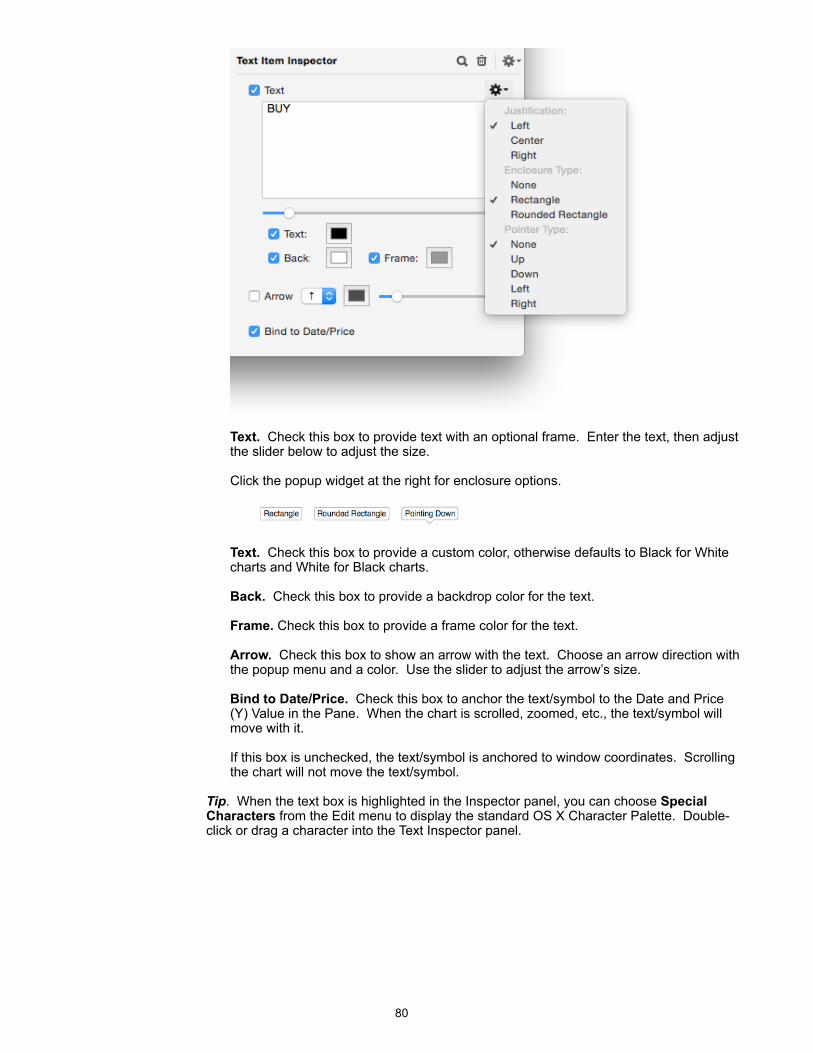
!
Text. Check this box to provide text with an optional frame. Enter the text, then adjust the slider below to adjust the size.
Click the popup widget at the right for enclosure options.
!
Text. Check this box to provide a custom color, otherwise defaults to Black for White charts and White for Black charts.
Back. Check this box to provide a backdrop color for the text.
Frame. Check this box to provide a frame color for the text.
Arrow. Check this box to show an arrow with the text. Choose an arrow direction with the popup menu and a color. Use the slider to adjust the arrow’s size.
Bind to Date/Price. Check this box to anchor the text/symbol to the Date and Price (Y) Value in the Pane. When the chart is scrolled, zoomed, etc., the text/symbol will move with it.
If this box is unchecked, the text/symbol is anchored to window coordinates. Scrolling the chart will not move the text/symbol.
Tip. When the text box is highlighted in the Inspector panel, you can choose Special Characters from the Edit menu to display the standard OS X Character Palette. Double-click or drag a character into the Text Inspector panel.
!80
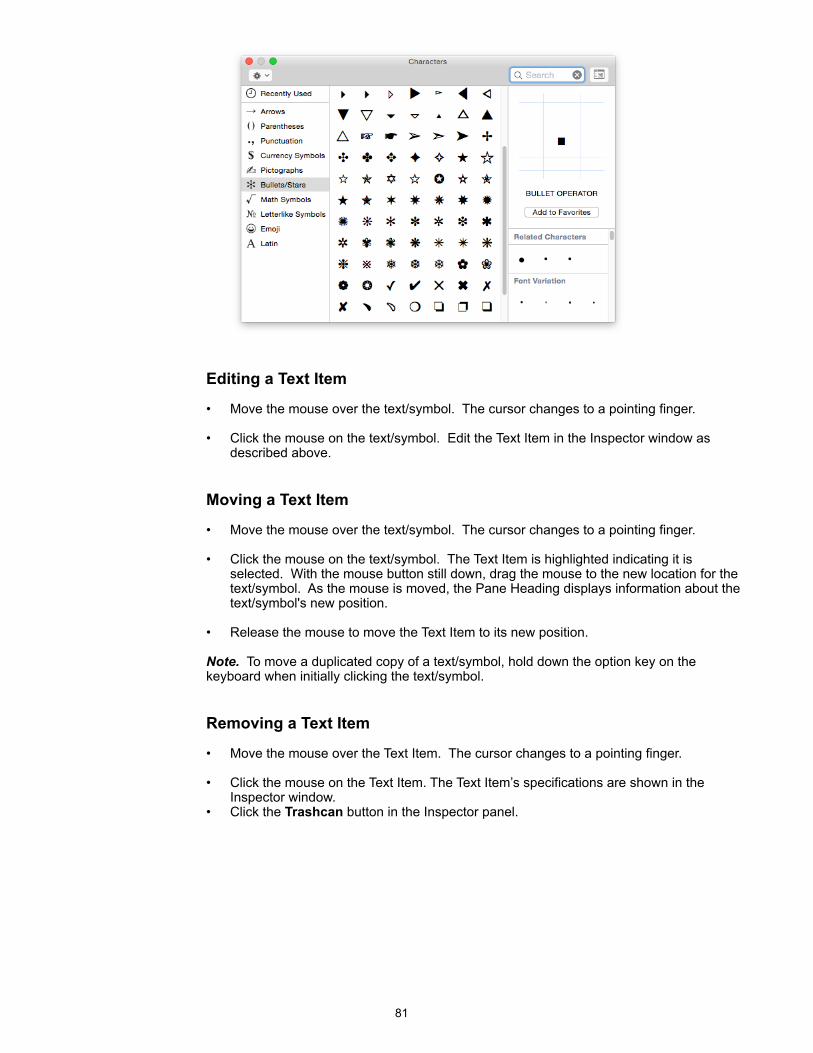
!
Editing a Text Item
• Move the mouse over the text/symbol. The cursor changes to a pointing finger.
• Click the mouse on the text/symbol. Edit the Text Item in the Inspector window as described above.
Moving a Text Item
• Move the mouse over the text/symbol. The cursor changes to a pointing finger.
• Click the mouse on the text/symbol. The Text Item is highlighted indicating it is selected. With the mouse button still down, drag the mouse to the new location for the text/symbol. As the mouse is moved, the Pane Heading displays information about the text/symbol's new position.
• Release the mouse to move the Text Item to its new position.
Note. To move a duplicated copy of a text/symbol, hold down the option key on the keyboard when initially clicking the text/symbol.
Removing a Text Item
• Move the mouse over the Text Item. The cursor changes to a pointing finger.
• Click the mouse on the Text Item. The Text Item’s specifications are shown in the Inspector window.
• Click the Trashcan button in the Inspector panel.
!81
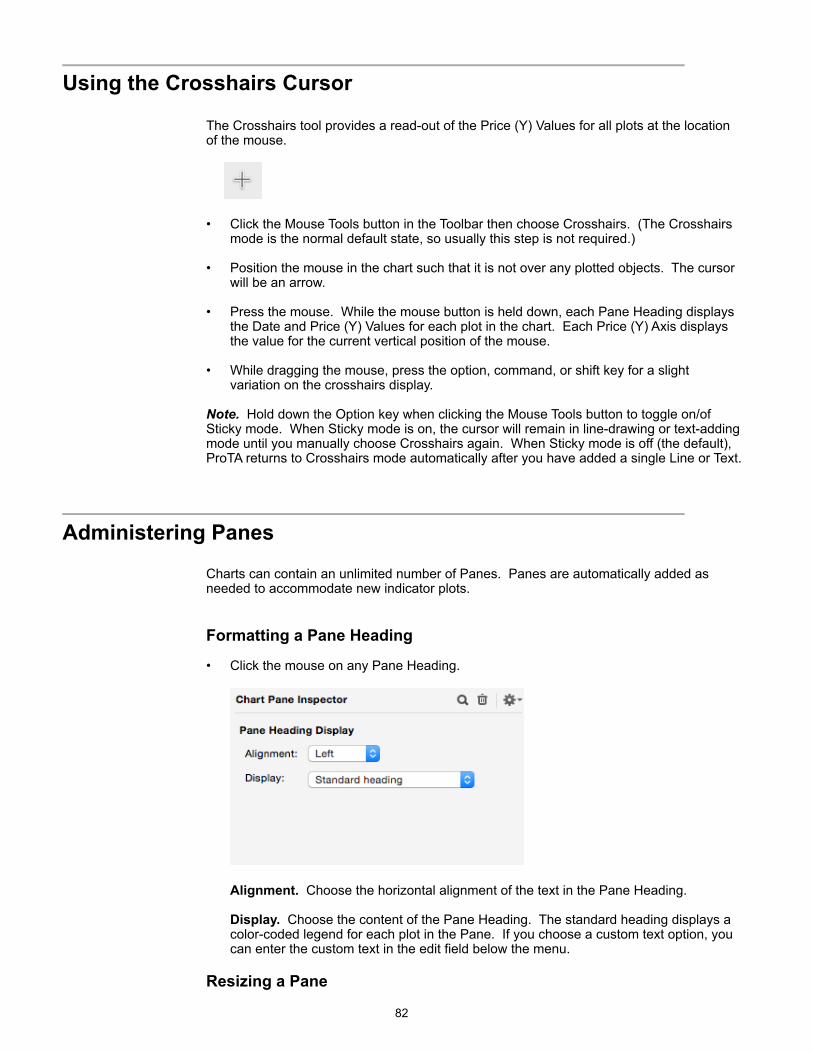
!Using the Crosshairs Cursor
The Crosshairs tool provides a read-out of the Price (Y) Values for all plots at the location of the mouse.
!
• Click the Mouse Tools button in the Toolbar then choose Crosshairs. (The Crosshairs mode is the normal default state, so usually this step is not required.)
• Position the mouse in the chart such that it is not over any plotted objects. The cursor will be an arrow.
• Press the mouse. While the mouse button is held down, each Pane Heading displays the Date and Price (Y) Values for each plot in the chart. Each Price (Y) Axis displays the value for the current vertical position of the mouse.
• While dragging the mouse, press the option, command, or shift key for a slight variation on the crosshairs display.
Note. Hold down the Option key when clicking the Mouse Tools button to toggle on/of Sticky mode. When Sticky mode is on, the cursor will remain in line-drawing or text-adding mode until you manually choose Crosshairs again. When Sticky mode is off (the default), ProTA returns to Crosshairs mode automatically after you have added a single Line or Text.
!Administering Panes
Charts can contain an unlimited number of Panes. Panes are automatically added as needed to accommodate new indicator plots.
Formatting a Pane Heading
• Click the mouse on any Pane Heading.
!
Alignment. Choose the horizontal alignment of the text in the Pane Heading.
Display. Choose the content of the Pane Heading. The standard heading displays a color-coded legend for each plot in the Pane. If you choose a custom text option, you can enter the custom text in the edit field below the menu.
Resizing a Pane
!82
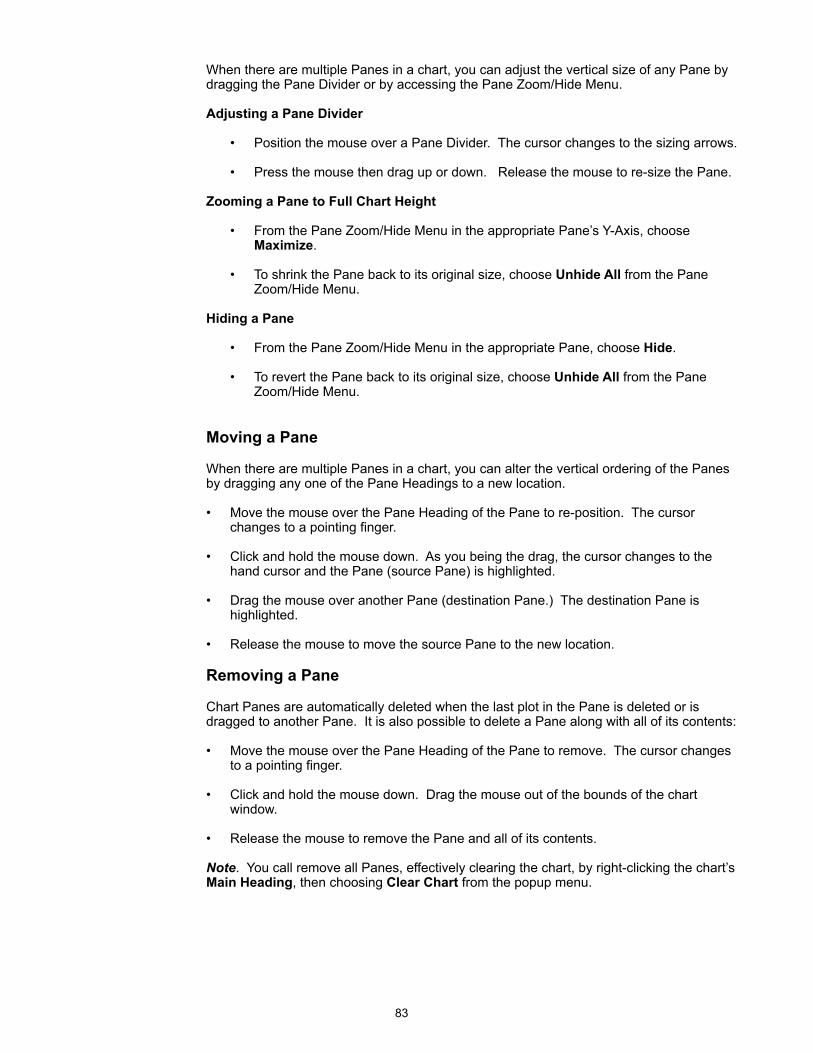
When there are multiple Panes in a chart, you can adjust the vertical size of any Pane by dragging the Pane Divider or by accessing the Pane Zoom/Hide Menu.
Adjusting a Pane Divider
• Position the mouse over a Pane Divider. The cursor changes to the sizing arrows.
• Press the mouse then drag up or down. Release the mouse to re-size the Pane.
Zooming a Pane to Full Chart Height
• From the Pane Zoom/Hide Menu in the appropriate Pane’s Y-Axis, choose Maximize.
• To shrink the Pane back to its original size, choose Unhide All from the Pane Zoom/Hide Menu.
Hiding a Pane
• From the Pane Zoom/Hide Menu in the appropriate Pane, choose Hide.
• To revert the Pane back to its original size, choose Unhide All from the Pane Zoom/Hide Menu.
Moving a Pane
When there are multiple Panes in a chart, you can alter the vertical ordering of the Panes by dragging any one of the Pane Headings to a new location.
• Move the mouse over the Pane Heading of the Pane to re-position. The cursor changes to a pointing finger.
• Click and hold the mouse down. As you being the drag, the cursor changes to the hand cursor and the Pane (source Pane) is highlighted.
• Drag the mouse over another Pane (destination Pane.) The destination Pane is highlighted.
• Release the mouse to move the source Pane to the new location.
Removing a Pane
Chart Panes are automatically deleted when the last plot in the Pane is deleted or is dragged to another Pane. It is also possible to delete a Pane along with all of its contents:
• Move the mouse over the Pane Heading of the Pane to remove. The cursor changes to a pointing finger.
• Click and hold the mouse down. Drag the mouse out of the bounds of the chart window.
• Release the mouse to remove the Pane and all of its contents.
Note. You call remove all Panes, effectively clearing the chart, by right-clicking the chart’s Main Heading, then choosing Clear Chart from the popup menu.
!83
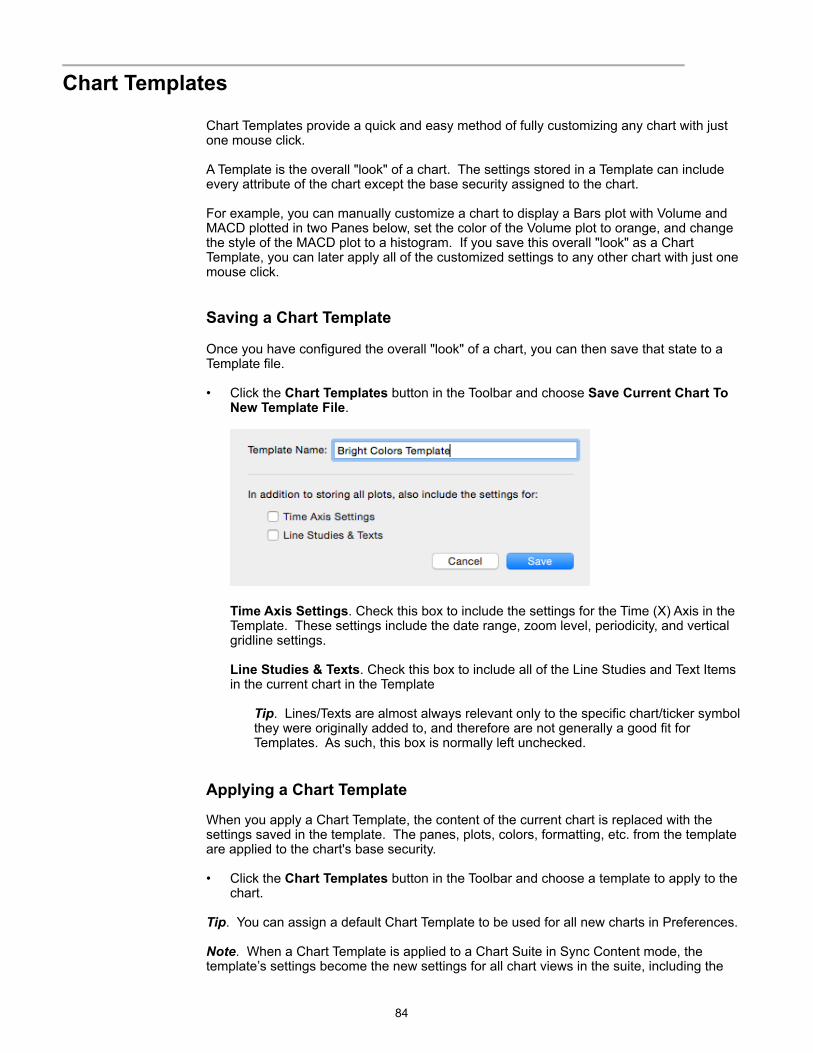
! Chart Templates
Chart Templates provide a quick and easy method of fully customizing any chart with just one mouse click.
A Template is the overall "look" of a chart. The settings stored in a Template can include every attribute of the chart except the base security assigned to the chart.
For example, you can manually customize a chart to display a Bars plot with Volume and MACD plotted in two Panes below, set the color of the Volume plot to orange, and change the style of the MACD plot to a histogram. If you save this overall "look" as a Chart Template, you can later apply all of the customized settings to any other chart with just one mouse click.
Saving a Chart Template
Once you have configured the overall "look" of a chart, you can then save that state to a Template file.
• Click the Chart Templates button in the Toolbar and choose Save Current Chart To New Template File.
!
Time Axis Settings. Check this box to include the settings for the Time (X) Axis in the Template. These settings include the date range, zoom level, periodicity, and vertical gridline settings.
Line Studies & Texts. Check this box to include all of the Line Studies and Text Items in the current chart in the Template
Tip. Lines/Texts are almost always relevant only to the specific chart/ticker symbol they were originally added to, and therefore are not generally a good fit for Templates. As such, this box is normally left unchecked.
Applying a Chart Template
When you apply a Chart Template, the content of the current chart is replaced with the settings saved in the template. The panes, plots, colors, formatting, etc. from the template are applied to the chart's base security.
• Click the Chart Templates button in the Toolbar and choose a template to apply to the chart.
Tip. You can assign a default Chart Template to be used for all new charts in Preferences.
Note. When a Chart Template is applied to a Chart Suite in Sync Content mode, the template’s settings become the new settings for all chart views in the suite, including the
!84
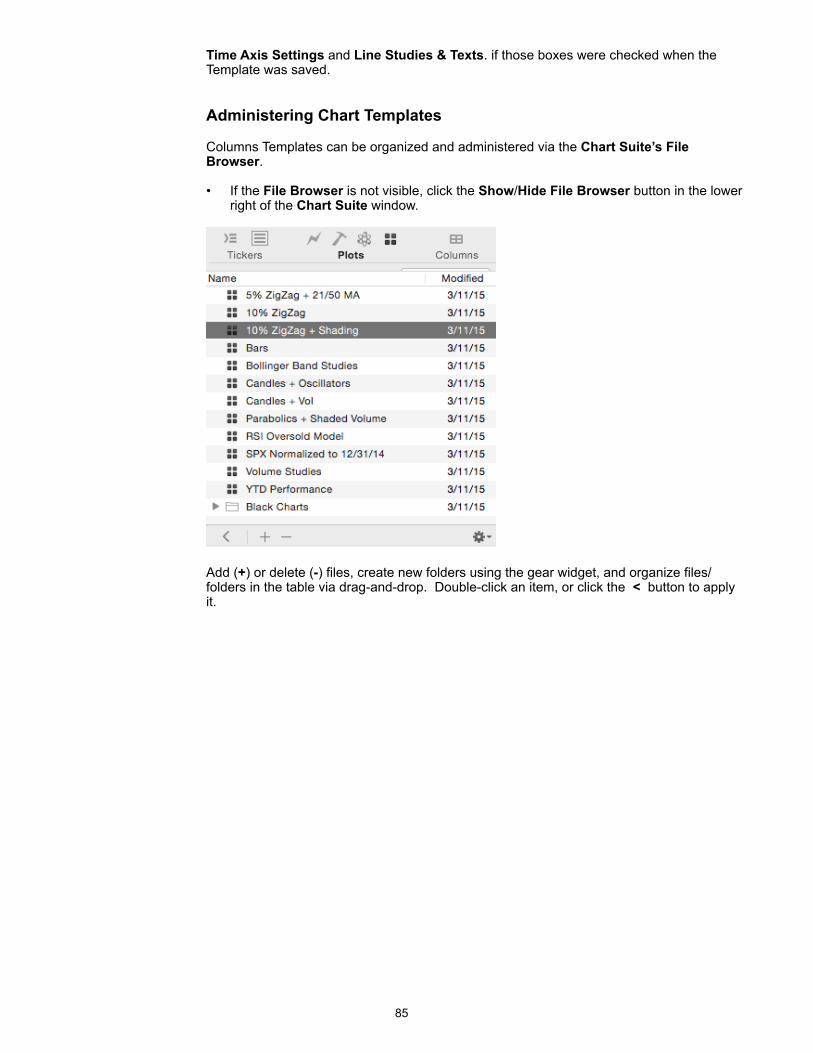
Time Axis Settings and Line Studies & Texts. if those boxes were checked when the Template was saved.
Administering Chart Templates
Columns Templates can be organized and administered via the Chart Suite’s File Browser.
• If the File Browser is not visible, click the Show/Hide File Browser button in the lower right of the Chart Suite window.
!
Add (+) or delete (-) files, create new folders using the gear widget, and organize files/folders in the table via drag-and-drop. Double-click an item, or click the < button to apply it.
!85
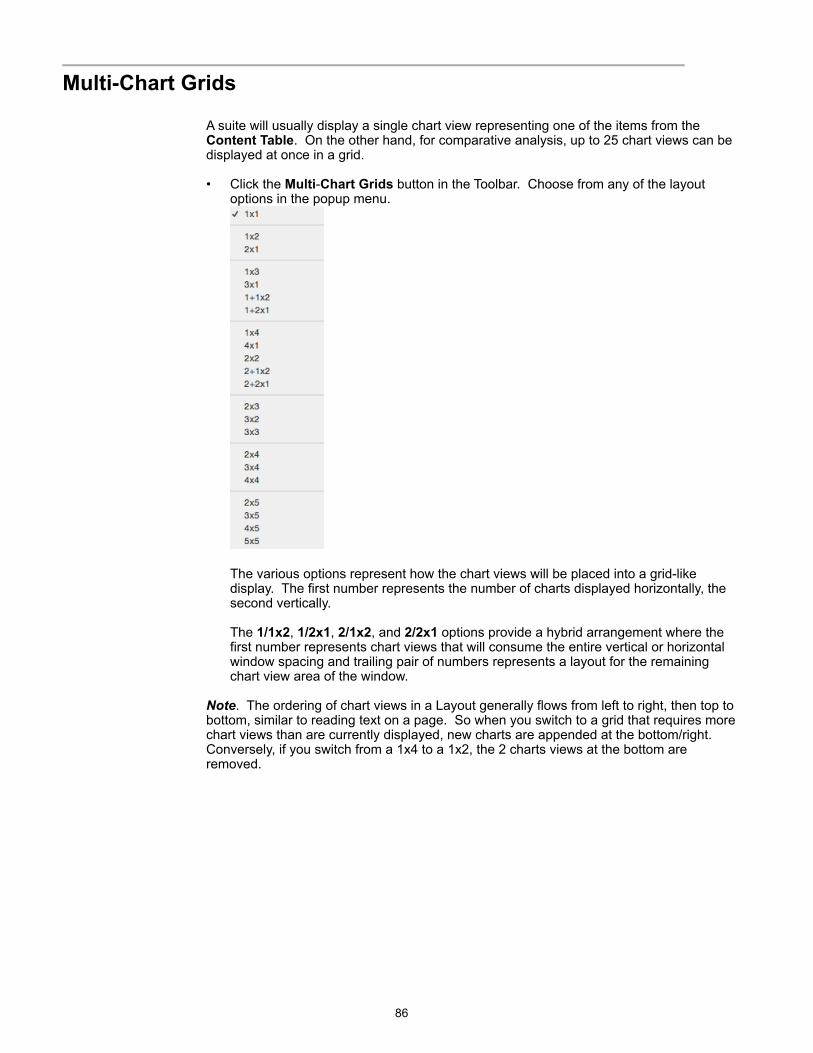
! Multi-Chart Grids
A suite will usually display a single chart view representing one of the items from the Content Table. On the other hand, for comparative analysis, up to 25 chart views can be displayed at once in a grid.
• Click the Multi-Chart Grids button in the Toolbar. Choose from any of the layout options in the popup menu.
!
The various options represent how the chart views will be placed into a grid-like display. The first number represents the number of charts displayed horizontally, the second vertically.
The 1/1x2, 1/2x1, 2/1x2, and 2/2x1 options provide a hybrid arrangement where the first number represents chart views that will consume the entire vertical or horizontal window spacing and trailing pair of numbers represents a layout for the remaining chart view area of the window.
Note. The ordering of chart views in a Layout generally flows from left to right, then top to bottom, similar to reading text on a page. So when you switch to a grid that requires more chart views than are currently displayed, new charts are appended at the bottom/right. Conversely, if you switch from a 1x4 to a 1x2, the 2 charts views at the bottom are removed.
!86
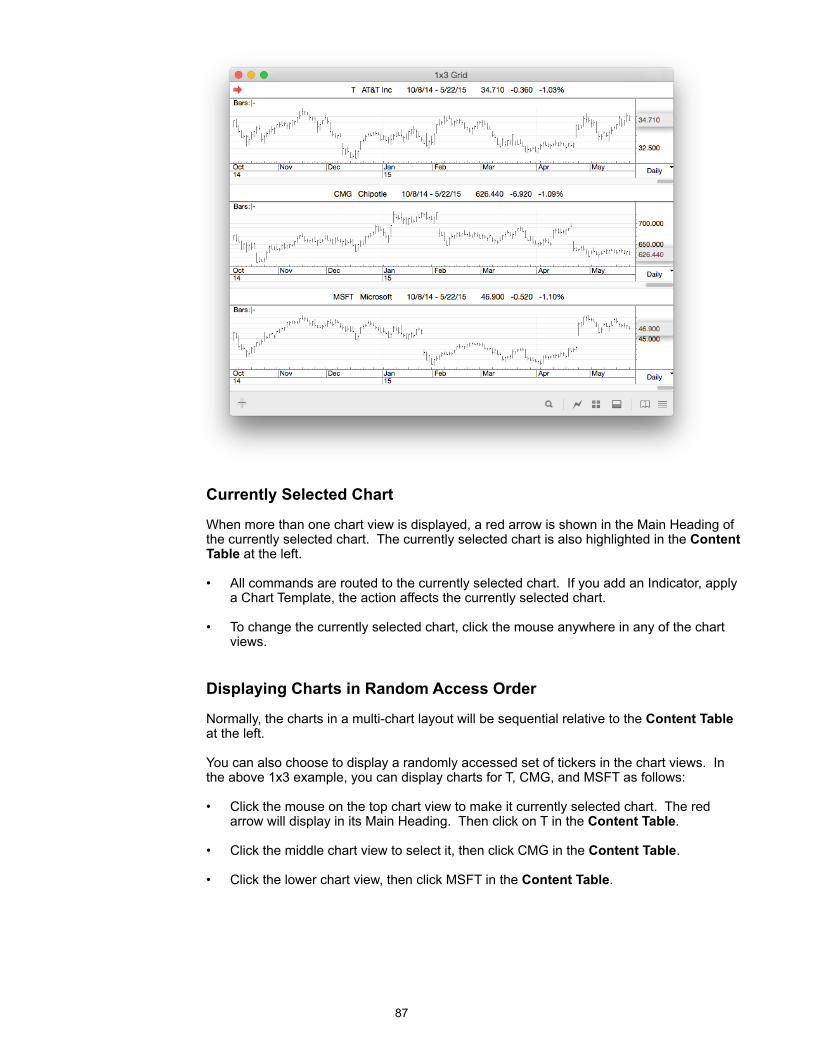
!
Currently Selected Chart
When more than one chart view is displayed, a red arrow is shown in the Main Heading of the currently selected chart. The currently selected chart is also highlighted in the Content Table at the left.
• All commands are routed to the currently selected chart. If you add an Indicator, apply a Chart Template, the action affects the currently selected chart.
• To change the currently selected chart, click the mouse anywhere in any of the chart views.
Displaying Charts in Random Access Order
Normally, the charts in a multi-chart layout will be sequential relative to the Content Table at the left.
You can also choose to display a randomly accessed set of tickers in the chart views. In the above 1x3 example, you can display charts for T, CMG, and MSFT as follows:
• Click the mouse on the top chart view to make it currently selected chart. The red arrow will display in its Main Heading. Then click on T in the Content Table.
• Click the middle chart view to select it, then click CMG in the Content Table.
• Click the lower chart view, then click MSFT in the Content Table.
!87
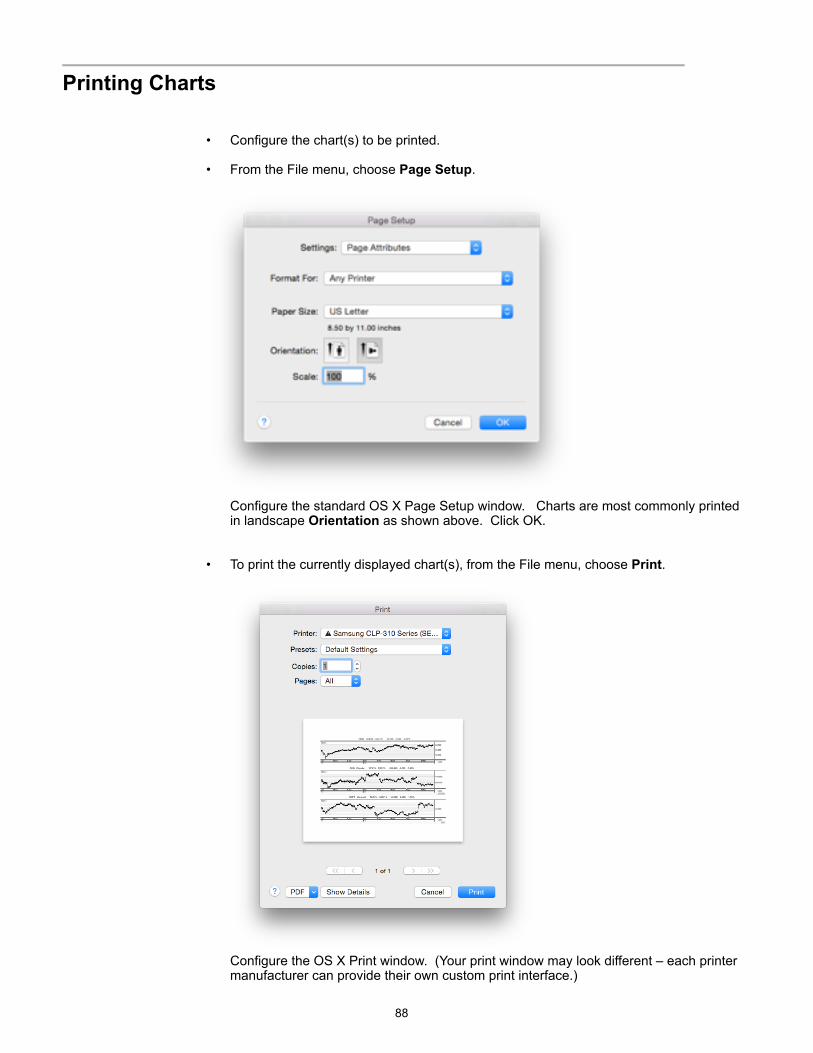
!Printing Charts
• Configure the chart(s) to be printed.
• From the File menu, choose Page Setup.
! Configure the standard OS X Page Setup window. Charts are most commonly printed in landscape Orientation as shown above. Click OK.
• To print the currently displayed chart(s), from the File menu, choose Print.
! Configure the OS X Print window. (Your print window may look different – each printer manufacturer can provide their own custom print interface.)
!88
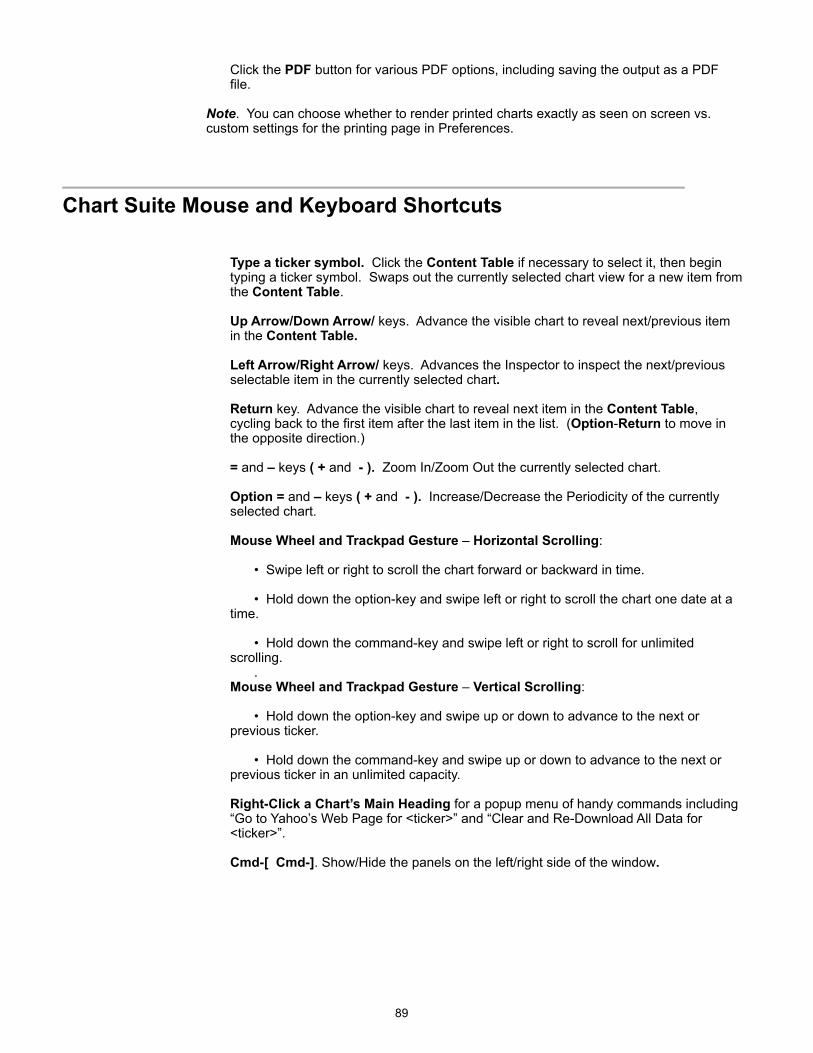
Click the PDF button for various PDF options, including saving the output as a PDF file.
Note. You can choose whether to render printed charts exactly as seen on screen vs. custom settings for the printing page in Preferences.
! Chart Suite Mouse and Keyboard Shortcuts
Type a ticker symbol. Click the Content Table if necessary to select it, then begin typing a ticker symbol. Swaps out the currently selected chart view for a new item from the Content Table.
Up Arrow/Down Arrow/ keys. Advance the visible chart to reveal next/previous item in the Content Table.
Left Arrow/Right Arrow/ keys. Advances the Inspector to inspect the next/previous selectable item in the currently selected chart.
Return key. Advance the visible chart to reveal next item in the Content Table, cycling back to the first item after the last item in the list. (Option-Return to move in the opposite direction.)
= and – keys ( + and - ). Zoom In/Zoom Out the currently selected chart.
Option = and – keys ( + and - ). Increase/Decrease the Periodicity of the currently selected chart.
Mouse Wheel and Trackpad Gesture – Horizontal Scrolling:
• Swipe left or right to scroll the chart forward or backward in time.
• Hold down the option-key and swipe left or right to scroll the chart one date at a time.
• Hold down the command-key and swipe left or right to scroll for unlimited scrolling.
. Mouse Wheel and Trackpad Gesture – Vertical Scrolling:
• Hold down the option-key and swipe up or down to advance to the next or previous ticker.
• Hold down the command-key and swipe up or down to advance to the next or previous ticker in an unlimited capacity.
Right-Click a Chart’s Main Heading for a popup menu of handy commands including “Go to Yahoo’s Web Page for <ticker>” and “Clear and Re-Download All Data for <ticker>”.
Cmd-[ Cmd-]. Show/Hide the panels on the left/right side of the window.
!89
Indicators
!Overview
An indicator is a technical calculation based on the data fields of a quote file. Technical analysts use indicators to help identify tendencies for future price action including trends, consolidations, and overbought/oversold conditions (reversal of trends).
A library of 50 indicators and price plots are included in ProTA’s Standard Indicator database. Each is fully customizable in terms of color, line style, and computational parameters.
This chapter provides a brief description of each price plot and indicator. While this chapter represents a good starting point, you will gain a much better understanding of the indicators by reading the published literature.
Note. See Adding a Price Plot or Indicator, in the Charts chapter, for the generalized instructions for adding an indicator to a chart window.
Note. All of the Standard Indicators discussed in this chapter are also available for use in the ProTAscript which can be used to write Custom Indicators, Trading Systems and Smartlists. See the separate chapters for each of these topics.
!90
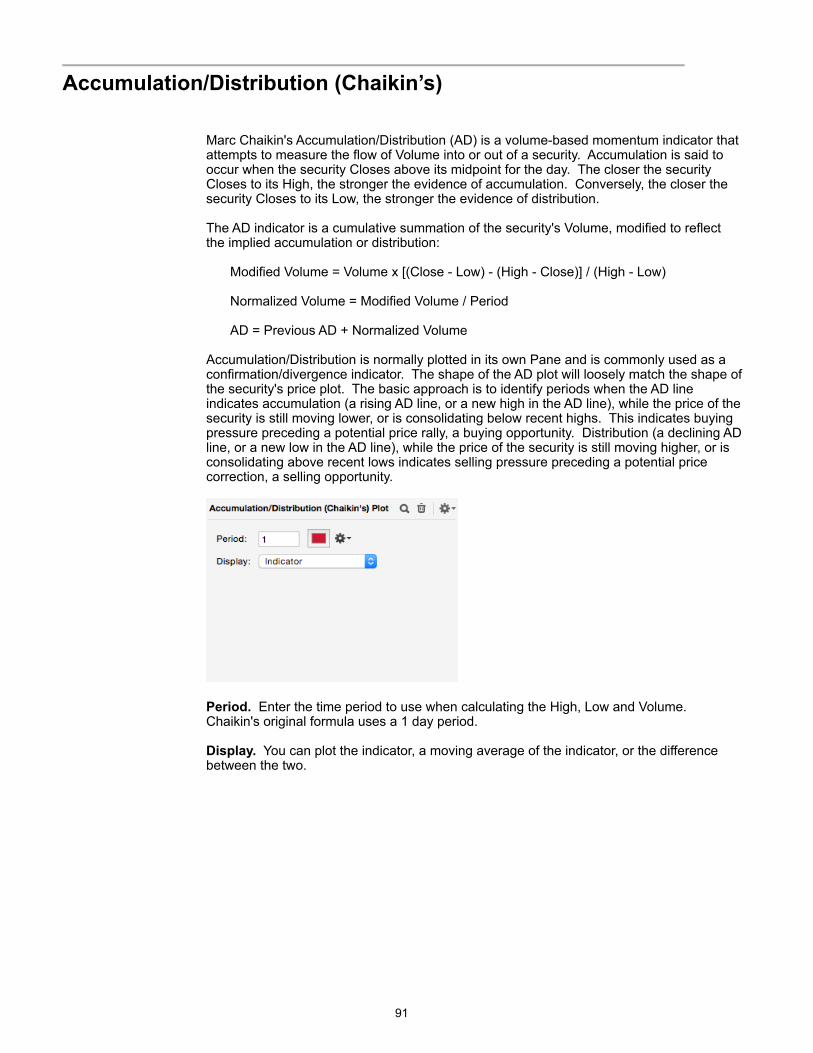
!Accumulation/Distribution (Chaikin’s)
Marc Chaikin's Accumulation/Distribution (AD) is a volume-based momentum indicator that attempts to measure the flow of Volume into or out of a security. Accumulation is said to occur when the security Closes above its midpoint for the day. The closer the security Closes to its High, the stronger the evidence of accumulation. Conversely, the closer the security Closes to its Low, the stronger the evidence of distribution.
The AD indicator is a cumulative summation of the security's Volume, modified to reflect the implied accumulation or distribution:
Modified Volume = Volume x [(Close - Low) - (High - Close)] / (High - Low)
Normalized Volume = Modified Volume / Period
AD = Previous AD + Normalized Volume
Accumulation/Distribution is normally plotted in its own Pane and is commonly used as a confirmation/divergence indicator. The shape of the AD plot will loosely match the shape of the security's price plot. The basic approach is to identify periods when the AD line indicates accumulation (a rising AD line, or a new high in the AD line), while the price of the security is still moving lower, or is consolidating below recent highs. This indicates buying pressure preceding a potential price rally, a buying opportunity. Distribution (a declining AD line, or a new low in the AD line), while the price of the security is still moving higher, or is consolidating above recent lows indicates selling pressure preceding a potential price correction, a selling opportunity.
!
Period. Enter the time period to use when calculating the High, Low and Volume. Chaikin's original formula uses a 1 day period.
Display. You can plot the indicator, a moving average of the indicator, or the difference between the two.
!91
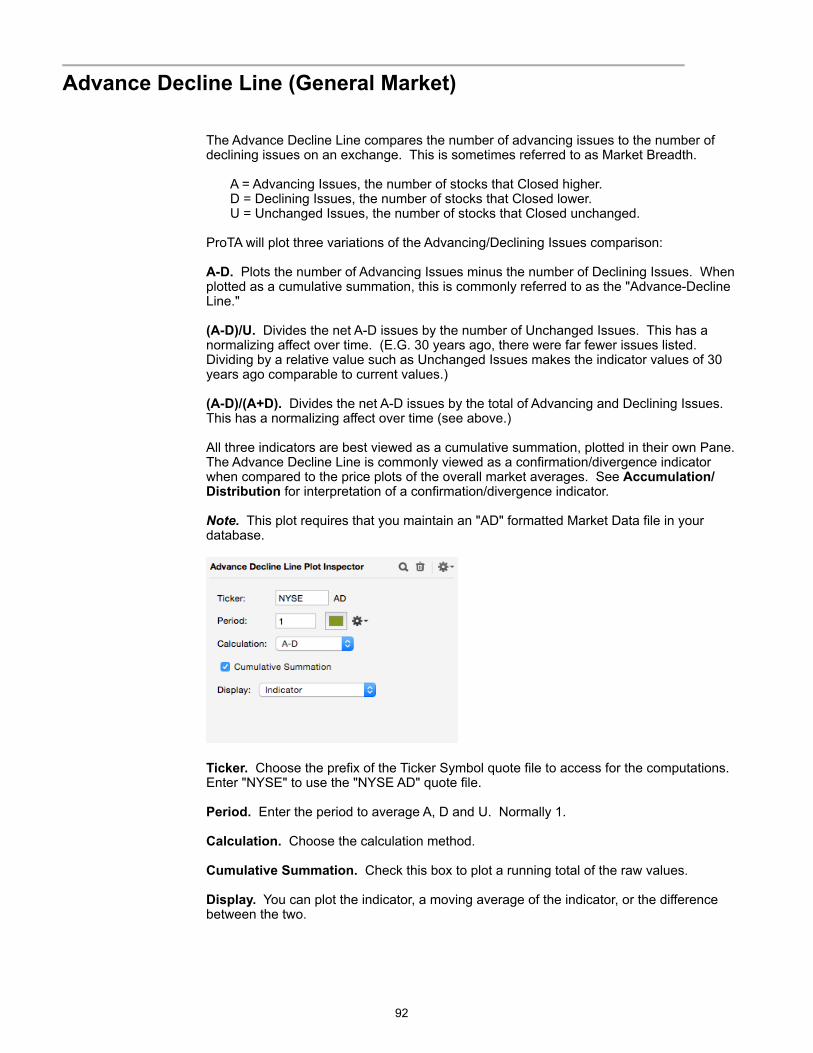
!Advance Decline Line (General Market)
The Advance Decline Line compares the number of advancing issues to the number of declining issues on an exchange. This is sometimes referred to as Market Breadth.
A = Advancing Issues, the number of stocks that Closed higher. D = Declining Issues, the number of stocks that Closed lower. U = Unchanged Issues, the number of stocks that Closed unchanged.
ProTA will plot three variations of the Advancing/Declining Issues comparison:
A-D. Plots the number of Advancing Issues minus the number of Declining Issues. When plotted as a cumulative summation, this is commonly referred to as the "Advance-Decline Line."
(A-D)/U. Divides the net A-D issues by the number of Unchanged Issues. This has a normalizing affect over time. (E.G. 30 years ago, there were far fewer issues listed. Dividing by a relative value such as Unchanged Issues makes the indicator values of 30 years ago comparable to current values.)
(A-D)/(A+D). Divides the net A-D issues by the total of Advancing and Declining Issues. This has a normalizing affect over time (see above.)
All three indicators are best viewed as a cumulative summation, plotted in their own Pane. The Advance Decline Line is commonly viewed as a confirmation/divergence indicator when compared to the price plots of the overall market averages. See Accumulation/Distribution for interpretation of a confirmation/divergence indicator.
Note. This plot requires that you maintain an "AD" formatted Market Data file in your database.
!
Ticker. Choose the prefix of the Ticker Symbol quote file to access for the computations. Enter "NYSE" to use the "NYSE AD" quote file.
Period. Enter the period to average A, D and U. Normally 1.
Calculation. Choose the calculation method.
Cumulative Summation. Check this box to plot a running total of the raw values.
Display. You can plot the indicator, a moving average of the indicator, or the difference between the two.
!92
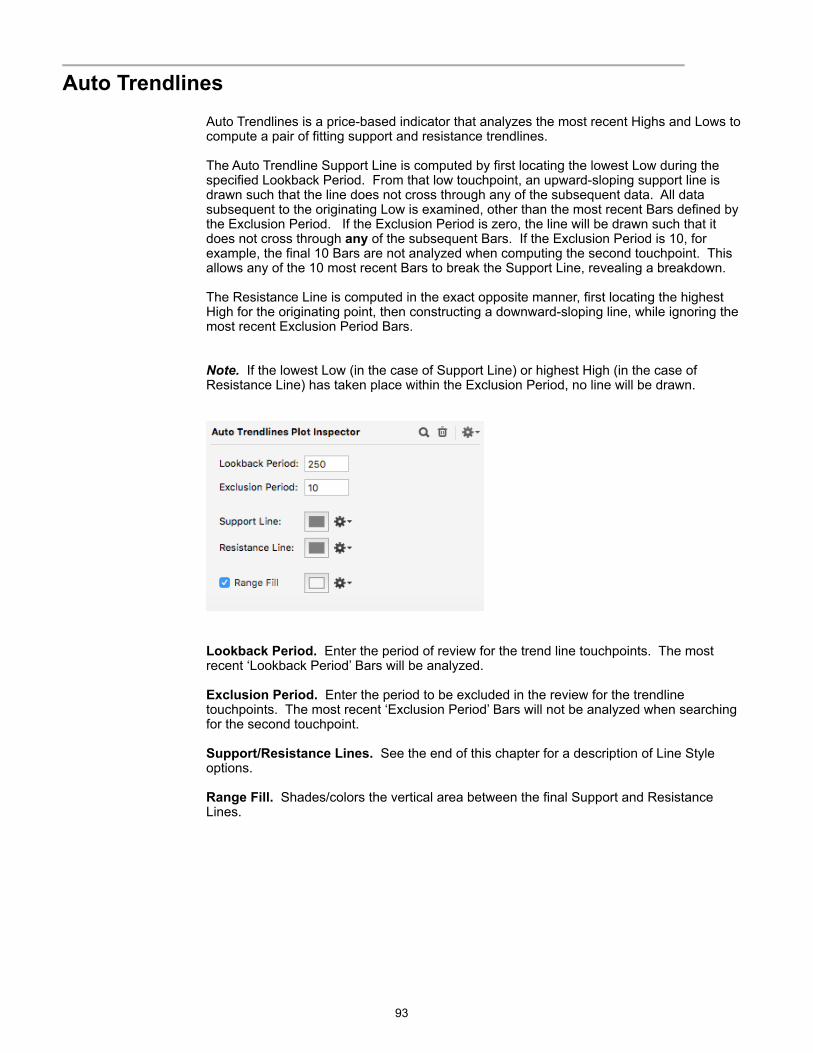
! Auto Trendlines
Auto Trendlines is a price-based indicator that analyzes the most recent Highs and Lows to compute a pair of fitting support and resistance trendlines.
The Auto Trendline Support Line is computed by first locating the lowest Low during the specified Lookback Period. From that low touchpoint, an upward-sloping support line is drawn such that the line does not cross through any of the subsequent data. All data subsequent to the originating Low is examined, other than the most recent Bars defined by the Exclusion Period. If the Exclusion Period is zero, the line will be drawn such that it does not cross through any of the subsequent Bars. If the Exclusion Period is 10, for example, the final 10 Bars are not analyzed when computing the second touchpoint. This allows any of the 10 most recent Bars to break the Support Line, revealing a breakdown.
The Resistance Line is computed in the exact opposite manner, first locating the highest High for the originating point, then constructing a downward-sloping line, while ignoring the most recent Exclusion Period Bars.
Note. If the lowest Low (in the case of Support Line) or highest High (in the case of Resistance Line) has taken place within the Exclusion Period, no line will be drawn.
!
Lookback Period. Enter the period of review for the trend line touchpoints. The most recent ‘Lookback Period’ Bars will be analyzed.
Exclusion Period. Enter the period to be excluded in the review for the trendline touchpoints. The most recent ‘Exclusion Period’ Bars will not be analyzed when searching for the second touchpoint.
Support/Resistance Lines. See the end of this chapter for a description of Line Style options.
Range Fill. Shades/colors the vertical area between the final Support and Resistance Lines.
!93
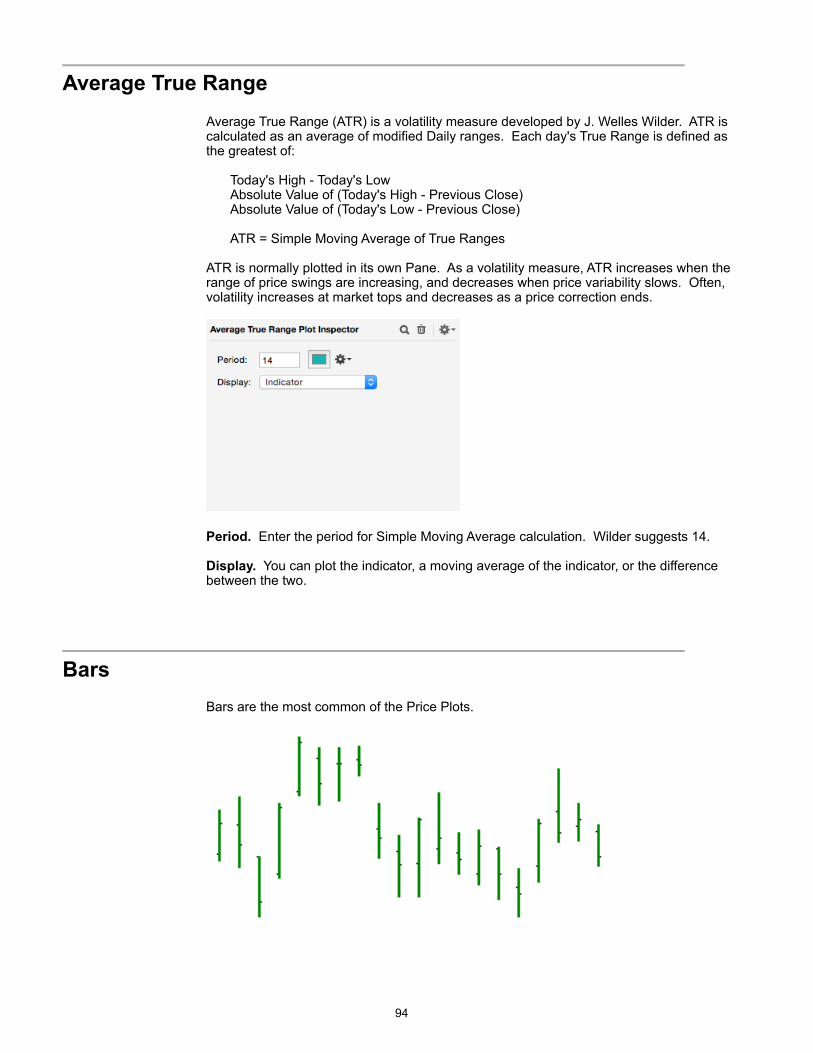
!Average True Range
Average True Range (ATR) is a volatility measure developed by J. Welles Wilder. ATR is calculated as an average of modified Daily ranges. Each day's True Range is defined as the greatest of:
Today's High - Today's Low Absolute Value of (Today's High - Previous Close) Absolute Value of (Today's Low - Previous Close)
ATR = Simple Moving Average of True Ranges
ATR is normally plotted in its own Pane. As a volatility measure, ATR increases when the range of price swings are increasing, and decreases when price variability slows. Often, volatility increases at market tops and decreases as a price correction ends.
!
Period. Enter the period for Simple Moving Average calculation. Wilder suggests 14.
Display. You can plot the indicator, a moving average of the indicator, or the difference between the two.
! Bars
Bars are the most common of the Price Plots.
!
!94
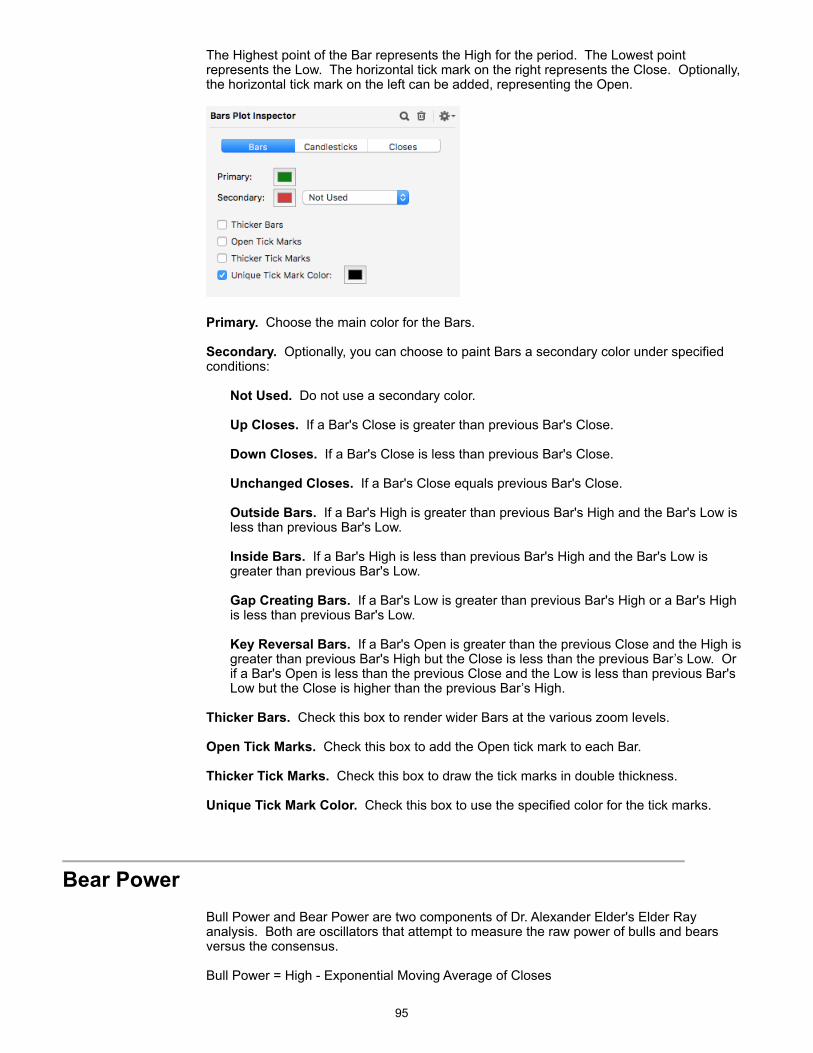
The Highest point of the Bar represents the High for the period. The Lowest point represents the Low. The horizontal tick mark on the right represents the Close. Optionally, the horizontal tick mark on the left can be added, representing the Open.
!
Primary. Choose the main color for the Bars.
Secondary. Optionally, you can choose to paint Bars a secondary color under specified conditions:
Not Used. Do not use a secondary color.
Up Closes. If a Bar's Close is greater than previous Bar's Close.
Down Closes. If a Bar's Close is less than previous Bar's Close.
Unchanged Closes. If a Bar's Close equals previous Bar's Close.
Outside Bars. If a Bar's High is greater than previous Bar's High and the Bar's Low is less than previous Bar's Low.
Inside Bars. If a Bar's High is less than previous Bar's High and the Bar's Low is greater than previous Bar's Low.
Gap Creating Bars. If a Bar's Low is greater than previous Bar's High or a Bar's High is less than previous Bar's Low.
Key Reversal Bars. If a Bar's Open is greater than the previous Close and the High is greater than previous Bar's High but the Close is less than the previous Bar’s Low. Or if a Bar's Open is less than the previous Close and the Low is less than previous Bar's Low but the Close is higher than the previous Bar’s High.
Thicker Bars. Check this box to render wider Bars at the various zoom levels.
Open Tick Marks. Check this box to add the Open tick mark to each Bar.
Thicker Tick Marks. Check this box to draw the tick marks in double thickness.
Unique Tick Mark Color. Check this box to use the specified color for the tick marks.
! Bear Power
Bull Power and Bear Power are two components of Dr. Alexander Elder's Elder Ray analysis. Both are oscillators that attempt to measure the raw power of bulls and bears versus the consensus.
Bull Power = High - Exponential Moving Average of Closes
!95
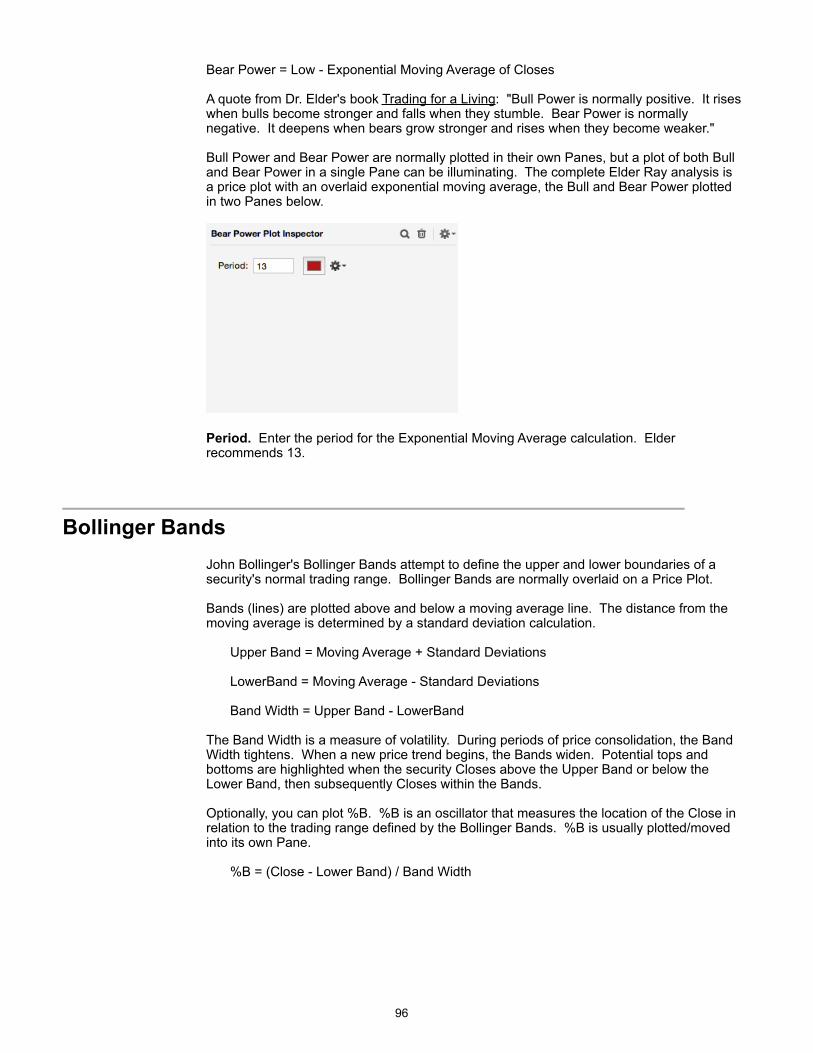
Bear Power = Low - Exponential Moving Average of Closes
A quote from Dr. Elder's book Trading for a Living: "Bull Power is normally positive. It rises when bulls become stronger and falls when they stumble. Bear Power is normally negative. It deepens when bears grow stronger and rises when they become weaker."
Bull Power and Bear Power are normally plotted in their own Panes, but a plot of both Bull and Bear Power in a single Pane can be illuminating. The complete Elder Ray analysis is a price plot with an overlaid exponential moving average, the Bull and Bear Power plotted in two Panes below.
!
Period. Enter the period for the Exponential Moving Average calculation. Elder recommends 13.
!Bollinger Bands
John Bollinger's Bollinger Bands attempt to define the upper and lower boundaries of a security's normal trading range. Bollinger Bands are normally overlaid on a Price Plot.
Bands (lines) are plotted above and below a moving average line. The distance from the moving average is determined by a standard deviation calculation.
Upper Band = Moving Average + Standard Deviations
LowerBand = Moving Average - Standard Deviations
Band Width = Upper Band - LowerBand
The Band Width is a measure of volatility. During periods of price consolidation, the Band Width tightens. When a new price trend begins, the Bands widen. Potential tops and bottoms are highlighted when the security Closes above the Upper Band or below the Lower Band, then subsequently Closes within the Bands.
Optionally, you can plot %B. %B is an oscillator that measures the location of the Close in relation to the trading range defined by the Bollinger Bands. %B is usually plotted/moved into its own Pane.
%B = (Close - Lower Band) / Band Width
!96
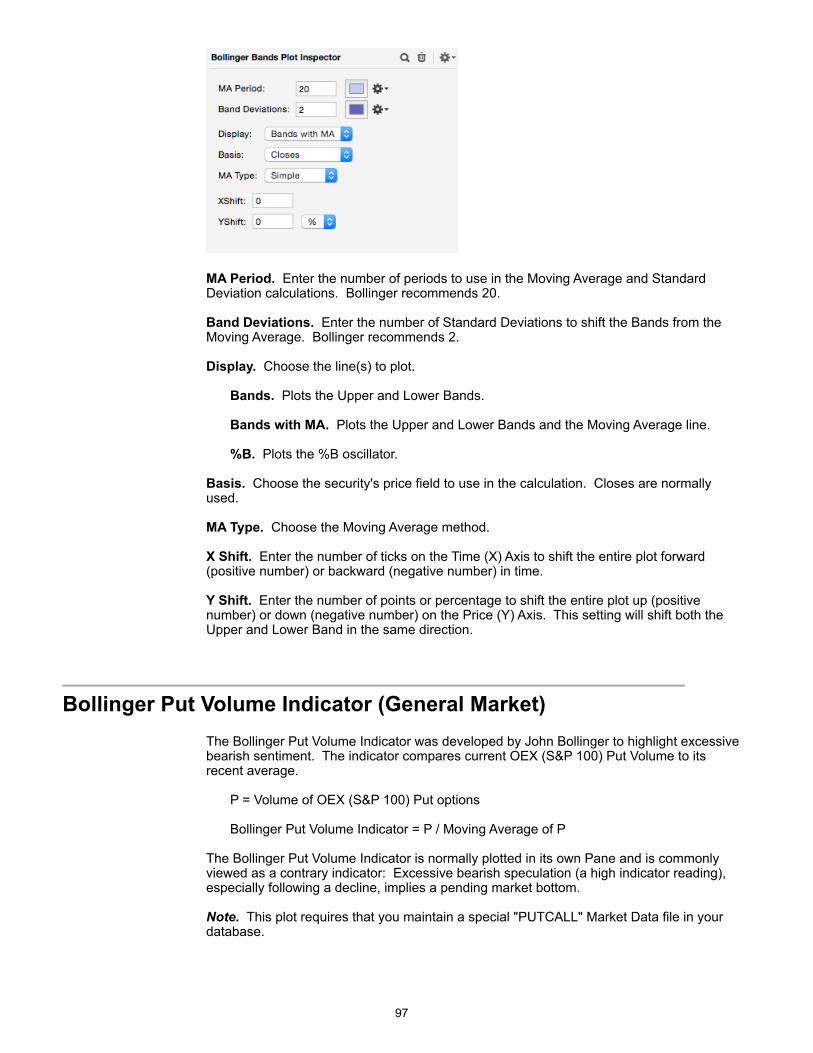
!
MA Period. Enter the number of periods to use in the Moving Average and Standard Deviation calculations. Bollinger recommends 20.
Band Deviations. Enter the number of Standard Deviations to shift the Bands from the Moving Average. Bollinger recommends 2.
Display. Choose the line(s) to plot.
Bands. Plots the Upper and Lower Bands.
Bands with MA. Plots the Upper and Lower Bands and the Moving Average line.
%B. Plots the %B oscillator.
Basis. Choose the security's price field to use in the calculation. Closes are normally used.
MA Type. Choose the Moving Average method.
X Shift. Enter the number of ticks on the Time (X) Axis to shift the entire plot forward (positive number) or backward (negative number) in time.
Y Shift. Enter the number of points or percentage to shift the entire plot up (positive number) or down (negative number) on the Price (Y) Axis. This setting will shift both the Upper and Lower Band in the same direction.
!Bollinger Put Volume Indicator (General Market)
The Bollinger Put Volume Indicator was developed by John Bollinger to highlight excessive bearish sentiment. The indicator compares current OEX (S&P 100) Put Volume to its recent average.
P = Volume of OEX (S&P 100) Put options
Bollinger Put Volume Indicator = P / Moving Average of P
The Bollinger Put Volume Indicator is normally plotted in its own Pane and is commonly viewed as a contrary indicator: Excessive bearish speculation (a high indicator reading), especially following a decline, implies a pending market bottom.
Note. This plot requires that you maintain a special "PUTCALL" Market Data file in your database.
!97
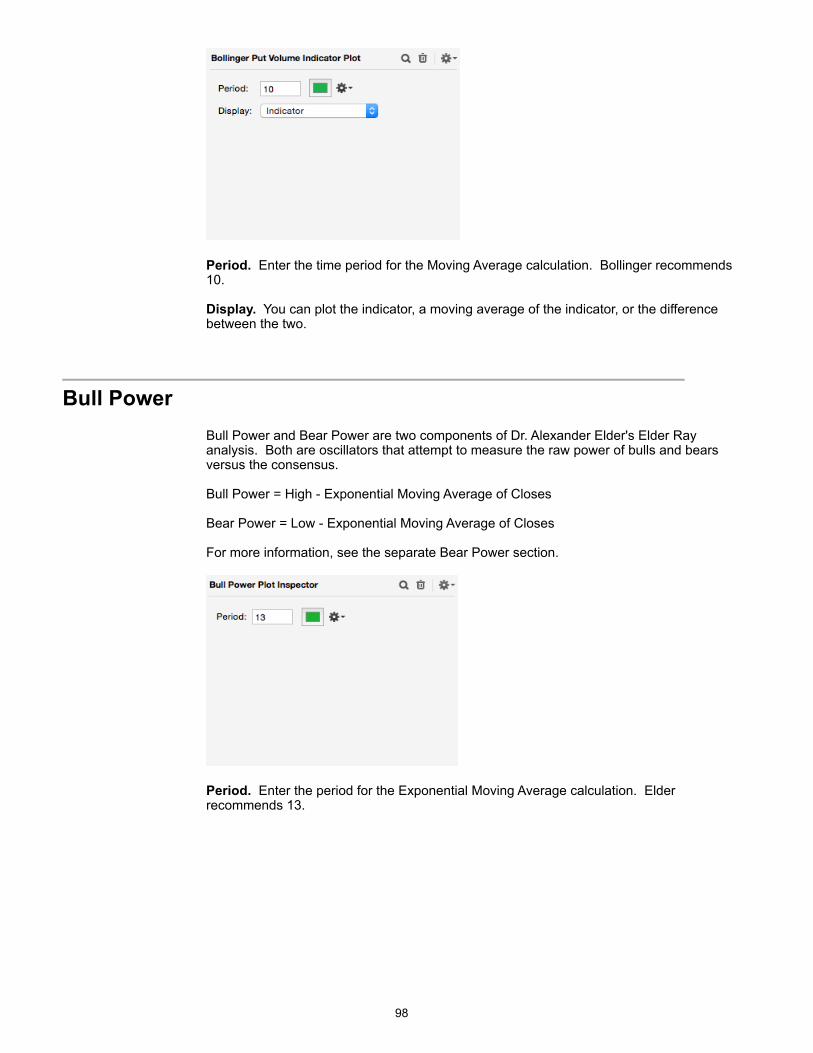
!
Period. Enter the time period for the Moving Average calculation. Bollinger recommends 10.
Display. You can plot the indicator, a moving average of the indicator, or the difference between the two.
! Bull Power
Bull Power and Bear Power are two components of Dr. Alexander Elder's Elder Ray analysis. Both are oscillators that attempt to measure the raw power of bulls and bears versus the consensus.
Bull Power = High - Exponential Moving Average of Closes
Bear Power = Low - Exponential Moving Average of Closes
For more information, see the separate Bear Power section.
!
Period. Enter the period for the Exponential Moving Average calculation. Elder recommends 13.
!98
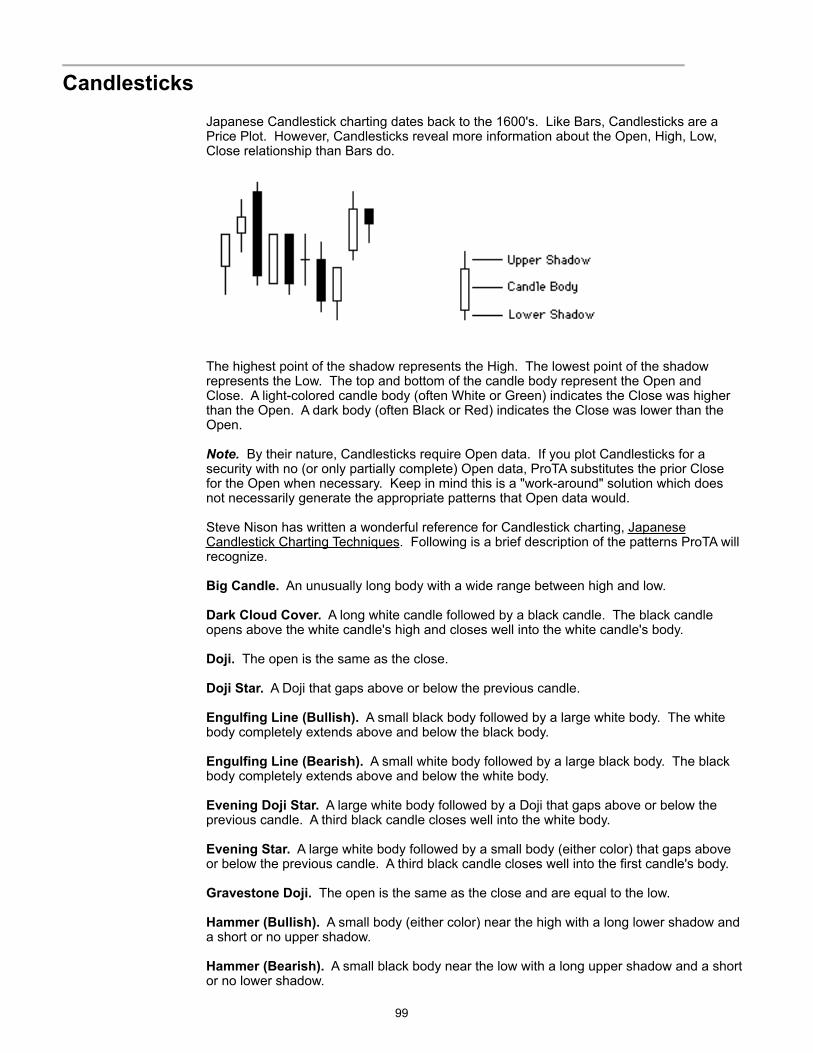
!Candlesticks
Japanese Candlestick charting dates back to the 1600's. Like Bars, Candlesticks are a Price Plot. However, Candlesticks reveal more information about the Open, High, Low, Close relationship than Bars do.
!
The highest point of the shadow represents the High. The lowest point of the shadow represents the Low. The top and bottom of the candle body represent the Open and Close. A light-colored candle body (often White or Green) indicates the Close was higher than the Open. A dark body (often Black or Red) indicates the Close was lower than the Open.
Note. By their nature, Candlesticks require Open data. If you plot Candlesticks for a security with no (or only partially complete) Open data, ProTA substitutes the prior Close for the Open when necessary. Keep in mind this is a "work-around" solution which does not necessarily generate the appropriate patterns that Open data would.
Steve Nison has written a wonderful reference for Candlestick charting, Japanese Candlestick Charting Techniques. Following is a brief description of the patterns ProTA will recognize.
Big Candle. An unusually long body with a wide range between high and low.
Dark Cloud Cover. A long white candle followed by a black candle. The black candle opens above the white candle's high and closes well into the white candle's body.
Doji. The open is the same as the close.
Doji Star. A Doji that gaps above or below the previous candle.
Engulfing Line (Bullish). A small black body followed by a large white body. The white body completely extends above and below the black body.
Engulfing Line (Bearish). A small white body followed by a large black body. The black body completely extends above and below the white body.
Evening Doji Star. A large white body followed by a Doji that gaps above or below the previous candle. A third black candle closes well into the white body.
Evening Star. A large white body followed by a small body (either color) that gaps above or below the previous candle. A third black candle closes well into the first candle's body.
Gravestone Doji. The open is the same as the close and are equal to the low.
Hammer (Bullish). A small body (either color) near the high with a long lower shadow and a short or no upper shadow.
Hammer (Bearish). A small black body near the low with a long upper shadow and a short or no lower shadow.
!99
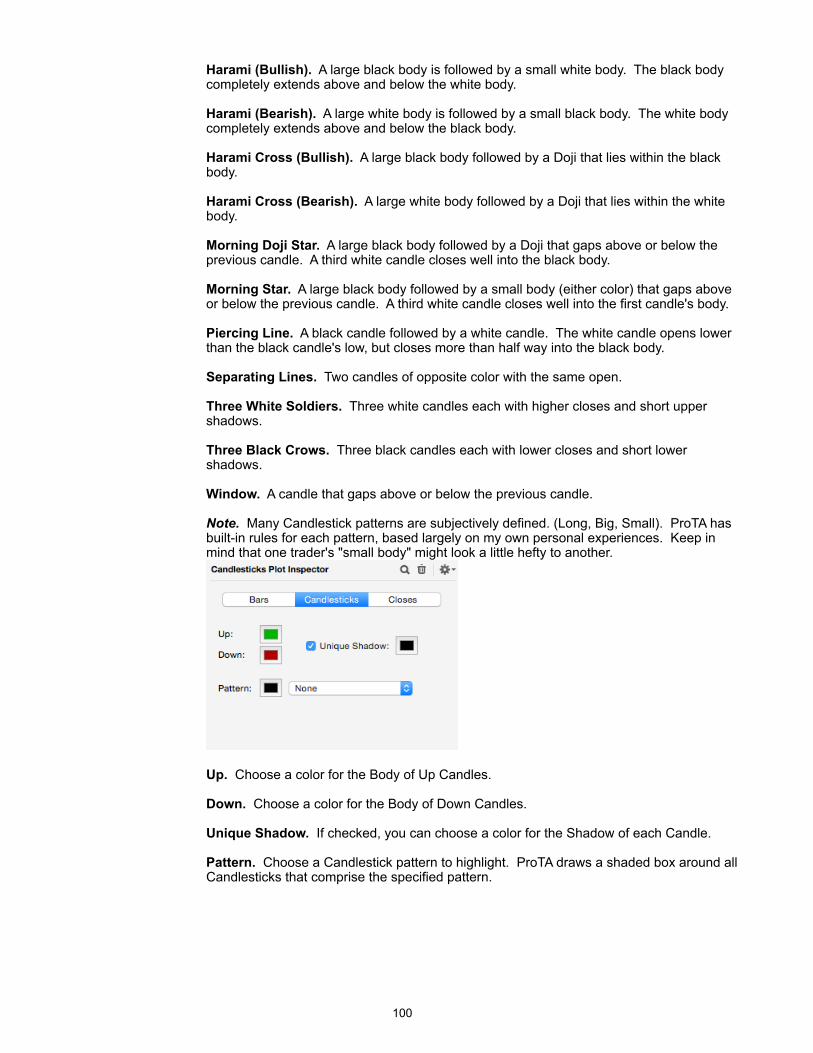
Harami (Bullish). A large black body is followed by a small white body. The black body completely extends above and below the white body.
Harami (Bearish). A large white body is followed by a small black body. The white body completely extends above and below the black body.
Harami Cross (Bullish). A large black body followed by a Doji that lies within the black body.
Harami Cross (Bearish). A large white body followed by a Doji that lies within the white body.
Morning Doji Star. A large black body followed by a Doji that gaps above or below the previous candle. A third white candle closes well into the black body.
Morning Star. A large black body followed by a small body (either color) that gaps above or below the previous candle. A third white candle closes well into the first candle's body.
Piercing Line. A black candle followed by a white candle. The white candle opens lower than the black candle's low, but closes more than half way into the black body.
Separating Lines. Two candles of opposite color with the same open.
Three White Soldiers. Three white candles each with higher closes and short upper shadows.
Three Black Crows. Three black candles each with lower closes and short lower shadows.
Window. A candle that gaps above or below the previous candle.
Note. Many Candlestick patterns are subjectively defined. (Long, Big, Small). ProTA has built-in rules for each pattern, based largely on my own personal experiences. Keep in mind that one trader's "small body" might look a little hefty to another.
!
Up. Choose a color for the Body of Up Candles.
Down. Choose a color for the Body of Down Candles.
Unique Shadow. If checked, you can choose a color for the Shadow of each Candle.
Pattern. Choose a Candlestick pattern to highlight. ProTA draws a shaded box around all Candlesticks that comprise the specified pattern.
!100

!Chaikin Oscillator
The Chaikin Oscillator is based on Marc Chaikin's Accumulation/Distribution (AD) indicator. It is calculated as the difference between a 3 period exponential moving average (EMA) of AD and a 10 period EMA of AD.
Chaikin Oscillator = 3 Period EMA of AD - 10 Period EMA of AD
The Chaikin Oscillator is normally plotted in its own Pane. A simple approach is to buy when the oscillator moves above the zero line and sell when it moves below zero. The author recommends using the oscillator for divergence analysis, especially at new highs or lows in the security's price. If the security makes a new high or low that is not confirmed by the Chaikin Oscillator, a potential reversal is pending. This is especially reliable when direction of the potential reversal agrees with the direction of the longer-term trend.
!
Long Period. Enter the period for the longer EMA. Normally 10.
Short Period. Enter the period for the shorter EMA. Normally 3.
Display. You can plot the indicator, a moving average of the indicator, or the difference between the two.
!Closes
Closes is a simple line plot of the Closing values in the quote file.
!
Line Style. See the end of this chapter for a description of Line Style options.
!101
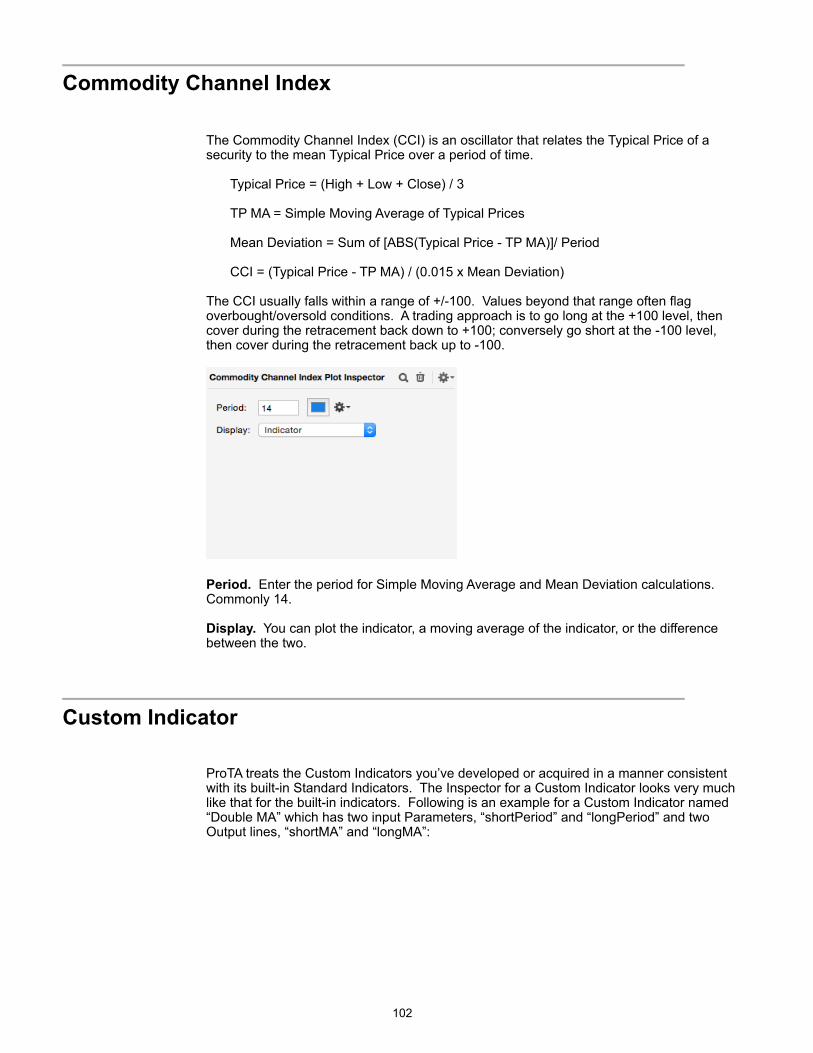
!Commodity Channel Index
The Commodity Channel Index (CCI) is an oscillator that relates the Typical Price of a security to the mean Typical Price over a period of time.
Typical Price = (High + Low + Close) / 3
TP MA = Simple Moving Average of Typical Prices
Mean Deviation = Sum of [ABS(Typical Price - TP MA)]/ Period
CCI = (Typical Price - TP MA) / (0.015 x Mean Deviation)
The CCI usually falls within a range of +/-100. Values beyond that range often flag overbought/oversold conditions. A trading approach is to go long at the +100 level, then cover during the retracement back down to +100; conversely go short at the -100 level, then cover during the retracement back up to -100.
!
Period. Enter the period for Simple Moving Average and Mean Deviation calculations. Commonly 14.
Display. You can plot the indicator, a moving average of the indicator, or the difference between the two.
!Custom Indicator
ProTA treats the Custom Indicators you’ve developed or acquired in a manner consistent with its built-in Standard Indicators. The Inspector for a Custom Indicator looks very much like that for the built-in indicators. Following is an example for a Custom Indicator named “Double MA” which has two input Parameters, “shortPeriod” and “longPeriod” and two Output lines, “shortMA” and “longMA”:
!102
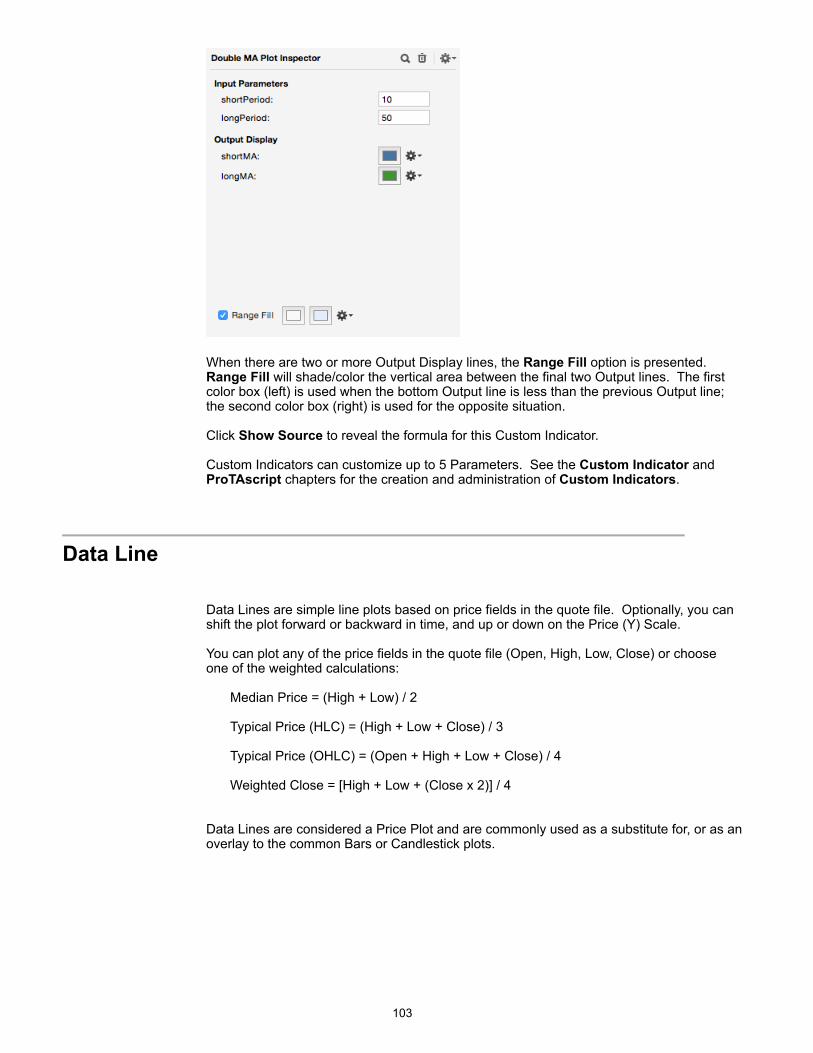
!
When there are two or more Output Display lines, the Range Fill option is presented. Range Fill will shade/color the vertical area between the final two Output lines. The first color box (left) is used when the bottom Output line is less than the previous Output line; the second color box (right) is used for the opposite situation.
Click Show Source to reveal the formula for this Custom Indicator.
Custom Indicators can customize up to 5 Parameters. See the Custom Indicator and ProTAscript chapters for the creation and administration of Custom Indicators.
! Data Line
Data Lines are simple line plots based on price fields in the quote file. Optionally, you can shift the plot forward or backward in time, and up or down on the Price (Y) Scale.
You can plot any of the price fields in the quote file (Open, High, Low, Close) or choose one of the weighted calculations:
Median Price = (High + Low) / 2
Typical Price (HLC) = (High + Low + Close) / 3
Typical Price (OHLC) = (Open + High + Low + Close) / 4
Weighted Close = [High + Low + (Close x 2)] / 4
Data Lines are considered a Price Plot and are commonly used as a substitute for, or as an overlay to the common Bars or Candlestick plots.
!103
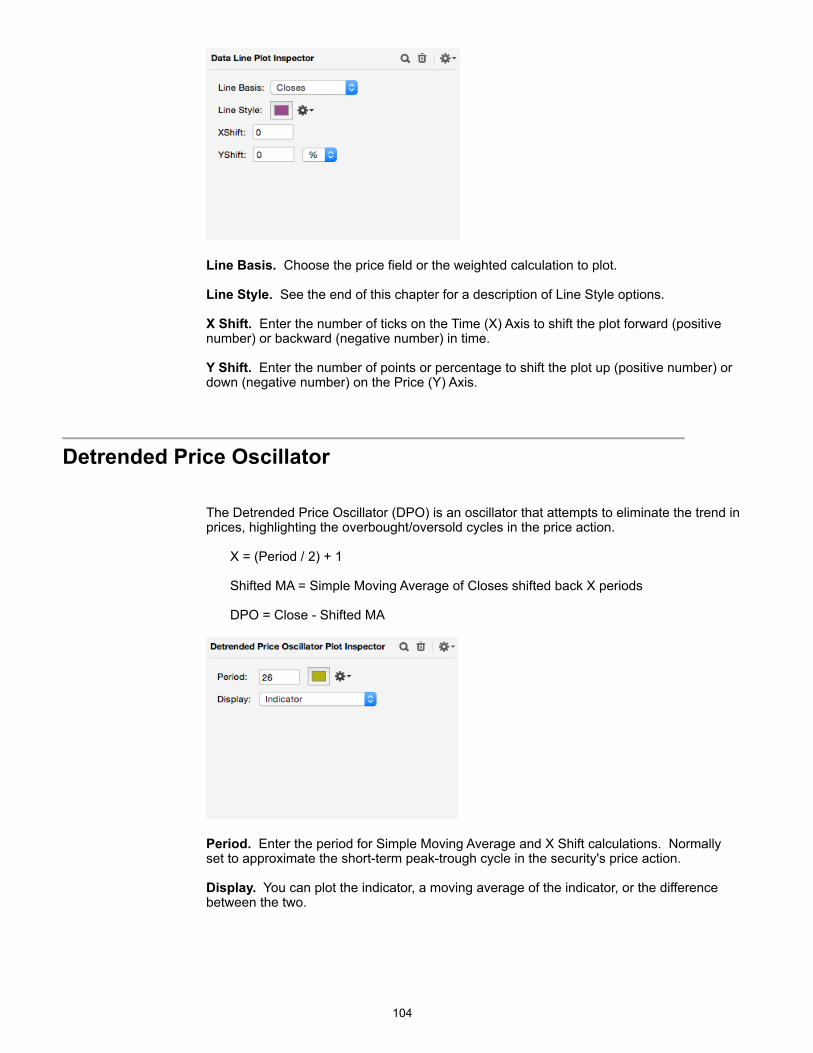
!
Line Basis. Choose the price field or the weighted calculation to plot.
Line Style. See the end of this chapter for a description of Line Style options.
X Shift. Enter the number of ticks on the Time (X) Axis to shift the plot forward (positive number) or backward (negative number) in time.
Y Shift. Enter the number of points or percentage to shift the plot up (positive number) or down (negative number) on the Price (Y) Axis.
!Detrended Price Oscillator
The Detrended Price Oscillator (DPO) is an oscillator that attempts to eliminate the trend in prices, highlighting the overbought/oversold cycles in the price action.
X = (Period / 2) + 1
Shifted MA = Simple Moving Average of Closes shifted back X periods
DPO = Close - Shifted MA
!
Period. Enter the period for Simple Moving Average and X Shift calculations. Normally set to approximate the short-term peak-trough cycle in the security's price action.
Display. You can plot the indicator, a moving average of the indicator, or the difference between the two.
!104
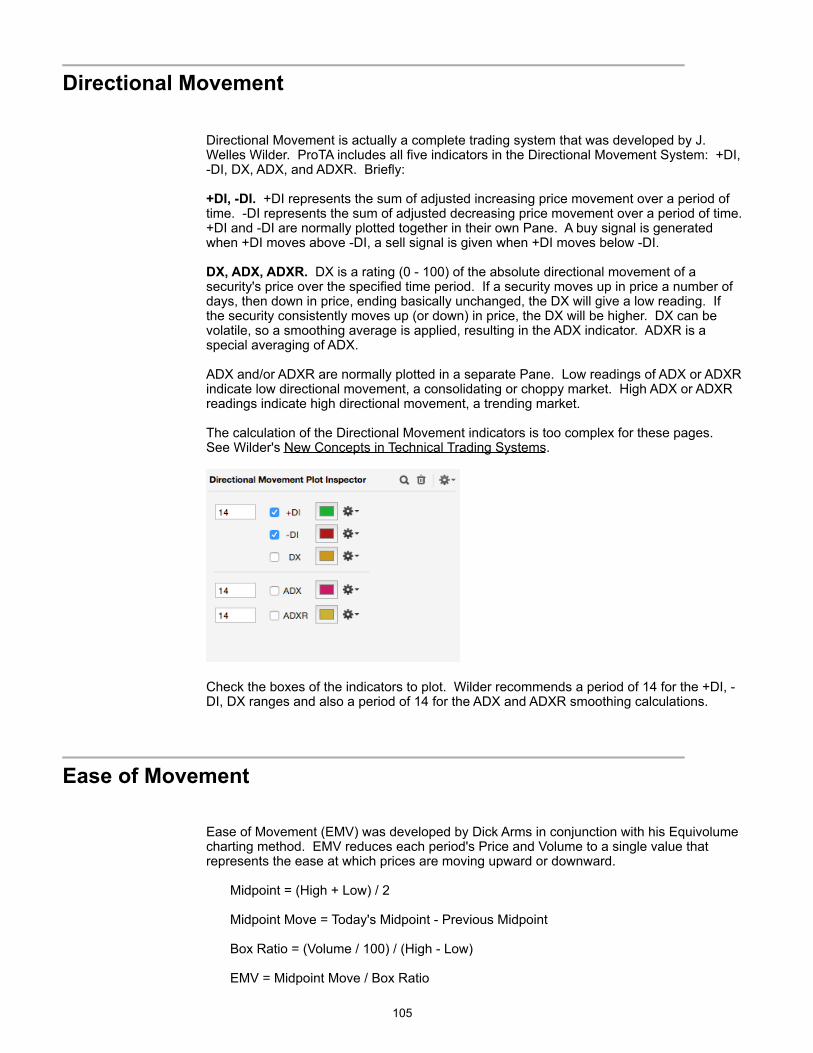
!Directional Movement
Directional Movement is actually a complete trading system that was developed by J. Welles Wilder. ProTA includes all five indicators in the Directional Movement System: +DI, -DI, DX, ADX, and ADXR. Briefly:
+DI, -DI. +DI represents the sum of adjusted increasing price movement over a period of time. -DI represents the sum of adjusted decreasing price movement over a period of time. +DI and -DI are normally plotted together in their own Pane. A buy signal is generated when +DI moves above -DI, a sell signal is given when +DI moves below -DI.
DX, ADX, ADXR. DX is a rating (0 - 100) of the absolute directional movement of a security's price over the specified time period. If a security moves up in price a number of days, then down in price, ending basically unchanged, the DX will give a low reading. If the security consistently moves up (or down) in price, the DX will be higher. DX can be volatile, so a smoothing average is applied, resulting in the ADX indicator. ADXR is a special averaging of ADX.
ADX and/or ADXR are normally plotted in a separate Pane. Low readings of ADX or ADXR indicate low directional movement, a consolidating or choppy market. High ADX or ADXR readings indicate high directional movement, a trending market.
The calculation of the Directional Movement indicators is too complex for these pages. See Wilder's New Concepts in Technical Trading Systems.
!
Check the boxes of the indicators to plot. Wilder recommends a period of 14 for the +DI, -DI, DX ranges and also a period of 14 for the ADX and ADXR smoothing calculations.
! Ease of Movement
Ease of Movement (EMV) was developed by Dick Arms in conjunction with his Equivolume charting method. EMV reduces each period's Price and Volume to a single value that represents the ease at which prices are moving upward or downward.
Midpoint = (High + Low) / 2
Midpoint Move = Today's Midpoint - Previous Midpoint
Box Ratio = (Volume / 100) / (High - Low)
EMV = Midpoint Move / Box Ratio
!105
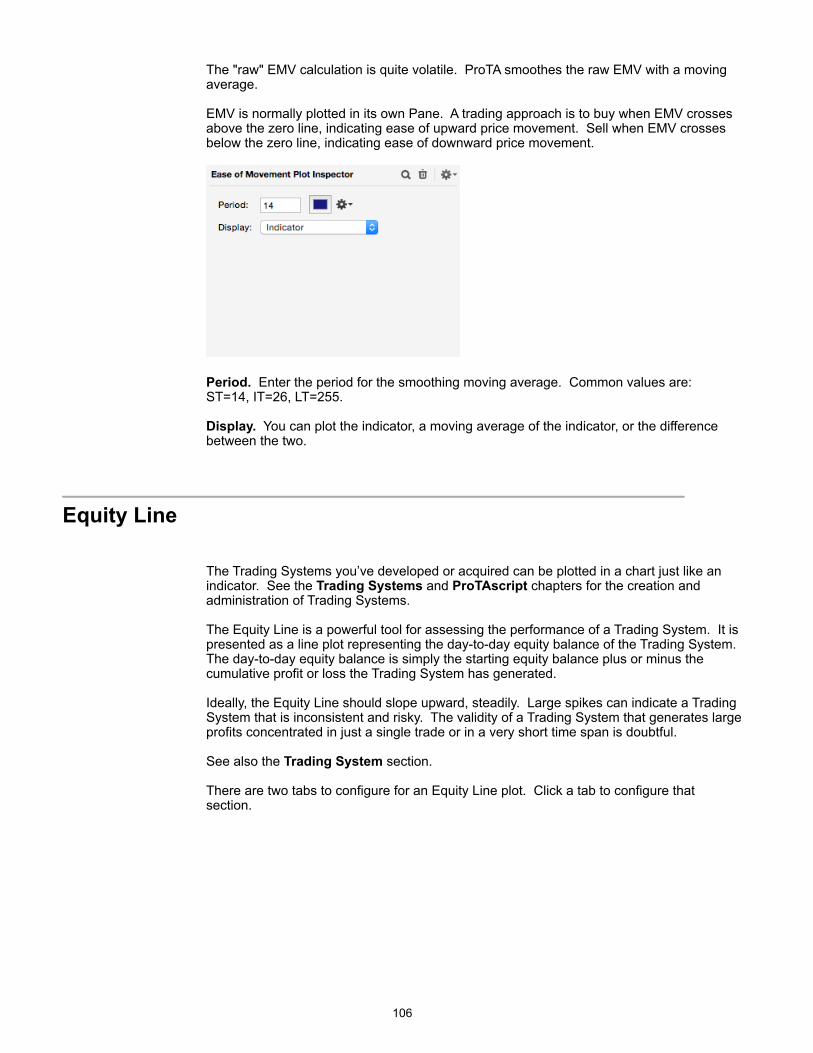
The "raw" EMV calculation is quite volatile. ProTA smoothes the raw EMV with a moving average.
EMV is normally plotted in its own Pane. A trading approach is to buy when EMV crosses above the zero line, indicating ease of upward price movement. Sell when EMV crosses below the zero line, indicating ease of downward price movement.
!
Period. Enter the period for the smoothing moving average. Common values are: ST=14, IT=26, LT=255.
Display. You can plot the indicator, a moving average of the indicator, or the difference between the two.
!Equity Line
The Trading Systems you’ve developed or acquired can be plotted in a chart just like an indicator. See the Trading Systems and ProTAscript chapters for the creation and administration of Trading Systems.
The Equity Line is a powerful tool for assessing the performance of a Trading System. It is presented as a line plot representing the day-to-day equity balance of the Trading System. The day-to-day equity balance is simply the starting equity balance plus or minus the cumulative profit or loss the Trading System has generated.
Ideally, the Equity Line should slope upward, steadily. Large spikes can indicate a Trading System that is inconsistent and risky. The validity of a Trading System that generates large profits concentrated in just a single trade or in a very short time span is doubtful.
See also the Trading System section.
There are two tabs to configure for an Equity Line plot. Click a tab to configure that section.
!106
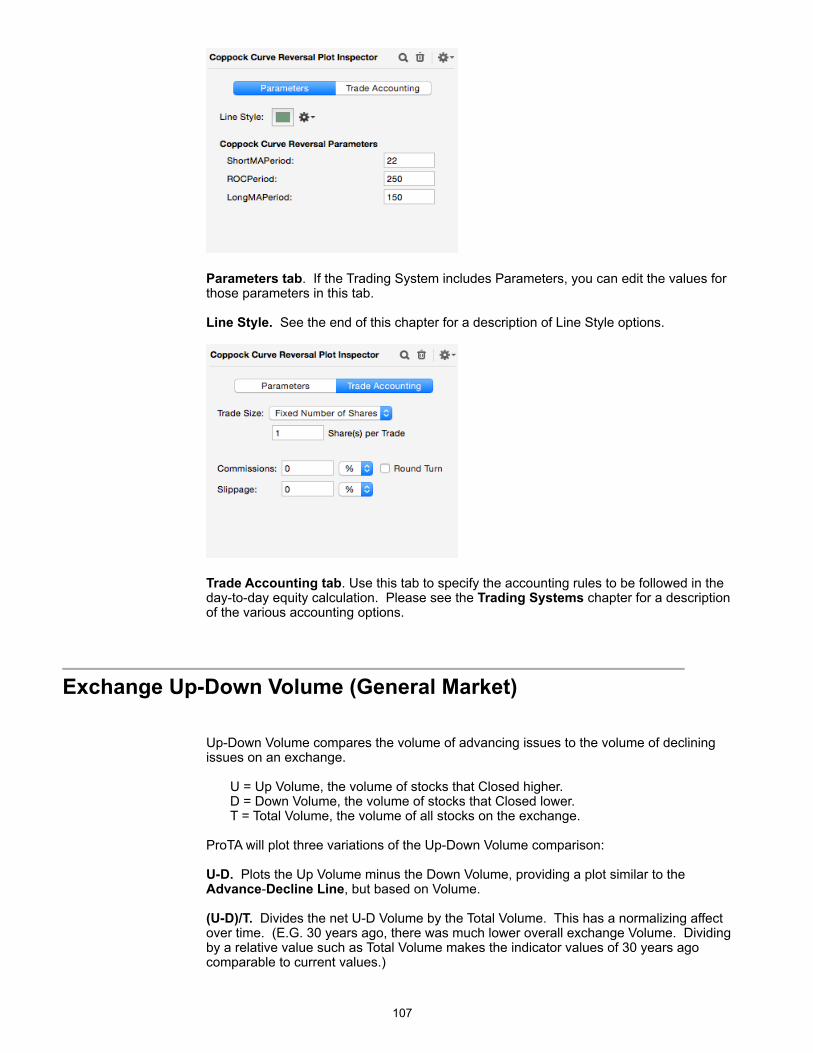
!
Parameters tab. If the Trading System includes Parameters, you can edit the values for those parameters in this tab.
Line Style. See the end of this chapter for a description of Line Style options.
!
Trade Accounting tab. Use this tab to specify the accounting rules to be followed in the day-to-day equity calculation. Please see the Trading Systems chapter for a description of the various accounting options.
!Exchange Up-Down Volume (General Market)
Up-Down Volume compares the volume of advancing issues to the volume of declining issues on an exchange.
U = Up Volume, the volume of stocks that Closed higher. D = Down Volume, the volume of stocks that Closed lower. T = Total Volume, the volume of all stocks on the exchange.
ProTA will plot three variations of the Up-Down Volume comparison:
U-D. Plots the Up Volume minus the Down Volume, providing a plot similar to the Advance-Decline Line, but based on Volume.
(U-D)/T. Divides the net U-D Volume by the Total Volume. This has a normalizing affect over time. (E.G. 30 years ago, there was much lower overall exchange Volume. Dividing by a relative value such as Total Volume makes the indicator values of 30 years ago comparable to current values.)
!107
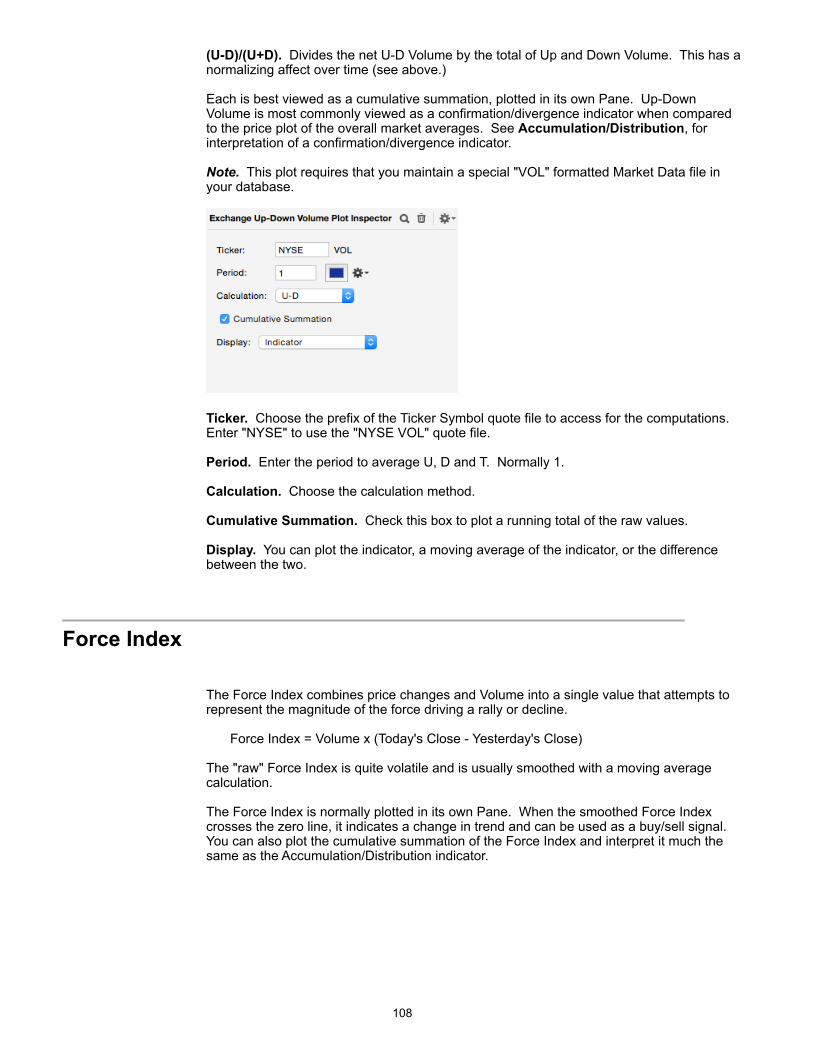
(U-D)/(U+D). Divides the net U-D Volume by the total of Up and Down Volume. This has a normalizing affect over time (see above.)
Each is best viewed as a cumulative summation, plotted in its own Pane. Up-Down Volume is most commonly viewed as a confirmation/divergence indicator when compared to the price plot of the overall market averages. See Accumulation/Distribution, for interpretation of a confirmation/divergence indicator.
Note. This plot requires that you maintain a special "VOL" formatted Market Data file in your database.
!
Ticker. Choose the prefix of the Ticker Symbol quote file to access for the computations. Enter "NYSE" to use the "NYSE VOL" quote file.
Period. Enter the period to average U, D and T. Normally 1.
Calculation. Choose the calculation method.
Cumulative Summation. Check this box to plot a running total of the raw values.
Display. You can plot the indicator, a moving average of the indicator, or the difference between the two.
!Force Index
The Force Index combines price changes and Volume into a single value that attempts to represent the magnitude of the force driving a rally or decline.
Force Index = Volume x (Today's Close - Yesterday's Close)
The "raw" Force Index is quite volatile and is usually smoothed with a moving average calculation.
The Force Index is normally plotted in its own Pane. When the smoothed Force Index crosses the zero line, it indicates a change in trend and can be used as a buy/sell signal. You can also plot the cumulative summation of the Force Index and interpret it much the same as the Accumulation/Distribution indicator.
!108
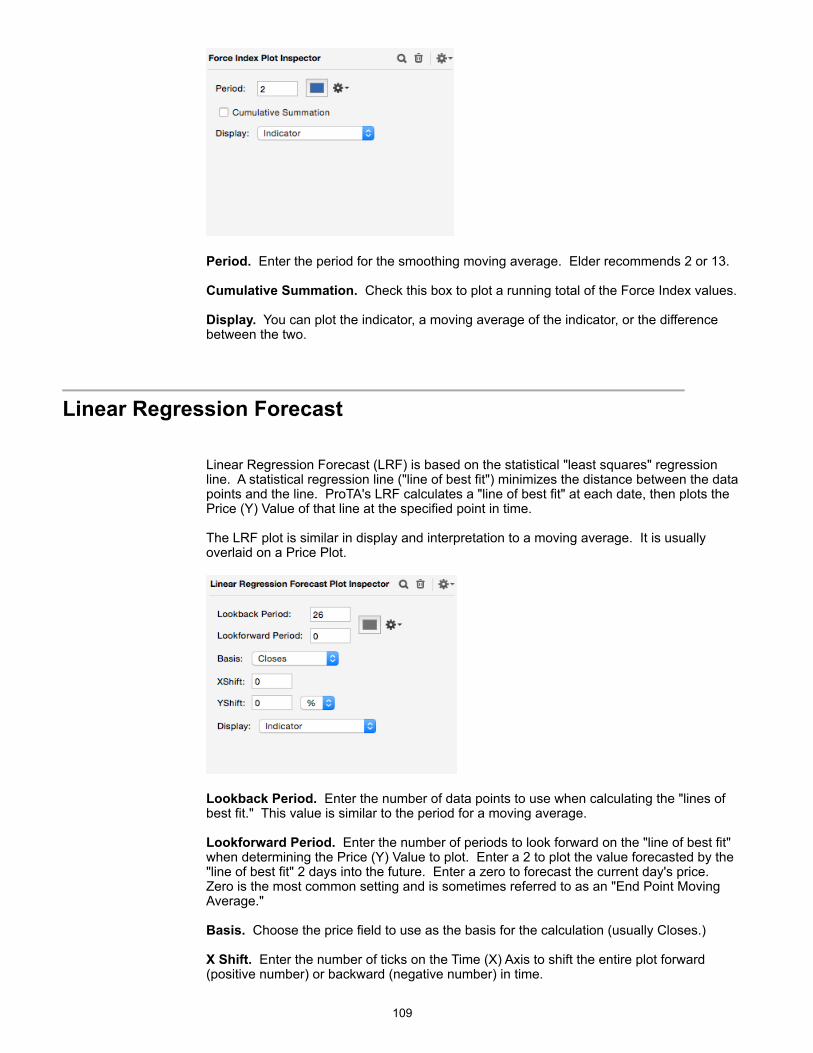
!
Period. Enter the period for the smoothing moving average. Elder recommends 2 or 13.
Cumulative Summation. Check this box to plot a running total of the Force Index values.
Display. You can plot the indicator, a moving average of the indicator, or the difference between the two.
!Linear Regression Forecast
Linear Regression Forecast (LRF) is based on the statistical "least squares" regression line. A statistical regression line ("line of best fit") minimizes the distance between the data points and the line. ProTA's LRF calculates a "line of best fit" at each date, then plots the Price (Y) Value of that line at the specified point in time.
The LRF plot is similar in display and interpretation to a moving average. It is usually overlaid on a Price Plot.
!
Lookback Period. Enter the number of data points to use when calculating the "lines of best fit." This value is similar to the period for a moving average.
Lookforward Period. Enter the number of periods to look forward on the "line of best fit" when determining the Price (Y) Value to plot. Enter a 2 to plot the value forecasted by the "line of best fit" 2 days into the future. Enter a zero to forecast the current day's price. Zero is the most common setting and is sometimes referred to as an "End Point Moving Average."
Basis. Choose the price field to use as the basis for the calculation (usually Closes.)
X Shift. Enter the number of ticks on the Time (X) Axis to shift the entire plot forward (positive number) or backward (negative number) in time.
!109
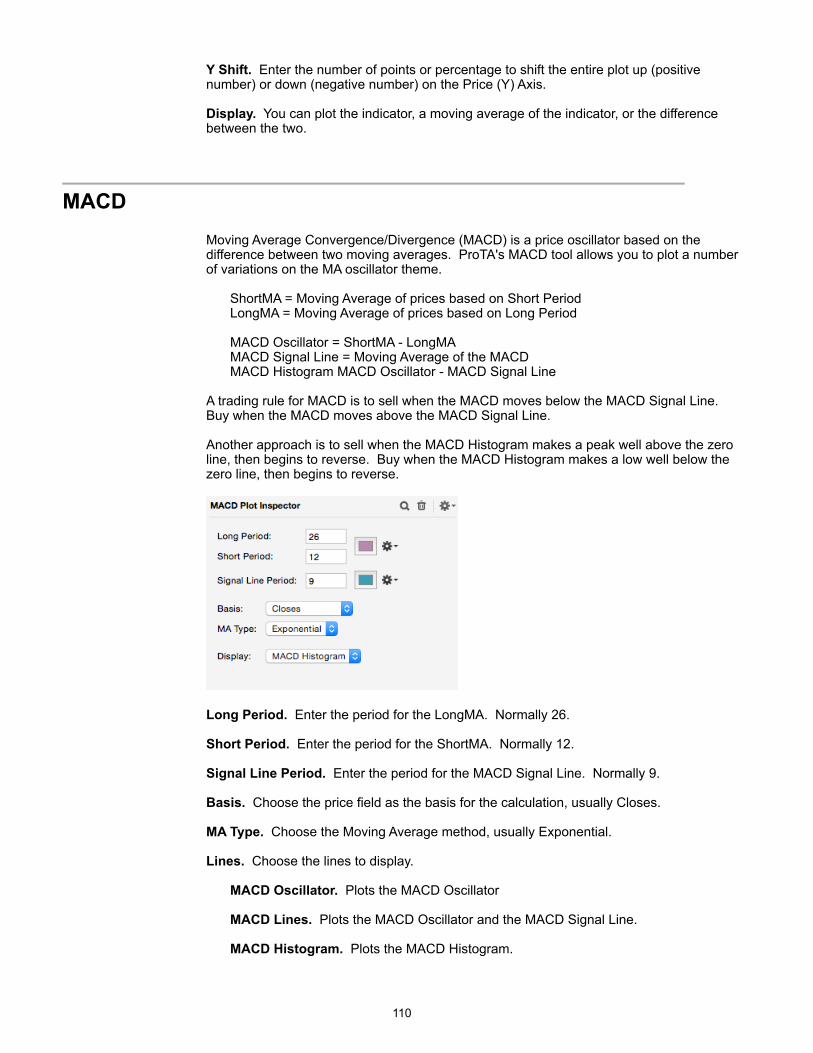
Y Shift. Enter the number of points or percentage to shift the entire plot up (positive number) or down (negative number) on the Price (Y) Axis.
Display. You can plot the indicator, a moving average of the indicator, or the difference between the two.
!MACD
Moving Average Convergence/Divergence (MACD) is a price oscillator based on the difference between two moving averages. ProTA's MACD tool allows you to plot a number of variations on the MA oscillator theme.
ShortMA = Moving Average of prices based on Short Period LongMA = Moving Average of prices based on Long Period
MACD Oscillator = ShortMA - LongMA MACD Signal Line = Moving Average of the MACD MACD Histogram MACD Oscillator - MACD Signal Line
A trading rule for MACD is to sell when the MACD moves below the MACD Signal Line. Buy when the MACD moves above the MACD Signal Line.
Another approach is to sell when the MACD Histogram makes a peak well above the zero line, then begins to reverse. Buy when the MACD Histogram makes a low well below the zero line, then begins to reverse.
!
Long Period. Enter the period for the LongMA. Normally 26.
Short Period. Enter the period for the ShortMA. Normally 12.
Signal Line Period. Enter the period for the MACD Signal Line. Normally 9.
Basis. Choose the price field as the basis for the calculation, usually Closes.
MA Type. Choose the Moving Average method, usually Exponential.
Lines. Choose the lines to display.
MACD Oscillator. Plots the MACD Oscillator
MACD Lines. Plots the MACD Oscillator and the MACD Signal Line.
MACD Histogram. Plots the MACD Histogram.
!110
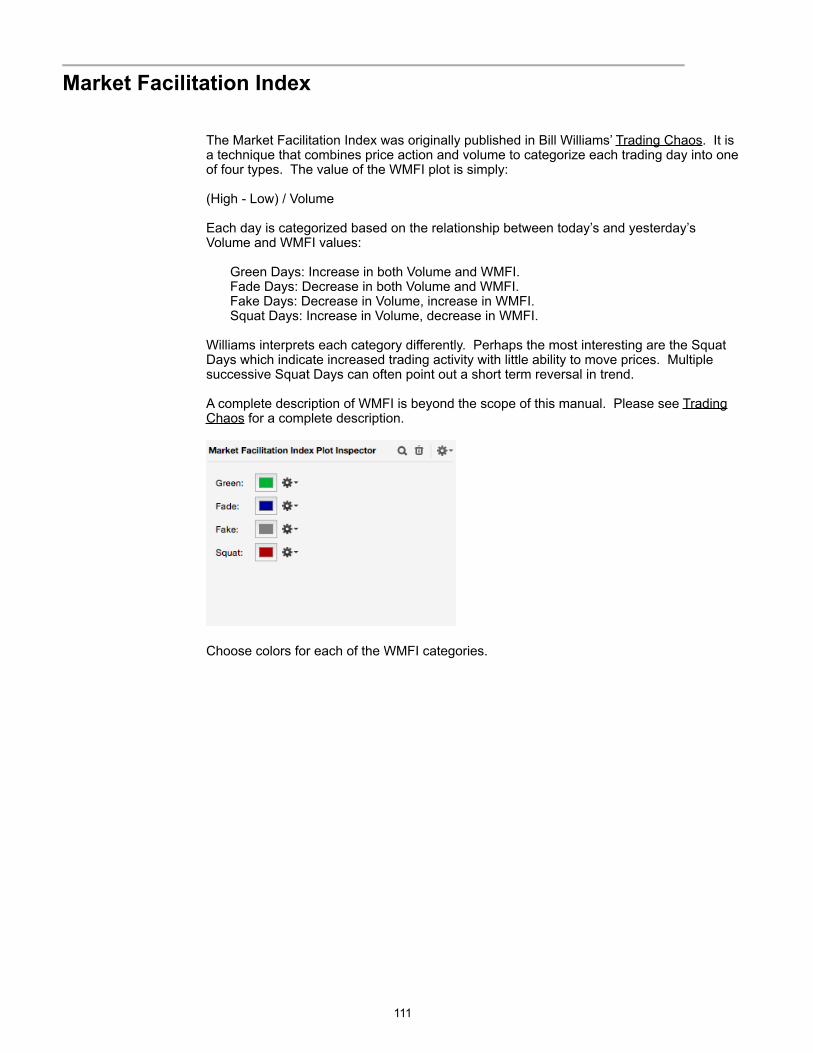
!Market Facilitation Index
The Market Facilitation Index was originally published in Bill Williams’ Trading Chaos. It is a technique that combines price action and volume to categorize each trading day into one of four types. The value of the WMFI plot is simply:
(High - Low) / Volume
Each day is categorized based on the relationship between today’s and yesterday’s Volume and WMFI values:
Green Days: Increase in both Volume and WMFI. Fade Days: Decrease in both Volume and WMFI. Fake Days: Decrease in Volume, increase in WMFI. Squat Days: Increase in Volume, decrease in WMFI.
Williams interprets each category differently. Perhaps the most interesting are the Squat Days which indicate increased trading activity with little ability to move prices. Multiple successive Squat Days can often point out a short term reversal in trend.
A complete description of WMFI is beyond the scope of this manual. Please see Trading Chaos for a complete description.
!
Choose colors for each of the WMFI categories.
!111
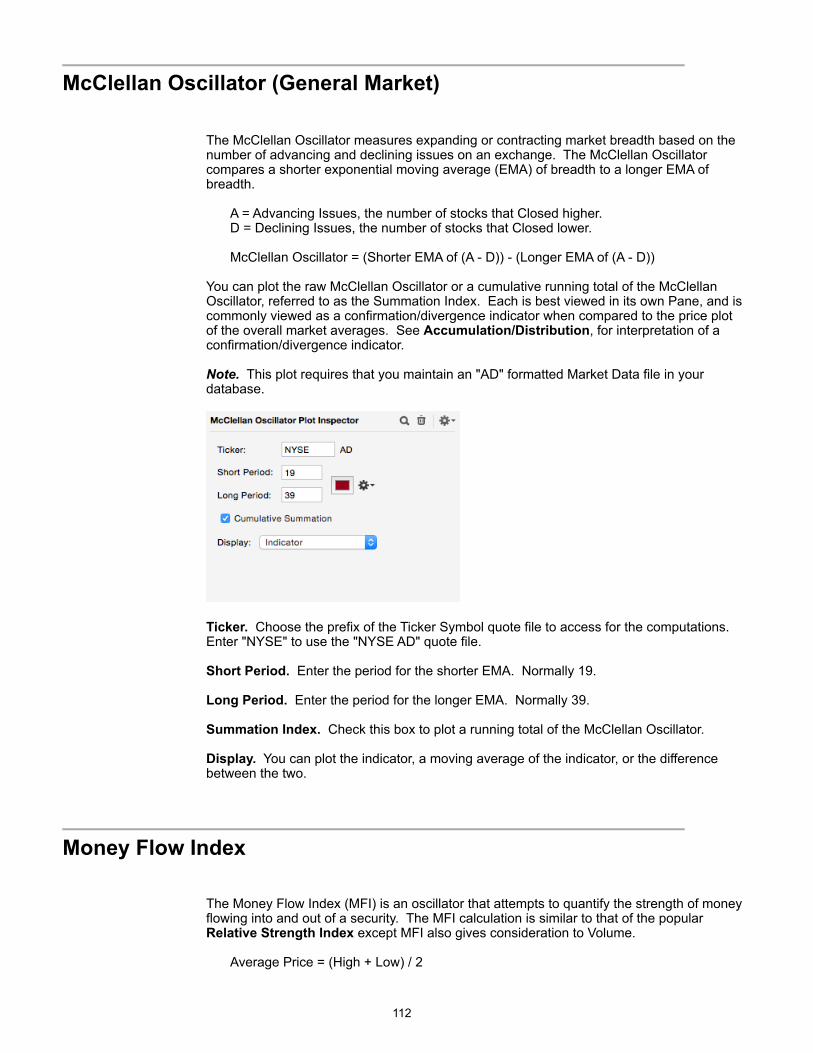
!McClellan Oscillator (General Market)
The McClellan Oscillator measures expanding or contracting market breadth based on the number of advancing and declining issues on an exchange. The McClellan Oscillator compares a shorter exponential moving average (EMA) of breadth to a longer EMA of breadth.
A = Advancing Issues, the number of stocks that Closed higher. D = Declining Issues, the number of stocks that Closed lower.
McClellan Oscillator = (Shorter EMA of (A - D)) - (Longer EMA of (A - D))
You can plot the raw McClellan Oscillator or a cumulative running total of the McClellan Oscillator, referred to as the Summation Index. Each is best viewed in its own Pane, and is commonly viewed as a confirmation/divergence indicator when compared to the price plot of the overall market averages. See Accumulation/Distribution, for interpretation of a confirmation/divergence indicator.
Note. This plot requires that you maintain an "AD" formatted Market Data file in your database.
!
Ticker. Choose the prefix of the Ticker Symbol quote file to access for the computations. Enter "NYSE" to use the "NYSE AD" quote file.
Short Period. Enter the period for the shorter EMA. Normally 19.
Long Period. Enter the period for the longer EMA. Normally 39.
Summation Index. Check this box to plot a running total of the McClellan Oscillator.
Display. You can plot the indicator, a moving average of the indicator, or the difference between the two.
!Money Flow Index
The Money Flow Index (MFI) is an oscillator that attempts to quantify the strength of money flowing into and out of a security. The MFI calculation is similar to that of the popular Relative Strength Index except MFI also gives consideration to Volume.
Average Price = (High + Low) / 2
!112
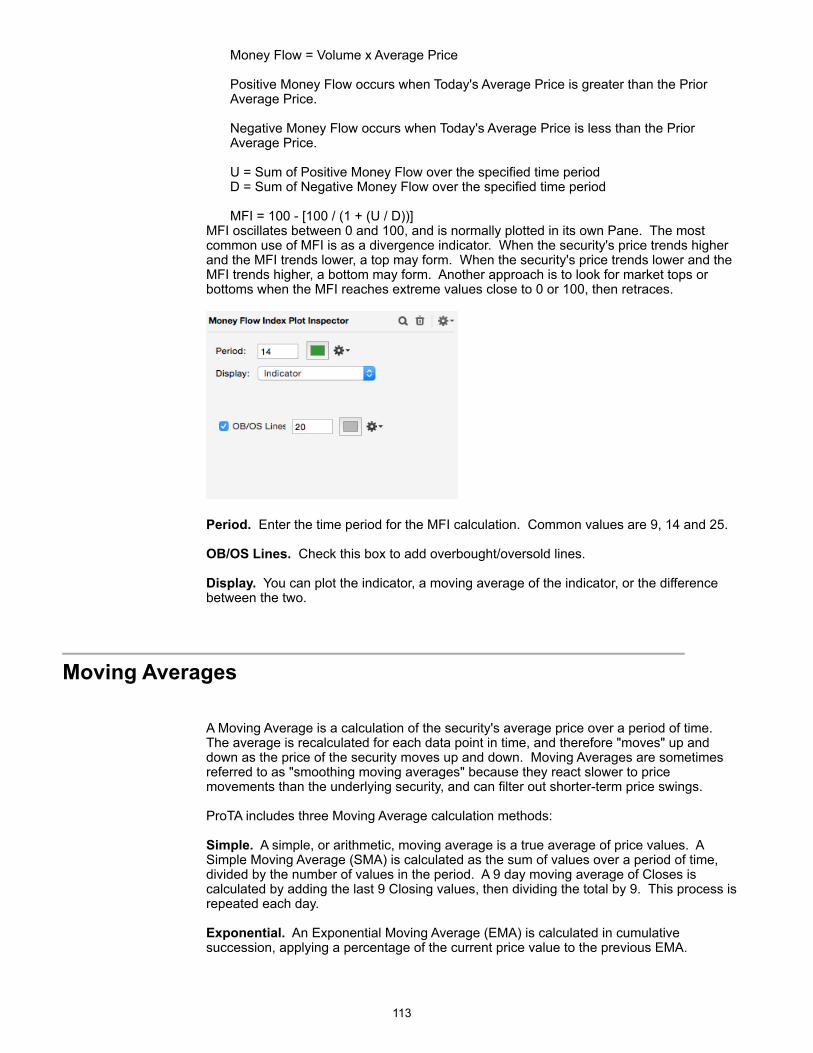
Money Flow = Volume x Average Price
Positive Money Flow occurs when Today's Average Price is greater than the Prior Average Price.
Negative Money Flow occurs when Today's Average Price is less than the Prior Average Price.
U = Sum of Positive Money Flow over the specified time period D = Sum of Negative Money Flow over the specified time period
MFI = 100 - [100 / (1 + (U / D))] MFI oscillates between 0 and 100, and is normally plotted in its own Pane. The most common use of MFI is as a divergence indicator. When the security's price trends higher and the MFI trends lower, a top may form. When the security's price trends lower and the MFI trends higher, a bottom may form. Another approach is to look for market tops or bottoms when the MFI reaches extreme values close to 0 or 100, then retraces.
!
Period. Enter the time period for the MFI calculation. Common values are 9, 14 and 25.
OB/OS Lines. Check this box to add overbought/oversold lines.
Display. You can plot the indicator, a moving average of the indicator, or the difference between the two.
!Moving Averages
A Moving Average is a calculation of the security's average price over a period of time. The average is recalculated for each data point in time, and therefore "moves" up and down as the price of the security moves up and down. Moving Averages are sometimes referred to as "smoothing moving averages" because they react slower to price movements than the underlying security, and can filter out shorter-term price swings.
ProTA includes three Moving Average calculation methods:
Simple. A simple, or arithmetic, moving average is a true average of price values. A Simple Moving Average (SMA) is calculated as the sum of values over a period of time, divided by the number of values in the period. A 9 day moving average of Closes is calculated by adding the last 9 Closing values, then dividing the total by 9. This process is repeated each day.
Exponential. An Exponential Moving Average (EMA) is calculated in cumulative succession, applying a percentage of the current price value to the previous EMA.
!113
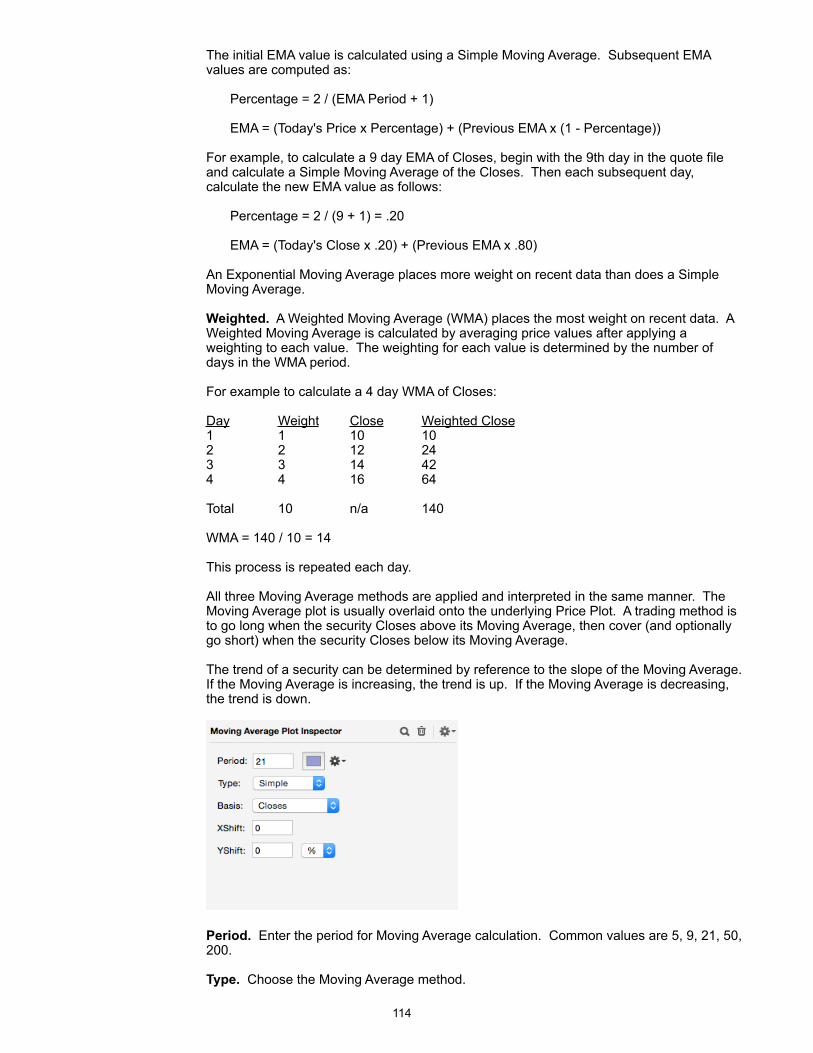
The initial EMA value is calculated using a Simple Moving Average. Subsequent EMA values are computed as:
Percentage = 2 / (EMA Period + 1)
EMA = (Today's Price x Percentage) + (Previous EMA x (1 - Percentage))
For example, to calculate a 9 day EMA of Closes, begin with the 9th day in the quote file and calculate a Simple Moving Average of the Closes. Then each subsequent day, calculate the new EMA value as follows:
Percentage = 2 / (9 + 1) = .20
EMA = (Today's Close x .20) + (Previous EMA x .80)
An Exponential Moving Average places more weight on recent data than does a Simple Moving Average.
Weighted. A Weighted Moving Average (WMA) places the most weight on recent data. A Weighted Moving Average is calculated by averaging price values after applying a weighting to each value. The weighting for each value is determined by the number of days in the WMA period.
For example to calculate a 4 day WMA of Closes:
Day Weight Close Weighted Close 1 1 10 10 2 2 12 24 3 3 14 42 4 4 16 64
Total 10 n/a 140
WMA = 140 / 10 = 14
This process is repeated each day.
All three Moving Average methods are applied and interpreted in the same manner. The Moving Average plot is usually overlaid onto the underlying Price Plot. A trading method is to go long when the security Closes above its Moving Average, then cover (and optionally go short) when the security Closes below its Moving Average.
The trend of a security can be determined by reference to the slope of the Moving Average. If the Moving Average is increasing, the trend is up. If the Moving Average is decreasing, the trend is down.
!
Period. Enter the period for Moving Average calculation. Common values are 5, 9, 21, 50, 200.
Type. Choose the Moving Average method.
!114
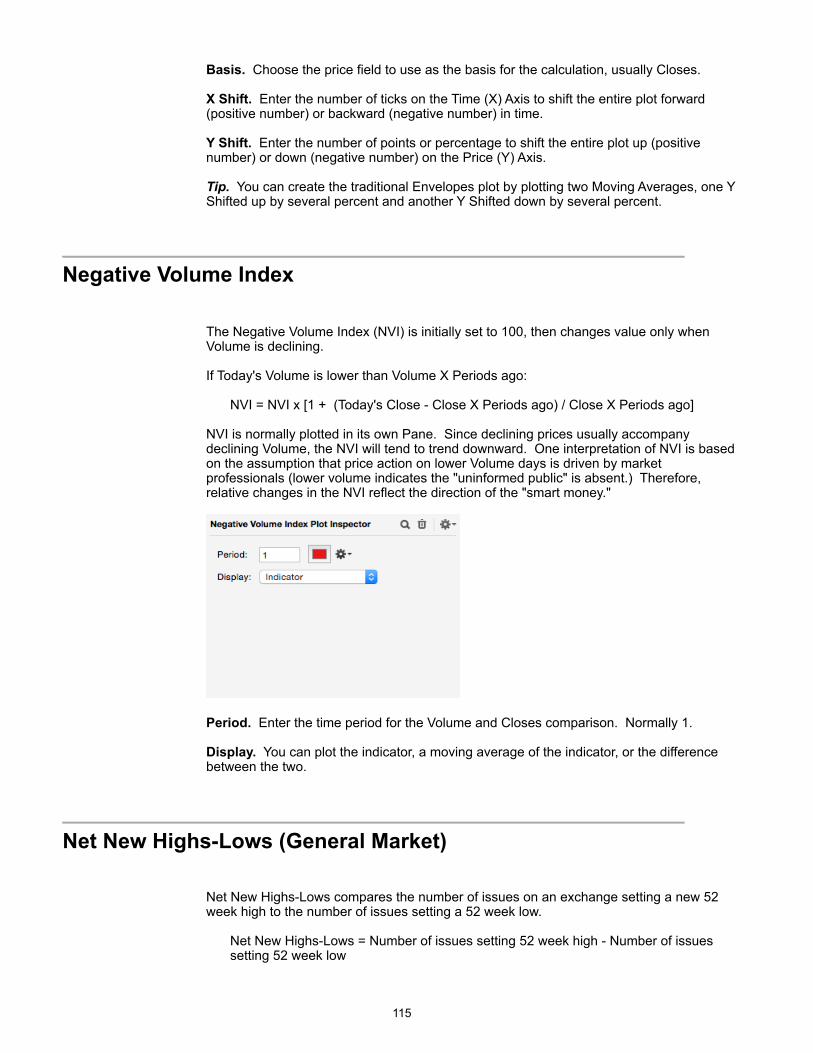
Basis. Choose the price field to use as the basis for the calculation, usually Closes.
X Shift. Enter the number of ticks on the Time (X) Axis to shift the entire plot forward (positive number) or backward (negative number) in time.
Y Shift. Enter the number of points or percentage to shift the entire plot up (positive number) or down (negative number) on the Price (Y) Axis.
Tip. You can create the traditional Envelopes plot by plotting two Moving Averages, one Y Shifted up by several percent and another Y Shifted down by several percent.
!Negative Volume Index
The Negative Volume Index (NVI) is initially set to 100, then changes value only when Volume is declining.
If Today's Volume is lower than Volume X Periods ago:
NVI = NVI x [1 + (Today's Close - Close X Periods ago) / Close X Periods ago]
NVI is normally plotted in its own Pane. Since declining prices usually accompany declining Volume, the NVI will tend to trend downward. One interpretation of NVI is based on the assumption that price action on lower Volume days is driven by market professionals (lower volume indicates the "uninformed public" is absent.) Therefore, relative changes in the NVI reflect the direction of the "smart money."
!
Period. Enter the time period for the Volume and Closes comparison. Normally 1.
Display. You can plot the indicator, a moving average of the indicator, or the difference between the two.
! Net New Highs-Lows (General Market)
Net New Highs-Lows compares the number of issues on an exchange setting a new 52 week high to the number of issues setting a 52 week low.
Net New Highs-Lows = Number of issues setting 52 week high - Number of issues setting 52 week low
!115
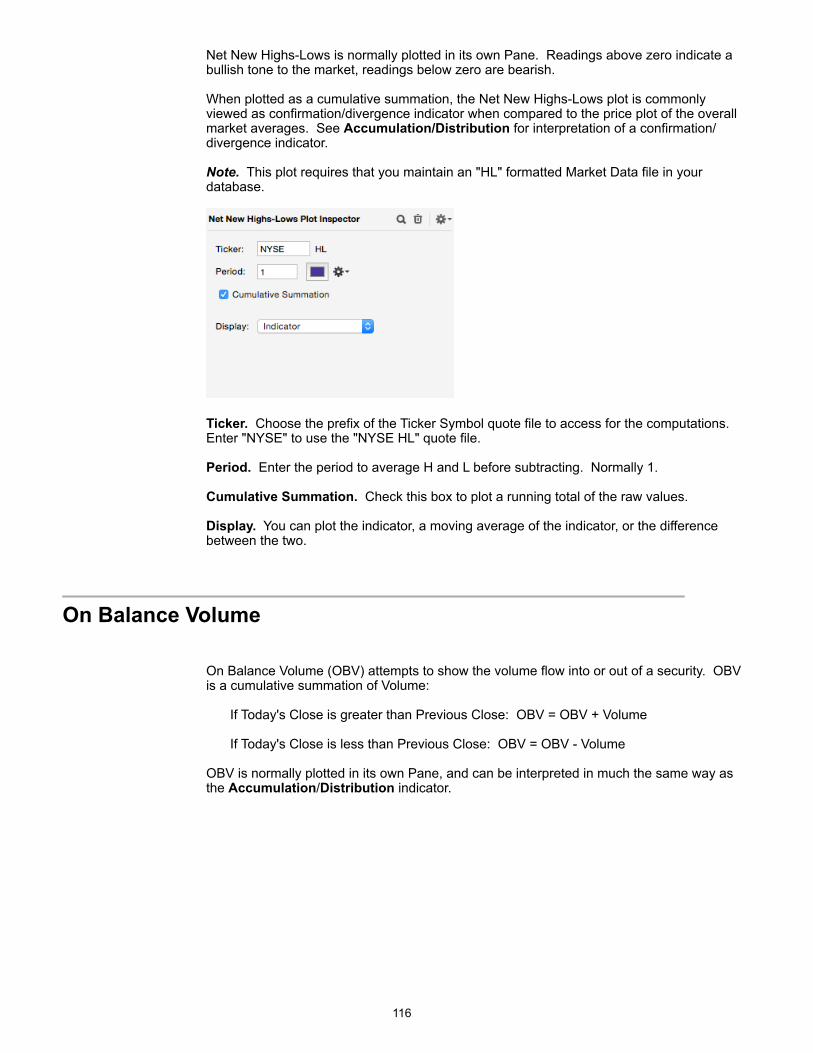
Net New Highs-Lows is normally plotted in its own Pane. Readings above zero indicate a bullish tone to the market, readings below zero are bearish.
When plotted as a cumulative summation, the Net New Highs-Lows plot is commonly viewed as confirmation/divergence indicator when compared to the price plot of the overall market averages. See Accumulation/Distribution for interpretation of a confirmation/divergence indicator.
Note. This plot requires that you maintain an "HL" formatted Market Data file in your database.
!
Ticker. Choose the prefix of the Ticker Symbol quote file to access for the computations. Enter "NYSE" to use the "NYSE HL" quote file.
Period. Enter the period to average H and L before subtracting. Normally 1.
Cumulative Summation. Check this box to plot a running total of the raw values.
Display. You can plot the indicator, a moving average of the indicator, or the difference between the two.
! On Balance Volume
On Balance Volume (OBV) attempts to show the volume flow into or out of a security. OBV is a cumulative summation of Volume:
If Today's Close is greater than Previous Close: OBV = OBV + Volume
If Today's Close is less than Previous Close: OBV = OBV - Volume
OBV is normally plotted in its own Pane, and can be interpreted in much the same way as the Accumulation/Distribution indicator.
!116
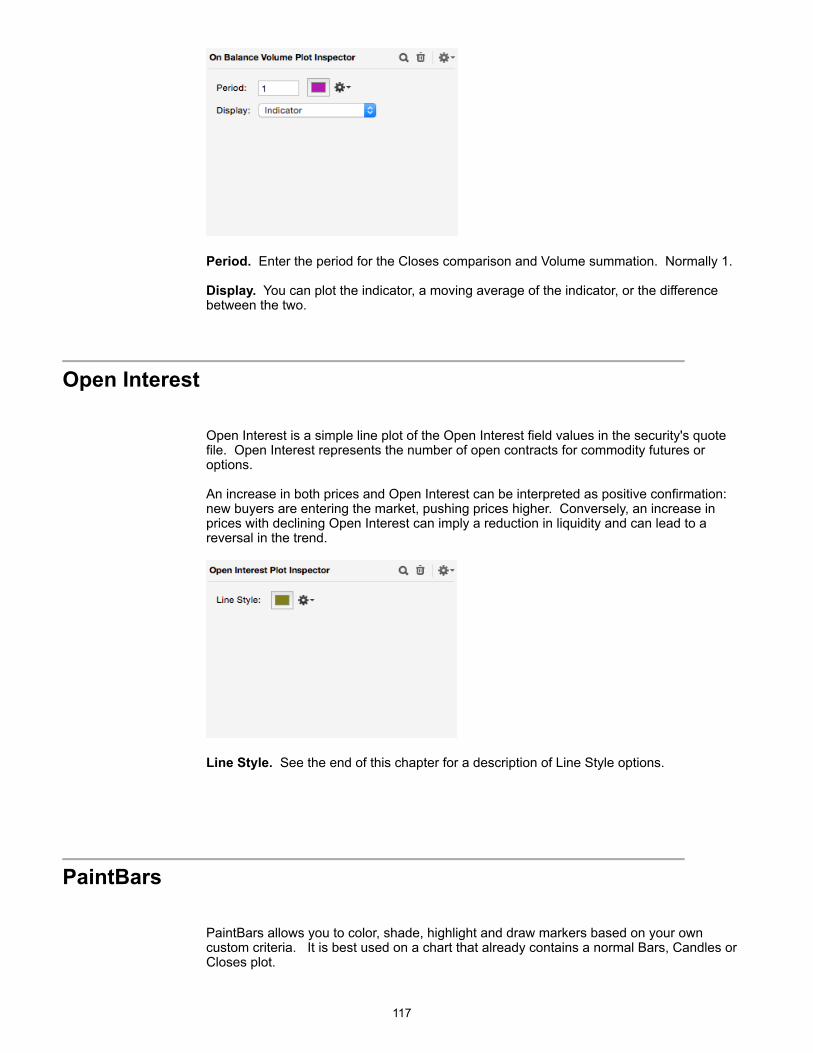
!
Period. Enter the period for the Closes comparison and Volume summation. Normally 1.
Display. You can plot the indicator, a moving average of the indicator, or the difference between the two.
! Open Interest
Open Interest is a simple line plot of the Open Interest field values in the security's quote file. Open Interest represents the number of open contracts for commodity futures or options.
An increase in both prices and Open Interest can be interpreted as positive confirmation: new buyers are entering the market, pushing prices higher. Conversely, an increase in prices with declining Open Interest can imply a reduction in liquidity and can lead to a reversal in the trend.
!
Line Style. See the end of this chapter for a description of Line Style options.
!PaintBars
PaintBars allows you to color, shade, highlight and draw markers based on your own custom criteria. It is best used on a chart that already contains a normal Bars, Candles or Closes plot.
!117
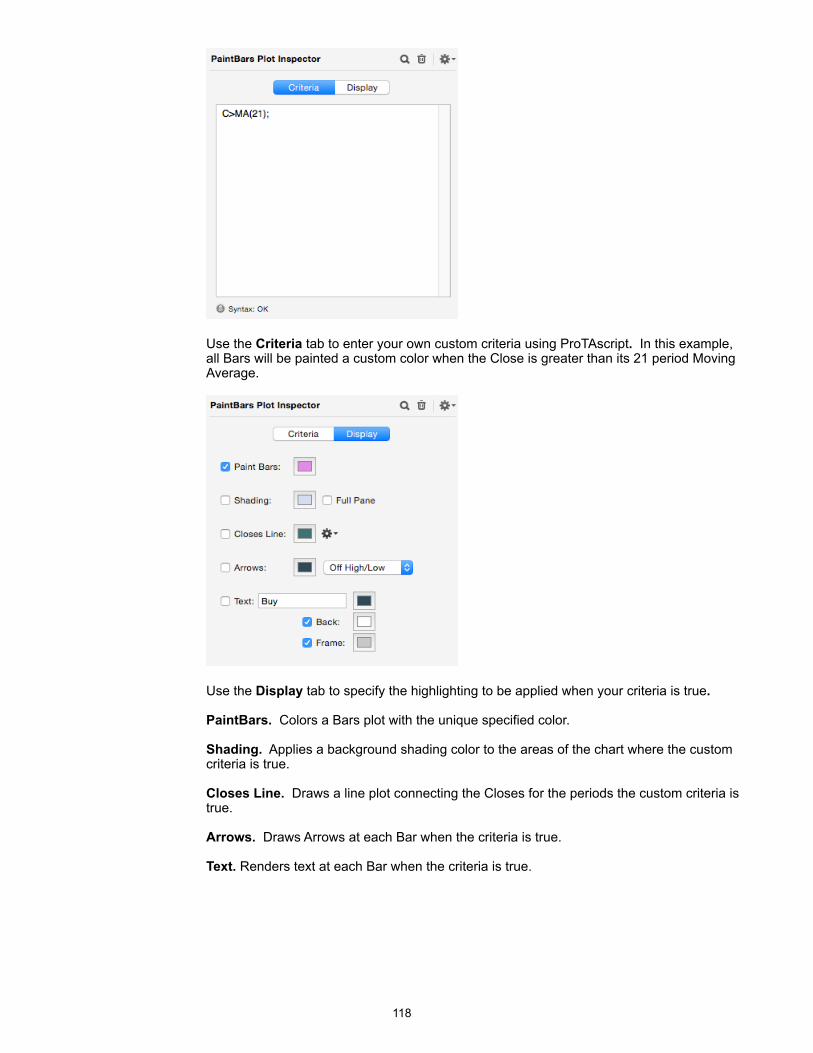
!
Use the Criteria tab to enter your own custom criteria using ProTAscript. In this example, all Bars will be painted a custom color when the Close is greater than its 21 period Moving Average.
!
Use the Display tab to specify the highlighting to be applied when your criteria is true.
PaintBars. Colors a Bars plot with the unique specified color.
Shading. Applies a background shading color to the areas of the chart where the custom criteria is true.
Closes Line. Draws a line plot connecting the Closes for the periods the custom criteria is true.
Arrows. Draws Arrows at each Bar when the criteria is true.
Text. Renders text at each Bar when the criteria is true.
!118
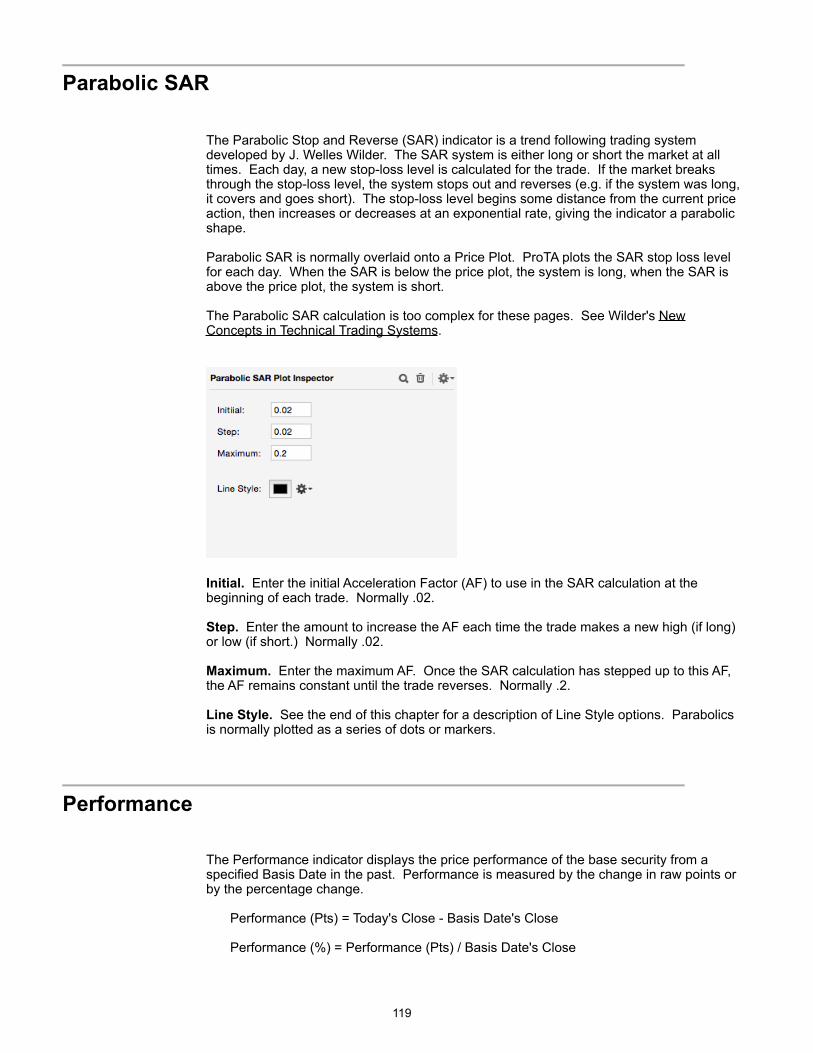
!Parabolic SAR
The Parabolic Stop and Reverse (SAR) indicator is a trend following trading system developed by J. Welles Wilder. The SAR system is either long or short the market at all times. Each day, a new stop-loss level is calculated for the trade. If the market breaks through the stop-loss level, the system stops out and reverses (e.g. if the system was long, it covers and goes short). The stop-loss level begins some distance from the current price action, then increases or decreases at an exponential rate, giving the indicator a parabolic shape.
Parabolic SAR is normally overlaid onto a Price Plot. ProTA plots the SAR stop loss level for each day. When the SAR is below the price plot, the system is long, when the SAR is above the price plot, the system is short.
The Parabolic SAR calculation is too complex for these pages. See Wilder's New Concepts in Technical Trading Systems.
!
Initial. Enter the initial Acceleration Factor (AF) to use in the SAR calculation at the beginning of each trade. Normally .02.
Step. Enter the amount to increase the AF each time the trade makes a new high (if long) or low (if short.) Normally .02.
Maximum. Enter the maximum AF. Once the SAR calculation has stepped up to this AF, the AF remains constant until the trade reverses. Normally .2.
Line Style. See the end of this chapter for a description of Line Style options. Parabolics is normally plotted as a series of dots or markers.
!Performance
The Performance indicator displays the price performance of the base security from a specified Basis Date in the past. Performance is measured by the change in raw points or by the percentage change.
Performance (Pts) = Today's Close - Basis Date's Close
Performance (%) = Performance (Pts) / Basis Date's Close
!119
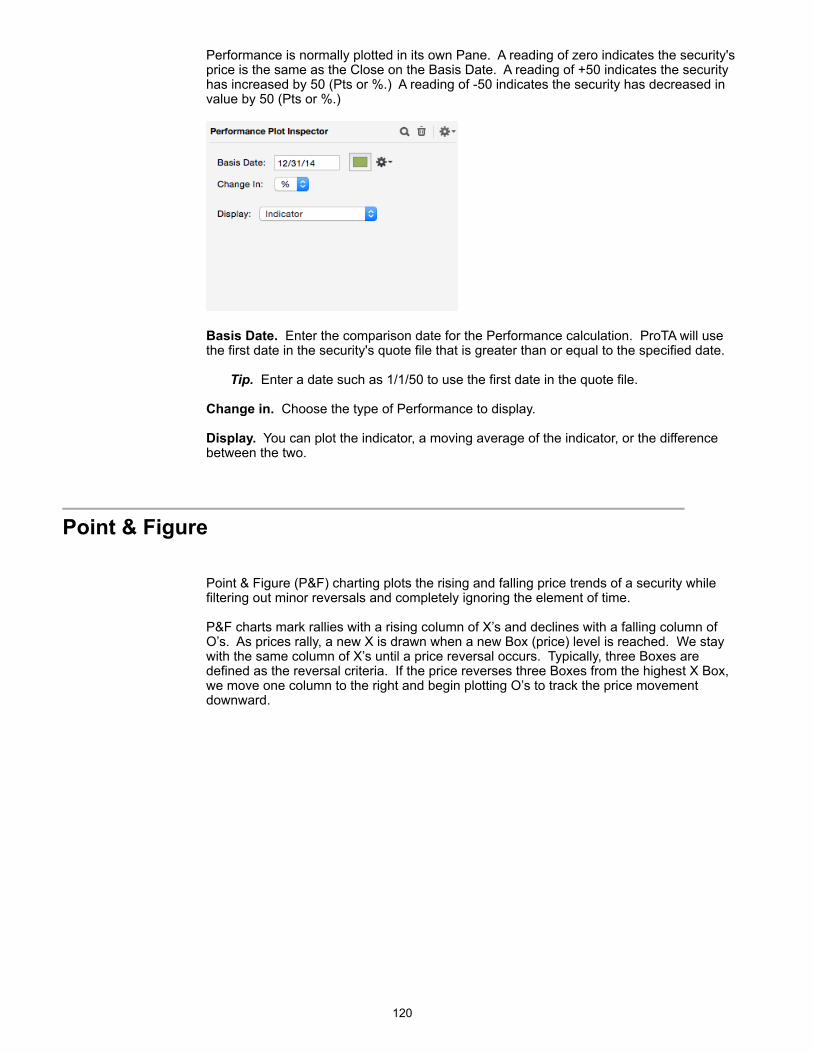
Performance is normally plotted in its own Pane. A reading of zero indicates the security's price is the same as the Close on the Basis Date. A reading of +50 indicates the security has increased by 50 (Pts or %.) A reading of -50 indicates the security has decreased in value by 50 (Pts or %.)
!
Basis Date. Enter the comparison date for the Performance calculation. ProTA will use the first date in the security's quote file that is greater than or equal to the specified date.
Tip. Enter a date such as 1/1/50 to use the first date in the quote file.
Change in. Choose the type of Performance to display.
Display. You can plot the indicator, a moving average of the indicator, or the difference between the two.
! Point & Figure
Point & Figure (P&F) charting plots the rising and falling price trends of a security while filtering out minor reversals and completely ignoring the element of time.
P&F charts mark rallies with a rising column of X’s and declines with a falling column of O’s. As prices rally, a new X is drawn when a new Box (price) level is reached. We stay with the same column of X’s until a price reversal occurs. Typically, three Boxes are defined as the reversal criteria. If the price reverses three Boxes from the highest X Box, we move one column to the right and begin plotting O’s to track the price movement downward.
!120
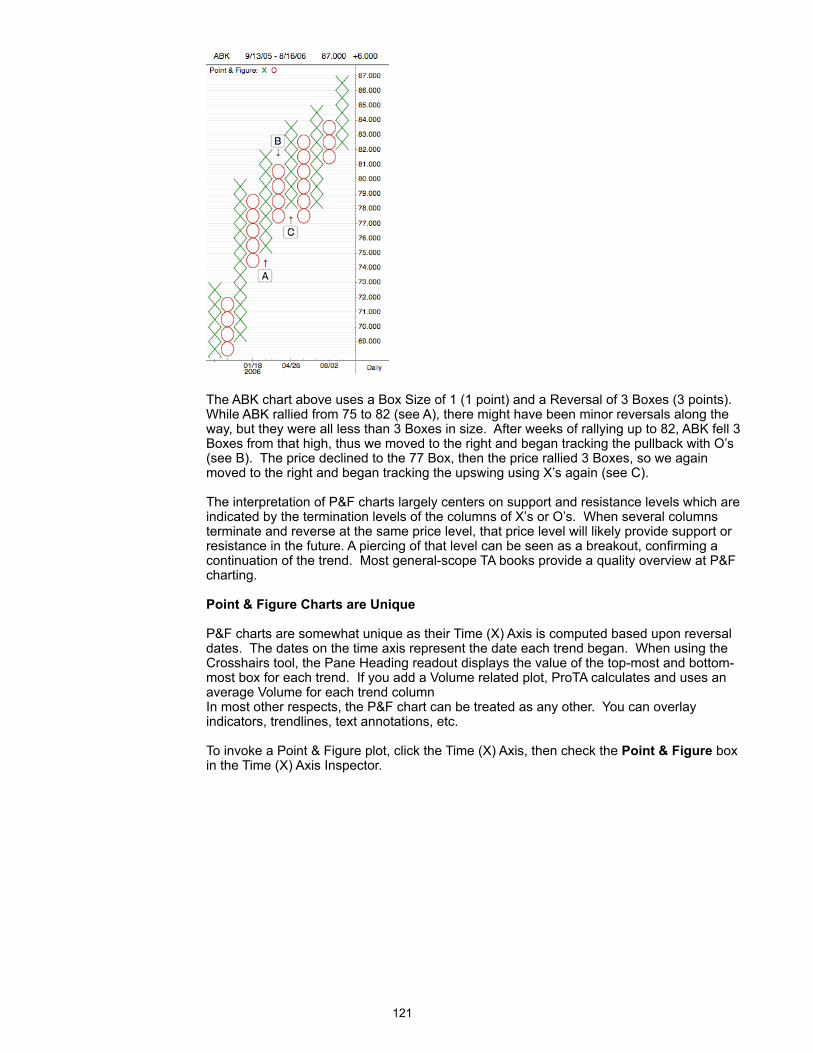
!
The ABK chart above uses a Box Size of 1 (1 point) and a Reversal of 3 Boxes (3 points). While ABK rallied from 75 to 82 (see A), there might have been minor reversals along the way, but they were all less than 3 Boxes in size. After weeks of rallying up to 82, ABK fell 3 Boxes from that high, thus we moved to the right and began tracking the pullback with O’s (see B). The price declined to the 77 Box, then the price rallied 3 Boxes, so we again moved to the right and began tracking the upswing using X’s again (see C).
The interpretation of P&F charts largely centers on support and resistance levels which are indicated by the termination levels of the columns of X’s or O’s. When several columns terminate and reverse at the same price level, that price level will likely provide support or resistance in the future. A piercing of that level can be seen as a breakout, confirming a continuation of the trend. Most general-scope TA books provide a quality overview at P&F charting.
Point & Figure Charts are Unique
P&F charts are somewhat unique as their Time (X) Axis is computed based upon reversal dates. The dates on the time axis represent the date each trend began. When using the Crosshairs tool, the Pane Heading readout displays the value of the top-most and bottom-most box for each trend. If you add a Volume related plot, ProTA calculates and uses an average Volume for each trend column In most other respects, the P&F chart can be treated as any other. You can overlay indicators, trendlines, text annotations, etc.
To invoke a Point & Figure plot, click the Time (X) Axis, then check the Point & Figure box in the Time (X) Axis Inspector.
!121
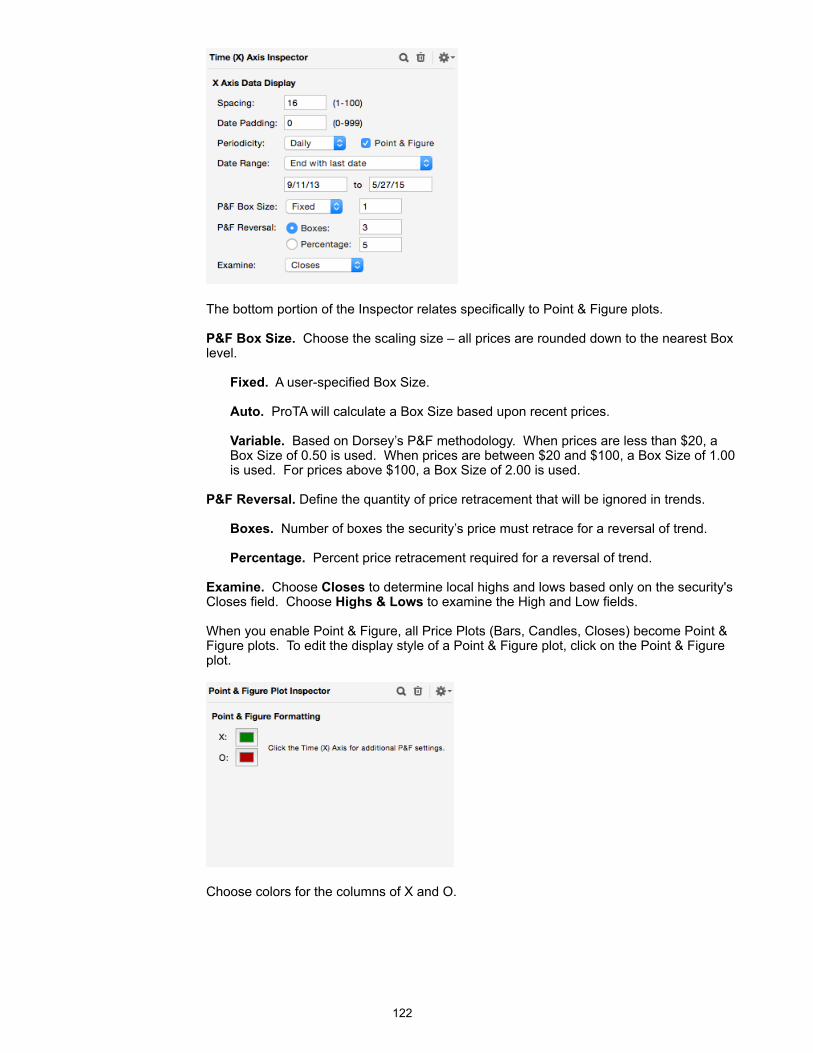
!
The bottom portion of the Inspector relates specifically to Point & Figure plots.
P&F Box Size. Choose the scaling size – all prices are rounded down to the nearest Box level.
Fixed. A user-specified Box Size.
Auto. ProTA will calculate a Box Size based upon recent prices.
Variable. Based on Dorsey’s P&F methodology. When prices are less than $20, a Box Size of 0.50 is used. When prices are between $20 and $100, a Box Size of 1.00 is used. For prices above $100, a Box Size of 2.00 is used.
P&F Reversal. Define the quantity of price retracement that will be ignored in trends.
Boxes. Number of boxes the security’s price must retrace for a reversal of trend.
Percentage. Percent price retracement required for a reversal of trend.
Examine. Choose Closes to determine local highs and lows based only on the security's Closes field. Choose Highs & Lows to examine the High and Low fields.
When you enable Point & Figure, all Price Plots (Bars, Candles, Closes) become Point & Figure plots. To edit the display style of a Point & Figure plot, click on the Point & Figure plot.
!
Choose colors for the columns of X and O.
!122
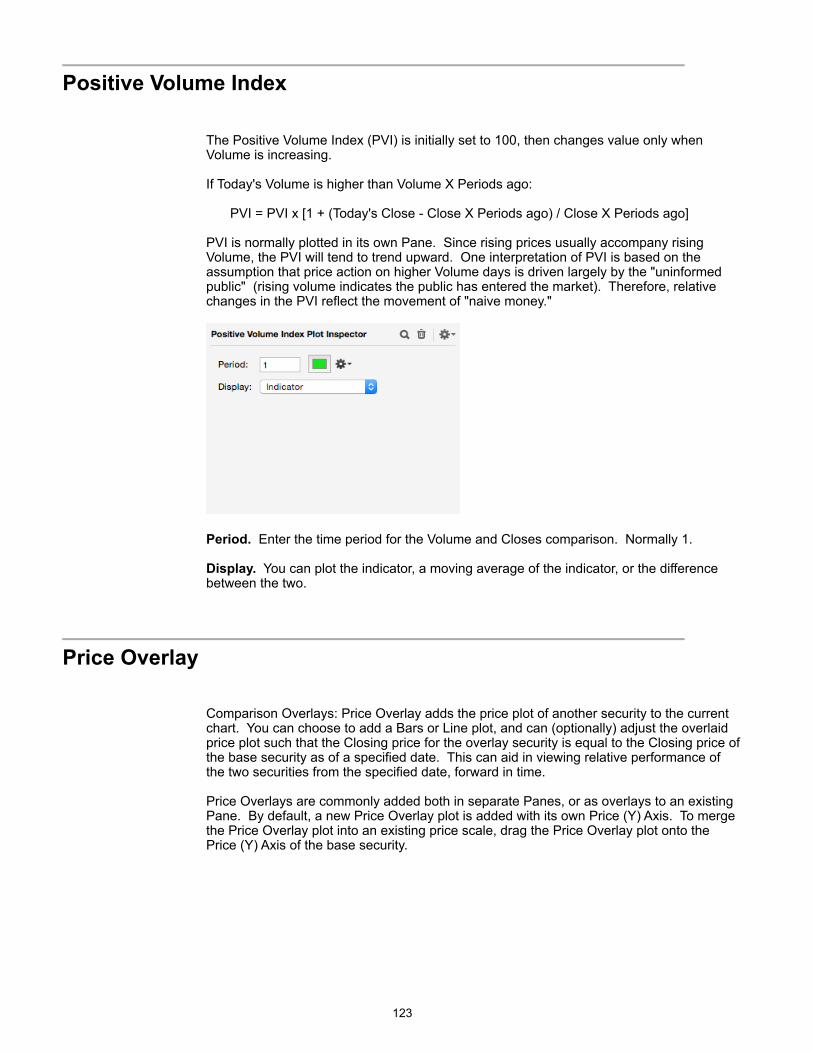
!Positive Volume Index
The Positive Volume Index (PVI) is initially set to 100, then changes value only when Volume is increasing.
If Today's Volume is higher than Volume X Periods ago:
PVI = PVI x [1 + (Today's Close - Close X Periods ago) / Close X Periods ago]
PVI is normally plotted in its own Pane. Since rising prices usually accompany rising Volume, the PVI will tend to trend upward. One interpretation of PVI is based on the assumption that price action on higher Volume days is driven largely by the "uninformed public" (rising volume indicates the public has entered the market). Therefore, relative changes in the PVI reflect the movement of "naive money."
!
Period. Enter the time period for the Volume and Closes comparison. Normally 1.
Display. You can plot the indicator, a moving average of the indicator, or the difference between the two.
! Price Overlay
Comparison Overlays: Price Overlay adds the price plot of another security to the current chart. You can choose to add a Bars or Line plot, and can (optionally) adjust the overlaid price plot such that the Closing price for the overlay security is equal to the Closing price of the base security as of a specified date. This can aid in viewing relative performance of the two securities from the specified date, forward in time.
Price Overlays are commonly added both in separate Panes, or as overlays to an existing Pane. By default, a new Price Overlay plot is added with its own Price (Y) Axis. To merge the Price Overlay plot into an existing price scale, drag the Price Overlay plot onto the Price (Y) Axis of the base security.
!123

!
Ticker, Type. Enter the Ticker Symbol and Type of security to overlay.
Normalization. You can adjust the overlaid price data such that the Closing price for the overlay security is equal to the Closing price of the base security as of a specified date.
Bars. Choose this button to add a Bars plot.
Line. Choose this button to add a Line plot.
The settings at the bottom are used to configure the display options and are identical to the options for Bars and Data Lines.
! Price Volume Trend
Price Volume Trend (PVT) attempts to show the volume flow into or out of a security. PVT is a cumulative summation of Volume, adjusted by the magnitude of the security's price change:
PVT = PVT + Volume x (Today's Close - Previous Close) / Previous Close)
PVT is normally plotted in its own Pane, and can be interpreted in much the same way as the Accumulation/Distribution indicator.
!
Period. Enter the period for the Closes comparison and Volume summation. Normally 1.
Display. You can plot the indicator, a moving average of the indicator, or the difference between the two.
!124
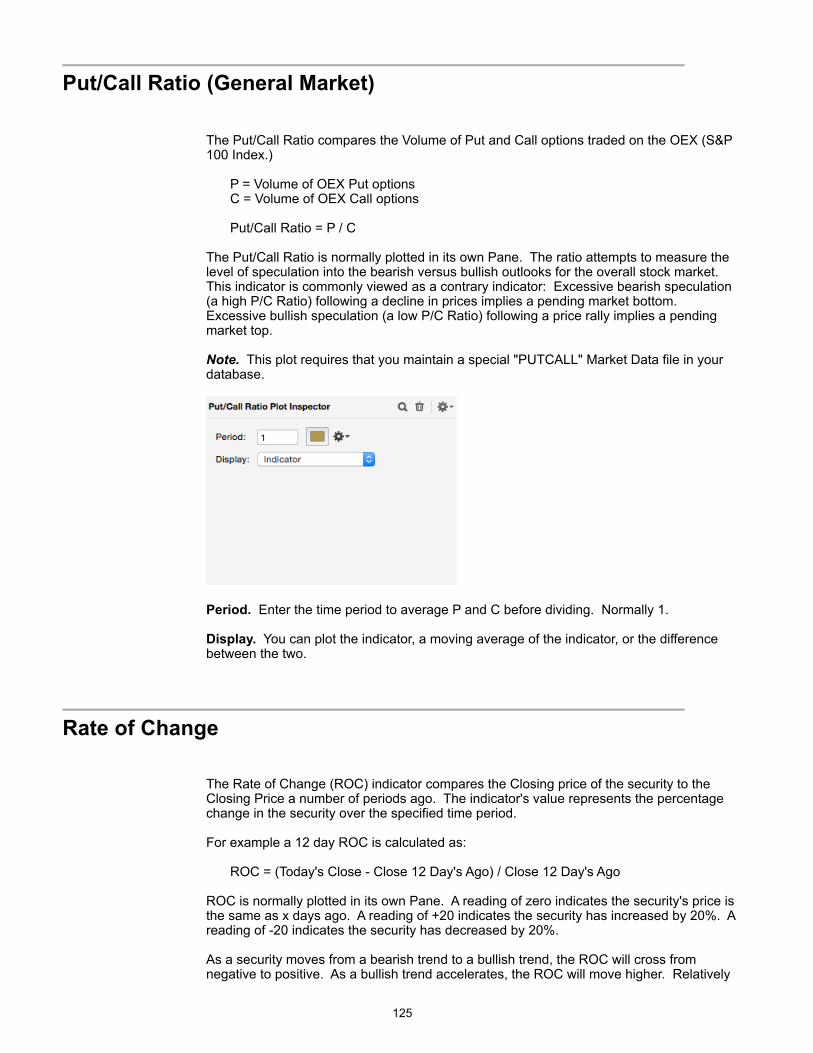
! Put/Call Ratio (General Market)
The Put/Call Ratio compares the Volume of Put and Call options traded on the OEX (S&P 100 Index.)
P = Volume of OEX Put options C = Volume of OEX Call options
Put/Call Ratio = P / C
The Put/Call Ratio is normally plotted in its own Pane. The ratio attempts to measure the level of speculation into the bearish versus bullish outlooks for the overall stock market. This indicator is commonly viewed as a contrary indicator: Excessive bearish speculation (a high P/C Ratio) following a decline in prices implies a pending market bottom. Excessive bullish speculation (a low P/C Ratio) following a price rally implies a pending market top.
Note. This plot requires that you maintain a special "PUTCALL" Market Data file in your database.
!
Period. Enter the time period to average P and C before dividing. Normally 1.
Display. You can plot the indicator, a moving average of the indicator, or the difference between the two.
! Rate of Change
The Rate of Change (ROC) indicator compares the Closing price of the security to the Closing Price a number of periods ago. The indicator's value represents the percentage change in the security over the specified time period.
For example a 12 day ROC is calculated as:
ROC = (Today's Close - Close 12 Day's Ago) / Close 12 Day's Ago
ROC is normally plotted in its own Pane. A reading of zero indicates the security's price is the same as x days ago. A reading of +20 indicates the security has increased by 20%. A reading of -20 indicates the security has decreased by 20%.
As a security moves from a bearish trend to a bullish trend, the ROC will cross from negative to positive. As a bullish trend accelerates, the ROC will move higher. Relatively
!125
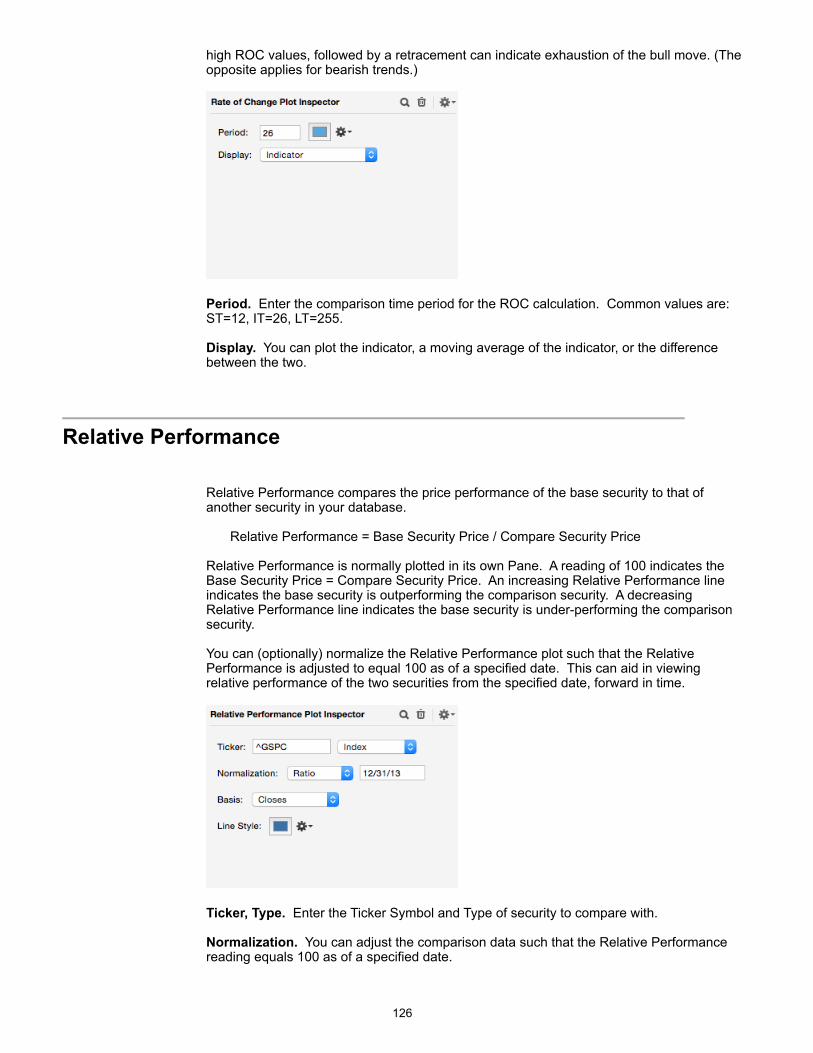
high ROC values, followed by a retracement can indicate exhaustion of the bull move. (The opposite applies for bearish trends.)
!
Period. Enter the comparison time period for the ROC calculation. Common values are: ST=12, IT=26, LT=255.
Display. You can plot the indicator, a moving average of the indicator, or the difference between the two.
!Relative Performance
Relative Performance compares the price performance of the base security to that of another security in your database.
Relative Performance = Base Security Price / Compare Security Price
Relative Performance is normally plotted in its own Pane. A reading of 100 indicates the Base Security Price = Compare Security Price. An increasing Relative Performance line indicates the base security is outperforming the comparison security. A decreasing Relative Performance line indicates the base security is under-performing the comparison security.
You can (optionally) normalize the Relative Performance plot such that the Relative Performance is adjusted to equal 100 as of a specified date. This can aid in viewing relative performance of the two securities from the specified date, forward in time.
!
Ticker, Type. Enter the Ticker Symbol and Type of security to compare with.
Normalization. You can adjust the comparison data such that the Relative Performance reading equals 100 as of a specified date.
!126
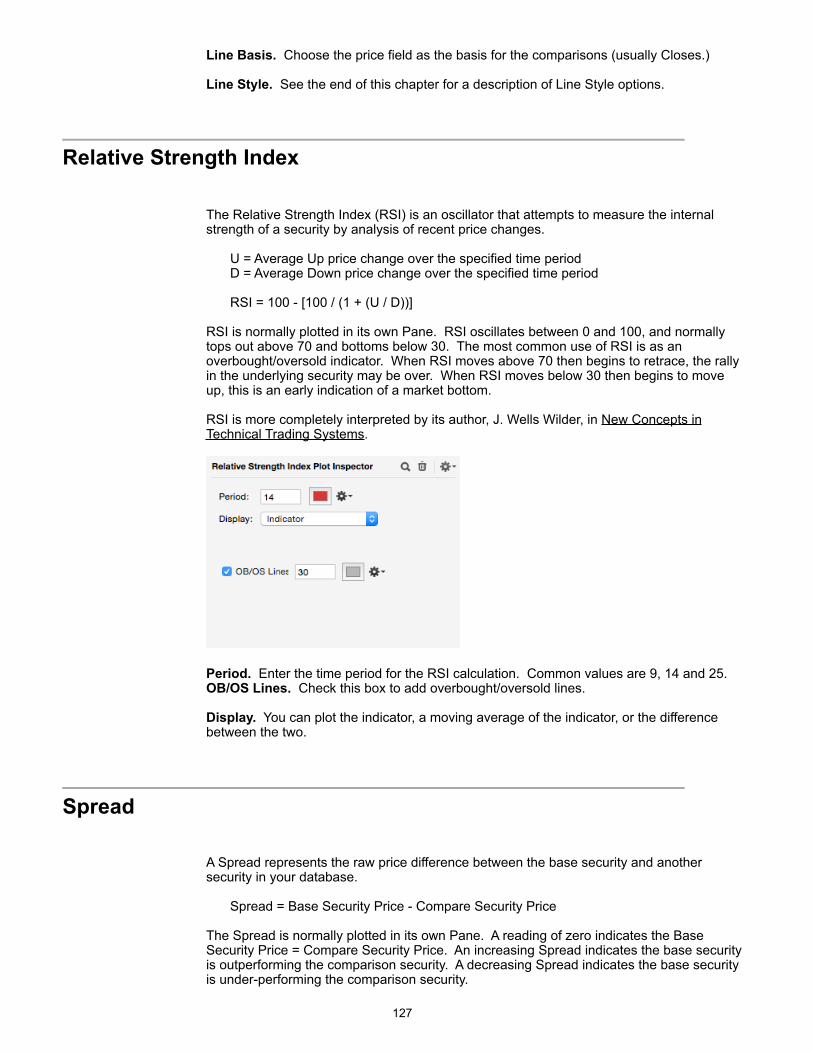
Line Basis. Choose the price field as the basis for the comparisons (usually Closes.)
Line Style. See the end of this chapter for a description of Line Style options.
!Relative Strength Index
The Relative Strength Index (RSI) is an oscillator that attempts to measure the internal strength of a security by analysis of recent price changes.
U = Average Up price change over the specified time period D = Average Down price change over the specified time period
RSI = 100 - [100 / (1 + (U / D))]
RSI is normally plotted in its own Pane. RSI oscillates between 0 and 100, and normally tops out above 70 and bottoms below 30. The most common use of RSI is as an overbought/oversold indicator. When RSI moves above 70 then begins to retrace, the rally in the underlying security may be over. When RSI moves below 30 then begins to move up, this is an early indication of a market bottom.
RSI is more completely interpreted by its author, J. Wells Wilder, in New Concepts in Technical Trading Systems.
!
Period. Enter the time period for the RSI calculation. Common values are 9, 14 and 25. OB/OS Lines. Check this box to add overbought/oversold lines.
Display. You can plot the indicator, a moving average of the indicator, or the difference between the two.
!Spread
A Spread represents the raw price difference between the base security and another security in your database.
Spread = Base Security Price - Compare Security Price
The Spread is normally plotted in its own Pane. A reading of zero indicates the Base Security Price = Compare Security Price. An increasing Spread indicates the base security is outperforming the comparison security. A decreasing Spread indicates the base security is under-performing the comparison security.
!127
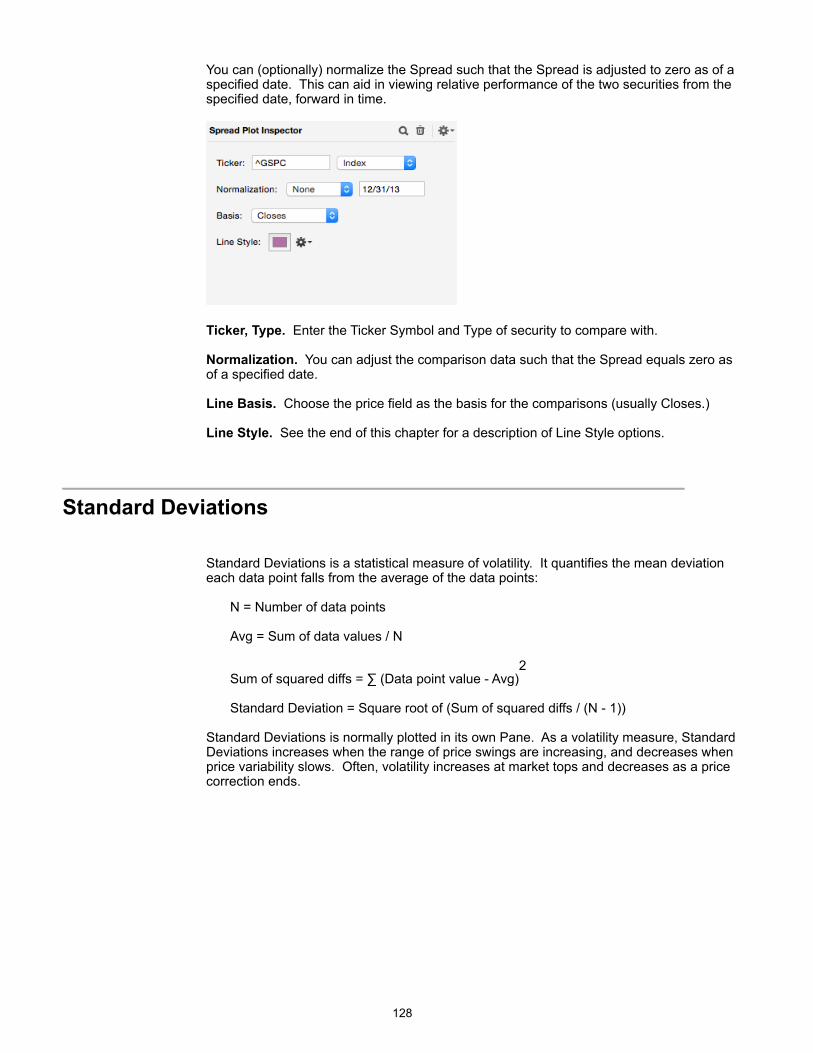
You can (optionally) normalize the Spread such that the Spread is adjusted to zero as of a specified date. This can aid in viewing relative performance of the two securities from the specified date, forward in time.
!
Ticker, Type. Enter the Ticker Symbol and Type of security to compare with.
Normalization. You can adjust the comparison data such that the Spread equals zero as of a specified date.
Line Basis. Choose the price field as the basis for the comparisons (usually Closes.)
Line Style. See the end of this chapter for a description of Line Style options.
!Standard Deviations
Standard Deviations is a statistical measure of volatility. It quantifies the mean deviation each data point falls from the average of the data points:
N = Number of data points
Avg = Sum of data values / N
Sum of squared diffs = ∑ (Data point value - Avg)2
Standard Deviation = Square root of (Sum of squared diffs / (N - 1))
Standard Deviations is normally plotted in its own Pane. As a volatility measure, Standard Deviations increases when the range of price swings are increasing, and decreases when price variability slows. Often, volatility increases at market tops and decreases as a price correction ends.
!128
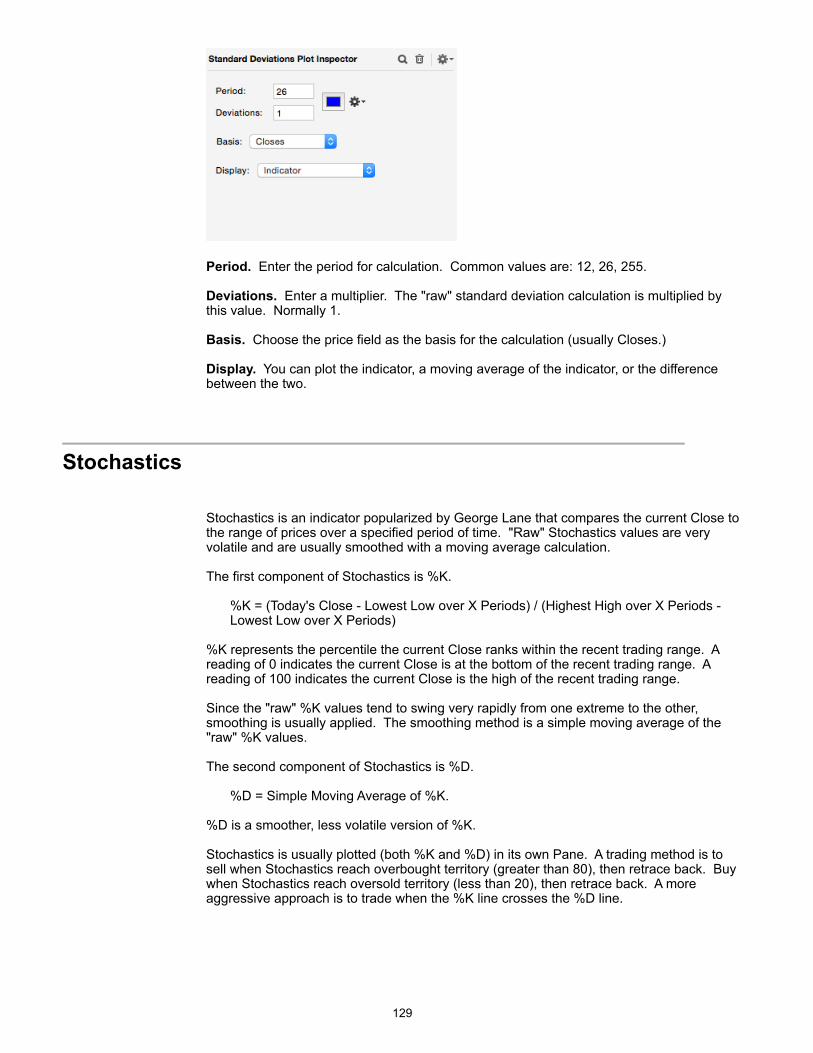
!
Period. Enter the period for calculation. Common values are: 12, 26, 255.
Deviations. Enter a multiplier. The "raw" standard deviation calculation is multiplied by this value. Normally 1.
Basis. Choose the price field as the basis for the calculation (usually Closes.)
Display. You can plot the indicator, a moving average of the indicator, or the difference between the two.
!Stochastics
Stochastics is an indicator popularized by George Lane that compares the current Close to the range of prices over a specified period of time. "Raw" Stochastics values are very volatile and are usually smoothed with a moving average calculation.
The first component of Stochastics is %K.
%K = (Today's Close - Lowest Low over X Periods) / (Highest High over X Periods - Lowest Low over X Periods)
%K represents the percentile the current Close ranks within the recent trading range. A reading of 0 indicates the current Close is at the bottom of the recent trading range. A reading of 100 indicates the current Close is the high of the recent trading range.
Since the "raw" %K values tend to swing very rapidly from one extreme to the other, smoothing is usually applied. The smoothing method is a simple moving average of the "raw" %K values.
The second component of Stochastics is %D.
%D = Simple Moving Average of %K.
%D is a smoother, less volatile version of %K.
Stochastics is usually plotted (both %K and %D) in its own Pane. A trading method is to sell when Stochastics reach overbought territory (greater than 80), then retrace back. Buy when Stochastics reach oversold territory (less than 20), then retrace back. A more aggressive approach is to trade when the %K line crosses the %D line.
!129
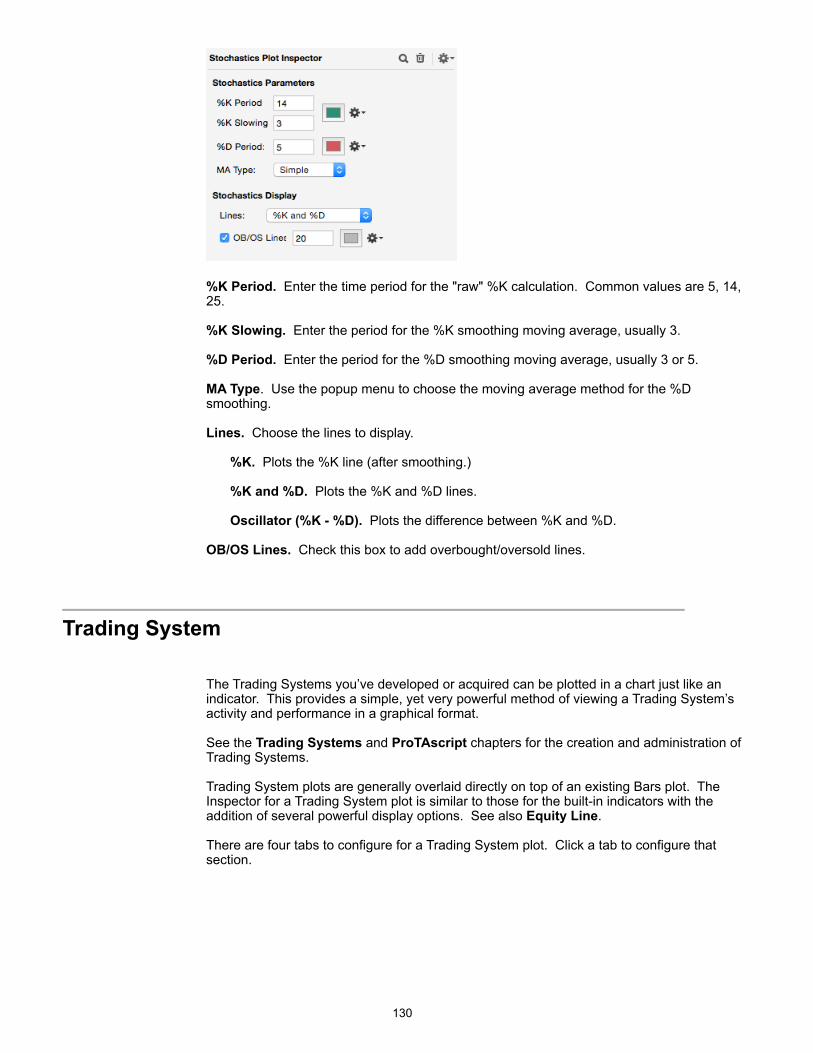
!
%K Period. Enter the time period for the "raw" %K calculation. Common values are 5, 14, 25.
%K Slowing. Enter the period for the %K smoothing moving average, usually 3.
%D Period. Enter the period for the %D smoothing moving average, usually 3 or 5.
MA Type. Use the popup menu to choose the moving average method for the %D smoothing.
Lines. Choose the lines to display.
%K. Plots the %K line (after smoothing.)
%K and %D. Plots the %K and %D lines.
Oscillator (%K - %D). Plots the difference between %K and %D.
OB/OS Lines. Check this box to add overbought/oversold lines.
!Trading System
The Trading Systems you’ve developed or acquired can be plotted in a chart just like an indicator. This provides a simple, yet very powerful method of viewing a Trading System’s activity and performance in a graphical format.
See the Trading Systems and ProTAscript chapters for the creation and administration of Trading Systems.
Trading System plots are generally overlaid directly on top of an existing Bars plot. The Inspector for a Trading System plot is similar to those for the built-in indicators with the addition of several powerful display options. See also Equity Line.
There are four tabs to configure for a Trading System plot. Click a tab to configure that section.
!130
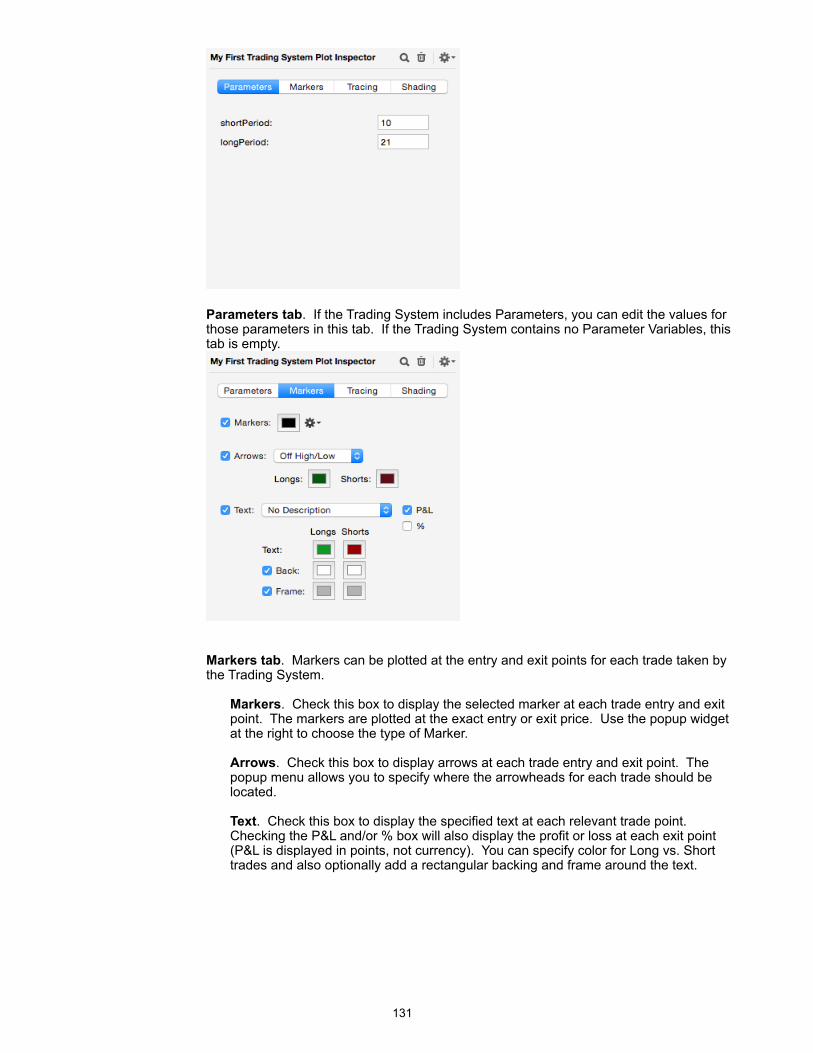
!
Parameters tab. If the Trading System includes Parameters, you can edit the values for those parameters in this tab. If the Trading System contains no Parameter Variables, this tab is empty.
!
Markers tab. Markers can be plotted at the entry and exit points for each trade taken by the Trading System.
Markers. Check this box to display the selected marker at each trade entry and exit point. The markers are plotted at the exact entry or exit price. Use the popup widget at the right to choose the type of Marker.
Arrows. Check this box to display arrows at each trade entry and exit point. The popup menu allows you to specify where the arrowheads for each trade should be located.
Text. Check this box to display the specified text at each relevant trade point. Checking the P&L and/or % box will also display the profit or loss at each exit point (P&L is displayed in points, not currency). You can specify color for Long vs. Short trades and also optionally add a rectangular backing and frame around the text.
!131
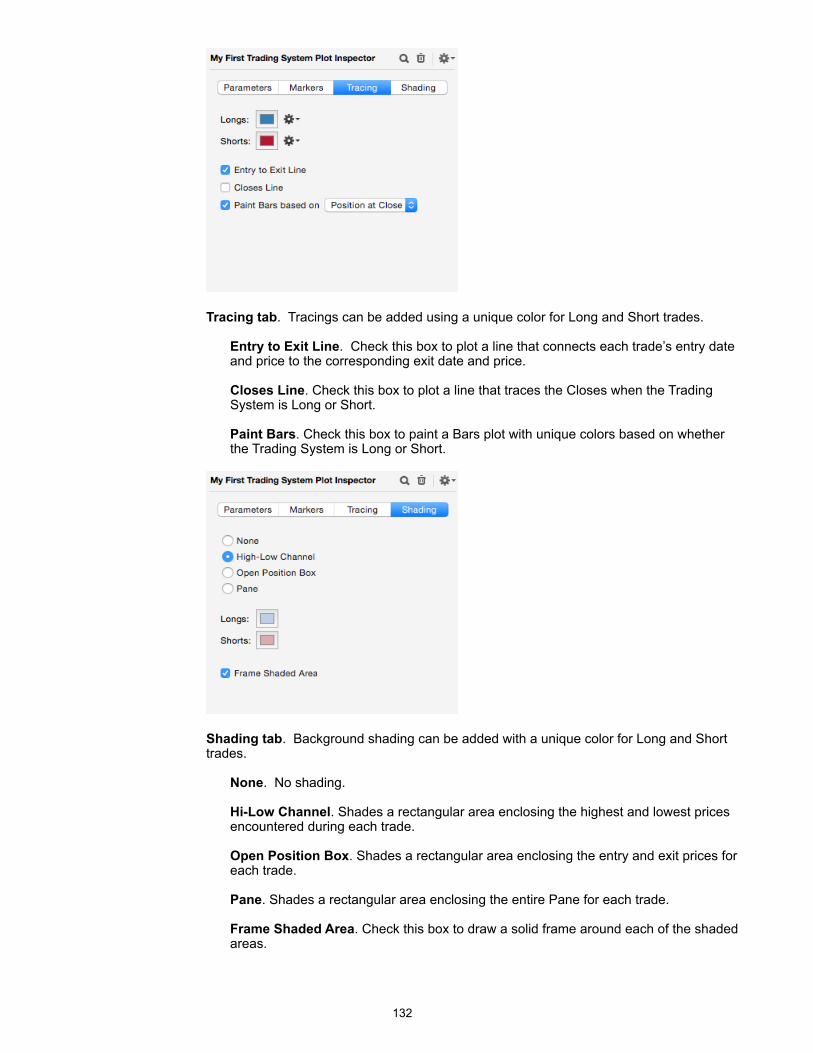
!
Tracing tab. Tracings can be added using a unique color for Long and Short trades.
Entry to Exit Line. Check this box to plot a line that connects each trade’s entry date and price to the corresponding exit date and price.
Closes Line. Check this box to plot a line that traces the Closes when the Trading System is Long or Short.
Paint Bars. Check this box to paint a Bars plot with unique colors based on whether the Trading System is Long or Short.
!
Shading tab. Background shading can be added with a unique color for Long and Short trades.
None. No shading.
Hi-Low Channel. Shades a rectangular area enclosing the highest and lowest prices encountered during each trade.
Open Position Box. Shades a rectangular area enclosing the entry and exit prices for each trade.
Pane. Shades a rectangular area enclosing the entire Pane for each trade.
Frame Shaded Area. Check this box to draw a solid frame around each of the shaded areas.
!132
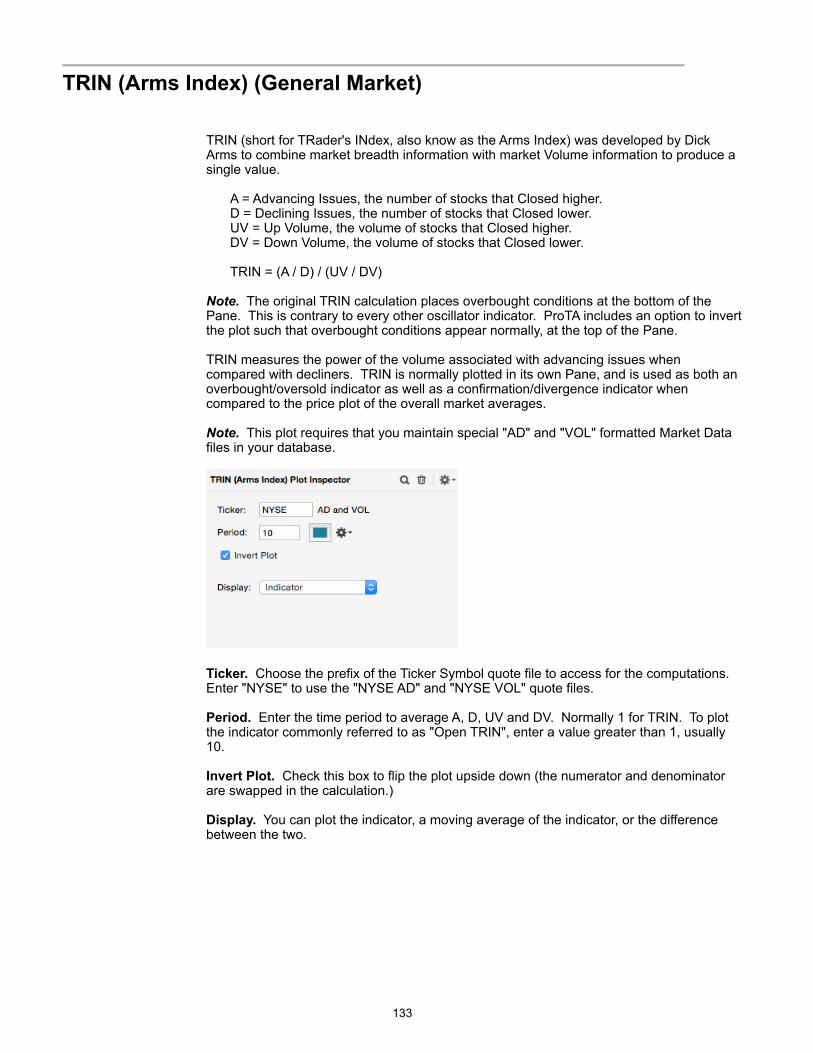
! TRIN (Arms Index) (General Market)
TRIN (short for TRader's INdex, also know as the Arms Index) was developed by Dick Arms to combine market breadth information with market Volume information to produce a single value.
A = Advancing Issues, the number of stocks that Closed higher. D = Declining Issues, the number of stocks that Closed lower. UV = Up Volume, the volume of stocks that Closed higher. DV = Down Volume, the volume of stocks that Closed lower.
TRIN = (A / D) / (UV / DV)
Note. The original TRIN calculation places overbought conditions at the bottom of the Pane. This is contrary to every other oscillator indicator. ProTA includes an option to invert the plot such that overbought conditions appear normally, at the top of the Pane.
TRIN measures the power of the volume associated with advancing issues when compared with decliners. TRIN is normally plotted in its own Pane, and is used as both an overbought/oversold indicator as well as a confirmation/divergence indicator when compared to the price plot of the overall market averages.
Note. This plot requires that you maintain special "AD" and "VOL" formatted Market Data files in your database.
!
Ticker. Choose the prefix of the Ticker Symbol quote file to access for the computations. Enter "NYSE" to use the "NYSE AD" and "NYSE VOL" quote files.
Period. Enter the time period to average A, D, UV and DV. Normally 1 for TRIN. To plot the indicator commonly referred to as "Open TRIN", enter a value greater than 1, usually 10.
Invert Plot. Check this box to flip the plot upside down (the numerator and denominator are swapped in the calculation.)
Display. You can plot the indicator, a moving average of the indicator, or the difference between the two.
!133
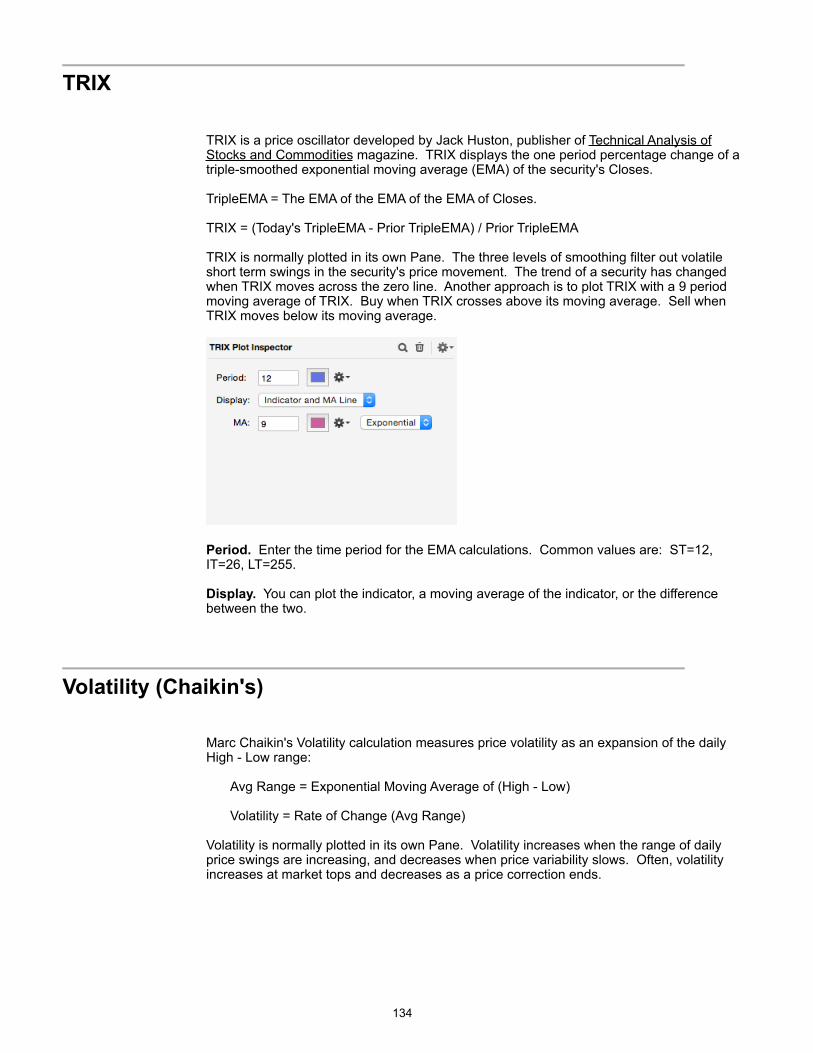
! TRIX
TRIX is a price oscillator developed by Jack Huston, publisher of Technical Analysis of Stocks and Commodities magazine. TRIX displays the one period percentage change of a triple-smoothed exponential moving average (EMA) of the security's Closes.
TripleEMA = The EMA of the EMA of the EMA of Closes.
TRIX = (Today's TripleEMA - Prior TripleEMA) / Prior TripleEMA
TRIX is normally plotted in its own Pane. The three levels of smoothing filter out volatile short term swings in the security's price movement. The trend of a security has changed when TRIX moves across the zero line. Another approach is to plot TRIX with a 9 period moving average of TRIX. Buy when TRIX crosses above its moving average. Sell when TRIX moves below its moving average.
!
Period. Enter the time period for the EMA calculations. Common values are: ST=12, IT=26, LT=255.
Display. You can plot the indicator, a moving average of the indicator, or the difference between the two.
!Volatility (Chaikin's)
Marc Chaikin's Volatility calculation measures price volatility as an expansion of the daily High - Low range:
Avg Range = Exponential Moving Average of (High - Low)
Volatility = Rate of Change (Avg Range)
Volatility is normally plotted in its own Pane. Volatility increases when the range of daily price swings are increasing, and decreases when price variability slows. Often, volatility increases at market tops and decreases as a price correction ends.
!134
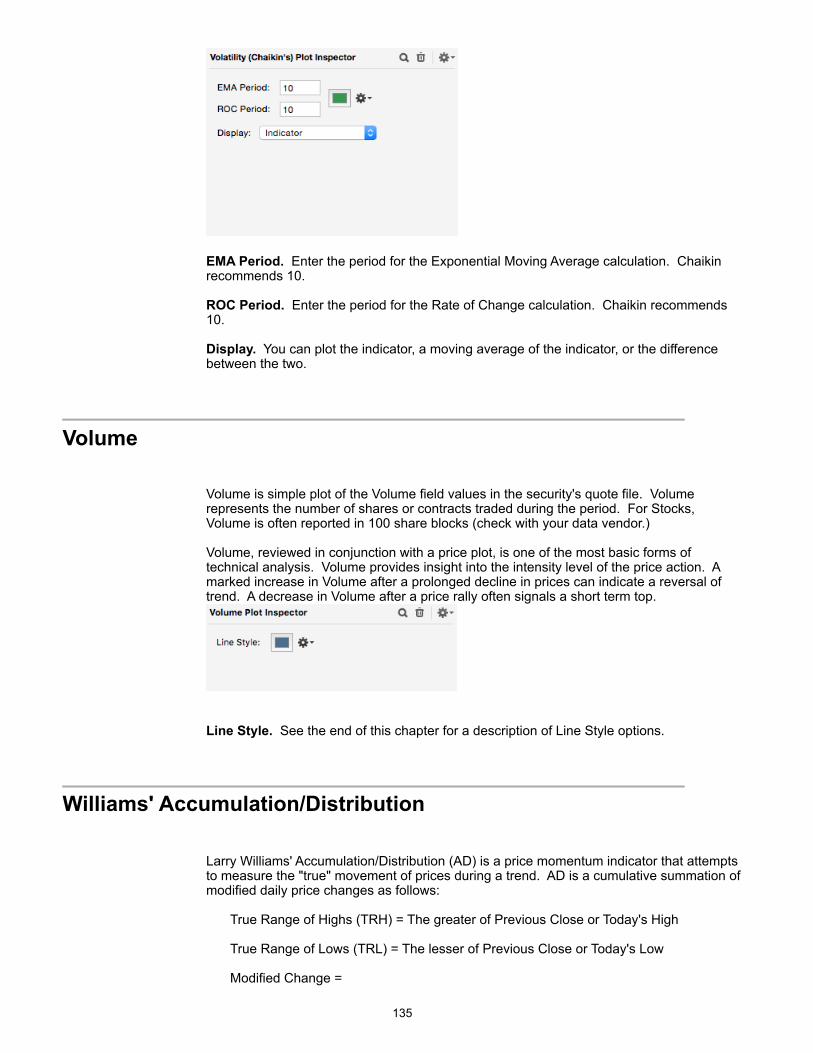
!
EMA Period. Enter the period for the Exponential Moving Average calculation. Chaikin recommends 10.
ROC Period. Enter the period for the Rate of Change calculation. Chaikin recommends 10.
Display. You can plot the indicator, a moving average of the indicator, or the difference between the two.
!Volume
Volume is simple plot of the Volume field values in the security's quote file. Volume represents the number of shares or contracts traded during the period. For Stocks, Volume is often reported in 100 share blocks (check with your data vendor.)
Volume, reviewed in conjunction with a price plot, is one of the most basic forms of technical analysis. Volume provides insight into the intensity level of the price action. A marked increase in Volume after a prolonged decline in prices can indicate a reversal of trend. A decrease in Volume after a price rally often signals a short term top.
!
Line Style. See the end of this chapter for a description of Line Style options.
!Williams' Accumulation/Distribution
Larry Williams' Accumulation/Distribution (AD) is a price momentum indicator that attempts to measure the "true" movement of prices during a trend. AD is a cumulative summation of modified daily price changes as follows:
True Range of Highs (TRH) = The greater of Previous Close or Today's High
True Range of Lows (TRL) = The lesser of Previous Close or Today's Low
Modified Change =
!135

Today's Close - TRL, if Today's Close is greater than Yesterday's Close
Today's Close - TRH, if Today's Close is less than Yesterday's Close
0, if Today's Close is equal to Yesterday's Close
AD = Previous AD + Modified Change
Williams' AD is normally plotted in its own Pane. The shape of the AD plot closely follows the shape of the security's price plot. Divergences can be noted by comparing new highs/lows in the AD plot versus new highs/lows in the security's price plot. Distribution of the security (a potential top) is indicated when the AD plot makes a new local high, but the security does not. Accumulation of the security (a potential bottom) is indicated when the AD plot makes a new local low, but the security does not.
!
Line Style. See the end of this chapter for a description of Line Style options.
Display. You can plot the indicator, a moving average of the indicator, or the difference between the two.
!Williams' %R
Larry Williams' %R (% Range) is a simple price oscillator that relates the current Close to the range of prices over a specified period. %R is nearly identical to the "raw" %K component of Stochastics.
Note. Williams' formula for %R places overbought conditions at the bottom of the Pane. This is contrary to every other oscillator indicator. ProTA's %R calculation modifies Williams' original and is inverted such that overbought conditions appear normally, at the top of the Pane.
%R = (Today's Close - Lowest Low over X Periods) / (Highest High over X Periods - Lowest Low over X Periods)
%R is normally plotted in its own Pane. See Stochastics for interpretations.
!136

!
Period. Enter the time period for the range calculations. Common values are: 12, 26, 255.
OB/OS Lines. Check this box to add overbought/oversold lines.
Display. You can plot the indicator, a moving average of the indicator, or the difference between the two.
! Zig Zag
Zig Zag completely filters out (ignores) price moves that are less than a specified percentage or number of points. The Zig Zag indicator connects the major sequential highs and lows in the security's price action.
A major high is set when the security makes a local high that is followed by a correction of at least X (Pts or %), before another new high is set.
A major low is set when the security makes a local low that is followed by a rally of at least X (Pts or %), before another new low is set.
Zig Zag is normally overlaid onto a price plot and is used to highlight the major rallies and corrections in the security's price movement.
!
Reversal Amount. Enter the threshold to define "major" highs or lows. The impact of this value will vary with each security, but a general guideline for major market moves is a 10% to 20% threshold.
Examine. Choose Closes to determine local highs and lows based only on the security's Closes field. Choose Highs & Lows to examine the High and Low fields.
Line Style. See the end of this chapter for a description of Line Style options.
!137
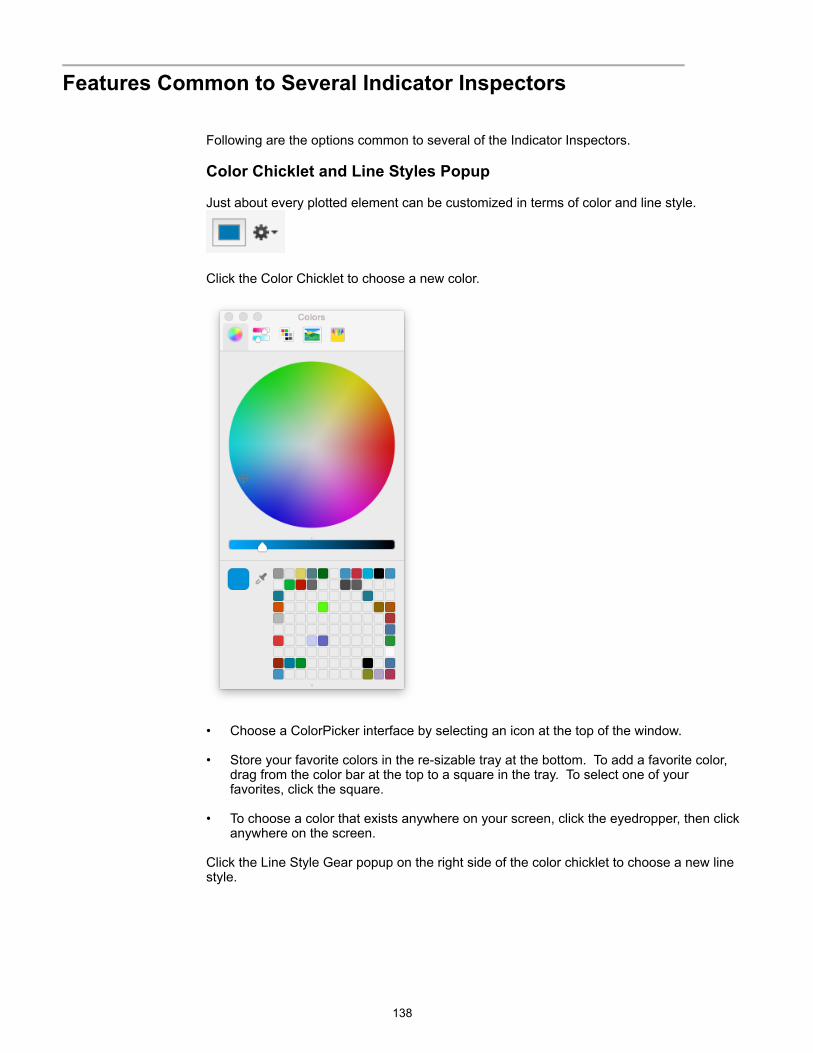
! Features Common to Several Indicator Inspectors
Following are the options common to several of the Indicator Inspectors.
Color Chicklet and Line Styles Popup
Just about every plotted element can be customized in terms of color and line style.
!
Click the Color Chicklet to choose a new color.
!
• Choose a ColorPicker interface by selecting an icon at the top of the window.
• Store your favorite colors in the re-sizable tray at the bottom. To add a favorite color, drag from the color bar at the top to a square in the tray. To select one of your favorites, click the square.
• To choose a color that exists anywhere on your screen, click the eyedropper, then click anywhere on the screen.
Click the Line Style Gear popup on the right side of the color chicklet to choose a new line style.
!138
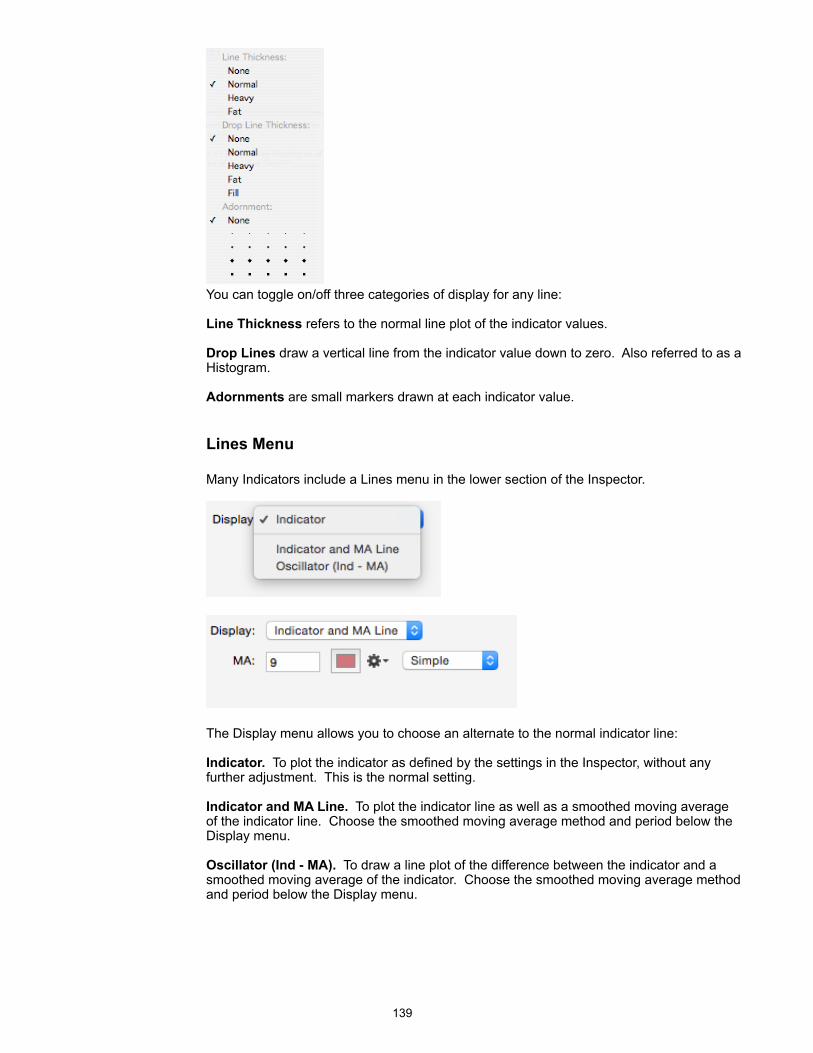
! You can toggle on/off three categories of display for any line:
Line Thickness refers to the normal line plot of the indicator values.
Drop Lines draw a vertical line from the indicator value down to zero. Also referred to as a Histogram.
Adornments are small markers drawn at each indicator value.
Lines Menu
Many Indicators include a Lines menu in the lower section of the Inspector.
!
!
The Display menu allows you to choose an alternate to the normal indicator line:
Indicator. To plot the indicator as defined by the settings in the Inspector, without any further adjustment. This is the normal setting.
Indicator and MA Line. To plot the indicator line as well as a smoothed moving average of the indicator line. Choose the smoothed moving average method and period below the Display menu.
Oscillator (Ind - MA). To draw a line plot of the difference between the indicator and a smoothed moving average of the indicator. Choose the smoothed moving average method and period below the Display menu.
!139
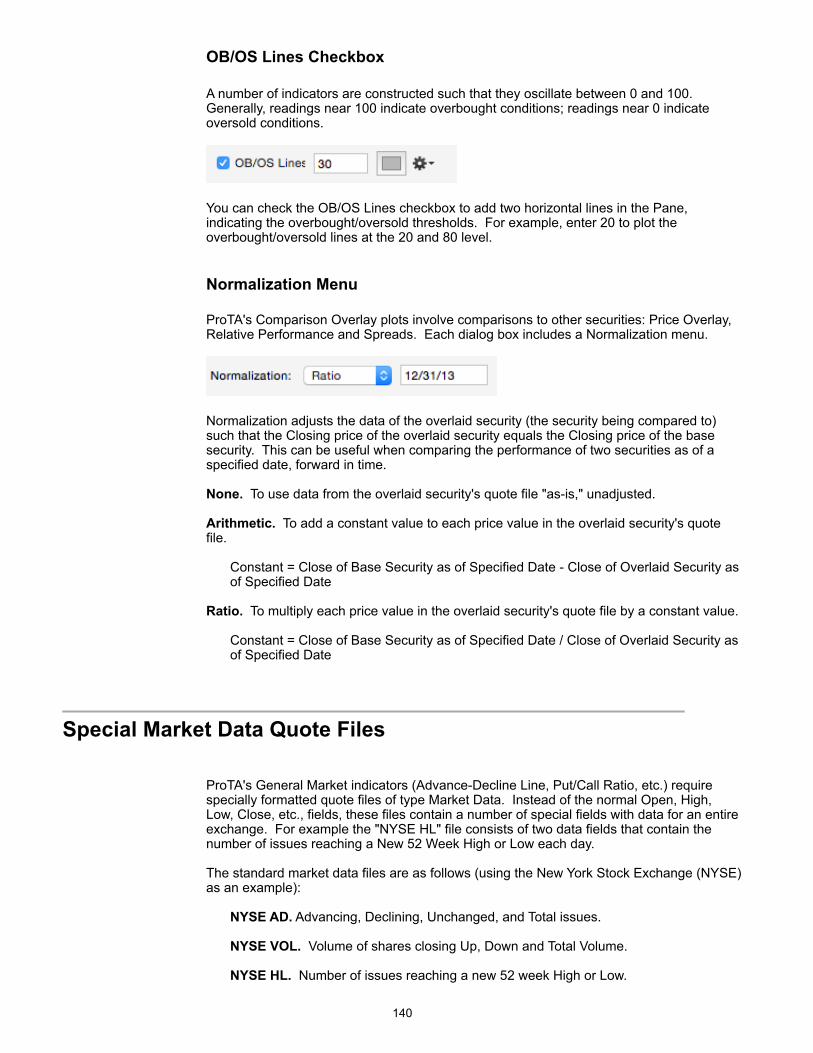
OB/OS Lines Checkbox
A number of indicators are constructed such that they oscillate between 0 and 100. Generally, readings near 100 indicate overbought conditions; readings near 0 indicate oversold conditions.
!
You can check the OB/OS Lines checkbox to add two horizontal lines in the Pane, indicating the overbought/oversold thresholds. For example, enter 20 to plot the overbought/oversold lines at the 20 and 80 level.
Normalization Menu
ProTA's Comparison Overlay plots involve comparisons to other securities: Price Overlay, Relative Performance and Spreads. Each dialog box includes a Normalization menu.
!
Normalization adjusts the data of the overlaid security (the security being compared to) such that the Closing price of the overlaid security equals the Closing price of the base security. This can be useful when comparing the performance of two securities as of a specified date, forward in time.
None. To use data from the overlaid security's quote file "as-is," unadjusted.
Arithmetic. To add a constant value to each price value in the overlaid security's quote file.
Constant = Close of Base Security as of Specified Date - Close of Overlaid Security as of Specified Date
Ratio. To multiply each price value in the overlaid security's quote file by a constant value.
Constant = Close of Base Security as of Specified Date / Close of Overlaid Security as of Specified Date
!Special Market Data Quote Files
ProTA's General Market indicators (Advance-Decline Line, Put/Call Ratio, etc.) require specially formatted quote files of type Market Data. Instead of the normal Open, High, Low, Close, etc., fields, these files contain a number of special fields with data for an entire exchange. For example the "NYSE HL" file consists of two data fields that contain the number of issues reaching a New 52 Week High or Low each day.
The standard market data files are as follows (using the New York Stock Exchange (NYSE) as an example):
NYSE AD. Advancing, Declining, Unchanged, and Total issues.
NYSE VOL. Volume of shares closing Up, Down and Total Volume.
NYSE HL. Number of issues reaching a new 52 week High or Low.
!140
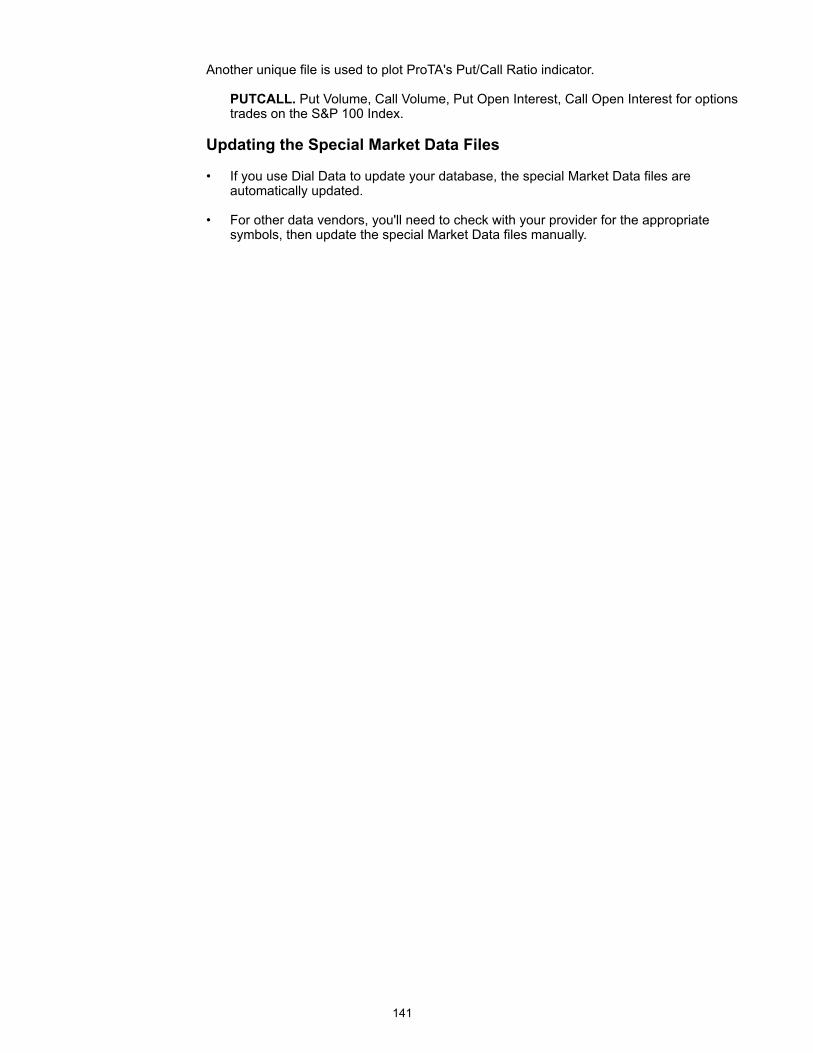
Another unique file is used to plot ProTA's Put/Call Ratio indicator.
PUTCALL. Put Volume, Call Volume, Put Open Interest, Call Open Interest for options trades on the S&P 100 Index.
Updating the Special Market Data Files
• If you use Dial Data to update your database, the special Market Data files are automatically updated.
• For other data vendors, you'll need to check with your provider for the appropriate symbols, then update the special Market Data files manually.
!141
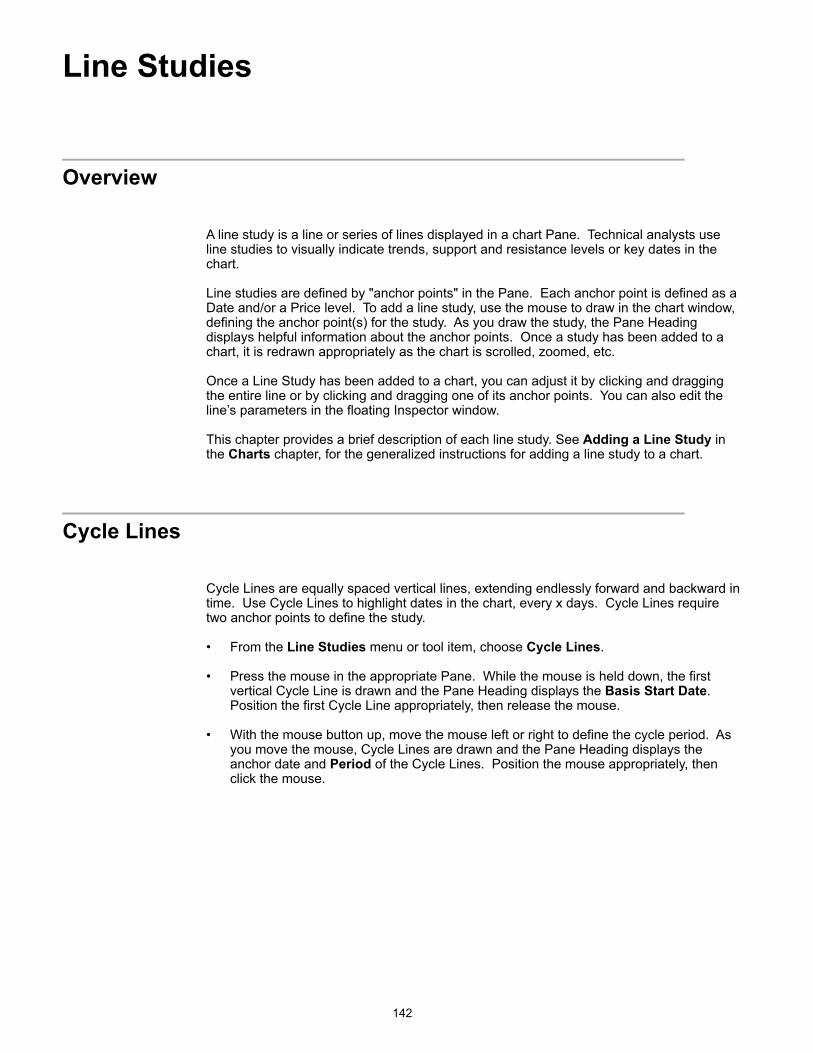
Line Studies
!Overview
A line study is a line or series of lines displayed in a chart Pane. Technical analysts use line studies to visually indicate trends, support and resistance levels or key dates in the chart.
Line studies are defined by "anchor points" in the Pane. Each anchor point is defined as a Date and/or a Price level. To add a line study, use the mouse to draw in the chart window, defining the anchor point(s) for the study. As you draw the study, the Pane Heading displays helpful information about the anchor points. Once a study has been added to a chart, it is redrawn appropriately as the chart is scrolled, zoomed, etc.
Once a Line Study has been added to a chart, you can adjust it by clicking and dragging the entire line or by clicking and dragging one of its anchor points. You can also edit the line’s parameters in the floating Inspector window.
This chapter provides a brief description of each line study. See Adding a Line Study in the Charts chapter, for the generalized instructions for adding a line study to a chart.
! Cycle Lines
Cycle Lines are equally spaced vertical lines, extending endlessly forward and backward in time. Use Cycle Lines to highlight dates in the chart, every x days. Cycle Lines require two anchor points to define the study.
• From the Line Studies menu or tool item, choose Cycle Lines.
• Press the mouse in the appropriate Pane. While the mouse is held down, the first vertical Cycle Line is drawn and the Pane Heading displays the Basis Start Date. Position the first Cycle Line appropriately, then release the mouse.
• With the mouse button up, move the mouse left or right to define the cycle period. As you move the mouse, Cycle Lines are drawn and the Pane Heading displays the anchor date and Period of the Cycle Lines. Position the mouse appropriately, then click the mouse.
!142
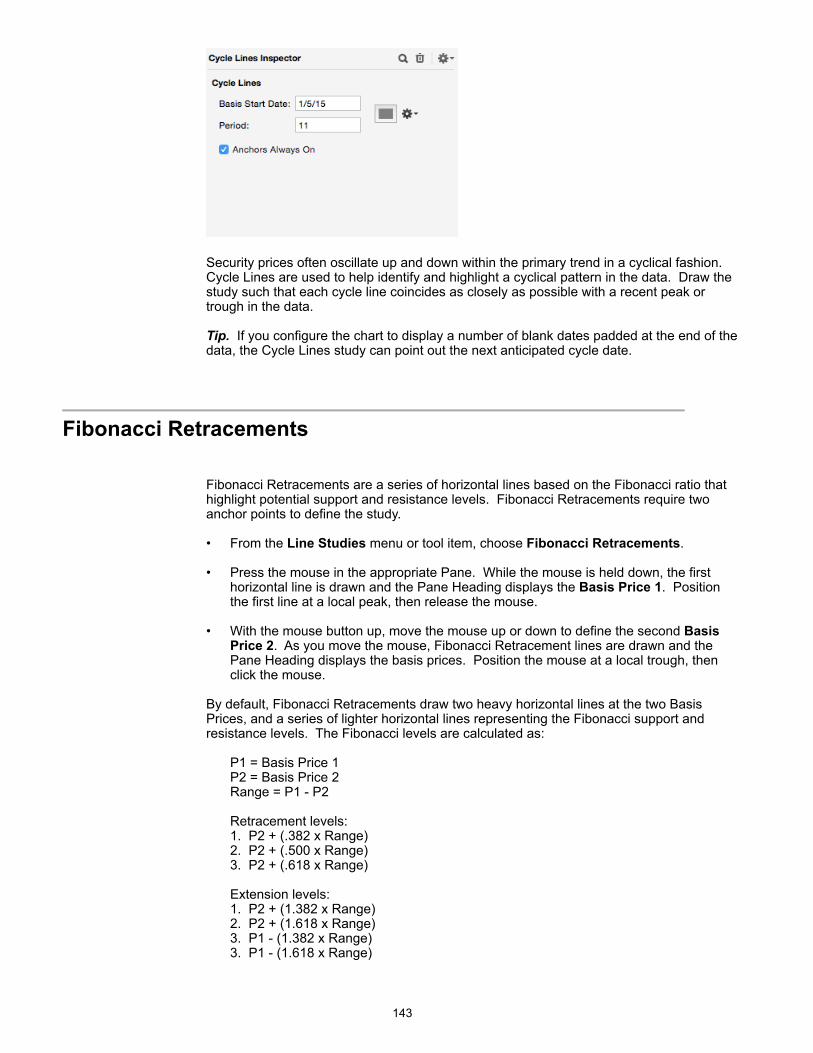
!
Security prices often oscillate up and down within the primary trend in a cyclical fashion. Cycle Lines are used to help identify and highlight a cyclical pattern in the data. Draw the study such that each cycle line coincides as closely as possible with a recent peak or trough in the data.
Tip. If you configure the chart to display a number of blank dates padded at the end of the data, the Cycle Lines study can point out the next anticipated cycle date.
!Fibonacci Retracements
Fibonacci Retracements are a series of horizontal lines based on the Fibonacci ratio that highlight potential support and resistance levels. Fibonacci Retracements require two anchor points to define the study.
• From the Line Studies menu or tool item, choose Fibonacci Retracements.
• Press the mouse in the appropriate Pane. While the mouse is held down, the first horizontal line is drawn and the Pane Heading displays the Basis Price 1. Position the first line at a local peak, then release the mouse.
• With the mouse button up, move the mouse up or down to define the second Basis Price 2. As you move the mouse, Fibonacci Retracement lines are drawn and the Pane Heading displays the basis prices. Position the mouse at a local trough, then click the mouse.
By default, Fibonacci Retracements draw two heavy horizontal lines at the two Basis Prices, and a series of lighter horizontal lines representing the Fibonacci support and resistance levels. The Fibonacci levels are calculated as:
P1 = Basis Price 1 P2 = Basis Price 2 Range = P1 - P2
Retracement levels: 1. P2 + (.382 x Range) 2. P2 + (.500 x Range) 3. P2 + (.618 x Range)
Extension levels: 1. P2 + (1.382 x Range) 2. P2 + (1.618 x Range) 3. P1 - (1.382 x Range) 3. P1 - (1.618 x Range)
!143
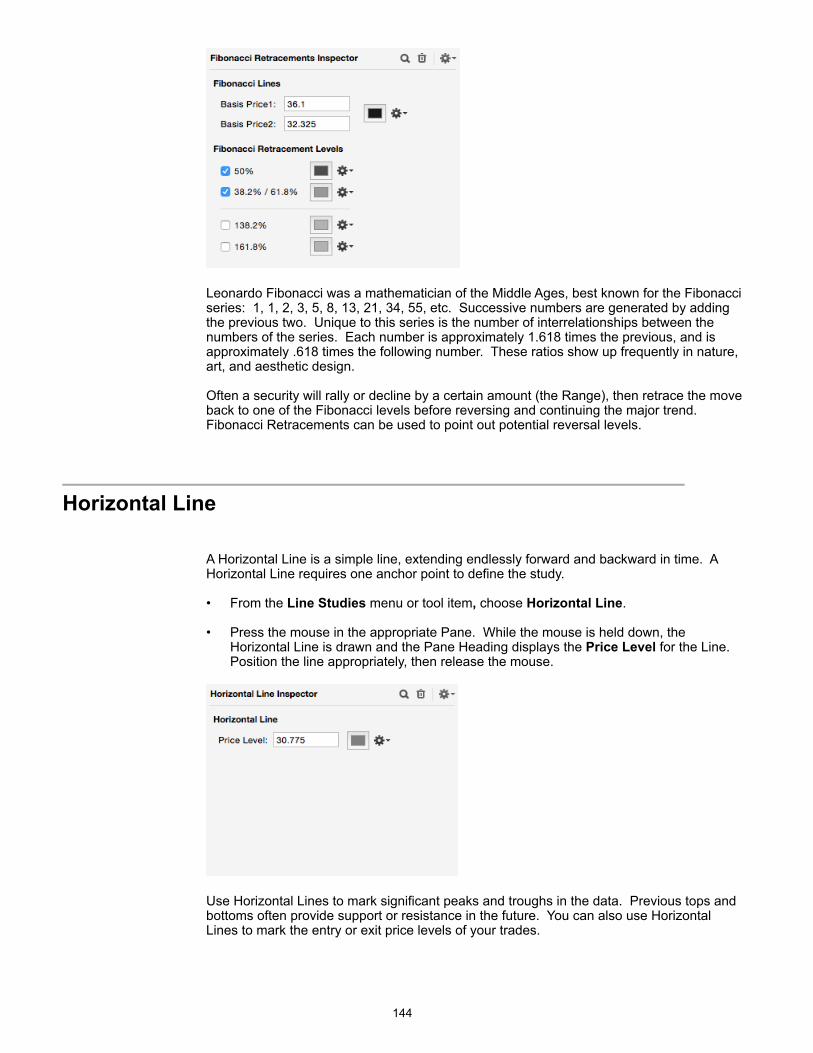
!
Leonardo Fibonacci was a mathematician of the Middle Ages, best known for the Fibonacci series: 1, 1, 2, 3, 5, 8, 13, 21, 34, 55, etc. Successive numbers are generated by adding the previous two. Unique to this series is the number of interrelationships between the numbers of the series. Each number is approximately 1.618 times the previous, and is approximately .618 times the following number. These ratios show up frequently in nature, art, and aesthetic design.
Often a security will rally or decline by a certain amount (the Range), then retrace the move back to one of the Fibonacci levels before reversing and continuing the major trend. Fibonacci Retracements can be used to point out potential reversal levels.
!Horizontal Line
A Horizontal Line is a simple line, extending endlessly forward and backward in time. A Horizontal Line requires one anchor point to define the study.
• From the Line Studies menu or tool item, choose Horizontal Line.
• Press the mouse in the appropriate Pane. While the mouse is held down, the Horizontal Line is drawn and the Pane Heading displays the Price Level for the Line. Position the line appropriately, then release the mouse.
!
Use Horizontal Lines to mark significant peaks and troughs in the data. Previous tops and bottoms often provide support or resistance in the future. You can also use Horizontal Lines to mark the entry or exit price levels of your trades.
!144
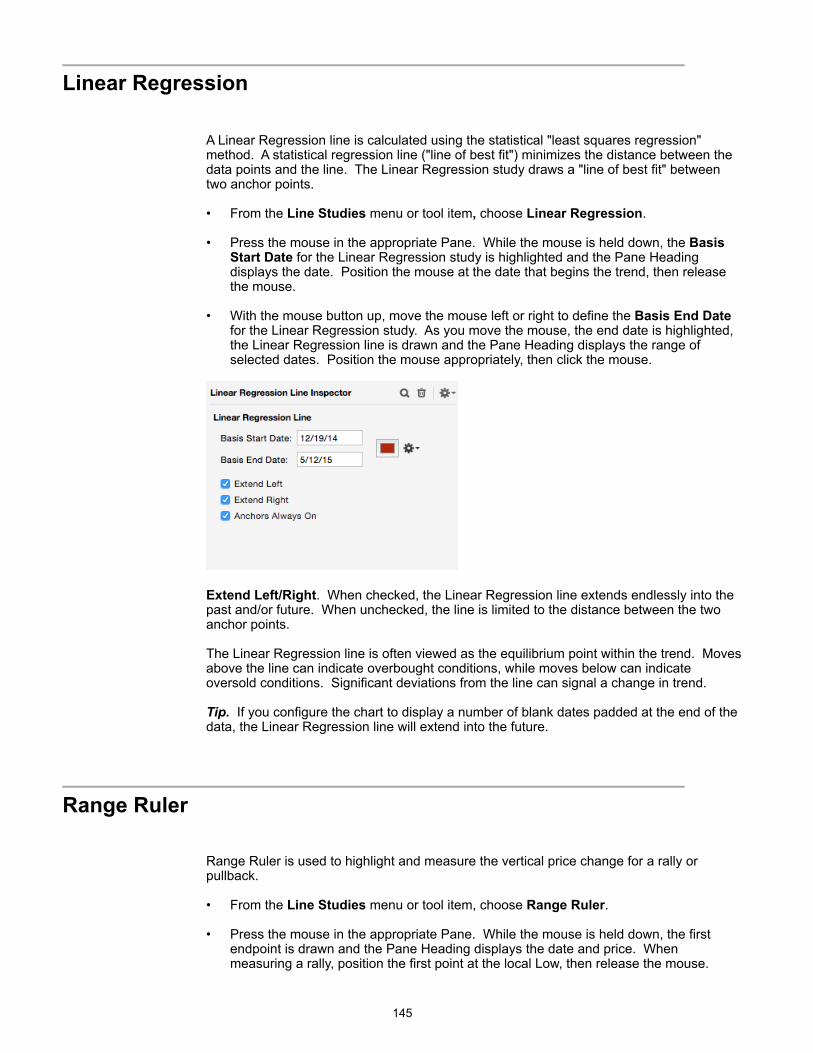
!Linear Regression
A Linear Regression line is calculated using the statistical "least squares regression" method. A statistical regression line ("line of best fit") minimizes the distance between the data points and the line. The Linear Regression study draws a "line of best fit" between two anchor points.
• From the Line Studies menu or tool item, choose Linear Regression.
• Press the mouse in the appropriate Pane. While the mouse is held down, the Basis Start Date for the Linear Regression study is highlighted and the Pane Heading displays the date. Position the mouse at the date that begins the trend, then release the mouse.
• With the mouse button up, move the mouse left or right to define the Basis End Date for the Linear Regression study. As you move the mouse, the end date is highlighted, the Linear Regression line is drawn and the Pane Heading displays the range of selected dates. Position the mouse appropriately, then click the mouse.
!
Extend Left/Right. When checked, the Linear Regression line extends endlessly into the past and/or future. When unchecked, the line is limited to the distance between the two anchor points.
The Linear Regression line is often viewed as the equilibrium point within the trend. Moves above the line can indicate overbought conditions, while moves below can indicate oversold conditions. Significant deviations from the line can signal a change in trend.
Tip. If you configure the chart to display a number of blank dates padded at the end of the data, the Linear Regression line will extend into the future.
!Range Ruler
Range Ruler is used to highlight and measure the vertical price change for a rally or pullback.
• From the Line Studies menu or tool item, choose Range Ruler.
• Press the mouse in the appropriate Pane. While the mouse is held down, the first endpoint is drawn and the Pane Heading displays the date and price. When measuring a rally, position the first point at the local Low, then release the mouse.
!145
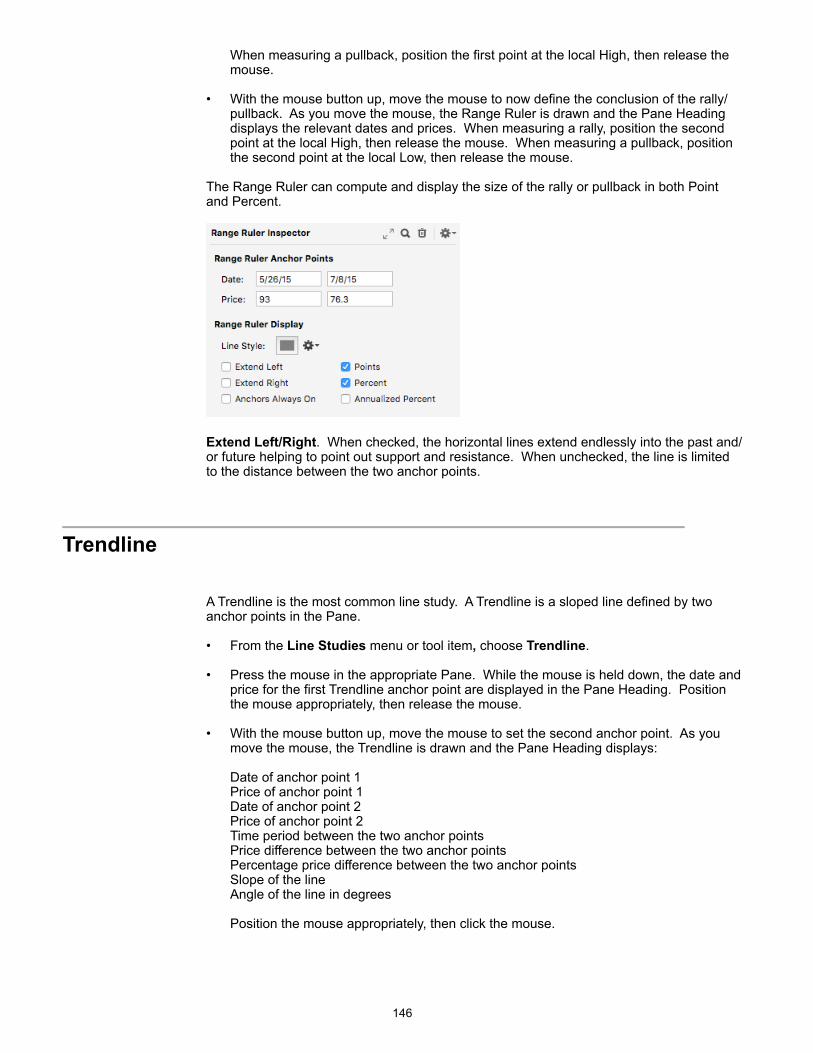
When measuring a pullback, position the first point at the local High, then release the mouse.
• With the mouse button up, move the mouse to now define the conclusion of the rally/pullback. As you move the mouse, the Range Ruler is drawn and the Pane Heading displays the relevant dates and prices. When measuring a rally, position the second point at the local High, then release the mouse. When measuring a pullback, position the second point at the local Low, then release the mouse.
The Range Ruler can compute and display the size of the rally or pullback in both Point and Percent.
!
Extend Left/Right. When checked, the horizontal lines extend endlessly into the past and/or future helping to point out support and resistance. When unchecked, the line is limited to the distance between the two anchor points.
!Trendline
A Trendline is the most common line study. A Trendline is a sloped line defined by two anchor points in the Pane.
• From the Line Studies menu or tool item, choose Trendline.
• Press the mouse in the appropriate Pane. While the mouse is held down, the date and price for the first Trendline anchor point are displayed in the Pane Heading. Position the mouse appropriately, then release the mouse.
• With the mouse button up, move the mouse to set the second anchor point. As you move the mouse, the Trendline is drawn and the Pane Heading displays:
Date of anchor point 1 Price of anchor point 1 Date of anchor point 2 Price of anchor point 2 Time period between the two anchor points Price difference between the two anchor points Percentage price difference between the two anchor points Slope of the line Angle of the line in degrees
Position the mouse appropriately, then click the mouse.
!146
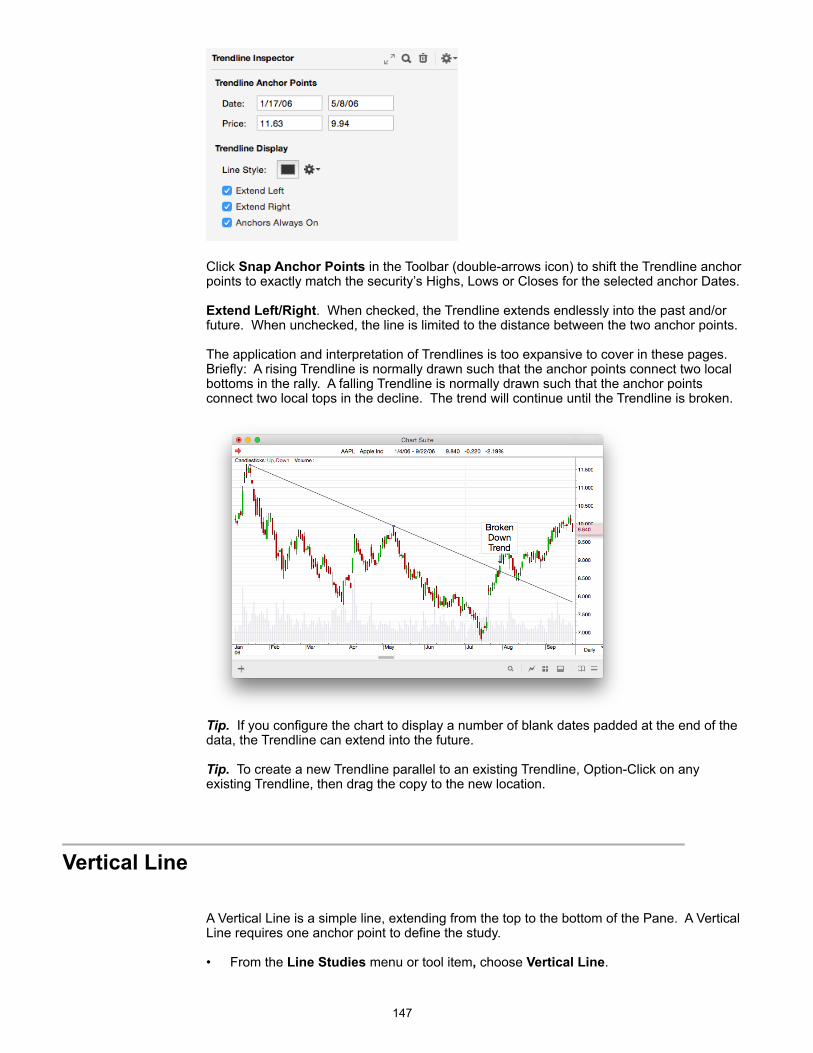
!
Click Snap Anchor Points in the Toolbar (double-arrows icon) to shift the Trendline anchor points to exactly match the security’s Highs, Lows or Closes for the selected anchor Dates.
Extend Left/Right. When checked, the Trendline extends endlessly into the past and/or future. When unchecked, the line is limited to the distance between the two anchor points.
The application and interpretation of Trendlines is too expansive to cover in these pages. Briefly: A rising Trendline is normally drawn such that the anchor points connect two local bottoms in the rally. A falling Trendline is normally drawn such that the anchor points connect two local tops in the decline. The trend will continue until the Trendline is broken.
! Tip. If you configure the chart to display a number of blank dates padded at the end of the data, the Trendline can extend into the future.
Tip. To create a new Trendline parallel to an existing Trendline, Option-Click on any existing Trendline, then drag the copy to the new location.
!Vertical Line
A Vertical Line is a simple line, extending from the top to the bottom of the Pane. A Vertical Line requires one anchor point to define the study.
• From the Line Studies menu or tool item, choose Vertical Line.
!147
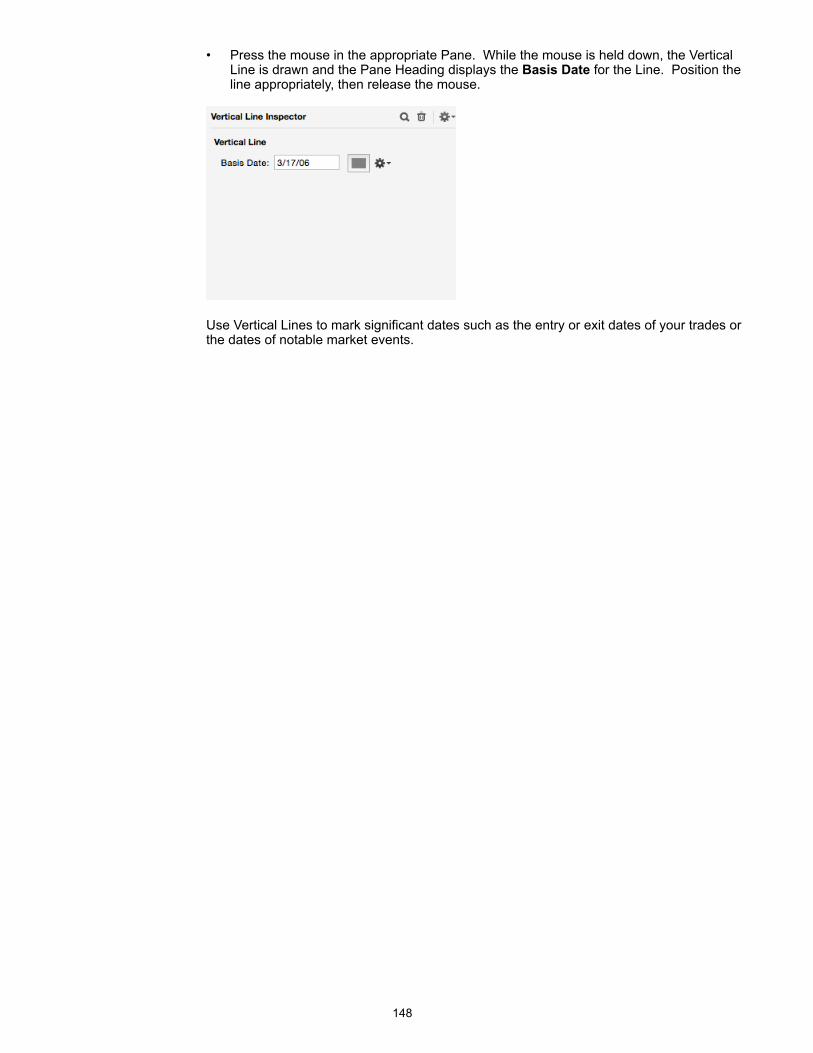
• Press the mouse in the appropriate Pane. While the mouse is held down, the Vertical Line is drawn and the Pane Heading displays the Basis Date for the Line. Position the line appropriately, then release the mouse.
!
Use Vertical Lines to mark significant dates such as the entry or exit dates of your trades or the dates of notable market events.
!148
Custom Indicators
!Overview
ProTA includes a large library of built-in Standard Indicators which represent some of the most widely followed analytical techniques in the industry (see the Indicators chapter). But the field of technical analysis is constantly evolving. New analytical methods are published every month in new books, trade magazines, web publication, or even by TA software users such as yourself. When you discover new indicators or come up with your own new ideas, you can implement them by writing a Custom Indicator.
Custom Indicators are constructed using ProTAscript. A simple, one-line example is:
MA( 21, Simple, RSI(14) );
{Computes a 21 day Simple Moving Average of the 14 day Relative Strength Index indicator.}
If you are familiar with writing formulas in spreadsheets, the above example will look familiar to you. You can probably start writing Custom Indicators right away. If this looks confusing, don’t worry. The ProTAscript chapter covers the language in great detail and there are a number of commented sample formulas included with the default installation of ProTA software.
Custom Indicators 1-2-3
1. Define a Custom Indicator formula using ProTAscript. See the next section.
2. Create or Open any Chart Suite window.
3. Display the Custom Indicators File Browser in the upper-right of the Chart Suite and double-click any Custom Indicator to add it to the selected chart.
!Administering Custom Indicators
The creation and organization of Custom Indicators is administered in the Custom Indicators authoring window.
• Choose Custom Indicators from the Tools menu.
!149
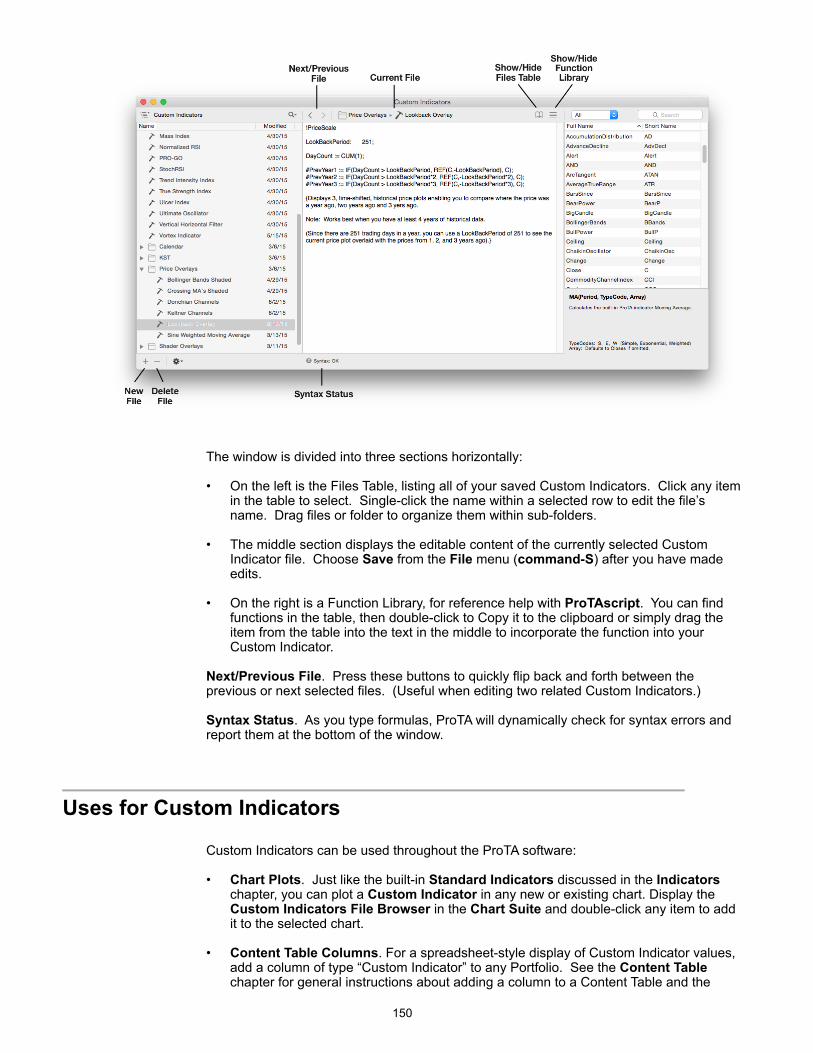
!
The window is divided into three sections horizontally:
• On the left is the Files Table, listing all of your saved Custom Indicators. Click any item in the table to select. Single-click the name within a selected row to edit the file’s name. Drag files or folder to organize them within sub-folders.
• The middle section displays the editable content of the currently selected Custom Indicator file. Choose Save from the File menu (command-S) after you have made edits.
• On the right is a Function Library, for reference help with ProTAscript. You can find functions in the table, then double-click to Copy it to the clipboard or simply drag the item from the table into the text in the middle to incorporate the function into your Custom Indicator.
Next/Previous File. Press these buttons to quickly flip back and forth between the previous or next selected files. (Useful when editing two related Custom Indicators.)
Syntax Status. As you type formulas, ProTA will dynamically check for syntax errors and report them at the bottom of the window.
! Uses for Custom Indicators
Custom Indicators can be used throughout the ProTA software:
• Chart Plots. Just like the built-in Standard Indicators discussed in the Indicators chapter, you can plot a Custom Indicator in any new or existing chart. Display the Custom Indicators File Browser in the Chart Suite and double-click any item to add it to the selected chart.
• Content Table Columns. For a spreadsheet-style display of Custom Indicator values, add a column of type “Custom Indicator” to any Portfolio. See the Content Table chapter for general instructions about adding a column to a Content Table and the
!150
Content Table Columns chapter for a specific section about Custom Indicator columns.
• Custom Indicators, Smartlists, Trading Systems, or Custom Indicators within Custom Indicators. ProTAscript allows you to refer to any previously written Custom Indicator within any formula. The syntax to refer to a Custom Indicator named “My First System” is:
FN(“My First Indicator”)
By using FN(“Custom Indicator Name”) in your Trading System formulas, Smartlist criteria, or even in other Custom Indicators, you can save a lot of typing and make your formulas more readable. For example, look at all the typing that went into defining the extremely simple “My First Indicator” Custom Indicator two pages back. If you later want to write a Smartlist criteria that scans for My First Indicator greater than zero, you don’t have to re-type the entire formula for the Smartlist criteria. Simply refer to the Custom Indicator using FN:
FN(“My First Indicator”) > 0;
See the ProTAscript chapter for more information.
!151

Smartlists
!Overview
ProTA’s Smartlist feature automatically searches your database for securities that meet your own custom-tailored criteria. Instead of manually paging through hundreds or thousands of charts looking for patterns, crossovers, new highs/lows, etc., you can codify your criteria into a simple formula and let ProTA find the matches for you.
You can use Smartlists to:
• Discover which securities have just generated a “buy” or “sell” signal.
• List all securities that have crossed their 200 day moving average on above average volume.
• Limit your Content Table to only include securities that are up more than 50% since 1/1/2012.
• See all stocks that are above their 21 day average, have an RSI above 60 and the Stochastics have just crossed above 80.
• View all securities that are currently Long or Short any of your Trading Systems.
This is just a small sampling of possible criteria. Since your criteria is specified with ProTAscript, you are only limited by your imagination. The ProTAscript chapter covers the formula language in great detail and there are a number of commented sample Smartlists that ship with ProTA.
Smartlists 1-2-3
1. Define criteria in the Smartlists authoring window using ProTAscript. See the next two sections.
2. Create or Open any Chart Suite window.
3. Display the Smartlists File Browser in the upper-right of the Chart Suite and double-click any Smartlist to apply it to the Chart Suite.
! Administering Smartlists
The creation and organization of Smartlists is administered in the Smartlists authoring window.
• Choose Smartlists from the Tools menu.
!152
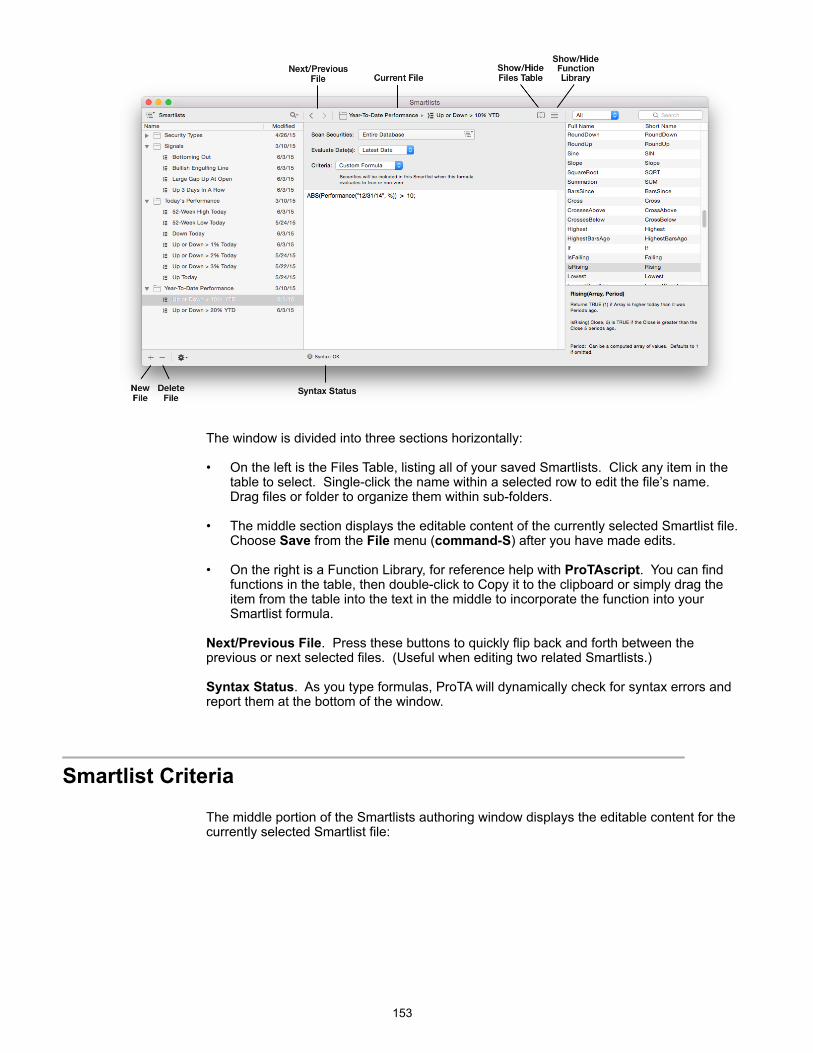
! The window is divided into three sections horizontally:
• On the left is the Files Table, listing all of your saved Smartlists. Click any item in the table to select. Single-click the name within a selected row to edit the file’s name. Drag files or folder to organize them within sub-folders.
• The middle section displays the editable content of the currently selected Smartlist file. Choose Save from the File menu (command-S) after you have made edits.
• On the right is a Function Library, for reference help with ProTAscript. You can find functions in the table, then double-click to Copy it to the clipboard or simply drag the item from the table into the text in the middle to incorporate the function into your Smartlist formula.
Next/Previous File. Press these buttons to quickly flip back and forth between the previous or next selected files. (Useful when editing two related Smartlists.)
Syntax Status. As you type formulas, ProTA will dynamically check for syntax errors and report them at the bottom of the window.
! Smartlist Criteria
The middle portion of the Smartlists authoring window displays the editable content for the currently selected Smartlist file:
!153
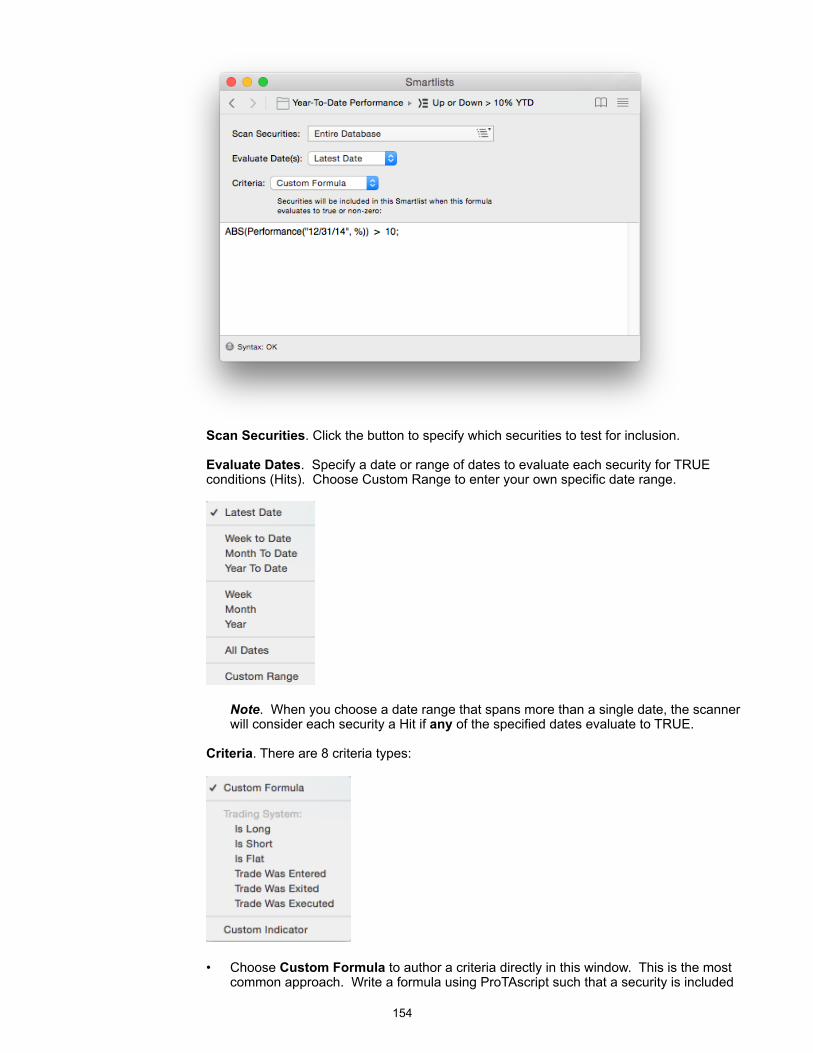
! Scan Securities. Click the button to specify which securities to test for inclusion.
Evaluate Dates. Specify a date or range of dates to evaluate each security for TRUE conditions (Hits). Choose Custom Range to enter your own specific date range.
!
Note. When you choose a date range that spans more than a single date, the scanner will consider each security a Hit if any of the specified dates evaluate to TRUE.
Criteria. There are 8 criteria types:
!
• Choose Custom Formula to author a criteria directly in this window. This is the most common approach. Write a formula using ProTAscript such that a security is included
!154

in the Smartlist whenever the formula resolved to TRUE or a non-zero number. See the ProTAscript chapter for details.
• The next 6 items are used to query the state of a Trading System. Use the popup menu at the right to select the desired Trading System to query.
• Choose Custom Indicator when the desired criteria was already written and saved in a Custom Indictor file. Then use the popup menu at the right to select the desired Custom Indicator file.
!155

Trading Systems
!Overview
One of the most powerful features in ProTA, Trading Systems, allows you to determine the historical profitability of your trading strategies.
A Trading System is a user-defined set of rules that specify when you should buy or sell a security. Every aspect of a Trading System is fully customizable: rules for triggering a trade entry or exit, stop levels, trade execution methods, and even the accounting method used to track day-to-day equity balances.
You can use Trading Systems to:
• Determine how much money would have been made had you followed a specific trading strategy.
• Graphically examine Trading System activity in any chart with buy/sell arrows, shadings, painted Bars, equity lines.
• Create tabular rankings and reports for dozens of trade statistics.
• Optimize the parameters within your trading rules to find the most profitable systems.
• Compare and rank the results of multiple systems to determine which is working best for a given security.
The buy and sell rules for a Trading System are constructed using ProTAscript. A simple example of an Enter Long rule is:
#EnterLong := CrossesAbove(Close, MA(21));
{Generates a BUY signal when the security’s closing price crosses above the 21 day moving average line.}
If you are familiar with writing formulas in spreadsheets, the above example will look familiar to you. You can probably start writing Trading Systems right away. If this looks confusing, don’t worry. The ProTAscript chapter covers the language in great detail and there are a number of commented sample Trading Systems included in the ProTA software
Trading Systems 1-2-3
1. Define a Trading System: Entry and exit rules, stops, and/or trade execution rules. See Creating a Trading System.
2. Set scope and accounting rules then run a system test. See Running a System Test.
3. Review the results of the test: dozens of trade statistics, sortable tables, trade-by-trade listings, charts of trading activity and day-to-day profitability analyses. See Reviewing a Trading System Report.
!156
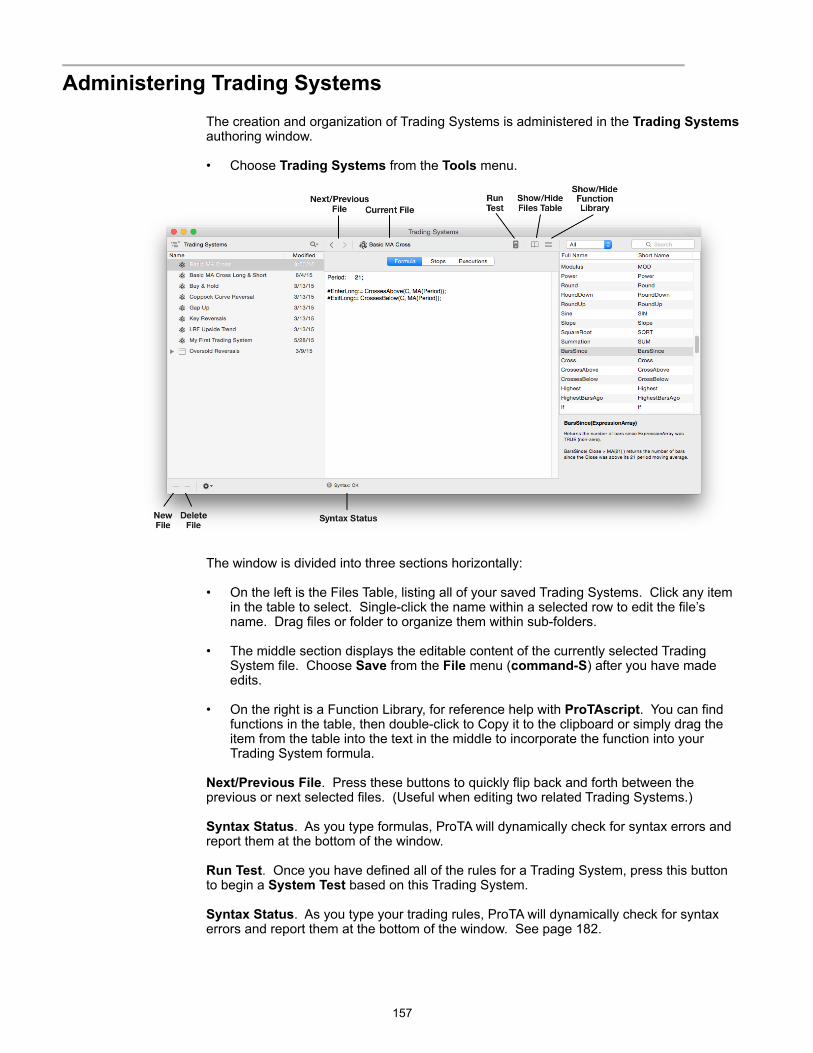
!Administering Trading Systems
The creation and organization of Trading Systems is administered in the Trading Systems authoring window.
• Choose Trading Systems from the Tools menu.
! The window is divided into three sections horizontally:
• On the left is the Files Table, listing all of your saved Trading Systems. Click any item in the table to select. Single-click the name within a selected row to edit the file’s name. Drag files or folder to organize them within sub-folders.
• The middle section displays the editable content of the currently selected Trading System file. Choose Save from the File menu (command-S) after you have made edits.
• On the right is a Function Library, for reference help with ProTAscript. You can find functions in the table, then double-click to Copy it to the clipboard or simply drag the item from the table into the text in the middle to incorporate the function into your Trading System formula.
Next/Previous File. Press these buttons to quickly flip back and forth between the previous or next selected files. (Useful when editing two related Trading Systems.)
Syntax Status. As you type formulas, ProTA will dynamically check for syntax errors and report them at the bottom of the window.
Run Test. Once you have defined all of the rules for a Trading System, press this button to begin a System Test based on this Trading System.
Syntax Status. As you type your trading rules, ProTA will dynamically check for syntax errors and report them at the bottom of the window. See page 182.
!157
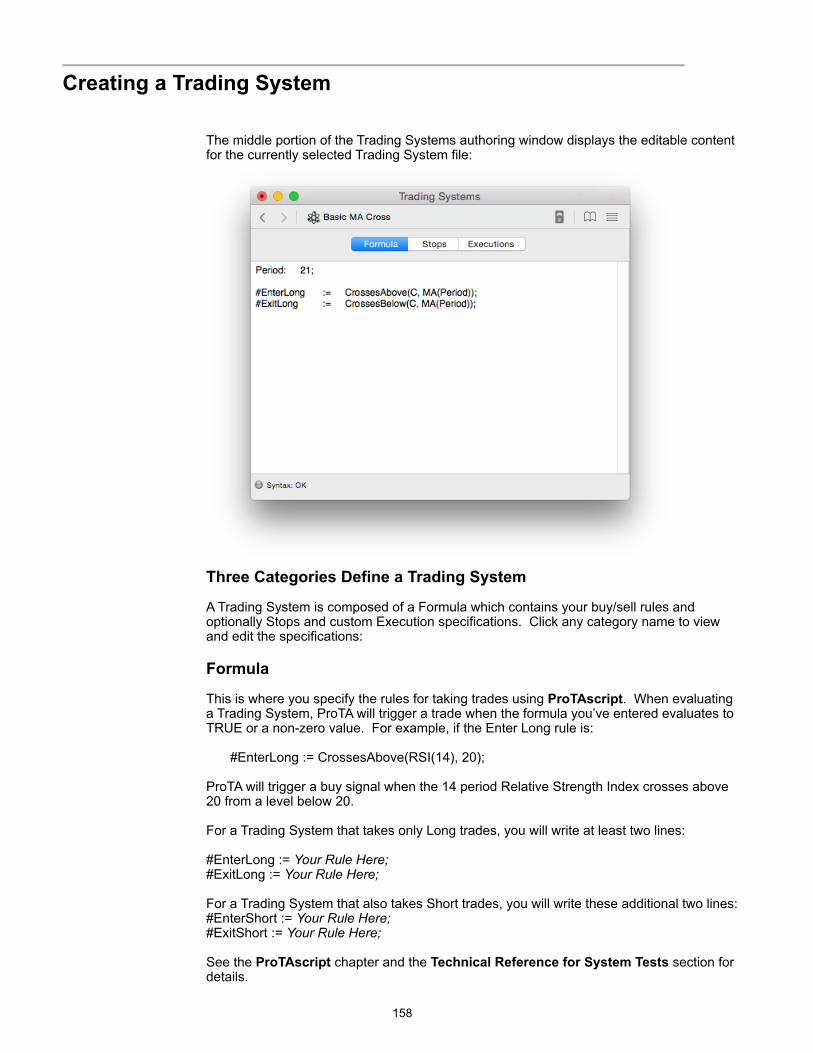
!Creating a Trading System
The middle portion of the Trading Systems authoring window displays the editable content for the currently selected Trading System file:
! Three Categories Define a Trading System
A Trading System is composed of a Formula which contains your buy/sell rules and optionally Stops and custom Execution specifications. Click any category name to view and edit the specifications:
Formula
This is where you specify the rules for taking trades using ProTAscript. When evaluating a Trading System, ProTA will trigger a trade when the formula you’ve entered evaluates to TRUE or a non-zero value. For example, if the Enter Long rule is:
#EnterLong := CrossesAbove(RSI(14), 20);
ProTA will trigger a buy signal when the 14 period Relative Strength Index crosses above 20 from a level below 20.
For a Trading System that takes only Long trades, you will write at least two lines:
#EnterLong := Your Rule Here; #ExitLong := Your Rule Here;
For a Trading System that also takes Short trades, you will write these additional two lines: #EnterShort := Your Rule Here; #ExitShort := Your Rule Here;
See the ProTAscript chapter and the Technical Reference for System Tests section for details.
!158
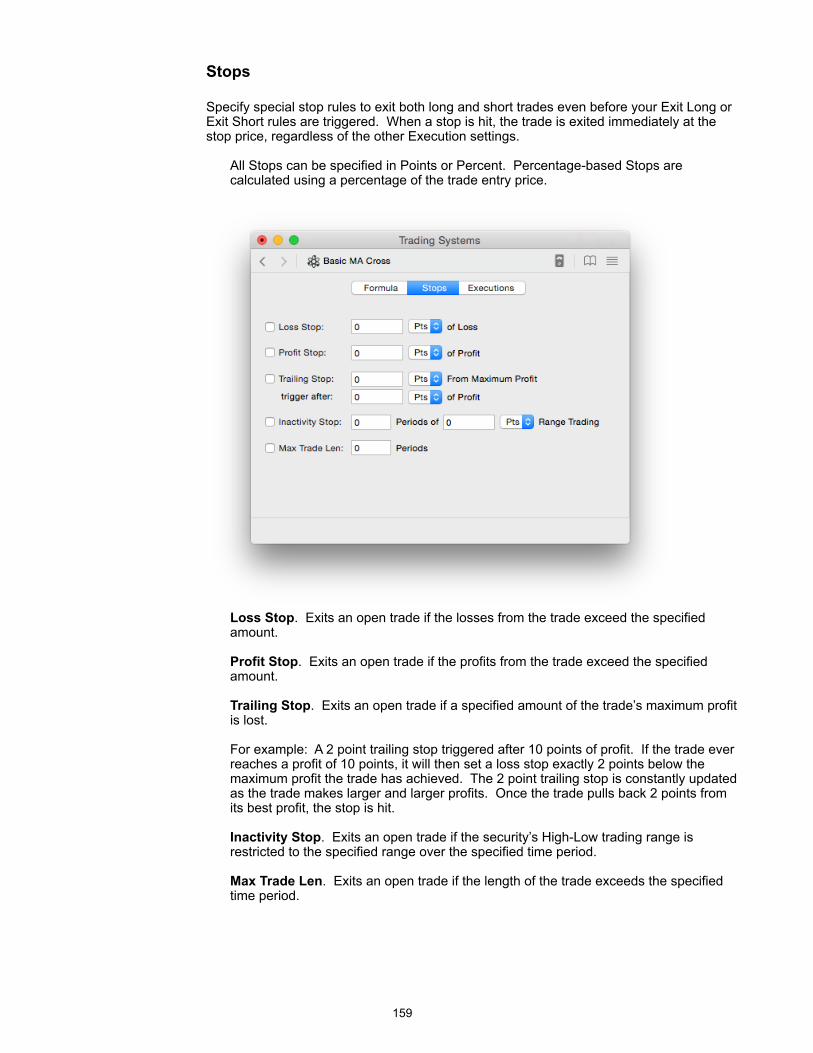
Stops
Specify special stop rules to exit both long and short trades even before your Exit Long or Exit Short rules are triggered. When a stop is hit, the trade is exited immediately at the stop price, regardless of the other Execution settings.
All Stops can be specified in Points or Percent. Percentage-based Stops are calculated using a percentage of the trade entry price.
! Loss Stop. Exits an open trade if the losses from the trade exceed the specified amount.
Profit Stop. Exits an open trade if the profits from the trade exceed the specified amount.
Trailing Stop. Exits an open trade if a specified amount of the trade’s maximum profit is lost.
For example: A 2 point trailing stop triggered after 10 points of profit. If the trade ever reaches a profit of 10 points, it will then set a loss stop exactly 2 points below the maximum profit the trade has achieved. The 2 point trailing stop is constantly updated as the trade makes larger and larger profits. Once the trade pulls back 2 points from its best profit, the stop is hit.
Inactivity Stop. Exits an open trade if the security’s High-Low trading range is restricted to the specified range over the specified time period.
Max Trade Len. Exits an open trade if the length of the trade exceeds the specified time period.
!159
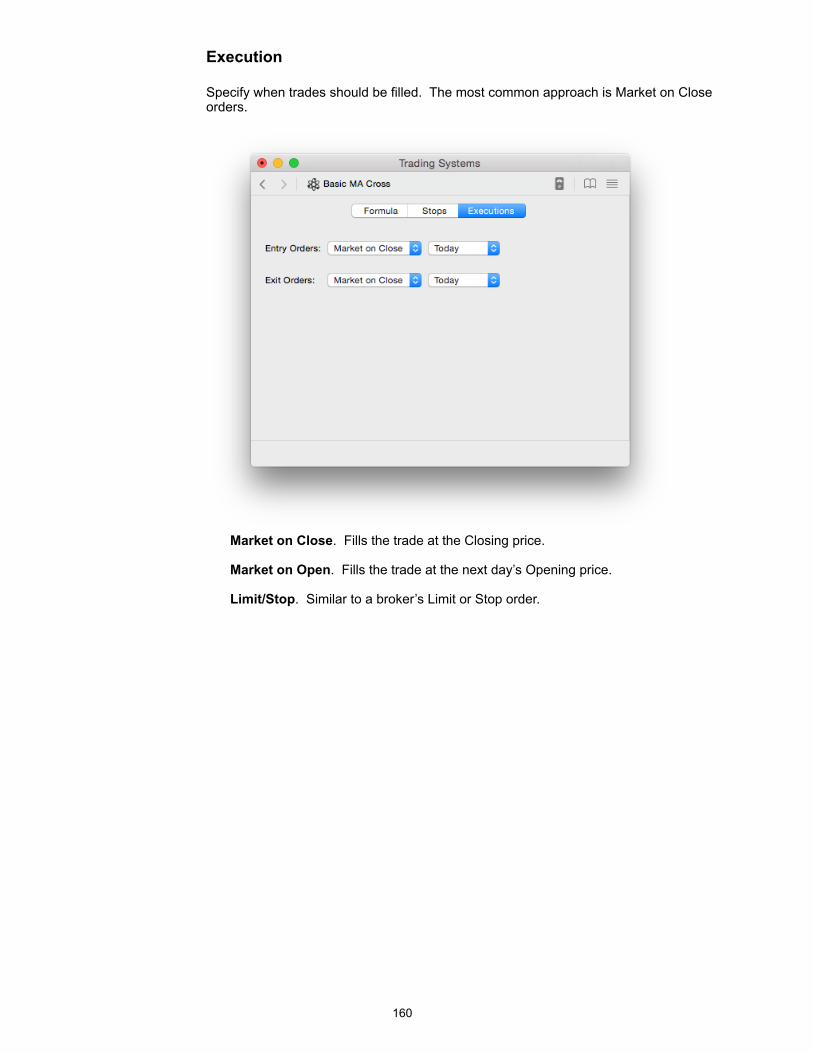
Execution
Specify when trades should be filled. The most common approach is Market on Close orders.
! Market on Close. Fills the trade at the Closing price.
Market on Open. Fills the trade at the next day’s Opening price.
Limit/Stop. Similar to a broker’s Limit or Stop order.
!160
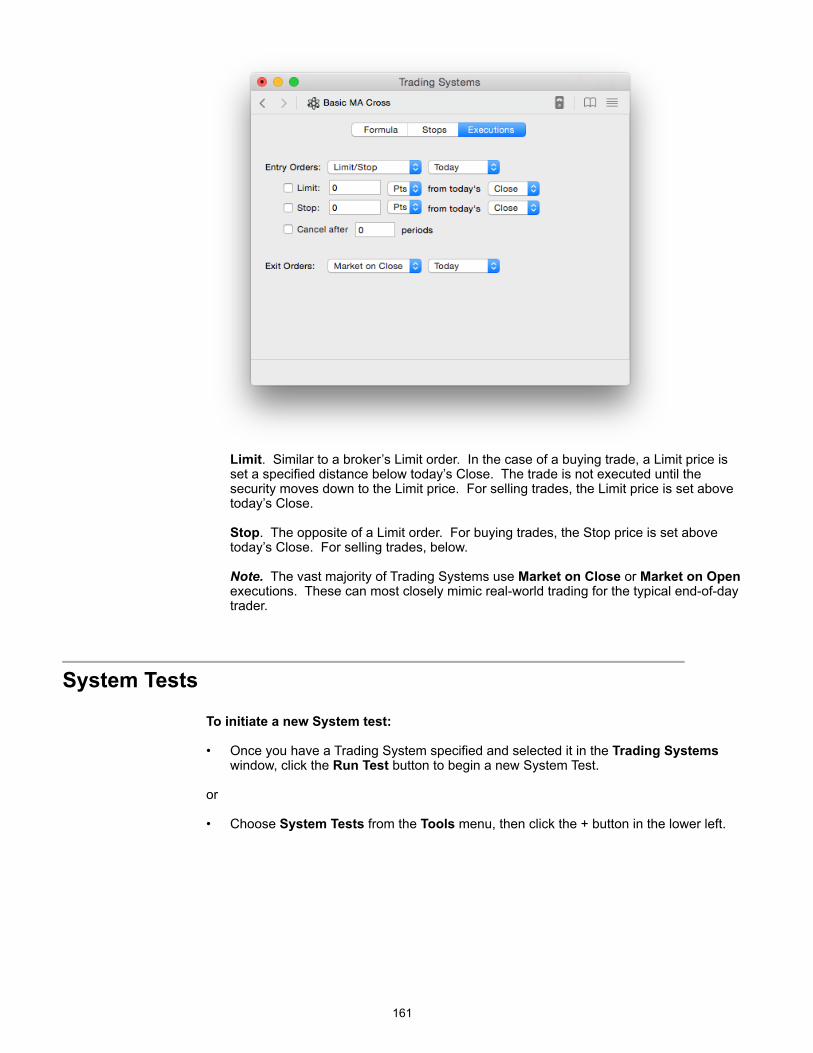
! Limit. Similar to a broker’s Limit order. In the case of a buying trade, a Limit price is set a specified distance below today’s Close. The trade is not executed until the security moves down to the Limit price. For selling trades, the Limit price is set above today’s Close.
Stop. The opposite of a Limit order. For buying trades, the Stop price is set above today’s Close. For selling trades, below.
Note. The vast majority of Trading Systems use Market on Close or Market on Open executions. These can most closely mimic real-world trading for the typical end-of-day trader.
!System Tests
To initiate a new System test:
• Once you have a Trading System specified and selected it in the Trading Systems window, click the Run Test button to begin a new System Test.
or
• Choose System Tests from the Tools menu, then click the + button in the lower left.
!161
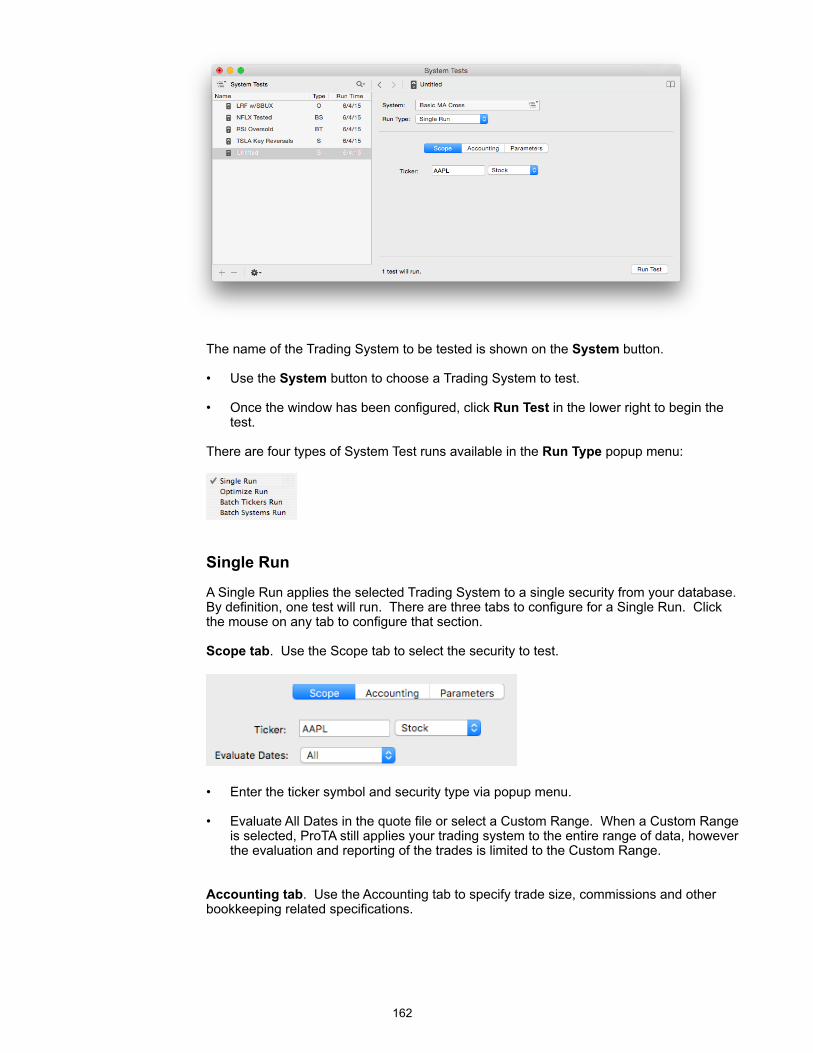
!
The name of the Trading System to be tested is shown on the System button.
• Use the System button to choose a Trading System to test.
• Once the window has been configured, click Run Test in the lower right to begin the test.
There are four types of System Test runs available in the Run Type popup menu:
!
Single Run
A Single Run applies the selected Trading System to a single security from your database. By definition, one test will run. There are three tabs to configure for a Single Run. Click the mouse on any tab to configure that section.
Scope tab. Use the Scope tab to select the security to test.
!
• Enter the ticker symbol and security type via popup menu.
• Evaluate All Dates in the quote file or select a Custom Range. When a Custom Range is selected, ProTA still applies your trading system to the entire range of data, however the evaluation and reporting of the trades is limited to the Custom Range.
Accounting tab. Use the Accounting tab to specify trade size, commissions and other bookkeeping related specifications.
!162
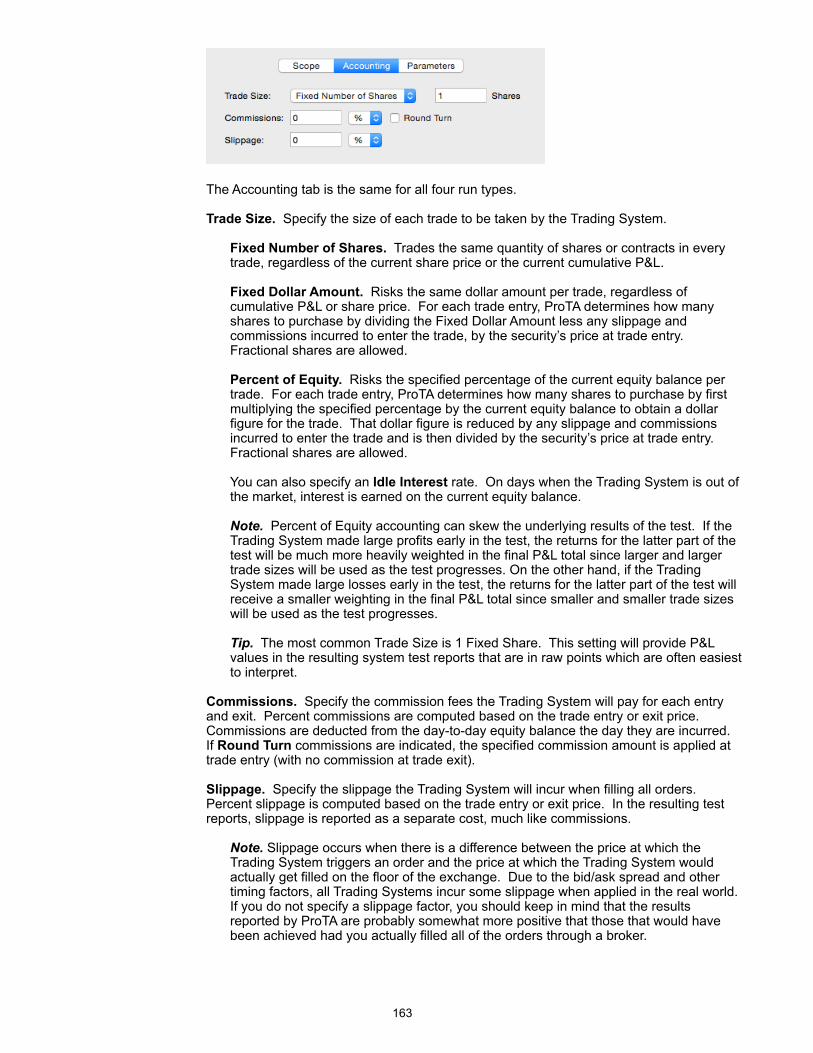
!
The Accounting tab is the same for all four run types.
Trade Size. Specify the size of each trade to be taken by the Trading System.
Fixed Number of Shares. Trades the same quantity of shares or contracts in every trade, regardless of the current share price or the current cumulative P&L.
Fixed Dollar Amount. Risks the same dollar amount per trade, regardless of cumulative P&L or share price. For each trade entry, ProTA determines how many shares to purchase by dividing the Fixed Dollar Amount less any slippage and commissions incurred to enter the trade, by the security’s price at trade entry. Fractional shares are allowed.
Percent of Equity. Risks the specified percentage of the current equity balance per trade. For each trade entry, ProTA determines how many shares to purchase by first multiplying the specified percentage by the current equity balance to obtain a dollar figure for the trade. That dollar figure is reduced by any slippage and commissions incurred to enter the trade and is then divided by the security’s price at trade entry. Fractional shares are allowed.
You can also specify an Idle Interest rate. On days when the Trading System is out of the market, interest is earned on the current equity balance.
Note. Percent of Equity accounting can skew the underlying results of the test. If the Trading System made large profits early in the test, the returns for the latter part of the test will be much more heavily weighted in the final P&L total since larger and larger trade sizes will be used as the test progresses. On the other hand, if the Trading System made large losses early in the test, the returns for the latter part of the test will receive a smaller weighting in the final P&L total since smaller and smaller trade sizes will be used as the test progresses.
Tip. The most common Trade Size is 1 Fixed Share. This setting will provide P&L values in the resulting system test reports that are in raw points which are often easiest to interpret.
Commissions. Specify the commission fees the Trading System will pay for each entry and exit. Percent commissions are computed based on the trade entry or exit price. Commissions are deducted from the day-to-day equity balance the day they are incurred. If Round Turn commissions are indicated, the specified commission amount is applied at trade entry (with no commission at trade exit).
Slippage. Specify the slippage the Trading System will incur when filling all orders. Percent slippage is computed based on the trade entry or exit price. In the resulting test reports, slippage is reported as a separate cost, much like commissions.
Note. Slippage occurs when there is a difference between the price at which the Trading System triggers an order and the price at which the Trading System would actually get filled on the floor of the exchange. Due to the bid/ask spread and other timing factors, all Trading Systems incur some slippage when applied in the real world. If you do not specify a slippage factor, you should keep in mind that the results reported by ProTA are probably somewhat more positive that those that would have been achieved had you actually filled all of the orders through a broker.
!163
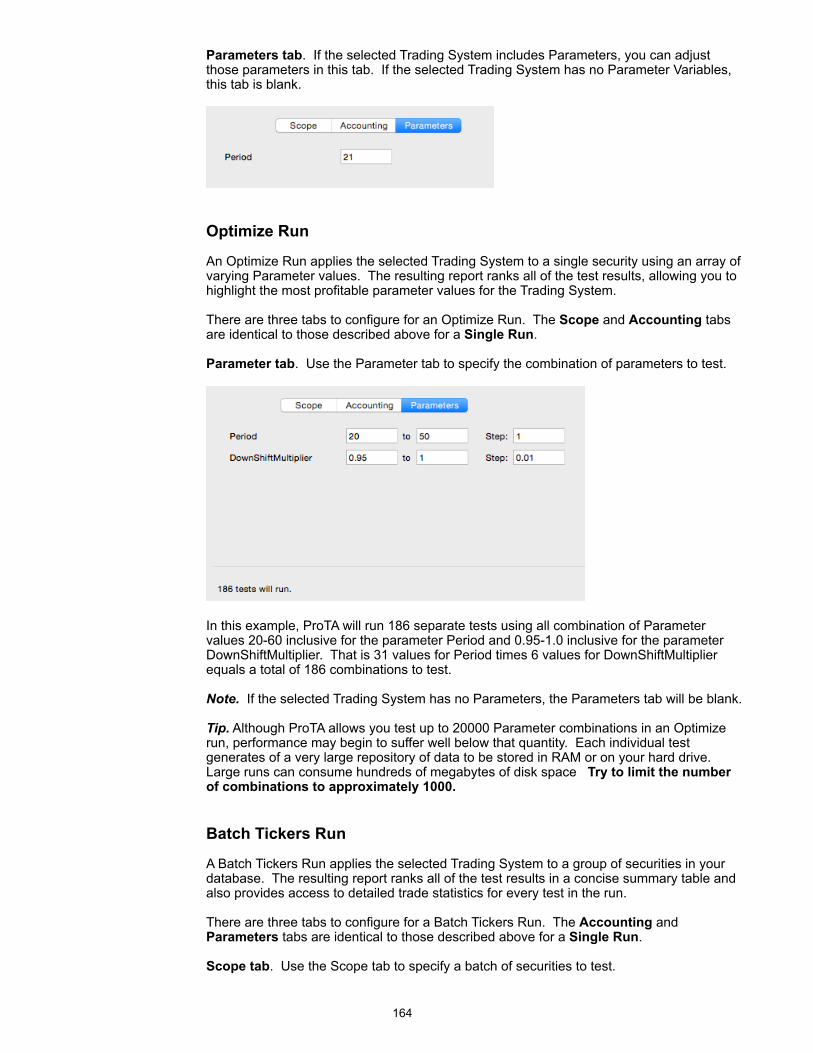
Parameters tab. If the selected Trading System includes Parameters, you can adjust those parameters in this tab. If the selected Trading System has no Parameter Variables, this tab is blank.
!
Optimize Run
An Optimize Run applies the selected Trading System to a single security using an array of varying Parameter values. The resulting report ranks all of the test results, allowing you to highlight the most profitable parameter values for the Trading System.
There are three tabs to configure for an Optimize Run. The Scope and Accounting tabs are identical to those described above for a Single Run.
Parameter tab. Use the Parameter tab to specify the combination of parameters to test.
!
In this example, ProTA will run 186 separate tests using all combination of Parameter values 20-60 inclusive for the parameter Period and 0.95-1.0 inclusive for the parameter DownShiftMultiplier. That is 31 values for Period times 6 values for DownShiftMultiplier equals a total of 186 combinations to test.
Note. If the selected Trading System has no Parameters, the Parameters tab will be blank.
Tip. Although ProTA allows you test up to 20000 Parameter combinations in an Optimize run, performance may begin to suffer well below that quantity. Each individual test generates of a very large repository of data to be stored in RAM or on your hard drive. Large runs can consume hundreds of megabytes of disk space Try to limit the number of combinations to approximately 1000.
Batch Tickers Run
A Batch Tickers Run applies the selected Trading System to a group of securities in your database. The resulting report ranks all of the test results in a concise summary table and also provides access to detailed trade statistics for every test in the run.
There are three tabs to configure for a Batch Tickers Run. The Accounting and Parameters tabs are identical to those described above for a Single Run.
Scope tab. Use the Scope tab to specify a batch of securities to test.
!164
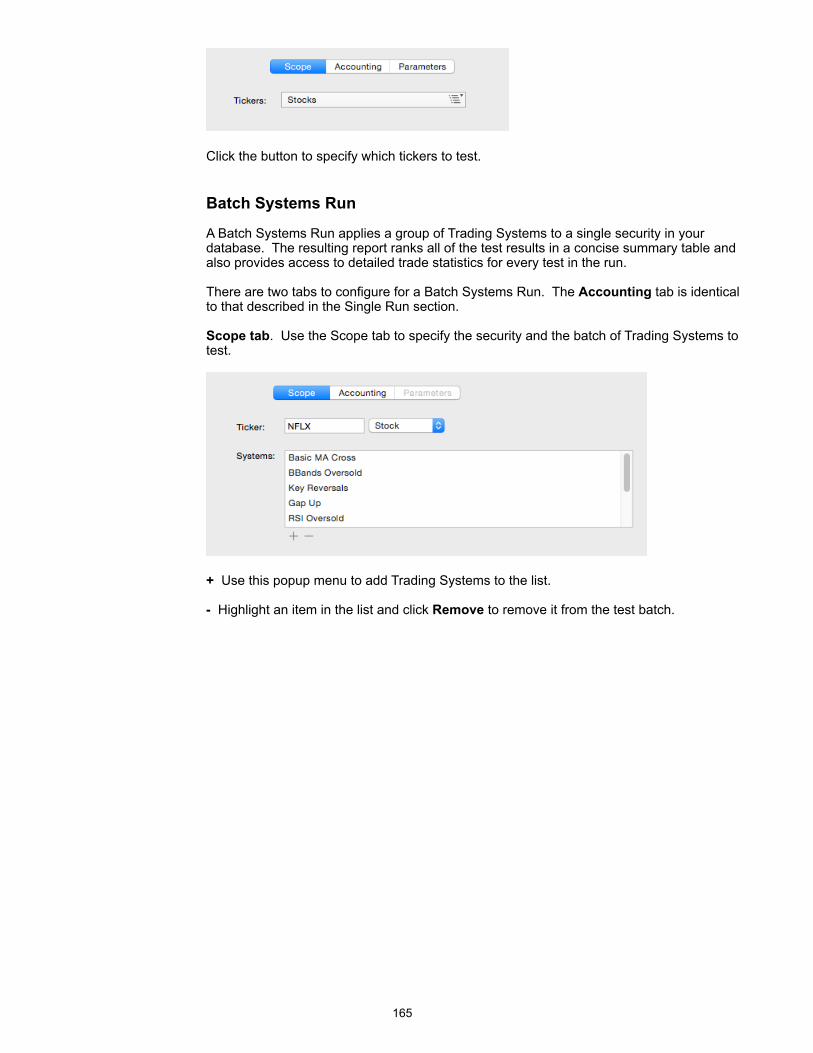
!
Click the button to specify which tickers to test.
Batch Systems Run
A Batch Systems Run applies a group of Trading Systems to a single security in your database. The resulting report ranks all of the test results in a concise summary table and also provides access to detailed trade statistics for every test in the run.
There are two tabs to configure for a Batch Systems Run. The Accounting tab is identical to that described in the Single Run section.
Scope tab. Use the Scope tab to specify the security and the batch of Trading Systems to test.
!
+ Use this popup menu to add Trading Systems to the list.
- Highlight an item in the list and click Remove to remove it from the test batch.
!165
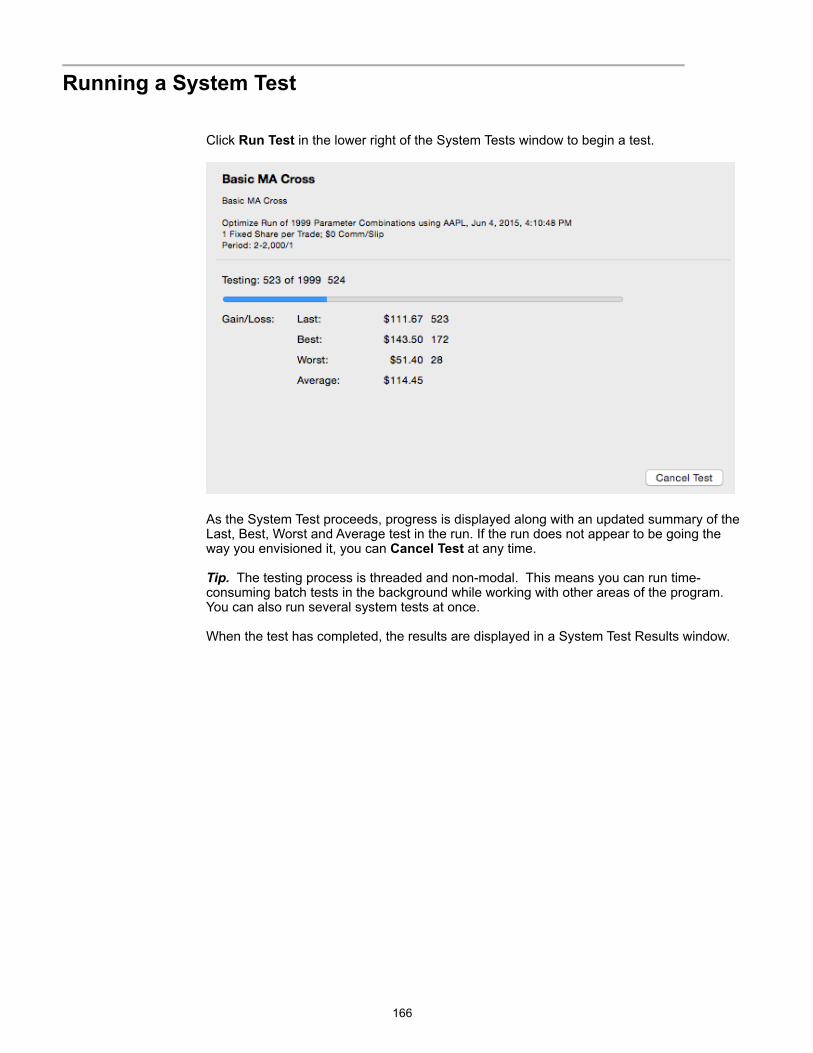
!Running a System Test
Click Run Test in the lower right of the System Tests window to begin a test.
!
As the System Test proceeds, progress is displayed along with an updated summary of the Last, Best, Worst and Average test in the run. If the run does not appear to be going the way you envisioned it, you can Cancel Test at any time.
Tip. The testing process is threaded and non-modal. This means you can run time-consuming batch tests in the background while working with other areas of the program. You can also run several system tests at once.
When the test has completed, the results are displayed in a System Test Results window.
!166
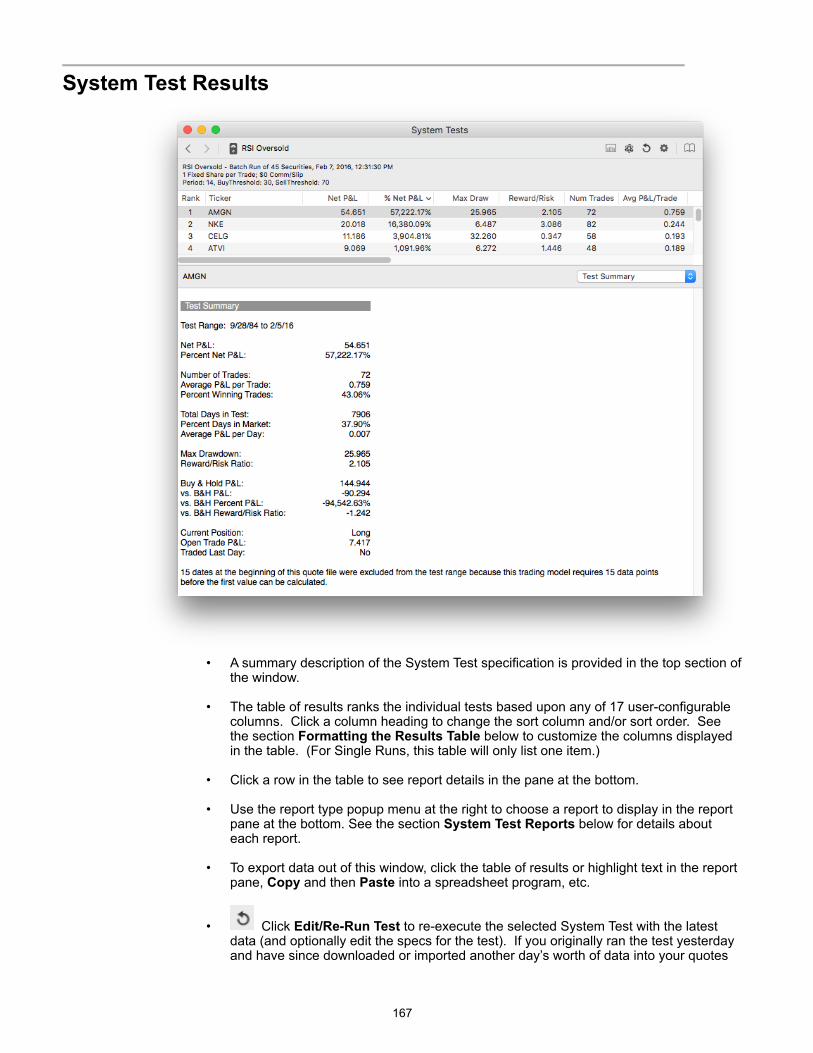
!System Test Results
! • A summary description of the System Test specification is provided in the top section of
the window.
• The table of results ranks the individual tests based upon any of 17 user-configurable columns. Click a column heading to change the sort column and/or sort order. See the section Formatting the Results Table below to customize the columns displayed in the table. (For Single Runs, this table will only list one item.)
• Click a row in the table to see report details in the pane at the bottom.
• Use the report type popup menu at the right to choose a report to display in the report pane at the bottom. See the section System Test Reports below for details about each report.
• To export data out of this window, click the table of results or highlight text in the report pane, Copy and then Paste into a spreadsheet program, etc.
• ! Click Edit/Re-Run Test to re-execute the selected System Test with the latest data (and optionally edit the specs for the test). If you originally ran the test yesterday and have since downloaded or imported another day’s worth of data into your quotes
!167
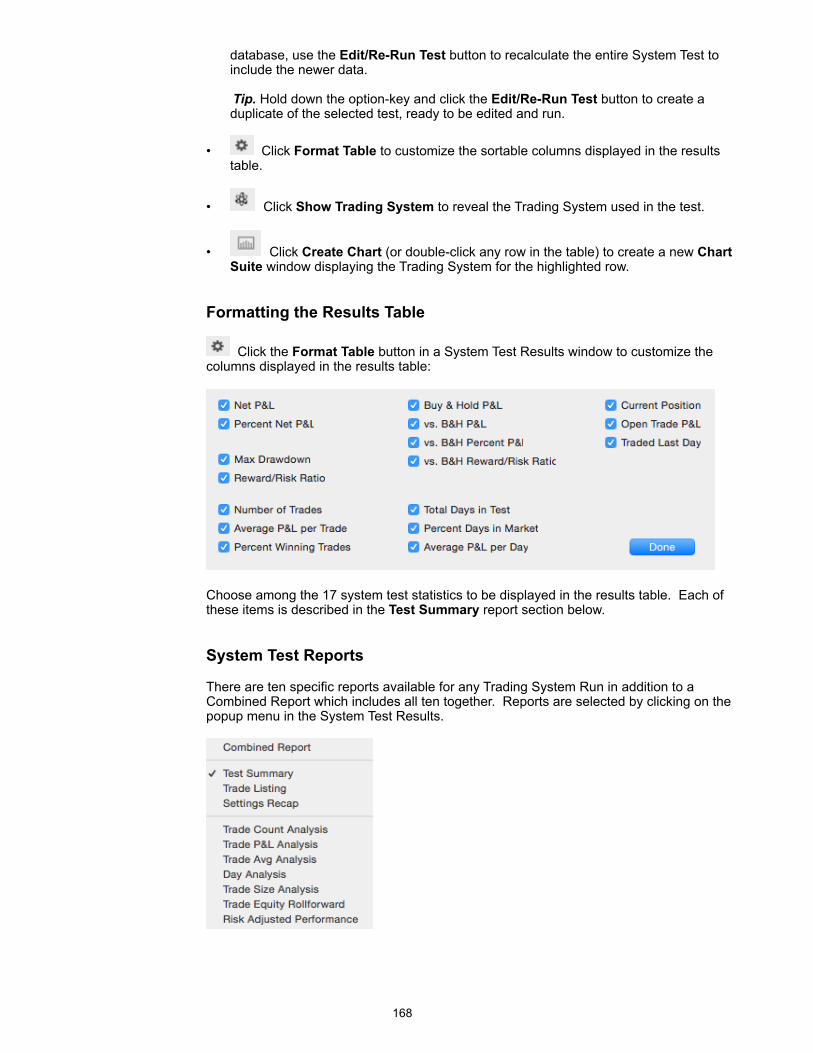
database, use the Edit/Re-Run Test button to recalculate the entire System Test to include the newer data.
Tip. Hold down the option-key and click the Edit/Re-Run Test button to create a duplicate of the selected test, ready to be edited and run.
• ! Click Format Table to customize the sortable columns displayed in the results table.
• ! Click Show Trading System to reveal the Trading System used in the test.
• ! Click Create Chart (or double-click any row in the table) to create a new Chart Suite window displaying the Trading System for the highlighted row.
Formatting the Results Table
! Click the Format Table button in a System Test Results window to customize the columns displayed in the results table:
!
Choose among the 17 system test statistics to be displayed in the results table. Each of these items is described in the Test Summary report section below.
System Test Reports
There are ten specific reports available for any Trading System Run in addition to a Combined Report which includes all ten together. Reports are selected by clicking on the popup menu in the System Test Results.
!
!168

Test Summary:
!
Test Range. The actual range of dates included in the test. This range only includes dates that were eligible for trading. A Trading System that uses a 21 day moving average, for example, is not eligible to take a trade until at least 21 days from the beginning of the quote file. This is because it takes 21 days before the first moving average value can be computed. The number of ineligible dates is reported at the bottom of the Test Summary
Net P&L. The final profit or loss realized by the trades taken in the test, net of commissions and slippage. This value does not include any idle interest that was earned.
% Net P&L. 100 * Net P&L / Beginning Balance. The Beginning Balance is determined uniquely for each of the three trade size accounting options:
Fixed Number of Shares: Number of Shares * Security’s Price When the Test Began
Fixed Dollar Amount: Fixed Dollar Amount
Percent of Equity: The specified Beginning Equity balance.
Number of Trades. This is a count of all trades, including a trade that is still open at the conclusion of the test.
Avg P&L/Trade. Net P&L / Number of Trades.
% Winners. Number of Winning Trades / Number of Trades. A winning trade is a trade that has a P&L of zero or greater after considering commissions and slippage.
Total Days in Test. Number of days in the Test Range as defined above. This is not a calendar day count but rather a count of the bars (data points) within the Test Range period.
% Days in Market. Number of Days Long or Short / Total Days in Test.
Avg P&L/Day. Net P&L / Total Days in Test.
Max Drawdown. The maximum peak to trough dip in the day-to-day equity of the trading system. A measure of risk.
Reward/Risk Ratio. Net P&L / Max Drawdown.
!169
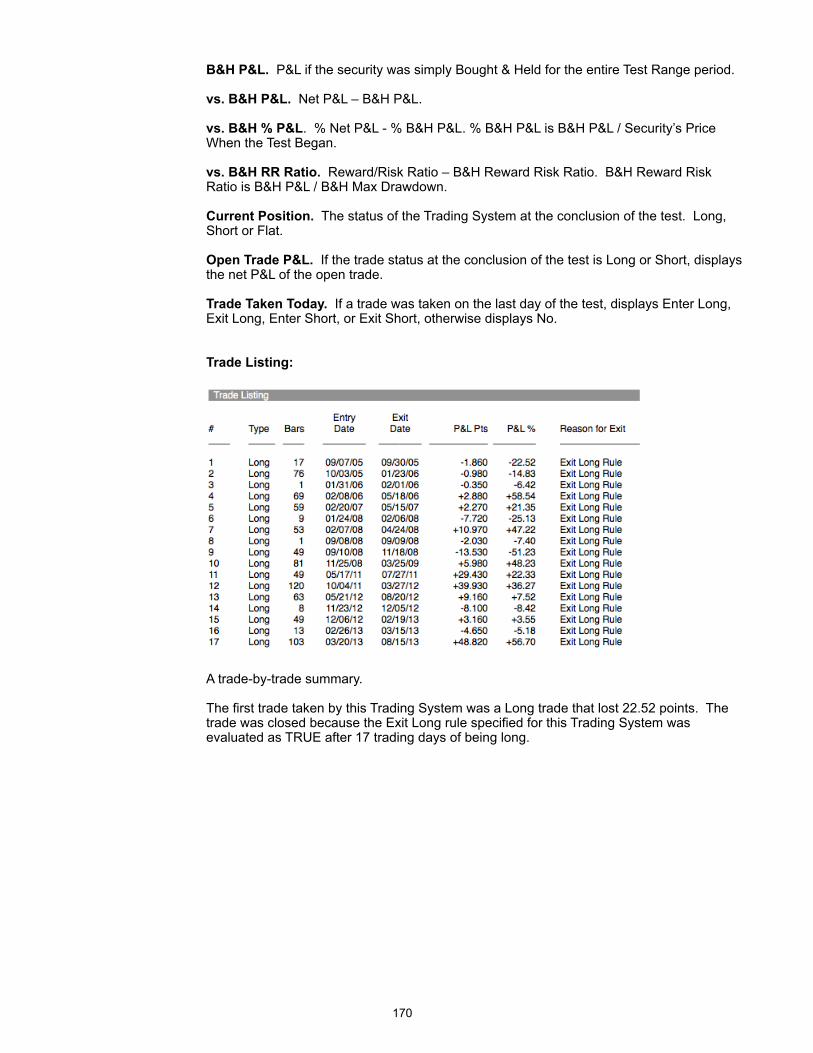
B&H P&L. P&L if the security was simply Bought & Held for the entire Test Range period.
vs. B&H P&L. Net P&L – B&H P&L.
vs. B&H % P&L. % Net P&L - % B&H P&L. % B&H P&L is B&H P&L / Security’s Price When the Test Began.
vs. B&H RR Ratio. Reward/Risk Ratio – B&H Reward Risk Ratio. B&H Reward Risk Ratio is B&H P&L / B&H Max Drawdown.
Current Position. The status of the Trading System at the conclusion of the test. Long, Short or Flat.
Open Trade P&L. If the trade status at the conclusion of the test is Long or Short, displays the net P&L of the open trade.
Trade Taken Today. If a trade was taken on the last day of the test, displays Enter Long, Exit Long, Enter Short, or Exit Short, otherwise displays No.
Trade Listing:
!
A trade-by-trade summary.
The first trade taken by this Trading System was a Long trade that lost 22.52 points. The trade was closed because the Exit Long rule specified for this Trading System was evaluated as TRUE after 17 trading days of being long.
!170
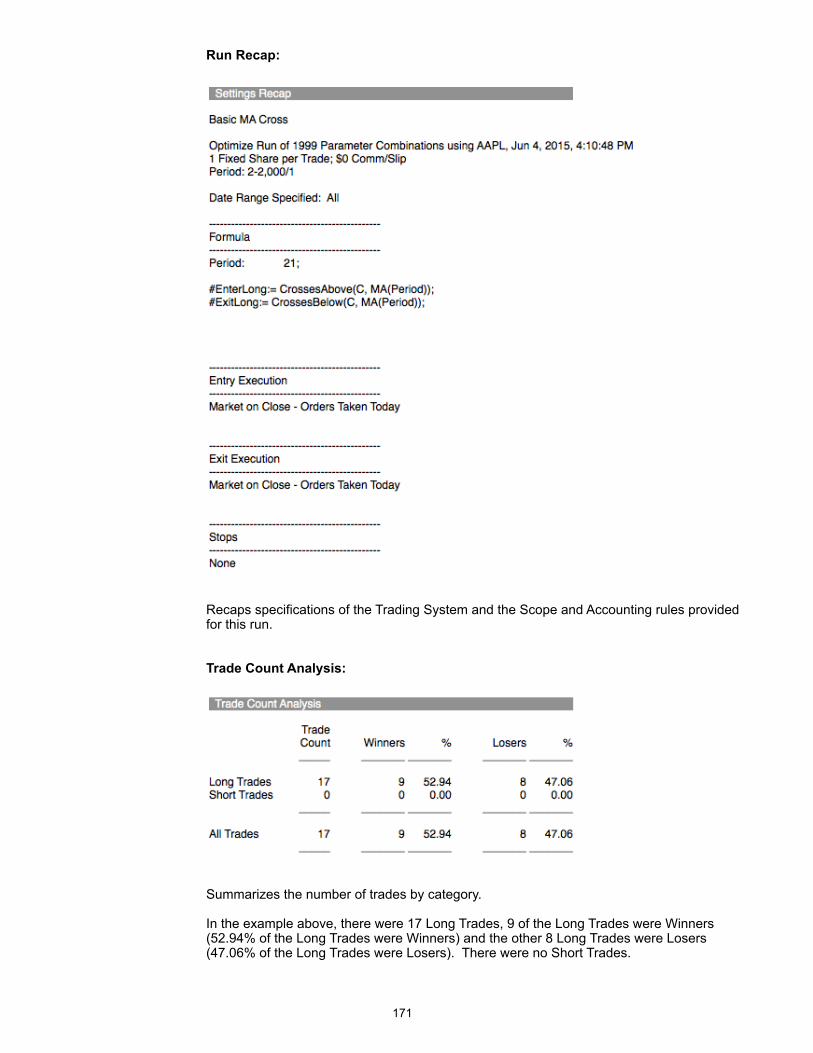
Run Recap:
!
Recaps specifications of the Trading System and the Scope and Accounting rules provided for this run.
Trade Count Analysis:
!
Summarizes the number of trades by category.
In the example above, there were 17 Long Trades, 9 of the Long Trades were Winners (52.94% of the Long Trades were Winners) and the other 8 Long Trades were Losers (47.06% of the Long Trades were Losers). There were no Short Trades.
!171
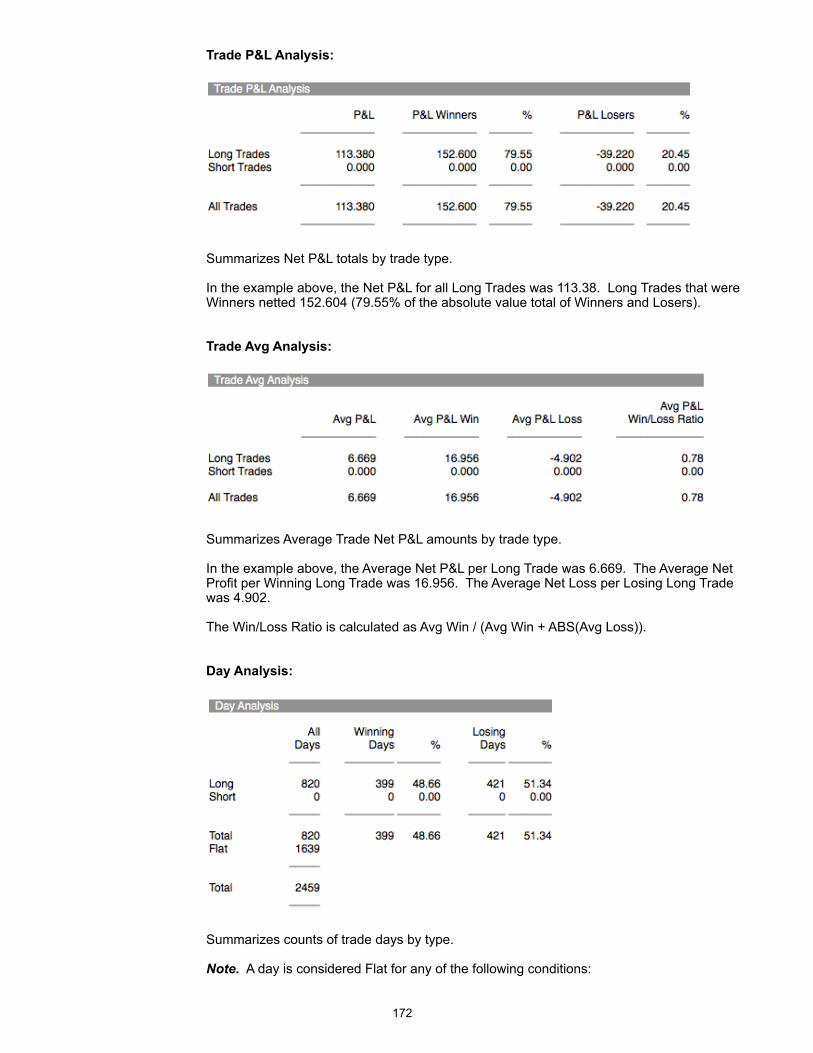
Trade P&L Analysis:
!
Summarizes Net P&L totals by trade type.
In the example above, the Net P&L for all Long Trades was 113.38. Long Trades that were Winners netted 152.604 (79.55% of the absolute value total of Winners and Losers).
Trade Avg Analysis:
!
Summarizes Average Trade Net P&L amounts by trade type.
In the example above, the Average Net P&L per Long Trade was 6.669. The Average Net Profit per Winning Long Trade was 16.956. The Average Net Loss per Losing Long Trade was 4.902.
The Win/Loss Ratio is calculated as Avg Win / (Avg Win + ABS(Avg Loss)).
Day Analysis:
!
Summarizes counts of trade days by type.
Note. A day is considered Flat for any of the following conditions:
!172
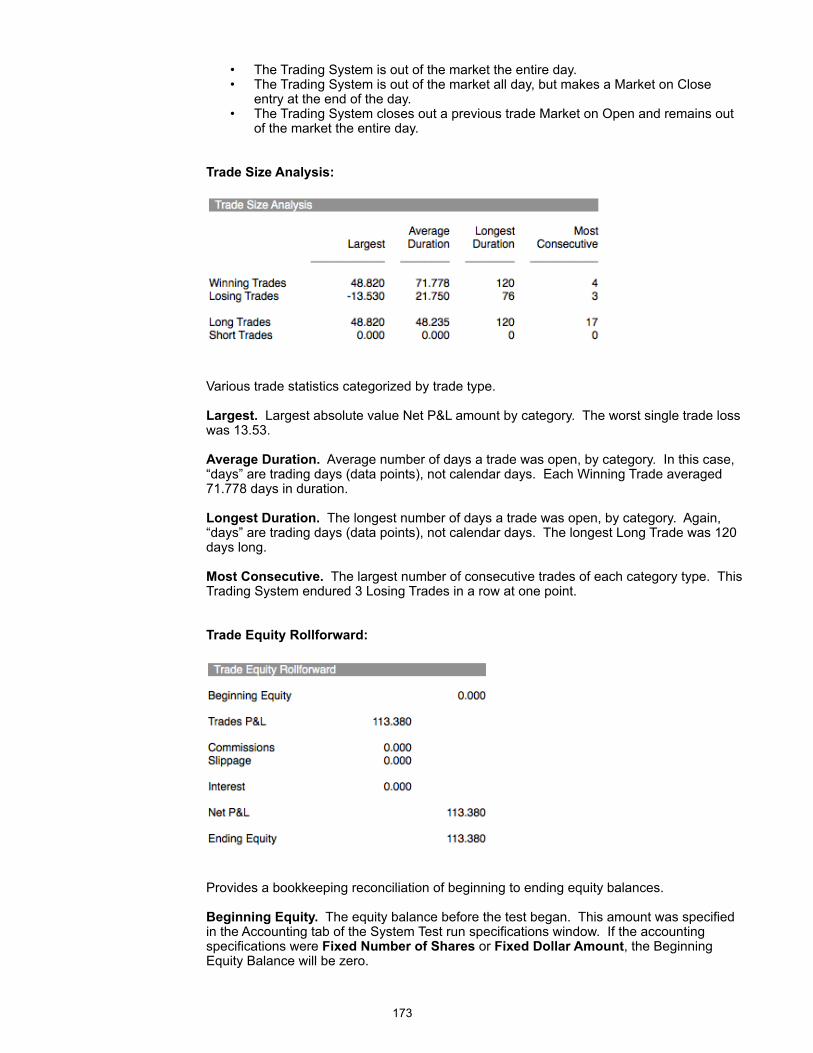
• The Trading System is out of the market the entire day. • The Trading System is out of the market all day, but makes a Market on Close
entry at the end of the day. • The Trading System closes out a previous trade Market on Open and remains out
of the market the entire day.
Trade Size Analysis:
!
Various trade statistics categorized by trade type.
Largest. Largest absolute value Net P&L amount by category. The worst single trade loss was 13.53.
Average Duration. Average number of days a trade was open, by category. In this case, “days” are trading days (data points), not calendar days. Each Winning Trade averaged 71.778 days in duration.
Longest Duration. The longest number of days a trade was open, by category. Again, “days” are trading days (data points), not calendar days. The longest Long Trade was 120 days long.
Most Consecutive. The largest number of consecutive trades of each category type. This Trading System endured 3 Losing Trades in a row at one point.
Trade Equity Rollforward:
!
Provides a bookkeeping reconciliation of beginning to ending equity balances.
Beginning Equity. The equity balance before the test began. This amount was specified in the Accounting tab of the System Test run specifications window. If the accounting specifications were Fixed Number of Shares or Fixed Dollar Amount, the Beginning Equity Balance will be zero.
!173
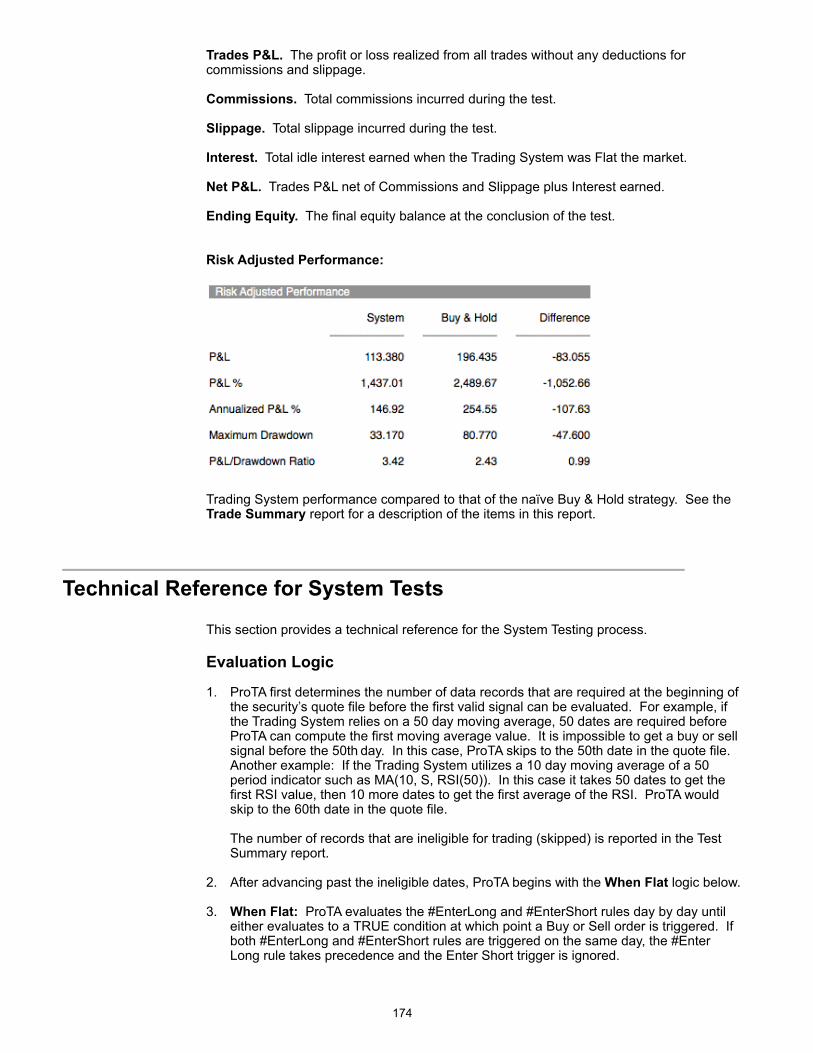
Trades P&L. The profit or loss realized from all trades without any deductions for commissions and slippage.
Commissions. Total commissions incurred during the test.
Slippage. Total slippage incurred during the test.
Interest. Total idle interest earned when the Trading System was Flat the market.
Net P&L. Trades P&L net of Commissions and Slippage plus Interest earned.
Ending Equity. The final equity balance at the conclusion of the test.
Risk Adjusted Performance:
!
Trading System performance compared to that of the naïve Buy & Hold strategy. See the Trade Summary report for a description of the items in this report.
!Technical Reference for System Tests
This section provides a technical reference for the System Testing process.
Evaluation Logic
1. ProTA first determines the number of data records that are required at the beginning of the security’s quote file before the first valid signal can be evaluated. For example, if the Trading System relies on a 50 day moving average, 50 dates are required before ProTA can compute the first moving average value. It is impossible to get a buy or sell signal before the 50th day. In this case, ProTA skips to the 50th date in the quote file. Another example: If the Trading System utilizes a 10 day moving average of a 50 period indicator such as MA(10, S, RSI(50)). In this case it takes 50 dates to get the first RSI value, then 10 more dates to get the first average of the RSI. ProTA would skip to the 60th date in the quote file.
The number of records that are ineligible for trading (skipped) is reported in the Test Summary report.
2. After advancing past the ineligible dates, ProTA begins with the When Flat logic below.
3. When Flat: ProTA evaluates the #EnterLong and #EnterShort rules day by day until either evaluates to a TRUE condition at which point a Buy or Sell order is triggered. If both #EnterLong and #EnterShort rules are triggered on the same day, the #Enter Long rule takes precedence and the Enter Short trigger is ignored.
!174
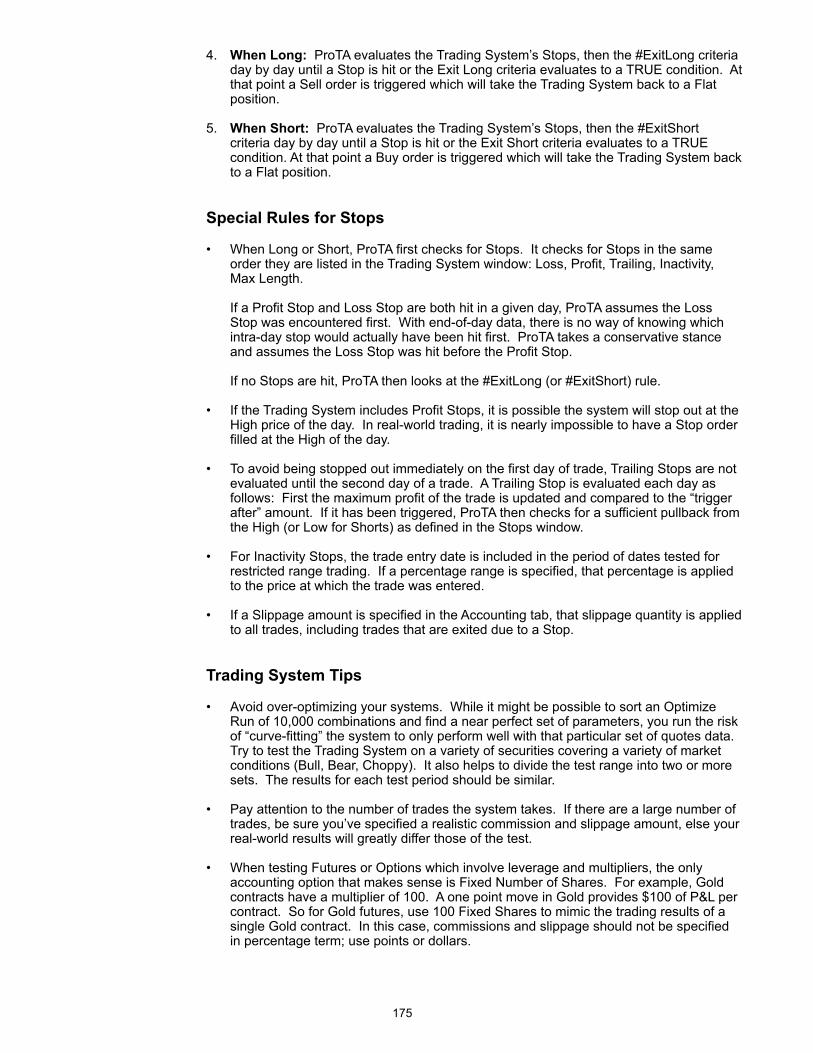
4. When Long: ProTA evaluates the Trading System’s Stops, then the #ExitLong criteria day by day until a Stop is hit or the Exit Long criteria evaluates to a TRUE condition. At that point a Sell order is triggered which will take the Trading System back to a Flat position.
5. When Short: ProTA evaluates the Trading System’s Stops, then the #ExitShort criteria day by day until a Stop is hit or the Exit Short criteria evaluates to a TRUE condition. At that point a Buy order is triggered which will take the Trading System back to a Flat position.
Special Rules for Stops
• When Long or Short, ProTA first checks for Stops. It checks for Stops in the same order they are listed in the Trading System window: Loss, Profit, Trailing, Inactivity, Max Length.
If a Profit Stop and Loss Stop are both hit in a given day, ProTA assumes the Loss Stop was encountered first. With end-of-day data, there is no way of knowing which intra-day stop would actually have been hit first. ProTA takes a conservative stance and assumes the Loss Stop was hit before the Profit Stop.
If no Stops are hit, ProTA then looks at the #ExitLong (or #ExitShort) rule.
• If the Trading System includes Profit Stops, it is possible the system will stop out at the High price of the day. In real-world trading, it is nearly impossible to have a Stop order filled at the High of the day.
• To avoid being stopped out immediately on the first day of trade, Trailing Stops are not evaluated until the second day of a trade. A Trailing Stop is evaluated each day as follows: First the maximum profit of the trade is updated and compared to the “trigger after” amount. If it has been triggered, ProTA then checks for a sufficient pullback from the High (or Low for Shorts) as defined in the Stops window.
• For Inactivity Stops, the trade entry date is included in the period of dates tested for restricted range trading. If a percentage range is specified, that percentage is applied to the price at which the trade was entered.
• If a Slippage amount is specified in the Accounting tab, that slippage quantity is applied to all trades, including trades that are exited due to a Stop.
Trading System Tips
• Avoid over-optimizing your systems. While it might be possible to sort an Optimize Run of 10,000 combinations and find a near perfect set of parameters, you run the risk of “curve-fitting” the system to only perform well with that particular set of quotes data. Try to test the Trading System on a variety of securities covering a variety of market conditions (Bull, Bear, Choppy). It also helps to divide the test range into two or more sets. The results for each test period should be similar.
• Pay attention to the number of trades the system takes. If there are a large number of trades, be sure you’ve specified a realistic commission and slippage amount, else your real-world results will greatly differ those of the test.
• When testing Futures or Options which involve leverage and multipliers, the only accounting option that makes sense is Fixed Number of Shares. For example, Gold contracts have a multiplier of 100. A one point move in Gold provides $100 of P&L per contract. So for Gold futures, use 100 Fixed Shares to mimic the trading results of a single Gold contract. In this case, commissions and slippage should not be specified in percentage term; use points or dollars.
!175
• Avoid using the ZigZag, PeakValue, and TroughValue functions in your Trading System definitions. These are calculated by ProTA with 20-20 hindsight; an advantage you won’t have when trading in real time.
• The same warning applies to the REF function when used with a positive Period parameter. When a positive Period is used, ProTA is shifting values from the future back to today.
• It is important that your quote files are free of errors and omissions. A transposed digit or a zero value, especially in the Closes field, will produce unreliable trading results. The garbage in, garbage out rule applies here.
! Other Uses for Trading Systems
In addition to Running a System Test, Trading Systems can be used elsewhere in the ProTA software:
• Chart Plots. Just like the built-in Indicators discussed in the Indicators chapter, you can plot a Trading System in any new or existing chart. Display Trading Systems in the suite’s Filer Browser in the upper-right then double-click any Trading Systems to plot the results in the currently selected chart. (Hold down the option key then double-click to add an Equity Line plot.)
• Content Table Columns. For a spreadsheet-style display of Trading System status (Long, Short, etc.), add a column of type “Trading System” to any Content Table. See the Content Table chapter for general instructions about adding a column and the Content Table Columns chapter for specifics about the Trading System column option.
• Custom Indicators, Smartlists, or Trading Systems within Trading Systems. ProTAscript allows you to refer to any previously written Trading System within any formula. The syntax to obtain the status of a Trading System named “My Awesome System” is:
Position(“My Awesome System”) {Returns 1 if Long, -1 if Short, 0 if Flat}
TradeTaken("My Awesome System") {Returns 1 , 2, -1, -2, 0 for Enter Long, Exit Long, Enter Short, Exit Short, or No Trade, respectively}
See the ProTAscript chapter for more information.
!176
ProTAscript
!Overview
ProTA includes a powerful formula-building language called ProTAscript. ProTAscript is used to:
• Write formulas for Custom Indicators.
(High + Low)/2 - MA(21);
• Define buy and sell signals in Trading Systems.
Enter Long: CrossesAbove(Close, MA(21)); Exit Long: CrossesBelow(Close, MA(21));
• Specify criteria for Smartlists.
RSI(14) > 60 AND IsRising(Volume);
The same language is used in all three areas of the program. Once you become comfortable writing Custom Indicators for example, you are well on your way to mastering Trading Systems and Smartlists.
Tip. There are a number of samples to review, included in the default ProTA installation. Take a look at the Custom Indicators and Smartlists that ship with ProTA.
!Structure of a Formula
The term formula refers interchangeably to a Custom Indicator formula, a buy or sell rule in a Trading System or a formula used as the criteria for a Smartlist.
Formulas can include the following types of instructions:
Parameters (optional)
Reference Variables (optional)
Final Calculation (required) or Multiple Outputs (optional)
Many simple formulas consist entirely of a single line (Final Calculation line), while others can span dozens of lines of Parameters, Reference Variables with Multiple Output lines.
In all cases, each line of code should be terminated with a semi-colon. For example:
Sum(Volume, 20)/20;
The next three sections discuss each part of the formula structure. In each section we will build up an example formula, My First Indicator. My First Indicator is a simple Oscillator that subtracts the 10 period moving average from the 21 period moving average. In this example, we like the moving average periods 10 and 21, but we’d also like to have flexibility to adjust these values when plotting My First Indicator in a chart.
!177
Parameters
Parameters allow you to assign a default numerical value to a defined name in the formula. A formula can contain an unlimited number of Parameters, but only the first 5 will be editable when plotting in a chart. Parameters are optional, but when they are used, they should come first in the formula. The syntax for a Parameter line is:
ParameterName: FLOATING POINT CONSTANT;
For My First Indicator, we might start off the first two lines of the formula as follows:
shortPeriod: 10; longPeriod: 21;
These two lines assign the specified values as defaults for each Parameter.
Reference Variables
Rather than aggregating your entire formula calculation into one long, single-line expression, you can use Reference Variables to break up the formula into several, more manageable and more readable sub-calculations. A formula can contain an unlimited number of Reference Variables. If used, Reference Variable lines should come after all of the Parameters. The syntax for a Reference Variable line is:
ReferenceVariableName := ANY EXPRESSION;
For My First Indicator, let’s compute the two moving averages before going on to subtract them. We’ll use two Reference Variables:
shortMA := MA(shortPeriod); longMA := MA(longPeriod);
These Reference Variable lines assign the moving average values to the variables named shortMA and longMA. Notice how the MA functions use the Parameters “shortPeriod” and “longPeriod”. When this formula is evaluated, ProTA substitutes “shortPeriod” and “longPeriod” with the values that are provided for the chart plot (see below).
Final Calculation
All formulas must contain the Final Calculation as the last line of the formula. Since Parameters and Reference Variables are optional, many simple formulas consist entirely of a single Final Calculation line.
The Final Calculation line is the value that is actually returned by the formula: the value that is plotted for a Custom Indicator, the buy/sell rule that is evaluated in a Trading System, or the criteria that is examined when Database Scanning. The syntax for the Final Calculation line is:
ANY EXPRESSION;
For My First Indicator, the Final Calculation would be:
shortMA - longMA;
The entire My First Indicator looks like this:
shortPeriod: 10; longPeriod: 21;
!178
shortMA := MA(shortPeriod); longMA := MA(longPeriod);
shortMA - longMA;
Multiple Outputs
Sometimes you will want to write a Custom Indicator that produces more than one output. For example, an indicator that plots trading bands 10% above and below a Moving Average line. You could write two separate indicators, one for the upper band and one for the lower band. But it is much simpler to write a single indicator to produce both outputs.
Any Reference Variable line or the Final Calculation line that is preceded with the # symbol will produce output that will be plotted in the chart. Up to 5 lines can be prefixed with # to produce up to 5 outputs per Custom Indicator formula. For example:
Period:5; PercentShift:10;
ShiftAmt:= MA(Period) * PercentShift / 100;
#UpperLine:= MA(Period) + ShiftAmt; #LowerLine:= MA(Period) - ShiftAmt;
Advantage of Using Parameters
Custom Indicators. If we did not use any Parameters (or Reference Variables), My First Indicator could be condensed into a single line formula:
MA(10) - MA(21);
The advantage of the longer version is primarily in the use of Parameters. The short version has ‘10’ and ‘21’ “hard-coded” into the formula. Every time you plot the short version of this formula, it will use 10 and 21 in the computation. If you later decide that 13 and 36 might be worth a look, you would have to re-write the formula using these values. But with the longer, Parameter version of the formula, you have the option of altering the 10 and 21 defaults in the Inspector window associated with the plotted indicator.
Inspector window when plotting the shorter version (with no Parameters):
!
Inspector window when plotting the longer version (with Parameters):
!179

!
Trading Systems. Parameters are also important when defining buy/sell rules in Trading Systems. You cannot optimize Trading Systems that do not use Parameters. However, with Parameters included, you can test a range of parameter combinations looking for the best possible values.
For example, if the Enter Long rule is:
shortPeriod: 10; longPeriod: 21;
shortMA := MA(shortPeriod); longMA := MA(longPeriod);
#EnterLong:=CrossesAbove(shortMA, longMA); #ExitLong:=CrossesBelow(shortMA, longMA);
You can perform an Optimize Run to test hundreds or thousands of combinations of periods looking for best combination of values:
! Formula Re-Use. ProTAscript includes several functions that allow you to call into any other Custom Indicator or Trading System that you have already written and saved to disk. If those saved formulas include Parameters, you can pass in values to those formulas. For example, if we had already saved My First Indicator to disk, we could write a second formula that calls into My First Indicator as follows:
FN(“My First Indicator”, 15, 30);
!180
In this case, our formula would evaluate My First Indicator by substituting 15 and 30 for the shortPeriod and longPeriod Parameters.
See the ProTAscript chapter for more information about the CustInd or FN function used above.
Parameter and Variable Names
Parameter and Reference Variable names can be any series of letters and numbers you choose with the following exceptions:
• The name must be 25 letters or less.
• The first character must be a letter.
• A name cannot be the same as any reserved function name in the ProTAscript language.
• Names cannot be assigned a value more than once in the formula.
Whitespace is Ignored
Spaces, Tabs and Returns are ignored. You can add spaces, tabs and line breaks throughout your formula to improve readability. The only time spacing is required is for the logical operators AND and OR. Both of these keywords must be preceded and followed by a space character.
The following two formulas are identical:
Close>20 AND Close<40;
Close > 20 AND Close < 40;
Case is Insensitive
Lower and upper case letters are interchangeable. The following are evaluated identically:
IF(Slope(Close, 1)>0, Volume, -Volume);
If(SLOPE(CLOSE,1)>0, volume, -VOLUME);
Comments Placed Between { } are Ignored
You can add comments throughout your formulas by placing the comment text in between { } characters. All text, including line breaks, in between { } is ignored.
myMin: 20; {set minimum to 20} myMax: 40; {set maximum to 40}
Close > myMin AND Close < myMax; {must fall between min and max}
!181
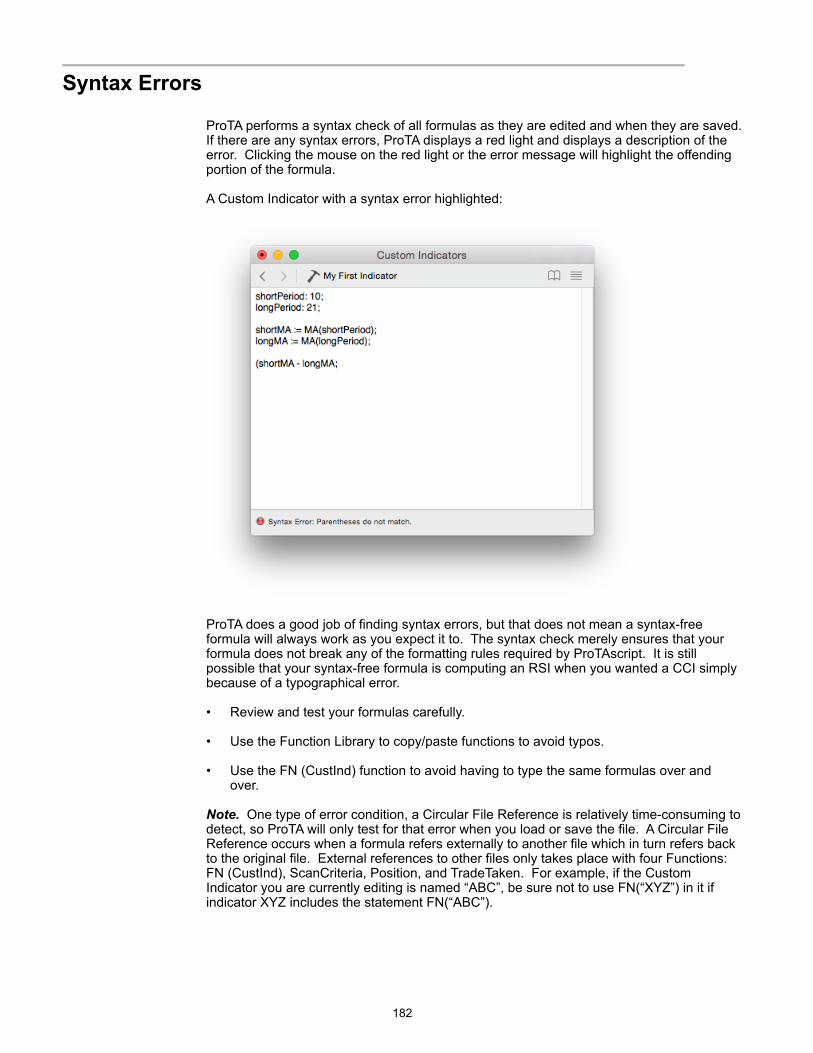
!Syntax Errors
ProTA performs a syntax check of all formulas as they are edited and when they are saved. If there are any syntax errors, ProTA displays a red light and displays a description of the error. Clicking the mouse on the red light or the error message will highlight the offending portion of the formula.
A Custom Indicator with a syntax error highlighted:
!
ProTA does a good job of finding syntax errors, but that does not mean a syntax-free formula will always work as you expect it to. The syntax check merely ensures that your formula does not break any of the formatting rules required by ProTAscript. It is still possible that your syntax-free formula is computing an RSI when you wanted a CCI simply because of a typographical error.
• Review and test your formulas carefully.
• Use the Function Library to copy/paste functions to avoid typos.
• Use the FN (CustInd) function to avoid having to type the same formulas over and over.
Note. One type of error condition, a Circular File Reference is relatively time-consuming to detect, so ProTA will only test for that error when you load or save the file. A Circular File Reference occurs when a formula refers externally to another file which in turn refers back to the original file. External references to other files only takes place with four Functions: FN (CustInd), ScanCriteria, Position, and TradeTaken. For example, if the Custom Indicator you are currently editing is named “ABC”, be sure not to use FN(“XYZ”) in it if indicator XYZ includes the statement FN(“ABC”).
!182
!Elements of the ProTAscript Language
There are over 150 elements in ProTAscript than can be used to construct a wide range of mathematical functions and logical analyses.
ProTAscript elements can be divided into four major categories: Quote Field, Fundamental Data, Operators and Functions.
Quote Field elements
Quote Field elements permit access to the six data fields of the security. They can be accessed using either the long or short name:
Long Name Short Name Open O High H Low L Close C Volume V OpenInterest I
Close + 5; {plots the Closing price shifted up 5 points}
(H + L) / 2; {plots the midpoint of the High-Low range}
Fundamental Data elements
Each Stock has up to 20 Fundamental Data values associated with it. These values are automatically pulled from Yahoo! during ProTA’s data acquisition sessions.
$BookValue Book Value per Share $DivPerShare Annual Dividend per Share $DivYield Dividend Yield $EBITDA Earnings Before Income Taxes, Depreciation, Amortization $EPS Earnings per Share $EPSEstCY EPS Estimate for Current Year $EPSEstNQ EPS Estimate for Next Quarter $EPSEstNY EPS Estimate for Next Year $FloatShares Number of Floating Shares $MarketCap Market Capitalization $OneYearTarget Average of Analysts’ One Year Price Target $PEGRatio Price/Earnings to Growth Ratio $PERatio Price/Earnings Ratio $PriceBookRatio Price/Book Value Ratio $PriceEPSEstCYRatio Price/Earnings (Estimated Current Year) Ratio $PriceEPSEstNYRatio Price/Earnings (Estimated Next Year) Ratio $PriceSalesRatio Price/Sales Ratio $Revenue Revenue (Sales) $SharesOutstanding Shares Outstanding $ShortRatio Short Ratio
{stocks with a P/E Ratio between 5 and 20:} $PERatio < 20 AND $PERatio > 5;
{stocks with a Market Capitalization over a billion with negative earnings:} $MarketCap > 1000000000 AND $EPS < 0;
!183
Operators
Operators provide the basic math, comparison, and logic functions.
Math Operators:
+ Addition - Subtraction * Multiplication / Division
Comparison Operators:
< Less than <= Less than or equal to > Greater than >= Greater than or equal to = Equals <> Not equals
Logical Operators:
AND Logical AND (both conditions must be TRUE) OR Logical OR (either condition must be TRUE)
Note. AND and OR must be preceded and followed by a space or Tab character.
Result of Operations:
• The result of Math operations is numerical.
• The result of Comparison and Logical operations is a Boolean: TRUE or FALSE. In ProTA, TRUE is plotted as a value of 1, FALSE is plotted as a value of 0.
• When ProTA needs to perform a Boolean operation but a numerical value is provided, all non-zero values are considered TRUE and all zero values are considered FALSE.
Functions
The power and depth of ProTAscript lies in its Function library. Functions perform a wide variety of mathematical operations including indicator math, pattern recognition, and price analyses.
See the Functions Reference section for details on each Function.
Pragmas
Your formulas can optionally contain several pragmas indicating special meta-processing takes place when using the formula. Pragmas are case insensitive, but must not contain any spaces and always begin with the ! character. They can be placed anywhere in the formula but the most common practice is to place them at the very beginning of the formula text.
!PriceScale When this is plotted as a Custom Indicator, it will be added to the same pane and Y-Axis as the price plots such as Bars or Candles.
!VolumeScale When this is plotted as a Custom Indicator, it will be added to the same pane and Y-Axis as a Volume-based plot.
!Weekly The formula will be computed using Weekly source data rather than the basic Daily data found in the quote file.
!184
!Monthly The formula will be computed using Monthly source data rather than the basic Daily data found in the quote file.
!IgnoreZeros When this is plotted as a Custom Indicator, the line plot will not attempt to connect to zero values.
A pragma would be useful, for example, in the Custom Indicator written as follows:
MA(21) + 5; {plot the MA shifted up 5 points}
When the above Custom Indicator is added to a chart, it will be added in its own new Pane. But most likely, you would prefer this indicator is merged into the Pane and Y-Axis of the existing price plots such as Bars, Candles. Adding the !PriceScale pragma tells ProTA to add this plot to the existing price plots Pane and Y-Axis.
!PriceScale
MA(21) + 5; {plot the MA shifted up 5 points}
!Order of Operations
Formulas are generally evaluated top to bottom:
1. Parameter values are substituted into the formula. 2. Reference Variable lines are evaluated, first to last. 3. The Final Calculation line is evaluated.
Each calculation is interpreted in the same manner as most computer languages/spreadsheets/formularies. The order of operations from first to last is as follows:
• Quotes, Fundamentals and Functions • Expressions in parentheses • Negative sign before values • *, / • +, - • =, <, >, <=, >=, <> • AND, OR
Within each category, evaluation is performed left to right.
!Function Library
ProTA includes a handy in-program reference to ProTAscript.
• In any of the authoring windows (Custom Indicators, Smartlists, Trading Systems), click the Show/Hide Function Library button in the upper-right.
!185
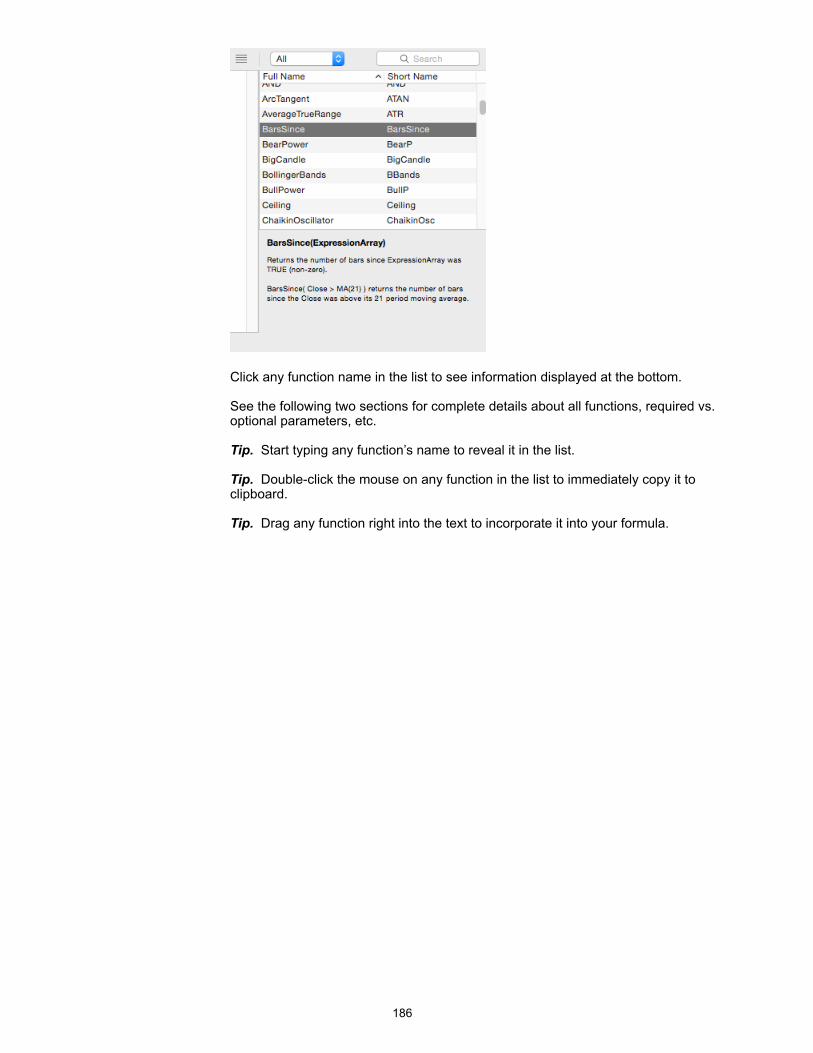
!
Click any function name in the list to see information displayed at the bottom.
See the following two sections for complete details about all functions, required vs. optional parameters, etc.
Tip. Start typing any function’s name to reveal it in the list.
Tip. Double-click the mouse on any function in the list to immediately copy it to clipboard.
Tip. Drag any function right into the text to incorporate it into your formula.
!186
!Function Summary
ProTAscript includes over 100 Functions which provide a wide variety of ready-to-use mathematical and analytical calculations.
The Function Reference in the next section lists each Function in alphabetical order with details about its syntax and purpose. This section provides a summary of Functions grouped by type.
Long Name Short Name
Built-in Indicators: Identical to the ProTA built-in Indicators.
AccumulationDistribution AD AdvanceDecline AdvDecl AutoTrendline AutoTL AverageTrueRange ATR BearPower BearP BollingerBands BBands BullPower BullP ChaikinOscillator ChaikinOsc CommodityChannelIndex CCI DirectionalMovement DM EaseOfMovement EOM ExchangeVolume ExchVol ExternalReference XREF ForceIndex Force LinearRegressionForecast LRF MACD MACD MarketFacilitationIndex WMFI McClellanOscillator McOsc MedianPrice MP MoneyFlowIndex MFI MovingAverage MA NegativeVolumeIndex NVI NetHighsLows NetHL OnBalanceVolume OBV ParabolicSAR Parabolic Performance Perf PositiveVolumeIndex PVI PriceVolumeTrend PVT PutCallRatio PutCall PutVolumeIndicator BPVI RateOfChange ROC RelativePerformance RelPerf RelativeStrengthIndex RSI Spread Spread StandardDeviation StDev Stochastics Stoch TRIN TRIN TRIX TRIX TypicalPrice TP Volatility Volatility WeightedClose WC WilliamsAccumDist WAD WilliamsPercentR PercentR ZigZag ZigZag
!187
Date Related: Provides Day, Month Year values.
DayOfMonth DayOfMonth DayOfWeek DayOfWeek Month Month Year Year
External Calls: Return values from other Custom Indicators, Trading Systems, Smartlists or other External Files.
CustInd FN Position Pos ScanCriteria ScanFN TradeTaken Traded
External File XFile
Math: Perform basic math functions.
AbsoluteValue ABS ArcTangent ATAN Ceiling Ceiling Change Change Cosine COS Cumulate CUM Exponent EXP Floor Floor Fraction FRAC Integer INT Log LOG Maximum MAX Minimum MIN Modulus MOD Power Power Round Round RoundDown RoundDown RoundUp RoundUp Sine SIN Slope Slope SquareRoot SQRT Summation SUM
Patterns: Candlestick and other basic pattern recognition.
BigCandle BigCandle DarkCloudCover DarkCloudCover Doji Doji DojiStar DojiStar EngulfingLine EngulfingLine EveningDojiStar EveningDojiStar EveningStar EveningStar Gap Gap GapDown GapDown GapUp GapUp GravestoneDoji GravestoneDoji Hammer Hammer Harami Harami HaramiCross HaramiCross InsideDay InsideDay KeyReversalDay KeyReversalDay MorningDojiStar MorningDojiStar MorningStar MorningStar OutsideDay OutsideDay PiercingLine PiercingLine
!188
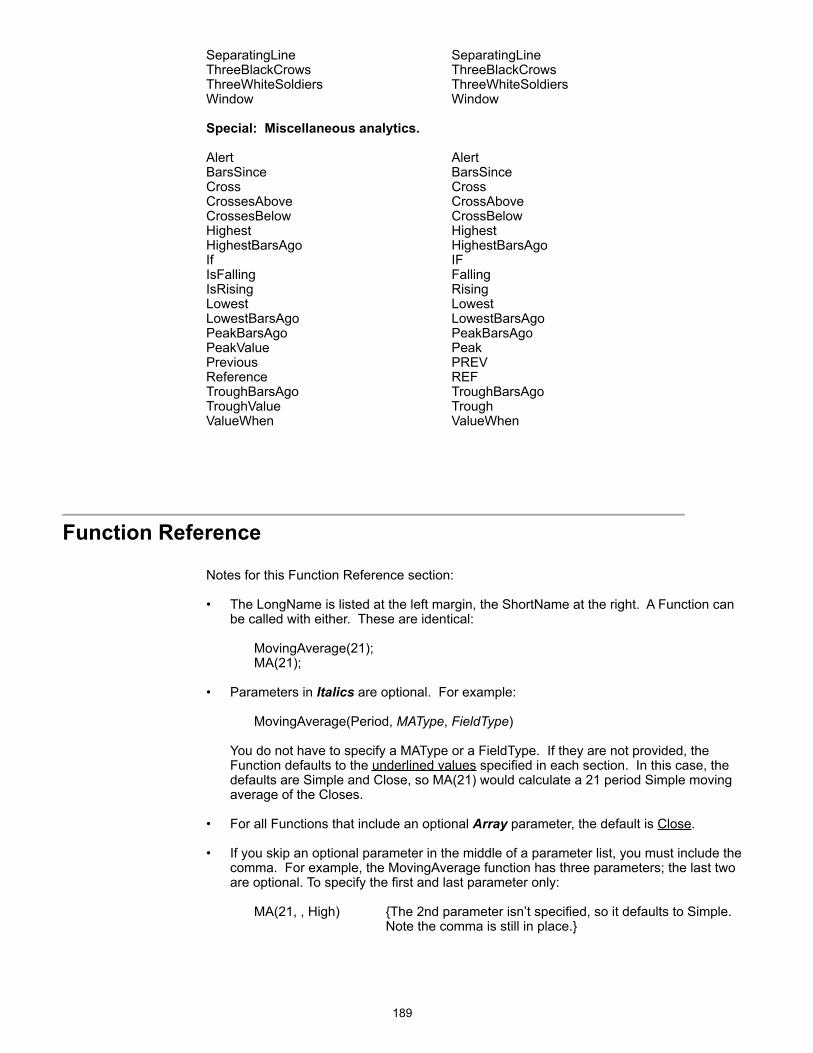
SeparatingLine SeparatingLine ThreeBlackCrows ThreeBlackCrows ThreeWhiteSoldiers ThreeWhiteSoldiers Window Window
Special: Miscellaneous analytics.
Alert Alert BarsSince BarsSince Cross Cross CrossesAbove CrossAbove CrossesBelow CrossBelow Highest Highest HighestBarsAgo HighestBarsAgo If IF IsFalling Falling IsRising Rising Lowest Lowest LowestBarsAgo LowestBarsAgo PeakBarsAgo PeakBarsAgo PeakValue Peak Previous PREV Reference REF TroughBarsAgo TroughBarsAgo TroughValue Trough ValueWhen ValueWhen
!Function Reference
Notes for this Function Reference section:
• The LongName is listed at the left margin, the ShortName at the right. A Function can be called with either. These are identical:
MovingAverage(21); MA(21);
• Parameters in Italics are optional. For example:
MovingAverage(Period, MAType, FieldType)
You do not have to specify a MAType or a FieldType. If they are not provided, the Function defaults to the underlined values specified in each section. In this case, the defaults are Simple and Close, so MA(21) would calculate a 21 period Simple moving average of the Closes.
• For all Functions that include an optional Array parameter, the default is Close.
• If you skip an optional parameter in the middle of a parameter list, you must include the comma. For example, the MovingAverage function has three parameters; the last two are optional. To specify the first and last parameter only:
MA(21, , High) {The 2nd parameter isn’t specified, so it defaults to Simple. Note the comma is still in place.}
!189
• INTEGER CONSTANT. Some Functions require an INTEGER CONSTANT as one of the parameters. An INTEGER CONSTANT is any number value without a decimal or fractional portion.
21 1 250
• FLOATING POINT CONSTANT. Some Functions require a FLOATING POINT CONSTANT as one of the parameters. A FLOATING POINT CONSTANT is any numerical value.
21 1.65 -8.839 3987.467 0.0052
• ARRAY. Some Functions require an ARRAY as one of the parameters. An ARRAY is any numerical value or mathematical expression. An ARRAY can be virtually any expression that can be specified using the ProTAscript.
21 -8.839 109 + 3.67 Close High + 5 MA(21) - Close IF(Close>Open, Volume * 10, Volume * 8)
• TYPE WORD. Some Functions require a TYPE WORD as one of the parameters. A TYPE WORD is one of a special set of keywords that are specified within each Function section below.
MA(21, Exponential) {Exponential is a TYPE WORD that specifies the MAType}
BBands(20, 2, UB) { UB is a TYPE WORD that specifies the Upper Band of the Bollinger Bands}
!190
AbsoluteValue ABS
ABS (Array)
Returns the Absolute Value of the Array. Absolute Value is the number without its sign.
• ABS(-10.7) returns 10.7 • ABS(10.7) returns 10.7
AccumulationDistribution AD
AD (Period)
Period: An INTEGER CONSTANT specifying the period for the indicator calculation. Normally 1.
Calculates the Accumulation/Distribution indicator. Identical to the built-in Accumulation/Distribution indicator.
• AD(1) is the standard Accumulation/Distribution indicator.
AdvanceDecline AdvDecl
AdvDecl (“EXCHANGE PREFIX”, Period, Type)
“EXCHANGE PREFIX”: Text enclosed in quotation marks that specifies which AD quote file to use for the calculation. Normally “NYSE”, “NASD” or “AMEX” for the NYSE AD, NASD AD, or AMEX AD market data files. The indicated quote file must be present in your Market Data section.
Period: An INTEGER CONSTANT specifying the period for the indicator calculation. Normally 1.
Type: A TYPE WORD specifying the type of Advance-Decline calculation. AD: Advances - Declines ADU: (Advances - Declines) / Unchanged ADAD: (Advances - Declines) / (Advances + Declines)
Calculates the Advance-Decline (General Market) indicator. Identical to the built-in Advance-Decline (General Market) indicator.
• AdvDecl(“NYSE”, 1) calculates Advancing issues minus Declining issues on the NYSE.
• AdvDecl(“NYSE”, 1, ADU) calculates (Advancing issues minus Declining issues) divided by Unchanged issues on the NYSE.
• CUM(AdvDecl(“NYSE”, 1)) is the standard NYSE “Advance-Decline Line”.
Alert Alert
Alert (Array, Period)
Period: An INTEGER CONSTANT or ARRAY specifying the number of bars to extend the TRUE condition.
Returns TRUE when Array is TRUE (non-zero) and also extends the TRUE results Period bars forward starting with today.
!191
• Alert(Volume > 10000, 3) returns TRUE when the Volume is greater than 10000 and also TRUE for the following 2 bars even if the Volume is not greater than 10000 on the 2 subsequent days.
• Alert(C>10, 1) is identical to C>10.
ArcTangent ATAN
ATAN (Array1, Array2)
Returns the ArcTangent of Array1/Array2 where Array1 and Array2 are presumably y, x coordinates. The values returned are in degrees from 0 to 359. 0 degrees is the right x-axis, 90 degrees is the upper y-axis, 180 degrees is the left x-axis, and 270 degrees is the lower y-axis.
• ATAN(0, 1) returns 0 • ATAN(1, 1) returns 45 • ATAN(1, 0) returns 90
AutoTrendline AutoTL
AutoTL (Lookback Period, Exclusion Period, Type)
Lookback Period: An INTEGER CONSTANT specifying the most recent Bars to analyze.
Exclusion Period: An INTEGER CONSTANT specifying the most recent Bars to exclude from the analysis.
Type: A TYPE WORD specifying the type of trendline value to compute:
Support: Upward-sloping Support Line value Resistance: Downward-sloping Resistance Line value
Calculates the Auto Trendlines indicator. Identical to the built-in Auto Trendines indicator.
• AutoTL(250,10,Support) returns the value of the upward-sloping Support Line defined via review of the most recent 250 Bars, but excluding the 10 most recent Bars.
AverageTrueRange ATR
ATR (Period)
Period: An INTEGER CONSTANT specifying the period for the indicator calculation.
Calculates the Average True Range indicator. Identical to the built-in Average True Range indicator.
• ATR(14) is the 14 period Average True Range indicator.
BarsSince BarsSince
BarsSince (Array)
Returns the number of Bars (time periods) since Array was TRUE.
!192
• BarsSince(Close > MA(21)) returns the number of Bars since the Close was above its 21 day average.
BearPower BearP
BearP (Period)
Period: An INTEGER CONSTANT specifying the period for the indicator calculation.
Calculates the Bear Power indicator. Identical to the built-in Bear Power indicator.
• BearP(13) is the 13 period Bear Power indicator.
BigCandle BigCandle
BigCandle (Type)
Type: A TYPE WORD specifying the type of candle patterns to identify. Any: Both Bullish and Bearish Big Candles Bull: Bullish Big Candles Bear: Bearish Big Candles
Returns TRUE when a Big Candle formation is detected, otherwise FALSE. See the Indicators chapter for a description of Candlestick patterns.
• BigCandle(Bull) returns TRUE when a Bullish Big Candle is detected.
• BigCandle() returns TRUE when any Big Candle is detected.
BollingerBands BBands
BBands (Period, Deviations, Type, Array)
Period: An INTEGER CONSTANT specifying the period for the indicator calculation.
Deviations: A FLOATING POINT CONSTANT specifying the number of standard deviations for the bands.
Type: A TYPE WORD specifying the type of Bollinger Band value to compute. %B or %: %B oscillator UB or UpperBand: Upper Band LB or LowerBand: Lower Band
Calculates the specified component of the Bollinger Bands indicator. Identical to the built-in Bollinger Bands indicator.
• BBands(20, 1.95, UB, High) returns the upper band value of the 20 period, 1.95 deviations Bollinger Band indicator using the security’s High field as the basis of calculation.
• BBands(20, 1.95)) returns the %B value of the 20 period, 1.95 deviations Bollinger Band indicator using the security’s Close field as the basis of calculation.
!193
BullPower BullP
BullP (Period)
Period: An INTEGER CONSTANT specifying the period for the indicator calculation.
Calculates the Bull Power indicator. Identical to the built-in Bull Power indicator.
• BullP(13) is the 13 period Bull Power indicator.
Ceiling Ceiling
Ceiling (Array, Multiple)
Multiple: A FLOATING POINT CONSTANT specifying the rounding multiple.
Returns the smallest multiple of Multiple that is greater than or equal to the Array value.
• Ceiling(Close, 0.25) returns the Close rounded up to the nearest quarter point.
ChaikinOscillator ChaikinOsc
ChaikinOsc (LongPeriod, ShortPeriod)
LongPeriod, ShortPeriod: Two INTEGER CONSTANTS specifying the periods for the indicator calculation.
Calculates the Chaikin Oscillator indicator. Identical to the built-in Chaikin Oscillator indicator.
• ChaikinOsc(10, 3) is the standard Chaikin Oscillator indicator.
Change Change
Change (Array, Period)
Period: An INTEGER CONSTANT or ARRAY specifying the lookback period. Defaults to 1.
Returns the change in Array compared to Periods ago.
• Change(C, 2) returns the Close minus the Closes 2 periods ago.
• Change(RSI(14)) returns the 1 period change in the 14 period RSI indicator.
CommodityChannelIndex CCI
CCI (Period)
Period: An INTEGER CONSTANT specifying the period for the indicator calculation.
Calculates the Commodity Channel Index indicator. Identical to the built-in Commodity Channel Index indicator.
• CCI(14) is the 14 period Commodity Channel Index indicator.
!194
Cosine COS
COS (Array)
Returns the Cosine of Array. The Array value(s) should be in degrees.
• COS(30) returns 0.866
Cross Cross
Cross (Array1, Array2)
Returns TRUE on days when Array1 has crossed above or below Array2, otherwise returns FALSE.
• Cross(Close, 20) is TRUE when the Close moves from above 20 to below 20 or when the Close moves from below 20 to above 20.
CrossesAbove CrossAbove
CrossAbove (Array1, Array2)
Returns TRUE on days when Array1 has crossed above Array2, otherwise returns FALSE.
• CrossAbove(Close, 20) is TRUE when the Close moves from below 20 to above 20.
CrossesBelow CrossBelow
CrossBelow (Array1, Array2)
Returns TRUE on days when Array1 has crossed below Array2, otherwise returns FALSE.
• CrossBelow(Close, 20) is TRUE when the Close moves from above 20 to below 20.
Cumulate CUM
CUM (Array)
Calculates a cumulative summation of Array dating back to the beginning of the Array.
• CUM(Close) is a running total of all Closing values.
• CUM(1) returns the current Bar (data point) count . The first date in the quote file is 1, the second date is 2, etc.
CustInd FN
FN (“Custom Indicator Name”, Param1, Param2, Param3, Param4, Param5)
“Custom Indicator Name”: Text enclosed in quotation marks that specifies the name of a previously created and saved Custom Indicator file.
!195
Param1-5: Optional values can be passed into the Custom Indicator to be used in place of the default Parameters.
Returns an array of values as calculated by the specified Custom Indicator.
• FN(“My Awesome Oscillator”) returns the values calculated by My Awesome Oscillator. If the saved formula for My Awesome Oscillator is:
period:27 MA(period)
Then FN(“My Awesome Oscillator”) is identical to MA(27).
FN(“My Awesome Oscillator”, 13) is identical to MA(13).
DarkCloudCover DarkCloudCover
DarkCloudCover ()
Returns TRUE when a Dark Cloud Cover formation is detected, otherwise FALSE. See the Indicators chapter for a description of Candlestick patterns.
• DarkCloudCover () returns TRUE when a Dark Cloud Cover pattern is detected.
DayOfMonth DayOfMonth
DayOfMonth ()
Returns the calendar day of month from the quote file.
• When plotted in a chart, the value for March 9, 2006 would be 9.
DayOfWeek DayOfWeek
DayOfWeek ()
Returns the day of week from the quote file.
1 = Monday 2 = Tuesday 3 = Wednesday 4 = Thursday 5 = Friday 6 = Saturday 7 = Sunday
• When plotted in a chart, the value for Thursday, March 9, 2006 would be 4.
DirectionalMovement DM
DM (DXPeriod, ADXPeriod, ADXRPeriod, Type)
DXPeriod, ADXPeriod, ADXRPeriod: 3 INTEGER CONSTANTS specifying the periods for the indicator calculation.
Type: A TYPE WORD specifying the component of Directional Movement system to compute.
!196
ADX: ADX line MinusDI or -DI: -DI line PlusDI or +DI: +DI line DX: DX line ADXR: ADXR line
Calculates the specified component of the Directional Movement system. Identical to the built-in Directional Movement indicator.
• DM(14, 14, 14, ADXR) returns the 14 period ADXR line.
• DM(14, 14, 14) returns the 14 period ADX line.
Doji Doji
Doji ()
Returns TRUE when a Doji formation is detected, otherwise FALSE. See the Indicators chapter for a description of Candlestick patterns.
• Doji () returns TRUE when a Doji pattern is detected.
DojiStar DojiStar
DojiStar ()
Returns TRUE when a Doji Star formation is detected, otherwise FALSE. See the Indicators chapter for a description of Candlestick patterns.
• DojiStar () returns TRUE when a Doji Star pattern is detected.
EaseOfMovement EOM
EOM (Period)
Period: An INTEGER CONSTANT specifying the period for the indicator calculation.
Calculates the Ease of Movement indicator. Identical to the built-in Ease of Movement indicator.
• EOM(26) is the 26 period Ease of Movement indicator.
EngulfingLine EngulfingLine
EngulfingLine (Type)
Type: A TYPE WORD specifying the type of candle patterns to identify. Any: Both Bullish and Bearish Engulfing Line candles Bull: Bullish Engulfing Line candles Bear: Bearish Engulfing Line candles
Returns TRUE when an Engulfing Line formation is detected, otherwise FALSE. See the Indicators chapter for a description of Candlestick patterns.
• EngulfingLine(Bear) returns TRUE when a Bearish Engulfing Line pattern is detected.
!197
• EngulfingLine () returns TRUE when any Engulfing Line pattern is detected.
EveningDojiStar EveningDojiStar
EveningDojiStar ()
Returns TRUE when an Evening Doji Star formation is detected, otherwise FALSE. See the Indicators chapter for a description of Candlestick patterns.
• EveningDojiStar () returns TRUE when an Evening Doji Star pattern is detected.
EveningStar EveningStar
EveningStar ()
Returns TRUE when an Evening Star formation is detected, otherwise FALSE. See the Indicators chapter for a description of Candlestick patterns.
• EveningStar () returns TRUE when an Evening Star pattern is detected.
ExchangeVolume ExchangeVolume
ExchVol (“EXCHANGE PREFIX”, Period, Type)
“EXCHANGE PREFIX”: Text enclosed in quotation marks that specifies which VOL quote file to use for the calculation. Normally “NYSE”, “NASD” or “AMEX” for the NYSE VOL, NASD VOL, or AMEX VOL market data files. The indicated quote file must be present in your Market Data section.
Period: An INTEGER CONSTANT specifying the period for the indicator calculation. Normally 1.
Type: A TYPE WORD specifying the type of Exchange Volume calculation. UD: UpVol - DownVol UDT: (UpVol - DownVol) / TotVol UDUD: (UpVol - DownVol) / (UpVol + DownVol)
Calculates the Up-Down Volume (General Market) indicator. Identical to the built-in Exchange Up-Down Volume (General Market) indicator.
• ExchVol(“NYSE”, 1) calculates Up Volume minus Down Volume on the NYSE.
• ExchVol (“NYSE”, 1, UDT) calculates (Up Volume minus Down Volume) divided by Total Volume on the NYSE.
Exponent EXP
EXP (Array)
Computes e raised to the power specified in Array.
• EXP(2) is e squared
!198
ExternalReference XREF
XREF (“TICKER”, SecurityType, FieldType, NormType, “NormDate”)
“TICKER”: Text enclosed in quotation marks that specifies a ticker symbol for a security in your quotes database.
SecurityType: A TYPE WORD specifying the security’s type. S or Stock M or MutualFund I or Index F or Futures O or Option B or Bond D or MarketData
FieldType: A TYPE WORD specifying the field to access in the specified security’s quote file.
C or Close O or Open H or High L or Low
NormType: A TYPE WORD specifying the Normalization method. N or None A or Arithmetic R or Ratio
“NormDate”: Text enclosed in quotation marks that specifies the date at which to Normalize the two securities. Defaults to “12/31/04”.
Returns the specified pricing data of another security. Identical to the built-in Price Plot (Comparison Overlay) indicator.
• XREF(“AAPL”, S) returns the Closing prices from the AAPL stock quote file.
• XREF(“IBM”, S, O) returns the Opening prices from the IBM stock quote file.
• XREF(“SPX”, I, , R, “1/1/95”) returns the Closing prices from the SPX index quote file after normalizing the SPX data to match on 1/1/95 using a ratio method.
ExternalFile XFILE
XFILE (“Filename”)
“Filename”: Text enclosed in quotation marks that specifies a user-created text file.
Note. Choose Preferences from the ProTA menu, then click the General icon to set the root folder location where the XFILE function should look for the data files.
The user-created text file should be in the format:
Date, Value (comma or tab delimited, each line ending with a Return or LineFeed)
• XFILE(“MyDataFile.txt”) returns the values from the file MyDataFile.txt.
If the data file is located in a subfolder, you can specify the path to the file using / separators:
• XFILE(“Signals/MyDataFile.txt”) returns the values from the file MyDataFile.txt located in a folder named Signals.
!199
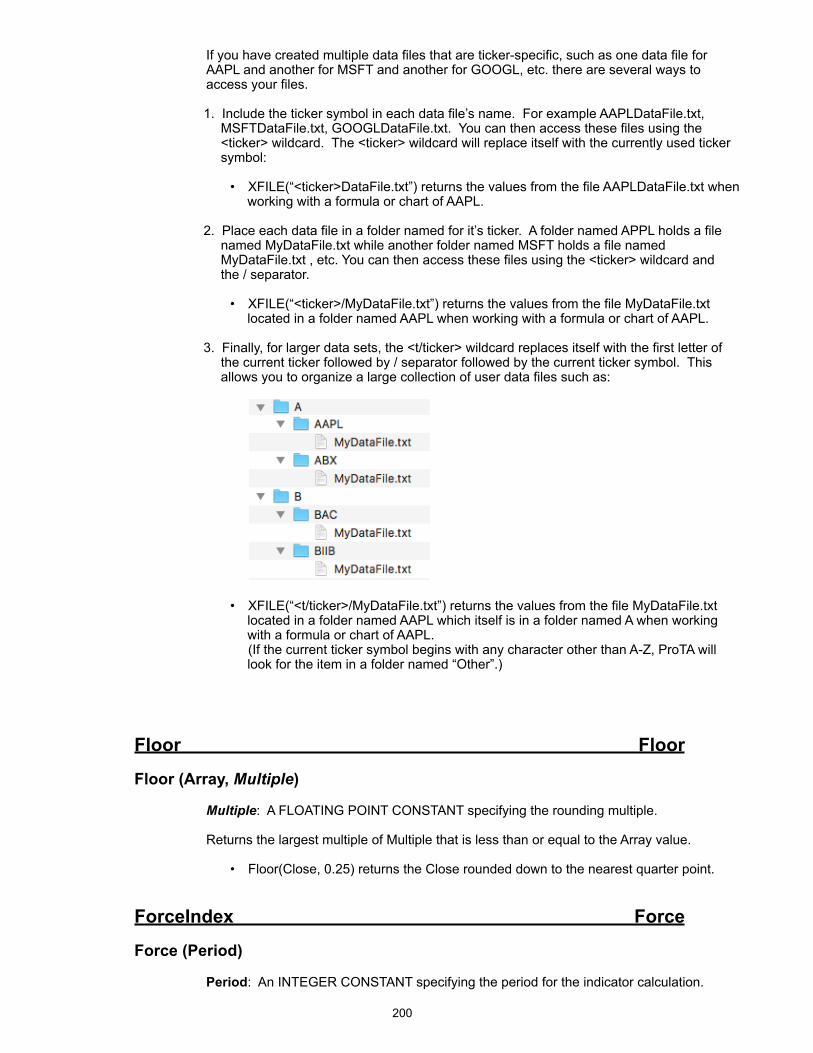
If you have created multiple data files that are ticker-specific, such as one data file for AAPL and another for MSFT and another for GOOGL, etc. there are several ways to access your files.
1. Include the ticker symbol in each data file’s name. For example AAPLDataFile.txt, MSFTDataFile.txt, GOOGLDataFile.txt. You can then access these files using the <ticker> wildcard. The <ticker> wildcard will replace itself with the currently used ticker symbol:
• XFILE(“<ticker>DataFile.txt”) returns the values from the file AAPLDataFile.txt when working with a formula or chart of AAPL.
2. Place each data file in a folder named for it’s ticker. A folder named APPL holds a file named MyDataFile.txt while another folder named MSFT holds a file named MyDataFile.txt , etc. You can then access these files using the <ticker> wildcard and the / separator.
• XFILE(“<ticker>/MyDataFile.txt”) returns the values from the file MyDataFile.txt located in a folder named AAPL when working with a formula or chart of AAPL.
3. Finally, for larger data sets, the <t/ticker> wildcard replaces itself with the first letter of the current ticker followed by / separator followed by the current ticker symbol. This allows you to organize a large collection of user data files such as:
!
• XFILE(“<t/ticker>/MyDataFile.txt”) returns the values from the file MyDataFile.txt located in a folder named AAPL which itself is in a folder named A when working with a formula or chart of AAPL.
(If the current ticker symbol begins with any character other than A-Z, ProTA will look for the item in a folder named “Other”.)
Floor Floor
Floor (Array, Multiple)
Multiple: A FLOATING POINT CONSTANT specifying the rounding multiple.
Returns the largest multiple of Multiple that is less than or equal to the Array value.
• Floor(Close, 0.25) returns the Close rounded down to the nearest quarter point.
ForceIndex Force
Force (Period)
Period: An INTEGER CONSTANT specifying the period for the indicator calculation.
!200
Calculates the Force Index indicator. Identical to the built- Force Index indicator.
• Force(2) is the 2 period Force Index indicator.
• CUM(Force(2)) is the Cumulative Summation line of the 2 period Force Index indicator.
Fraction FRAC
FRAC (Array)
Eliminates the integer portion of the Array value(s) and returns only the fractional part.
• FRAC(10.563) returns 0.563
• FRAC(21) returns 0
Gap Gap
Gap ()
Returns TRUE when there is a price gap from the previous Bar, otherwise returns FALSE. Specifically, a Gap occurs if the Low is greater than the previous High or the High is lower than the previous Low.
• Gap () returns TRUE on any Gap day.
GapDown GapDown
GapDown ()
Returns TRUE when there is a downward price gap from the previous Bar, otherwise returns FALSE. Specifically, a Gap Down occurs if the High is lower than the previous Low.
• GapDown () returns TRUE on any Gap Down day.
GapUp GapUp
GapUp ()
Returns TRUE when there is an upward price gap from the previous Bar, otherwise returns FALSE. Specifically, a GapUp occurs if the Low is greater than the previous High.
• GapUp () returns TRUE on any Gap Up day.
GravestoneDoji GravestoneDoji
GravestoneDoji ()
Returns TRUE when a Gravestone Doji formation is detected, otherwise FALSE. See the Indicators chapter for a description of Candlestick patterns.
• GravestoneDoji () returns TRUE when a Gravestone Doji pattern is detected.
!201
Hammer Hammer
Hammer (Type)
Type: A TYPE WORD specifying the type of candle patterns to identify. Any: Both Bullish and Bearish Hammer candles Bull: Bullish Hammer candles Bear: Bearish Hammer candles
Returns TRUE when a Hammer formation is detected, otherwise FALSE. See the Indicators chapter for a description of Candlestick patterns.
• Hammer (Bear) returns TRUE when a Bearish Hammer pattern is detected.
• Hammer () returns TRUE when any Hammer pattern is detected.
Harami Harami
Harami (Type)
Type: A TYPE WORD specifying the type of candle patterns to identify. Any: Both Bullish and Bearish Harami candles Bull: Bullish Harami candles Bear: Bearish Harami candles
Returns TRUE when a Harami formation is detected, otherwise FALSE. See the Indicators chapter for a description of Candlestick patterns.
• Harami (Bull) returns TRUE when a Bullish Harami pattern is detected.
• Harami () returns TRUE when any Harami pattern is detected.
HaramiCross HaramiCross
HaramiCross (Type)
Type: A TYPE WORD specifying the type of candle patterns to identify. Any: Both Bullish and Bearish Harami Cross candles Bull: Bullish Harami Cross candles Bear: Bearish Harami Cross candles
Returns TRUE when a Harami Cross formation is detected, otherwise FALSE. See the Indicators chapter for a description of Candlestick patterns.
• HaramiCross (Bull) returns TRUE when a Bullish Harami Cross pattern is detected.
• HaramiCross () returns TRUE when any Harami Cross pattern is detected.
Highest Highest
Highest (Array, Period)
Returns the largest Array value over the specified preceding periods (including the current day). Period can be an INTEGER CONSTANT or ARRAY.
!202
• Highest(Close, 5) returns the largest Closing price over the last 5 days, including the current day.
• Highest(Close, 2) returns the higher of the current or the previous day’s Close.
• Highest(Close, 1) always returns the current Close.
HighestBarsAgo HighestBarsAgo
HighestBarsAgo (Array, Period)
Returns the number of Bars (time periods) ago the Array was at its largest value over the specified preceding periods (including the current day). Period can be an INTEGER CONSTANT or ARRAY.
• HighestBarsAgo(Close, 5) returns the number of periods ago the Close was at its highest level. The returned value would be in the range of 0-4, where zero indicates today.
• HighestBarsAgo (Close, 1) always returns 0.
IF IF
IF (Array, TrueArray, FalseArray)
A conditional function that returns the value from TrueArray if Array is TRUE, otherwise returns the value from FalseArray.
• IF(5 > 10, High, Low) always returns the Low.
• IF(IsRising(Close), 10, -10) returns 10 on up days, -10 on down days.
InsideDay InsideDay
InsideDay ()
Returns TRUE when the High-Low trading range is completely enclosed by the previous day’s High-Low trading range, otherwise returns FALSE.
• InsideDay () returns TRUE on any Inside Day.
Integer INT
INT (Array)
Eliminates the fractional portion of the Array value(s) and returns only the integer part.
• INT(10.563) returns 10
• INT(21) returns 21
!203
IsFalling Falling
IsFalling (Array, Period)
Period: An INTEGER CONSTANT or ARRAY specifying the lookback period for the indicator calculation. If omitted, defaults to 1.
Returns TRUE if Array is less than it was periods ago, otherwise returns FALSE.
• IsFalling(Close, 5) returns TRUE if the Close is lower than 5 periods ago.
• IsFalling(Close) returns TRUE if the Close is lower than the previous period.
IsRising Rising
IsRising (Array, Period)
Period: An INTEGER CONSTANT or ARRAY specifying the lookback period for the indicator calculation. If omitted, defaults to 1.
Returns TRUE if Array is higher than it was periods ago, otherwise returns FALSE.
• IsRising(Close, 5) returns TRUE if the Close is higher than 5 periods ago.
• IsRising (Close) returns TRUE if the Close is higher than the previous period.
KeyReversalDay KeyReversalDay
KeyReversalDay ()
Returns TRUE when the Open is higher than the previous Close and the High is greater than the previous High but the Close is lower than the previous Low OR the Open is lower than the previous Close and the Low is lower than the previous Low but the Close is higher than the previous High, otherwise returns FALSE.
• KeyReversalDay () returns TRUE on any Key Reversal Day.
LinearRegressionForecast LRF
LRF (LookBackPeriod, LookAheadPeriod, Array)
LookBackPeriod: INTEGER CONSTANT specifying the lookback period for the indicator calculation.
LookAheadPeriod: INTEGER CONSTANT specifying the look ahead period for the indicator calculation. If omitted, defaults to 0.
Calculates the Linear Regression Forecast indicator. Identical to the built-in Linear Regression Forecast indicator.
• LRF(26) returns the 26 period Linear Regression Forecast for the current date.
• LRF(26, 5, High) returns the 26 period Linear Regression Forecast for the High 5 days in the future.
!204
Log LOG
LOG (Array)
Calculates the natural logarithm of Array.
• LOG(10) returns 2.303
Lowest Lowest
Lowest (Array, Period)
Returns the lowest Array value over the specified preceding periods (including the current day). Period can be an INTEGER CONSTANT or ARRAY.
• Lowest(Close, 5) returns the lowest Closing price over the last 5 days, including the current day.
• Lowest (Close, 2) returns the lower of the current or previous day’s Close.
• Lowest (Close, 1) always returns the current Close.
LowestBarsAgo LowestBarsAgo
LowestBarsAgo (Array, Period)
Returns the number of Bars (time periods) ago the Array was at its lowest value over the specified preceding periods (including the current day). Period can be an INTEGER CONSTANT or ARRAY.
• LowestBarsAgo(Close, 5) returns the number of periods ago the Close was at its lowest level. The returned value would be in the range of 0-4, where zero indicates today.
• LowestBarsAgo (Close, 1) always returns 0.
MACD MACD
MACD (LongPeriod, ShortPeriod, SignalPeriod, Type, Array)
LongPeriod, ShortPeriod, and SignalPeriod: 3 INTEGER CONSTANTS specifying the periods for the indicator calculation.
Type: A TYPE WORD specifying which of the MACD lines to compute. Hist or Histogram Signal or MACDSignal MAOsc or MAOscillator
Calculates the specified component of the MACD indicator. Identical to the built-in MACD indicator.
• MACD (26, 12, 9) returns the 26, 12, 9 MACD Histogram.
• MACD (26, 12, 9, Signal, High) returns the 26, 12, 9 MACD Signal line using the Highs as the basis of calculation.
!205
MarketFacilitationIndex WMFI
WMFI ()
Calculates the Market Facilitation Index indicator. Identical to the built-in Market Facilitation Index indicator.
• WMFI() returns the Market Facilitation Index.
Maximum MAX
MAX (Array1, Array2)
Returns the larger of the two parameters. Same as: IF(Array2 > Array1, Array2, Array1)
• MAX(Close, 20) returns either the Closing price or 20, whichever is greater.
• MAX(15, 20) always returns 20.
McClellanOscillator McOsc
McOsc (“EXCHANGE PREFIX”, ShortPeriod, LongPeriod)
“EXCHANGE PREFIX”: Text enclosed in quotation marks that specifies which AD quote file to use for the calculation. Normally “NYSE”, “NASD” or “AMEX” for the NYSE AD, NASD AD, or AMEX AD market data files. The indicated quote file must be present in your Market Data section.
ShortPeriod, LongPeriod: 2 INTEGER CONSTANTS specifying the periods for the indicator calculation. If omitted, defaults to the standard 19 and 39.
Calculates the McClellan Oscillator indicator. Identical to the built-in McClellan Oscillator indicator.
• McOsc(“NYSE”) calculates the standard McClellan Oscillator for the NYSE.
• McOsc(“NYSE”, 30, 60) calculates a modified McClellan using 30 and 60 period EMA’s.
MedianPrice MP
MP ()
Calculates the MedianPrice indicator. Same as: (High + Low) / 2.
• MP() returns the Median Price.
Minimum MIN
MIN (Array1, Array2)
Returns the lower of the two parameters. Same as: IF(Array2 < Array1, Array2, Array1)
!206
• MIN(Close, 20) returns either the Closing price or 20, whichever is lower.
• MIN(15, 20) always returns 15.
Modulus MOD
MOD (Array1, Array2)
Returns the remainder when Array1 is divided by Array2.
• MOD(10.7, 3) returns 1.7
• MOD(9, 3) returns 0
MoneyFlowIndex MFI
MFI (Period)
Period: An INTEGER CONSTANT specifying the period for the indicator calculation.
Calculates the Money Flow Index indicator. Identical to the built-in Money Flow Index indicator.
• MFI(14) is the 14 period Money Flow Index indicator.
Month Month
Month ()
Returns the month based on the date from the quote file.
• When plotted in a chart, the value for March 9, 2006 would be 3.
MorningDojiStar MorningDojiStar
MorningDojiStar ()
Returns TRUE when a Morning Doji Star formation is detected, otherwise FALSE. See the Indicators chapter for a description of Candlestick patterns.
• MorningDojiStar () returns TRUE when a Morning Doji Star pattern is detected.
MorningStar MorningStar
MorningStar ()
Returns TRUE when a Morning Star formation is detected, otherwise FALSE. See the Indicators chapter for a description of Candlestick patterns.
• MorningStar () returns TRUE when a Morning Star pattern is detected.
!207
MovingAverage MA
MA (Period, Type, Array)
Period: An INTEGER CONSTANT specifying the period for the indicator calculation.
Type: A TYPE WORD specifying the type of average to compute. S or Simple E or Exponential W or Weighted
Calculates the specified Moving Average indicator. Identical to the built-in Moving Average indicator.
• MA(21) is the 21 period Simple Moving Average of Closes.
• MA (21, E) is the 21 period Exponential Moving Average of Closes.
• MA (21, E, RSI(14)) is the 21 period Exponential Moving Average of the 14 period Relative Strength Index.
NegativeVolumeIndex NVI
NVI (Period)
Period: An INTEGER CONSTANT specifying the period for the indicator calculation. Normally 1.
Calculates the Negative Volume Index indicator. Identical to the built-in Negative Volume Index indicator.
• NVI(1) is the standard Negative Volume Index indicator.
NetHighsLows NetHL
NetHL (“EXCHANGE PREFIX”, Period)
“EXCHANGE PREFIX”: Text enclosed in quotation marks that specifies which HL quote file to use for the calculation. Normally “NYSE”, “NASD” or “AMEX” for the NYSE HL, NASD HL, or AMEX HL market data files. The indicated quote file must be present in your Market Data section.
Period: An INTEGER CONSTANT specifying the period for the indicator calculation. Normally 1.
Calculates the Net New Highs-Lows (General Market) indicator. Identical to the built-in Net New Highs-Lows (General Market ) indicator.
• NetHL(“NYSE”, 1) calculates net number of New Highs vs. New Lows on the NYSE.
• CUM(NetHL(“NYSE”, 1)) is a cumulative summation line of the net New Highs vs. New Lows on the NYSE.
!208
OnBalanceVolume OBV
OBV (Period)
Period: An INTEGER CONSTANT specifying the period for the indicator calculation. Normally 1.
Calculates the On Balance Volume indicator. Identical to the built-in On Balance Volume indicator.
• OBV(1) is the standard On Balance Volume indicator.
OutsideDay OutsideDay
OutsideDay ()
Returns TRUE when the High is greater than the previous High and the Low is lower than the previous Low, otherwise returns FALSE.
• OutsideDay () returns TRUE on any Outside Day.
ParabolicSAR Parabolic
Parabolic (Initial, Step, MaxValue)
Initial, Step, MaxValue: 3 FLOATING POINT CONSTANTS specifying the parameters of the indicator calculation.
Calculates the Parabolic SAR indicator. Identical to the built-in Parabolic SAR indicator.
• Parabolic(.02, .02, .2) returns the .02, .02, .2 Parabolic SAR indicator.
PeakBarsAgo PeakBarsAgo
PeakBarsAgo (PeakNum, ReversalAmt, ReversalType, ExamineType)
PeakNum: An INTEGER CONSTANT specifying the number of Peaks ago to examine.
ReversalAmt: A FLOATING POINT CONSTANT specifying the reversal criteria for a Peak.
ReversalType: A TYPE WORD specifying the reversal criteria method for a Peak. % or Percent P or Pts
ExamineType: A TYPE WORD specifying the field(s) to examine. HL or HighsLows C or Closes
Returns the number of Bars (time periods) that have passed since a swing high (Peak) occurred, PeakNum peaks ago. Peaks are determined using the ZigZag indicator and, in fact, the last three parameters used here are the same as for ZigZag. See the Indicators chapter.
If the requested Peak never took place, zero is returned.
• PeakBarsAgo (1, 20) returns the number of Bars that have passed since the last Peak high occurred as defined by a 20% pullback from the Highs.
!209
• PeakBarsAgo (2, 10, Pts, Closes) returns the number of Bars that have passed since the second to last Peak high occurred as defined by a 10 Point pullback looking at Closing values only.
PeakValue Peak
Peak (PeakNum, ReversalAmt, ReversalType, ExamineType)
PeakNum: An INTEGER CONSTANT specifying the number of Peaks ago to examine.
ReversalAmt: A FLOATING POINT CONSTANT specifying the reversal criteria for a Peak.
ReversalType: A TYPE WORD specifying the reversal criteria method for a Peak. % or Percent P or Pts
ExamineType: A TYPE WORD specifying the field(s) to examine. HL or HighsLows C or Closes
Returns the swing high (Peak) value, PeakNum peaks ago. Peaks are determined using the ZigZag indicator and, in fact, the last three parameters used here are the same as for ZigZag. See the Indicators chapter.
If the requested Peak never took place, zero is returned.
• Peak (1, 20) returns the last swing high value as defined by a 20% pullback from the Highs.
• Peak (2, 10, Pts, Closes) returns the second to last swing high value as defined by a 10 Point pullback looking at Closing values only.
Performance Perf
Perf (“Date”, Type, Array)
“Date”: Text enclosed in quotation marks the basis date for the Performance calculation.
Type: A TYPE WORD specifying the reporting type for Performance. % or Percent P or Pts
Calculates the Performance indicator. Identical to the built-in Performance indicator.
• Perf(“1/1/2006”) calculates the percentage gain or loss since 1/1/2006 based on the Closing prices.
PiercingLine PiercingLine
PiercingLine ()
Returns TRUE when a Piercing Line formation is detected, otherwise FALSE. See the Indicators chapter for a description of Candlestick patterns.
• PiercingLine () returns TRUE when a Piercing Line pattern is detected.
!210
Position Pos
Pos (“Trading System Name”, Param1, Param2, Param3, Param4, Param5)
“Trading System Name”: Text enclosed in quotation marks that specifies the name of a previously created and saved Trading System file.
Param1-5: Optional values can be passed into the Trading System to be used in place of the default Parameters.
Returns the trading position held by the specified Trading System:
Long: 1 Short: -1 Flat: 0
• Pos(“My Awesome Trading System”) returns 1 when My Awesome Trading System is Long, -1 when Short and 0 when Flat.
• IF(Pos(“My Awesome Trading System”) = 1, Close, 0) plots the Closes only when My Awesome Trading System is Long.
PositiveVolumeIndex PVI
PVI (Period)
Period: An INTEGER CONSTANT specifying the period for the indicator calculation. Normally 1.
Calculates the Positive Volume Index indicator. Identical to the built-in Positive Volume Index indicator.
• PVI(1) is the standard Positive Volume Index indicator.
Power Power
Power (Array, Power)
Power: A FLOATING POINT CONSTANT specifying the exponent.
Returns the Array value(s) raised to the Power power.
• Power(5, 2) returns 25.
Previous PREV
PREV ()
Returns the previous value of the current line of computation. For the first date in a data array, PREV() returns zero.
• PREV() + 1 returns a value of 1 on the first date, 2 on the second date, 3 on the third, etc..
Note. Unlike all of the other ProTAscript functions, the PREV() function is implemented internally as a recursive call and can consume substantial computation resources. Depending upon the complexity of the overall formula and the size of the underlying data
!211
file, calculation times will grow exponentially. Use PREV() sparingly and only when you cannot find a way to write a formula without it.
PriceVolumeTrend PVT
PVT (Period)
Period: An INTEGER CONSTANT specifying the period for the indicator calculation. Normally 1.
Calculates the Price Volume Trend indicator. Identical to the built-in Price Volume Trend indicator.
• PVT(1) is the standard Price Volume Trend indicator.
PutCallRatio PutCall
PutCall (Period)
Period: An INTEGER CONSTANT specifying the period for the indicator calculation. Normally 1.
Calculates the Put/Call Ratio. Identical to the built-in Put/Call Ratio (General Market) indicator. This function requires the market data file PUTCALL.
• PutCall(1) is the standard Put/Call Ratio indicator.
PutVolumeIndicator BPVI
BPVI (Period)
Period: An INTEGER CONSTANT specifying the period for the indicator calculation. Normally 10.
Calculates the Bollinger Put Volume Indicator. Identical to the built-in Put Volume Indicator (General Market) indicator. This function requires the market data file PUTCALL.
• BPVI(10) is the standard Bollinger Put Volume Indicator.
RateOfChange ROC
ROC (Period, Array)
Period: An INTEGER CONSTANT specifying the period for the indicator calculation.
Calculates the Rate of Change indicator. Identical to the built-in Rate of Change indicator.
• ROC(26) is the 26 period Rate of Change of the Closes.
• ROC(26, MA(13)) is the 26 period Rate of Change of the 13 period moving average line.
!212
Reference REF
REF (Array, Period)
Period: An INTEGER CONSTANT specifying the number of periods to look back or ahead. Negative numbers look backward and are the norm.
References a previous or subsequent value in the Array. Negative Periods look back in time, positive Periods look ahead.
• REF(Close, -1) returns the previous Close.
• REF(MA(21), -10) returns the 21 period moving average value 10 periods ago.
• REF(Close, 0) returns the Close. Same as Close.
• REF(Close, 5) returns the Close 5 periods ahead.
RelativePerformance RelPerf
RelPerf (“TICKER”, SecurityType, FieldType, NormType, “NormDate”)
“TICKER”: Text enclosed in quotation marks that specifies the ticker symbol of a security in your quotes database.
SecurityType: A TYPE WORD specifying the security’s type. S or Stock M or MutualFund I or Index F or Futures O or Option B or Bond D or MarketData
FieldType: A TYPE WORD specifying the field to access in the specified security’s quote file.
C or Close O or Open H or High L or Low
NormType: A TYPE WORD specifying the Normalization method. N or None A or Arithmetic R or Ratio
“NormDate”: Text enclosed in quotation marks that specifies the date at which to Normalize the two securities. Defaults to “12/31/04”.
Calculates the performance ratio when compared to another security. Identical to the built-in Relative Performance (Comparison Overlay) indicator.
• RelPerf(“AAPL”, S) returns the Relative Performance vs. AAPL stock.
• RelPerf(“IBM”, S, H) returns the Relative Performance vs. IBM stock looking at Highs instead of Closes.
!213
RelativeStrengthIndex RSI
RSI (Period, Array)
Period: An INTEGER CONSTANT specifying the period for the indicator calculation.
Calculates the Relative Strength Index indicator. Identical to the built-in Relative Strength Index indicator.
• RSI(14) is the 14 period Relative Strength Index.
• RSI (14, MA(9)) is the 14 period Relative Strength Index of the 9 period moving average line.
Round Round
Round (Array, DecPlaces)
DecPlaces: An INTEGER CONSTANT specifying the number of decimal places.
Rounds the Array value(s) up or down to the nearest number of decimal places.
• Round(654.321, 1) returns 654.3
• Round(654.321, 0) returns 654
• Round(654.321, -1) returns 650
RoundDown RoundDown
RoundDown (Array, DecPlaces)
DecPlaces: An INTEGER CONSTANT specifying the number of decimal places.
Rounds the Array value(s) down to the nearest number of decimal places.
• Round(456.789, 1) returns 456.7
• Round(456.789, 0) returns 456
• Round(456.789, -1) returns 450
RoundUp RoundUp
RoundUp (Array, DecPlaces)
DecPlaces: An INTEGER CONSTANT specifying the number of decimal places.
Rounds the Array value(s) up to the nearest number of decimal places.
• Round(654.321, 1) returns 654.4
• Round(654.321, 0) returns 655
• Round(654.321, -1) returns 660
!214
SeparatingLine SeparatingLine
SeparatingLine ()
Returns TRUE when a Separating Line formation is detected, otherwise FALSE. See the Indicators chapter for a description of Candlestick patterns.
• SeparatingLine () returns TRUE when a Separating Line pattern is detected.
Sine SIN
SIN (Array)
Returns the Sine of Array. The Array value(s) should be in degrees.
• SIN(30) returns 0.50.
Slope Slope
Slope (Array, Period)
Period: An INTEGER CONSTANT or ARRAY specifying the lookback period. Defaults to 1.
Returns the slope of a line connecting the current Array value to the Array value Periods ago.
• Slope(Close, 5) is the same as (Close - REF(Close, -5)) / 5
• If the Close was 1 point lower 5 periods ago, Slope(Close, 5) returns 0.20
Spread Spread
Spread (“TICKER”, SecurityType, FieldType, NormType, “NormDate”)
“TICKER”: Text enclosed in quotation marks that specifies the ticker symbol of a security in your quotes database.
SecurityType: A TYPE WORD specifying the security’s type. S or Stock M or MutualFund I or Index F or Futures O or Option B or Bond D or MarketData
FieldType: A TYPE WORD specifying the field to access in the specified security’s quote file.
C or Close O or Open H or High L or Low
NormType: A TYPE WORD specifying the Normalization method. N or None A or Arithmetic R or Ratio
!215
“NormDate”: Text enclosed in quotation marks that specifies the date at which to Normalize the two securities. Defaults to “12/31/04”.
Calculates the price spread compared to another security. Identical to the built-in Spread (Comparison Overlay) indicator.
• Spread(“AAPL”, S) returns the price spread vs. AAPL stock.
• Spread(“IBM”, S, H) returns the price spread vs. IBM stock looking at Highs instead of Closes.
SquareRoot SQRT
SQRT (Array)
Returns the square root of the Array value(s).
• SQRT(64) returns 8.
StandardDeviation StDev
StDev (Period, Array)
Period: An INTEGER CONSTANT specifying the period for the indicator calculation.
Calculates the Standard Deviations indicator. Identical to the built-in Standard Deviations indicator.
• StDev(26) is the 26 period Standard Deviations based on Closes.
• StDev(26, High) is the 26 period Standard Deviations of the Highs.
Stochastics Stochastics
Stoch (KPeriod, KSlowingPeriod, DPeriod, Type)
KPeriod, KSlowingPeriod, DPeriod: 3 INTEGER CONSTANTS specifying the periods for the indicator calculation.
Type: A TYPE WORD specifying which of the Stochastic lines to compute. %D or D %K or K Oscillator or Osc
Calculates the specified component of the Stochastics indicator. Identical to the built-in Stochastics indicator.
• Stoch (14, 3, 5) returns the 14, 3, 5 %D line.
• Stoch (14, 3, 5, Osc) returns the difference between the 14, 3, 5 %K and %D lines.
!216
Summation SUM
SUM (Array, Period)
Period: An INTEGER CONSTANT or ARRAY specifying the range of periods.
Returns the sum of all Array values over the preceding Periods, including the current period.
• SUM(Close, 3) sums up the current Close and the preceding two Closes.
• SUM(5, 3) always returns 15.
• SUM(ScanFN(“My Awesome Criteria”), 10) returns the number of days My Awesome Criteria was TRUE over the past 10 days, including the current day.
ThreeBlackCrows ThreeBlackCrows
ThreeBlackCrows ()
Returns TRUE when a Three Black Crows formation is detected, otherwise FALSE. See the Indicators chapter for a description of Candlestick patterns.
• ThreeBlackCrows () returns TRUE when a Three Black Crows pattern is detected.
ThreeWhiteSoldiers ThreeWhiteSoldiers
ThreeWhiteSoldiers ()
Returns TRUE when a Three White Soldiers formation is detected, otherwise FALSE. See the Indicators chapter for a description of Candlestick patterns.
• ThreeWhiteSoldiers () returns TRUE when a Three White Soldiers pattern is detected.
TRIN TRIN
TRIN (“EXCHANGE PREFIX”, Period)
“EXCHANGE PREFIX”: Text enclosed in quotation marks that specifies which AD and VOL quote file to use for the calculation. Normally “NYSE”, “NASD” or “AMEX” for the NYSE AD, NYSE VOL, NASD AD, NASD VOL, or AMEX AD, AMEX VOL market data files. The indicated quote files must be present in your Market Data section.
Period: An INTEGER CONSTANT specifying the period for the indicator calculation. Normally 1.
Calculates the TRIN (Arms Index) indicator. Identical to the built-TRIN (Arms Index) (General Market ) indicator.
• TRIN(“NYSE”, 1) calculates the standard TRIN for the NYSE.
!217
TRIX TRIX
TRIX (Period, Array)
Period: An INTEGER CONSTANT specifying the period for the indicator calculation.
Calculates the TRIX indicator. Identical to the built-in TRIX indicator.
• TRIX(12) is the 12 period TRIX indicator based on Closes.
• Cross(TRIX(12), 0)) is TRUE when the 12 period TRIX crosses above or below the zero line.
TradeTaken Traded
Traded (“Trading System Name”, Param1, Param2, Param3, Param4, Param5)
“Trading System Name”: Text enclosed in quotation marks that specifies the name of a previously created and saved Trading System file.
Param1-5: Optional values can be passed into the Trading System to be used in place of the default Parameters.
Returns the trade taken that day by the specified Trading System:
Enter Long: 1 Exit Long: 2 Enter Short: -1 Exit Short: -2 No Trades: 0
• Traded(“My Awesome Trading System”) returns 1 when My Awesome Trading System opened a new Long position, 2 when it closes a Long position, etc.
TroughBarsAgo TroughBarsAgo
TroughBarsAgo (TroughNum, ReversalAmt, ReversalType, ExamineType)
TroughNum: An INTEGER CONSTANT specifying the number of Troughs ago to examine.
ReversalAmt: A FLOATING POINT CONSTANT specifying the reversal criteria for a Trough.
ReversalType: A TYPE WORD specifying the reversal criteria method for a Trough. % or Percent P or Pts
ExamineType: A TYPE WORD specifying the field(s) to examine. HL or HighsLows C or Closes
Returns the number of Bars (times periods) that have passed since a swing low (Trough) occurred, TroughNum troughs ago. Troughs are determined using the ZigZag indicator and, in fact, the last three parameters used here are the same as for ZigZag. See the Indicators chapter.
If the requested Trough never took place, zero is returned.
!218
• TroughBarsAgo (1, 20) returns the number of Bars that have passed since the last Trough low occurred as defined by a 20% rally from the Lows.
• TroughBarsAgo (2, 10, Pts, Closes) returns the number of Bars that have passed since the second to last Trough low occurred as defined by a 10 Point rally looking at Closing values only.
TroughValue Trough
Trough (TroughNum, ReversalAmt, ReversalType, ExamineType)
TroughNum: An INTEGER CONSTANT specifying the number of Troughs ago to examine.
ReversalAmt: A FLOATING POINT CONSTANT specifying the reversal criteria for a Trough.
ReversalType: A TYPE WORD specifying the reversal criteria method for a Trough. % or Percent P or Pts
ExamineType: A TYPE WORD specifying the field(s) to examine. HL or HighsLows C or Closes
Returns the swing low (Trough) value, TroughNum peaks ago. Trough are determined using the ZigZag indicator and, in fact, the last three parameters used here are the same as for ZigZag. See the Indicators chapter.
If the requested Trough never took place, zero is returned.
• Trough (1, 20) returns the last swing low value as defined by a 20% rally from the Lows.
• Trough (2, 10, Pts, Closes) returns the second to last swing low value as defined by a 10 Point rally looking at Closing values only.
TypicalPrice TP
TP ()
Calculates the Typical Price indicator. Same as: (High + Low + Close) / 3.
• TP() returns the Typical Price.
ValueWhen ValueWhen
ValueWhen (LookbackCount, ExpressionArray, OutputArray)
LookbackCount: An INTEGER CONSTANT specifying the number of occurrences ago to examine.
Returns the value from OutputArray when ExpressionArray was last TRUE (non-zero), looking backwards in time for LookbackCount occurrences of ExpressionArray.
• ValueWhen(1, Volume > 10000, Close) returns the Closing price the last time Volume was greater than 10000.
!219
Volatility Volatility
Volatility (EMAPeriod, ROCPeriod)
EMAPeriod, ROCPeriod: 2 INTEGER CONSTANTS specifying the periods for the indicator calculation.
Calculates the Volatility (Chaikin’s) indicator. Identical to the built-in Volatility (Chaikin’s) indicator.
• Volatility(10, 10) is the standard Volatility indicator.
WeightedClose WC
WC ()
Calculates the Weighted Close indicator. Same as: (High + Low + Close*2) / 4.
• WC() returns the Weighted Close.
WilliamsAccumDist WAD
WAD ()
Calculates the Williams’ Accumulation/Distribution indicator. Identical to the built-in Williams’ Accumulation/Distribution indicator.
• WAD() returns the Williams’ Accumulation/Distribution indicator.
WilliamsPercentR PercentR
PercentR (Period)
Period: An INTEGER CONSTANT specifying the period for the indicator calculation.
Calculates the Williams’ %R indicator. Identical to the built-in Williams’ %R indicator.
• PercentR(26) is the 26 period Williams’ %R indicator.
Window Window
Window (Type)
Type: A TYPE WORD specifying the type of candle patterns to identify. Any: Both Bullish and Bearish Window candles Bull: Bullish Window candles Bear: Bearish Window candles
Returns TRUE when a Window formation is detected, otherwise FALSE. See the Indicators chapter for a description of Candlestick patterns.
• Window (Bull) returns TRUE when a Bullish Window pattern is detected.
• Window () returns TRUE when any Window pattern is detected.
!220
Year Year
Year ()
Returns the 4-digit year based on the date from the quote file.
• When plotted in a chart, the reading for March 9, 2006 would be 2006.
ZigZag ZigZag
ZigZag (ReversalAmt, ReversalType, ExamineType)
ReversalAmt: A FLOATING POINT CONSTANT specifying the threshold for a reversal.
ReversalType: A TYPE WORD specifying the measurement method for a reversal. % or Percent P or Pts
ExamineType: A TYPE WORD specifying the field(s) to examine. HL or HighsLows C or Closes
Calculates the Zig Zag indicator. Identical to the built-in Zig Zag indicator.
• ZigZag(20) plots the Zig Zag indicator for 20% or larger retracements.
!221
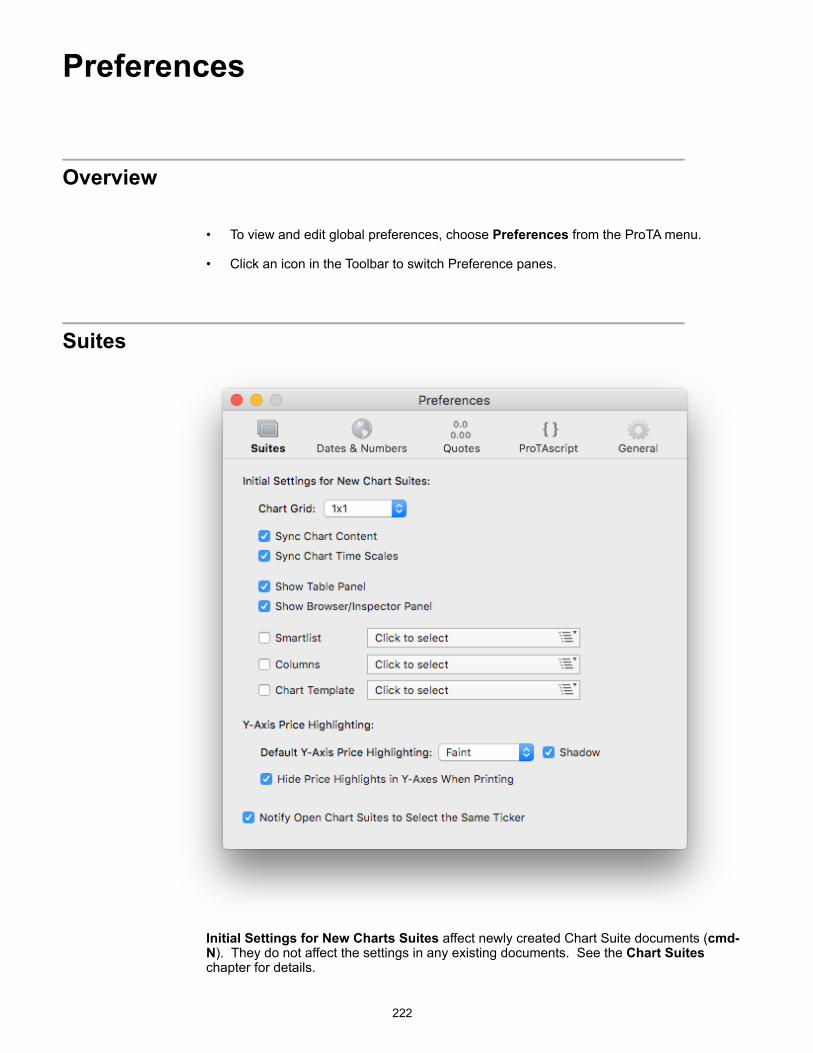
Preferences
!Overview
• To view and edit global preferences, choose Preferences from the ProTA menu.
• Click an icon in the Toolbar to switch Preference panes.
!Suites
! Initial Settings for New Charts Suites affect newly created Chart Suite documents (cmd-N). They do not affect the settings in any existing documents. See the Chart Suites chapter for details.
!222
Chart Grid. Choose the grid option for new Chart Suite documents. Normally 1x1.
Sync Chart Content. New Chart Suite documents will be created with Sync Content mode enabled.
Sync Chart Time Scales. New Chart Suite documents will be created with Sync Time Scales mode enabled.
Show Table Panel. New Chart Suite documents will be created with the Content Table displayed to the left of the chart view(s).
Show Browser/Inspector Panel. New Chart Suite documents will be created with the File Browser and Inspector panel displayed to the right of the chart view(s).
Smartlist. Check to assign a default Smartlist to all new Chart Suites.
Columns. Check to assign a Columns Template to all new Chart Suite Content Tables.
Chart Template. Check to assign a Chart Template to all new Charts.
Y Axis Price Highlighting provides default settings for the display and printing of chart Y-Axes.
Default Y-Axis Price Highlighting. Affects all new charts – see the Charts chapter in the Price (Y) Axis section for more.
Hide Price Highlights in Y-Axes When Printing Charts. Y-Axes tend to look cleaner on the printed page with this option enabled.
Notify Open Chart Suites to Select Same Ticker provides a means to keep all open chart suite windows in sync to all select and display the same ticker. When enabled, any time you change ticker selection in the top-most chart suite window, all other open chat suite windows will also attempt to switch tickers to match the selection of the top-most window.
!223
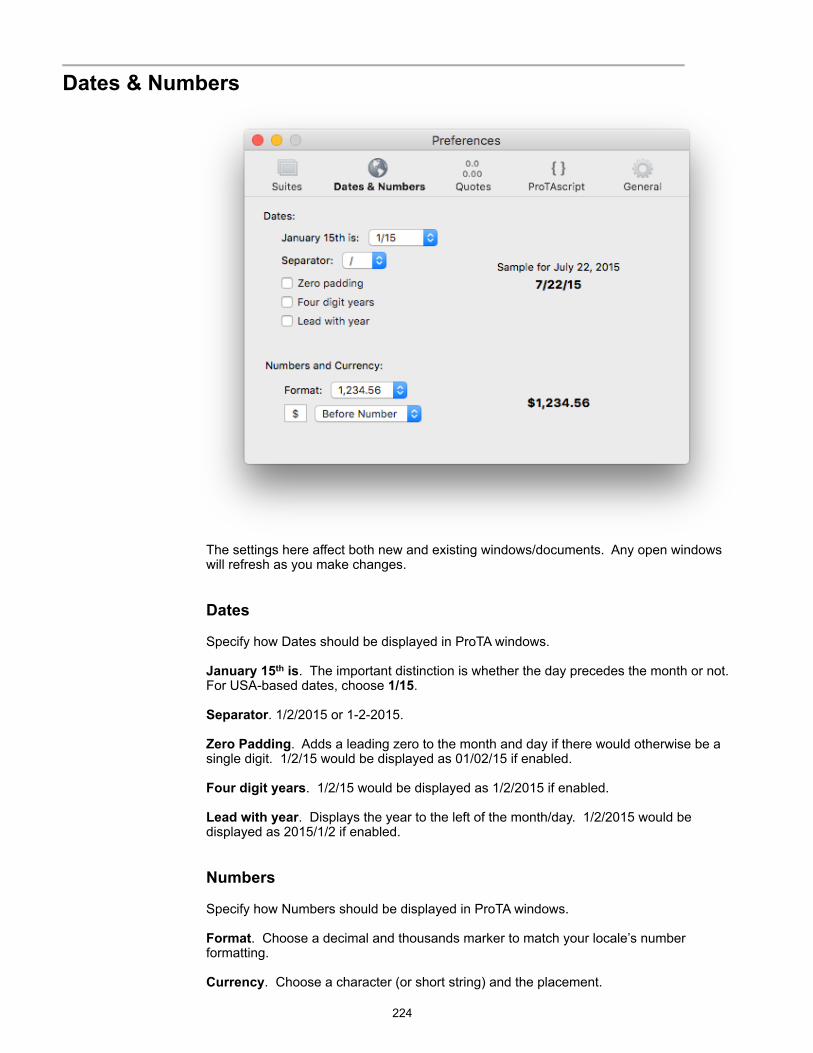
!Dates & Numbers
! The settings here affect both new and existing windows/documents. Any open windows will refresh as you make changes.
Dates
Specify how Dates should be displayed in ProTA windows.
January 15th is. The important distinction is whether the day precedes the month or not. For USA-based dates, choose 1/15.
Separator. 1/2/2015 or 1-2-2015.
Zero Padding. Adds a leading zero to the month and day if there would otherwise be a single digit. 1/2/15 would be displayed as 01/02/15 if enabled.
Four digit years. 1/2/15 would be displayed as 1/2/2015 if enabled.
Lead with year. Displays the year to the left of the month/day. 1/2/2015 would be displayed as 2015/1/2 if enabled.
Numbers
Specify how Numbers should be displayed in ProTA windows.
Format. Choose a decimal and thousands marker to match your locale’s number formatting.
Currency. Choose a character (or short string) and the placement.
!224
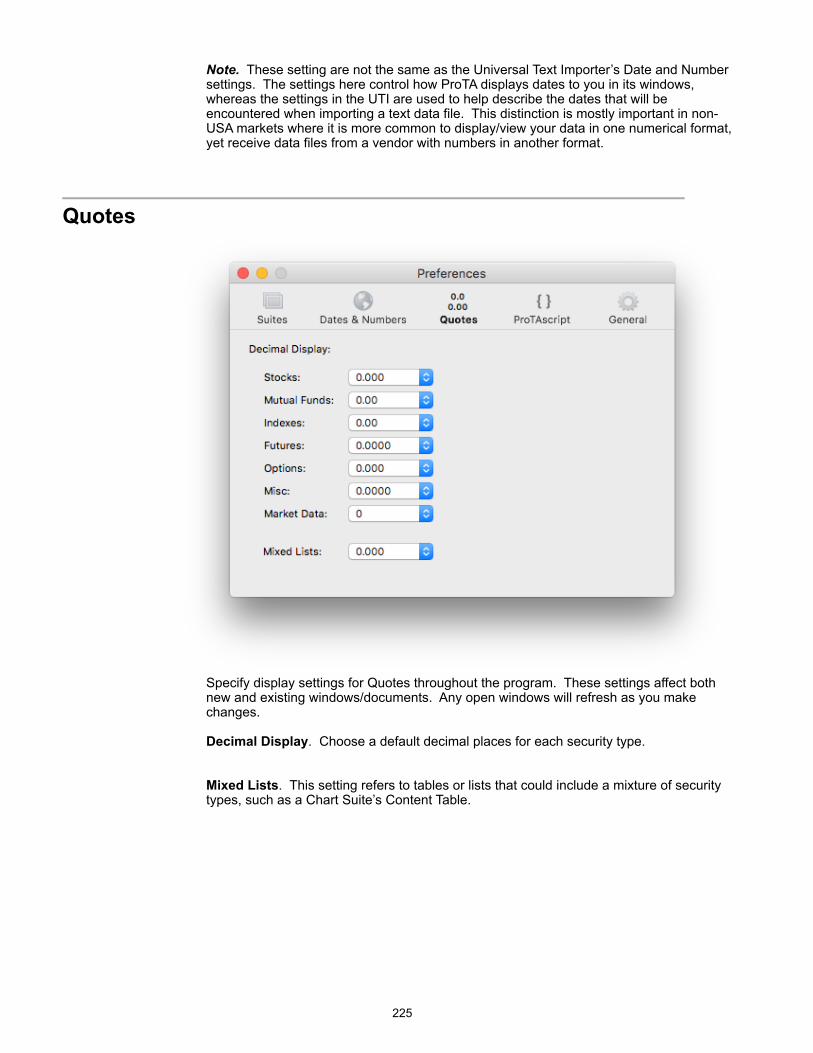
Note. These setting are not the same as the Universal Text Importer’s Date and Number settings. The settings here control how ProTA displays dates to you in its windows, whereas the settings in the UTI are used to help describe the dates that will be encountered when importing a text data file. This distinction is mostly important in non-USA markets where it is more common to display/view your data in one numerical format, yet receive data files from a vendor with numbers in another format.
!Quotes
! Specify display settings for Quotes throughout the program. These settings affect both new and existing windows/documents. Any open windows will refresh as you make changes.
Decimal Display. Choose a default decimal places for each security type.
Mixed Lists. This setting refers to tables or lists that could include a mixture of security types, such as a Chart Suite’s Content Table.
!225
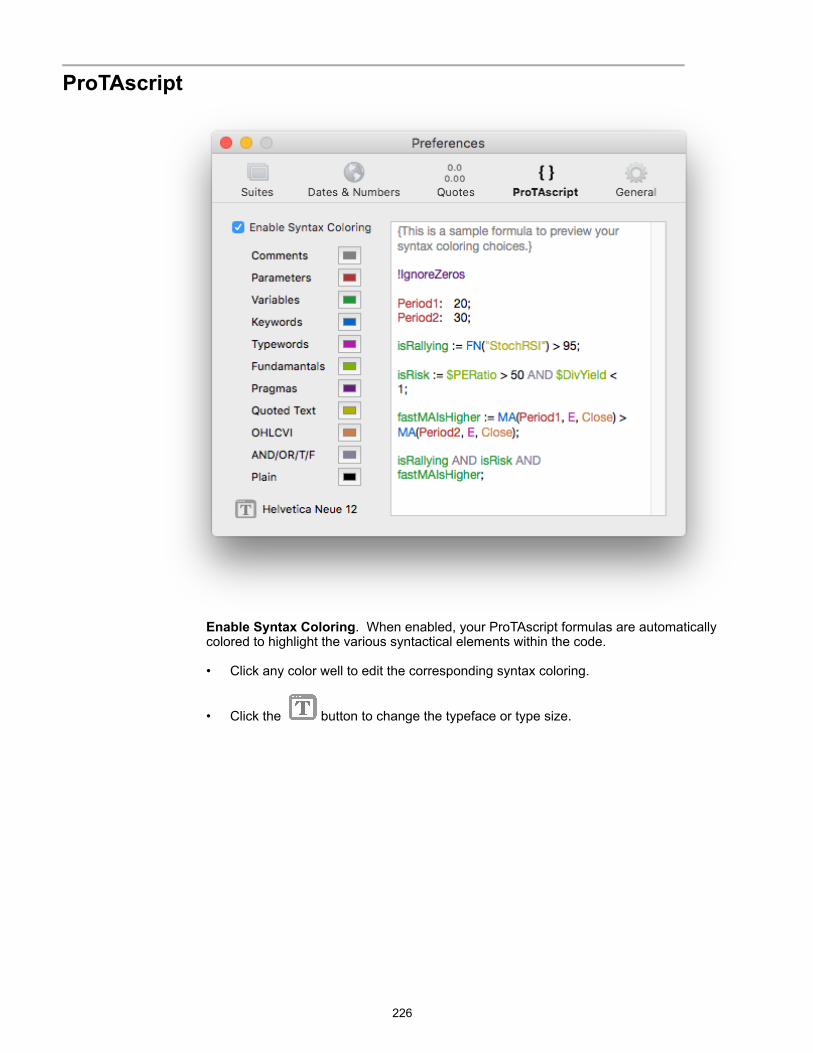
!ProTAscript
! Enable Syntax Coloring. When enabled, your ProTAscript formulas are automatically colored to highlight the various syntactical elements within the code.
• Click any color well to edit the corresponding syntax coloring.
• Click the ! button to change the typeface or type size.
!226
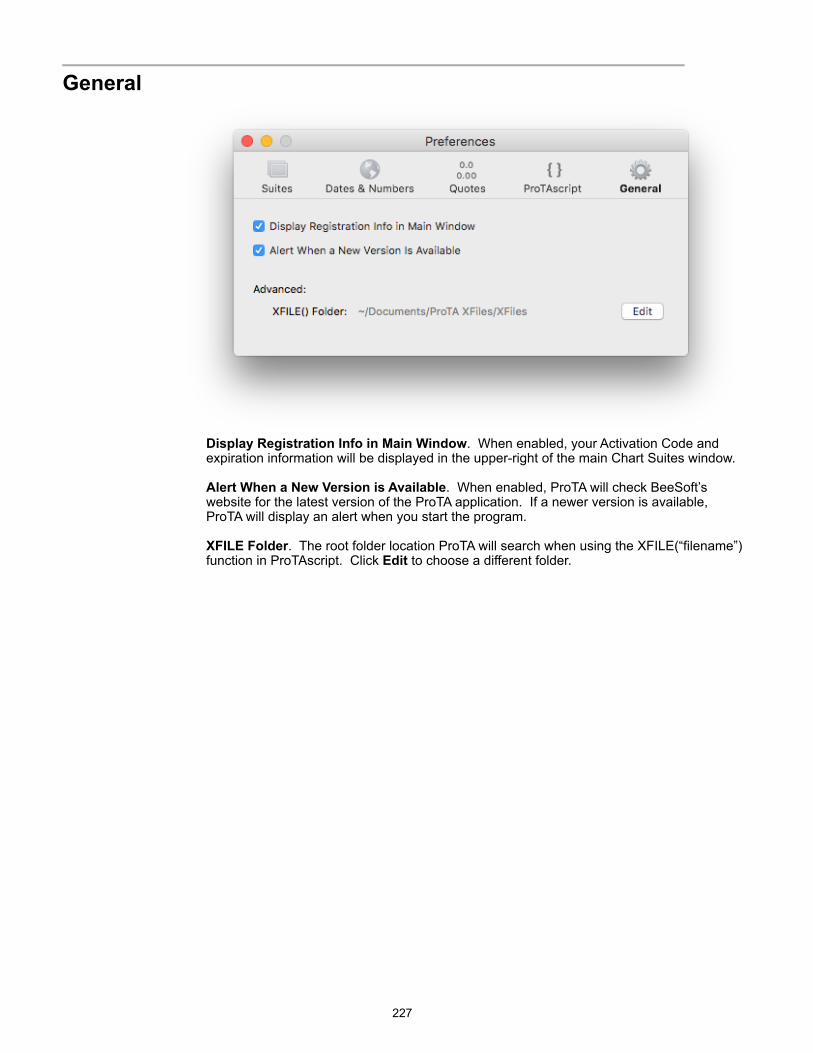
!General
! Display Registration Info in Main Window. When enabled, your Activation Code and expiration information will be displayed in the upper-right of the main Chart Suites window.
Alert When a New Version is Available. When enabled, ProTA will check BeeSoft’s website for the latest version of the ProTA application. If a newer version is available, ProTA will display an alert when you start the program.
XFILE Folder. The root folder location ProTA will search when using the XFILE(“filename”) function in ProTAscript. Click Edit to choose a different folder.
!227
Appendix I - File Archives
!Overview
All of your work is stored in various database files within the ProTA folder. These database files are all tightly integrated and relational. As such, it is import to backup, transfer and restore your ProTA folder as an intact, integral whole unit - not file-by-file. In general, you should never need to peek inside of the ProTA folder.
But what if you are interested in exporting just a single file from ProTA, or perhaps a sub-set of the entire database?
File Archives is a feature that allows you to select individual files or groups of files from within ProTA, then export them to an external file format suitable for sharing with other ProTA users, or suitable for setting aside for future restoration to your own ProTA database.
! Exporting to a File Archive
Files can be exported from any of the following ProTA windows:
Chart Suites Smartlists Custom Indicators Trading Systems System Tests Chart Templates Columns Templates
• In any of the above tables, select a row or rows (click, shift-click or cmd-click), then choose Export to Archive… from the File menu.
• Choose a location on your hard drive to save the exported archive files. The exported archive files can reside anywhere, though it is recommended you choose a location NOT inside your ProTA folder.
The exported filenames will include a suffix based on the type of archive: .tasuite, .tasmartlist, .tacustind, .tatradesys, .tasystest, .tacharttemplate, .tacolstemplate.
Tip. Exported file archives can be set aside anywhere on your hard drive, can be copied to a flash drive, can be dragged into an email to be shared with another ProTA user or with BeeSoft tech support.
Tip. Be sure to export all of the files necessary to reconstitute the original file. For example, you may wish to share a Chart Suite you have created with another ProTA user. If the Chart Suite contains any Custom Indicators or Smartlists that you have personally authored or edited, you must also export those files as well as the main chart suite file. Provide all of the Archive files to your recipient.
!228
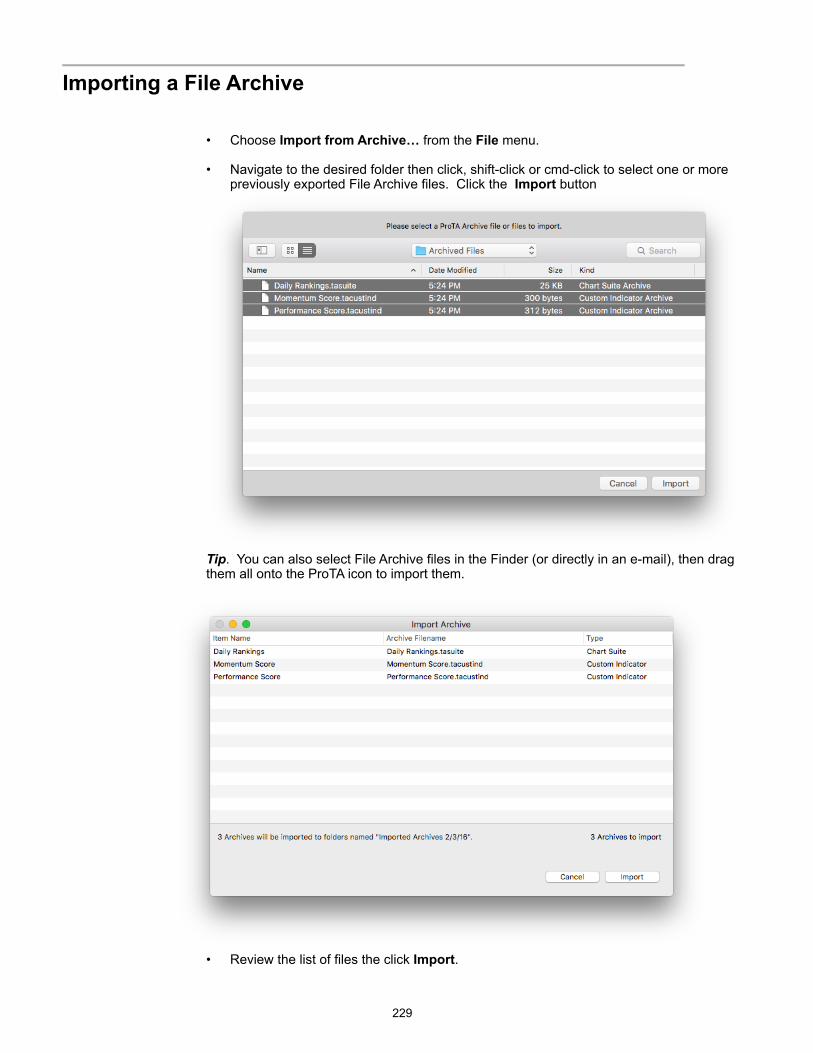
! Importing a File Archive
• Choose Import from Archive… from the File menu.
• Navigate to the desired folder then click, shift-click or cmd-click to select one or more previously exported File Archive files. Click the Import button
! Tip. You can also select File Archive files in the Finder (or directly in an e-mail), then drag them all onto the ProTA icon to import them.
! • Review the list of files the click Import.
!229
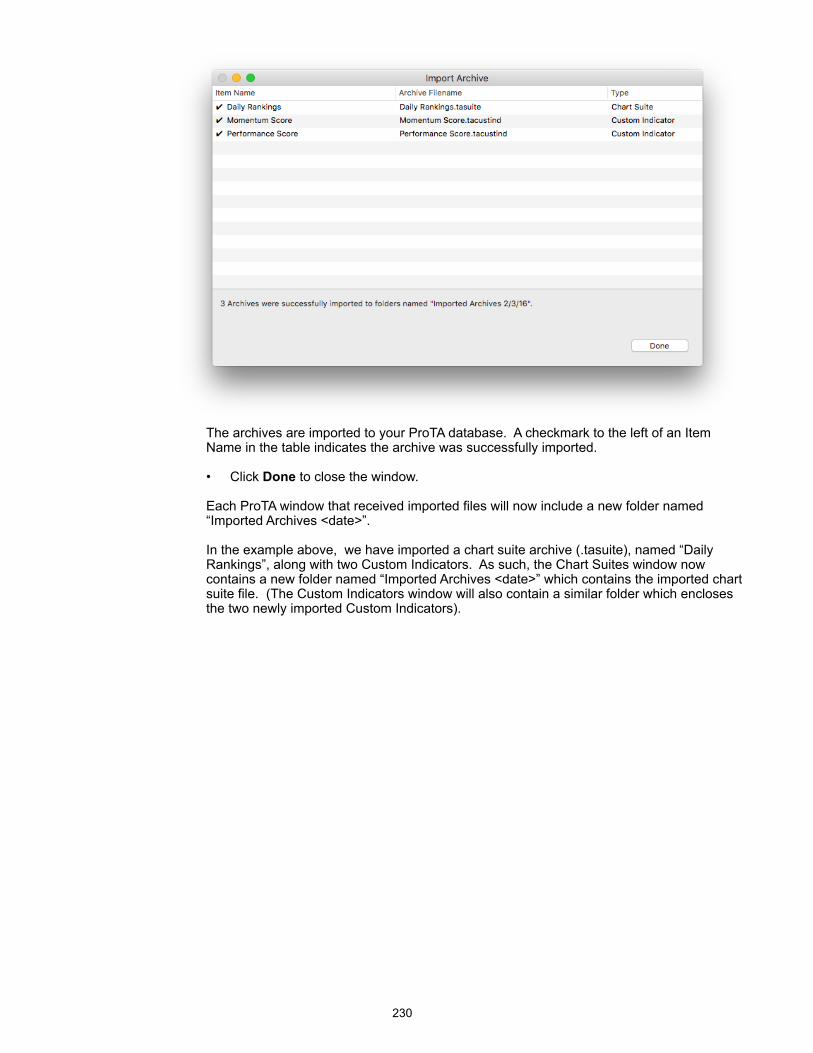
! The archives are imported to your ProTA database. A checkmark to the left of an Item Name in the table indicates the archive was successfully imported.
• Click Done to close the window.
Each ProTA window that received imported files will now include a new folder named “Imported Archives <date>”.
In the example above, we have imported a chart suite archive (.tasuite), named “Daily Rankings”, along with two Custom Indicators. As such, the Chart Suites window now contains a new folder named “Imported Archives <date>” which contains the imported chart suite file. (The Custom Indicators window will also contain a similar folder which encloses the two newly imported Custom Indicators).
!230
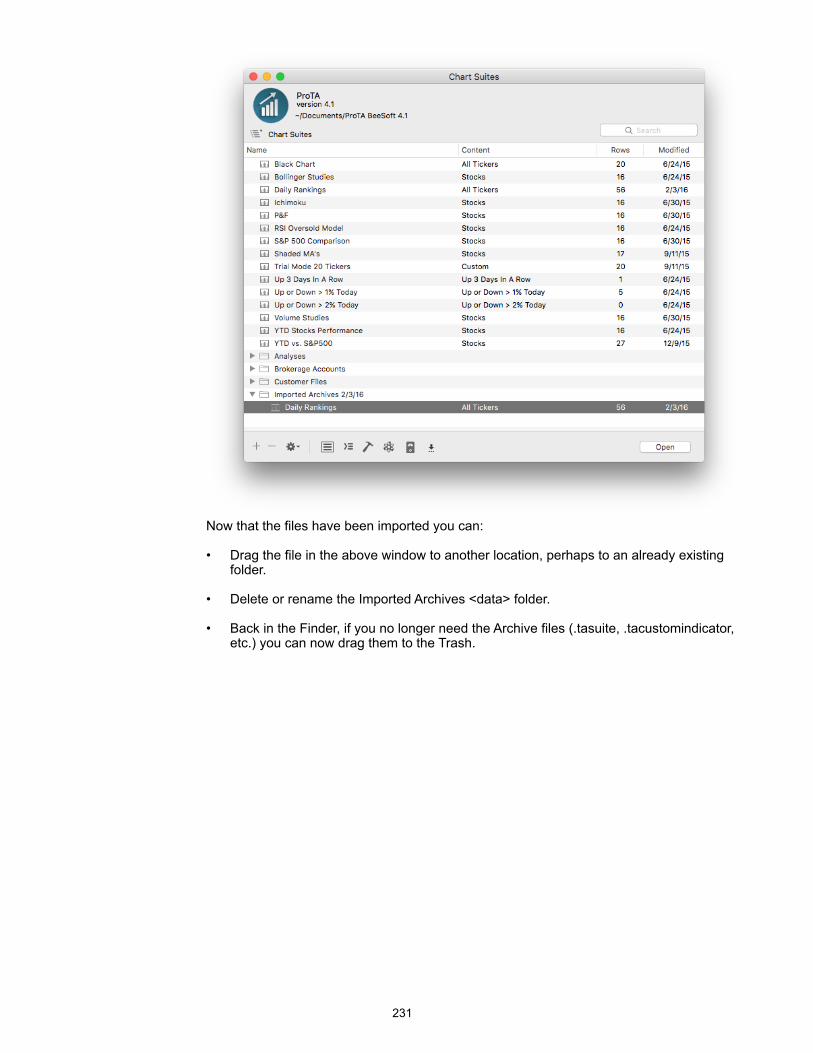
! Now that the files have been imported you can:
• Drag the file in the above window to another location, perhaps to an already existing folder.
• Delete or rename the Imported Archives <data> folder.
• Back in the Finder, if you no longer need the Archive files (.tasuite, .tacustomindicator, etc.) you can now drag them to the Trash.
!231
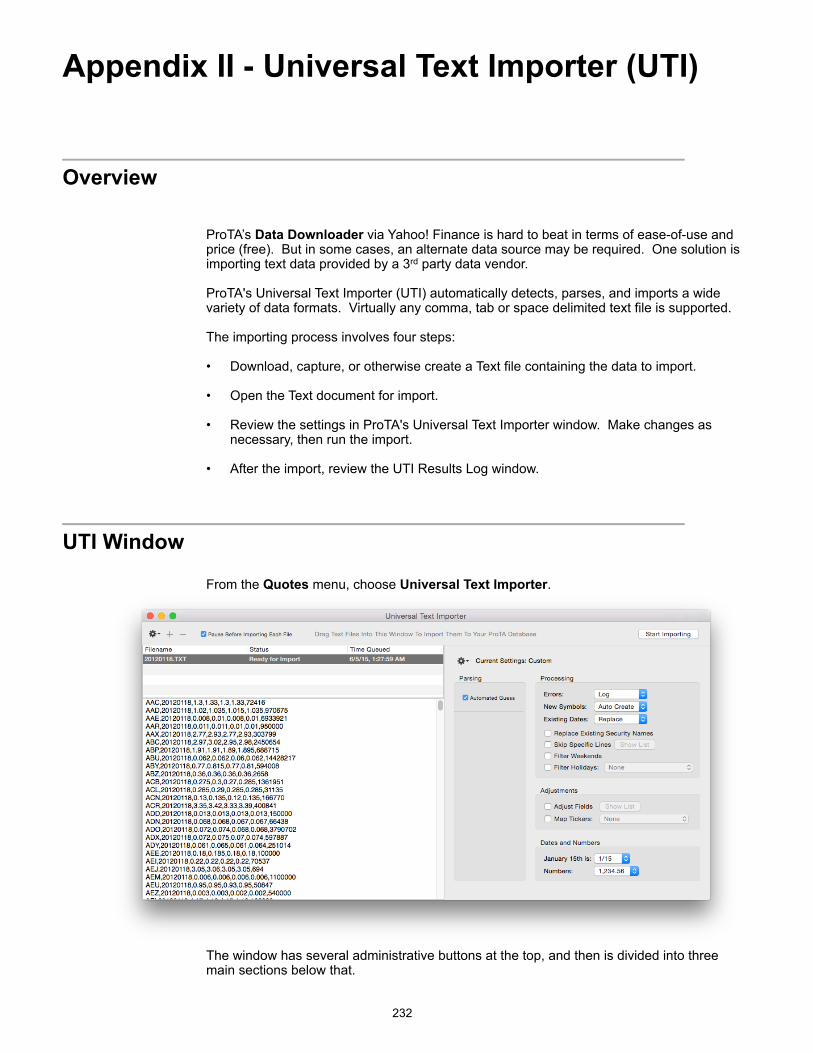
Appendix II - Universal Text Importer (UTI)
!Overview
ProTA’s Data Downloader via Yahoo! Finance is hard to beat in terms of ease-of-use and price (free). But in some cases, an alternate data source may be required. One solution is importing text data provided by a 3rd party data vendor.
ProTA's Universal Text Importer (UTI) automatically detects, parses, and imports a wide variety of data formats. Virtually any comma, tab or space delimited text file is supported.
The importing process involves four steps:
• Download, capture, or otherwise create a Text file containing the data to import.
• Open the Text document for import.
• Review the settings in ProTA's Universal Text Importer window. Make changes as necessary, then run the import.
• After the import, review the UTI Results Log window.
! UTI Window
From the Quotes menu, choose Universal Text Importer.
! The window has several administrative buttons at the top, and then is divided into three main sections below that.
!232
The Files Queue Table in the upper left lists all of the files that are to be imported or have recently completed. Select a file in the table to see its contents in the text pane below (if the file has already been imported, the results log for that file is displayed instead).
The right side of the window is dedicated to the settings that will be used when importing the file(s).
Pause Before Each File. When checked, the Queue will pause at each file awaiting the Start Importing command in the Toolbar. Uncheck this to import an entire queue of files without interruption.
Adding Files To Be Imported
Once you have obtained text file(s) from your data source, the first step is loading them into the UTI queue:
• Select files in the OS X Finder and drag them into the UTI Files Queue Table to queue them for import.
or
• Press the + button in the upper left to select file(s) to be queued.
• To remove items from the list, highlight the rows, then click the – button at the upper left. (The text files will not be deleted from your hard drive; they are simply removed from the Files Queue Table listing.)
Note. The Queue of files is cleared when you quit the program.
Configuring Settings
The entire right side of the UTI window is dedicated to the settings for the import.
Use the Gear widget to save a Settings for future re-use, or to apply a Settings that was previously saved.
Below the Gear widget are the controls that specify and manage the importing logic. All of the various options are described in the UTI Settings section.
Start Importing
Once you have reviewed and edited the various settings, click Start Importing in the upper right to begin the importing process. If the process takes more than a few seconds, you will se a progress panel. Upon completion, a results log is displayed for the import.
! UTI Settings
The UTI provides a lot of flexibility for your importing needs. As a consequence, there are a lot of options to configure for any given import.
!233
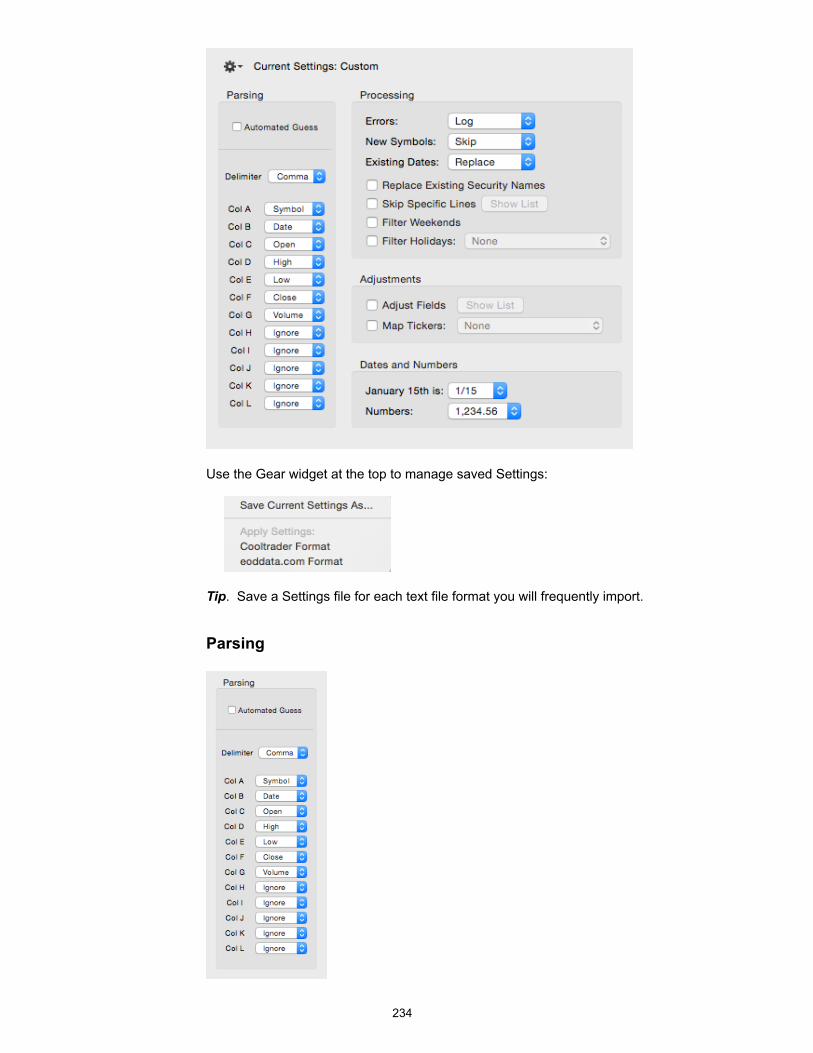
!
Use the Gear widget at the top to manage saved Settings:
!
Tip. Save a Settings file for each text file format you will frequently import.
Parsing
!
!234
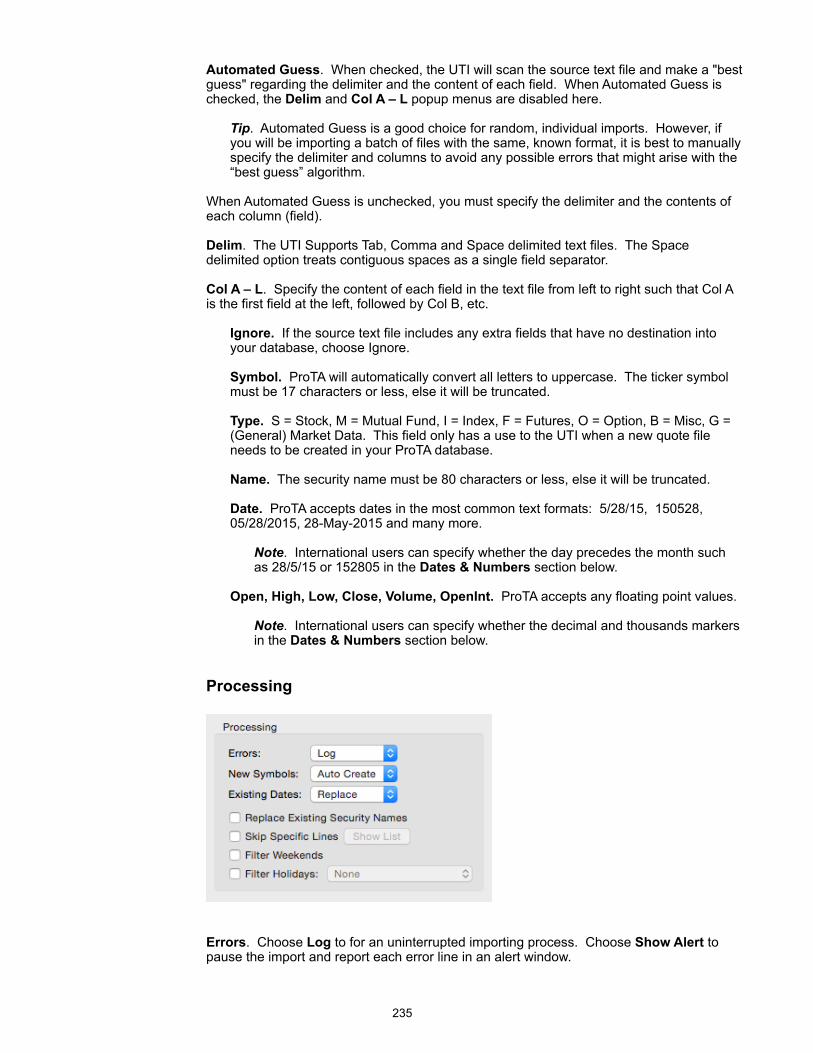
Automated Guess. When checked, the UTI will scan the source text file and make a "best guess" regarding the delimiter and the content of each field. When Automated Guess is checked, the Delim and Col A – L popup menus are disabled here.
Tip. Automated Guess is a good choice for random, individual imports. However, if you will be importing a batch of files with the same, known format, it is best to manually specify the delimiter and columns to avoid any possible errors that might arise with the “best guess” algorithm.
When Automated Guess is unchecked, you must specify the delimiter and the contents of each column (field).
Delim. The UTI Supports Tab, Comma and Space delimited text files. The Space delimited option treats contiguous spaces as a single field separator.
Col A – L. Specify the content of each field in the text file from left to right such that Col A is the first field at the left, followed by Col B, etc.
Ignore. If the source text file includes any extra fields that have no destination into your database, choose Ignore.
Symbol. ProTA will automatically convert all letters to uppercase. The ticker symbol must be 17 characters or less, else it will be truncated.
Type. S = Stock, M = Mutual Fund, I = Index, F = Futures, O = Option, B = Misc, G = (General) Market Data. This field only has a use to the UTI when a new quote file needs to be created in your ProTA database.
Name. The security name must be 80 characters or less, else it will be truncated.
Date. ProTA accepts dates in the most common text formats: 5/28/15, 150528, 05/28/2015, 28-May-2015 and many more.
Note. International users can specify whether the day precedes the month such as 28/5/15 or 152805 in the Dates & Numbers section below.
Open, High, Low, Close, Volume, OpenInt. ProTA accepts any floating point values.
Note. International users can specify whether the decimal and thousands markers in the Dates & Numbers section below.
Processing
!
Errors. Choose Log to for an uninterrupted importing process. Choose Show Alert to pause the import and report each error line in an alert window.
!235
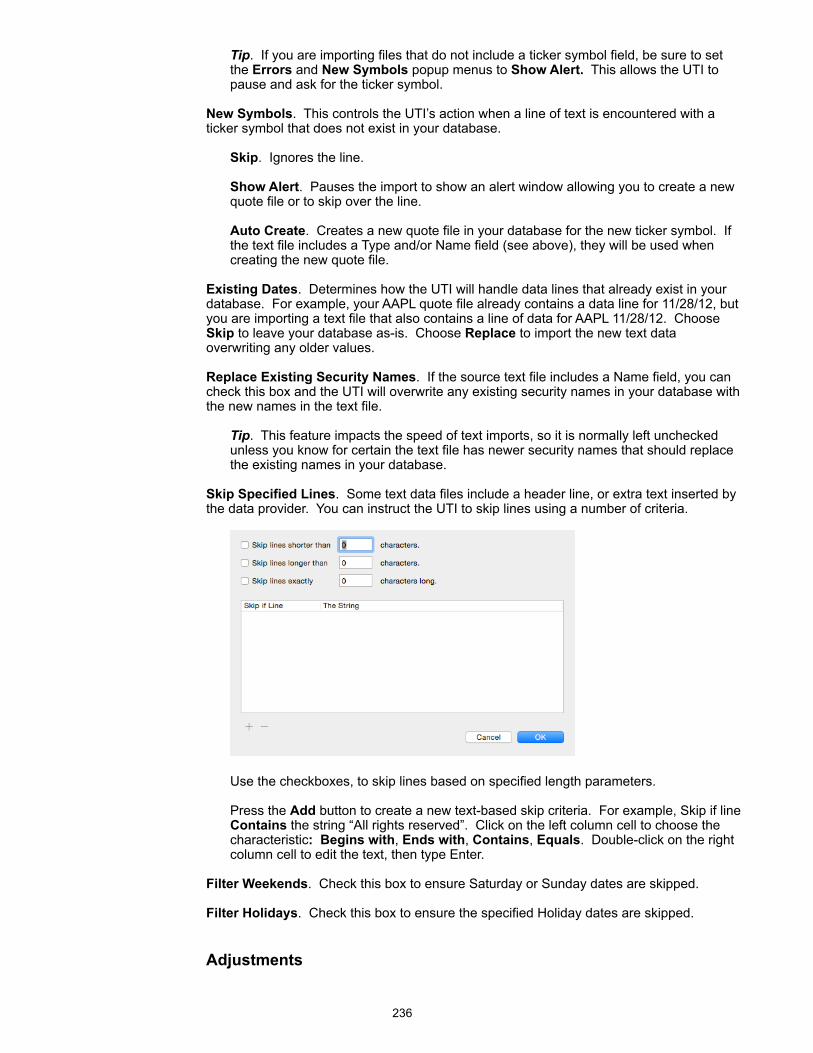
Tip. If you are importing files that do not include a ticker symbol field, be sure to set the Errors and New Symbols popup menus to Show Alert. This allows the UTI to pause and ask for the ticker symbol.
New Symbols. This controls the UTI’s action when a line of text is encountered with a ticker symbol that does not exist in your database.
Skip. Ignores the line.
Show Alert. Pauses the import to show an alert window allowing you to create a new quote file or to skip over the line.
Auto Create. Creates a new quote file in your database for the new ticker symbol. If the text file includes a Type and/or Name field (see above), they will be used when creating the new quote file.
Existing Dates. Determines how the UTI will handle data lines that already exist in your database. For example, your AAPL quote file already contains a data line for 11/28/12, but you are importing a text file that also contains a line of data for AAPL 11/28/12. Choose Skip to leave your database as-is. Choose Replace to import the new text data overwriting any older values.
Replace Existing Security Names. If the source text file includes a Name field, you can check this box and the UTI will overwrite any existing security names in your database with the new names in the text file.
Tip. This feature impacts the speed of text imports, so it is normally left unchecked unless you know for certain the text file has newer security names that should replace the existing names in your database.
Skip Specified Lines. Some text data files include a header line, or extra text inserted by the data provider. You can instruct the UTI to skip lines using a number of criteria.
!
Use the checkboxes, to skip lines based on specified length parameters.
Press the Add button to create a new text-based skip criteria. For example, Skip if line Contains the string “All rights reserved”. Click on the left column cell to choose the characteristic: Begins with, Ends with, Contains, Equals. Double-click on the right column cell to edit the text, then type Enter.
Filter Weekends. Check this box to ensure Saturday or Sunday dates are skipped.
Filter Holidays. Check this box to ensure the specified Holiday dates are skipped.
Adjustments
!236
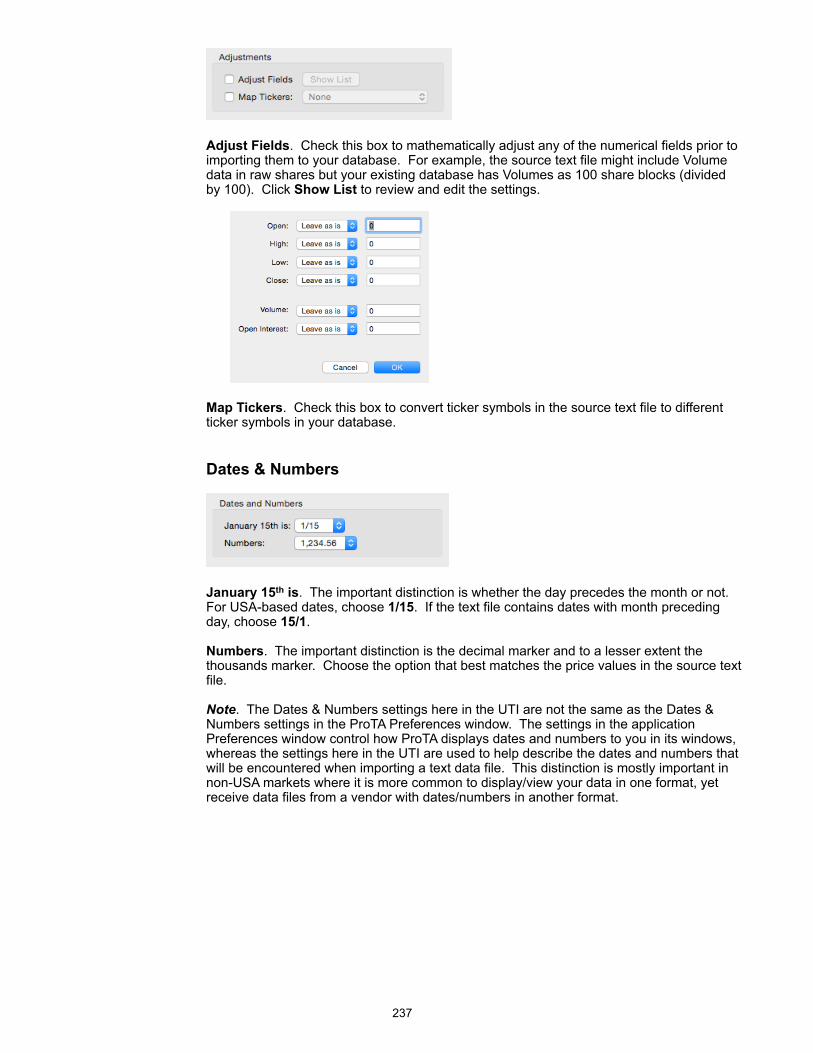
!
Adjust Fields. Check this box to mathematically adjust any of the numerical fields prior to importing them to your database. For example, the source text file might include Volume data in raw shares but your existing database has Volumes as 100 share blocks (divided by 100). Click Show List to review and edit the settings.
!
Map Tickers. Check this box to convert ticker symbols in the source text file to different ticker symbols in your database.
Dates & Numbers
!
January 15th is. The important distinction is whether the day precedes the month or not. For USA-based dates, choose 1/15. If the text file contains dates with month preceding day, choose 15/1.
Numbers. The important distinction is the decimal marker and to a lesser extent the thousands marker. Choose the option that best matches the price values in the source text file.
Note. The Dates & Numbers settings here in the UTI are not the same as the Dates & Numbers settings in the ProTA Preferences window. The settings in the application Preferences window control how ProTA displays dates and numbers to you in its windows, whereas the settings here in the UTI are used to help describe the dates and numbers that will be encountered when importing a text data file. This distinction is mostly important in non-USA markets where it is more common to display/view your data in one format, yet receive data files from a vendor with dates/numbers in another format.
!237
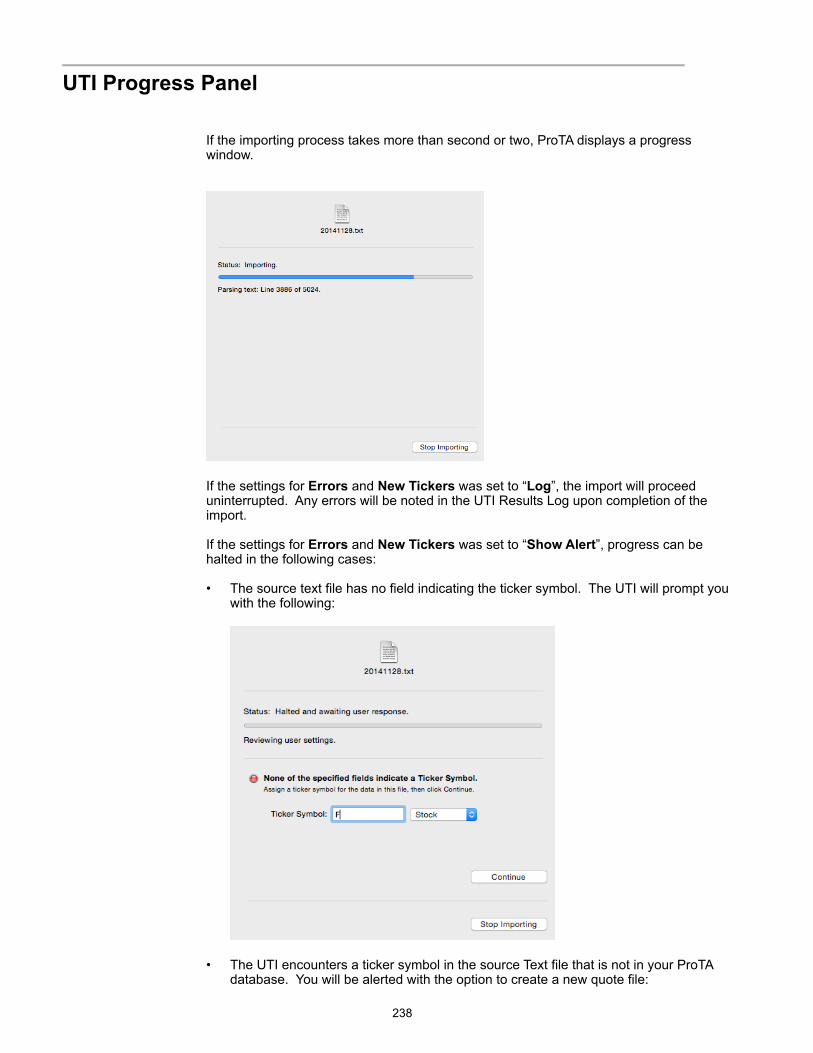
! UTI Progress Panel
If the importing process takes more than second or two, ProTA displays a progress window.
!
If the settings for Errors and New Tickers was set to “Log”, the import will proceed uninterrupted. Any errors will be noted in the UTI Results Log upon completion of the import.
If the settings for Errors and New Tickers was set to “Show Alert”, progress can be halted in the following cases:
• The source text file has no field indicating the ticker symbol. The UTI will prompt you with the following:
!
• The UTI encounters a ticker symbol in the source Text file that is not in your ProTA database. You will be alerted with the option to create a new quote file:
!238
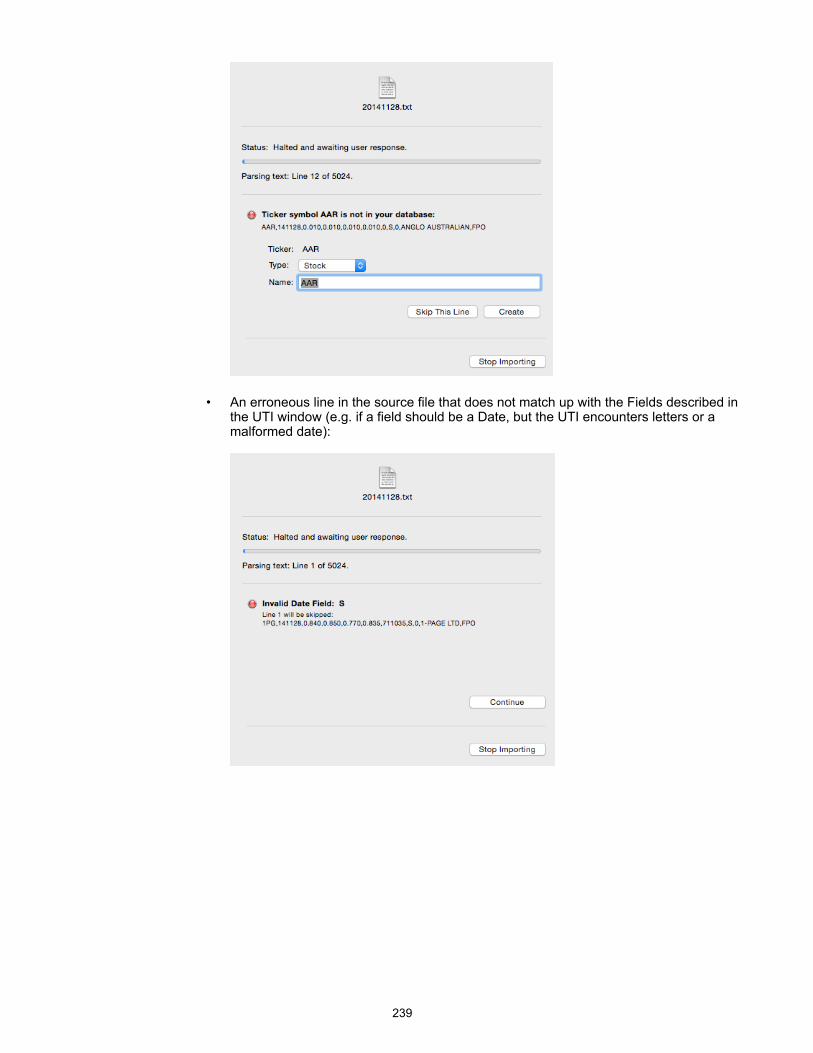
!
• An erroneous line in the source file that does not match up with the Fields described in the UTI window (e.g. if a field should be a Date, but the UTI encounters letters or a malformed date):
!
!239
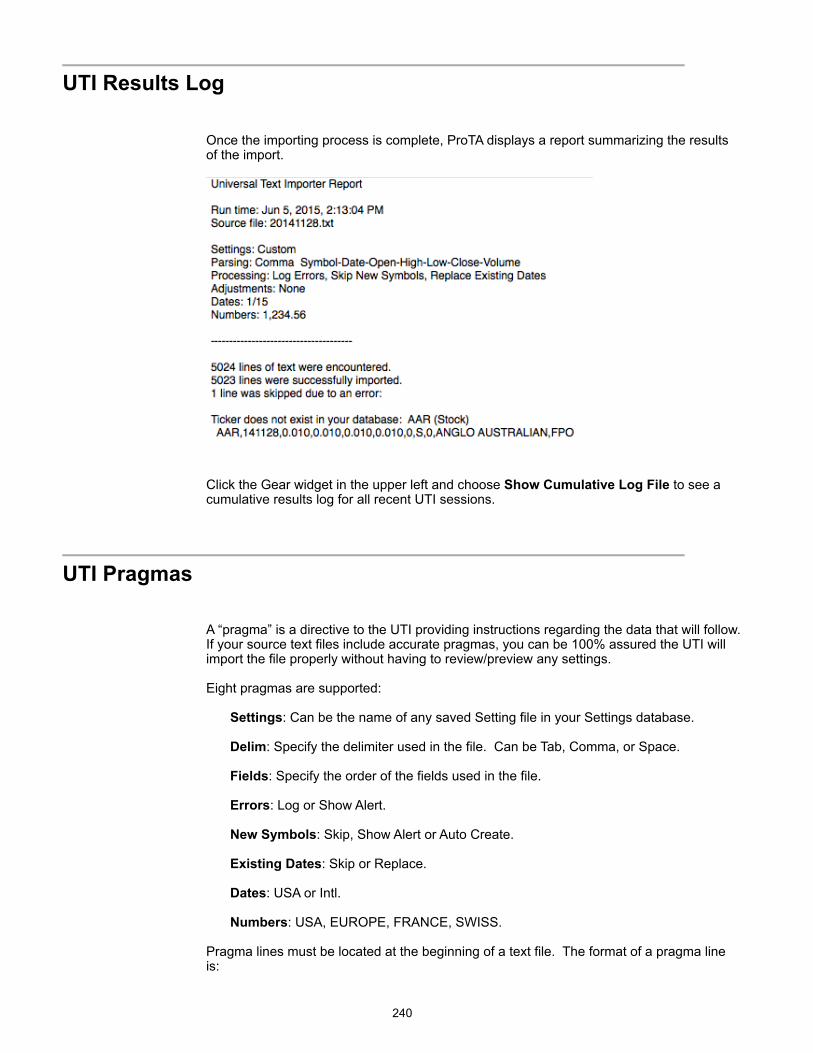
! UTI Results Log
Once the importing process is complete, ProTA displays a report summarizing the results of the import.
!
Click the Gear widget in the upper left and choose Show Cumulative Log File to see a cumulative results log for all recent UTI sessions.
! UTI Pragmas
A “pragma” is a directive to the UTI providing instructions regarding the data that will follow. If your source text files include accurate pragmas, you can be 100% assured the UTI will import the file properly without having to review/preview any settings.
Eight pragmas are supported:
Settings: Can be the name of any saved Setting file in your Settings database.
Delim: Specify the delimiter used in the file. Can be Tab, Comma, or Space.
Fields: Specify the order of the fields used in the file.
Errors: Log or Show Alert.
New Symbols: Skip, Show Alert or Auto Create.
Existing Dates: Skip or Replace.
Dates: USA or Intl.
Numbers: USA, EUROPE, FRANCE, SWISS.
Pragma lines must be located at the beginning of a text file. The format of a pragma line is:
!240
<Pragma Name> Description
An example of all 8 pragmas:
<Settings> Yahoo Spreadsheet
<Delim> Comma <Fields> Date Open High Low Close Volume <Errors> Show Alert <New Symbols> Show Alert <Existing Dates> Replace <Dates> USA <Numbers> USA
28-May-99,26.9688,27.2812,26.625,27.25,7333000 27-May-99,27.2188,27.5312,26.50,27,12573100 26-May-99,26.3438,27.5156,25.9375,27.2812,20084600 25-May-99,27.4219,27.4219,26.0312,26.0938,16188000
Note. Normally you would not provide all 8 pragmas in the same file. Either provide a Settings pragma or provide any/all of the remaining 7 pragmas.
!241
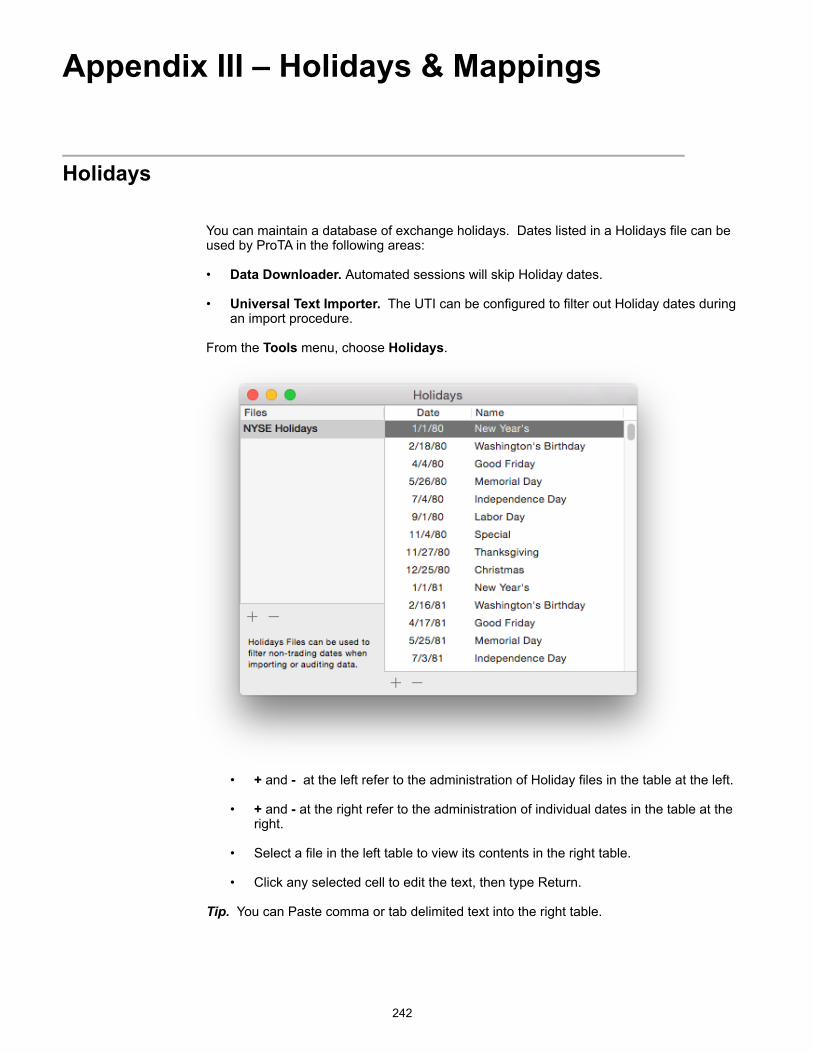
Appendix III – Holidays & Mappings
!Holidays
You can maintain a database of exchange holidays. Dates listed in a Holidays file can be used by ProTA in the following areas:
• Data Downloader. Automated sessions will skip Holiday dates.
• Universal Text Importer. The UTI can be configured to filter out Holiday dates during an import procedure.
From the Tools menu, choose Holidays.
! • + and - at the left refer to the administration of Holiday files in the table at the left.
• + and - at the right refer to the administration of individual dates in the table at the right.
• Select a file in the left table to view its contents in the right table.
• Click any selected cell to edit the text, then type Return.
Tip. You can Paste comma or tab delimited text into the right table.
!242
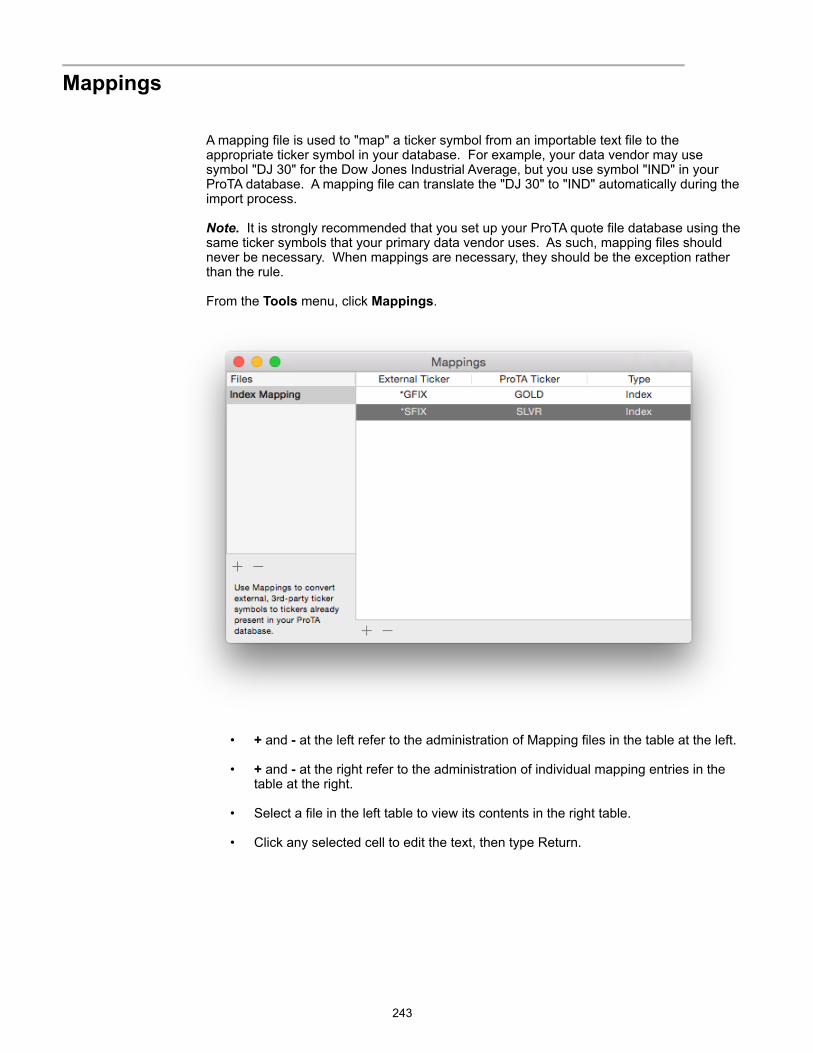
!Mappings
A mapping file is used to "map" a ticker symbol from an importable text file to the appropriate ticker symbol in your database. For example, your data vendor may use symbol "DJ 30" for the Dow Jones Industrial Average, but you use symbol "IND" in your ProTA database. A mapping file can translate the "DJ 30" to "IND" automatically during the import process.
Note. It is strongly recommended that you set up your ProTA quote file database using the same ticker symbols that your primary data vendor uses. As such, mapping files should never be necessary. When mappings are necessary, they should be the exception rather than the rule.
From the Tools menu, click Mappings.
!
• + and - at the left refer to the administration of Mapping files in the table at the left.
• + and - at the right refer to the administration of individual mapping entries in the table at the right.
• Select a file in the left table to view its contents in the right table.
• Click any selected cell to edit the text, then type Return.
!243