protected species toolbox - science & technology to the fishery management plans (fmp) of the...
TRANSCRIPT
Protected species toolbox
Quantitative tools to assess the impact of anthropogenic activity on sea turtle populations
Heather Haas (NEFSC), Melissa Warden (Integrated Statistics), Paul Richards (SEFSC)
NEFSC
18 Nov 2015
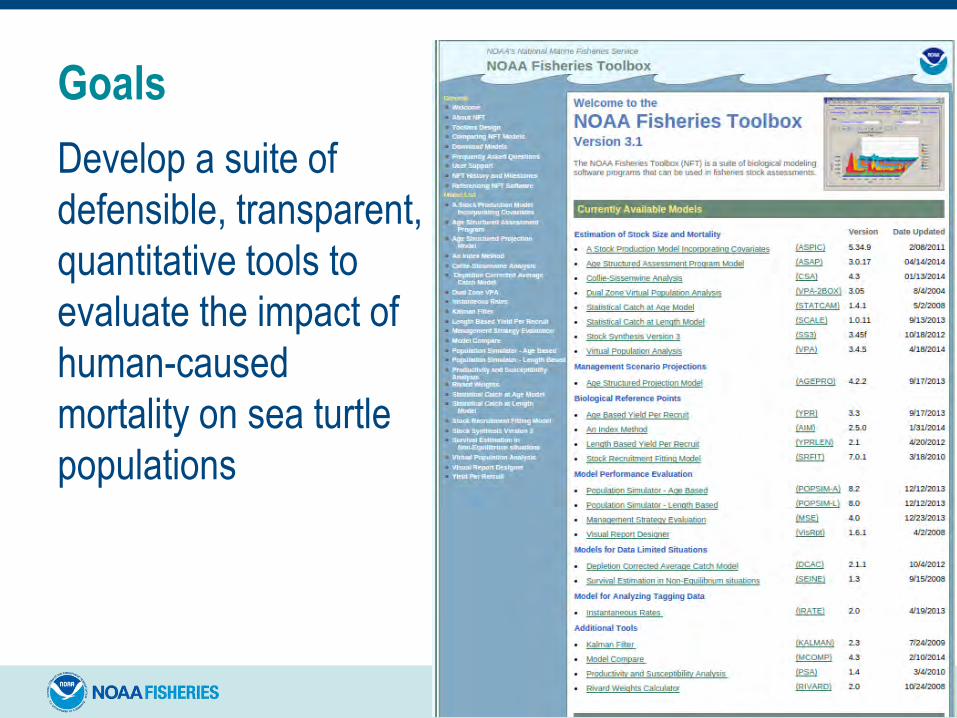
Goals
Develop a suite of
defensible, transparent,
quantitative tools to
evaluate the impact of
human-caused
mortality on sea turtle
populations
U.S. Department of Commerce | National Oceanic and Atmospheric Administration | NOAA Fisheries | Page 2

Three-phase plan
• Population model with removals
• Removal from different life stages
• Removal as individual turtles or adult equivalents
• Investigate population monitoring metrics
• Apply and evaluate impact assessment tools
U.S. Department of Commerce | National Oceanic and Atmospheric Administration | NOAA Fisheries | Page 3

First phase
U.S. Department of Commerce | National Oceanic and Atmospheric Administration | NOAA Fisheries | Page 4
Establish spatial loggerhead population model
Impact of removals from different life stages
Model structure and general overview
• Spatial matrix model
• Annual survival and fecundity
• 4 life stages
• 3 regions (neritic north, neritic south, oceanic)
• Removals from the population in terms of
individuals or adult equivalents, and affecting
different life stages or regions
U.S. Department of Commerce | National Oceanic and Atmospheric Administration | NOAA Fisheries | Page 5

Simulated population trajectory minus
removal
• Population projection
• Removals
U.S. Department of Commerce | National Oceanic and Atmospheric Administration | NOAA Fisheries | Page 6
n(t + 1) = An(t)
n(t ) = n(t) - r

Removals
• Standard: based on stage distribution (but adjusted
so not heavy on stage 1)
• Weighted
• 50% to neritic north, 50% to neritic south
• 50% to oceanic
• 50% to stage 1, 2, 3, or 4
• Individuals or adult equivalents (determined from
model-based reproductive values)
U.S. Department of Commerce | National Oceanic and Atmospheric Administration | NOAA Fisheries | Page 7

Reproductive values
U.S. Department of Commerce | National Oceanic and Atmospheric Administration | NOAA Fisheries | Page 8
• Size-based proportions representing the
contributions that individuals make to current and
future reproduction
• Used to calculate
adult equivalents
• Scaled so equals 1
for the breeding class
and near 0 for youngest
turtles, so one breeding adult = 1 adult equivalent

Results
Removal in
terms of
adult
equivalents
is robust to
affected life
stage
U.S. Department of Commerce | National Oceanic and Atmospheric Administration | NOAA Fisheries | Page 9

U.S. Department of Commerce | National Oceanic and Atmospheric Administration | NOAA Fisheries | Page 10
Second phase
Explore monitoring metrics

Allow variation in parameter estimates
Within
simulations
(annual
variability)
Between simulations (parameter uncertainty)
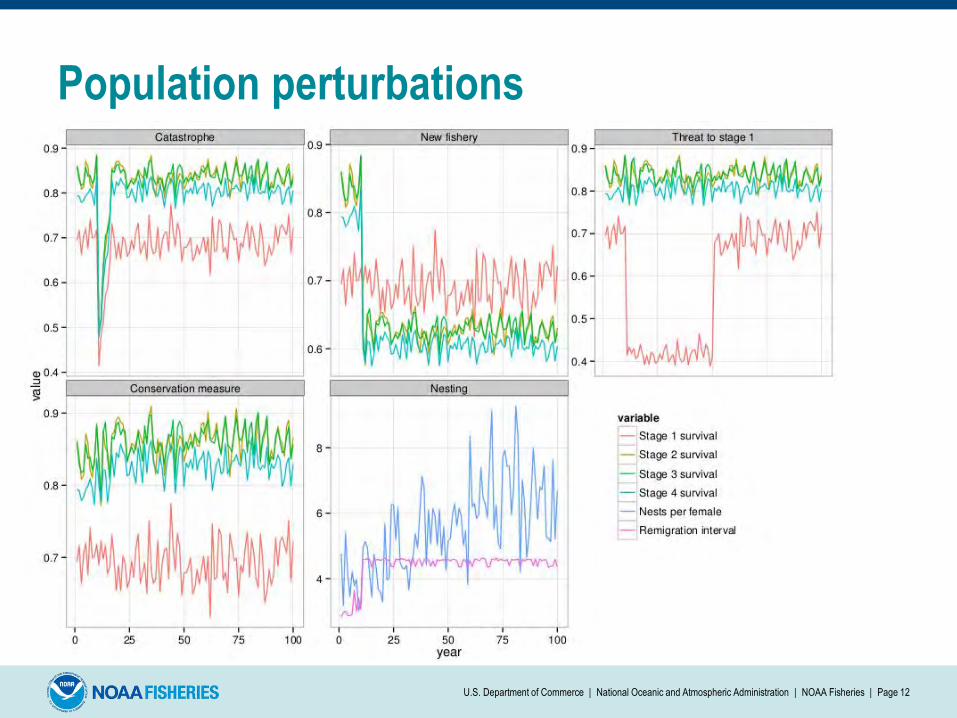
Population perturbations
U.S. Department of Commerce | National Oceanic and Atmospheric Administration | NOAA Fisheries | Page 12

Monitoring index: nest counts
U.S. Department of Commerce | National Oceanic and Atmospheric Administration | NOAA Fisheries | Page 13
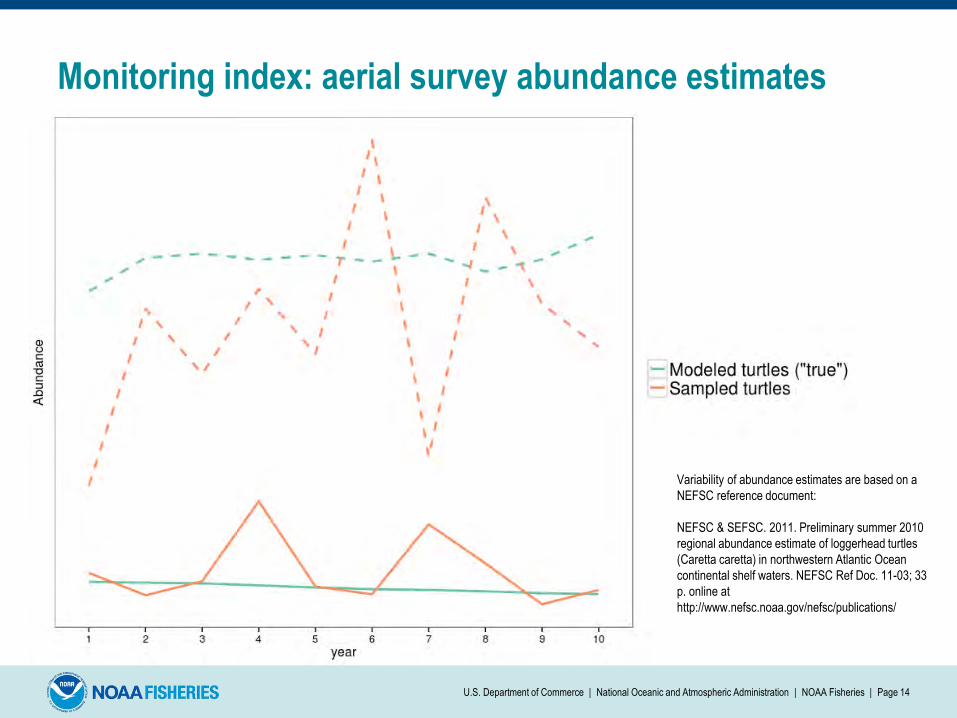
Monitoring index: aerial survey abundance estimates
U.S. Department of Commerce | National Oceanic and Atmospheric Administration | NOAA Fisheries | Page 14
Variability of abundance estimates are based on a
NEFSC reference document:
NEFSC & SEFSC. 2011. Preliminary summer 2010
regional abundance estimate of loggerhead turtles
(Caretta caretta) in northwestern Atlantic Ocean
continental shelf waters. NEFSC Ref Doc. 11-03; 33
p. online at
http://www.nefsc.noaa.gov/nefsc/publications/

Results: Compare with adult equivalents
U.S. Department of Commerce | National Oceanic and Atmospheric Administration | NOAA Fisheries | Page 15

U.S. Department of Commerce | National Oceanic and Atmospheric Administration | NOAA Fisheries | Page 16
Third phase
Apply and evaluate new and existing tools
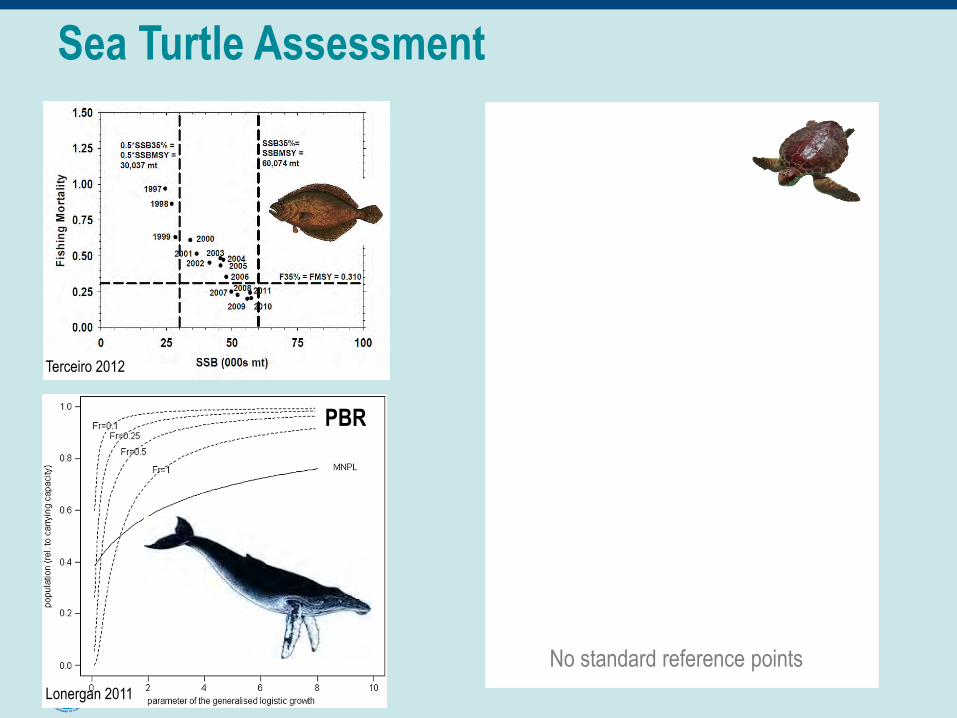
Sea Turtle Assessment
PBR
No standard reference points
Lonergan 2011
Terceiro 2012
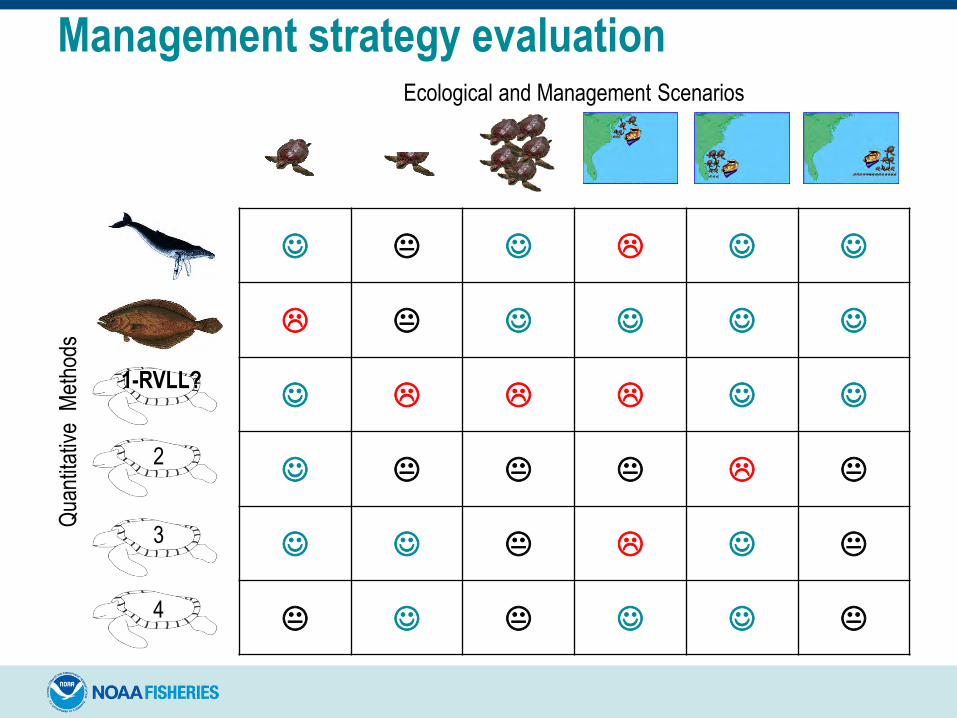
Qua
ntita
tive
Met
hods
Ecological and Management Scenarios
Management strategy evaluation
1-RVLL?
2
3
4

U.S. Department of Commerce | National Oceanic and Atmospheric Administration | NOAA Fisheries | Page 19
Questions?

3 regions
U.S. Department of Commerce | National Oceanic and Atmospheric Administration | NOAA Fisheries | Page 20
• Represent
foraging areas
• Neritic north,
neritic south,
oceanic

Survival and remigration rates
U.S. Department of Commerce | National Oceanic and Atmospheric Administration | NOAA Fisheries | Page 21
Harvest-corrected survival rate (𝑆)
Stage Stage description Oceanic (O) or
neritic (N) Approximate
CCL (cm) Duration (d)
(years) Estimated
survival rate (𝑆∗) Neritic
(NN & NS) Oceanic (OC)
I Hatchling and
oceanic juvenile O Hatchling – 60.45 13 (10, 18) 0.744 (0.588, 0.878) 0.745 0.744
II Small juvenile N, O 60.46-75.72 10 (9, 12) 0.830 (0.740, 0.890) 0.836 0.830
III Large juvenile N, O 75.73-101.5 7 (4, 12) 0.835 (0.740, 0.925) 0.841 0.836
IV Adult N, O 101.5 indefinite 0.841 (0.770, 0.925) 0.847 0.841
Remigration interval (yr)
Observed
Mortality-corrected
1 0.019 0.014 2 0.466 0.412 3 0.348 0.362 4 0.130 0.159
5+ 0.037 0.053

Fecundity
Elements of calculating fecundity for nesting female
U.S. Department of Commerce | National Oceanic and Atmospheric Administration | NOAA Fisheries | Page 22
nests per nesting female per year eggs per nest
egg survival (i.e., proportion of eggs hatched)
proportion of female offspring year 1 survival
5 (2, 8) 109 (89, 125) 0.53 (0.11, 0.82) 0.5 (0.35, 0.80) 0.744
F = 5 x 109 x 0.53 x 0.5 x 0.744 = 107.5 ≈ 108

Standard removals
U.S. Department of Commerce | National Oceanic and Atmospheric Administration | NOAA Fisheries | Page 23

Model structure: patch-specific
U.S. Department of Commerce | National Oceanic and Atmospheric Administration | NOAA Fisheries | Page 24
1080.745
⋱0.745
0.836⋱
0.8360.841
⋱0.841 0.847 ∗ 0.014 0.847
0.847 ∗ 0.0530.847 ∗ 0.159 0.8470.847 ∗ 0.362 0.8470.847 ∗ 0.412 0.847
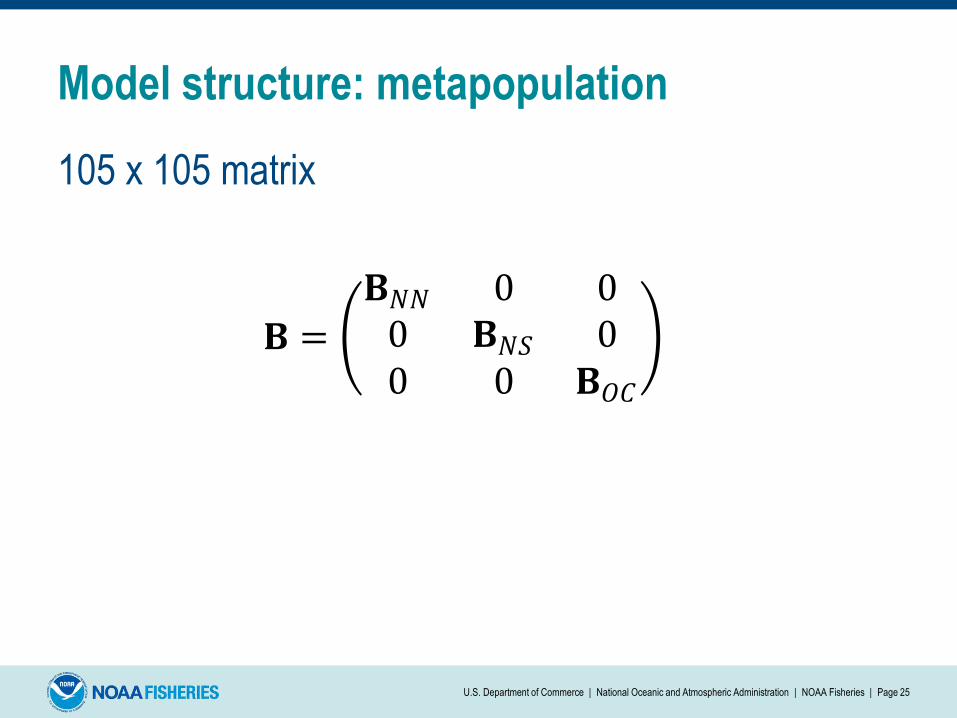
Model structure: metapopulation
105 x 105 matrix
U.S. Department of Commerce | National Oceanic and Atmospheric Administration | NOAA Fisheries | Page 25
𝐁 =
𝐁𝑁𝑁 0 00 𝐁𝑁𝑆 00 0 𝐁𝑂𝐶
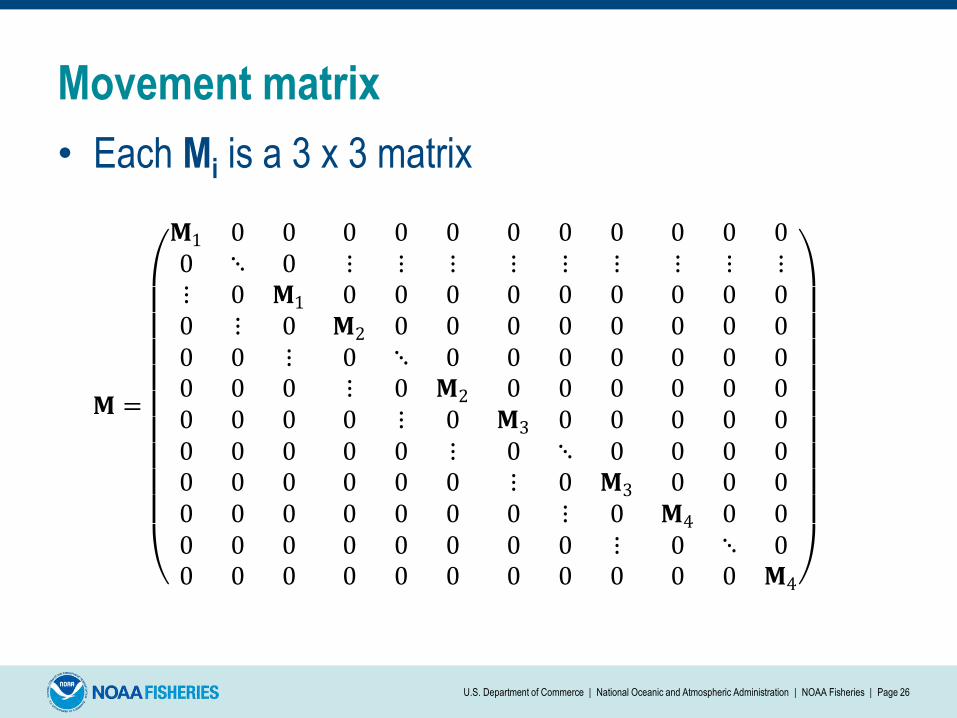
Movement matrix
• Each Mi is a 3 x 3 matrix
U.S. Department of Commerce | National Oceanic and Atmospheric Administration | NOAA Fisheries | Page 26
𝐌 =
𝐌1 0 0 0 0 0 0 0 0 0 0 00 ⋱ 0 ⋮ ⋮ ⋮ ⋮ ⋮ ⋮ ⋮ ⋮ ⋮⋮ 0 𝐌1 0 0 0 0 0 0 0 0 00 ⋮ 0 𝐌2 0 0 0 0 0 0 0 00 0 ⋮ 0 ⋱ 0 0 0 0 0 0 00 0 0 ⋮ 0 𝐌2 0 0 0 0 0 00 0 0 0 ⋮ 0 𝐌3 0 0 0 0 00 0 0 0 0 ⋮ 0 ⋱ 0 0 0 00 0 0 0 0 0 ⋮ 0 𝐌3 0 0 00 0 0 0 0 0 0 ⋮ 0 𝐌4 0 00 0 0 0 0 0 0 0 ⋮ 0 ⋱ 00 0 0 0 0 0 0 0 0 0 0 𝐌4

Movement between patches
U.S. Department of Commerce | National Oceanic and Atmospheric Administration | NOAA Fisheries | Page 27
Stage I II III IV
Origination
Patch NN NS O NN NS O NN NS O NN NS O
NN 0.001 0.001 0.001 0.02 0.02 0.02 0.02 0.02 0.02 0.03 0.03 0.03 Destination
NS 0.019 0.019 0.019 0.65 0.65 0.65 0.65 0.65 0.65 0.92 0.96 0.92
O 0.98 0.98 0.98 0.33 0.33 0.33 0.33 0.33 0.33 0.05 0.01 0.05
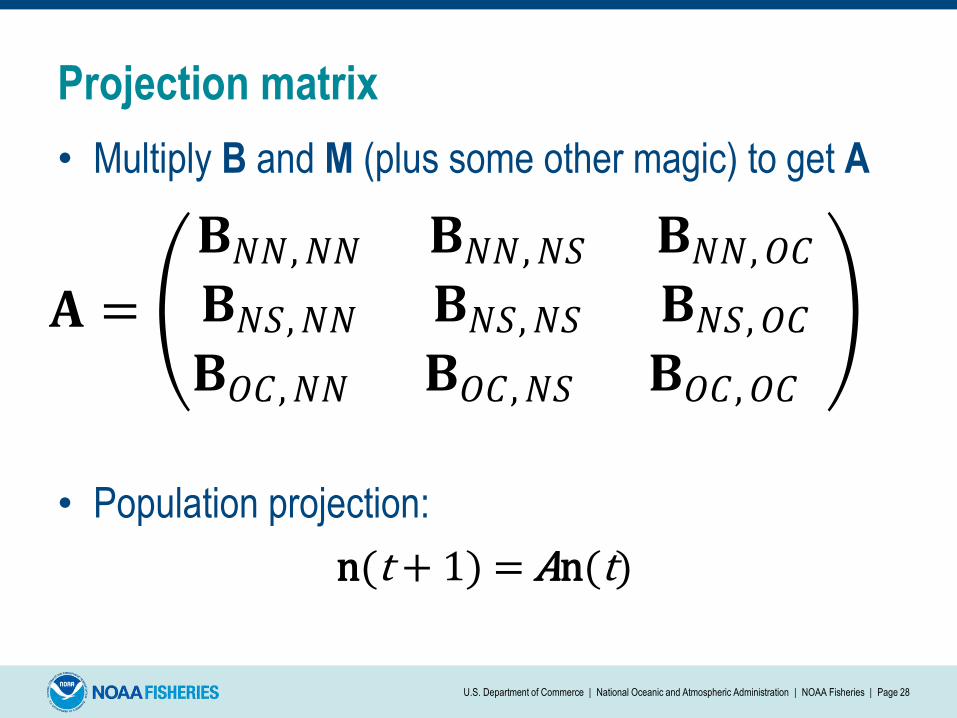
Projection matrix
• Multiply B and M (plus some other magic) to get A
• Population projection:
U.S. Department of Commerce | National Oceanic and Atmospheric Administration | NOAA Fisheries | Page 28
𝐀 =
𝐁𝑁𝑁 , 𝑁𝑁 𝐁𝑁𝑁 , 𝑁𝑆 𝐁𝑁𝑁 , 𝑂𝐶
𝐁𝑁𝑆, 𝑁𝑁 𝐁𝑁𝑆, 𝑁𝑆 𝐁𝑁𝑆, 𝑂𝐶
𝐁𝑂𝐶 , 𝑁𝑁 𝐁𝑂𝐶 , 𝑁𝑆 𝐁𝑂𝐶 , 𝑂𝐶
n(t + 1) = An(t)

Annual loggerhead ITS (lethal)
U.S. Department of Commerce | National Oceanic and Atmospheric Administration | NOAA Fisheries | Page 29
Biological opinion ITS date NMFS' approval of the tilefish fishery management plan 3 Mar 2001 Implementation of the Deep-Sea Red Crab, Chaceon quinquedens, fishery management plan 1 Feb 2002 Endangered Species Act section 7 consultation on the fishery management plan for the dolphin and wahoo fishery of the Atlantic Ocean 0.67 Aug 2003 Sea turtle conservation measures for the pound net fishery in Virginia waters of the Chesapeake Bay 2 Apr 2004 Reinitiation of consultation on the Atlantic pelagic longline fishery for highly migratory species 143 Jun 2004 Amendment to the fishery management plans (FMP) of the U.S. Caribbean to address required provisions of the Magnuson-Stevens Fishery Conservation and Management Act, as amended by the Sustainable Fisheries Act 0 Aug 2005 The continued authorization of snapper-grouper fishing in the U.S. South Atlantic exclusive economic zone (EEZ) as managed under the snapper-grouper fishery management plan of the South Atlantic region, including Amendment 13C to the SGFMP 22.33 Jun 2006 The continued authorization of fishing under the fishery management plan (FMP) for coastal migratory pelagic resources in the Atlantic and Gulf of Mexico 11 Aug 2007 The continued authorization of fishing under the fishery management plan (FMP) for spiny lobster in the South Atlantic and Gulf of Mexico 1 Aug 2009 The continued authorization of fishing under the fishery management plan for the stone crab fishery of the Gulf of Mexico [F/SER/2005/07541] 1.33 Sep 2009
Endangered Species Act Section 7 reinitation consultation on the federal Atlantic herring fishery management plan (FMP) **(Internal NMFS memorandum to document that the fishery was not likely to adversely affect protected species, so no formal biological opinion completed.) 0 Feb 2010 The continued authorization of reef fish fishing under the Gulf of Mexico (Gulf) reef fish fishery management plan (RFFMP) 191 Sep 2011 Reinitiation of Endangered Species Act (ESA) Section 7 consultation of the continued implementation of the sea turtle conservations regulations, as proposed to be amended, and the continued authorization of the Southeast U.S. shrimp fisheries in federal waters under the Magnuson-Stevens Act 7,701 May 2012 Endangered Species Act Section 7 consultation on the Atlantic sea scallop fishery management plan 112 Jul 2012 Endangered Species Act Section 7 consultation on the continued implementation of management measures for the American lobster fishery 1 Aug 2012 Endangered Species Act Section 7 consultation on the NEFSC research vessel surveys as well as two cooperative gear research studies to be overseen by the NEFSC protected species branch (PSB) 1 Nov 2012 Continued authorization of the Atlantic shark fisheries via the consolidated HMS fishery management plan as amended by Amendments 3 and 4 and the federal authorization of a Smoothhound fishery 26 Dec 2012 Endangered Species Act Section 7 consultation on the continued implementation of management measures for the Northeast multispecies, monkfish, spiny dogfish, Atlantic bluefish, Northeast skate complex, mackerel/squid/butterfish, and summer flounder/ scup/black sea bass fisheries 239 Dec 2013
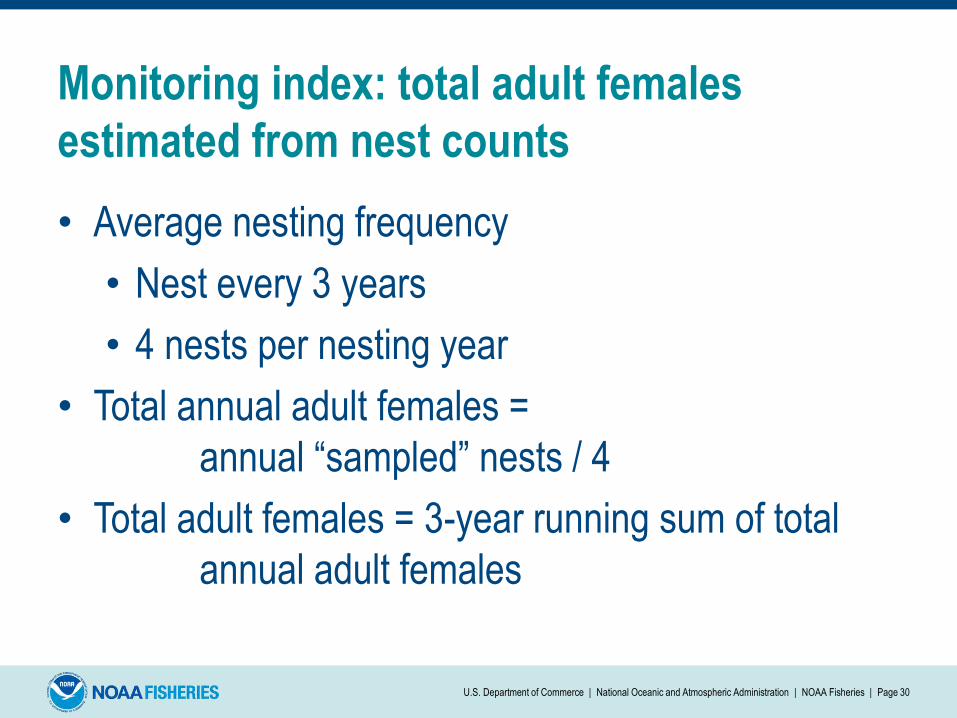
Monitoring index: total adult females
estimated from nest counts
• Average nesting frequency
• Nest every 3 years
• 4 nests per nesting year
• Total annual adult females =
annual “sampled” nests / 4
• Total adult females = 3-year running sum of total
annual adult females
U.S. Department of Commerce | National Oceanic and Atmospheric Administration | NOAA Fisheries | Page 30