protection. it’s in our nature. - fbd group · 2 financial highlights 2019 €000s 2018 €000s...
TRANSCRIPT

FBD Holdings plc Annual Report 2019
Protection. It’s in our nature.

Strategic Report 1 FBD at a Glance2 Financial Highlights3 Our Purpose4 Chairman's Statement7 2019 in Pictures8 Review of Operations 14 Our Business Model16 Our Strategy18 Risk & Uncertainties Report26 Corporate Social Responsibility 33 Corporate Information
Governance36 Board of Directors38 Report of the Directors44 Corporate Governance54 Nomination and Governance Report57 Report on Directors’ Remuneration 68 Directors’ Responsibilities Statement 69 Independent Auditors’ Report
In this years report
Financial Statements80 Consolidated Income Statement 81 Consolidated Statement of Comprehensive Income82 Consolidated Statement of Financial Position84 Consolidated Statement of Cash Flows85 Consolidated Statement of Changes in Equity86 Company Statement of Financial Position87 Company Statement of Cash Flows88 Company Statement of Changes in Equity89 Notes to the Financial Statements
Other Information151 Alternative Performance Measures
Explore onlineVisit our website to find out more: www.FBD.ie or follow us and join the conversation
Front CoverGary and Paul O’Donovan RowingChloe Watkins HockeyRhasidat Adeleke AthleticsEmma Slevin Gymnastics

Established in the 1960s by farmers for farmers, FBD has built on our roots in agriculture to become a leading general insurer directly serving the needs of agricultural, small business and consumer customers throughout Ireland.
FBD at a Glance
2019 Performance Highlights
Profit before tax
€112m(2018: €50m)
Return on Equity
30%(2018: 15%)
Combined operating ratio
72%(2018: 81%)
Per Share Dividend Proposed
100c(2018: 50c)
Net Asset Value
1,068c(2018: 818c)
Gross premium written
€370m(2018: €372m)
FBD Holdings plc Annual Report 2019 1

2
Financial Highlights
2019€000s
2018€000s
Gross premium written 370,063 371,504
Net premium earned 337,553 337,903
Profit for the financial year 98,225 42,383
2019Cent
2018Cent
Basic earnings per share 281 122
Diluted earnings per share 2761 1122
Net asset value per share 1,068 818
Ordinary dividend per share proposed 100 50
Ordinary dividend per share paid 50 24
1 Dilutedearningspersharereflectsthepotentialvestingofsharebasedpayments2 Dilutedearningspersharereflectsthepotentialconversionofconvertibledebtupuntilthedateofpurchaseandcancellationoftheconvertibledebtandthepotentialvestingofsharebasedpayments
Financial CalendarPreliminary announcement 27 February 2020
Dividend record date 14 April 2020
Annual General Meeting 8 May 2020
Dividend payment date 15 May 2020

Our PurposeOur customers and our
community are at the heart of who we are and
what we do
FBD Holdings plc Annual Report 2019 3Strategic Report
Governance
Financial Statements
Other Inform
ation
FBD’s purpose is to support, protect and stand with Ireland’s families, farms and businesses to enable our customers to grow and thrive in a vibrant society and economy.
Our Purpose
We are proud of our roots in farming and of our Irish heritage. We are proud of our expertise and appreciate the trust of our loyal customers. We take pride in being part of the communities we serve. We look forward to supporting families and family businesses for generations in the same way we have supported Ireland’s farmers.
To support our customers we must first look after ourselves and each other.
This excites our people, because we are a team that wants to succeed. We are a team that evolves and grows. We are continually developing.
We are also in the service of others: each other, our customers and society. We believe our work is worthwhile work that is worth doing. Our products help our customers to prosper.
Our Mission
Respect | Belief | Innovation | Comm
unity | Ownership | Communication
To be the Irish Insurer of choice
Families |
Busin
esse
s | F
arm
s
Our Values
Our Cust
omer
s
We will carefully grow our business, building the FBD brand and securing FBD’s future.

Taking pride in our Irish roots and investing in our communitiesLAIM HERLIHY | Chairman
4
PerformanceI am pleased to present our excellent financial results for 2019 and in particular I am very pleased to propose a substantial dividend payment to our shareholders. We have reported a Group Profit before Tax of €112m and our Net Asset Value (book value) per share grew to 1,068 cent. Our Solvency Capital Ratio continues to be very strong at 192%. FBD is today in a very strong financial position.
2019 has seen a continuation of excellent financial results for our business. Despite competitive headwinds in some areas, our strategy and our discipline continue to deliver positive results for FBD.
I am very grateful for all we have accomplished and specifically, I want to thank all of our loyal FBD staff, in Bluebell and in our branches up and down the country, for their contribution to our success. Their dedication to our customers and to great customer service continues to be a key differentiator for FBD. The commitment shown across the Group in delivering for the business, while outperforming on expectations, has been nothing short of remarkable.
Chairman’s Statement
GROUP PROFIT BEFORE TAX
€112m
NET ASSET VALUE PER SHARE
1,068c
PER SHARE DIVIDEND PROPOSED
100c

FBD Holdings plc Annual Report 2019 5Strategic Report
Governance
Financial Statements
Other Inform
ation
Board of DirectorsI am delighted to welcome the two new Independent Non-Executive Directors who joined our Board in 2019. Richard Pike and Sylvia Cronin bring a wealth of business experience to FBD and I am sure they will make a very valuable contribution over the coming years.
Fiona Muldoon, Chief Executive Officer, has informed the Board that she will leave her position as Executive Director and CEO during 2020. Fiona has been CEO since August 2015 having joined FBD as Executive Director and Chief Financial Officer in January 2015. Fiona has transformed the commercial fortunes of FBD over the past five years. Her relentless focus on the business and its customers has been remarkable. The shareholders and the community we serve have benefitted from her tireless efforts.
The appointment of a successor CEO is actively underway. The process is now at an advanced stage and we hope to be in a position to comment further on this important appointment soon.
Team Ireland SponsorshipFBD’s Team Ireland sponsorship was ramped up in 2019 and is a big investment as we enter Olympic Year 2020 and start to focus on the main event in Tokyo next summer. This sponsorship will encompass all of the Olympic Federation of Ireland’s activity, both in Ireland and internationally. This partnership is very exciting for both FBD Insurance and the Olympic Federation of Ireland and shows our continued commitment to supporting and protecting all of the communities from which Ireland’s Olympic heroes emerge.
Local communities are the foundations of support that enable our Irish athletes to compete on the world stage. At FBD, we have a unique connection with our local communities through our nationwide branches and our direct customer relationships. As a truly local Irish insurer we are proud to partner with Team Ireland on what is sure to be an exciting journey for Ireland’s talented athletes, their coaches, their families and their communities as they progress to the biggest sporting stage of all in 2020, the Tokyo Olympic Games.
This major sponsorship in its third year will peak when the Games are held in summer 2020. It sits in the portfolio of our other national sponsorships including the National Ploughing Championships. As part of our strategy to continue to protect and grow our rural customer base as well as to enable continued growth in urban Ireland, this sponsorship of Team Ireland will provide a nationwide
platform for FBD. It highlights both our local pride and our commitment to communities across Ireland.
InnovationInnovation is key for FBD and we had many new ideas successfully brought to life in 2019. Our Farm Uplift product contains quite a few ‘firsts’ for farmers; including increasing Public Liability limits and offering Environmental (pollution) Liability cover as standard. There was also our new Small Business product, the improvements in Motor pricing on renewal, a low mileage Motor product, our Friends and Family discount scheme and Claims Fraud propensity modelling. Our newest innovation is only live since November and it improves the digital car insurance journey by allowing the customer sign the proposal documents there and then and to upload their No-claims cert using their phone camera. I am proud that FBD continues to be market leading for its customers and we will keep this going for 2020 and beyond.
Investing in our Irish roots and communitiesFBD is committed to working with and supporting local communities. For over 50 years FBD has been committed to ensuring farms, businesses and wider communities feel real economic and social benefits as a result of our business activities. FBD is a responsible member of the community. We set high standards for ourselves and insist that all of our business activities are conducted lawfully and ethically.
In supporting Irish communities, FBD displays commitment to partnerships with local communities. We also provide insurance cover to sectors which are crucial to the economic and social fabric of the many communities we serve, particularly in rural Ireland.
Farming is a unique way of life with many positive aspects to it. However, by its nature, it is also a hazardous occupation. The high number of farm accidents annually is cause for great concern to us. FBD supports many initiatives which make the farm a safer place for all. In addition we have dedicated employees who work directly with farms and businesses to help improve safety standards and safety awareness in the workplace.

6
As an organisation that works to protect and safeguard our customers’ future, we are also working to improve our sustainable business practices. FBD actively measures, manages and mitigates our carbon footprint and aims to minimise our environmental impact. Adapting smarter business practices has a powerful role to play in our business and it is something our whole organisation plays a part in. Company-wide initiatives raise awareness amongst employees on how simple, effective and relevant activities can contribute to a healthier planet. Our sustainability projects include a commitment to using less paper, printing less and being more efficient in our energy usage.
Claims EnvironmentFBD welcomes the progress made in improving the claims environment such as the establishment of a Personal Injuries Guidelines Committee charged with providing guidelines on soft tissue injuries. We await the findings of this Committee in the belief that it has the potential to drive real change from the judiciary. It is also welcome that courts are showing an increased willingness to recognise that individuals have some responsibility for their own personal safety. In the meantime the level of compensation remains too high and without reform Irish farmers, businesses and consumers will continue to bear the cost of significantly higher premiums than those seen in other countries.
DividendThe Board believes that it is in the long-term interest of all stakeholders to maintain a strong solvency margin and it is focussed on ensuring that the Group’s capital position is robust and its financial position well managed.
Following the excellent financial performance for 2019 the Board proposes to pay a dividend of 100 cent per share for the 2019 financial year. This is equivalent to a pay-out ratio of approximately 35% in respect of 2019 profits. This represents a significant increase on the 50 cents (40%) paid in 2018 as our profits are significantly higher. It reflects our continuing confidence in the profitability and future prospects of the business. The Group continues to target a 20% to 50% annual pay-out range of full year profits when appropriate, recognising extreme weather events and inherent cyclicality are features of all insurance businesses.
This conservative Dividend Policy is designed to recognise the importance of full year earnings in determining dividends while protecting the capital position of the Group.
ConclusionI would like to thank the Board for their continued support and hard work throughout the year. In an uncertain world, I am confident that whatever challenges lie ahead, FBD is strong and will continue to prosper as a business.
Finally, as always, thanks to our customers for their continuing support, loyalty, trust and confidence. Because of them, FBD is strongly positioned for the future.
With Best Regards.
Liam Herlihy Chairman
26 February 2020
Chairman’s Statement (continued)

2019 in Pictures
FBD Holdings plc Annual Report 2019 7Strategic Report
Governance
Financial Statements
Other Inform
ationStrategic Report
Governance
Financial Statements
Other Inform
ation
O’Donovan brothers visit to Scoil Bhríde, Dunleer
2019 National Ploughing Championships FBD sponsored gold medal winning garden at Bloom
Macra 75th Dinner Celebrations
Tullamore Show
Tadhg Furlong & Fiona Muldoon pictured at the announcement of FBD’s sponsorship of New Ross Rugby Club
O’Donovan brothers visit to Scoil Bhríde, Dunleer
Interview with Kellie Harrington from the FBD stand at Bloom
Launch of FBD sponsorship of Tipperary County Championship
Presentation to the winner of the Holiday Competition at Bloom
8
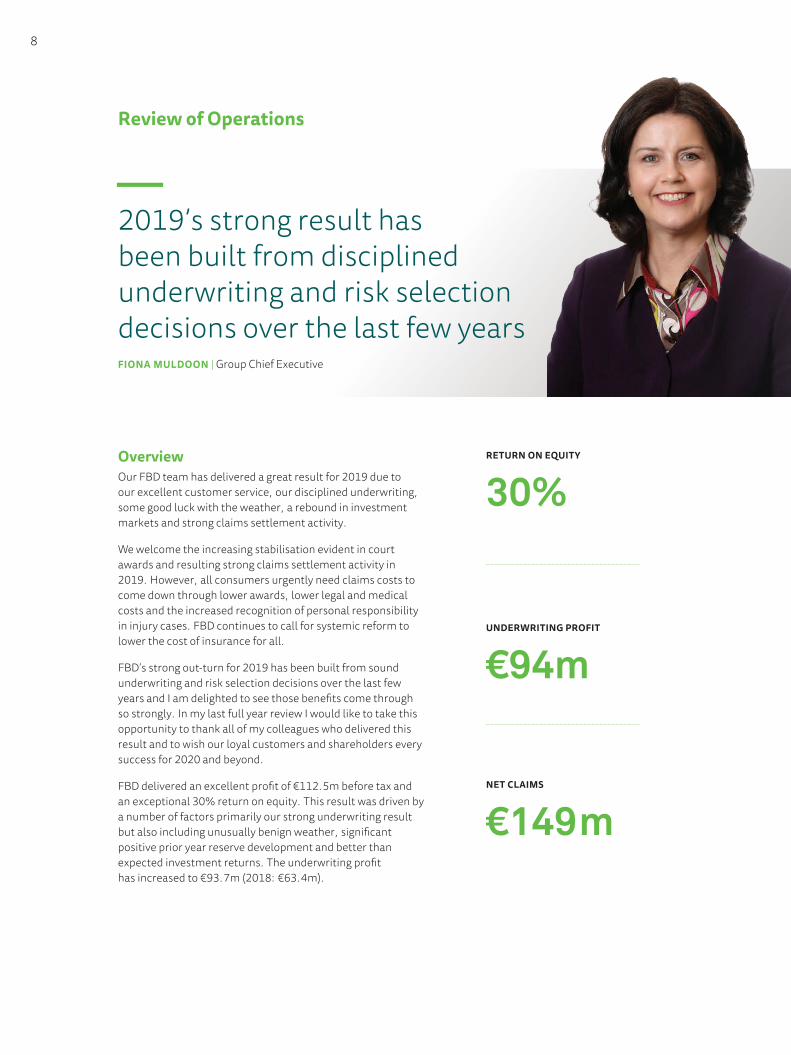
Review of Operations
OverviewOur FBD team has delivered a great result for 2019 due to our excellent customer service, our disciplined underwriting, some good luck with the weather, a rebound in investment markets and strong claims settlement activity.
We welcome the increasing stabilisation evident in court awards and resulting strong claims settlement activity in 2019. However, all consumers urgently need claims costs to come down through lower awards, lower legal and medical costs and the increased recognition of personal responsibility in injury cases. FBD continues to call for systemic reform to lower the cost of insurance for all.
FBD’s strong out-turn for 2019 has been built from sound underwriting and risk selection decisions over the last few years and I am delighted to see those benefits come through so strongly. In my last full year review I would like to take this opportunity to thank all of my colleagues who delivered this result and to wish our loyal customers and shareholders every success for 2020 and beyond.
FBD delivered an excellent profit of €112.5m before tax and an exceptional 30% return on equity. This result was driven by a number of factors primarily our strong underwriting result but also including unusually benign weather, significant positive prior year reserve development and better than expected investment returns. The underwriting profit has increased to €93.7m (2018: €63.4m).
2019’s strong result has been built from disciplined underwriting and risk selection decisions over the last few yearsFIONA MULDOON | Group Chief Executive
RETURN ON EQUITY
30%
UNDERWRITING PROFIT
€94m
NET CLAIMS
€149m

FBD Holdings plc Annual Report 2019 9Strategic Report
Governance
Financial Statements
Other Inform
ation
UnderwritingPremium incomeStrong competition in all customer segments has resulted in a decrease in Gross Premium Written of €1.4m to €370.1m (2018: €371.5m). Increases in SME Business and the introduction of the An Post partnership were offset by reductions in Agri and Consumer as we reduced prices in the face of strong competition to defend our book. We continued to maintain our underwriting discipline on risk selection and price adequacy. We believe that our strong customer relationships, risk selection and underwriting capabilities are a core strength. New business volumes grew by 13%, primarily in personal lines. Retention rates are generally satisfactory across the book thanks to our excellent customer service.
Average premiums reduced by 2.2% across the book. Average Motor premiums reduced by 4.2% and Farm reduced by 2.5%, despite increases in exposures following the improvements in our Multi-Peril product with increased cover for Public Liability and Environmental (pollution) Liability. Business premiums increased by 1.8%, primarily due to changes in mix as opposed to rate increases.
ReinsuranceOur underwriting track record over the past few years supported the successful renegotiation of our 2019 reinsurance programme at satisfactory rates.
ClaimsNet claims incurred amounted to €148.7m (2018: €183.4m). There were positive prior year reserve releases of €40.1m as our claims experience from older years continued to show improvements relative to provisions (2018: €28.7m). These releases have been driven primarily by better than expected settlements and a very low large claims frequency in some recent accident years. In particular our latest view of the 2016 accident year continues to be better than previous expectations.
The Group incurred a net charge of €8.0m (2018: €7.1m) relating to the MIBI levy and its MIICF contribution which are calculated based on the Group’s expected share of the motor market for 2019 and its motor gross premium written respectively.
Claims EnvironmentWe welcome the increased stabilisation in the Irish claims environment, in particular:
n An increased willingness to recognise that plaintiffs have some degree of responsibility for their own personal safety, building on the decision in Byrne v Ardenheath (2017). This should assist businesses who are being held to unreasonably high standards in personal injury cases. In addition, in the event a plaintiff succeeds in proving a breach of statutory duty on the part of the defendant, a causal link must be shown before damages will be awarded (McCarthy v Twomey (2019)).
n The PIAB (Amendment) Act was enacted in April to address the non-co-operation of claimants including failure to attend medical examinations and failure to cooperate with experts. Claimants can now incur penalties in respect of legal costs but only at the judge’s discretion.
n The Civil Liability & Courts Act has been amended to reduce the timeframe of notification of a claim to a defendant from two months to one.
n Legislation was passed to establish the Judicial Council and the Personal Injuries Guidelines Committee. The Judicial Council was formally established in February 2020 and the Committee is to follow. We await the findings of the Committee to see if there is to be real change in award levels.
Currently the level of compensation is too high for soft tissue injuries in Irish courts and the negligence standards imposed by courts for farmers and small businesses remain too onerous. The Personal Injuries Commission found that the average soft tissue award in Ireland is more than 4 times that in the UK. We believe important reforms would lower insurance costs for all our customers:
n lower injury awards through the work of the Judicial Council Personal Injury Commission;
n speed up litigation and reduce legal costs;
n create a pre-action protocol to fast-track rejected Injuries Board awards;
n make gross exaggeration an offence;
n establish and resource a Garda fraud investigation unit.
In addition, there are remaining issues outstanding that may further increase the cost of claims such as:
n the Consumer Insurance Contracts Act, while introducing reforms for consumers that are generally welcome but has the potential to increase costs and create upward pressure on pricing;

n Brexit implications on our supply chain may lead to increased costs for motor and property damage repair claims;
n further increases in Property repair costs due to demand and labour supply shortages.
While award stability is welcome after many years of uncertainty, in the absence of real reform of the claims environment, Irish businesses, farmers and consumers will continue to bear too-high insurance costs and volatile underwriting capacity in the market caused by withdrawal of foreign competitors and niche operators.
Weather, Claims Frequency and Large ClaimsAn unusually benign 2019 resulted in no weather events of note and the lowest quantum of weather claims in many years.
There was a modest reduction in Motor injury frequency during 2019 with the benign weather a contributing factor. We are closely monitoring Employer’s Liability claims frequency which was running at a three year high in the middle of 2019 but is showing more positive trends in the second half of the year. It is likely that it is a result of increased economic activity.
The number of large Casualty claims greater than €250k reported in 2019 is slightly higher than the average number reported in the previous 7 years. The number and size of large claims can vary greatly from year to year.
ExpensesThe Group’s expense ratio was 25.9% (2018: 24.9%). Other underwriting expenses were €87.3m, an increase of €3.2m. The increase is explained by €1.2m more in commission payments in respect of our intermediary partner, €1.2m in increased salary costs and a €1m increase in marketing costs offset by modest reductions elsewhere.
GeneralFBD generated an underwriting profit of €93.7m (2018: €63.4m) which translates to a COR of 72.3% (2018: 81.2%).
Investment ReturnFBD’s total investment return for 2019 was 2.7% (2018: -0.5%). 1.7% (2018: 0.2%) is recognised in the Consolidated Income Statement and 1.0% (2018: -0.7%) recognised in the Consolidated Statement of Other Comprehensive Income (OCI). The strong returns are a result of investment gains across all asset classes.
The Income Statement return reflects the strong performance of the Group’s risk asset portfolio, in particular equities. FBD’s global equity fund was up 24% during the year as this asset class performed strongly with the easing of geo-political tensions and challenging low interest environment. Falling interest rates and an easing of monetary policy in the Eurozone resulted in a strong positive Mark to Market return on FBD’s sovereign and corporate bond portfolios and this is reflected in OCI.
Financial Services Income and Other CostsThe Group’s financial services operations delivered a profit before tax of €3.7m for the year (2018; €2.5m). The life, pension and investment broking operation (FBD Financial Solutions) increased revenue by 12% to €4.3m (2018: €3.8m) with marginal cost increases. Other financial services fees increased by 5%. Holding company costs decreased from €3.5m to €2.9m mainly due to lower legal expenses.
Profit per shareThe diluted profit per share was 276 cent per ordinary share, compared to 112 cent per ordinary share in 2018.
Statement Of Financial PositionCapital positionOrdinary shareholders’ funds at 31 December 2019 amounted to €372.2m (2018: €283.5m). The increase in shareholders’ funds is mainly attributable to the following:
n profit after tax for the year of €98.2m;
n Mark to Market movement on our Bond portfolio of €9.6m after tax in the Statement of Other Comprehensive Income;
n share based payments of €2.4m;
n offset by €17.7m dividend payments in respect of the 2018 financial year; and
n the decrease in the defined benefit pension scheme surplus of €3.7m after tax following a 90bps decrease in the discount rate to 0.9% and drop in long-term inflation to 1.3%.
Net assets per ordinary share are 1,068 cent, compared to 818 cent per share at 31 December 2018.
10
Review of Operations (continued)

FBD Holdings plc Annual Report 2019 11Strategic Report
Governance
Financial Statements
Other Inform
ation
The allocation of the Group’s investment assets is as follows:
31 December 2019 31 December 2018
€m % €m %
Corporate bonds 509 46% 498 47%
Government bonds 302 27% 297 28%
Deposits and cash 168 15% 157 15%
Other risk assets 111 10% 79 8%
Investment property 19 2% 18 2%
1,109 100% 1,049 100%
Investment AllocationThe Group adopts a conservative investment strategy to ensure that its technical reserves are matched by cash and fixed interest securities of low risk and similar duration. FBD allocated an additional €22m to our Risk Assets portfolio during 2019 to move closer to the Group’s target Strategic Asset Allocation.
SolvencyThe latest (unaudited) Solvency Capital Ratio (SCR) is 192% compared to the 2018 SCR of 165%. The SCR includes the foreseeable ordinary dividend of €34.9m. For the first time the SCR calculation excludes a substantial portion of the value of the Group’s TIA policy administration system.
The TIA system is the principal operating and core technology platform of the business. The impact of this change in the SCR calculation is a reduction of eight percentage points. There is no impact on the Group’s IFRS financial statements.
OutlookOur mission is to be the Irish insurer of choice by putting our customers and communities at the heart of who we are and what we do. We believe this approach delivers sustainable returns to shareholders and ensures the ongoing profitability of FBD.
We welcome the strong stance taken by the judiciary towards fraudulent and exaggerated claims, the increasing stabilisation of award levels and some recognition of increased personal responsibility in court awards. In non-co-operation cases judges may now issue penalties. Claims may be dismissed if a claimant’s affidavit is false or misleading. FBD contests all suspect claims and we advocate for penalties for false or exaggerated claims in order to deter these claimants. However, progress in reducing injury awards remains the key driver in reducing future costs for all our customers.
We are operating in a very competitive market. All business, new and existing is fiercely competed. We believe underwriting and pricing discipline is key to our future success.
We have successfully renegotiated our 2020 reinsurance programme at satisfactory rates. The structure of our programme is largely unchanged from 2019.
We are preparing to limit the operational impacts on our supply chain following Brexit. However the impact on our customers; the consumers, farms and businesses around the country, is still very uncertain. We will continue to monitor this economic impact and to advocate for sensible solutions as the situation evolves.
FBD is strongly positioned for the future.

12
Proud sponsors of Team Ireland for the Tokyo 2020 OlympicsFBD’s Team Ireland sponsorship will give us a nationwide platform. It highlights both our local pride and our commitment to communities all over Ireland.

FBD Holdings plc Annual Report 2019 13Strategic Report
Governance
Financial Statements
Other Inform
ation
Kellie Harrington Boxing
“Boxing is all about respect – respect for your own team,
respect for your opponent and respecting the hard work
and dedication needed to make it.”

Our Business Model
How we create and share value
Inputs How it Works
FBD empowers its people to deliver for customers and shareholders alike.
Our PeopleThe expertise, experience and local knowledge of our 900 employees provides our customers with tailored service based on in-depth awareness of their requirements.
Social & RelationshipsFBD is a responsible member of local communities throughout Ireland and works hard to provide significant support to farm, business and community groups.
FinancialFBD seeks to maintain a resilient and stable balance sheet that is well reserved with a low-risk investment portfolio.
IntellectualFounded by farmers for farmers, FBD has an unrivalled knowledge of farm enterprises through 50 years of protection and close relationships with farming organisations. Today FBD has expertise in three key customer segments: Farm, SME and Consumer.
NaturalFBD’s reinsurance program reduces our exposure to adverse weather while maximising the protection that we offer our communities.
TechnologyFBD has evolved with changing customer needs for over 50 years. FBD will continue to change and adapt to offer unrivalled service and protection in the digital era.
14
Business Activities/Create ValueFBD creates value through our customer centric focus and our expertise in three main customer segments: Farm, SME and Consumer.
OutputsFBD offers products that meet the customer where they wish to shop, where we can deliver a better service proposition and an underwriting advantage.
OutcomesFBD strives to deliver for all stakeholders. We support and develop our employees. We protect and support our customers through our quality products and services. We deliver strong returns to our shareholders.

As Ireland’s home grown Insurer, our customers and our communities are at the heart of who we are and what we do. We offer clear solutions to customer’s insurance needs through our 34 local branches nationwide, on the phone, online or through our broker network.
FBD Holdings plc Annual Report 2019 15Strategic Report
Governance
Financial Statements
Other Inform
ation
Our ProductsFBD protects our customers through our range of farm, SME and consumer products.
Our ChannelsFBD offers great service through our 34 branches, on the phone or digitally. We also deliver through our broker network, and our partnerships. We meet the customer where they choose to shop.
Financial Advisory ServicesFBD Life & Pensions provides advice to personal and corporate customers, through our team of financial planning advisors in our 34 branch network.
Customer Centric FocusThrough our 34 offices located across the country, we are never far away and always ready to protect our customers.
Underwriting Risk selectionAt FBD we understand the Irish farm, SME and consumer customer. We measure and model risk effectively which enables us to price accurately, competitively and fairly.
Manage ClaimsFBD maintains it’s customer centric focus throughout the customer journey. We are focused on paying honest claims quickly and efficiently.
Reserve AppropriatelyFBD has a prudent approach to reserving; supported by strong governance including extensive peer reviews and regular external reviews.
Capital ManagementFBD follows a conservative investment policy. We manage our assets and claims liabilities to ensure we meet our obligations to our policyholders.
Our StakeholdersWe protect our customers by delivering products that meet their needs. We deliver sustainable returns for our shareholders primarily through growth in book value.
Our EmployeesWe invest in our people, helping them grow their skills and expertise so that they excel in their careers. We provide market competitive rewards and benefits linked to individual and Group performance.
Local CommunitiesWe invest in the communities in which we operate through corporate sponsorship (Corporate Social Responsibility on pages 26 to 32) and by partnering with charities, trusts and local events.
ReinvestmentThrough our profit generation we reinvest in our people, property and technology to continue to generate value for FBD.

16
Our Strategy
Our mission is to be the Irish insurer of choice. We aim to be truly customer centric; delivering the best customer experience, no matter the way the customer chooses to shop with us.
Our customers and our community
are at the heart of who we are and
what we do
Innovate for
Protect the customer in all that we do
Evolving with
Growing with
Protect the customer in all that they do
Value for money
Make it easy

FBD Holdings plc Annual Report 2019 17Strategic Report
Governance
Financial Statements
Other Inform
ation
Our Vision Be truly customer centric
Delivering the best customer experience, no matter the way the customer chooses to shop with us.
Our Mission To be the Irish insurer of choice
Our customers and communities are at the heart of who we are and
what we do.
Our ValuesRespect
BeliefInnovation
CommunityOwnership
Communication
Maintain underwriting discipline, continue to improve risk selection and develop opportunities to safely grow our footprint
Our strategy for 2020 is to continue growing our capabilities in Commercial and Consumer coupled with relentless focus on our premier position in Farm
Deliver customer centred products and service
2019 is an excellent underwriting result for FBD
18
OverviewRisk taking is inherent in the provision of financial services and FBD assumes a variety of risks in undertaking its business activities. FBD defines risk as any event that could impact the core earnings capacity of the Group; increase earnings or cash-flow volatility; reduce capital; threaten business reputation or viability; and/or breach regulatory or legal obligations.
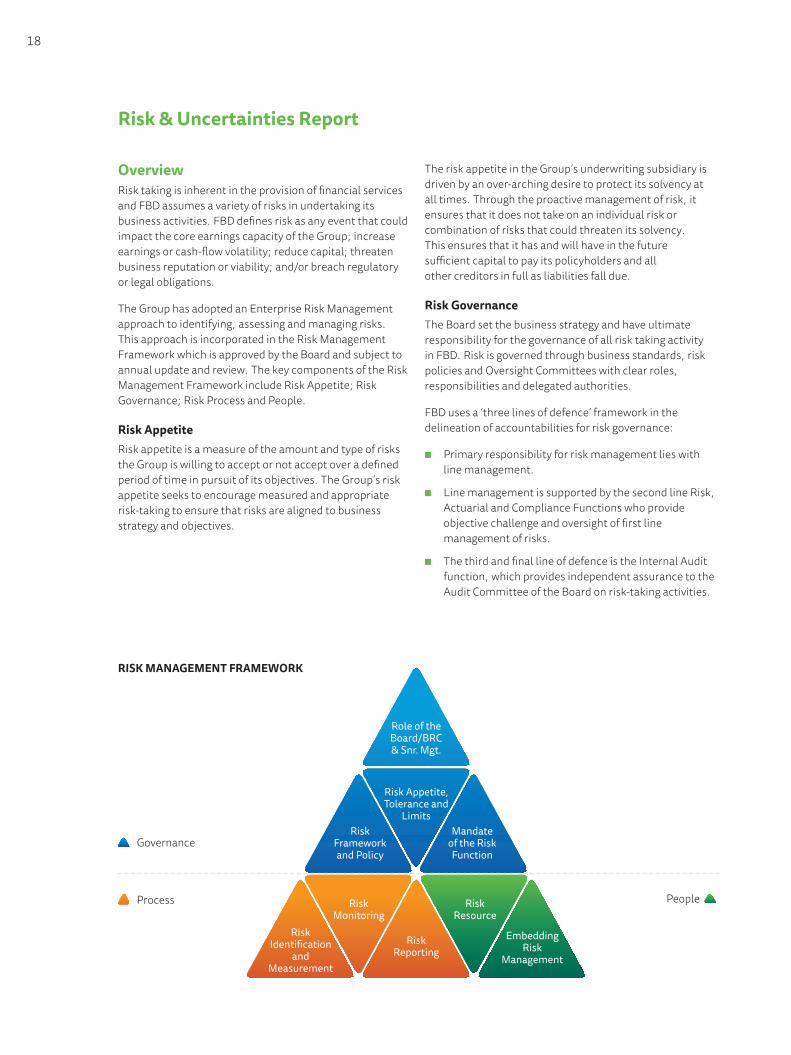
The Group has adopted an Enterprise Risk Management approach to identifying, assessing and managing risks. This approach is incorporated in the Risk Management Framework which is approved by the Board and subject to annual update and review. The key components of the Risk Management Framework include Risk Appetite; Risk Governance; Risk Process and People.
Risk Appetite Risk appetite is a measure of the amount and type of risks the Group is willing to accept or not accept over a defined period of time in pursuit of its objectives. The Group’s risk appetite seeks to encourage measured and appropriate risk-taking to ensure that risks are aligned to business strategy and objectives.
The risk appetite in the Group’s underwriting subsidiary is driven by an over-arching desire to protect its solvency at all times. Through the proactive management of risk, it ensures that it does not take on an individual risk or combination of risks that could threaten its solvency. This ensures that it has and will have in the future sufficient capital to pay its policyholders and all other creditors in full as liabilities fall due.
Risk Governance The Board set the business strategy and have ultimate responsibility for the governance of all risk taking activity in FBD. Risk is governed through business standards, risk policies and Oversight Committees with clear roles, responsibilities and delegated authorities.
FBD uses a ‘three lines of defence’ framework in the delineation of accountabilities for risk governance:
n Primary responsibility for risk management lies with line management.
n Line management is supported by the second line Risk, Actuarial and Compliance Functions who provide objective challenge and oversight of first line management of risks.
n The third and final line of defence is the Internal Audit function, which provides independent assurance to the Audit Committee of the Board on risk-taking activities.
Risk & Uncertainties Report
Role of the Board/BRC & Snr. Mgt.
Risk Appetite, Tolerance and
Limits
Risk Reporting
Embedding Risk
Management
Risk Identification
and Measurement
Risk Framework and Policy
Risk Monitoring
Risk Resource
Mandate of the Risk Function
Governance
Process People
RISK MANAGEMENT FRAMEWORK

FBD Holdings plc Annual Report 2019 19Strategic Report
Governance
Financial Statements
Other Inform
ation
Risk Process
Identify and MeasureRisk, including emerging risks, is identified and assessed through a combination of top-down and bottom-up risk assessment processes. Top-down processes focus on broad risk types and common risk drivers rather than specific individual risk events, and adopt a forward-looking view of perceived threats over the planning horizon. Bottom-up risk assessment processes are more granular, focusing on risk events that have been identified through specific qualitative or quantitative measurement tools. Top-down and bottom-up views of risk come together through a process of upward reporting of, and management response to, identified and emerging risks. This ensures that the view of risk remains sensitive to emerging trends and common themes. FBD measures risk on the basis of economic capital and other bases (where appropriate) to determine materiality, potential impact and appropriate management. Risks are recorded on the Group Risk Register.
Monitor and ReportWe regularly monitor our risk exposures against risk appetite, risk tolerances and limits and monitor the effectiveness of controls in place to manage risk. Reporting to the Risk Committees is dynamic and includes material risks, emerging risks, risk appetite monitoring, changes in risk profile, risk mitigation programmes, reportable errors, breaches of risk policies (if any), results of independent assessments performed by the Risk Function.
PeopleRisk Management is embedded in the Group through leadership, governance, decision making and competency. The Risk Management Framework establishes the roles and responsibilities of risk resources. A risk training programme is in place to ensure all risk resources have the knowledge and competency to perform their roles effectively.
In accordance with Group policy, business unit management has primary responsibility for the effective identification, management, monitoring and reporting of risks. There is an annual review by the Risk Committee of all major risks and emerging risks, to ensure all risks are identified and evaluated. Each risk is assessed by considering the potential impact and the probability of the event occurring. Impact assessments are made against financial, operational, regulatory, reputational and customer impact criteria.

20
Risk & Uncertainties Report (continued)
Key Risks and MitigantsThe Board reviews all key risk policies and governance structures, at least annually. This includes the Risk Management Framework; internal control systems; outcomes of Risk and Audit reviews. Key risks were reviewed regularly by the Board and Risk Committees. Some of these Risks, together with key controls and mitigants are outlined below. Emerging risks are captured via a variety of channels and get reported to and challenged/discussed at Board meetings. Escalation parameters for key risks that are outside of tolerance/appetite and a ‘three lines of defence’ system, complemented with external reviews are in place. The Board is satisfied that FBD maintains a robust and effective risk management framework.
RISK KEY MITIGANTS
Capital Management RiskThe risk that the Group fails to maintain an adequate regulatory solvency position.
n The Group has an Investment Committee, a Pricing & Underwriting Committee, a Capital Management Forum, an Audit Committee, a Reserving Committee and Board and Executive Risk Committees, all of which assist the Board in the identification and management of exposures and capital.
n The annual Own Risk and Solvency Assessment ‘ORSA’ provides a comprehensive view and understanding of the risks to which the Group is exposed or could face in the future and how they translate into capital needs or alternatively require mitigation actions.
n An experienced Actuarial team is in place with policies and procedures to ensure that Technical Provisions are calculated in an appropriate manner and represent a best estimate.
n Technical Provisions are internally peer reviewed every quarter, audited once a year and subject to external peer review every two years.
n An approved reinsurance programme is in place to minimise the Solvency Impact of Catastrophe events to the Group.
n The Chief Financial Officer (CFO) is responsible for consideration of the implications for capital position as part of the strategic planning process and key strategic decision-making and for ensuring appropriate action is taken as approved by the Board/CEO/relevant committee.
n On at least an annual basis, thresholds for Solvency Capital Requirements (SCR) Ratio, developed as part of the annual planning/budgeting process, are approved by the Board as part of the Risk Appetite Statements in the Risk Appetite Framework.
n The Group also devotes considerable resources to managing its relationships with the providers of capital within the capital markets, for example, existing and potential shareholders, financial institutions, stockbrokers and corporate finance houses.

FBD Holdings plc Annual Report 2019 21Strategic Report
Governance
Financial Statements
Other Inform
ation
RISK KEY MITIGANTS
Underwriting RiskThis is the risk that underwritten business is less profitable than planned due to insufficient pricing and setting of claims case reserves as a result of higher than expected claims frequency, higher average cost per claim and catastrophic claims.
The Group manages this risk through its underwriting strategy, proactive claims handling and its reinsurance arrangements.
Underwriting Strategyn The Group’s underwriting strategy is incorporated in the overall
corporate strategy which is approved by the Board of Directors and includes the employment of appropriately qualified underwriting personnel; the targeting of certain types of business that conform with the Group’s risk appetite and reinsurance treaties; constant review of the Group’s Pricing Policy using up-to-date statistical analysis and claims experience; and the surveying of risks carried out by experienced personnel. All risks underwritten are within the Group’s underwriting policies.
n The Group has developed its insurance underwriting strategy to diversify the type of insurance risks written and, within each of the types of cover, to achieve a sufficiently large population of risks to reduce the variability of the expected outcome. The principal insurance cover provided by the Group include, Motor, Employers’ and Public Liability and Property.
n The only significant concentration of insurance risk is that all of the Group’s underwriting business is conducted in Ireland. Within Ireland there is no significant concentration risk in any one area.
Reserving:n The Group uses statistical and actuarial methods to calculate
the quantum of claims provisions and uses independent actuaries to review its liabilities to ensure that the carrying amount of the liabilities is adequate. The provision includes a margin for uncertainty to minimise the risk that actual claims exceed the amount provided. The Reserving Committee assists the Board in its review of the adequacy of the Group’s claims provisions.
n Case reserve estimates are subject to robust controls including system controls preventing claim handlers from increasing reserves above their reserve limits without supervisor approval and secondary review and challenge of case reserve estimates
Reinsurance Arrangementsn The Group purchases reinsurance protection to limit its exposure
to single claims and the aggregation of claims from catastrophic events. The Group’s reinsurance programme is approved by the Board of Directors on an annual basis. FBD has purchased a reinsurance programme which has been developed to meet the local domestic risk profile and tailored to FBD’s risk appetite. The programme protects, Motor, Liability, Property and other classes against both individual large losses and events.

22
Risk & Uncertainties Report (continued)
RISK KEY MITIGANTS
Market Risk The Group has invested in term deposits, listed debt securities, investment property and Collective Investment Schemes. These investments are subject to market risk, whereby the value of the investments may fluctuate as a result of changes in market prices, changes in market interest rates or changes in the foreign exchange rates of the currency in which the investments are denominated.
n The extent of the exposure to market risk is managed by the formulation of, and adherence to, an Investment Policy incorporating clearly defined investment limits and rules, as approved annually by the Board of Directors and employment of appropriately qualified and experienced personnel and external investment management specialists to manage the Group’s investment portfolio. The overriding philosophy of the Investment Policy is to protect and safeguard the Group’s assets and to ensure its capacity to underwrite is not put at risk.
n The Group will only invest in assets the risks of which can be properly identified, measured, monitored, managed and controlled. In this regard the approach adopted by the Group is to ensure funds are allocated primarily in euro denominated Corporate/Government bonds and deposits.
n The Group monitors its allocation to the various asset classes and has a long term Strategic Asset Allocation target.
Credit & Concentration RiskThis is the risk of loss in the value of financial assets due to counterparties failing to meet all or part of their obligations and/or over allocation to a single entity that may default or fall in value resulting in adverse financial impact.
n Credit and concentration risk is managed by the formulation of, and adherence to, an Investment Policy that is approved annually by the Board of Directors. The Investment Policy incorporates clearly defined investment limits and rules and ensures that there is an optimum spread and duration of investments.
n The Group only places reinsurance with companies that it believes are strong financially and operationally. Credit exposures to these companies are closely monitored by senior management. All of the Group’s current reinsurers have either a credit rating of A- or better. The reinsurance programme structure ensures that there is no significant concentration of risk.
n All of the Group’s fixed term deposits are with financial institutions which have a minimum A- rating.
Liquidity RiskThis is the risk of insufficient liquidity to pay claims and other liabilities due to inappropriate monitoring and management of liquidity levels or inadequate Asset Liability Management.
n The Group manages liquidity risk by continuously monitoring forecast and actual cash flows and ensuring that the maturity profile of its financial assets is shorter than or equal to the maturity profile of its liabilities and maintaining a minimum amount available on term deposit at all times.

FBD Holdings plc Annual Report 2019 23Strategic Report
Governance
Financial Statements
Other Inform
ation
RISK KEY MITIGANTS
Strategy RiskThe risk that the strategy adopted by the Board is incorrect or not implemented appropriately resulting in sub-optimal performance and impact on profitability.
n The Group has a strategic planning cycle which commences with a fundamental review of strategy at least every 5 years (normally every 3 years). Further supporting this is an annual review of the strategy by the Board to determine the continuing relevance. To ensure the strategy is implemented effectively, the Group engages in a robust business planning and review process that results in an annual plan including key initiatives and budget.
Operational RiskOperational risk could arise as a result of inadequately controlled internal processes or systems, human error or from external events.
This definition is intended to include all risks to which the Group is exposed and that are not considered elsewhere. Hence, operational risks include for example, information technology, information security, human resources, project management, outsourcing, taxation, legal, fraud and regulatory risks.
Three Lines of Defencen Extensive second and third line challenge over the operational
control environment.
Information Technology Controlsn Sound information technology controls are in place across
the Group, including a dedicated IT security team with overall responsibility for managing information technology security standards, which together with on-going employee training and regular cyber-risk reviews are used to mitigate such information technology risks.
Business Continuity Plansn The Group has taken significant steps to minimise the impact
of business interruption that could result from a major external event. A formal disaster recovery plan is in place for both workspace recovery and retrieval of communications, IT systems and data. If a major event occurs, these procedures will enable the Group to move the affected operations to alternative facilities within very short periods of time. The disaster recovery plan is tested regularly and includes disaster simulation tests.
Personneln The Group is dependent upon the quality, ability and commitment
of key personnel in order to sustain, develop and grow its business. There can be no assurance that the Group will be able to retain all of its key employees. The success of the Group will depend upon its ability to retain, attract, motivate and develop key personnel.

24
Risk & Uncertainties Report (continued)
RISK KEY MITIGANTS
Reputational Risk The risk of reputational or brand damage arising from inadequate or failed processes and systems or badly executed strategy/poorly executed communication.
n The Group’s Board and senior management set the ethical and behavioural tone for the Group. In support of this a number of Group policies are utilised which influence employee behaviour, including a Reputational Risk Policy, Fitness & Probity Policy, an Anti-Fraud Policy, Code of Conduct Policy, Conflicts of Interest Policy and a Speak Up Policy.
n The Group has established a Corporate Governance Framework which is in full compliance with the requirements of the Central Bank of Ireland’s Corporate Governance Requirements for Insurance Undertakings and the UK Corporate Governance Code.
n Reputation risk assessments are performed for all business arrangements with material reputation risk and reassessed throughout the life of the relationship.
n Independent customer satisfaction research is undertaken and customer complaints are dealt with efficiently to ensure the quality of products and services offered to customers.
n The Group’s published claims philosophy is to be “Fair to the customer and fair to FBD”. This philosophy guides the claims function in its handling of all customer claims.
Emerging RisksOne key aspect of the Risk Management Framework is to identify and if necessary take appropriate action in response to future risks which could impact the Group. We have a defined process in place for the identification of Emerging Risks, which is informed through the use of subject matter experts, workshops, Risk and Control Self Assessments and consulting a range of external documentation. Key emerging risks are regularly reviewed by the Risk Committee to assess whether they might become significant for the business. Key Emerging Risks include:
n Technological advances changing the shape of the insurance industry and competitive environment.
n The risk that an interruption or failure of information systems, whether caused by security breaches, cyber-attacks or other failures or malfunctions, may result in a significant loss of business, assets or competitive position.
n Global deterioration in economic conditions and particularly in Ireland may lead to a reduction in revenue and profits.
n Global socio-political uncertainty that may cause an adverse impact on profitability.
n The impact of climate change may result in increasingly volatile weather patterns and more frequent severe weather events.
n Regulatory legislative landscape and its associated cost to ensure continued compliance.
FBD Holdings plc Annual Report 2019 25Strategic Report
Governance
Financial Statements
Other Inform
ation
Brexit The UK legally left the EU on 31 January 2020 and have entered into a Transition Period, which is due to end on 31 December 2020. Brexit uncertainty continues as the UK and EU must negotiate and agree the detail of the terms of their future trade relationship. The impact of Brexit on the economy is still uncertain. The Irish government has stated that it will be following a “No Deal” approach to implementing Budget 2020. Leaving without a trade deal would involve tariffs, or import taxes on many goods, notably food and would also involve significant bureaucracy and disruption to trade. Brexit introduces business and trading uncertainty for all indigenous Irish businesses, including FBD and the Group’s core customers in farming and other small businesses. As mentioned previously the financial impact of Brexit on FBD is mitigated by our exclusive focus on the Republic of Ireland for insurance business and our low level of exposure to sterling assets in our investment portfolio. Operationally, we are in communication with all relevant UK service suppliers and are satisfied that Brexit does not pose a material threat. To the degree that there might be an impact on the carrying value of our assets, this risk is managed. FBD have set conservative Strategic Allocation levels across investment assets and these have been stress-tested for a Brexit scenario. Brexit related risks are managed in line with our Risk Management Framework as outlined on page 18. We continue to review and plan for operational impacts which may arise including supporting the needs of our customers.

26
Corporate Social Responsibility
FBD is committed to working with and supporting local communitiesFor over 50 years FBD has been invested in agriculture, farming and rural life generally. We believe farms, businesses, consumers and wider society feel real economic and social benefits as a result of our business activities. As an organisation that plans for the future, we are mindful of our impact on Society, the Environment, and the Communities in which we operate. FBD’s Sustainable Development Goals (SDGs) are aligned to the UN 17 point Sustainable Goal Charter to assist FBD focus and influence on improving the lives of our customers and wider Irish society.
Supporting our Communities Supporting our RootsFBD’s initiatives in supporting Irish communities has Quality Education (SDG 4); Decent Work and Economic Growth (SDG 8); Innovation and Infrastructure (SDG 9); Life on Land (SDG 11) and Partnerships for the Goals (SDG 17) at their core. We display our commitment to strong partnerships and cooperation by supporting communities and providing insurance cover to difficult sectors which are crucial to the economic and social fabric of the communities we serve. An example of this is FBD’s ongoing commitment to insuring livestock marts as they are an important component of the farming economy and the social fabric of Irish rural life.
N O P OV E RT Y
Z E R O H U N G E R
C L E A N WAT E R A N D SA N I TAT I O N
A F FO R DA B L E A N D C L E A N E N E R GY
R E D U C E D I N EQ UA L I T I ES
L I F E B E LOW WAT E R
P E AC E , J U ST I C E A N D ST R O N G
I N ST I T U T I O N S
L I F E O N L A N D

FBD Holdings plc Annual Report 2019 27Strategic Report
Governance
Financial Statements
Other Inform
ation
The FBD TRUSTThe FBD Trust was initially established to advance the interests of Irish farm families along with the communities in which they live and work. The FBD Trust supports research grants and educational scholarships for farming related training and development. It also supports groups and organisations that advocate for Irish farmers and their communities. FBD is immensely proud of the numerous innovative projects and initiatives that are supported by the FBD Trust.
FBD Student of the Year AwardThe annual FBD Student of the Year awards presented to the highest achieving graduates from Teagasc colleges across the country. A bursary and travel opportunity is presented to the overall winner. Nominees for these awards are the next generation of farm leaders and innovators.
UCD Farm Safety LecturerDr. Aoife Osborne is a lecturer for farm health and safety within the School of Agriculture, University College Dublin. This position is sponsored by FBD Trust. Dr. Osborne has a central role in educating the emerging generation of farming experts at Ireland’s largest university.
Nuffield ScholarshipsFBD sponsors the Nuffield Farming Scholarship Programme. This programme provides Agri-scholars the opportunity to achieve a global perspective and exposure to new methods and ideas. Scholars regularly go on to become influencers of sustainable change and improvement within their sector. FBD supports Nuffield scholarships to promote excellence by developing and supporting individuals with leadership. The current FBD Nuffield scholar, Karina Pierce PhD is conducting an investigation entitled ‘Future Proofing the Irish Agri-Food Sector through Robust Research’.
ASA Conference PartnerThe Agricultural Science Association is the professional body for graduates in agricultural, horticultural, forestry, environmental and food science. It is the voice of the Agricultural profession in Ireland. FBD provides financial support and assistance to the ASA Annual Conference.
FBD’s Supplier CharterFBD’s ‘Supplier Charter’ outlines the standards that we expect to see throughout our supply chain. We set high standards for ourselves and our Suppliers. We insist that all of our business activities are conducted lawfully, sustainably and above all ethically. Our charter sets out FBD’s zero tolerance approach to modern slavery in all its forms in our own business and in our supply chain. This means not using forced or compulsory labour, and/or labour held under slavery or servitude. We also understand how important prompt payment is to our suppliers. Our standard payment terms are net 30 days and we work hard to make sure we meet this. FBD expects that all of our Suppliers pay employees at least the minimum wage, and provides each employee with all legally mandated benefits.
Protecting InformationFBD collects and retains information from and about our customers and third parties. This is a vital and necessary part of providing insurance products. Keeping information secure is a top priority for us. We continue to implement appropriate technical and organisational measures to protect data from unlawful or unauthorised processing and against accidental loss, destruction, damage, alteration or disclosure.
Using Language that everyone understandsWe understand that some insurance terminology can be complex and difficult to understand. We aim to write all our customer documents in plain language to ensure that we are more readily understood. Our documents are approved by the National Adult Literacy Agency before they are published.
Q UA L I T Y E D U CAT I O N - I N V EST I N G I N FA R M A N D AG R I C U LT U R A L E XC E L L E N C E
D EC E N T WO R K A N D EC O N O M I C G R OW T H

28
The FBD Young Farmer of the Year AwardsThe FBD ‘Young Farmer of the Year’ is a national competition in conjunction with Macra na Feirme that recognises and rewards top-performing young farmers. It also promotes knowledge-sharing and networking to help with the isolation of running a farm on your own. Adjudication is based on a number of criteria including business initiative and innovation on the farm. Also considered are farm efficiency levels and enterprise quality, farm safety environmental protection awareness, as well as agricultural knowledge and community involvement.
The FBD National Dairy Open DayThe National Dairy Open Day is an international flagship outdoor event in Teagasc’s world leading Dairy Campus at Moorepark, Co Cork, and is sponsored by FBD. This event is free to attend and provides a valuable learning experience for dairy farmers along with the wider dairy industry. World leading dairy sustainability,production research and technologies are promoted to a national and international audience.
FBD CellCheck AwardsThe CellCheck Milking for Quality Awards is an initiative held in conjunction with Animal Health Ireland (AHI) to recognise and reward excellence on Irish dairy farms. Since the inception of the Awards in 2014, FBD has sponsored the ‘Best 500’ Award for the 500 milk suppliers nationally with the lowest weighted annual average somatic cell count.
FBD €uro-Star €200 competitionRun by the Irish Cattle Breeding Federation, the FBD €uro-Star €200 awards recognises excellence in beef breeding in both pedigree and commercial suckler herds.
Patron Member of Agri AwareA founding member of Agri Aware, FBD was one of a number of agri-businesses that recognised the need for an independent body to provide the general public with information and education on the importance of agriculture and the food industry to the Irish economy. FBD’s support assists Agri Aware in continuing its programme of educational and public awareness initiatives among the non-farming community. Topics include modern agriculture, the rural environment, animal welfare, food quality and safety.
I N N OVAT I O N A N D I N F R AST R U CT U R E
ThomasDuffy(Macra);FionaMuldoon(FBD),Liam Hanrahan (2019 FBDYoungFarmeroftheYear),picturedwithJoe Healy (IFA)
Corporate Social Responsibility (continued)

FBD Holdings plc Annual Report 2019 29Strategic Report
Governance
Financial Statements
Other Inform
ation
Guaranteed IrishFBD is a proud member of the Guaranteed Irish programme. As Ireland’s only indigenous insurance company, FBD has a proud heritage of supporting local communities. The Guaranteed Irish symbol is awarded to companies that create quality jobs, contribute to local communities and are committed to Irish provenance.
Chambers of CommerceWith 34 branches located around Ireland, FBD is a committed member of many local Chambers of Commerce. Working collaboratively with local businesses, Chambers of Commerce provide a forum to promote initiatives, knowledge sharing and to assist local business in communities across Ireland.
G O O D H E A LT H & W E L L B E I N G
Employees Giving BackFBD employees are active in supporting a wide range of local and national charity and community based organisations. At a Group level, FBD employees chose to appoint the Jack & Jill Children’s foundation and the Alzheimer’s Society as our charity partners for 2019.
Einín’s GardenFBD employees teamed up with The Jack & Jill Children’s foundation to help make a difference for a little girl named Einín and her family. FBD volunteers from across the Group worked hard over six weeks to provide her with a beautiful sensory outdoor play experience. FBD’s award winning garden from Bloom was utilised extensively and recycled throughout this project.
Farm ProtectFarming is a unique way of life and many positive aspects are associated with the occupation. However, by its nature, it is also a hazardous occupation. The continually high number of farm accidents is cause for great concern to us. FBD’s mission is to support initiatives which will make the farm a safer place for all. This embodies SDG 3 – Good Health and Well-Being. In addition we have dedicated employees who work directly with farms and businesses to help improve safety standards and awareness in the workplace. Ciaran Roche, FBD Risk Manager, represents FBD on the National Farm Safety Partnership.
FBD’s Farm Protect campaign aims to encourage farmers to make small but meaningful changes to their working behaviour. While farmers’ attitudes to health and safety are generally positive, simple changes can make a big difference. We focus on promoting awareness of the critical behavioural changes required through press and online adverts, social media and through distributing safety materials at events and through our network of branches.
Free Mart Risk Assessment
FBD works closely with Livestock Marts to provide a safe and suitable environment for all patrons. Free Risk Assessments are carried out by qualified health and safety professionals from a third party professional risk manager, Farm Relief Services (FRS). These Risk Assessments are intended to help mart managers. They identify hazards within the mart and advise on best practice to mitigate these risks. This service complements the significant FBD efforts made in improving Livestock Mart risks including; Safety Training Videos, a Lockdown Code of Practice and an On-line BeSmart Risk Assessment Tool developed in partnership with the Health and Safety Authority (HSA) and the Irish Co-Operative Organisation Society (ICOS).
PA RT N E RS H I P S FO R T H E G OA LS

30
National Marts Farm Safety and Remembrance Week“National Marts Farm Safety and Remembrance Week” was sponsored and organised by FBD in partnership with the HSA, ICOS, Associated Livestock Marts (ALM), The Farm Safely Partnership and Embrace. During this week there was a minute silence held at all ICOS and ALM mart sales followed by an educational session promoting safe work practices. This week commemorates the loved ones lost in farming accidents, and also promotes safety awareness and our individual commitment to farm safety. This campaign connects directly with 10,000 farmers annually.
Champions for SafetyFor seven years, FBD has led “Champions for Safety” seminars across Agricultural Colleges around the country. Speakers include staff from FBD, Teagasc, the HSA, ESB Networks and farm accident survivor testimonials who raise awareness of the importance of safety for the students’ on-farm work experience.
Farm Safety SignsThrough 2019, an additional 10,000 farm safety signs were produced and distributed free of charge to farmers all around the country. This brings the total number of signs provided to farmers to over 95,000. The concept of the sign is to improve and reinforce safety awareness on the farm on a daily basis and to help keep farmers, farm workers, family farm members and visitors focused on safety when they enter the farm.
Promoting Farm Safety through Theatre at Moorepark 2019FBD and Teagasc brought the topic of farm safety to the fore through the use of theatre at the Teagasc Moorepark Dairy open day. This live event demonstrates the trauma of an accident and its aftermath. This innovative approach to communicating farm safety messages builds on research
internationally showing theatre has the potential to assist with changing values and practices regarding safety.
Tractor Training SkillsFBD supports the Farm Relief Services (FRS) tractor training skills course for young people over the age of 14, to ensure that safe driving practises are adopted early.
Farm Safety Live
FarmSafetyLiveattheTullamoreShow
Each year FBD, FRS and the HSA bring ‘Farm Safety Live’ to the Tullamore Show. This consists of an arena specifically dedicated to farm safety demonstrations throughout the day. This popular and educational event provides practical and relevant farm safety tips through live and interactive demonstrations which can be taken home and implemented by farmers.
Safeguarding the Future of Farming Conference“Safeguarding the Future of Farming” was the main theme of this year’s safety conference supported by FBD Insurance and the Health and Safety Authority (HSA).
Health & SafetyFBD conducts all aspects of its business activities in such a way as to achieve the best possible standards of Health and Safety and Welfare for its employees. We have an approved Health & Safety statement.
Corporate Social Responsibility (continued)

FBD Holdings plc Annual Report 2019 31Strategic Report
Governance
Financial Statements
Other Inform
ation
Promoting Diversity & InclusionConsistent with SDG 5 – Gender Equality, FBD seeks to ensure all employees are treated with dignity and respect, receive equal opportunities and are not subject to discrimination. We work to ensure that respect for diversity, equality and inclusion are embedded in all the services we provide and in the work that we do. It is FBD’s policy that all employees may perform their work in an environment that is free of harassment, bullying and intimidation and where employees’ right to dignity at work is respected. Harassment and bullying is not tolerated.
FBD are proud members and supporters of the ‘30% Club’. This International organisation was established with a goal of achieving a better gender balance on boards and in executive leadership. 30 per cent of the Board of Directors of FBD Holdings plc is female along with 38 per cent of Executive level and 41 per cent of Manager/Specialists level in FBD. 60 per cent of FBD’s overall headcount are female.
The Women and Agriculture ConferenceThis conference acknowledges and celebrates the essential role that women play on farms and more generally in the wider agri-sector. This is a calendar highlight for women involved in the agricultural sector. It also provides an opportunity to network and engage with relevant discussions on topical agenda items.
Supporting Climate ActionAs an organisation that plans for the future and in keeping with SDG 11 - Sustainable Cities and Communities; SDG 12 - Responsible Consumption and SDG 13 – Climate Action we are working to become a leader in sustainable business practices in our industry. FBD actively measures, manages and mitigates our carbon footprint and aims to minimise our environmental impact. Adopting smarter business practices is the right thing to do and it is something the organisation is embracing and playing a part in realising. Companywide initiatives raise awareness amongst internal stakeholders and employees on how simple, effective and relevant activities can contribute to a healthier planet. Our sustainability projects include a commitment to using less paper, printing less and being more efficient in our energy usage.
G E N D E R EQ UA L I T Y
MaureenO’Meara,HeadofSales,Munster,addressingthe delegates at Women & Ag Conference

32
Taking responsibility for our Carbon Footprint
In 2019 FBD once again engaged with Vita Ireland to purchase voluntary carbon credits to offset the tonnes of carbon created by our business kilometres, using carbon credits from Vita’s innovative Green Impact Fund. Vita is an Irish overseas development agency working in Africa fighting hunger and the impacts of climate change. FBD’s longer term goal is to build the business case for achieving Carbon Neutral status, aided by Vita Ireland this goal helps support SDG 2 – Zero Hunger.
R ES P O N S I B L E C O N S U M PT I O N
Drive to reduce unnecessary printingThrough our paper reduction campaign, FBD is committed to reducing printing on a daily basis. We have also committed to reducing the number of printers in the organisation. We are seeking to challenge ourselves to be considerate of the environment. Since the introduction of the ‘Leave it on the screen’ campaign in August 2019, we have seen average monthly printing reduce by 27%.
LED Lighting UpgradeOur commitment to sustainable business practices has begun in our branches and encompasses all areas of our business. Our upgrading of the branch network and Mullingar Service Centre to LED lighting has resulted in significantly less power consumption. This is a significant financial saving, and also generates 25% more light. LED is a more energy efficient and environmentally friendly light source.
‘Cycle to Work’ schemeFBD participates in ‘The Cycle to Work Scheme’, which aims to encourage staff to use bicycles for their daily commute, helping to reduce our overall carbon footprint. Under this tax incentive scheme, FBD pays for a new bicycle and our employee then repays the cost in regular installments from their gross salary.
C L I M AT E ACT I O N
Grass10 – Grassland Excellence for Irish LivestockFBD is happy to sponsor ‘Grass10’ a multi-year campaign launched by Teagasc to increase grass utilisation on Irish livestock farms. Achieving ‘Grass10’ targets will require changes in farm practices associated with both grass production and utilisation, delivering best practice, and promoting sustainable agricultural methods.
Carbon Disclosure Project (CDP)FBD has proactively engaged with the Carbon Disclosure Project to better understand and mitigate our environmental impact. CDP is a non-profit charity which supports the global disclosure system for investors, companies, cities, states and regions to manage their environmental impacts. CDP takes independently verified information supplied by FBD, and scores our progress on climate action on a scale from A to F. FBD’s 2019 score is B; which signifies the ‘Management’ band – we are taking coordinated action on climate issues. This is higher than the Europe regional average of C and higher than the financial services sector average of C.
Corporate Social Responsibility (continued)

FBD Holdings plc Annual Report 2019 33Strategic Report
Governance
Financial Statements
Other Inform
ation
Corporate Information
Registered Office and Head Office Bankers FBD House Allied Irish Banks plcBluebell Bank of IrelandDublin 12 Ulster BankD12 Y0HE Barclays Bank plcIreland BNP Paribas
Close Brothers InternationalStockbrokers Credit Suisse (UK) LimitedGoodbody Stockbrokers Danske BankBallsbridge Park Deutsche Bank AGBallsbridge Goldman SachsDublin 4D04 YW83 SolicitorsIreland Dillon Eustace
33 Sir John Rogerson’s QuayShore Capital Dublin 2The Corn Exchange D02 XK09Fenwick Street IrelandLiverpool L2 7RBUnited Kingdom Registrar
Computershare Investor Services (Ireland) LimitedIndependent Auditors for 2019 3100 Lake DrivePricewaterhouseCoopers Citywest Business CampusChartered Accountants and Statutory Audit Firm Dublin 24One Spencer Dock D24 AK82North Wall Quay IrelandDublin 1D01 X9R7Ireland

34 Customer
centricBecoming truly customer centricDuring 2019 our commitment to improving our customer experience included improving our products and the ease of doing business with us. We aim to deliver a great customer experience no matter how the customer chooses to shop – via our nationwide branch network, on the phone or on-line.

FBD Holdings plc Annual Report 2019 35Strategic Report
Governance
Financial Statements
Other Inform
ation
“The support we receive from our local community helps us strive to be the
best and make them proud, helping us put Skibbereen on the map and show
the world what the support of your community can help you achieve.”
Paul & Gary O’Donovan Rowing

36
Board of DirectorsBiographical details of the Directors in office on the date of this Report are as follows:
Walter Bogaerts
Mr. Walter Bogaerts was General Manager of the Corporate Insurances Division of KBC Insurance based in Belgium prior to his retirement in 2013. He joined KBC Group (previously ABB Insurances) in 1979 and has gained extensive experience throughout his career with KBC in underwriting, reinsurance, audit, risk management and sales. He was general manager in charge of KBC Group’s Central-European insurance businesses until appointed to his most recent role in 2012. In that role he was a member of the Supervisory Boards, Audit and Risk Committees of KBC’s insurance subsidiaries in Czech Republic, Slovakia, Hungary, Poland and Bulgaria. He holds a Commercial Engineering degree from the Economic University of Brussels.
Fiona Muldoon
Ms. Fiona Muldoon joined the Group in January 2015 as Group Finance Director Designate and member of its Board. Later in 2015, Ms. Muldoon was appointed as Group Chief Executive. A Chartered Accountant, Ms. Muldoon was Director of Credit Institutions and Insurance Supervision at the Central Bank of Ireland from 2011 until 2014. Prior to this she was with XL Group for seventeen years and held a number of senior roles with this NYSE listed Property & Casualty Insurance company in Ireland, UK and Bermuda, including two years as Group Treasurer until July 2010. On 12 June 2015 Ms. Muldoon, was appointed as a non-executive Director of Bank of Ireland. Ms Muldoon is also a board member of Insurance Ireland, the Insurance Industry members association.
Mary Brennan
Ms. Mary Brennan is a Chartered Director, Certified Investment Fund Director and a Fellow of Chartered Accountants Ireland. In a career spanning over 30 years, Ms. Brennan has worked internationally in audit in KPMG and in a number of publicly listed companies, including Elan plc and Occidental Petroleum Corp. She is a highly experienced Non-Executive Director with a portfolio of companies, previously serving as Director and Audit Committee Chair of BNP Paribas Ireland. Ms. Brennan was appointed as Independent Non-Executive Director to Macquarie Capital (Ireland) Dac during 2019.
Sylvia Cronin
Ms. Sylvia Cronin was Director of Insurance Supervision in the Central Bank of Ireland until October 2019 and was a Member of the European Insurance and Occupational Pensions Authority (“EIOPA”) Board of Supervisors. Before joining the Central Bank, Ms Cronin spent the majority of her career working in the insurance industry, most recently as Chief Executive of Augura Life Ireland Ltd. Previously, Ms Cronin was the Chief Executive of MGM International Assurance Ltd. and spent several years with the AXA Group where she was head of Business Development, Services and Marketing in Ireland. Ms Cronin started her insurance career with the Fortis Group where her focus was on IT Management. Ms Cronin holds a Masters in Business Administration, was admitted as a Chartered Director to the Institute of Directors in London and is a CEDR Certified Mediator.
Liam Herlihy
Mr. Liam Herlihy is a farmer and was appointed Chairman in May 2017. He was appointed Chairman of the Teagasc Authority in September 2018 and was, until May of 2015, Group Chairman of Glanbia plc, a leading Irish based performance nutrition and ingredients group, having served in that role for 7 years during which he presided over a period of significant structural change and unprecedented growth for Glanbia plc. Mr. Herlihy completed the Institute of Directors Development Programme and holds a certificate of merit in Corporate Governance from University College Dublin. He brings to the Board a wealth of commercial experience and some deep insights into the farming and general agricultural industries in Ireland which, together, comprise the Group’s core customer base.
BACKGROUND & CAREER
CHAIRMANAPPOINTED ON 01/09/2015
Age: 68
GROUP CHIEF EXECUTIVEAPPOINTED ON 19/01/2015
Age: 52
INDEPENDENT NON-EXECUTIVE DIRECTORAPPOINTED ON 26/02/2016
Age: 62
INDEPENDENT NON-EXECUTIVE DIRECTORAPPOINTED ON 31/08/2016
Age: 54
INDEPENDENT NON-EXECUTIVE DIRECTORAPPOINTED ON 28/11/2019
Age: 57

FBD Holdings plc Annual Report 2019 37Strategic Report
Governance
Financial Statements
Other Inform
ation
Richard Pike
Mr Richard Pike has extensive experience of working with financial institutions throughout the world, assisting companies in managing enterprise risk more efficiently while addressing local regulatory guidelines and standards. As well as being the founder and CEO of Governor Software, Richard is currently Chairman of Citadel Securities (Ireland) Ltd and an Independent Non-Executive Director, National Cyber Security Society, JPMorgan fund administration, JPMorgan hedge fund administration and Citadel Securities Europe. Prior to Governor Software, Richard has worked in various senior banking, insurance, credit and market risk roles at Wolters Kluwer Financial Services, ABN AMRO, Bain, COMIT Gruppe and Quay Financial Software. In 2009, Richard was recognised as a “Top 50” Face of Operational Risk by Op Risk & Compliance magazine and was a contributing author to two books on risk management. Richard has also received the designation of ‘Certified Bank Director’ by the Institute of Banking.
Joe Healy
Mr. Joe Healy runs a dairy and cattle farm in Athenry, Co Galway with his family. He was elected the 15th President of the Irish Farmers’ Association in April 2016. Prior to that, he represented Galway IFA on the IFA National Farm Business Committee. Previously, he was actively involved in the young farmers’ organisation Macra na Feirme and was elected President of that organisation from 1995-1997. Mr Healy represents Irish farmers at EU level on COPA (Committee of Professional Agricultural Organisations), which is the official umbrella representative body for European farmers. He chairs the COPA Food Chain Working Group, which is seeking a stronger position for farmers in the food supply chain. He is a Non-Executive Director of Bord Bia – the Irish Food Board – which is responsible for the marketing of Irish food and drink abroad.
Padraig Walshe
Mr. Padraig Walshe is Chairman of Farmer Business Developments plc, the Company’s largest shareholder, and a dairy farmer. He is a past President of COPA, the European Farmers’ Organisation and of the Irish Farmers’ Association. Mr. Walshe previously served on the Board of FBD between 2006 and 2010, and rejoined the Board in December 2011. Mr. Walshe’s extensive leadership experience at national and international level and his deep understanding of Ireland’s farming community and the Irish food sector are of immense benefit to the Board.
INDEPENDENT NON-EXECUTIVE DIRECTORAPPOINTED ON 09/08/2017
Age: 52
INDEPENDENT NON-EXECUTIVE DIRECTORAPPOINTED ON 18/09/2019
Age: 52
John O’Grady
Mr. John O’Grady is a Chartered Accountant and an experienced insurance executive. He joined FBD from Liberty Insurance Limited where he held the role of Finance Director. Prior to his role in Liberty, Mr. O’Grady worked for Aviva and its predecessor companies in Ireland in various roles between 1989 and 2012, including Finance Director, Claims Director and Operations Director.
David O’Connor
Mr. David O’Connor is a Fellow of the Society of Actuaries in Ireland. He commenced his career in New Ireland Assurance before joining Allianz Ireland in 1988 to set up its non-life actuarial function. He was a member of Allianz Executive Management Board and held a number of senior management positions there prior to joining Willis Towers Watson in 2003 to set up its Property and Casualty consultancy unit in Dublin, where he worked until June 2016.
SENIOR INDEPENDENT NON-EXECUTIVE DIRECTORAPPOINTED ON 05/07/2016
Age: 62
GROUP FINANCE DIRECTORAPPOINTED ON 01/07/2016
Age: 58
NON-EXECUTIVE DIRECTORAPPOINTED ON 23/12/2011
Age: 62

38
Report of the Directors
The Directors present their report and the audited financial statements for the financial year 2019.
Principal ActivitiesFBD is one of Ireland’s largest property and casualty insurers looking after the insurance needs of farmers, private individuals and business owners through its principal subsidiary, FBD Insurance plc. The Group also has financial services operations including a successful life and pensions intermediary. The Company is a holding company incorporated in Ireland.
Business ReviewThe review of the performance of the Group, including an analysis of financial information and the outlook for its future development, is contained in the Chairman’s Statement on pages 4 to 6 and in the Group Chief Executive’s Review of Operations on pages 8 to 11. Information in respect of events since the financial year end and a review of the key performance indicators are also included in these sections. The key performance indicators include gross premium written, earnings per share, loss ratio, expense ratio, combined operating ratio, profit for the year, net asset value per share and return on equity.
ResultsThe results for the year are shown in the Consolidated Income Statement on page 80.
Financial InstrumentsThe Group makes routine use of financial instruments in the carry-on of its activities. The use of financial instruments is material to an assessment of the financial statements. Detail on the Group’s financial risk management objectives, policies and it’s exposure to liquidity, market, foreign currency, credit and concentration risk are included in Note 41 of the financial statements.
DividendsOn 26 February 2020 the Board of FBD Holdings plc proposed a preference dividend of €113,000 on the 14% preference shares, €169,000 on the 8% preference shares and €34,862,000 on the ordinary shares. The proposed dividends are subject to approval by shareholders at the Annual General Meeting on 8 May 2020. Please refer to note 35 for further details.
Subsequent EventsThere have been no subsequent events that would have a material impact on the financial statements.
Risk and UncertaintiesA description of the risks and uncertainties facing the Group are set out in the Risks and Uncertainties Report on pages 18 to 25.
SubsidiariesThe Company’s principal subsidiaries, as at 31 December 2019, are listed in note 36.
DirectorsThe present Directors of the Company, together with a biography on each, are set out on pages 36 and 37. The Board has decided that all Directors continuing in office will submit themselves for re-election at each Annual General Meeting, except for Joe Healy who has announced his intention not to stand for re-election.
The Directors who served at any time during 2019 were as follows:
Liam Herlihy Chairman
Walter Bogaerts IndependentNon-ExecutiveDirector
Mary Brennan IndependentNon-ExecutiveDirector
Dermot Browne SeniorIndependentNon-ExecutiveDirector(Resigned10May2019)
Sylvia Cronin IndependentNon-ExecutiveDirector(Appointed28November2019)
Joe Healy IndependentNon-ExecutiveDirector
Orlagh Hunt IndependentNon-ExecutiveDirector(Resigned10May2019)
Fiona Muldoon GroupChiefExecutive
David O’Connor SeniorIndependentNon-ExecutiveDirector
John O’Grady GroupChiefFinancialOfficer
Richard Pike IndependentNon-ExecutiveDirector(Appointed18September2019)
Padraig Walshe Non-ExecutiveDirector
Annual General MeetingThe Annual General Meeting is scheduled to be held on Friday, 8 May 2020. The notice of the Annual General Meeting of the Company will be sent to shareholders giving 21 clear days’ notice.

FBD Holdings plc Annual Report 2019 39Strategic Report
Governance
Financial Statements
Other Inform
ation
Directors’ and Company Secretary’s interestsThe interests of the Directors and Company Secretary (together with their respective family interests) in the share capital of the Company, at 31 December 2019 and 1 January 2019 (or date of appointment if later) were as follows:
Number of ordinary shares of €0.60 each
Beneficial31 December
20191 January
2019Liam Herlihy 8,000 8,000
Walter Bogaerts 0 0
Mary Brennan 0 0
Dermot Browne 0 0
Sylvia Cronin 0 0
Joe Healy 281 281
Orlagh Hunt 0 0
Fiona Muldoon 44,779 4,000
David O’Connor 1,500 1,500
John O’Grady 0 0
Richard Pike 0 0
Padraig Walshe 1,100 1,100
Company SecretaryDerek Hall 7,383 1,755
There has been no change in the interests of the Directors and Company Secretary (together with their respective family interests) in the share capital of the Company up to the date of this report.
The interests of the Directors and the Company Secretary in conditional awards over the share capital of the Company under the shareholder approved Performance Share Plans are detailed in the Report on Directors’ Remuneration on pages 57 to 67.
European Communities (Takeover Bids (Directive 2004/25/EC)) Regulations 2006For the purposes of Regulation 21 of the European Communities (Takeover Bids (Directive 2004/25/EC)) Regulations 2006, the information on the Board of Directors on pages 36 and 37, the Performance Share Plans in note 39 and the Report on Directors’ Remuneration on pages 57 to 67 are deemed to be incorporated in this part of the Report of the Directors.
Substantial ShareholdingsAs at 31 December 2019 the Company has been notified of the following interests of 3% or more in its share capital:
Ordinary shares of €0.60 each No.% of
Class
Farmer Business Development Plc 8,531,948 24.5%
FBD Trust Company Limited 2,984,737 8.6%
M&G Investment Management Ltd. 2,696,353 7.7%
Fidelity Management and Research Company 1,910,153 5.5%
INVESCO Asset Management Ltd. 1,695,383 4.9%
Highclere International Investors LLP 1,652,369 4.7%
Black Creek Investment Management Inc. 1,444,926 4.1%
Preference Share Capital14% Non-cumulative preference shares of €0.60 each No.
% of Class
Farmer Business Developments plc 1,340,000 100%
8% Non-cumulative preference shares of €0.60 each No.
% of Class
FBD Trust Company Limited 2,062,000 58.38%
Farmer Business Developments plc 1,470,292 41.62%
Share CapitalThe Group had four classes of shares in issue at the end of the year. These classes and the percentage of the total issued share capital represented by each are as follows:
Voting sharesNumber
in issue% of
Total
Ordinary shares of €0.60 each 34,862,464* 87.7%
14% Non-cumulative preference shares of €0.60 each 1,340,000 3.4%
8% Non-cumulative preference shares of €0.60 each 3,532,292 8.9%
39,734,756 100.0%
* excluding 598,742 shares held in treasury

40
Report of the Directors (continued)
The Company’s ordinary shares of €0.60 each are listed on the Main Securities Market of Euronext Dublin and have a premium listing on the UK Listing Authority. They are traded on both the Euronext Dublin and the London Stock Exchange. Neither class of preference share is traded on a regulated market.
Each of the above classes of share enjoys the same rights to receive notice of, attend and vote at meetings of the Company.
Non-voting shares Number in issue
‘A’ ordinary shares of €0.01 each 13,169,428
The rights attaching to the ‘A’ ordinary shares are clearly set out in the Articles of Association of the Company. They are not transferable except only to the Company. Other than a right to a return of paid up capital of €0.01 per ‘A’ ordinary share in the event of a winding up, the ‘A’ ordinary shares have no right to participate in the capital or the profits of the Company.
Non-Financial StatementEU Non-Financial Disclosure Regulations (Directive 2014/95/EU) were transposed into Irish law in Statutory Instrument No. 360 of 2017 and became effective for financial years commencing on or after 1 August 2017. Under these regulations, FBD Holdings plc must provide a brief description of the Groups’s Business Model and disclose information in relation to:
n environmental matters;
n social and employee matters ;
n respect for human rights; and
n anti-corruption and anti-bribery matters.
Any risk relating to the above matters are identified, assessed, managed and reported in line with the risk management framework as outlined on page 18.
FBD’s Business ModelFBD’s business model is outlined on pages 14 and 15. Our model starts with a sound strategy, focussing on our customers and our community. Our strategy is delivered through our great people and the right culture. We create value through our business activities and unique level of service. We reinvest in the Group while providing positive returns to our shareholders, our local communities and our people.
Environmental MattersFBD started measuring our use of energy nine years ago. This commenced through an engagement with the Carbon Disclosure Project (CDP). CDP is a not-for-profit charity that runs a global disclosure system for investors, companies, cities, states and regions to manage their environmental impacts.
Initially, this initiative was about understanding how the use of energy is measured and in turn managing FBD’s own use of energy. In 2016, a decision was made to undertake third party validation of the energy consumption data and in 2018 a further step was taken in the journey to look beyond “Energy Management” to the consideration of Climate Change and the Environment. These decisions were driven by the growth of concern regarding climate change and the environment from shareholders, employees, the management team and the wider community.
Overall emissions have decreased by 6 tCO2e, on the previous year. The savings have resulted from investment in energy efficient lighting and improved energy control equipment.
FBD Scope 1 and Scope 2 Emissions Data
Scope 1 Scope 2 – Location Based
Scope descriptions Includes CO2 emissions generated from gas and heating oil.
Includes emissions from the purchase of electricity by location. Individual FBD Property consumption approach.
2019 Consumption 89 tonnes CO2e 978 tonnes CO2e
2018 Consumption 88 tonnes CO2e 985 tonnes CO2e
Progress in 2019 Scope 1 emissions are up by 1 tCO2e, the increase is 1% on the previous year.
Scope 2 location based emissions are down 1% on the previous year, due to a reduction in consumption and a reduction in the emission factor. As the grid uses more renewables, the All Ireland emission factor reduces.

FBD Holdings plc Annual Report 2019 41Strategic Report
Governance
Financial Statements
Other Inform
ation
In 2019, in recognition of FBD’s environmental responsibilities and the Global Community, FBD once again purchased voluntary carbon credits to offset our business kilometres with Vita Ireland. Please refer to our Corporate Social Responsibility Statement on pages 26 to 32 for further details on this initiative.
Social and Employee MattersFBD has a range of policies in place to ensure full compliance with legislation and with our commitment to providing a safe and supportive working environment for our employees. Fundamental to these policies and the embedded culture, is a regard for the individual, their rights and the mutual advantage of fostering our employees’ potential and supporting their career development.
These policies are communicated to all staff joining FBD as part of the on-boarding process. They provide information, guidelines and rules where appropriate in relation to every stage of employment including recruitment and selection; equality and diversity; probation; learning and development; all types of leave; benefits; remuneration; disciplinary and grievance.
These policies are reviewed regularly and updates are notified to employees. Additional policies are introduced from time to time to support the organisation’s focus on enhancing the working environment and ensuring full compliance with legislative requirements.
Respect for Human RightsUnder FBD’s Equality and Diversity Policy, all employees who work in FBD, and those who use services provided by FBD, are treated with dignity and respect, receive equality of opportunity and are not subject to discrimination. FBD seeks to ensure that respect for diversity, equality and inclusion are embedded in all the services we provide and the work we do. To this end, FBD’s Supplier Charter details how FBD supports the Universal Declaration of Human Rights and will work to enforce these rights within our supply chain.
Anti-Bribery and Anti-CorruptionFBD requires all employees at all times to act honestly and with integrity and to safeguard the resources for which they are responsible. Our Code of Conduct Policy sets out the professional and responsible behaviour expected to ensure that we are appropriately focused on delivering the right outcomes for shareholders and customers, meeting our
legal and regulatory requirements and appropriately managing and mitigating risks.
This is further underpinned by our:
n delivery of mandatory ethics training to all staff annually;
n the Anti-Fraud Policy which outlines the role and responsibilities for the reporting and investigation of fraud; and
n the Speak Up Policy which provides a framework for staff to raise concerns about unlawful or inappropriate conduct, financial malpractice, danger to the public or the environment, possible fraud or risks to the Group.
Independent AuditorsPricewaterhouseCoopers, Chartered Accountants and Statutory Audit Firm, were appointed by the Directors in 2016 to audit the financial statements for the financial year ended 31 December 2016 and subsequent financial periods. The period of total uninterrupted engagement is four years, covering the financial years ended 31 December 2016 to 31 December 2019. PricewaterhouseCoopers have signified their willingness to continue in office in accordance with the provisions of Section 383(2) of the Companies Act 2014.
Regarding disclosure of information to the Auditors, the Directors confirm that:
As far as they are aware, there is no relevant audit information of which the Group’s statutory auditors are unaware; and they have taken all the steps that they ought to have taken as a Director in order to make themselves aware of any relevant audit information and to establish that the Group’s statutory auditors are aware of that information.
Accounting RecordsThe Directors have taken appropriate measures to ensure compliance with Sections 281 to 285 of the Companies Act, 2014 – the requirement to keep proper accounting records – through the employment of suitably qualified accounting personnel and the maintenance of appropriate accounting systems. The accounting records are located at FBD House, Bluebell, Dublin 12, Ireland.

42
Report of the Directors (continued)
Directors’ compliance statementThe Directors of the Company acknowledge that they are responsible for securing the Company’s compliance with its relevant obligations (as defined in the Companies Act 2014 (the “2014 Act”)) and, as required by section 225 of the 2014 Act, the Directors confirm that:
(i) a compliance policy statement setting out the Company’s policies with regard to complying with the relevant obligations under the 2014 Act has been prepared;
(ii) arrangements and structures have been put in place that they consider sufficient to secure material compliance with the Company’s relevant obligations; and
(iii) a review of arrangements and structures has been conducted during the financial year to which the Directors’ report relates.
Corporate GovernanceThe Corporate Governance Report on pages 44 to 53 forms part of this report and in this the Board has set out how it has applied the principles set out in the UK Corporate Governance Code 2018, which was adopted by both the Euronext Dublin and the UK Listing Authority, the Irish Corporate Governance Annex, and the Central Bank of Ireland Corporate Governance Code requirements for Insurance Undertakings 2015.
Board CommitteesThe Board has established four committees to assist it in the execution of its responsibilities. These are:
n the Audit Committee;
n the Risk Committee;
n the Nomination and Governance Committee; and
n the Remuneration Committee.
Political DonationsThe Group did not make any political donations during 2019.
Viability StatementThe Directors have assessed the prospects of the Group and its ability to meet its liabilities as they fall due in the medium term. The Directors selected a three year timeframe which they consider appropriate as this corresponds with the Board’s strategic planning process. The objectives of the strategic planning process are to consider the key strategic choices facing the Group and to incorporate these into a financial model with various scenarios. This assessment has been made with reference to the Group’s current position and prospects, the Group’s strategy, the Board’s risk appetite and the principal risks and uncertainties facing the Group, as outlined in the Risks and Uncertainties Report on pages 18 to 25.
The Directors review and renew the Group’s three year plan at least annually. Progress against the strategic plan is reviewed regularly by the Board and senior management. Associated risks are considered within the Board’s risk management framework.
The strategic plan has been tested for a number of scenarios which assess the potential impact of some of the strategic and commercial risks facing the Group. The Group performs an ORSA at least annually which subjects FBD’s solvency capital levels to a number of extreme stress scenarios. This was last performed in December 2019. Based on the results of these tests the Directors confirm that they have performed a robust assessment of the principal risks facing the Group, including those that would threaten its business model, its future performance and solvency and that they can have a reasonable expectation that the Group will be able to continue in operation and meet its liabilities as they fall due over the period of the assessment.
Going ConcernThe Group’s business activities, together with the factors likely to affect its future development, performance and financial position are set out in the Chairman’s Statement and the Review of Operations, as is the financial position of the Group. In addition, the Risks and Uncertainties Report on pages 18 to 25 and note 41 of the financial statements include the Group’s policies and processes for financial risk management.

FBD Holdings plc Annual Report 2019 43Strategic Report
Governance
Financial Statements
Other Inform
ation
The Directors have a reasonable expectation that the Company and the Group have adequate resources to continue in operational existence for the foreseeable future being a period of at least twelve months from the date of this report. As a result they continue to adopt the going concern basis of accounting in preparing the financial statements. In forming this view, the Directors have reviewed the Group’s budget for 2020 and forecast for 2021 and 2022, which take account of reasonably foreseeable changes in trading performance, the key risks facing the business and the medium-term plans approved by the Board in its review of the Group’s corporate strategy along with the Group’s capital projections and requirements under the Solvency II regime. The Directors have concluded that there are no material uncertainties that cast significant doubt over the Group’s ability to continue as a going concern.
Approval of Financial StatementsThe financial statements were approved by the Board on 26 February 2020.
Signed on behalf of the Board
Liam Herlihy Chairman
Fiona Muldoon GroupChiefExecutive
26 February 2020

44
Corporate Governance
Your Board of Directors is committed to the highest standards of corporate governance. Good governance stems from a positive culture and well embedded values. FBD’s core values of respect, belief, innovation, community, ownership and communication are central to how the Board conducts its business and discharges its responsibilities. Equally, however, these values are as relevant to every employee working throughout the Group in their interactions with each other, and with our customers, shareholders and other stakeholders.
UK Corporate Governance Code and the Irish Corporate Governance AnnexThe UK Corporate Governance Code 2018 (“the Code”) and the Irish Corporate Governance Annex (“the Annex”) codify the governance arrangements which apply to listed companies such as FBD. Combined, these represent corporate governance standards of the highest international level.
Throughout 2019 and to the date of this report, we applied the principles of the Code and except where otherwise expressly stated complied with the provisions of both the Code and the Annex.
This section of the Annual Report sets out the governance arrangements in place in FBD Holdings plc.
Location of information required pursuant to Euronext Dublin Listing Rule 6.1.80
Listing Rule Information to be included:
6.1.77 (4) Refer to Report on Directors’ Remuneration on pages 57 to 67.
No information is required to be disclosed in respect of Listing Rules 6.1.77 (1), (2), (3), (4), (5), (6), (7), (8), (9), (10), (11), (12), (13), (14).
The Board of Directors and its RoleThe Group is managed by the Board of Directors.
The primary role of the Board is to provide leadership and strategic direction while maintaining effective control over the activities of the Group.
The Board has approved a Corporate Governance Framework setting out its role and responsibilities. This is reviewed annually as part of the Board’s evaluation of its performance and governance arrangements. The Framework includes a formal schedule of matters reserved to the Board for its consideration and decision, which includes:
n the approval of the Group’s objectives and strategy;
n approval of the annual budget including capital expenditure and the review of the Group’s systems of internal control;
n maintenance of the appropriate level of capital, the allocation thereof and decisions as to the recommendation or payment of dividends;
n approval of financial statements; and
n the appointment of Directors and the Company Secretary.
This schedule ensures that the skills, expertise and experience of the Directors are harnessed to best effect and ensures that any major opportunities or challenges for the Group come before the Board for consideration and decision. The schedule was last reviewed in February 2020.
Other specific responsibilities of the Board are delegated to Board appointed committees, details of which are given later in this report.
Board Composition and IndependenceAt 31 December 2019 the Board comprised two Executive Directors and eight Non-Executive Directors, including the Chairman. This structure was deemed appropriate by the Board.
The Board deemed it appropriate that it should have between 8 and 12 members and that this size is appropriate, being of sufficient breadth and diversity to ensure that there is healthy debate and input.
Six of the Non-Executive Directors in office at the end of 2019 were considered to meet all of the criteria indicating independence set out in the Code.

FBD Holdings plc Annual Report 2019 45Strategic Report
Governance
Financial Statements
Other Inform
ation
Date first elected by
shareholders
Years from first election to 2020 AGM
Considered to be
independent
Mary Brennan 31 Aug 2016 3.75 Yes
Walter Bogaerts 29 Apr 2016 4.0 Yes
Sylvia Cronin Awaiting election
- Yes
Joe Healy 4 May 2018 2.0 Yes
David O’Connor 31 Aug 2016 3.75 Yes
Richard Pike Awaiting election
- Yes
Mr. Walshe, who is chairman of the Group’s largest shareholder, Farmer Business Developments plc, is not considered to be independent.
Key Roles and ResponsibilitiesChairmanThe role of the Chairman is set out in writing in the Corporate Governance Framework. He is responsible, inter alia, for:
n the effective running of the Board, setting its agenda and ensuring that it receives accurate, timely and clear information;
n facilitating constructive board relations and the effective contribution of all Non-Executive Directors;
n ensuring that the Board as a whole plays a full and constructive part in the development and determination of the Group’s strategy and overall commercial objectives; and
n ensuring that the Board has a clear understanding of the views of the shareholders.
Group Chief ExecutiveThe role of the Group Chief Executive is set out in writing in the Corporate Governance Framework. She is responsible, inter alia, for:
n running the Group’s business and reporting regularly on the progress and performance of the Group;
n proposing, developing and executing the Group’s strategy and overall objectives in close consultation with the Chairman and the Board; and
n implementing the decisions of the Board and its Committees.
Senior Independent DirectorThe Senior Independent Director is responsible for:
n being available to shareholders if they have concerns which they have not been able to resolve through the normal channels of the Chairman, the Group Chief Executive or the Group Chief Financial Officer, or for which such contact is inappropriate;
n conducting an annual review of the performance of the Chairman;
n acting as a sounding board for the Chairman; and
n serving as an intermediary for the other Non-Executive Directors as required.
Company SecretaryThe Company Secretary acts as Secretary to the Board and to its Committees. In so doing, he:
n assists the Chairman in ensuring that the Directors have access, in a timely fashion, to the papers and information necessary to enable them to discharge their duties;
n assists the Chairman by organising and delivering induction and training programmes as required; and
n is responsible for ensuring that Board procedures are followed and that the Board and that the Directors are fully briefed on corporate governance matters.
Board effectiveness and performance evaluationBoard effectiveness is reviewed annually as part of the Board’s performance evaluation process. The Chairman is responsible for ensuring that each Director receives an induction on joining the Board and that he or she receives any additional training he or she requires. The induction itself is organised and delivered by the Company Secretary and other members of the management team.

46
Corporate Governance (continued)
Board EvaluationEvery year the Board evaluates its performance and that of its Committees. Directors are expected to take responsibility for identifying their own training needs and to take steps to ensure that they are adequately informed about the Group and about their responsibilities as a Director. The Board is confident that all of its members have the requisite knowledge and experience and support from within the Group to perform their role as a Director of the Group.
Towards the end of 2018, the Board had its evaluation process externally facilitated by Independent Audit, an independent consultancy which has no other connections with the Group.
The purpose of the process was to identify areas where the Board can benefit from improvement and to affirm positively those areas where it is playing an effective role in leading the Group. This was achieved through a combination of reviewing Board and Committee papers, observing Board and Committee meetings and comprehensive interviews with individual Directors and Executives. The evaluation process recommended that the Board maintain a relentless focus on the customer and utilise the changes to the Corporate Governance Code to further enhance its ways of working.
Further details of the 2019 Board Effectiveness and Performance Evaluation are set out in the Report of the Nomination and Governance Committee.
Re-election of DirectorsThe Board has, since 2011, adopted the practice that all Directors will submit themselves for re-election at each
Annual General Meeting regardless of length of service or the provisions of the Company’s Articles of Association.
Access to adviceAll members of the Board have access to the advice and the services of the Company Secretary who is responsible for ensuring that Board procedures are followed and that applicable rules, regulations and other obligations are complied with.
In addition members of the Board may take independent professional advice at the Company’s expense if deemed necessary in the furtherance of their duties.
If a Director is unable for any reason to attend a Board or Committee meeting, he or she will receive Board/Committee papers in advance of the meeting and is given an opportunity to communicate any views on or input into the business to come before the Board/Committee to the Board/Committee Chairman.
Each of the committees has written terms of reference which were approved by the Board and set out the Committees’ powers, responsibilities and obligations. The terms of reference are reviewed at least annually by the Board. These are available on the Group’s website www.fbdgroup.com.
The Company Secretary acts as secretary to the committees. Minutes of all of the Committees’ meetings are available to the Board.
Each of these Committees has provided a report in the sections following.
Attendance at Board and Board Committee Meetings during 2019
Board AuditNomination and
Governance Remuneration RiskW Bogaerts 10/10 5/5 3/3 6/6 5/5M Brennan 10/10 5/5 - - -D Browne 3/3 3/3 - - -S Cronin 1/1 - - - -J Healy 6/10 - - - -L Herlihy 10/10 - 3/3 - 5/5O Hunt 2/3 - - 3/3 1/2F Muldoon 10/10 - - - -D O’Connor 10/10 2/2 3/3 5/6 4/5J O’Grady 10/10 - - - -R Pike 2/2 - - - -P Walshe 10/10 - - - -

FBD Holdings plc Annual Report 2019 47Strategic Report
Governance
Financial Statements
Other Inform
ation
Report of the Audit Committee
Mary Brennan Committee Chairperson
Membership during the year
Length of time served on
committee
M Brennan Committee Chairperson, Independent Non-Executive Director
3.33 years
W Bogaerts Independent Non-Executive Director
3.83 years
D O’Connor Independent Non-Executive Director, Senior Independent Director
0.58 years
D Browne (resigned 10 May 2019)
Committee Chairman, Senior Independent Non-Executive Director
2.90 years
The Committee members have been selected to ensure that the Committee has available to it the range of skills and experience necessary to discharge its responsibilities.
The Board agrees that all Members are considered to have recent and relevant financial experience and qualifications. The Committee as a whole has the competence relevant to the General Insurance sector.
Objective of CommitteeTo assist the Board of the Group in fulfilling its oversight responsibilities for such matters as financial reporting, the system of internal control and management of financial risks, the audit process and the Group’s process for monitoring compliance with laws and regulations.
Key responsibilities delegated to the Committeen reviewing the Group’s financial results announcements
and financial statements;
n overseeing the relationship with the external auditors including reviewing and approving their terms of engagement and fees;
n review and monitor the independence and objectivity of the Statutory Auditor and the effectiveness of the audit process;
n reviewing the scope, resources, results and effectiveness of the Group’s internal audit function; and
n performing detailed reviews of specific areas of financial reporting as required by the Board or the Committee.
MeetingsThe Committee met on five occasions during 2019. Attendance at the scheduled meetings held during 2019 is outlined on page 46. Meetings are attended by Committee members. The Chief Financial Officer, the Statutory Auditor, the Head of Group Internal Audit, the Head of Actuarial Function, the Chief Risk Officer and the Chief Executive Officer are invited to attend all scheduled meetings of the Committee. The Committee regularly meets separately with the Statutory Auditor and with the Head of Group Internal Audit, without members of management present.
The minutes of Committee meetings are circulated routinely to the Board. The Committee chairperson also provides a verbal report to the Board after each Committee meeting. The Committee reports formally to the Board annually on the overall work undertaken and the degree to which it discharged the responsibilities delegated to it.
Activities of the Committee during 2019The principal activities undertaken by the Committee during 2019 include:
n assessment of financial and other risks facing the Group and of the operation of internal controls;
n review of all aspects of the relationship with the external auditors, including the statutory audit plan, audit findings and recommendations and consideration of the independence of the external auditors and the arrangement in place to safeguard this, including partner rotation, prohibition on share ownership and levels of fees payable to the statutory auditor for non-audit assignments;
n review of drafts of the Annual Report and the Half Yearly Report prior to their consideration by the Board;

48
Corporate Governance (continued)
n appraisal of the Internal Audit function, plan, work, reports and issues arising and monitoring the scope and effectiveness of the function;
n assessment of compliance with laws, regulations, codes and financial reporting requirements; and
n reporting to the Board on its activities and confirming the degree to which the Committee’s delegated responsibilities had been discharged through verbal reports to the Board after each meeting and a formal written report presented annually.
In 2019 the Committee considered the independence of the Auditors and acknowledged the independence and quality control safeguards operated within PricewaterhouseCoopers. No non-audit services were provided by PricewaterhouseCoopers other than the audit of those elements of the Solvency and Financial Condition Report that PricewaterhouseCoopers are required to audit and the provision of certificates of premium amounts to the Motor Insurers Bureau of Ireland. In addition, the Board has approved a Non-Audit Services Policy which is in place to mitigate any risks threatening, or appearing to threaten, the external audit firm’s independence and objectivity arising through the provision of non-audit services.
As part of its responsibilities the Committee reviews the External Audit Plan, the audit approach and objectives and Audit Findings and has concluded that the external audit process has remained effective.
PricewaterhouseCoopers were reappointed as Auditors of the Group in respect of the financial year ended 31 December 2019. The audit was last put out to tender in 2015 and PricewaterhouseCoopers was appointed as Auditors from 2016. PricewaterhouseCoopers have been auditors to the Group for four years.
The significant issues, critical judgements and estimates used in the formulation of the financial statements are set out in note 3. All are considered by the Committee, with particular focus on the following in 2019:
n Insurance contract liabilities and related reinsurance assets. The Group had net claims outstanding of €617.0m and Net UPR of €183.5m at 31 December 2019. In order to satisfy itself that the balances were appropriately stated, the Committee reviewed the Actuarial Reserve analysis and margin for uncertainty prepared by Management, which are also subject to the approval of the Reserving Committee of FBD Insurance plc, and subject to both internal and external actuarial peer review. The Audit Committee concluded that the carrying value of claims outstanding and UPR included in the financial statements are appropriate.
Fair, balanced and understandableThe Committee formally advises the Board on whether the Annual Report and financial statements, taken as a whole, are fair, balanced and understandable, in accordance with Provision 27 of the UK Corporate Governance Code 2018. The Committee must ensure that the Annual Report and financial statements also provide the information necessary for Shareholders to assess the performance of the Group, along with its business model and strategy and the Committee is satisfied that the above requirements have been met.
EvaluationThe Committee has reviewed the activities which it performed and its overall effectiveness and has concluded that it has operated effectively in providing the Board with the assurances needed to discharge it’s responsibilities.
Mary Brennan On behalf of the Audit Committee
26 February 2020

FBD Holdings plc Annual Report 2019 49Strategic Report
Governance
Financial Statements
Other Inform
ation
Report of the Risk Committee
Walter Bogaerts Committee Chairman
Membership during the yearLength of time
served on committee
W Bogaerts Committee Chairman, Independent Non-Executive Director
3 years
L Herlihy Independent Non-Executive Director and Board Chairman
3 years
D O’Connor Senior Independent Non-Executive Director
3 years
O Hunt (resigned 10 May 2019)
Independent Non-Executive Director
2 years
The Committee members have been selected to ensure that the Committee has available to it the range of skills and experience necessary to discharge its responsibilities.
Objective of CommitteeThe Board Risk Committee is the forum for risk governance within FBD. It is responsible for providing oversight and advice to the Board in relation to current and potential future risk exposures of the Group and future risk strategy. This advice includes recommending a risk management framework incorporating strategies, policies, risk appetites and risk indicators to the Board for approval. The Risk Committee oversees the risk management function, which is managed on a daily basis by the Chief Risk Officer.
Key responsibilities delegated to the Committeen promote a risk awareness culture within the Group;
n ensure that the material risks and emerging risks facing the Group have been identified and that appropriate arrangements are in place to manage and mitigate those risks effectively;
n advise the Board on the effectiveness of strategies and policies with respect to maintaining, on an ongoing basis, the amounts, types and distribution of capital adequate to cover the risks of the Group;
n review and challenge risk information received by the Chief Risk Officer from the business departments to ensure that the Group is not exceeding the risk limits set by the Board;
n present a profile of the Group’s key risks, risk management framework, risk appetite and tolerance and risk policies at least annually together with a summary of the Committee’s business to the Board.
MeetingsThe Committee met on five occasions during 2019. Meetings are attended by Committee members. The Chief Risk Officer, the Chief Executive Officer, the Chief Financial Officer, the Chief Underwriting Officer, the Head of Actuarial Function, the Head of Compliance and the Head of Internal Audit are invited to attend all scheduled meetings of the Committee.
The minutes of Committee meetings are circulated routinely to the Board. The Committee chairman also provides a verbal report to the Board after each Committee meeting. The Committee reports formally to the Board annually on the overall work undertaken and the degree to which it discharged the responsibilities delegated to it.
Activities of the Committee during 2019The principal activities undertaken by the Committee during 2019 include:n assisted the Board in the review and update of its risk
policies, including frameworks, risk appetite, risk indicators and risk tolerance;
n appraised the Risk Function plan, to ensure that the plan is sufficient and appropriate to effectively identify, monitor, manage and report, on a continuous basis, the risks to which the Group could be exposed;
n ensured that the material risks facing the Group have been identified and appropriately managed and mitigated;
n reviewed the Emerging Risks facing the Groupn reviewed and challenged risk information reported to
the Committee to ensure that the Group is operating within the risk limits set by the Board;
n reviewed the quarterly Solvency Capital Ratio;n considered the results of risk policy stress tests and
peer reviews of the Actuarial Best Estimate that were performed by the Risk Function;
n assessed the results of Control Design Reviews, Blank Page Risk Reviews and Emerging Risks Reviews undertaken by the Risk Function; and
n reviewed the 2019 ORSA report prior to its consideration by the Board.
EvaluationThe Committee has reviewed the activities which it performed and its overall effectiveness and has concluded that it has operated effectively in providing the Board with the assurances needed to discharge it’s responsibilities.
Walter Bogaerts On behalf of the Risk Committee 26 February 2020

50
Corporate Governance (continued)
Report of the Nomination and Governance Committee
Liam Herlihy Committee Chairman
Membership during the year
Length of time served on
committee
L Herlihy Committee Chairman, Non-Executive Director, Board Chairman
3.58 years
D O’Connor Senior Independent Non-Executive Director
2.66 years
W Bogaerts Independent Non-Executive Director
0.58 years
D Browne (resigned 10 May 2019)
Senior Independent Non-Executive Director
2 years
Objective of CommitteeTo ensure that the Board and its Committees are made up of individuals with the necessary skills, knowledge and experience to ensure that the Board is effective in discharging its responsibilities.
During 2019 the responsibilities of the Committee were expanded to include corporate governance and the Committee was renamed the Nomination and Governance Committee.
Key responsibilities delegated to the Committeen reviewing the structure, size and composition of the
Board and making recommendations to the Board for any appointments or other changes;
n recommending changes to the Board’s Committees;
n advising the Board in relation to succession planning both for the Board and the senior executives in the Group;
n monitor the Group’s compliance with corporate governance best practice with applicable legal, regulatory and listing requirements and to recommend to the Board such changes as deemed appropriate; and
n overseeing, in conjunction with the Board Chairman, the conduct of the annual evaluation of the Board, Board Committees, Chairman and individual Director Performance.
MeetingsThe Committee met three times during 2019. The Group Chief Executive may attend meetings of the Committee but only by invitation and not at a time when her succession arrangements are discussed.
The minutes of Committee meetings are circulated routinely to the Board. The Committee chairman also provides a verbal report to the Board after each Committee meeting. The Committee reports formally to the Board annually on the overall work undertaken and the degree to which it discharged the responsibilities delegated to it.
Activities of the Committee during 2019n led the search process for a successor to the CEO;
n led the search and selection process for new Independent Non-Executive Directors;
n reviewed the Board evaluation process;
n reviewed the talent management and succession plan for the Group and its principal subsidiary, FBD Insurance plc.
n reviewed the Diversity Policy; and
n following the expansion of the Committee’s responsibilities to include governance, they reviewed compliance with governance best practice.
Further details of their activities are laid out in on the Nomination and Governance report on pages 54 to 56.
EvaluationThe Committee has reviewed the activities which it performed and its overall effectiveness and has concluded that it has operated effectively in providing the Board with the assurances needed to discharge it’s responsibilities.
Liam Herlihy On behalf of the Nomination and Governance Committee 26 February 2020

FBD Holdings plc Annual Report 2019 51Strategic Report
Governance
Financial Statements
Other Inform
ation
Report of the Remuneration Committee
David O’Connor Committee Chairman
Membership during year
Length of time served on
committee
D O’Connor Committee Chairman, Senior Independent Non-Executive Director
2.66 years
W Bogaerts Independent Non-Executive Director
3.66 years
O Hunt (resigned 10 May 2019)
Committee Chairperson, Independent Non-Executive Director
2.68 years
Following the resignation of Ms Hunt, Mr O’Connor was appointed as Committee Chairman following receipt of approval from the Central Bank of Ireland. In line with Provision 32 of the UK Corporate Governance Code 2018, Mr O’Connor had served on the Remuneration Committee for at least 12 months prior to his appointment as Chairman of the Committee.
Objective of CommitteeTo assist the Board of the Group in ensuring that the level of remuneration in the Group and the split between fixed and variable remuneration are sufficient to attract, retain and motivate Executive Directors and senior management of the quality required to run the Group in a manner which is fair and in line with market norms, while not exposing the Group to unnecessary levels of risk.
Key responsibilities delegated to the Committeen ensuring that the Group’s overall reward strategy is
consistent with achievement of the Group’s strategic objectives
n determining the broad policy for the remuneration of the Group’s Executive Directors, Company Secretary and executive management;
n determining the total remuneration packages for the foregoing individuals, including salaries, variable remuneration, pension and other benefit provision and any compensation on termination of office;
n ensure that remuneration schemes promote long-term shareholdings by Executive Directors that support alignment with long-term shareholder interests;
n review the on-going appropriateness and relevance of the Remuneration Policy;
n ensuring that the Group operates to recognised good governance standards in relation to remuneration;
n making awards of shares under the Group’s approved share scheme; and
n preparation of the detailed Report on Directors’ Remuneration.
MeetingsThe Committee met six times during 2019. The Group Chief Executive may attend meetings of the Committee but only by invitation and not at a time when her individual remuneration arrangements are discussed.
The minutes of Committee meetings are circulated routinely to the Board. The Committee chairman also provides a verbal report to the Board after each Committee meeting. The Committee reports formally to the Board annually on the overall work undertaken and the degree to which it discharged the responsibilities delegated to it.
Activities of the Committee during 2019The principal activities undertaken by the Committee during 2019 include:
n annual review of remuneration arrangements for Executive Directors and other senior executives;
n review and approval of the Report on Directors’ Remuneration for 2019;
n making of a conditional award of shares under the FBD Performance Share Plan and setting the conditions attached.
n keeping under review upcoming legislation impacting the Group.
Full details of Directors’ Remuneration are set in the Report on Directors’ Remuneration on pages 57 to 67.
EvaluationThe Committee has reviewed the activities which it performed and its overall effectiveness and has concluded that it has operated effectively in providing the Board with the assurances needed to discharge it’s responsibilities.
David O’Connor On behalf of the Remuneration Committee 26 February 2020

52
Corporate Governance (continued)
EngagementFBD has identified the following as its key stakeholders:
n Shareholders
n Employees
n Policyholders/Customers
n Regulators
n Wider Society
The Board is committed to ensuring that excellent lines of communication exist and are fostered between the Group and its stakeholders. Initiatives undertaken are outlined in the Corporate Social Responsibility report on pages 26 to 32.
A planned programme of investor relations activities is undertaken throughout the year which includes:
n briefing meetings with all major shareholders after the full year and half yearly results announcements;
n regular meetings between institutional investors and analysts with the Group Chief Executive, Chief Financial Officer and/or Head of Investor Relations to discuss business performance and strategy and to address any issues of concern; and
n responding to letters and queries received directly from shareholders and from proxy adviser firms.
Should a significant proportion of votes be cast against a resolution at any general meeting, the Board will endeavour to identify the shareholders concerned and will initiate contact with them with the view to understanding the reasons for the adverse vote. In 2019 no resolution had 20% or more votes cast against it.
The Board receives reporting on shareholder engagement which includes details of meetings held, feedback received and issues either of interest or of concern raised. Any issues arising are managed at board meetings.
FBD has numerous channels through which it can engage with customers. FBD has 34 Branches in its network making face to face contact easily accessible for customers. In addition FBD is present at a significant number of events throughout the country.
Through regular meetings with board members and senior management the Group has an engaging relationship with the Central Bank of Ireland, its regulator. Through attendance at Oireachtas meetings on insurance related matters the Group engages with Government bodies.
Ms Sylvia Cronin has been appointed as Non-Executive Director for engagement with the workforce and it is intended that feedback will be regularly reported to the Board.
FBD and Wider SocietyThe CEO of the Group is a Board Member of Insurance Ireland which is the Voice of Insurance in Ireland and represents the Irish general insurance, health insurance, life assurance, reinsurance and captive management sectors. In addition FBD spokespeople on Insurance, Farm Safety and the Claims Environment participate in and contribute to societal debate on topical issues.
Annual General MeetingThe Company’s Annual General Meeting is held each year in Dublin. The 2020 meeting will be held on 8 May 2020.
Who attends?n Directors;
n Senior Group executives;
n Shareholders;
n Company Advisers; and
n Members of the media are also invited and permitted to attend.
What business takes place at the meeting?n the Group Chief Executive makes a presentation on the
results and performance to the meeting prior to the Chairman dealing with the formal business of the meeting itself; and
n all shareholders present, either in person or by proxy can question the Chairman, the Committee Chairpersons and the rest of the Board during the meeting and afterwards.
All formal resolutions are dealt with on a show of hands. Once the vote is declared by the Chairman, the votes lodged with the Company in advance of the meeting are displayed prominently in the venue for those present to see. Immediately after the meeting is concluded the results are published on the Group’s website www.fbdgroup.com and also via the Euronext Dublin and London Stock Exchange.
The notice of the Annual General Meeting is issued to shareholders at least 20 working days in advance of the meeting.

FBD Holdings plc Annual Report 2019 53Strategic Report
Governance
Financial Statements
Other Inform
ation
Internal ControlThe Board has overall responsibility for the Group’s system of internal control and for reviewing its effectiveness. Such a system is designed to manage rather than eliminate the risk of failure to achieve business objectives and can provide only reasonable and not absolute assurance against material misstatement or loss.
In accordance with the revised Financial Reporting Council (FRC) guidance for directors on internal control published in September 2014, “GuidanceonRiskManagement,Internal Control and Related Financial and Business Reporting”, the Board confirms that there is an ongoing process for identifying, evaluating and managing any significant risks faced by the Group, that it has been in place for the year under review and up to the date of approval of the financial statements and that this process is regularly reviewed by the Board.
The key risk management and internal control procedures which cover all material controls include:
n skilled and experienced management and staff in line with fit and proper requirements;
n roles and responsibilities including reporting lines clearly defined with performance linked to Group objectives;
n an organisation structure with clearly defined lines of responsibility and authority; a comprehensive system of financial control incorporating budgeting, periodic financial reporting and variance analysis;
n a Risk Committee of the Board and a Risk Management Framework comprising a risk function headed by a Chief Risk Officer, a clearly stated risk appetite and risk strategy supported by approved risk management policies and processes;
n an Executive Risk Committee comprising senior management whose main role includes reviewing and challenging key risk information and to assist the Board Risk Committee, described earlier, in the discharge of its duties between meetings;
n the risk strategy, framework and appetite are articulated in a suite of policies covering all risk types and supported by detailed procedural documents. Each of these documents is subject to annual review and approval by the Board;
n performance of an ORSA linking to risk management, strategy and capital management;
n a Group Internal Audit function;
n a Group Compliance function;
n a Data Protection Officer;
n an Audit Committee whose formal terms of reference include responsibility for assessing the significant risks facing the Group in the achievement of its objectives and the controls in place to mitigate those risks;
n a disaster recovery framework is in place and is regularly tested;
n a business continuity framework is in place and is regularly tested; and
n a number of key Group policies in place include a Corporate Governance Framework, Fitness and Probity Policy, Financial Reporting Policy, Speak Up Policy and Code of Conduct.
The Annual Budget, Half-Yearly Report and Annual Report are reviewed and approved by the Board. Financial results with comparisons against budget are reported to Executive Directors on a monthly basis and are reported to the Board at each Board meeting.
The risk management, internal control, reporting and forecasting processes are important to the Board in the exercise of its Governance and Oversight role. The Board constantly strives to further improve their quality.
The Group has established a ‘Speak Up’ Policy for employees the purpose of which is to reassure employees that it is safe and appropriate to raise any concern that they may have about malpractice and to enable them to raise such concerns safely and properly. This policy is reviewed annually and circulated thereafter to all Group employees.
The Board confirms that it has reviewed the effectiveness of the Group’s Systems of Internal Control for the year ended 31 December 2019. The 2019 internal control assessment provides reasonable assurance that the Group’s controls are effective, and that where control weaknesses are identified, they are subject to management oversight and action plans.

54
Nomination and Governance Report
Dear Shareholder,
On behalf of the Nomination and Governance Committee, I am pleased to set out a summary of its activities during 2019.
Board Changes during 2019In October 2019, Ms Muldoon informed the Board that she will leave her position as Executive Director and CEO during 2020. Following this announcement the Committee engaged an external executive search specialist firm, Odgers Berndtson, to assist in identifying a suitable replacement to lead FBD into the future.
In addition, Mr Dermot Browne and Ms Orlagh Hunt did not go forward for re-election at the 2019 Annual General Meeting. Following the departure of Mr Browne and Ms Hunt there were two vacancies on the Board. In planning for Board appointments the Committee considered the current Board diversity, mix and skills and engaged Odgers Berndtson, to assist in identifying suitable candidates in line with the needs of the Board. Appointments are made, on merit, against objective criteria and with due regard for the benefits of diversity on the Board. All appointments to the Board are subject to the approval of the Central Bank of Ireland. Odgers Berndtson has no connection with the Group or any of its Directors.
During 2019 the Nomination and Governance Committee recommended the appointment of Ms Cronin and Mr Pike as Independent Non-Executive Directors to the Board. The Committee welcome the new skills and additional financial services, regulation, risk and technological experience these individuals bring to the Board.
Diversity and Inclusion ReportThe Board has a formal Diversity Policy in place, the objective of which is to ensure the appropriate balance is achieved in the composition of the Board. The Board values the major contribution which a mix of backgrounds, skills and experience brings to the Group and sees merit in increasing diversity at Board level in achieving the Group’s strategic objectives. Differences in background, skills, experience and other qualities, including gender, are always considered and formally discussed at the Nomination Committee in determining the optimal composition of the Board, the principal aim being to achieve an appropriate balance between them.
While all appointments to the Board will have due regard to diversity, they will be made on merit, ensuring that the
skills, experience and traits noted by the Board as being of particular relevance at any time are present on the Board and included in any planned recruitment.
The Board continues to comprise of a mix in backgrounds, experience and gender in line with the policy. As at the date of this report, the Board was comprised as follows:
Tenure of Director0 – 2 years 20%
3 – 6 years 70%
7 – 9 years 10%
Over 9 years 0%
GenderMale 70%
Female 30%
Executive/non-executiveNon-executive 80%
Executive 20%
Experience and skillsThe skills and experience identified by the Board as critical to its composition and that of its Committees at this time included expertise in insurance or other financial services, actuarial, general and farming/agri industry experience, corporate finance, accounting and auditing, corporate governance, compliance, executive reward, risk and technology.
The percentage of the Board having the requisite skills and experience were as follows:
Insurance or financial services 80%
Actuarial 10%
General industry 100%
Agri/farming 30%
Corporate finance 40%
Accounting and Auditing 30%
Corporate Governance 80%
Compliance 70%
Executive reward 40%
Risk 80%
Technology 20%

FBD Holdings plc Annual Report 2019 55Strategic Report
Governance
Financial Statements
Other Inform
ation
FBD are proud members and supporters of the ‘30% Club’. This international organisation was established with a goal of achieving a better gender balance on boards and in executive leadership. 30 per cent of the Board of Directors of FBD Holdings plc is female along with 40 per cent of Executive level and 41 per cent of Manager/Specialists level in FBD. 60 per cent of FBD’s overall headcount are female.
Gender BalanceThe gender balance of those in the senior management and their direct reports.
Gender Female
Gender Male
Executive Management Team 40% 60%
Direct Reports 43% 57%
CultureDiversity and inclusion is an integral part of our Culture programme. In 2018 we launched our Culture programme to ensure our employees were focussed on value adding and deepening customer relationships. In 2019 we launched ‘Our Values and Behaviours’ with over 30% of the organisation collaborating to develop a framework that is authentic to FBD and supports a diversity and inclusion culture.
The Board is committed to ensuring that the culture programme is embedded into the organisation and monitors compliance regularly. A number of key initiatives were delivered in 2019 with continuous updates to the Board throughout the year. The values and behaviours rolled out in December 2019, align the Group’s purpose, value and strategy and a presentation was made to the Board as part of this roll out.
Succession Planning and Senior Management DevelopmentThe Committee is responsible for reviewing the Talent Management and Succession Plan. The Succession Plan was last reviewed in December 2019 and as part of this process FBD had documented succession plans for the board and senior roles with a view to ensuring that FBD develops and retains talent and is best placed to replace key roles in as seamless a manner as possible should they arise.
A comprehensive Senior Management Development Plan has been a key focus during 2019 and senior management have taken part in this programme. In addition, specific innovation projects to support long term retention and development of key pipeline talent have been undertaken.
Focus at executive management level has been to inspire employees to drive performance to deliver for our stakeholders.
Investment in the WorkforceThe success of FBD is directly related to the capabilities of our employees and our ability to achieve standards of excellence through the services we provide our customers. In order to achieve and sustain these standards of excellence we are committed to providing employees at all levels with appropriate training, development and education.
Employee development is a continuous process. Development progress is regularly measured to ensure an optimum contribution to the Group’s achievements and employee development needs. This ensures that there is a mutual benefit ensuing from the development plan. In the first instance we aim to provide a comprehensive internal training and development programme to employees of the organisation at all levels, and to supplement this where necessary or appropriate with external development and education.
The training needs of employees are identified through performance management and operational planning in line with best practice and legislative guidelines. Additionally, FBD supports further educational and professional development of its employees.
Board EvaluationEvery year the Board evaluates its performance and that of its Committees. The evaluation of the Board for 2019 involved the following:
n Completion by each Director of a detailed questionnaire covering key aspects of Board effectiveness including composition of Board, meetings and processes, Board performance and reporting and performance of Board Committees.

56
Nomination and Governance Report (continued)
n Through the completion of a questionnaire each Director evaluated their performance and this forms part of the review of their individual performance. Further areas of discussion include Board performance and effectiveness and feedback on the evaluation process.
n The results of the evaluation and feedback are collated and reported to the Board along with suggested areas for improvement.
The Senior Independent Director is responsible for leading the evaluation of the performance of the Chairman and this was carried out through a meeting with the Directors in the absence of the Chairman. Feedback is provided to the Chairman through the Senior Independent Director.
The Board Evaluation was externally facilitated by Independent Audit at the end of 2018. Recommendations from this review were addressed and progressed in line with an agreed action plan. Independent Audit are assisting the Chairman, the Senior Independent Director, and the Directors in carrying out the Board evaluation for 2019 and are assessing progress against the 2018 action plan. In assisting with the evaluation Independent Audit will meet individually with the Directors and attend a board meeting in an observatory capacity. Any additional recommendations arising from this evaluation will be addressed as appropriate.
Liam Herlihy On behalf of the Nomination and Governance Committee
26 February 2020

FBD Holdings plc Annual Report 2019 57Strategic Report
Governance
Financial Statements
Other Inform
ation
Report on Directors’ Remuneration
Introductory Letter from the Remuneration Committee ChairDear Shareholder,
On behalf of the Remuneration Committee and the Board, I am pleased to set out in the section following, the details of the Directors’ Remuneration for the year ended 31 December 2019.
Paying for PerformanceThe Committee ensures alignment of risk appetite and remuneration metrics with the long term interests of the Group’s key stakeholders by aligning remuneration metrics with the Group’s business model and strategic objectives and by ensuring sufficient stretch in the performance targets.
External AdviceWillis Towers Watson continued to provide advice in respect of FBD’s Remuneration Policy in 2019. I was employed by Willis Towers Watson from 2003 to 2015, however, I currently have no financial connection with Willis Towers Watson nor does any of my income derive from it or any of it’s affiliated entities.
Shareholder Dialogue and SupportDespite the fact that there is no obligation to do so under Irish Law, the Board, on the recommendation of this Committee tables the Report on Directors’ Remuneration at the Annual General Meeting each year for an advisory note. At the 2019 AGM, this report received 99% support from shareholders.
The Committee requests shareholders to consider and approve the annual remuneration report set out on the pages following at the 2020 AGM.
David O’Connor Chairperson of the Remuneration Committee
26 February, 2020

58
Report on Directors’ Remuneration (continued)
Role of Remuneration CommitteeResponsibility for determining the levels of remuneration of the Executive Directors has been delegated by the Board to the Remuneration Committee whose membership is set out in the Corporate Governance Report.
In framing remuneration strategy, frameworks and policies, the Committee gives full consideration to the principles and provisions of the Corporate Governance Requirements for Insurance Undertakings 2015 and UK Corporate Governance Code 2018 and takes into account the long term interests of shareholders, investors and other stakeholders of the Group.
The duties of the Remuneration Committee are to determine Directors Remuneration policies and practices by reviewing performance structures, performance metrics, target setting and application of discretion.
The Remuneration Committee also reviews overall workforce remuneration and related policies and alignment of incentives and rewards with culture and takes these factors into account when setting the policy for Executive Director remuneration.
The Committee considers and reviews the remuneration policy and are in agreement that it is operating as intended in respect of group performance quantum.
In determining outcomes under the bonus and the LTIP, the Remuneration Committee considers performance achieved during the year and satisfies themselves that the incentive outcomes were appropriately aligned with the extent to which the Group met its strategic goals and the shareholder experience.
PolicyRemuneration arrangements are determined throughout the Group based on the same principle – reward should be sufficient in order to attract, retain and motivate high performing individuals who are critical to the future development of the Group. The fair distribution of our Group’s profits is an integral part of our corporate culture as we wish to reward our employees’ contribution to the success of the Group.
The performance measures ensure everyone is focussed on delivering the same business priorities and that employees share in the success if the business strategy is delivered.
It is the policy of the Group to provide all members of executive management, middle management and employees of the Group with appropriate remuneration and incentives that reward performance and ensure that they are, in a fair and responsible manner, rewarded for specific contributions which align to the financial success of the Group. The appropriateness is assessed with reference to internal and external sources. This is done by ensuring that the principles of sound, prudent, risk management are fully reflected and that excessive risk taking is neither encouraged nor rewarded.
The Committee has aimed to build simplicity and transparency into the design and delivery of our Remuneration Policy. The remuneration structure is simple to understand for both participants and shareholders and is aligned to the strategic priorities of the business. We aim for our disclosures to clearly explain the design of our arrangements and the way that they have been operated so that they can be fully understood by all stakeholders.
The Policy includes a number of points in it’s design, the aim of which is to mitigate potential risk:
n defined limits on the maximum opportunity levels under incentive plans;
n provisions to allow malus and clawback to be applied by the Remuneration Committee where appropriate;
n performance targets calibrated at appropriately stretching but sustainable levels in line with our business strategy so that executives are incentivised to deliver performance but not at the expense of going beyond the Group’s risk appetite; and
n shareholding requirements ensures alignment of interests between Executive Directors and Shareholders and encourages sustainable performance.
FBD Holdings plc Annual Report 2019 59Strategic Report
Governance
Financial Statements
Other Inform
ation
We aim for our disclosure to be clear to allow Shareholders to understand the range of potential values which may be earned under the remuneration arrangements. All incentive arrangements have defined and disclosed limits on pay out/award levels.
A significant proportion of executive director remuneration arrangements is share-based and we also require significant holding of shares which ensures that remuneration outcomes are closely aligned to shareholder returns for example, the CEO is required to build and maintain a shareholding equivalent to two times annual salary.
It is also the policy of the Group to provide a remuneration framework that attracts, motivates and rewards Executives of the highest calibre who bring experience to the strategic direction and management of the Group and who will perform in the long term interests of the Group and it’s shareholders.
As part of our annual remuneration cycle a comprehensive analysis is completed in respect of comparison of changes to salary, benefits and annual bonus for Executive Directors, senior management and all employees. A gender pay gap comparison and gap analysis is also completed in respect of both pay and bonus around total workforce remuneration.
Base salaries are reviewed annually with effect from 1 April taking into account the individual’s role and experience, group performance and personal performance. Market practice and benchmarking is also taken into account and a comprehensive review of our pay model and benchmarking exercise was completed in 2019. Although salaries are reviewed annually there is no automatic right for any Executive to receive a salary increase.
The following table sets out the key elements of the Remuneration Policy for Executive Directors and Senior Executives, their purpose and how they link to strategic rational.
Element and link to strategy
Policy and operation Changes to policy
Base Salary (fixed remuneration)
To help recruit and retain senior experienced Executives
Base salaries are reviewed annually with effect from 1 April taking the following factors into account:
n The individual’s role and experience
n Group performance
n Personal performance
n Market practice and benchmarking
Although salaries are reviewed annually there is no automatic right of any Executive to receive a salary increase.
No change to policy
Benefits (fixed remuneration)
To provide market competitive benefits
Benefits provided take the form of a motor allowance and an agreed percentage contribution to health and other insurance costs.
No change to policy

60
Report on Directors’ Remuneration (continued)
Element and link to strategy
Policy and operation Changes to policy
Pension Provision (fixed remuneration)
To provide market competitive benefits and reward performance over a long period, enabling Executives to save for retirement
All employees are provided with retirement benefits under a defined contribution arrangement from 1 October 2015.
The Group’s defined benefit pension scheme has been closed to future accrual since September 2015 and to new members since 2005.
Mr O’Grady receives a taxable cash allowance in lieu of pension benefits.
No change to policy
Annual Performance Bonuses (variable remuneration)
To reward achievement of group targets, personal performance and contribution
The performance measures for annual performance bonuses for the Executive Directors and other Senior Executives are based on attainment of Combined Operating Ratio (66.6%) and Gross Premium Written growth (33.4%) targets for 2019.
The maximum bonus potential as a percentage of base salary for the Chief Executive for 2019 was 105%.
The maximum bonus potential as a percentage of base salary for the Chief Financial Officer for 2019 was 60%.
More detail on the actual operation of the Annual Performance Bonus arrangements appear later in this Report.
There have been no changes to either the policy or the operation of annual performance bonuses.
Executive Directors receive defined contribution pension benefits (or equivalent cash in lieu), in line with existing scheme arrangements available to the wider workforce. The Remuneration Committee have determined that the level of pension contribution for any newly appointed Executive Director will be set in line with levels in operation for the majority of the workforce as is the case with all employees.
Current contribution levels for existing Executive Directors are 20% (Fiona Muldoon, CEO) and 15% (John O’Grady, CFO) of salary. The Committee will continue to monitor market and best practice in this area and consider whether any adjustments to these arrangements would be appropriate in the future.

FBD Holdings plc Annual Report 2019 61Strategic Report
Governance
Financial Statements
Other Inform
ation
Element and link to strategy
Policy and operation Changes to policy
Longer Term Incentives – the FBD Performance Share Plan (“LTIP”) (variable remuneration)
To align the financial interests of Executives with those of Shareholders
The Group Performance Share Plan (“LTIP”) was approved by shareholders in 2018.
Under the LTIP, the Remuneration Committee may, at its sole discretion, make conditional awards of shares to Executives. Conditional awards of shares under the LTIP are limited to 10% in aggregate with any other employee share plan of the Company’s issued ordinary shares of €0.60 each over a rolling 10 year period.
The market value of the shares which are the subject of a conditional award to an individual may not, in any financial year, normally exceed 150% of the participant’s base salary as at the date of grant.
The Remuneration Committee set performance conditions each year, selecting appropriate metrics based on key strategic priorities. The period over which the performance conditions applying to a conditional award under the LTIP are measured may not be less than three years. The extent to which a conditional award may vest in the future will be determined by the Remuneration Committee by reference to the performance conditions set at the time of the award. These conditions are designed to ensure alignment between the economic interests of the plan participants and those of shareholders. Different conditions, or the same conditions in differing proportions, can be used by the Remuneration Committee in different years under the LTIP rules, provided that the Committee is satisfied that they are challenging targets and that they are aligned with the interests of the Company’s shareholders.
The LTIP rules allow the Remuneration Committee (at it’s sole discretion) to make awards which may be subject to an additional post-vesting holding period. Awards will vest after three years once applicable performance conditions have been achieved and the vested shares (net of tax) may be required to be held for a further two-year period to provide continued alignment with shareholders.
The LTIP includes provisions that allow the Remuneration Committee to withhold, reduce or require the repayment of awards for up to two years after vesting (i.e. up to five years after grant) if there is found to have been (a) material misstatement of the Group’s financial results or (b) gross misconduct on the part of the award holder.
No change to policy.

62
Report on Directors’ Remuneration (continued)
The information below on pages 57 to 67 of the Report on Directors’ Remuneration identified as audited forms an integral part of the audited financial statements as described in the basis of preparation on page 89. All other information in the report on Directors’ Remuneration is additional information and does not form part of the audited financial statements.
Conditional Awards of Shares in 2019 - AuditedDuring 2019 one Conditional Award of shares was made under the Performance Share Plan. This was made in March 2019 to Executive Directors and senior management.
The conditions attached to the award, which reflect the Board’s strategic plans, were based 100% on the compound annual growth rate (CAGR) of Net Asset Value (NAV) per share, relative to the 1 January 2019 NAV for the three years ending 31 December 2021. The NAV has been chosen because the Committee considers it is the controllable measure most closely correlated to share price and ultimately to shareholder return.
Vesting levels range between a threshold level of 25% to a maximum of 125% for outperformance. The CAGR target for NAV is up to high single digit percentages. The actual percentages are not disclosed due to commercial competitor sensitivity and because to do so would also constitute forward looking guidance.
The Committee will publish details regarding targets and vesting levels at the end of the performance period (2022).
The Committee has decided not to include relative performance to market targets as there is no relevant comparator in the Irish market.
The maximum and threshold for vesting for the performance conditions are as follows:
Threshold Level Proportion vesting Upper Level Proportion vesting
NAV CAGR >3.4% 25% High single digits 125%
Outstanding Conditional Awards (2016-2018) - AuditedThe Committee considered the extent to which the performance conditions underpinning this award were met in the three financial years 2016 to 2018 (the ’Performance Period’). The Committee concluded that 59.0% of the business results and 16.5% of market share performance conditions were met and therefore the conditional awards granted in March 2016 was 75.5% vested. The Committee used their discretion to allow vesting in respect of share price given it was 1c lower than minimum vesting threshold.
Directors’ and Company Secretary’s Conditional LTIP Awards - AuditedDetails of the conditional share awards to the CEO, CFO and to the Company Secretary made under the 2007 and 2018 LTIP plans are given in the table below. In respect of the 2017 awards, the number of shares is the maximum possible number which could vest for the individual concerned if all of the performance conditions previously described are met at stretch target level. In respect of the 2018 and 2019 awards the number of shares could increase to a maximum of 125% of the number of shares outlined below if the performance conditions previously described are met at stretch target level.

FBD Holdings plc Annual Report 2019 63Strategic Report
Governance
Financial Statements
Other Inform
ation
At 1 January
2019
Granted during
year
Vested during
year
Lapsed during
year
Forfeited during
year
At 31December
2019Performance
Period
Earliest vesting
date
Market price on award €
Executive Directors
Fiona Muldoon 54,545 - (42,317) (12,228) - - 2016-2018 Mar-19 6.60
54,961 - (42,640) (12,321) - - 2016-2018 Mar-19 6.55
45,283 - - - - 45,283 2017-2019 Mar-20 7.95
33,256 - - - - 33,256 2018-2020 Aug-21 10.83
- 40,955 - - - 40,955 2019-2021 Mar-22 8.79
Total 188,045 40,955 (84,957) (24,549) - 119,494
John O’Grady 22,138 - - - - 22,138 2017-2019 Mar-20 7.95
17,737 - - - - 17,737 2018-2020 Aug-21 10.83
15,927 - - - 15,927 2019-2021 Mar-22 8.79
Total 39,875 15,927 - - - 55,802
Company Secretary
Derek Hall 15,114 - (11,725) (3,389) - - 2016-2018 Mar-19 6.55
11,006 - - - - 11,006 2017-2019 Mar-20 7.95
11,316 - - - - 11,316 2018-2020 Aug-21 10.83
- 12,969 - - - 12,969 2019-2021 Mar-22 8.79
Total 37,436 12,969 (11,725) (3,389) - 35,291
The total number of shares subject to conditional awards outstanding under the 2007 and 2018 LTIP Schemes amount to 658,704 being 1.9% of the Company’s ordinary share capital (excluding treasury shares) at 31 December 2019 (2018: 642,974) shares and 1.9% of ordinary share capital.
The aggregate limit of the number of shares over which conditional awards are permitted under the 2007 and 2018 LTIP scheme rules is 10% of the Company’s issued share capital over a rolling 10 year period. Since 2008, there have been 10 conditional awards with an aggregate of 1,825,214 shares or 5.2% of the Company’s ordinary share capital (excluding treasury shares).
The Remuneration Committee concluded that 75.5% of LTIP 2016 performance conditions were met. In relation to the share price condition the Remuneration Committee used their discretion to take into account a short averaging period rather than an unrepresentative spot price to allow this portion of the award to vest.

64
Report on Directors’ Remuneration (continued)
Share Ownership PolicyThe Group incentivises its Executive Directors and Senior Executives with equity based awards under the Group’s shareholder approved share schemes. Central to the philosophy underlying awards is the goal of aligning the economic interests of those individuals with those of shareholders.
Executives are expected to maintain a significant long-term equity interest in the Company. The requirement, which is set out in a policy document by the Remuneration Committee, approved and reviewed annually, is to build and retain a valuable shareholding relative to base salary, at a minimum, as noted hereunder. Executive Directors have not built up to the requirement yet due to the relatively short time in their roles. Until such time as this requirement has been met, those to whom the Policy applies are precluded from disposing of any shares issued to them under the Group’s share schemes.
Executive Share ownership requirement
Group Chief Executive 2 times annual salary
Other Executive Directors 1.5 times annual salary
Other Senior Executives 1 times annual salary
Non-Executive Director Remuneration - AuditedThe remuneration of the non-Executive Directors is determined by the Board, and reflects the time commitment and responsibilities of their role. In setting this level, the Board has regard to the fees payable to the Non-Executive Directors of the other Irish publicly listed companies and also to the developments and policy for the remuneration of the employees in the wider Group.
The basic non-Executive Director fee is €50,000 and this was last reviewed in July 2016. Directors receive additional fees for being members of and/or chairing Board Committees as outlined within the Corporate Governance Report on pages 44 to 53. These fees are reflective of their added responsibilities.
The Chairman, Mr Liam Herlihy received fees of €118,500 during the year (2018: €118,500) inclusive of the basic non-Executive Director fee. Mr David O’Connor, received fees of €70,455 during the year as he took the position of Senior Independent Director (2018: €60,000) inclusive of the basic Non-Executive Director fee, and reflecting his additional responsibilities as Chairman of the Remuneration Committee.
Non-Executive Directors are not members of the Group’s pension schemes and are not eligible for participation in the Group’s long-term incentive schemes.
Service ContractsThe service contract for the Group Chief Executive and the Group Financial Officer provide for the following periods of notice of termination of employment:
Executive From Company From CEO/CFO
Fiona Muldoon CEO 12 months 6 months
John O’Grady CFO 6 months 6 months

FBD Holdings plc Annual Report 2019 65Strategic Report
Governance
Financial Statements
Other Inform
ation
External appointments held by the Executive DirectorsIn recognition of the benefits to both the Group and to our Executive Directors serving as Non-Executive Directors of other companies, our Executive Directors are, subject to advance agreement in each case, permitted to take on an external non-Executive appointment and to retain any related fees paid to them.
During the year, Ms Muldoon served as a non-Executive Director of the Governor and Company of Bank of Ireland, for which she received fees of €78,625 in the period.
Determination of Annual Performance Bonus for the year ended 31 December 2019As previously noted, the overall Annual Performance Bonus arrangements, the targets and their achievement are approved by the Remuneration Committee each year. Specifically the Remuneration Committee approve the merit pay and bonus arrangements for the Executive Directors in line with FBD’s Remuneration Policy.
The 2019 annual performance bonus scheme was designed such that on plan group performance for the year 2019 would deliver 100% of the target bonus. 66.66% of the bonus pool is determined by Combined Operating Ratio and 33.34% by Gross Premium Written growth. The Gross Premium Written growth measure came in below the minimum threshold target of €7m and therefore no bonus is deemed payable under this measure. For the remaining 66.6% of the bonus pool, at less than 91% Combined Operating Ratio, 100-150% is deemed payable. In 2019, a COR of 72.3% was achieved and therefore 150% of the Combined Operating Ratio measure is deemed payable.
Accordingly the Remuneration Committee has approved a maximum bonus pool of 100% of target for all eligible employees to be split according to performance.
In the case of Ms Muldoon and Mr O’Grady for 2019, 66.6% of the annual performance bonus is determined by Combined Operating Ratio and 33.4% is determined by Gross Premium Written growth, subject to individual performance against agreed objectives. Accordingly the Remuneration Committee has decided bonuses of €414,000 and €112,000 are payable.
We are committed to ongoing and constructive engagement and use a number of channels to support our engagement process to ensure a process of two way engagement in order to incorporate their views into our business activities.
Among our key stakeholders is the Farmers Business Development plc and as FBD’s largest shareholder have a seat on the board which benefits the Group as they share knowledge in respect of our largest customer base.
FBD is committed to being open and transparent in respect of its remuneration arrangements for all employees and as part of this transparency table the Report on Directors’ Remuneration at the Annual General Meeting each year for an advisory note. The FBD Performance Share Plan (LTIP) was approved by Shareholders at AGM on 5 May 2018. FBD engaged individually with a number of shareholders prior to the AGM in respect of the Long Term Investment Plan.
As part of our annual pay cycle a communication is issued to all employees explaining how their bonus aligns to the Group strategy and the steps taken to ensure fairness of distribution for all employees. Regular engagement takes place with employer representative bodies to discuss remuneration and other matters.
FBD also have a programme of Investor Relation Activities where we engage with all Shareholders in order to enhance bilateral communication by fostering objective orientated dialogue with Shareholders.

66
Report on Directors’ Remuneration (continued)
Executive and non-Executive Directors’ Remuneration details - AuditedThe following table sets out in detail the remuneration payable by the Group in respect of any Director who held office for any part of the financial year:
Fees1 €000s
Salary2
€000s
Other Payments3
€000sBenefits4
€000s
PensionContribution5
€000s
2019Total
€000s
Executive Directors:
Fiona Muldoon - 450 414 39 90 993
John O’Grady - 280 112 18 52 462
Non-Executive Directors:
Liam Herlihy (Chairman) 119 - - - - 119
Joe Healy 50 - - - - 50
Padraig Walshe 50 - - - - 50
Dermot Browne 31 - - - - 31
Orlagh Hunt 22 - - - - 22
David O’Connor 70 - - - - 70
Walter Bogaerts 71 - - - - 71
Mary Brennan 62 - - - - 62
Richard Pike 14 - - - - 14
Sylvia Cronin 5 - - - - 5
494 730 526 57 142 1,949
Notes (2019)1. Fees are payable to the Non-Executive Directors only.
2. Salaries are paid to Executive Directors.
3. Bonuses of €414,000 and €112,000 were awarded to Ms Muldoon and Mr O’Grady under the bonus scheme in 2019. The bonuses for both Ms Muldoon and Mr O’Grady were calculated in accordance with the Annual Performance Arrangements described earlier and both Ms Muldoon’s and Mr O’Grady’s bonuses were approved by the Remuneration Committee.
4. Benefits relate exclusively to a motor allowance and contribution towards health insurance costs.
5. Pension contributions relate to contributions to a defined contribution pension scheme or a payment in lieu. In respect of the CFO there was an underpayment of €9,000 in respect of prior years’ which was corrected in 2019.
6. Mr. Dermot Browne and Ms. Orlagh Hunt did not go forward for re-election as Non-Executive Directors at the AGM on the 10th May 2019.
7. Richard Pike was appointed as Non-Executive Director on 18 September 2019.
8. Sylvia Cronin was appointed as Non-Executive Director on 28 November 2019.

FBD Holdings plc Annual Report 2019 67Strategic Report
Governance
Financial Statements
Other Inform
ation
The following table sets out the detail for the previous financial year (2018):
Fees1 €000s
Salary2
€000s
Other Payments3
€000sBenefits4
€000s
Pension Contribution5
€000s
2018 Total
€000s
Executive Directors:
Fiona Muldoon - 450 354 39 90 933
John O’Grady - 268 126 18 33 445
Non-Executive Directors:
Liam Herlihy (Chairman) 119 - - - - 119
Joe Healy 50 - - - - 50
Padraig Walshe 50 - - - - 50
Dermot Browne 85 - - - - 85
Orlagh Hunt 60 - - - - 60
David O’Connor 60 - - - - 60
Walter Bogaerts 70 - - - - 70
Mary Brennan 58 - - - - 58
552 718 480 57 123 1,930
Notes (2018)1. Fees are payable to the Non-Executive Directors only.
2. Salaries are paid to Executive Directors.
3. Bonuses of €354,000 and €126,000 were awarded to Ms Muldoon and Mr O’Grady under the bonus scheme in 2018. The bonuses for both Ms Muldoon and Mr O’Grady were calculated in accordance with the Annual Performance Arrangements described earlier and both Ms Muldoon’s and Mr O’Grady’s bonuses were approved by the Remuneration Committee on 25 February 2019.
4. Benefits relate exclusively to a motor allowance and contribution towards health insurance costs.
5. Pension contributions relate to contributions to a defined contribution pension scheme or a payment in lieu.

68
Directors’ Responsibilities Statement
The Directors are responsible for preparing the Annual Report and financial statements, in accordance with the Companies Act 2014 and the applicable regulations.
Irish company law requires the Directors to prepare financial statements for each financial year. Under the law, the Directors have elected to prepare the financial statements in accordance with International Financial Reporting Standards as adopted by the European Union (“relevant financial reporting framework”). Under company law, the Directors must not approve the financial statements unless they are satisfied that they give a true and fair view of the assets, liabilities and financial position of the Company as at the financial year end date and of the profit or loss of the Company for the financial year and otherwise comply with the Companies Act 2014.
In preparing each of the Company and Group financial statements, the Directors are required to:
n select suitable accounting policies for the Company and the Group financial statements and then apply them consistently;
n make judgements and estimates that are reasonable and prudent;
n state whether the financial statements have been prepared in accordance with the applicable accounting standards, identify those standards, and note the effect and the reasons for any material departure from those standards; and
n prepare the financial statements on the going concern basis unless it is inappropriate to presume that the Company will continue in business.
The Directors are responsible for ensuring that the Company and the Group keeps or causes to be kept adequate accounting records which correctly explain and record the transactions of the Company and the Group, enable at any time the assets, liabilities, financial position and profit or loss of the Company and the Group to be determined with reasonable accuracy, enable them to ensure that the Annual Report and financial statements comply with the Companies Act 2014 and the Listing Rules of the Euronext Dublin and enable the financial statements to be audited.
They are also responsible for safeguarding the assets of the Group and hence for taking reasonable steps for the prevention and detection of fraud and other irregularities.
The Directors are also required by the Transparency (Directive 2004/109/EC) Regulations 2007 (Transparency (Directive 2004/109/EC) (Amendment) (No. 2) Regulations 2015) to include a management report containing a fair review of the business and a description of the principal risks and uncertainties facing the Group.
Under applicable law and the requirements of the Listing Rules issued by the Euronext Dublin, the Directors are also responsible for preparing a Directors’ Report and reports relating to Directors’ remuneration and corporate governance that comply with that law and those Rules. The Directors are responsible for the maintenance and integrity of the corporate and financial information included on the Group’s website. Legislation in Ireland governing the preparation and dissemination of financial statements may differ from legislation in other jurisdictions.
The Directors confirm that, to the best of their knowledge and belief:
n the financial statements, prepared in accordance with IFRSs as endorsed by the EU, give a true and fair view of the assets, liabilities and financial position for the Group as at 31 December 2019 and of the result for the financial year then ended;
n the Report of the Directors, the Chairman’s Statement and the Review of Operations include a fair review of the development and performance of the Group’s business and the state of affairs of the Group for the 12 months ending 31 December 2019, together with a description of the principal risks and uncertainties facing the Group; and
n the Annual Report and financial statements, taken as a whole, is fair, balanced and understandable and provides the information necessary for shareholders to access the position, performance, strategy and business model of the Group.
On behalf of the Board
Liam Herlihy Chairman
Fiona Muldoon Group Chief Executive
26 February 2020

FBD Holdings plc Annual Report 2019 69Strategic Report
Governance
Financial Statements
Other Inform
ation
Independent auditors’ report to the members of FBD Holdings plc
Report on the audit of the financial statementsOpinionIn our opinion, FBD Holdings plc’s group financial statements and company financial statements (the “financial statements”):
n give a true and fair view of the group’s and the company’s assets, liabilities and financial position as at 31 December 2019 and of the group’s profit and the group’s and the company’s cash flows for the year then ended;
n have been properly prepared in accordance with International Financial Reporting Standards (“IFRSs”) as adopted by the European Union and, as regards the company’s financial statements, as applied in accordance with the provisions of the Companies Act 2014; and
n have been properly prepared in accordance with the requirements of the Companies Act 2014 and, as regards the group financial statements, Article 4 of the IAS Regulation.
We have audited the financial statements, included within the Annual Report, which comprise:
n the Consolidated and Company Statements of Financial Position as at 31 December 2019;
n the Consolidated Income Statement and Consolidated Statement of Comprehensive Income for the year then ended;
n the Consolidated and Company Statements of Cash Flows for the year then ended;
n the Consolidated and Company Statements of Changes in Equity for the year then ended; and
n the notes to the financial statements, which include a description of the significant accounting policies.
Certain required disclosures have been presented elsewhere in the Annual Report, rather than in the notes to the financial statements. These are cross-referenced from the financial statements and are identified as audited.
Our opinion is consistent with our reporting to the Audit Committee.
Basis for opinionWe conducted our audit in accordance with International Standards on Auditing (Ireland) (“ISAs (Ireland)”) and applicable law. Our responsibilities under ISAs (Ireland) are further described in the Auditors’ responsibilities for the audit of the financial statements section of our report. We believe that the audit evidence we have obtained is sufficient and appropriate to provide a basis for our opinion.
IndependenceWe remained independent of the group in accordance with the ethical requirements that are relevant to our audit of the financial statements in Ireland, which includes IAASA’s Ethical Standard as applicable to listed public interest entities, and we have fulfilled our other ethical responsibilities in accordance with these requirements.
To the best of our knowledge and belief, we declare that non-audit services prohibited by IAASA’s Ethical Standard were not provided to the group or the company.
Other than those disclosed in note 7 to the financial statements, we have provided no non-audit services to the group or the company in the period from 1 January 2019 to 31 December 2019.

70
Independent auditors’ report (continued)
Our audit approach
Overview
Materiality
Audit scope
Key audit matters
Materialityn €4.0 million (2018: €4.0 million) – Group financial statements
n Based on circa 1% of revenue.
n €960,000 (2018: €920,000) – Company financial statements
n Based on circa 1% of equity attributable to equity holders of the parent.
Audit scopen We performed a full scope audit of the complete financial information of the
group’s principal operating entity, FBD Insurance plc, and the holding company. We performed audit procedures on selected account balances of the group’s shared services entity, FBD Corporate Services Limited.
n Taken together, the entities where we performed a full scope audit of complete financial information and those selected balances at the group’s shared services entity on which we performed audit procedures accounted for in excess of 95% of group revenues, 95% of group profit before taxation and 90% of the group’s total assets.
Key audit mattersn Valuation of claims outstanding
The scope of our auditAs part of designing our audit, we determined materiality and assessed the risks of material misstatement in the financial statements. In particular, we looked at where the directors made subjective judgements, for example in respect of significant accounting estimates that involved making assumptions and considering future events that are inherently uncertain. As in all of our audits we also addressed the risk of management override of internal controls, including evaluating whether there was evidence of bias by the directors that represented a risk of material misstatement due to fraud.
Key audit mattersKey audit matters are those matters that, in the auditors’ professional judgement, were of most significance in the audit of the financial statements of the current period and include the most significant assessed risks of material misstatement (whether or not due to fraud) identified by the auditors, including those which had the greatest effect on: the overall audit strategy; the allocation of resources in the audit; and directing the efforts of the engagement team. These matters, and any comments we make on the results of our procedures thereon, were addressed in the context of our audit of the financial statements as a whole, and in forming our opinion thereon, and we do not provide a separate opinion on these matters. This is not a complete list of all risks identified by our audit.

FBD Holdings plc Annual Report 2019 71Strategic Report
Governance
Financial Statements
Other Inform
ation
Key audit matter How our audit addressed the key audit matter
Valuation of claims outstandingRefertopage48(ReportoftheAuditCommittee),pages93to94(groupaccountingpolicies),page103(criticalaccounting estimates and judgements in applying accounting policies) and pages 127 to 129 (note 27(a) to (c) tothegroupfinancialstatements).
The provision for claims outstanding is the group’s largest liability and its valuation involves considerable judgement.
The booked amount comprises:
n an actuarial best estimate of the ultimate settlement cost of claims incurred at the reporting date including claims incurred but not reported to the group; and
n a margin over actuarial best estimate to provide for the risk of adverse development of the actuarial best estimate and to cater for known risk factors not in the underlying data used to calculate the actuarial best estimate.
The actuarial best estimates is determined using complex actuarial calculations and requires the consideration of detailed methodologies, multiple assumptions and significant judgements. Methodologies and assumptions vary by class of business.
The key items underlying the calculations are past claims development patterns and assumptions in respect of expected loss ratios and the expected frequency, severity and duration of claims.
The valuation is also dependent on the completeness and accuracy of the data used in the actuarial modelling, in particular data relating to amounts of claims paid and incurred in the current and prior years.
As a result of the judgements and level of estimation detailed above, the valuation of claims outstanding was a key area of focus in our audit.
We performed procedures to understand the claims and actuarial reserving processes as they relate to financial reporting.
We tested the design and operating effectiveness of the controls over claims processing and payment and actuarial reserving. This testing included controls addressing the valuation of claims outstanding.
Based on the results of our risk assessment and materiality, we selected certain classes of business for independent valuation by our actuarial specialists using the group’s data.
The results of our independent valuation were compared to the group’s valuation to assess the reasonability of the estimate.
In respect of the segments not subject to independent valuation we assessed the group’s valuation with the assistance of our actuarial specialists. This involved:
n assessing the assumptions and methodologies underpinning management’s actuarial valuation; and
n considering the development of prior accident years’ estimates and analysis of the current accident year estimate, including consideration of the group’s historic claims experience, development in the Irish claims environment and our broader knowledge of developments in the insurance industry.
We assessed the rationale for the margin over actuarial best estimate with particular focus on the consideration of the appropriateness of changes in the amount since the prior year.
We tested the reconciliations of the data used in the actuarial models to the underlying systems and reconciled the actuarial valuation outputs to the financial statements.
Based on the results of these procedures we concluded that the valuation of claims outstanding included in the group’s financial statements is reasonable.
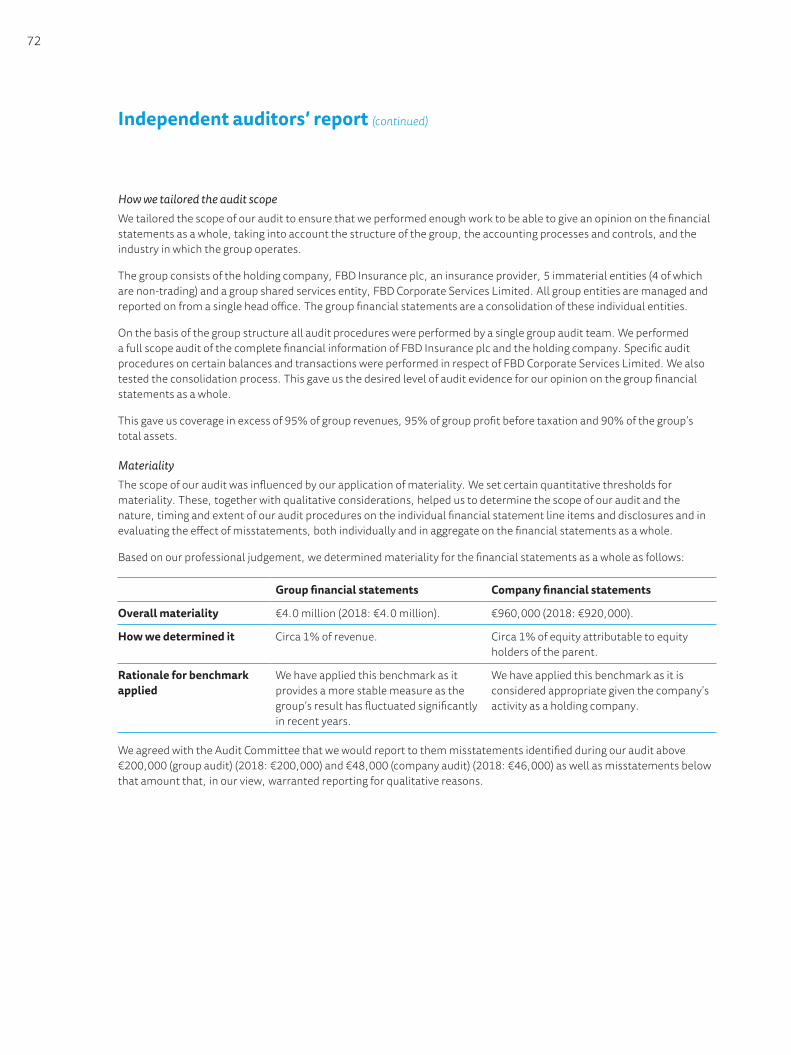
72
Independent auditors’ report (continued)
How we tailored the audit scopeWe tailored the scope of our audit to ensure that we performed enough work to be able to give an opinion on the financial statements as a whole, taking into account the structure of the group, the accounting processes and controls, and the industry in which the group operates.
The group consists of the holding company, FBD Insurance plc, an insurance provider, 5 immaterial entities (4 of which are non-trading) and a group shared services entity, FBD Corporate Services Limited. All group entities are managed and reported on from a single head office. The group financial statements are a consolidation of these individual entities.
On the basis of the group structure all audit procedures were performed by a single group audit team. We performed a full scope audit of the complete financial information of FBD Insurance plc and the holding company. Specific audit procedures on certain balances and transactions were performed in respect of FBD Corporate Services Limited. We also tested the consolidation process. This gave us the desired level of audit evidence for our opinion on the group financial statements as a whole.
This gave us coverage in excess of 95% of group revenues, 95% of group profit before taxation and 90% of the group’s total assets.
MaterialityThe scope of our audit was influenced by our application of materiality. We set certain quantitative thresholds for materiality. These, together with qualitative considerations, helped us to determine the scope of our audit and the nature, timing and extent of our audit procedures on the individual financial statement line items and disclosures and in evaluating the effect of misstatements, both individually and in aggregate on the financial statements as a whole.
Based on our professional judgement, we determined materiality for the financial statements as a whole as follows:
Group financial statements Company financial statements
Overall materiality €4.0 million (2018: €4.0 million). €960,000 (2018: €920,000).
How we determined it Circa 1% of revenue. Circa 1% of equity attributable to equity holders of the parent.
Rationale for benchmark applied
We have applied this benchmark as it provides a more stable measure as the group’s result has fluctuated significantly in recent years.
We have applied this benchmark as it is considered appropriate given the company’s activity as a holding company.
We agreed with the Audit Committee that we would report to them misstatements identified during our audit above €200,000 (group audit) (2018: €200,000) and €48,000 (company audit) (2018: €46,000) as well as misstatements below that amount that, in our view, warranted reporting for qualitative reasons.

FBD Holdings plc Annual Report 2019 73Strategic Report
Governance
Financial Statements
Other Inform
ation
Going concern In accordance with ISAs (Ireland) we report as follows:
Reporting obligation Outcome
We are required to report if we have anything material to add or draw attention to in respect of the directors’ statement in the financial statements about whether the directors considered it appropriate to adopt the going concern basis of accounting in preparing the financial statements and the directors’ identification of any material uncertainties to the group’s or the company’s ability to continue as a going concern over a period of at least twelve months from the date of approval of the financial statements.
We have nothing material to add or to draw attention to. However, because not all future events or conditions can be predicted, this statement is not a guarantee as to the group’s or the company’s ability to continue as a going concern.
We are required to report if the directors’ statement relating to going concern in accordance with Rule 6.1.82 (3) (a) of the Listing Rules for Euronext Dublin is materially inconsistent with our knowledge obtained in the audit.
We have nothing to report.
Reporting on other informationThe other information comprises all of the information in the Annual Report other than the financial statements and our auditors’ report thereon. The directors are responsible for the other information. Our opinion on the financial statements does not cover the other information and, accordingly, we do not express an audit opinion or, except to the extent otherwise explicitly stated in this report, any form of assurance thereon.
In connection with our audit of the financial statements, our responsibility is to read the other information and, in doing so, consider whether the other information is materially inconsistent with the financial statements or our knowledge obtained in the audit, or otherwise appears to be materially misstated. If we identify an apparent material inconsistency or material misstatement, we are required to perform procedures to conclude whether there is a material misstatement of the financial statements or a material misstatement of the other information. If, based on the work we have performed, we conclude that there is a material misstatement of this other information, we are required to report that fact. We have nothing to report based on these responsibilities.
With respect to the Report of the Directors, we also considered whether the disclosures required by the Companies Act 2014 (excluding the information included in the “Non Financial Statement” as defined by that Act on which we are not required to report) have been included.
Based on the responsibilities described above and our work undertaken in the course of the audit, ISAs (Ireland), the Companies Act 2014 (CA14) and the Listing Rules applicable to the company (Listing Rules) require us to also report certain opinions and matters as described below (required by ISAs (Ireland) unless otherwise stated).

74
Independent auditors’ report (continued)
Report of the Directorsn In our opinion, based on the work undertaken in the course of the audit, the information given in the Report of the
Directors (excluding the information included in the “Non Financial Statement” on which we are not required to report) for the year ended 31 December 2019 is consistent with the financial statements and has been prepared in accordance with the applicable legal requirements. (CA14)
n Based on our knowledge and understanding of the group and company and their environment obtained in the course of the audit, we did not identify any material misstatements in the Report of the Directors (excluding the information included in the “Non Financial Statement” Act on which we are not required to report). (CA14)
Corporate governance statementn In our opinion, based on the work undertaken in the course of the audit of the financial statements:
— the description of the main features of the internal control and risk management systems in relation to the financial reporting process; and
— the information required by Section 1373(2)(d) of the Companies Act 2014;
included in the Corporate Governance Statement, is consistent with the financial statements and has been prepared in accordance with section 1373(2) of the Companies Act 2014. (CA14)
n Based on our knowledge and understanding of the company and its environment obtained in the course of the audit of the financial statements, we have not identified material misstatements in the description of the main features of the internal control and risk management systems in relation to the financial reporting process and the information required by section 1373(2)(d) of the Companies Act 2014 included in the Corporate Governance Statement. (CA14)
n In our opinion, based on the work undertaken during the course of the audit of the financial statements, the information required by section 1373(2)(a),(b),(e) and (f) of the Companies Act 2014 and regulation 6 of the European Union (Disclosure of Non-Financial and Diversity Information by certain large undertakings and groups) Regulations 2017 is contained in the Corporate Governance Statement. (CA14)
The directors’ assessment of the prospects of the group and of the principal risks that would threaten the solvency or liquidity of the groupWe have nothing material to add or to draw attention to regarding:
n the directors’ confirmation on page 42 of the Annual Report that they have carried out a robust assessment of the principal risks facing the group, including those that would threaten its business model, future performance, solvency or liquidity.
n the disclosures in the Annual Report that describe those risks and explain how they are being managed or mitigated; or
n the directors’ explanation on page 42 of the Annual Report as to how they have assessed the prospects of the group, over what period they have done so and why they consider that period to be appropriate, and their statement as to whether they have a reasonable expectation that the group will be able to continue in operation and meet its liabilities as they fall due over the period of their assessment, including any related disclosures drawing attention to any necessary qualifications or assumptions.
We have nothing to report having performed a review of the directors’ statement that they have carried out a robust assessment of the principal risks facing the group and the directors’ statement in relation to the longer-term viability of the group. Our review was substantially less in scope than an audit and only consisted of making inquiries and considering the directors’ process supporting their statements; checking that the statements are in alignment with the relevant provisions of the UK Corporate Governance Code (the “Code”); and considering whether the statements are consistent with the knowledge and understanding of the group and the company and their environment obtained in the course of the audit. (Listing Rules)

FBD Holdings plc Annual Report 2019 75Strategic Report
Governance
Financial Statements
Other Inform
ation
Other Code provisionsWe have nothing to report in respect of our responsibility to report when:
n the statement given by the directors on page 68 that they consider the Annual Report taken as a whole to be fair, balanced and understandable and provides the information necessary for the members to assess the group’s and company’s position and performance, business model and strategy is materially inconsistent with our knowledge of the group and company obtained in the course of performing our audit;
n the section of the Annual Report on page 47 and 48 describing the work of the Audit Committee does not appropriately address matters communicated by us to the Audit Committee; or
n the directors’ statement relating to the company’s compliance with the Code and the Irish Corporate Governance Annex does not properly disclose a departure from a relevant provision of the Code or the Annex specified, under the Listing Rules, for review by the auditors.

76
Independent auditors’ report (continued)
Responsibilities for the financial statements and the audit
Responsibilities of the directors for the financial statementsAs explained more fully in the Directors’ Responsibilities Statement set out on page 68, the directors are responsible for the preparation of the financial statements in accordance with the applicable framework and for being satisfied that they give a true and fair view.
The directors are also responsible for such internal control as they determine is necessary to enable the preparation of financial statements that are free from material misstatement, whether due to fraud or error.
In preparing the financial statements, the directors are responsible for assessing the group’s and the company’s ability to continue as a going concern, disclosing as applicable, matters related to going concern and using the going concern basis of accounting unless the directors either intend to liquidate the group or the company or to cease operations, or have no realistic alternative but to do so.
Auditors’ responsibilities for the audit of the financial statementsOur objectives are to obtain reasonable assurance about whether the financial statements as a whole are free from material misstatement, whether due to fraud or error, and to issue an auditors’ report that includes our opinion. Reasonable assurance is a high level of assurance, but is not a guarantee that an audit conducted in accordance with ISAs (Ireland) will always detect a material misstatement when it exists. Misstatements can arise from fraud or error and are considered material if, individually or in the aggregate, they could reasonably be expected to influence the economic decisions of users taken on the basis of these financial statements.
A further description of our responsibilities for the audit of the financial statements is located on the IAASA website at:
https://www.iaasa.ie/getmedia/b2389013-1cf6-458b-9b8f-a98202dc9c3a/Description_of_auditors_responsibilities_for_audit.pdf
This description forms part of our auditors’ report.
Use of this reportThis report, including the opinions, has been prepared for and only for the company’s members as a body in accordance with section 391 of the Companies Act 2014 and for no other purpose. We do not, in giving these opinions, accept or assume responsibility for any other purpose or to any other person to whom this report is shown or into whose hands it may come save where expressly agreed by our prior consent in writing.
Other required reportingCompanies Act 2014 opinions on other mattersn We have obtained all the information and explanations
which we consider necessary for the purposes of our audit.
n In our opinion the accounting records of the company were sufficient to permit the company financial statements to be readily and properly audited.
n The Company Statement of Financial Position is in agreement with the accounting records.
Other exception reportingDirectors’ remuneration and transactionsUnder the Companies Act 2014 we are required to report to you if, in our opinion, the disclosures of directors’ remuneration and transactions specified by sections 305 to 312 of that Act have not been made. We have no exceptions to report arising from this responsibility.
We are required by the Listing Rules to review the six specified elements of disclosures in the report to shareholders by the Board on directors’ remuneration. We have no exceptions to report arising from this responsibility.
Prior financial year Non Financial StatementWe are required to report if the company has not provided the information required by Regulation 5(2) to 5(7) of the European Union (Disclosure of Non-Financial and Diversity Information by certain large undertakings and groups) Regulations 2017 in respect of the prior financial year. We have nothing to report arising from this responsibility.
FBD Holdings plc Annual Report 2019 77Strategic Report
Governance
Financial Statements
Other Inform
ation
AppointmentWe were appointed by the directors on 10 August 2016 to audit the financial statements for the year ended 31 December 2016 and subsequent financial periods. The period of total uninterrupted engagement is 4 years, covering the years ended 31 December 2016 to 31 December 2019.
Paraic Joyce for and on behalf of PricewaterhouseCoopers Chartered Accountants and Statutory Audit Firm Dublin 26 February 2020
n The maintenance and integrity of the FBD Group website is the responsibility of the directors; the work carried out by the auditors does not involve consideration of these matters and, accordingly, the auditors accept no responsibility for any changes that may have occurred to the financial statements since they were initially presented on the website.
n Legislation in the Republic of Ireland governing the preparation and dissemination of financial statements may differ from legislation in other jurisdictions.

78
Innovating our products and serviceDuring 2019 we added Environmental Liability cover for the first time to our Farm product. We launched a new Small Business product and a low mileage Motor product. We enabled a straight through digital journey for the motor customer that improves the customer experience and eliminates unnecessary paper. We improved claims fraud propensity modelling to help tackle fraudulent claims.
Protecting &
Evolving

FBD Holdings plc Annual Report 2019 79Strategic Report
Governance
Financial Statements
Other Inform
ation
“Representing Ireland is something I am very proud of and
the support from everyone gives me the confidence to believe I can
deliver a winning performance.”
Nhat Nguyen Badminton

80
Consolidated Income StatementFor the financial year ended 31 December 2019
2019 2018Note €000s €000s
Revenue 4(a) 394,639 396,003IncomeGross premium written 4(c) 370,063 371,504Reinsurance premiums 4(c) (31,836) (36,735)
Net premium written 4(c) 338,227 334,769Change in provision for unearned premiums 4(c) (674) 3,134
Net premium earned 4(c) 337,553 337,903Net investment return 5 17,892 2,482Financial services income – Revenue from contracts with customers 4(a) 4,268 3,754 – Other financial services income 4(a) 5,557 5,282Total income 365,270 349,421
ExpensesNet claims and benefits 4(c) (148,679) (183,367)Other underwriting expenses 4(c) (87,259) (84,054)Movement in other provisions 28 (7,946) (7,064)Financial services and other costs 4(e) (6,081) (6,548)Impairment of property, plant and equipment 13 (246) (1,034)Finance costs 29&30 (2,579) (5,453)Exceptional loss on purchase and cancellation of convertible debt 29 - (11,836)
Profit before taxation 6 112,480 50,065Income taxation charge 10 (14,255) (7,682)Profit for the financial year 98,225 42,383
Attributable to:Equity holders of the parent 98,225 42,383
Earnings per shareBasic 12 281 122Diluted 12 2761 1122
The ‘A’ ordinary shares of €0.01 each that are in issue have no impact on the earnings per share calculation.
1Dilutedearningspersharereflectsthepotentialvestingofsharebasedpayments.2Dilutedearningspersharereflectsthepotentialconversionofconvertibledebtupuntilthedateofpurchaseandcancellationoftheconvertibledebtandthepotentialvestingofsharebasedpayments.
The accompanying notes form an integral part of the financial statements. The financial statements were approved by the Board and authorised for issue on 26 February 2020.

FBD Holdings plc Annual Report 2019 81Strategic Report
Governance
Financial Statements
Other Inform
ation
Consolidated Statement of Comprehensive IncomeFor the financial year ended 31 December 2019
2019 2018
Note €000s €000s
Profit for the financial year 98,225 42,383
Itemsthatwillormaybereclassifiedtoprofitorlossinsubsequentperiods:
Net gain/(loss) on available for sale financial assets during the year 11,356 (7,744)
Gains transferred to the Consolidated Income Statement on disposal during the year (432) (101)
Taxation (charge)/credit relating to items that will or may be reclassified to profit or loss in subsequent periods (1,366) 981
Itemsthatwillnotbereclassifiedtoprofitorlossinsubsequentperiods:
Actuarial (loss)/gain on retirement benefit obligations 31(d) (4,236) 3,232
Taxation credit/(charge) relating to items not to be reclassified in subsequent periods 31(d) 530 (404)
Other comprehensive income/(expense) after taxation 5,852 (4,036)
Total comprehensive income for the financial year 104,077 38,347
Attributable to:
Equity holders of the parent 104,077 38,347

82
Consolidated Statement of Financial PositionAt 31 December 2019
ASSETS 2019 2018
Note €000s €000s
Property, plant and equipment 13 28,114 28,340
Policy administration system 14 38,603 40,152
Intangible assets 15 2,155 355
Investment property 16 18,693 18,310
Right of use assets 9 6,115 -
Loans 17 611 615
Deferred taxation asset 18 1,222 1,081
Financial assets
Available for sale investments 19(a) 811,986 795,717
Investments held for trading 19(a) 111,399 78,778
Deposits with banks 19(a) 60,000 70,998
983,385 945,493
Reinsurance assets
Provision for unearned premiums 27(e) 1 6
Claims outstanding 27(e) 66,349 80,919
66,350 80,925
Retirement benefit surplus 31(f) 8,723 12,944
Current taxation asset 20 3,949 3,949
Deferred acquisition costs 21 33,182 31,956
Other receivables 22 63,866 62,868
Cash and cash equivalents 23 94,982 77,639
Total assets 1,349,950 1,304,627

FBD Holdings plc Annual Report 2019 83Strategic Report
Governance
Financial Statements
Other Inform
ation
Consolidated Statement of Financial Position (continued)At 31 December 2019
EQUITY AND LIABILITIES 2019 2018
Note €000s €000s
Equity
Called up share capital presented as equity 24 21,409 21,409
Capital reserves 25(a) 22,811 20,430
Retained earnings 328,008 241,645
Equity attributable to ordinary equity holders of the parent 372,228 283,484
Preference share capital 26 2,923 2,923
Total equity 375,151 286,407
Liabilities
Insurance contract liabilities
Provision for unearned premiums 27(d) 183,545 182,875
Claims outstanding 27(c) 683,332 738,025
866,877 920,900
Other provisions 28 8,417 7,738
Subordinated debt 30 49,485 49,426
Lease liability 9 6,222 -
Deferred taxation liability 32 4,905 3,610
Current taxation liability 33 3,128 3,312
Payables 34(a) 35,765 33,234
Total liabilities 974,799 1,018,220
Total equity and liabilities 1,349,950 1,304,627
The accompanying notes form an integral part of the financial statements. The financial statements were approved by the Board and authorised for issue on 26 February 2020.
They were signed on its behalf by:
Liam Herlihy Fiona Muldoon Chairman Group Chief Executive

84
Consolidated Statement of Cash FlowsFor the financial year ended 31 December 2019
2019 2018Note €000s €000s
Cash flows from operating activitiesProfit before taxation 112,480 50,065Adjustments for: (Profit)/loss on investments held for trading (10,741) 4,411Exceptional loss on purchase and cancellation of convertible bond - 11,836Loss on investments available for sale 4,025 4,825Interest and dividend income (11,102) (12,072)Depreciation/amortisation 13,14&15 10,503 11,682Depreciation on right of use assets 9 771 -Share-based payment expense 39 2,381 704Revaluation of investment property 16 (290) (310)Impairment of property, plant and equipment 13 246 1,034Decrease in insurance contract liabilities (39,448) (20,480)Increase in other provisions 28 679 1,091Operating cash flows before movement in working capital 69,504 52,786(Increase)/decrease in receivables and deferred acquisition costs (2,839) 3,390Increase in payables 5,082 8,472Interest payments on convertible debt - (5,130)Interest payments on subordinated debt 30 (2,500) (589)Interest on lease liabilities 9 278 -Purchase of investments held for trading (29,689) (82,916)Sale of investments held for trading 7,807 45,075Cash generated from operations 47,643 21,088Interest and dividend income received 11,717 11,992Income taxes paid (14,129) -Net cash generated from operating activities 45,231 33,080Cash flows from investing activitiesPurchase of available for sale investments (152,656) (138,798)Sale of available for sale investments 143,289 89,101Purchase of property, plant and equipment & policy admin. system 13&14 (8,932) (13,003)Sale of property, plant and equipment 13 - 90Purchase of intangible assets 15 (1,935) (399)Decrease in loans and advances 17 4 66Decrease in deposits invested with banks 19(a) 10,998 124,987Net cash (used in)/generated from investing activities (9,232) 62,044Cash flows from financing activitiesOrdinary and preference dividends paid 35 (17,714) (8,602)Purchase and cancellation of convertible debt 29 - (86,059)Proceeds from issue of subordinated debt 30 - 50,000Principal elements of lease payments 9 (942) -Net cash used in financing activities (18,656) (44,661)Net increase in cash and cash equivalents 17,343 50,463Cash and cash equivalents at the beginning of the year 23 77,639 27,176Cash and cash equivalents at the end of the financial year 23 94,982 77,639
The accompanying notes form an integral part of the financial statements.

FBD Holdings plc Annual Report 2019 85Strategic Report
Governance
Financial Statements
Other Inform
ation
Consolidated Statement of Changes in EquityFor the financial year ended 31 December 2019
Calle
d up
shar
e ca
pita
l pr
esen
ted
as e
quity
Capi
tal r
eser
ves
Reta
ined
ear
ning
s
Oth
er re
serv
es
Attr
ibut
able
to o
rdin
ary
shar
ehol
ders
Pref
eren
ce sh
are
capi
tal
Tota
l equ
ity
€000s €000s €000s €000s €000s €000s €000s
Balance at 1 January 2018 21,409 19,726 212,259 18,232 271,626 2,923 274,549
Transitional adjustment IFRS 15 - - 2,404 - 2,404 - 2,404
Profit after taxation - - 42,383 - 42,383 - 42,383
Other comprehensive expense - - (4,036) - (4,036) - (4,036)
21,409 19,726 253,010 18,232 312,377 2,923 315,300
Dividends paid and approved on ordinary and preference shares - - (8,602) - (8,602) - (8,602)
Recognition of share based payments - 704 - - 704 - 704
Purchase and cancellation of convertible debt - - (2,763) (18,232) (20,995) - (20,995)
Balance at 31 December 2018 21,409 20,430 241,645 - 283,484 2,923 286,407
Profit after taxation - - 98,225 - 98,225 - 98,225
Other comprehensive income - - 5,852 - 5,852 - 5,852
21,409 20,430 345,722 - 387,561 2,923 390,484
Dividends paid and approved on ordinary and preference shares - - (17,714) - (17,714) - (17,714)
Recognition of share based payments - 2,381 - - 2,381 - 2,381
Balance at 31 December 2019 21,409 22,811 328,008 - 372,228 2,923 375,151

86
Company Statement of Financial PositionAt 31 December 2019
2019 2018
Note €000s €000s
ASSETS
Investments
Investment in subsidiaries 36 91,831 91,831
Financial assets 1 1
91,832 91,832
Cash and cash equivalents 734 59
Retirement benefit surplus 1,946 3,006
Deferred taxation asset 351 1,158
Other receivables 4,101 -
Total assets 98,964 96,055
EQUITY AND LIABILITIES
Equity
Called up share capital presented as equity 24 21,409 21,409
Capital reserves 25(b) 22,811 20,430
Retained earnings 48,930 46,647
Shareholders’ funds – equity interests 93,150 88,486
Preference share capital 26 2,923 2,923
Equity attributable to equity holders of the parent 96,073 91,409
Deferred taxation liability 243 368
Payables 34(b) 2,648 4,278
Total equity and liabilities 98,964 96,055
The Company’s movement in retained earnings is total comprehensive income for the financial year of €19,997,000 and dividend paid of €17,714,000 (2018: €7,497,000 and dividend paid of €8,602,000).
The accompanying notes form an integral part of the financial statements.
The financial statements were approved by the Board and authorised for issue on 26 February 2020.
They were signed on its behalf by:
Liam Herlihy Fiona Muldoon Chairman Group Chief Executive

FBD Holdings plc Annual Report 2019 87Strategic Report
Governance
Financial Statements
Other Inform
ation
Company Statement of Cash FlowsFor the financial year ended 31 December 2019
2019 2018
€000s €000s
Cash flows from operating activities
Profit before taxation 20,960 6,471
Adjustments for:
Share-based payment expense 2,381 704
Operating cash flows before movement in working capital 23,341 7,175
(Increase)/decrease in receivables (3,293) 899
Decrease in payables (1,659) (484)
Net cash generated from operating activities 18,389 7,590
Cash flows from investing activities
Decrease in deposits invested with banks - 850
Net cash generated from investing activities - 850
Cash flows from financing activities
Ordinary and preference dividends paid (17,714) (8,602)
Net cash used in financing activities (17,714) (8,602)
Net increase/(decrease) in cash and cash equivalents 675 (162)
Cash and cash equivalents at the beginning of the financial year 59 221
Cash and cash equivalents at the end of the financial year 734 59
The accompanying notes form an integral part of the financial statements.
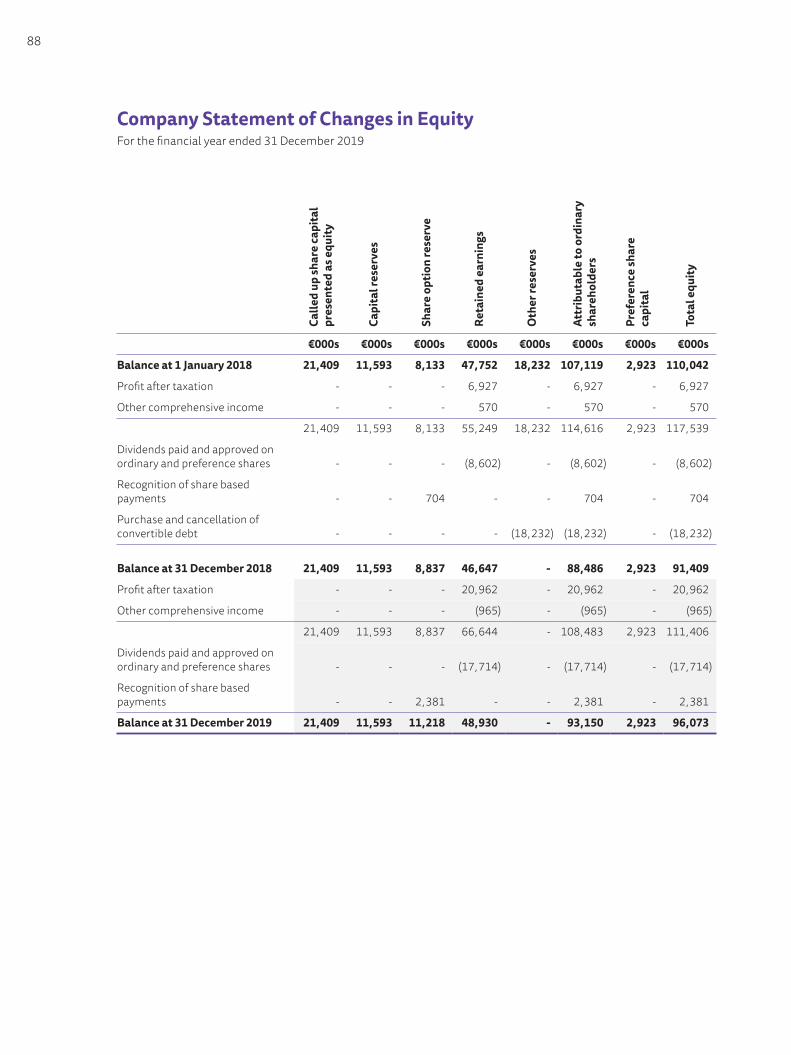
88
Company Statement of Changes in EquityFor the financial year ended 31 December 2019
Calle
d up
shar
e ca
pita
l pr
esen
ted
as e
quity
Capi
tal r
eser
ves
Shar
e op
tion
rese
rve
Reta
ined
ear
ning
s
Oth
er re
serv
es
Attr
ibut
able
to o
rdin
ary
shar
ehol
ders
Pref
eren
ce sh
are
capi
tal
Tota
l equ
ity
€000s €000s €000s €000s €000s €000s €000s €000s
Balance at 1 January 2018 21,409 11,593 8,133 47,752 18,232 107,119 2,923 110,042
Profit after taxation - - - 6,927 - 6,927 - 6,927
Other comprehensive income - - - 570 - 570 - 570
21,409 11,593 8,133 55,249 18,232 114,616 2,923 117,539
Dividends paid and approved on ordinary and preference shares - - - (8,602) - (8,602) - (8,602)
Recognition of share based payments - - 704 - - 704 - 704
Purchase and cancellation of convertible debt - - - - (18,232) (18,232) - (18,232)
Balance at 31 December 2018 21,409 11,593 8,837 46,647 - 88,486 2,923 91,409
Profit after taxation - - - 20,962 - 20,962 - 20,962
Other comprehensive income - - - (965) - (965) - (965)
21,409 11,593 8,837 66,644 - 108,483 2,923 111,406
Dividends paid and approved on ordinary and preference shares - - - (17,714) - (17,714) - (17,714)
Recognition of share based payments - - 2,381 - - 2,381 - 2,381
Balance at 31 December 2019 21,409 11,593 11,218 48,930 - 93,150 2,923 96,073

FBD Holdings plc Annual Report 2019 89Strategic Report
Governance
Financial Statements
Other Inform
ation
Notes to the Financial StatementsFor the financial year ended 31 December 2019
1 GENERAL INFORMATIONFBD Holdings plc is an Irish registered public limited company. The registration number of the company is 135882. The address of the registered office is given on page 33. The nature of the Group’s operations and its principal activities are set out in the Review of Operations on pages 8 to 11 and in the Report of the Directors on pages 38 to 43.
2 GOING CONCERNThe Directors have, at the time of approving the financial statements, a reasonable expectation that the Company and the Group have adequate resources to continue in operational existence for the foreseeable future. Thus they continue to adopt the going concern basis of accounting in preparing the financial statements. Further detail is contained in the Report of the Directors on pages 38 to 43.
3 SUMMARY OF SIGNIFICANT ACCOUNTING POLICIES
BASIS OF PREPARATIONThe Group and Company financial statements have been prepared in accordance with International Financial Reporting Standards (“IFRSs”) adopted by the European Union and therefore the Group financial statements comply with Article 4 of the EU IAS Regulation. The Group and Company financial statements are prepared in compliance with the Companies Acts 2014.
ADOPTION OF NEW AND REVISED INTERNATIONAL FINANCIAL REPORTING STANDARDS (“IFRSs”)
Standards adopted during the periodIn the current year, the Group has applied a number of amendments to IFRSs issued by the International Accounting Standards Board (IASB) that are mandatorily effective for an accounting period that begins on or after 1 January 2019.
n IFRS 16 Leasesn IFRIC 23 Uncertainty over Income tax treatmentsn Amendments to IAS 19 Employee Benefits
The adoption of these standards has not had a material impact on the financial statements of the Group. Further detail with respect to IFRS 16 Leases, is included below.
IFRS 16 LeasesIFRS 16 Leases became effective on 1 January 2019 and was adopted by the Group on that date. The Group has applied the modified retrospective approach and have not restated comparatives for the 2018 reporting period, as permitted under the specific transitional provisions in the standard.
The lease obligations were measured at the present value of the remaining lease payments, discounted using the Group’s Incremental Borrowing Rate (IBR) as of 1 January 2019. The weighted average IBR applied to the lease liabilities on 1 January 2019 was 4.41%.

90
Notes to the Financial Statements (continued)
3 SUMMARY OF SIGNIFICANT ACCOUNTING POLICIES (continued)
The adjustments recognised on adoption of IFRS 16 from the date of initial application are shown below:
Operating lease commitments disclosed as at 31 December 2018 €9.6m
Discounted using the Group’s incremental borrowing rate at the date of initial application €7.1m
Less short term leases recognised on a straight-line basis as an expense (€0.2m)
Lease liability as at 1 January 2019 €6.9m
On adoption of IFRS 16, the Group recognised a lease liability and a right of use asset for each of the leases which had previously been classified as ‘operating leases’ under the principles of IAS17 Leases. The right of use assets were measured at the amount equal to the lease liability, adjusted by the amount of any prepaid or accrued lease payments relating to that lease recognised in the Statement of Financial Position as at 31 December 2018. There were no onerous lease contracts that would have required an adjustment to the right of use assets at the date of initial application.
The Group has elected to apply the practical expedient permitted by the standard to recognise operating leases with a remaining lease term of less than 12 months as at 1 January 2019 as short-term leases. The Group has also elected to apply the practical expedient to use hindsight in determining the lease term where the contract contains options to extend or terminate the lease.
The adoption of IFRS 16 affected the following items on the Statement of Financial Position on 1 January 2019:
Right of use assets €6.9m Lease liability €6.9m
The adoption of IFRS 16 did not have a material impact on the key metrics or alternative performance measures (APMs) of the Group.
Standards and Interpretations not yet effective
IFRS 17 Insurance Contracts1
IFRS 9 Financial Instruments2
1 Effectiveforannualperiodsbeginningonorafter1January2022,withearlierapplicationpermitted.2 Consolidatedfinancialstatementsonly.Effectiveforannualperiodsbeginningonorafter1January2022,withearlier
applicationpermitted.
IFRS 17 Insurance ContractsIFRS 17 Insurance Contracts is effective for annual periods beginning on or after 1 January 2022.
IFRS 17 is expected to have a material impact on the consolidated financial statements of the Group. There is a project team in place and training has been provided on the impact of the new standard. The Group implementation programme is progressing in line with expectations.
IFRS 9 Financial Instruments in respect of the consolidated financial statements is being considered as part of the project for the adoption of IFRS 17 Insurance Contracts.
ACCOUNTING POLICIESThe principal accounting policies adopted by the Board are detailed below. All accounting policies are applicable to the consolidated and company financial statements unless stated otherwise.

FBD Holdings plc Annual Report 2019 91Strategic Report
Governance
Financial Statements
Other Inform
ation
3 SUMMARY OF SIGNIFICANT ACCOUNTING POLICIES (continued)
A) ACCOUNTING CONVENTIONThe consolidated and company financial statements are prepared under the historical cost convention as modified by the revaluation of property, investments held for trading, available for sale investments and investment property, which are measured at fair value.
B) BASIS OF CONSOLIDATIONThe consolidated financial statements include the financial statements of the Company and its subsidiary undertakings to 31 December. Control is achieved when the Company:
n has power over the investee;n is exposed, or has rights, to variable returns from its involvement with the investee; andn has the ability to use its power to affect its returns.
The Company reassesses whether or not it controls an investee if facts and circumstances indicate that there are changes to one or more of the elements of control listed above.
When the Company has less than a majority of the voting rights of an investee, it has power over an investee when the voting rights are sufficient to give it the practical ability to direct the relevant activities of the investee unilaterally. The Company considers all the relevant facts and circumstances in assessing whether or not the Company’s voting rights in an investee are sufficient to give it power, including:
n the size of the Company’s holding of voting rights relative to the size and dispersion of holdings of the other vote holders;
n potential voting rights held by the Company, other vote holders or other parties;n rights arising from other contractual arrangements; andn any additional facts and circumstances that indicate that the Company has, or does not have, the current
ability to direct the relevant activities at the time that decisions need to be made, including voting patterns at previous shareholders’ meetings.
Consolidation of a subsidiary begins when the Company obtains control over the subsidiary and ceases when the Company loses control of the subsidiary.
Profit or loss and each component of other comprehensive income are attributed to the owners of the Company and to the non-controlling interests. Total comprehensive income of subsidiaries is attributed to the owners of the Company and to the non-controlling interests even if this results in the non-controlling interests having a deficit balance.
All intra-Group transactions, balances, income and expenses are eliminated on consolidation.
Changes in the Group’s ownership interests in subsidiaries that do not result in a loss of control over the subsidiaries are accounted for as equity transactions. The carrying amount of the Group’s interests and the non-controlling interests are adjusted to reflect the changes in their relative interests in the subsidiaries. Any difference between the amount by which the non-controlling interests are adjusted and the fair value of the consideration paid or received is recognised directly in equity and attributed to the owners of the Company.

92
Notes to the Financial Statements (continued)
3 SUMMARY OF SIGNIFICANT ACCOUNTING POLICIES (continued)
B) BASIS OF CONSOLIDATION (continued)The acquisition of subsidiaries is accounted for using the acquisition method. The cost of the acquisition is measured as the aggregate of the fair values, at the date of exchange, of assets given, liabilities incurred or assumed, and equity instruments issued by the Group in exchange for control of the acquiree. Any transaction costs incurred are expensed in the period in which they occur. The acquiree’s identifiable assets, liabilities and contingent liabilities that meet the conditions for recognition under IFRS 3 are recognised at their fair value at the acquisition date, except for non-current assets (or disposal groups), that are classified as held for sale in accordance with IFRS 5, NonCurrentAssetsHeldforSaleandDiscontinuedOperations, which are recognised and measured at fair value less costs of sale.
Goodwill arising on acquisition is recognised as an asset and initially measured at cost, being the excess of the cost of the business combination over the Group’s interest in the net fair value of the identifiable assets, liabilities and contingent liabilities recognised. If, after reassessment, the Group’s interest in the net fair value of the acquiree’s identifiable assets, liabilities and contingent liabilities exceeds the cost of the business combination, the excess is recognised immediately in the Consolidated Income Statement.
When the Group loses control of a subsidiary, the profit or loss on the sale is calculated as the difference between (i) the aggregate of the fair value of the consideration received and the fair value of any retained interest and (ii) the previous carrying amount of the assets (including goodwill), less liabilities of the subsidiary and any non-controlling interests. Amounts previously recognised in the Consolidated Statement of Comprehensive Income in relation to the subsidiary are accounted for (i.e. reclassified to profit or loss or transferred directly to retained earnings) in the same manner as would be required if the relevant assets or liabilities are disposed of. The fair value of any investment retained in the former subsidiary at the date when control is lost is regarded as the fair value on initial recognition for subsequent accounting under IAS 39 FinancialInstruments:RecognitionandMeasurement or, when applicable, costs on initial recognition of an investment in an associate or jointly controlled entity.
C) INVESTMENTS IN SUBSIDIARIES (Company only)Investments in subsidiaries are accounted for at cost less accumulated impairment losses.
Dividend income from investments in subsidiaries is recognised when the Company’s right to receive has been established.
D) REVENUE RECOGNITIONRevenue is measured at the fair value of the consideration received or receivable and represents gross premiums written, broking commissions, fees, other commissions, interest and dividends receivable, rents receivable, net of discounts, levies, VAT and other sales related taxes.
Revenue from insurance contracts is accounted for in accordance with accounting policy (E).
Interest income is accrued on a time basis with reference to the principal outstanding at the effective interest rate applicable.
Broking commission is recognised as the Group satisfies its performance obligations. The Group’s performance obligation in relation to broking commissions is satisfied at the point in time when the underlying policy has been contractually agreed between the insured and the provider. The transaction price is the expected commission income receivable by the Group for the satisfaction of this performance obligation. The transaction price includes a variable consideration estimation on the basis that elements of commissions receivable are dependent on the outcome of future events, namely the underlying policies sold remaining in force, and are paid in future periods. Thus an expected level of lapses is applied to policies sold in order to calculate an appropriate commission receivable in relation to the satisfaction of the performance obligation.

FBD Holdings plc Annual Report 2019 93Strategic Report
Governance
Financial Statements
Other Inform
ation
3 SUMMARY OF SIGNIFICANT ACCOUNTING POLICIES (continued)
D) REVENUE RECOGNITION (continued)Fees for liability claims handling are recognised in the year to which they relate.
Dividend income from investments is recognised when the shareholders’ rights to receive payment have been established.
Rental income is recognised on a straight-line basis over the period of the lease.
E) INSURANCE CONTRACTS(i) Premiums written Premiums written relate to business incepted during the year, together with any difference between booked
premiums for prior years and those previously accrued, and include estimates of premiums due. Premiums written exclude taxes and duties levied on premiums.
(ii) Unearned premiums Unearned premiums are those portions of premium income written in the year that relate to insurance cover
after the year end. Unearned premiums are computed on a 365th of premium written. At 31 December each year, an assessment is made of whether the provision for unearned premiums is adequate as set out in accounting policy E (iv) below.
(iii) Deferred acquisition costs Deferred acquisition costs represent the proportion of acquisition costs, net of reinsurance, that are
attributable to the unearned premiums. Acquisition costs comprise the direct and indirect costs of obtaining and processing new insurance business. These costs are recognised as a deferred acquisition cost asset and amortised on the same basis as the related premiums are earned, and are tested for impairment at 31 December each year.
(iv) Unexpired risks At 31 December each year, an assessment is made of whether the provision for unearned premiums is
adequate. Provision for unexpired risks is made where the expected claims, related expenses and deferred acquisition costs are expected to exceed unearned premiums, after taking account of future investment income. At each reporting date, the Group reviews its unexpired risks and carries out a liability adequacy test for any overall excess of expected claims and deferred acquisition costs over unearned premiums, using the current estimates of future cash flows under its contracts after taking account of the investment return expected to arise on assets. If these estimates show that the carrying amount of its insurance liabilities (less related deferred acquisition costs) is insufficient in light of the estimated future cash flows, the deficiency is recognised in the Income Statement by setting up a provision in the Statement of Financial Position.
(v) Claims incurred Claims incurred comprise the cost of all insurance claims occurring during the year, whether reported or not,
and any adjustments to claims outstanding from previous years. Full provision, net of reinsurance recoveries, is made at the reporting date for the estimated cost of claims
incurred but not settled, including claims incurred but not yet reported and expenses to be incurred after the reporting date in settling those claims. The Group takes all reasonable steps to ensure that it has appropriate information regarding notified claims and uses this information when estimating the cost of those claims. Claims reserves are not discounted.

94
Notes to the Financial Statements (continued)
3 SUMMARY OF SIGNIFICANT ACCOUNTING POLICIES (continued)
E) INSURANCE CONTRACTS (continued)
(v) Claims incurred (continued) The Group uses estimation techniques, based on statistical analysis of past experience, to calculate the
estimated cost of claims outstanding at the year end. It is assumed that the development pattern of the current claims will be consistent with previous experience. Allowance is made, however, for any changes or uncertainties that may cause the cost of unsettled claims to increase or reduce. These changes or uncertainties may arise from issues such as the effects of inflation, changes in the mix of business or the legal environment.
Receivables arising out of direct insurance operations are measured at initial recognition at fair value and are subsequently measured at amortised cost, after recognising any impairment loss to reflect estimated irrecoverable amounts.
(vi) Reinsurance Premiums payable in respect of reinsurance ceded, are recognised in the period in which the reinsurance
contract is entered into and include estimates where the amounts are not determined at the reporting date. Premiums are expensed over the period of the reinsurance contract, calculated principally on a daily pro rata basis.
A reinsurance asset (reinsurers’ share of claims outstanding and provision for unearned premium) is recognised to reflect the amount estimated to be recoverable under the reinsurance contracts in respect of the outstanding claims reported under insurance liabilities. The amount recoverable from reinsurers is initially valued on the same basis as the underlying claims provision. The amount recoverable is reduced when there is an event arising after the initial recognition that provides objective evidence that the Group may not receive all amounts due under the contract and the event has a reliably measurable impact on the expected amount that will be recoverable from the reinsurer.
The reinsurers’ share of each unexpired risk provision is recognised on the same basis.
F) OTHER PROVISIONS The Group’s share of Motor Insurers’ Bureau of Ireland “MIBI” levy and related payments is based on its
estimated market share in the current year at the Statement of Financial Position date, and an estimate of the levy to be called by MIBI in the following 12 months.
The Group’s share of the Motor Insurers’ Insolvency Compensation Fund “MIICF” and related payments is based on 2% of the Group’s Motor premium for the year.
G) PROPERTY, PLANT AND EQUIPMENT(i) Property Property held for own use in the supply of services or for administrative purposes is stated at revalued
amounts, being the fair value at the date of revaluation which is determined by professional valuers. Revaluations are performed with sufficient regularity such that the carrying amount does not differ materially from that which would be determined using fair values at the reporting date. Any revaluation increase arising on the revaluation of such property is credited to the revaluation reserve except to the extent that it reverses a revaluation decrease for the same asset previously recognised. A decrease on revaluation is charged as an expense to the extent that it exceeds the balance, if any, held in the revaluation reserve relating to previous revaluation of that asset.
The gain or loss arising on the disposal or retirement of an asset is determined as the difference between the sales proceeds and the carrying amount of the asset and is recognised in the Income Statement.

FBD Holdings plc Annual Report 2019 95Strategic Report
Governance
Financial Statements
Other Inform
ation
3 SUMMARY OF SIGNIFICANT ACCOUNTING POLICIES (continued)
G) PROPERTY, PLANT AND EQUIPMENT (continued)
(ii) Computer equipment and fixtures and fittings Computer equipment and fixtures and fittings are stated at cost less accumulated depreciation and
accumulated impairment losses.
(iii) Depreciation Depreciation is provided in respect of computer equipment and fixtures and fittings, and is calculated in
order to write off the cost or valuation of the assets over their expected useful lives on a straight line basis over a three to ten year period. Depreciation on assets in development commences when the assets are ready for their intended use.
H) POLICY ADMINISTRATION SYSTEMThe Policy Administration System is stated at cost less accumulated amortisation and accumulated impairment losses. Amortisation is provided in respect of the Policy Administration System and is calculated in order to write off the cost of the asset over its expected useful life on a straight line basis over a five to ten year period.
I) INTANGIBLE ASSETSIntangible assets are valued at cost less accumulated amortisation and less any accumulated impairment losses. Intangible assets comprise computer software and these assets are amortised over expected useful lives on a straight line basis over a five year period.
J) INVESTMENT PROPERTYInvestment property, which is property held to earn rentals and/or for capital appreciation, is recognised initially at cost and stated at fair value at the reporting date being the value determined by qualified independent professional valuers. Gains or losses arising from changes in the fair value are recognised in the Income Statement for the period in which they arise.
An investment property is derecognised upon disposal or when the investment property is permanently withdrawn from use and no future economic benefits are expected. Any gain or loss arising on derecognition of the property (calculated as the difference between the net disposal proceeds and the carrying amount of the asset) is included in the Income Statement for the period in which the property is derecognised
K) FINANCIAL INSTRUMENTSFinancial assets and financial liabilities are recognised in the Statement of Financial Position when the Group becomes a party to the contractual provisions of the instrument.
The Group derecognises a financial asset only when the contractual rights to the cash flows of the asset expire, or when it transfers the financial asset and substantially all the risks and rewards of the ownership of the asset to another entity. If the Group neither transfers nor retains substantially all the risk and rewards of ownership and continues to control the transferred asset, the Group recognises its retained interest in the asset and an associated liability to the extent of its continuing involvement in the financial asset. If the Group retains substantially all the risks and rewards of ownership of a transferred financial asset, the Group continues to recognise the financial asset.
The Group derecognises financial liabilities when, and only when, the Group’s obligations are discharged, cancelled or they expire.

96
Notes to the Financial Statements (continued)
3 SUMMARY OF SIGNIFICANT ACCOUNTING POLICIES (continued)
K) FINANCIAL INSTRUMENTS (continued)
(i) Investments held for trading at fair value Investments held for trading are stated at fair value and include quoted shares, quoted debt securities and
collective investment schemes. They are recognised on a trade date basis at fair value and are revalued at subsequent reporting dates at fair value, using the closing bid price, with gains and losses being included in the Income Statement in the period in which they arise.
Investments are held for trading if:
n they have been acquired principally for the purpose of selling in the near future; orn they are part of an identified portfolio of financial instruments that the Group manages together and have
a recent actual pattern of short-term profit-making; orn they are derivatives that are not designated and effective as hedging instruments.
Investments other than investments held for trading may be designated at FVTPL (fair value through profit or loss) upon initial recognition if:
n such designation eliminates or significantly reduces a measurement or recognition inconsistency that would otherwise arise; or
n the investment forms part of a group of investments or financial liabilities or both, which is managed and its performance is evaluated on a fair value basis, in accordance with the Group’s documented Investment policy.
Financial assets at FVTPL are stated at fair value, with any gains or losses arising on remeasurement recognised in the Income Statement. The net gain or loss recognised in the Income Statement incorporates any dividend or interest earned on the financial asset and is included in the ‘net investment return’ line item in the Income Statement.
(ii) Available for sale investments Available for sale investments include quoted debt securities and unquoted investments, and are stated at
fair value where fair value can be reliably measured. Fair value is calculated using closing bid prices. They are recognised on a trade date basis at fair value, and are subsequently revalued at each reporting date to fair value, with gains and losses being included directly in the Statement of Comprehensive Income until the investment is disposed of or determined to be impaired, at which time the cumulative gain or loss previously recognised in the Statement of Comprehensive Income, is included in the Income Statement for the year.
(iii) Loans and other receivables
Loans Loans are recognised on a trade date basis at fair value plus transaction costs and are subsequently
measured at amortised cost using the effective interest rate method. When it is not possible to estimate reliably the cash flows or the expected life of a loan, the projected cash flows over the full term of the loan are used to determine fair value.
The effective interest method is a method of calculating the amortised cost of a debt instrument and of allocating interest income over the relevant period. The effective interest rate is the rate that exactly discounts estimated future cash receipts through the expected life of the debt instrument, or, where appropriate, a shorter period, to the net carrying amount at initial recognition.
FBD Holdings plc Annual Report 2019 97Strategic Report
Governance
Financial Statements
Other Inform
ation
3 SUMMARY OF SIGNIFICANT ACCOUNTING POLICIES (continued)
K) FINANCIAL INSTRUMENTS (continued)
(iii) Loans and other receivables (continued)
Other receivables Amounts arising out of direct insurance operations and other debtors are measured at initial recognition at
fair value and are subsequently measured at amortised cost, after recognising any impairment loss to reflect estimated irrecoverable amounts.
Other receivables (Company only) Amounts arising out of other debtors are measured at initial recognition at fair value and are subsequently
measured at amortised cost less expected credit losses. Expected credit losses is a forward looking measure of impairment calculated on a probability of credit losses basis.
(iv) Deposits with banks Term deposits with banks comprise cash held for the purpose of investment. Demand deposits with banks
are held for operating purposes and included in cash and cash equivalents. Deposits with banks and cash and cash equivalents are valued at amortised cost.
(v) Subordinated debt Subordinated debt issued by the Group comprise callable dated deferrable subordinated notes.
The financial liability is initially recognised at fair value of the subordinated notes net of costs. Subsequent to initial recognition, the subordinated debt is measured at amortised cost using the effective interest rate method.
Interest and amortisation relating to the financial liability is recognised in the Income Statement.
Applying IFRS 9 Financial Instruments with IFRS 4 Insurance Contracts (Amendments to IFRS 4) The Group applies the temporary exemption from IFRS 9 Financial Instruments, as defined in the
amendment “Applying IFRS 9 Financial Instruments with IFRS 4 Insurance Contracts – IFRS 4 amendments” issued by the IASB in September 2016, in its consolidated financial statements. This amendment allows an entity to defer the implementation of IFRS 9 if its activities are predominantly connected with insurance. As a result, the Group will continue to apply IAS 39, Financial Instrument: Recognition and Measurement in its consolidated financial statements until the reporting period beginning on 1 January 2022.
During 2018 the Group performed an assessment of the amendments and reached the conclusion that its activities were predominantly connected with insurance as at 31 December 2015. The Group’s percentage of its gross liabilities from contracts within the scope of IFRS 4 relative to its total liabilities at 31 December 2015 was 94.5% which is in excess of the 90% threshold required by IFRS 4. There has been no significant change to the activities of the Group requiring reassessment of the use of the temporary exemption from IFRS 9 to 31 December 2019.
IFRS 9 financial instruments deferral disclosures, as defined in IFRS 4, are included in Note 42.
L) LEASES(i) The Group as Lessor Rental income from operating leases is recognised on a straight-line basis over the term of the relevant lease.
Initial direct costs incurred in negotiating and arranging an operating lease are added to the carrying amount of the leased asset and recognised on a straight-line basis over the operating lease term.

98
Notes to the Financial Statements (continued)
3 SUMMARY OF SIGNIFICANT ACCOUNTING POLICIES (continued)
L) LEASES (continued)
(ii) The Group as Lessee 2018
For the 2018 comparative period; all of the Group’s leases qualified as operating leases under IAS17. Rentals payable under operating leases are charged to income on a straight-line basis over the term of the relevant lease. Benefits received and receivable as an incentive to enter into an operating lease are also spread on a straight-line basis over the operating lease term.
2019 For any new contracts entered into on or after 1 January 2019, the Group considers whether a contract is, or contains a lease. A lease is defined as ‘a contract, or part of a contract, that conveys the right to use an asset (the underlying asset) for a period of time in exchange for consideration’. To apply this definition the Group assesses whether the contract meets three key evaluations which are whether:
n the contract contains an identified asset, which is either explicitly identified in the contract or implicitly specified by being identified at the time the asset is made available to the Group;
n the Group has the right to obtain substantially all of the economic benefits from use of the identified asset throughout the period of use, considering its rights within the defined scope of the contract the Group has the right to direct the use of the identified asset throughout the period of use; and
n the Group assess whether it has the right to direct ‘how and for what purpose’ the asset is used throughout the period of use.
Measurement and recognition of leases as a lesseeAt lease commencement date, the lease liability is measured at the present value of the remaining lease payments, discounted using the Group’s incremental borrowing rate. The right of use asset is recognised as an amount equal to the lease liability, adjusted for amount of any prepaid or accrued lease payments relating to the lease.
The Group depreciates the right of use assets on a straight-line basis from the lease commencement date to the earlier of the end of the useful life of the right of use assets or the end of the lease term. The Group also assesses the right of use assets for impairment when such indicators exist.
Lease payments included in the measurement of the lease liability are made up of fixed payments, variable payments based on an index or rate, amounts expected to be payable under a residual value guarantee and payments arising from options reasonably certain to be exercised.
Subsequent to initial measurement, the liability will be reduced for payments made and increased for interest. It is re-measured to reflect any reassessment or modification, or if there are changes in in-substance fixed payments.
M) CASH AND CASH EQUIVALENTSCash and cash equivalents comprise cash on hand and demand deposits with maturities of 3 months or less held for the purpose of meeting short-term cash commitments rather than for investment or other purposes. Deposits with banks and cash and cash equivalents are valued at amortised cost.

FBD Holdings plc Annual Report 2019 99Strategic Report
Governance
Financial Statements
Other Inform
ation
3 SUMMARY OF SIGNIFICANT ACCOUNTING POLICIES (continued)
N) TAXATIONIncome tax expense or credit represents the sum of income tax currently payable and deferred income tax. Income tax currently payable is based on taxable profit for the year. Taxable profit differs from profit before tax as reported in the Consolidated Income Statement because it excludes items of income or expense that are taxable or deductible in other years and further excludes items that are not taxable or deductible. The Group’s liability for income tax is calculated using rates that have been enacted or substantively enacted at the reporting date. Income tax is recognised in the Income Statement except to the extent that it relates to items recognised directly in equity.
Deferred income tax is provided, using the liability method, on all differences between the carrying amounts of assets and liabilities for financial reporting purposes and the amounts used for taxation purposes. Deferred income tax assets and liabilities are measured at the tax rates that are expected to apply in the year when the asset is expected to be realised or the liability to be settled. Deferred tax assets are recognised for all deductible differences, carry forward of unused tax credits and unused tax losses, to the extent that it is probable that taxable profit will be available against which the deductible temporary differences and the carry forward of unused tax credits and unused tax losses can be utilised. The carrying amount of deferred income tax assets is reviewed at each reporting date and reduced to the extent that it is no longer probable that sufficient taxable profit would be available to allow all or part of the deferred income tax asset to be utilised.
Deferred taxation liabilities are recognised for taxable temporary differences arising on investments in subsidiaries except where the Group is able to control the reversal of the temporary differences and it is probable that the temporary differences will not reverse in the foreseeable future.
Deferred taxation assets and liabilities are offset when there is a legally enforceable right to set off current taxation assets against current taxation liabilities and when they relate to income taxes levied by the same taxation authority and the Group intends to settle on a net basis.
O) RETIREMENT BENEFITSThe Group provides either defined benefit or defined contribution retirement benefit schemes for the majority of its employees.
(i) Defined benefit scheme A full actuarial valuation of the scheme is undertaken every three years and is updated annually to reflect
current conditions in the intervening periods for the purposes of preparing the financial statements.
The liability or asset recognised in the Statement of Financial Position in respect of defined benefit pension plans is the present value of the defined benefit obligation at the end of the reporting period less the fair value of plan assets. The defined benefit obligation is calculated annually by independent actuaries using the projected unit credit method. The present value of the defined benefit obligation is determined by discounting the estimated future cash outflows using interest rates of high-quality corporate bonds that are denominated in the currency in which the benefits will be paid, and that have terms approximating to the terms of the related obligation. In countries where there is no deep market in such bonds, the market rates on government bonds are used.
The net interest cost is calculated by applying the discount rate to the net balance of the defined benefit obligation and the fair value of plan assets. This cost is included in employee benefit expense in the Income Statement.
Remeasurement gains and losses arising from experience adjustments and changes in actuarial assumptions are recognised in the period in which they occur, directly in other comprehensive income. They are included in retained earnings in the statement of changes in equity and in the Statement of Financial Position.
Changes in the present value of the defined benefit obligation resulting from plan amendments or curtailments are recognised immediately in the Income Statement as past service costs.

100
Notes to the Financial Statements (continued)
3 SUMMARY OF SIGNIFICANT ACCOUNTING POLICIES (continued)
(ii) Defined Contribution Schemes Costs arising in respect of the Group’s defined contribution retirement benefit schemes are charged to the
Income Statement in line with the service received.
P) CURRENCYFor the purpose of the consolidated financial statements, the results and financial position of each group company are expressed in euro, which is the functional currency of the Company, and the presentation currency for the consolidated financial statements.
In preparing the financial statements of the individual companies, transactions in currencies other than the entity’s functional currency (foreign currencies) are recognised at the rates of exchange prevailing on the dates of the transactions. At each Statement of Financial Position date, monetary assets and liabilities that are denominated in foreign currencies are retranslated at the rates prevailing at that date. Non-monetary items carried at fair value that are denominated in foreign currencies are translated at the rates prevailing at the date when the fair value was determined.
On consolidation, the assets and liabilities of the Group’s non Eurozone operations are translated at exchange rates prevailing on the reporting date. Income and expense items are translated at the average exchange rates for the period unless exchange rates fluctuate significantly, in which case the exchange rates at the date of transactions are used. Exchange differences that are classified as equity are transferred to the translation reserve. Such translation differences are recognised as income or expense in the period in which the operation is disposed.
Q) SHARE-BASED PAYMENTS AND LONG TERM INCENTIVE PLANSThe Group operates a long-term incentive plan based on market and non-market vesting conditions. The fair value of the market based awarded shares is determined at the date of grant using either the Black Scholes or Monte Carlo Simulation models. The fair value of the non-market based awarded shares is determined with reference to the share price of the Group at the date of grant. The cost is expensed in the Income Statement over the vesting period at the conclusion of which the employees become unconditionally entitled to the options. The corresponding amount to the expense is credited to a separate reserve in the Statement of Financial position. At each period end, the Group reviews its estimate of the number of options that it expects to vest and any adjustment relating to current and past vesting periods is brought to the Income Statement. The share awards are all equity settled.
R) TREASURY SHARESWhere any group company purchases the Company’s equity share capital, the consideration paid is shown as a deduction from ordinary shareholders’ equity. Consideration received on the subsequent sale or issue of treasury shares is credited to ordinary shareholders’ equity. Treasury shares are excluded when calculating earnings per share.
S) IMPAIRMENT OF ASSETS(i) Impairment of tangible and intangible assets At each reporting date, the Group reviews the carrying amounts of its tangible and intangible assets to
determine whether there is any indication that those assets have suffered an impairment loss. If any such indication exists, the recoverable amount of the asset is estimated to determine the extent of the impairment loss, if any. Where the asset does not generate cash flows that are independent from other assets, the Group estimates the recoverable amount of the cash generating unit to which the asset belongs.
The recoverable amount is the higher of the fair value less costs to sell and value in use. In assessing value in use, the estimated future cash flows are discounted to their present value using a pre-taxation discount rate that reflects current market assessments of the time value of money and the risks specific to the asset for which the estimates of future cash flows have not been adjusted.
FBD Holdings plc Annual Report 2019 101Strategic Report
Governance
Financial Statements
Other Inform
ation
3 SUMMARY OF SIGNIFICANT ACCOUNTING POLICIES (continued)
S) IMPAIRMENT OF ASSETS (continued)
(i) Impairment of tangible and intangible assets (continued) If the recoverable amount of an asset (or cash-generating unit) is estimated to be less than its carrying
amount, the carrying amount of the asset (or cash-generating unit) is reduced to its recoverable amount. A revaluation loss is recognised as an expense immediately, unless the relevant asset is carried at a revalued amount, in which case the impairment loss is treated as a revaluation decrease.
Where a revaluation loss subsequently reverses, the carrying amount of the asset (or cash-generating unit) is increased to the revised estimate of its recoverable amount, but so that the increased carrying amount does not exceed the carrying amount that would have been determined had no revaluation loss been recognised for the asset (or cash-generating unit) in prior years. A reversal of a revaluation loss, other than in relation to goodwill, is recognised as income immediately, unless the relevant asset is carried at a revalued amount, in which case the reversal of the revaluation loss is treated as a revaluation increase.
(ii) Impairment of financial assets Financial assets, other than those at FVTPL (fair value through profit or loss), are assessed for indicators of
impairment at each reporting date. Financial assets are impaired where there is objective evidence that, as a result of one or more events that occurred after the initial recognition of the financial assets, the estimated future cash flows of the investment have been impacted. For listed and unlisted equity investments classified as Available for Sale (“AFS”), a significant or prolonged decline in the fair value of the security below its cost is considered to be objective evidence of impairment.
For all other financial assets, objective evidence of impairment could include:
n significant financial difficulty of the issuer or counterparty; orn default or delinquency in interest or principal payments; orn it becoming probable that the borrower will enter bankruptcy or financial re-organisation.
For certain categories of financial asset, such as trade receivables, assets that are assessed not to be impaired individually are, in addition, assessed for impairment on a collective basis.
For financial assets carried at amortised cost, the amount of the impairment is the difference between the asset’s carrying amount and the present value of estimated future cash flows, discounted at the financial asset’s original effective interest rate.
The carrying amount of a financial asset is directly reduced by the impairment loss for all financial assets.
When an AFS financial asset is considered to be impaired, cumulative gains or losses previously recognised in the Statement of Comprehensive Income are reclassified to the Income Statement in the period.
With the exception of AFS equity instruments, if, in a subsequent period, the amount of the impairment loss decreases and the decrease can be related objectively to an event occurring after the impairment was recognised, the previously recognised impairment loss is reversed through the Income Statement, to the extent that the carrying amount of the investment at the date the impairment is reversed does not exceed what the amortised cost would have been had the impairment not been recognised.
In respect of AFS equity securities, impairment losses previously recognised in the Income Statement are not reversed through the Income Statement. Any increase in fair value subsequent to an impairment loss is recognised in the Statement of Comprehensive Income.

102
Notes to the Financial Statements (continued)
3 SUMMARY OF SIGNIFICANT ACCOUNTING POLICIES (continued)
T) RESTRUCTURING AND OTHER COSTSThe costs of the restructuring of the Group’s operations, such as redundancy costs, provision for lease termination costs or other rationalisation costs, are charged to the Income Statement when the decision to restructure is irrevocable and has been communicated to the parties involved.
U) OTHER FINANCIAL SERVICES INCOMEOther financial services income comprises interest on instalment premiums which is recognised on an effective interest method and other financial services income as detailed in accounting policy (D).
V) COMPOUND FINANCIAL INSTRUMENTSCompound financial instruments issued by the Group comprise convertible notes that can be converted to share capital at the option of the holder, when the number of shares to be issued is fixed.
The liability component of a compound financial instrument is recognised initially at the fair value of a similar liability that does not have an equity conversion option. The equity component is recognised initially at the difference between the fair value of the compound financial instrument as a whole and the fair value of the liability component.
Subsequent to initial recognition, the liability component of a compound financial instrument is measured at amortised cost using the effective interest rate method. The equity component of a compound financial instrument is not re-measured subsequent to initial recognition.
Interest relating to the financial liability is recognised in the Consolidated Income Statement. On conversion, the financial liability is reclassified to equity and no gain or loss is recognised.
W) EXCEPTIONAL GAINS OR LOSSESExceptional gains and losses are recognised in the period in which they are incurred and are reported in the Income Statement. Exceptional gains or losses are one-off items or items not in the ordinary course of business which have a material impact on the underlying profit.
X) CRITICAL ACCOUNTING ESTIMATES AND JUDGEMENTS IN APPLYING ACCOUNTING POLICIESThe principal accounting policies adopted by the Group are set out on pages 89 to 104. In the application of these accounting policies, the Directors are required to make judgements, estimates and assumptions about the carrying amount of assets and liabilities that are not readily apparent from other sources. There are no significant judgements exercised in the preparation of the financial statements and the key sources of estimation are detailed below. The estimates and associated assumptions are based on historical experience and other factors that are considered to be relevant. Actual results may differ from these estimates.
The estimates and underlying assumptions are reviewed on an ongoing basis. Revisions to accounting estimates are recognised in the period in which the estimate is revised if the revision affects only that period, or in the period of the revision and future periods if the revision affects both current and future periods.
The following are the critical estimates that the Directors have made in the process of applying the Group’s accounting policies and that have the most significant effect on the amounts recognised in the financial statements.

FBD Holdings plc Annual Report 2019 103Strategic Report
Governance
Financial Statements
Other Inform
ation
3 SUMMARY OF SIGNIFICANT ACCOUNTING POLICIES (continued)
X) CRITICAL ACCOUNTING ESTIMATES AND JUDGEMENTS IN APPLYING ACCOUNTING POLICIES (continued)
Claims provisionsClaims provisions represent the estimation of the cost of claims outstanding under insurance contracts written. Actuarial techniques, based on statistical analysis of past experience, are used to calculate the estimated cost of claims outstanding at year end. Allowance is made for any changes or uncertainties that may cause the cost of unsettled claims to increase or reduce. At each reporting date liability adequacy tests are performed to ensure the adequacy of the liabilities. Any deficiency is recognised in the Income Statement. Further details are set out in note 27 to the financial statements.
Reinsurance assetsThe Group spends substantial sums to purchase reinsurance protection from third parties and substantial claims recoveries from these reinsurers are included in the Statement of Financial Position at the reporting date. A reinsurance asset (reinsurers’ share of claims outstanding and provision for unearned premium) is recognised to reflect the amount estimated to be recoverable under the reinsurance contracts in respect of the outstanding claims reported under insurance liabilities. The amount recoverable from reinsurers is initially valued on the same basis as the underlying claims provision. The amount recoverable is reduced when there is an event arising after the initial recognition that provides objective evidence that the Group may not receive all amounts due under the contract and the event has a reliably measurable impact on the expected amount that will be recoverable from the reinsurer. To minimise default exposure, the Group’s policy is that all reinsurers should have a credit rating of A- or better or have provided alternative satisfactory security.
Property held for own useProperty held for own use in the supply of services or for administrative purposes is included in the Statement of Financial Position at fair value. Property valuations are affected by general economic and market conditions. The fair value of property held for own use is determined by valuations conducted at the reporting date by independent professional valuers, CB Richard Ellis, Valuation Surveyors. A decrease in the valuation of the property is charged as an expense to the Income Statement to the extent that it exceeds the balance, if any, held in the revaluation reserve relating to previous revaluation of that asset.
Properties are held at fair value less any subsequent depreciation in line with the accounting standard.
Valuation of financial instrumentsAs described in note 19, the Group uses valuation techniques that include inputs that are not based on observable market data to estimate the fair value of certain types of financial instruments. Note 19 provides detailed information about the key assumptions used in the determination of the fair value of financial instruments. The Directors believe that the chosen valuation techniques and assumptions used are appropriate in determining the fair value of financial instruments.
Deferred acquisition costsDeferred acquisition costs represent the proportion of net acquisition costs which are attributable to the unearned premiums. Acquisition costs comprise the direct and indirect costs of obtaining and processing new insurance business. These costs are recognised as a deferred acquisition cost asset and amortised on the same basis as the related premiums are earned, and are tested for impairment at 31 December each year.

104
Notes to the Financial Statements (continued)
3 SUMMARY OF SIGNIFICANT ACCOUNTING POLICIES (continued)
X) CRITICAL ACCOUNTING ESTIMATES AND JUDGEMENTS IN APPLYING ACCOUNTING POLICIES (continued)
Investment propertyInvestment property, which is property held to earn rentals and/or for capital appreciation, is recognised initially at cost and stated in the Statement of Financial Position at fair value at the reporting date. The fair value of investment property in Ireland is determined by valuations conducted at the reporting date by qualified independent professional valuers. Gains or losses arising from changes in the fair value are included in the Income Statement for the period in which they arise.
Accounting for the Defined Benefit Pension surplusThe valuation of the pension scheme is provided by the Group’s consultant actuaries. The critical accounting estimates and judgements in recognising the defined benefit pension surplus are the measurement of the defined pension obligation and the recoverability of the defined benefit asset.
The valuation of the defined benefit obligation is sensitive to actuarial assumptions. These include demographic assumptions covering mortality and longevity, and economic assumptions covering price inflation and the discount rate used.
The Directors have concluded that when all members have left the scheme, any surplus remaining would be returned to the employers in accordance with the trust deed. As such the full economic benefit of the surplus under IAS19 is deemed available to the employer and is recognised in the Statement of Financial Position.
Treatment of the purchase and cancellation of the Convertible BondThe allocation of debt and equity for the consideration paid for the purchase and cancellation of the convertible bond during the comparative period is a matter of judgement. As per the guidance of the accounting standards, the loss is split between the debt and equity components based on the fair values of each component at the time of the transaction. The Directors relied on the assistance of independent valuation experts in arriving at the allocation between the debt and equity components.
Note 41, Risk Management identifies the Group’s key sensitivity factors and tests the impact of a change in each one of these factors has on pre-taxation profit and shareholders’ equity.

FBD Holdings plc Annual Report 2019 105Strategic Report
Governance
Financial Statements
Other Inform
ation
4 SEGMENTAL INFORMATION
(a) Operating segmentsThe principal activities of the Group are underwriting of general insurance business and financial services.
For management purposes, the Group is organised in two operating segments - underwriting and financial services. These two segments are the basis upon which information is reported to the chief operating decision maker, the Group Chief Executive, for the purpose of resource allocation and assessment of segmental performance. Discrete financial information is prepared and reviewed on a regular basis for these two segments.
The following is an analysis of the Group’s revenue and results by reportable segments.
2019 Underwriting €000s
Financial services
€000sTotal
€000s
Revenue 384,814 9,825 394,639
Investment return 17,892 - 17,892
Finance costs (2,579) - (2,579)
Profit before taxation 108,736 3,744 112,480
Income taxation charge (13,592) (663) (14,255)
Profit after taxation 95,144 3,081 98,225
Other information
Capital additions 9,385 - 9,385
(Impairment)/Revaluation of other assets (1,908) 1,952 44
Depreciation/amortisation (10,503) - (10,503)
Statement of Financial Position
Segment assets 1,335,431 14,519 1,349,950
Segment liabilities 967,810 6,989 974,799
Included above in the current period is a net non-cash revaluation charge relating to investment property and property held for own use of €44,000 (2018: €724,000), of which a loss of €1,908,000 relates to the underwriting segment and a gain of €1,952,000 relates to the financial services segment.

106
Notes to the Financial Statements (continued)
4 SEGMENTAL INFORMATION (continued)
(a) Operating segments (continued)
2018 Underwriting €000s
Financialservices
€000sTotal
€000s
Revenue 386,967 9,036 396,003
Investment return 2,482 - 2,482
Finance costs (5,453) - (5,453)
Profit before taxation 47,577 2,488 50,065
Income taxation charge (7,165) (517) (7,682)
Profit after taxation 40,412 1,971 42,383
Other information
Capital additions 10,342 - 10,342
Impairment of other assets (724) - (724)
Depreciation (11,674) (8) (11,682)
Statement of Financial Position
Segment assets 1,292,719 11,908 1,304,627
Segment liabilities 1,011,473 6,747 1,018,220
The accounting policies of the reportable segments are the same as the Group accounting policies. Segment profit represents the profit earned by each segment. Central administration costs and Directors’ salaries are allocated based on actual activity. Restructuring costs and income taxation are direct costs of each segment.
In monitoring segment performance and allocating resources between segments:
n all assets are allocated to reportable segments. Assets used jointly by reportable segments are allocated on the basis of activity by each reportable segment; and
n all liabilities are allocated to reportable segments. Liabilities for which reportable segments are jointly liable are allocated in proportion to segment assets.

FBD Holdings plc Annual Report 2019 107Strategic Report
Governance
Financial Statements
Other Inform
ation
4 SEGMENTAL INFORMATION (continued)
(a) Operating segments (continued)An analysis of the Group’s revenue by product is as follows:
2019 2018
€000s €000s
Direct insurance – motor 182,586 181,858
Direct insurance – fire and other damage to property 107,399 110,859
Direct insurance – liability 74,690 73,200
Direct insurance – interest and other revenue 14,751 15,463
Direct insurance – other 5,388 5,587
Financial services revenue 9,825 9,036
Total revenue 394,639 396,003
The Group’s customer base is diverse and it has no reliance on any major customer. Insurance risk is not concentrated on any one area or on any one line of business.
(b) Geographical segmentsThe Group’s operations are located in Ireland.

108
Notes to the Financial Statements (continued)
4 SEGMENTAL INFORMATION (continued)
(c) Underwriting result2019 2019 2018 2018
€000s €000s €000s €000s
Earned premiums, net of reinsurance
Gross premium written 370,063 371,504
Outward reinsurance premiums (31,836) (36,735)
Net premium written 338,227 334,769
Change in provision for unearned premium
Gross amount (670) 3,133
Reinsurers’ share (4) 1
Change in net provision for unearned premium (674) 3,134
Premium earned, net of reinsurance 337,553 337,903
Claims paid, net of recoveries from reinsurers
Claims paid:
Gross amount (182,434) (203,793)
Reinsurers’ share 3,467 12,129
Claims paid, net of recoveries from reinsurers (178,967) (191,664)
Change in provision for claims
Gross amount 54,693 26,987
Reinsurers’ share (14,570) (9,642)
Change in insurance liabilities, net of reinsurance 40,123 17,345
Claims handling expenses (9,835) (9,048)
Claims incurred net of reinsurance (148,679) (183,367)
Motor insurers bureau of Ireland levy and related payments (7,946) (7,064)
Management expenses (86,499) (84,220)
Deferred acquisition costs 1,226 590
Gross management expenses (85,273) (83,630)
Reinsurers share of expenses 2,479 2,876
Broker commissions payable (4,465) (3,300)
Net operating expenses (87,259) (84,054)
Underwriting result 93,669 63,418
Net claims incurred in 2019 were €148,679,000, down 19% on the net claims incurred of €183,367,000 in 2018. The improvement is mainly as a result of an increase in positive prior year development in 2019 and an absence of weather and large claims.

FBD Holdings plc Annual Report 2019 109Strategic Report
Governance
Financial Statements
Other Inform
ation
4 SEGMENTAL INFORMATION (continued)The Group’s reinsurance policy dictates that all of the Group’s reinsurers must have a credit rating of A- or better, or provide alternative satisfactory security. The impact of buying reinsurance was a debit to the Consolidated Income Statement of €40,464,000 (2018: €31,370,000).
(d) Underwriting management expenses2019 2018
€000s €000sEmployee benefit expense 47,629 46,418Rent, rates, insurance and maintenance 6,367 6,497Depreciation/Amortisation 10,503 11,674Other 22,000 19,631Total underwriting management expenses 86,499 84,220
(e) Financial services and other costs2019 2018
€000s €000sEmployee benefit expense 3,553 3,280Rent, rates, insurance and maintenance 396 336Depreciation - 8Other 2,132 2,924Total financial services and other costs 6,081 6,548
5 NET INVESTMENT RETURN2019 2018
€000s €000sActual returnInterest and similar income 11,658 11,899Net income from investment properties 554 596Realised losses on investments (814) (1,193)Dividend income 59 94Revaluation of investment properties 290 310Unrealised gains/(losses) on financial investments 6,145 (9,224)Total investment income 17,892 2,482
By classification of investmentDeposits with banks 10 81Investments held for trading 10,649 (4,417)Investment properties 843 906Available for sale investments 6,390 5,912Total investment income 17,892 2,482
Interest and similar income received by the Group’s underwriting segment during the period was €12,271,000 (2018: €12,589,000).

110
Notes to the Financial Statements (continued)
6 PROFIT BEFORE TAXATION2019 2018
€000s €000s
Profit before taxation has been stated after charging:
Depreciation and amortisation 10,503 11,682
The remuneration of the Directors is disclosed in the audited section of the Report on Directors’ Remuneration on pages 57 to 67. These disclosures form an integral part of the financial statements.
7 INFORMATION RELATING TO AUDITORS’ REMUNERATIONAn analysis of fees payable to the statutory audit firm is as follows:
2019 2018
Company Group Company Group
€000s €000s €000s €000s
Description of service
Audit of statutory financial statements 65 296 60 275
Other assurance services - 116 - 142
Total auditors’ remuneration 65 412 60 417
Fees payable by the Company are included with the fees payable by the Group in each category.
In 2019, other assurance services relate to Solvency II audit which are prescribed under legislation or regulation.
In 2018, this category related to Solvency II audit and fees in respect of the issue of the subordinated debt.
8 STAFF COSTS AND NUMBERSThe average number of persons employed by the Group was as follows:
2019 2018
Underwriting 887 875
Financial services 28 25
Total 915 900
2019 2018
The aggregate employee benefit expense was as follows: €000s €000s
Wages and salaries 47,505 45,803
Social welfare costs 5,530 5,236
Pension costs 3,867 4,907
Share based payments 2,381 704
Total employee benefit expense 59,283 56,650
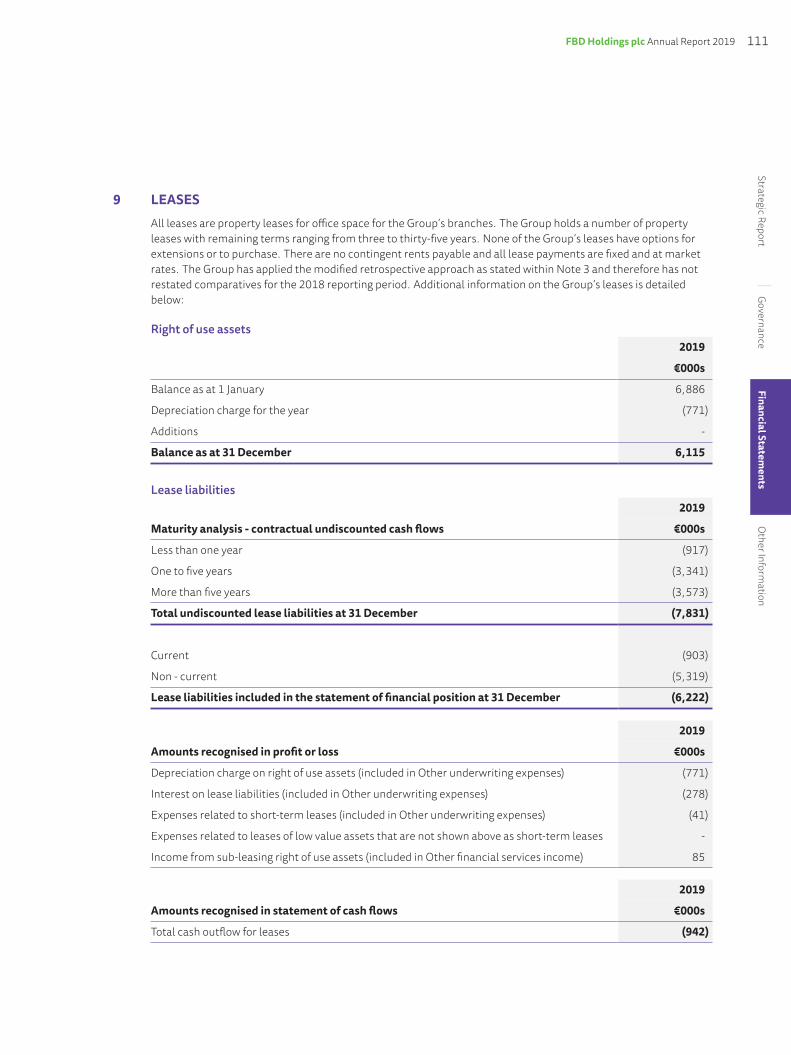
FBD Holdings plc Annual Report 2019 111Strategic Report
Governance
Financial Statements
Other Inform
ation
9 LEASESAll leases are property leases for office space for the Group’s branches. The Group holds a number of property leases with remaining terms ranging from three to thirty-five years. None of the Group’s leases have options for extensions or to purchase. There are no contingent rents payable and all lease payments are fixed and at market rates. The Group has applied the modified retrospective approach as stated within Note 3 and therefore has not restated comparatives for the 2018 reporting period. Additional information on the Group’s leases is detailed below:
Right of use assets2019
€000s
Balance as at 1 January 6,886
Depreciation charge for the year (771)
Additions -
Balance as at 31 December 6,115
Lease liabilities2019
Maturity analysis - contractual undiscounted cash flows €000s
Less than one year (917)
One to five years (3,341)
More than five years (3,573)
Total undiscounted lease liabilities at 31 December (7,831)
Current (903)
Non - current (5,319)
Lease liabilities included in the statement of financial position at 31 December (6,222)
2019
Amounts recognised in profit or loss €000s
Depreciation charge on right of use assets (included in Other underwriting expenses) (771)
Interest on lease liabilities (included in Other underwriting expenses) (278)
Expenses related to short-term leases (included in Other underwriting expenses) (41)
Expenses related to leases of low value assets that are not shown above as short-term leases -
Income from sub-leasing right of use assets (included in Other financial services income) 85
2019
Amounts recognised in statement of cash flows €000s
Total cash outflow for leases (942)

112
Notes to the Financial Statements (continued)
10 INCOME TAXATION CHARGE2019 2018
€000s €000sIrish corporation taxation charge (13,967) (3,140)Adjustments in respect of prior financial years 30 186
Current taxation charge (13,937) (2,954)Deferred taxation charge (318) (4,728)Income taxation charge (14,255) (7,682)
The taxation charge in the Consolidated Income Statement is higher than the standard rate of corporation taxation in Ireland. The differences are explained below:
2019 2018€000s €000s
Profit before taxation 112,480 50,065Corporation taxation charge at standard rate of 12.5% (2018: 12.5%) 14,060 6,258Effects of:Differences between capital allowances for period and depreciation - (94)Non-taxable income/unrealised gains/losses not chargeable/ deductible for taxation purposes (38) 1,682Higher rates of taxation on other income 263 22Adjustments in respect of prior years (30) (186)Income taxation charge 14,255 7,682Taxation as a percentage of profit before taxation 12.7% 15.3%
In addition to the amount charged to the Consolidated Income Statement, the following taxation amounts have been recognised directly in the Consolidated Statement of Comprehensive Income:
2019 2018€000s €000s
Deferred taxation on:Actuarial loss/(gain) on retirement benefit obligations 530 (404)(Gain)/loss on available for sale investments (1,366) 981Total income taxation (charge)/credit recognised directly in the Consolidated Statement of Comprehensive Income (836) 577
11 PROFIT FOR THE YEARThe Company’s profit for the financial year determined in accordance with IFRS, as adopted by the European Union, is €20,962,000 (2018: €6,927,000). The Company’s other comprehensive expense for the financial year is €965,000 (2018 other comprehensive income: €570,000).
In accordance with section 304 of the Companies Act 2014 the Company is availing of the exemption from presenting its individual Income Statement to the Annual General Meeting and from filing it with the Registrar of Companies.
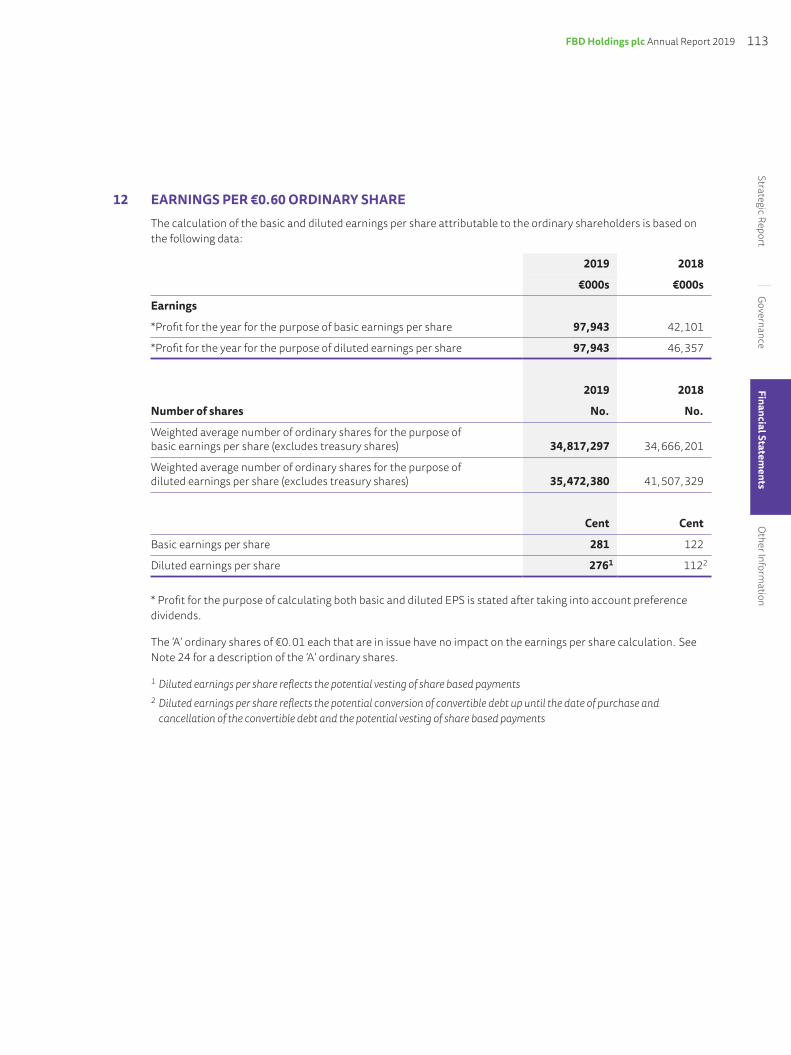
FBD Holdings plc Annual Report 2019 113Strategic Report
Governance
Financial Statements
Other Inform
ation
12 EARNINGS PER €0.60 ORDINARY SHAREThe calculation of the basic and diluted earnings per share attributable to the ordinary shareholders is based on the following data:
2019 2018
€000s €000s
Earnings
*Profit for the year for the purpose of basic earnings per share 97,943 42,101
*Profit for the year for the purpose of diluted earnings per share 97,943 46,357
2019 2018
Number of shares No. No.
Weighted average number of ordinary shares for the purpose of basic earnings per share (excludes treasury shares) 34,817,297 34,666,201
Weighted average number of ordinary shares for the purpose of diluted earnings per share (excludes treasury shares) 35,472,380 41,507,329
Cent Cent
Basic earnings per share 281 122
Diluted earnings per share 2761 1122
* Profit for the purpose of calculating both basic and diluted EPS is stated after taking into account preference dividends.
The ‘A’ ordinary shares of €0.01 each that are in issue have no impact on the earnings per share calculation. See Note 24 for a description of the ‘A’ ordinary shares.
1Dilutedearningspersharereflectsthepotentialvestingofsharebasedpayments2Dilutedearningspersharereflectsthepotentialconversionofconvertibledebtupuntilthedateofpurchaseandcancellationoftheconvertibledebtandthepotentialvestingofsharebasedpayments

114
Notes to the Financial Statements (continued)
13 PROPERTY, PLANT AND EQUIPMENT
Property held for
own useComputer
Equipment
Fixtures &
Fittings
Total property,plant and
equipment€000s €000s €000s €000s
Cost or valuation
At 1 January 2018 20,889 92,110 21,113 134,112
Additions 3,555 1,378 1,022 5,955
Assets under development - 1,452 595 2,047
Disposals (90) - - (90)
At 1 January 2019 24,354 94,940 22,730 142,024
Additions - 1,875 1,817 3,692
Assets under development - 826 - 826
Reclassification to investment property (130) - - (130)
At 31 December 2019 24,224 97,641 24,547 146,412
Comprising:
At cost - 97,641 24,547 122,188
At valuation 24,224 - - 24,224
At 31 December 2019 24,224 97,641 24,547 146,412
Property held for
own useComputer
Equipment
Fixtures &
Fittings
Total property,plant and
equipment€000s €000s €000s €000s
Accumulated depreciation and revaluation
At 1 January 2018 6,135 82,172 18,507 106,814
Depreciation charge for the year - 5,309 527 5,836
Impairment 1,034 - - 1,034
At 1 January 2019 7,169 87,481 19,034 113,684
Depreciation charge for the year - 3,734 671 4,405
Reclassification to investment property (37) - - (37)
Impairment 246 - - 246
At 31 December 2019 7,378 91,215 19,705 118,298
Carrying amount
At 31 December 2019 16,846 6,426 4,842 28,114
At 31 December 2018 17,185 7,459 3,696 28,340

FBD Holdings plc Annual Report 2019 115Strategic Report
Governance
Financial Statements
Other Inform
ation
13 PROPERTY, PLANT AND EQUIPMENT (CONTINUED)
Property held for own useProperties held for own use at 31 December 2019 and 2018 were valued at fair value which is determined by independent external professional valuers CB Richard Ellis, Valuation Surveyors. The valuers confirm that the properties have been valued by a valuer who is qualified for the purpose of the valuation in accordance with RICS Valuation – Global Standards 2017 (Red Book) incorporating the IVSC International Valuation Standards issued June 2017.
The valuation report states that the valuations have been prepared on the basis of “Market Value” which is defined in the report as “theestimatedamountforwhichanassetorliabilityshouldexchangeonvaluationdatebetweenawillingbuyerandawillingsellerinanarm’s-lengthtransaction,afterpropermarketingwherethepartieshadeachactedknowledgeably,prudentlyandwithoutcompulsion”. The report also states that the market value “hasbeenprimarilyderivedusingcomparablerecentmarkettransactionsonarm’slengthterms”.
The valuers state that they made various assumptions as to tenure, letting, taxation, town planning and the condition and repair of buildings and sites, including ground and groundwater contamination. They have determined market value using a range of capital values per square metre based on appropriate local evidence. The valuer states that they have not viewed any tenancy agreements and have assumed for the purposes of valuation that the properties (with the exception of FBD Offices at Lakepoint Retail Park Mullingar, Mullingar, Co. Westmeath) are subject to vacant possession.
The Directors believe that the market value, determined by independent professional valuers is not materially different to fair value.
Had the property been carried at historical cost less accumulated depreciation and accumulated revaluation losses, their carrying amount would have been as follows:
2019 2018
€000s €000s
Property held for own use 16,767 17,111
Fair value hierarchy disclosures required by IFRS13 FairValueMeasurement have been included in Note 19, FinancialInstrumentsandFairValueMeasurement.

116
Notes to the Financial Statements (continued)
14 POLICY ADMINISTRATION SYSTEMThe most significant investment by the Group in recent years is in its underwriting policy administration system. The Group’s policy administration system, TIA is the principal operating and core technology platform of the business.
Cost
Policy Admin System
€000s
At 1 January 2018 48,376
Additions 3,988
Assets under development 1,013
Disposals -
At 1 January 2019 53,377
Additions 4,414
Assets under development -
Disposals -
At 31 December 2019 57,791
Accumulated amortisation
Policy Admin System
€000s
At 1 January 2018 7,423
Amortisation charge for the year 5,802
At 1 January 2019 13,225
Amortisation charge for the year 5,963
At 31 December 2019 19,188
Carrying amount
At 31 December 2019 38,603
At 31 December 2018 40,152

FBD Holdings plc Annual Report 2019 117Strategic Report
Governance
Financial Statements
Other Inform
ation
15 INTANGIBLE ASSETSComputerSoftware
€000s
Cost:
Cost as at 1 January 2018 -
Additions 399
Cost as at 31 December 2018 399
Additions 1,279
Assets under development 656
Cost as at 31 December 2019 2,334
Accumulated Amortisation:
Accumulated amortisation as at 1 January 2018 -
Amortisation charge for the year (44)
Amortised as at 31 December 2018 (44)
Amortisation charge for the year (135)
Amortised as at 31 December 2019 (179)
Net book value at beginning of year 355
Net book value at end of year 2,155
16 INVESTMENT PROPERTY2019 2018
Fair value of investment property €000s €000s
At 1 January 18,310 18,000
Net gains or losses from fair value adjustments 290 310
Reclassification from property, plant & equipment 93 -
At 31 December 18,693 18,310
Investment property includes commercial rental property in Dublin city centre and land in the United Kingdom.
The investment property held for rental in Ireland was valued at fair value at 31 December 2019 and at 31 December 2018 by independent external professional valuers, CB Richard Ellis, Valuation Surveyors. The valuation was prepared in accordance with RICS Valuation – Global Standards 2017 (Red Book) incorporating the IVSC International Valuation Standards issued June 2017. The valuers confirm that they have sufficient current local and national knowledge of the particular property market involved and have skills and understanding to undertake the valuations competently.

118
Notes to the Financial Statements (continued)
16 INVESTMENT PROPERTY (continued)
The valuation statement received from the external professional valuers state that the valuations have been prepared on the basis of “MarketValue”which they define as “theestimatedamountforwhichapropertyshouldexchangeonthedateofvaluationbetweenawillingbuyerandawillingsellerinanarm’s-lengthtransactionafterpropermarketingwhereinthepartieshadeachactedknowledgeably,prudentlyandwithoutcompulsion”.
The land held in the United Kingdom is under price negotiation under the terms of an option agreement with a third party developer and as at 31 December 2019 the property has been included within the financial statements at a value relying on a letter from Sheldon Bosley Knight, Land and Property Professionals regulated by the Royal Institution of Chartered Surveyors, with offices in South Warwickshire.
The Directors believe that market value, determined by independent external professional valuers, is not materially different to the fair value.
There was a net increase in the fair value in 2019 of €290,000 (2018: €310,000).
The rental income earned by the Group from its investment properties amounted to €901,000 (2018: €1,028,000). Direct operating costs associated with investment properties amounted to €343,000 (2018: €250,000).
The historical cost of investment property is as follows:
2019 2018
€000s €000s
Historical cost at 1 January 20,080 20,080
Reclassification from Owner Occupied 130 -
Historical cost at 31 December 20,210 20,080
2019 2018
Non-cancellable operating lease receivables €000s €000s
Not longer than 1 year 704 1,027
Longer than 1 year and not longer than 5 years 2,817 4,107
Total non-cancellable operating lease receivables 3,521 5,134
Fair value hierarchy disclosures required by IFRS13 Fair Value Measurement have been included in Note 19, Financial Instruments and Fair Value Measurement.
17 LOANS2019 2018
€000s €000s
Other loans 611 615
Total loans 611 615
Fair value hierarchy disclosures required by IFRS13 FairValueMeasurement have been included in Note 19, Financial Instruments and Fair Value Measurement.

FBD Holdings plc Annual Report 2019 119Strategic Report
Governance
Financial Statements
Other Inform
ation
18 DEFERRED TAXATION ASSETAccelerated
capital allowances
Insurance Contracts
Losses carried
forward
Other timing
differences Total
€000s €000s €000s €000s €000s
At 1 January 2018 668 (1,830) 6,629 - 5,467
(Debited)/credited to Consolidated Income Statement (82) 915 (5,389) 170 (4,386)
At 31 December 2018 586 (915) 1,240 170 1,081
(Debited)/credited to Consolidated Income Statement (351) 915 (691) 268 141
At 31 December 2019 235 - 549 438 1,222
A deferred taxation asset of €549,000 (2018: €1,240,000) has been recognised in respect of losses carried forward. The Directors have considered and are satisfied that the deferred taxation asset will be fully recoverable against future taxable profits.
19 FINANCIAL INSTRUMENTS AND FAIR VALUE MEASUREMENT
(a) Financial Instruments2019 2018
€000s €000s
Financial Assets
At Amortised Cost:
Deposits with banks 60,000 70,998
Cash and cash equivalents 94,982 77,639
Loans 611 615
Other receivables 63,866 62,868
At fair value:
Available for sale investments 811,986 795,717
Investments held for trading 111,399 78,778
Financial Liabilities
At Amortised Cost:
Payables 35,765 33,234
Subordinated debt (Note 30) 49,485 49,426

120
Notes to the Financial Statements (continued)
19 FINANCIAL INSTRUMENTS AND FAIR VALUE MEASUREMENT (continued)
(b) Fair value measurementThe following table compares the carrying value of financial instruments not held at fair value with the fair value of those assets and liabilities:
2019Fair value
€000s
2019Carrying value
€000sAssetsLoans 733 611
LiabilitiesSubordinated debt 53,148 49,485
2018Fair value
€000s
2018Carrying value
€000sAssetsLoans 738 615
LiabilitiesSubordinated debt 49,817 49,426
The exemption from disclosing the fair value of short term receivables has been availed of.
Certain assets and liabilities are measured in the Statement of Financial Position at fair value using a fair value hierarchy of valuation inputs. The following table provides an analysis of assets and liabilities that are measured subsequent to initial recognition at fair value, grouped into Levels 1 to 3 based on the degree to which the fair value is observable.
Level 1 Fair value measurements derived from quoted prices (unadjusted) in active markets for identical assets or liabilities.n Available for sale investments – quoted debt securities are fair valued using latest available closing bid
price. Collective investment schemes, held for trading (Level 1) are valued using the latest available closing NAV of the fund.
Level 2 Fair value measurements derived from inputs other than quoted prices included within Level 1 that are observable for the asset or liability, either directly (i.e. as prices) or indirectly (i.e. derived from prices).n Investment property and property held for own use were fair valued by independent external
professional valuers at 31 December 2019 (refer to note 13 and note 16 in the Group Annual Report for year ended 31 December 2019).
Level 3 Fair value measurements derived from valuation techniques that include inputs for the asset or liability that are not based on observable market data (unobservable inputs). Among the valuation techniques used are cost, net asset or net book value or the net present value of future cash flows based on operating projections which are considered an approximation of fair value.n Collective investment schemes held for trading (Infrastructure and Senior Private Debt funds) are
valued using the most up-to-date valuations calculated by the fund administrator allowing for any additional investments made up until year end.
n AFS unquoted investment securities are mainly valued at cost.
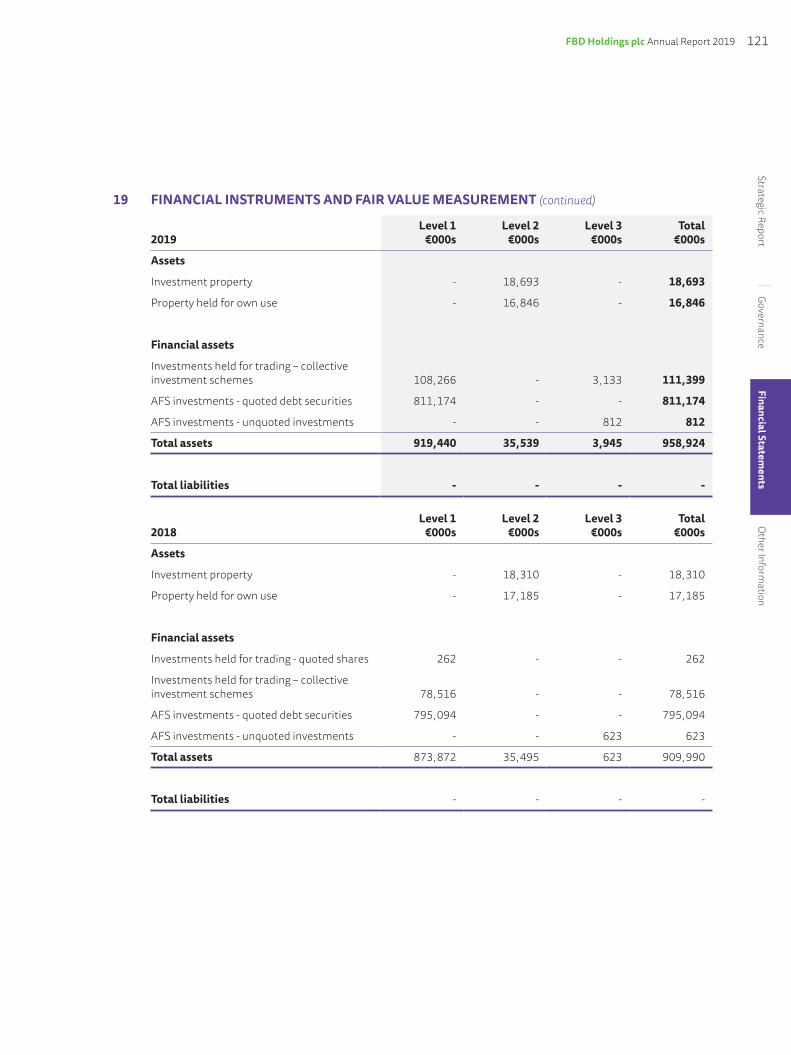
FBD Holdings plc Annual Report 2019 121Strategic Report
Governance
Financial Statements
Other Inform
ation
19 FINANCIAL INSTRUMENTS AND FAIR VALUE MEASUREMENT (continued)
2019Level 1
€000sLevel 2
€000sLevel 3
€000sTotal
€000s
Assets
Investment property - 18,693 - 18,693
Property held for own use - 16,846 - 16,846
Financial assets
Investments held for trading – collective investment schemes 108,266 - 3,133 111,399
AFS investments - quoted debt securities 811,174 - - 811,174
AFS investments - unquoted investments - - 812 812
Total assets 919,440 35,539 3,945 958,924
Total liabilities - - - -
2018Level 1
€000sLevel 2
€000sLevel 3
€000sTotal
€000s
Assets
Investment property - 18,310 - 18,310
Property held for own use - 17,185 - 17,185
Financial assets
Investments held for trading - quoted shares 262 - - 262
Investments held for trading – collective investment schemes 78,516 - - 78,516
AFS investments - quoted debt securities 795,094 - - 795,094
AFS investments - unquoted investments - - 623 623
Total assets 873,872 35,495 623 909,990
Total liabilities - - - -

122
Notes to the Financial Statements (continued)
19 FINANCIAL INSTRUMENTS AND FAIR VALUE MEASUREMENT (continued)
A reconciliation of Level 3 fair value measurement of financial assets is shown in the table below:
2019 2018
€000s €000s
At 1 January 623 844
Additions 3,436 -
Disposals - (250)
Unrealised (losses)/gains recognised in the Consolidated Income Statement (114) 29
At 31 December 3,945 623
The maximum exposure the Group has in relation to Level 3 valued financial assets is €3,945,000 (2018: €623,000). The Directors do not consider it necessary to provide a sensitivity analysis on financial investments grouped into Level 3 as they do not consider the impact of a change in one or more valuation inputs to be material.
20 CURRENT TAXATION ASSET2019 2018
€000s €000s
Income taxation receivable 3,949 3,949
21 DEFERRED ACQUISITION COSTSThe movements in deferred acquisition costs during the financial year were:
2019 2018
€000s €000s
At 1 January 31,956 31,366
Net acquisition costs further deferred during the year 1,226 590
At 31 December 33,182 31,956
All deferred acquisition costs are expected to be recovered within one year from 31 December 2019.

FBD Holdings plc Annual Report 2019 123Strategic Report
Governance
Financial Statements
Other Inform
ation
22 OTHER RECEIVABLES2019 2018
€000s €000s
Policyholders 42,703 42,923
Intermediaries 6,853 6,946
Other debtors 7,659 6,067
Accrued interest and rent 30 136
Prepayments and accrued income 6,621 6,796
Total other receivables 63,866 62,868
The Directors have performed an impairment review of the receivables arising out of direct insurance operations and no objective evidence came to their attention that an impairment exists. There is no significant concentration of risk in receivables arising out of direct insurance operations or any other activities.
The Directors consider that the carrying amount of receivables is approximate to their fair value. All receivables are due within one year and none are past due.
23 CASH AND CASH EQUIVALENTS2019 2018
€000s €000s
Short term deposits 91,177 74,770
Cash in hand 3,805 2,869
Total cash and cash equivalents 94,982 77,639
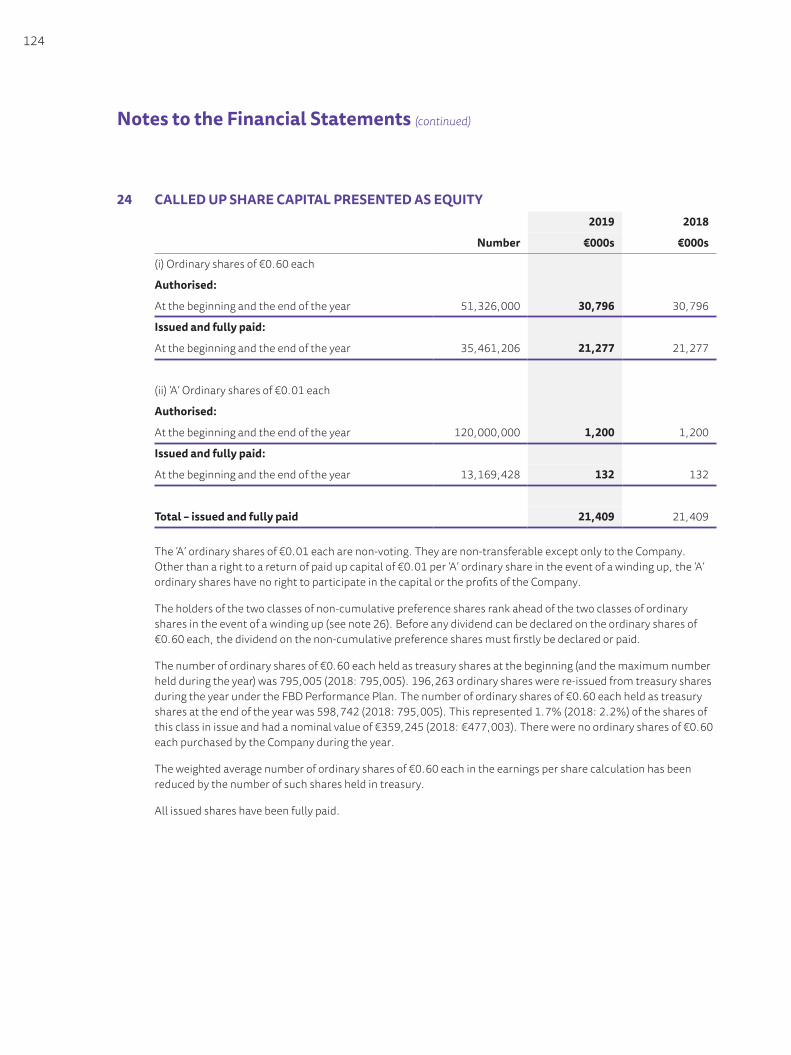
124
Notes to the Financial Statements (continued)
24 CALLED UP SHARE CAPITAL PRESENTED AS EQUITY2019 2018
Number €000s €000s
(i) Ordinary shares of €0.60 each
Authorised:
At the beginning and the end of the year 51,326,000 30,796 30,796
Issued and fully paid:
At the beginning and the end of the year 35,461,206 21,277 21,277
(ii) ‘A’ Ordinary shares of €0.01 each
Authorised:
At the beginning and the end of the year 120,000,000 1,200 1,200
Issued and fully paid:
At the beginning and the end of the year 13,169,428 132 132
Total – issued and fully paid 21,409 21,409
The ‘A’ ordinary shares of €0.01 each are non-voting. They are non-transferable except only to the Company. Other than a right to a return of paid up capital of €0.01 per ‘A’ ordinary share in the event of a winding up, the ‘A’ ordinary shares have no right to participate in the capital or the profits of the Company.
The holders of the two classes of non-cumulative preference shares rank ahead of the two classes of ordinary shares in the event of a winding up (see note 26). Before any dividend can be declared on the ordinary shares of €0.60 each, the dividend on the non-cumulative preference shares must firstly be declared or paid.
The number of ordinary shares of €0.60 each held as treasury shares at the beginning (and the maximum number held during the year) was 795,005 (2018: 795,005). 196,263 ordinary shares were re-issued from treasury shares during the year under the FBD Performance Plan. The number of ordinary shares of €0.60 each held as treasury shares at the end of the year was 598,742 (2018: 795,005). This represented 1.7% (2018: 2.2%) of the shares of this class in issue and had a nominal value of €359,245 (2018: €477,003). There were no ordinary shares of €0.60 each purchased by the Company during the year.
The weighted average number of ordinary shares of €0.60 each in the earnings per share calculation has been reduced by the number of such shares held in treasury.
All issued shares have been fully paid.

FBD Holdings plc Annual Report 2019 125Strategic Report
Governance
Financial Statements
Other Inform
ation
25 CAPITAL RESERVES
(a) GROUP
Sharepremium
€000s
Capitalconversion
reserve€000s
Capitalredemption
reserve€000s
Share option
reserve€000s
TotalGroup€000s
Balance at 1 January 2018 5,540 1,627 4,426 8,133 19,726
Recognition of share-based payments - - - 704 704
Balance at 31 December 2018 5,540 1,627 4,426 8,837 20,430
Recognition of share-based payments - - - 2,381 2,381
Balance at 31 December 2019 5,540 1,627 4,426 11,218 22,811
(b) COMPANY
Sharepremium
€000s
Capitalconversion
reserve€000s
Capitalredemption
reserve€000s
Shareoption
reserve€000s
TotalCompany
€000s
Balance at 1 January 2018 5,540 1,627 4,426 8,133 19,726
Recognition of share-based payments - - - 704 704
Balance at 31 December 2018 5,540 1,627 4,426 8,837 20,430
Recognition of share-based payments - - - 2,381 2,381
Balance at 31 December 2019 5,540 1,627 4,426 11,218 22,811
The capital conversion reserve arose on the redenomination of Company’s ordinary shares, 14% non-cumulative preference shares and 8% non-cumulative preference shares of IR£0.50 each into ordinary shares, 14% non-cumulative preference shares and 8% non-cumulative preference shares of 63.4869 cent. Each such share was then renominalised to an ordinary or a non-cumulative preference share of €0.60, an amount equal to the reduction in the issued share capital being transferred to the capital conversion reserve fund.
Capital redemption reserve arose on the buyback and cancellation of issued share capital.
Share option reserve arose on the recognition of share-based payments.

126
Notes to the Financial Statements (continued)
26 PREFERENCE SHARE CAPITAL2019 2018
Number €000s €000s
Authorised:
At the beginning and the end of the year
14% Non-cumulative preference shares of €0.60 each 1,340,000 804 804
8% Non-cumulative preference shares of €0.60 each 12,750,000 7,650 7,650
8,454 8,454
Issued and fully paid:
At the beginning and the end of the year
14% Non-cumulative preference shares of €0.60 each 1,340,000 804 804
8% Non-cumulative preference shares of €0.60 each 3,532,292 2,119 2,119
2,923 2,923
The rights attaching to each class of share capital are set out in the Company’s Articles of Association. In the event of the Company being wound up, the holders of the 14% non-cumulative preference shares rank ahead of the holders of the 8% non-cumulative preference shares, who in turn, rank ahead of the holders of both the ‘A’ ordinary shares of €0.01 each and the holders of the ordinary shares of €0.60 each.

FBD Holdings plc Annual Report 2019 127Strategic Report
Governance
Financial Statements
Other Inform
ation
27
CLAI
MS
OU
TSTA
ND
ING
(a)
Gro
ss C
laim
s Out
stan
ding
201
9Pr
ior
year
s€0
00s
20
10€0
00s
2011
€000
s20
12€0
00s
2013
€000
s20
14€0
00s
2015
€000
s20
16€0
00s
2017
€000
s20
18€0
00s
2019
€000
sTo
tal
€000
s
Estim
ate
of cu
mul
ativ
e cl
aim
s:
At e
nd o
f und
erw
ritin
g ye
ar
332
,367
24
3,15
8 2
32,3
11
245,
007
307
,517
30
2,58
1 2
53,9
62
247,
145
252
,435
21
9,24
4
One
year
late
r 3
16,4
14
216,
308
215
,445
23
6,83
9 3
42,4
22
304,
108
235
,972
22
3,32
2 2
35,9
02
-
Two
year
s lat
er
314
,526
22
5,30
0 2
24,7
20
266,
183
344
,123
32
6,05
2 2
20,3
76
205,
505
- -
Thre
e ye
ars l
ater
3
10,5
83
230,
001
235
,965
26
0,58
0 3
33,5
44
318,
467
206
,578
-
- -
Four
year
s lat
er
308
,360
23
4,20
4 2
33,4
34
257,
859
326
,714
28
8,39
5 -
- -
-
Five
year
s lat
er
306
,442
22
7,75
5 2
31,1
59
244,
922
318
,944
-
- -
- -
Six
year
s lat
er
305
,963
22
6,34
8 2
29,2
71
243,
163
- -
- -
- -
Seve
n ye
ars l
ater
3
05,5
81
224,
753
228
,677
-
- -
- -
- -
Eigh
t yea
rs la
ter
307
,121
22
4,26
5 -
- -
- -
- -
-
Nin
e ye
ars l
ater
3
07,7
64
- -
- -
- -
- -
-
Estim
ate
of cu
mul
ativ
e cl
aim
s 3
07,7
64
224,
265
228
,677
24
3,16
3 3
18,9
44
288,
395
206
,578
20
5,50
5 2
35,9
02
219,
244
Cum
ulat
ive
paym
ents
(2
93,8
18) (
215,
643)
(210
,701
) (21
5,52
4) (2
66,1
78) (
195,
108)
(134
,465
) (11
4,95
9) (1
03,3
08)
(56,
276)
Clai
ms o
utst
andi
ng a
t 31
Dec
embe
r 201
9:
10,
875
13,
946
8,6
22
17,
976
27,
639
52,
766
93,
287
72,
113
90,
546
132
,594
16
2,96
8 6
83,3
32
Clai
ms o
utst
andi
ng a
t 31
Dec
embe
r 201
8:
16,
058
14,
911
12,
116
23,
570
35,
765
75,
493
148
,209
10
1,57
1 1
25,0
00
185,
332
- 7
38,0
25
Mov
emen
t dur
ing
2019
:(5
,183
) (9
65)
(3,4
94)
(5,5
94)
(8,1
26)
(22,
727)
(5
4,92
2)
(29,
458)
(3
4,45
4)
(52,
738)
162
,968
(5
4,69
3)

128
Notes to the Financial Statements (continued)27
CL
AIM
S O
UTS
TAN
DIN
G (c
ontin
ued)
(b)
Net
Cla
ims O
utst
andi
ng 2
019
Prio
rye
ars
€000
s
20
10€0
00s
2011
€000
s20
12€0
00s
2013
€000
s20
14€0
00s
2015
€000
s20
16€0
00s
2017
€000
s20
18€0
00s
2019
€000
sTo
tal
€000
s
Estim
ate
of cu
mul
ativ
e cl
aim
s:
At e
nd o
f und
erw
ritin
g ye
ar
262
,562
21
4,92
3 2
14,7
93
228,
819
256
,663
27
0,27
9 2
28,1
07
212,
750
228
,501
20
6,34
3
One
year
late
r 2
47,7
35
192,
904
201
,171
21
7,09
8 2
92,2
23
274,
000
219
,905
19
9,08
6 2
16,2
10
-
Two
year
s lat
er
248
,931
20
1,18
1 2
10,4
22
243,
373
295
,223
28
4,63
6 2
05,3
20
186,
058
- -
Thre
e ye
ars l
ater
2
45,6
17
205,
434
221
,438
23
7,73
3 2
90,2
43
275,
909
190
,732
-
- -
Four
year
s lat
er
243
,668
20
9,53
3 2
18,9
79
233,
750
283
,929
26
2,80
1 -
- -
-
Five
year
s lat
er
241
,134
20
5,13
1 2
17,1
04
226,
331
275
,559
-
- -
- -
Six
year
s lat
er
239
,086
20
4,14
0 2
15,1
79
224,
386
- -
- -
- -
Seve
n ye
ars l
ater
2
38,6
67
202,
480
214
,396
-
- -
- -
- -
Eigh
t yea
rs la
ter
239
,555
20
1,89
7 -
- -
- -
- -
-
Nin
e ye
ars l
ater
2
39,8
36
- -
- -
- -
- -
-
Ten
year
s lat
er
Estim
ate
of cu
mul
ativ
e cl
aim
s 2
39,8
36
201,
897
214
,396
22
4,38
6 2
75,5
59
262,
801
190
,732
18
6,05
8 2
16,2
10
206,
343
Cum
ulat
ive
paym
ents
(2
29,8
09) (
193,
319)
(196
,509
) (19
9,89
4) (2
23,8
81) (
179,
779)
(126
,896
) (10
6,79
8)
(98,
578)
(5
6,45
4)
Clai
ms o
utst
andi
ng a
t 31
Dec
embe
r 201
9 1
0,68
2 1
0,02
7 8
,578
1
7,88
7 2
4,49
2 5
1,67
8 8
3,02
2 6
3,83
6 7
9,26
0 1
17,6
32
149,
889
616
,983
Clai
ms o
utst
andi
ng a
t 31
Dec
embe
r 201
8 1
5,59
8 1
1,35
4 1
2,15
9 2
3,67
1 3
2,70
5 7
5,00
4 1
19,4
60
94,
084
108
,412
16
4,65
9 -
657
,106
Mov
emen
t dur
ing
the
year
(4
,916
) (1
,327
) (3
,581
) (5
,784
) (8
,213
) (2
3,32
6)
(36,
438)
(3
0,24
8)
(29,
152)
(4
7,02
7) 1
49,8
89
(40,
123)

FBD Holdings plc Annual Report 2019 129Strategic Report
Governance
Financial Statements
Other Inform
ation
27 CLAIMS OUTSTANDING (continued)
(b) Net Claims Outstanding 2019 (continued)Full provision, net of reinsurance recoveries, is made at the reporting date for the estimated cost of claims incurred but not settled, including claims incurred but not yet reported and expenses to be incurred after the reporting date in settling those claims. The Group takes all reasonable steps to ensure that it has appropriate information regarding notified claims and uses this information when estimating the cost of those claims.
The Group uses estimation techniques, based on statistical analysis of past experience, to calculate the estimated cost of claims outstanding at the year end. It is assumed that the development pattern of the current claims will be consistent with previous experience. Allowance is made, however, for any changes or uncertainties that may cause the cost of unsettled claims to increase or reduce. These changes or uncertainties may arise from issues such as the effects of inflation, changes in the mix of business or the legal environment.
At each reporting date, liability adequacy tests are performed to ensure the adequacy of the insurance liabilities. In performing these tests, current best estimates of future cash flows and claims handling and administration expenses are used. Any deficiency is immediately recognised in the Consolidated Income Statement.
(c) Reconciliation of claims outstandingGross Net
€000s €000s
Balance at 1 January 2018 765,012 674,451
Change in provision for claims (26,987) (17,345)
Balance at 31 December 2018 738,025 657,106
Change in provision for claims (54,693) (40,123)
Balance at 31 December 2019 683,332 616,983
(d) Reconciliation of provision for unearned premiumThe following changes have occurred in the provision for unearned premium during the year:
2019 2018
€000s €000s
Balance at 1 January 182,875 186,008
Net premium written 338,227 334,769
Net premium earned (337,553) (337,903)
Changes in provision for unearned premium – reinsurers’ share (4) 1
Provision for unearned premium at 31 December 183,545 182,875
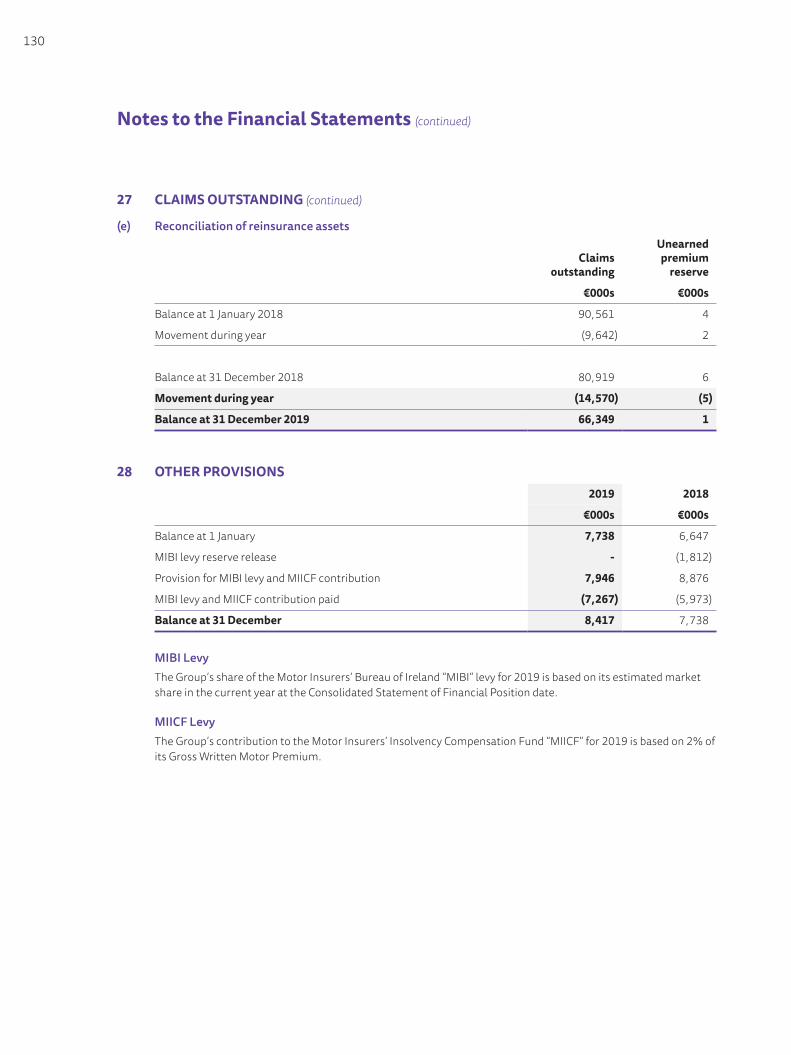
130
Notes to the Financial Statements (continued)
27 CLAIMS OUTSTANDING (continued)
(e) Reconciliation of reinsurance assets
Claimsoutstanding
Unearnedpremium
reserve
€000s €000s
Balance at 1 January 2018 90,561 4
Movement during year (9,642) 2
Balance at 31 December 2018 80,919 6
Movement during year (14,570) (5)
Balance at 31 December 2019 66,349 1
28 OTHER PROVISIONS2019 2018
€000s €000s
Balance at 1 January 7,738 6,647
MIBI levy reserve release - (1,812)
Provision for MIBI levy and MIICF contribution 7,946 8,876
MIBI levy and MIICF contribution paid (7,267) (5,973)
Balance at 31 December 8,417 7,738
MIBI LevyThe Group’s share of the Motor Insurers’ Bureau of Ireland “MIBI” levy for 2019 is based on its estimated market share in the current year at the Consolidated Statement of Financial Position date.
MIICF LevyThe Group’s contribution to the Motor Insurers’ Insolvency Compensation Fund “MIICF” for 2019 is based on 2% of its Gross Written Motor Premium.

FBD Holdings plc Annual Report 2019 131Strategic Report
Governance
Financial Statements
Other Inform
ation
29 CONVERTIBLE DEBT2019 2018
€000s €000s
Balance at 1 January - 52,525
Amortised during the year - 1,062
Derecognition of convertible debt upon purchase and cancellation - (53,587)
Balance at 31 December - -
On 1 October 2018 FBD Holdings plc announced that its subsidiary FBD Insurance plc had entered into an agreement to purchase and cancel the €70,000,000 7% Convertible Notes which were in issue for €86,059,000. The below table shows the loss recognised as a result of the purchase and cancellation of the Notes.
Interest costs associated with the Notes totalling €nil (2018: €4,864,000) as result of the purchase and cancellation of the Notes.
Purchase and cancellation of the Convertible Notes 2019 2018
€000s €000s
Carrying value of bond on date of settlement (as per above table) - 53,587
Carrying value of equity on date of settlement - 18,232
Total carrying value of convertible debt on date of settlement - 71,819
Consideration paid for the convertible bond - (86,059)
Loss on purchase and cancellation of the convertible bond - (14,240)
Lossonpurchaseandcancellationofthebondattributableto:
A) Statement of Changes in Equity:
– Loss on equity portion - (2,763)
B) Consolidated Income Statement:
– Loss on debt portion - (11,477)
- (14,240)

132
Notes to the Financial Statements (continued)
30 SUBORDINATED DEBT2019 2018
€000s €000s
Balance at 1 January 49,426 -
Recognition of subordinated debt on issue - 49,412
Amortised during the year 59 14
Balance at 31 December 49,485 49,426
On 2 October 2018 FBD Insurance plc successfully agreed to issue €50,000,000 of new Callable Dated Deferrable Subordinated Notes due 2028. The agreed coupon for the notes was 5%. Interest costs associated with the subordinated notes totalling €2,500,000 (2018: €589,000) were incurred and recognised during the financial year.
31 RETIREMENT BENEFIT ASSET
Defined Contribution PensionThe Group operates defined contribution retirement benefit plans for qualifying employees who opt to join. The assets of the plans are held separately from those of the Group in funds under the control of Trustees. The Group recognised an expense of €3,513,401 (2018: €4,387,648) relating to these pension schemes during the year ended 31 December 2019.
Defined Benefit PensionThe Group also operates a legacy funded defined benefit retirement pension scheme for certain qualifying employees. This scheme was closed to new members in 2005 and closed to future accrual in 2015. The defined benefit pension scheme is administered by a separate Trustee Company that is legally separated from the entity. The Trustee Company, who is responsible for ensuring compliance with the Pensions Act 1990 and other relevant legislation, is composed of an independent Trustee and representatives from both the employers and current and former employees. The Trustees are required by law and by its Articles of Association to act in the interest of the fund and of all relevant stakeholders in the scheme, i.e. deferred members, retirees and employers. They are responsible for the investment policy with regard to the assets of the scheme.
Under the defined benefit pension scheme, qualifying members are entitled to retirement benefits of 1/60th of final salary for each year of service on attainment of a retirement age of 65. A full actuarial valuation of the defined benefit pension scheme was carried out on 1 July 2016. This valuation was carried out using the projected unit credit method. The minimum funding standard was updated to 31 December 2019 by the schemes’ independent and qualified actuary. This confirms that the Scheme continues to satisfy the minimum funding standard. The next full actuarial valuation of the scheme is expected to be completed by March 2020 with a valuation date of 1 July 2019.
The long-term investment objective of the Trustees and the Group is to limit the risk of the assets failing to meet the liabilities of the scheme over the long term, and to maximise returns consistent with an acceptable level of risk so as to control the long-term costs of the scheme. To meet these objectives, the scheme’s assets are primarily invested in bonds with a smaller level of investment in diversified growth funds and property. These reflect the current long-term asset allocation ranges, having regard to the structure of liabilities within the scheme. The scheme typically exposes the Group to actuarial risks such as: investment risk, interest rate risk and longevity risk.

FBD Holdings plc Annual Report 2019 133Strategic Report
Governance
Financial Statements
Other Inform
ation
31 RETIREMENT BENEFIT ASSET (continued)
(a) Assumptions used to calculate scheme liabilities2019
%2018
%
Inflation rate 1.30 1.50
Salary rate increase N/A* N/A*
Pension payment increase 0.00 0.00
Discount rate 0.90 1.80
*Nolongerapplicableastheschemeclosedtofutureaccrualwithremovalofsalarylinkat30September2015.
(b) Mortality Assumptions2019 2018
Years Years
The average life expectancy of current and future retirees used in the scheme at age 65 is as follows:
Male 21.7 21.5
Female 24.1 23.9
The weighted average duration of the expected benefit payments from the scheme is circa 16 years.
As required by IAS 19 disclosures; the discount rate is set by reference to yields available at 31 December 2019 on high quality corporate bonds having regard to the duration of the schemes liabilities. The actual return on the scheme assets for the year was a gain of €9,764,000 (2018: €2,259,000).
(c) Consolidated Income Statement2019 2018
€000s €000s
Charged to Consolidated Income Statement:
Service cost: employer’s part of current service cost 338 347
Net interest credit (233) (173)
Past service costs - 132
Charge to Consolidated Income Statement 105 306
Charges to the Consolidated Income Statement have been included in other underwriting and financial services and other costs.

134
Notes to the Financial Statements (continued)
31 RETIREMENT BENEFIT ASSET (continued)
(d) Analysis of amount recognised in Group Statement of Comprehensive Income2019 2018
€000s €000s
Remeasurements in the year due to:
– Changes in financial assumptions 11,173 (1,655)
– Changes in demographic assumptions - -
– Experience adjustments on benefit obligations 1,120 (999)
Actual return less interest on scheme assets (8,057) (578)
Total amount recognised in OCI before taxation 4,236 (3,232)
Deferred taxation (credit)/debit (530) 404
Actuarial loss/(gain) net of deferred taxation 3,706 (2,828)
(e) History of experience gains and losses2019 2018 2017 2016 2015
€000s €000s €000s €000s €000s
Present value of defined benefit obligations 93,958 83,434 88,103 90,887 106,490
Fair value of plan assets 102,681 96,378 97,877 99,602 115,600
Net pension (asset)/liability (8,723) (12,944) (9,774) (8,715) (9,110)
Experience (losses)/gains on scheme liabilities (1,120) 999 150 (266) (401)
Total amount recognised in OCI before taxation (4,236) 3,232 275 (12,233) 15,914
The cumulative charge to the Consolidated Statement of Comprehensive Income is €104,806,000 (2018: €100,570,000).

FBD Holdings plc Annual Report 2019 135Strategic Report
Governance
Financial Statements
Other Inform
ation
31 RETIREMENT BENEFIT ASSET (continued)
(f) Assets in scheme at market value2019 2018
€000s €000s
Debt securities - quoted 84,561 78,543
Unit trusts - quoted 5,169 7,672
Managed funds - quoted 6,920 3,916
Managed funds - unquoted 5,419 -
Cash deposits and other - cost 612 6,247
Scheme assets 102,681 96,378
Actuarial value of liabilities (93,958) (83,434)
Net pension surplus 8,723 12,944
The assets are part of unitised funds which have a broad geographical and industry type spread with no significant concentration in any one geographical or industry type.
(g) Movement in net surplus during the year
2019 2018
€000s €000s
Net surplus in scheme at 1 January 12,944 9,774
Current service cost (338) (347)
Past service costs - (132)
Employer contributions 120 244
Interest on scheme liabilities (1,474) (1,508)
Interest on scheme assets 1,707 1,681
Total amount recognised in OCI before taxation (4,236) 3,232
Net surplus at 31 December 8,723 12,944

136
Notes to the Financial Statements (continued)
31 RETIREMENT BENEFIT ASSET (continued)
(h) Movement on assets and liabilities2019 2018
€000s €000s
Assets
Assets in scheme at 1 January 96,378 97,877
Actual return less interest on scheme assets 8,057 578
Employer contributions 120 244
Interest on scheme assets 1,707 1,681
Benefits paid (3,581) (4,002)
Assets in scheme at 31 December 102,681 96,378
Liabilities
Liabilities in scheme at 1 January 83,434 88,103
Experience gains and losses on scheme liabilities 1,120 (999)
Changes in financial assumptions 11,173 (1,655)
Current service cost 338 347
Past service costs - 132
Interest on scheme liabilities 1,474 1,508
Benefits paid (3,581) (4,002)
Liabilities in scheme at 31 December 93,958 83,434
The sensitivities regarding the principal assumptions used to measure the scheme liabilities are as follows:
n A 1% increase in the discount rate would reduce the value of the scheme liabilities by €13.4 million. A 1% reduction in the discount rate would increase the value of the scheme liabilities by €17.2 million.
n A 1% increase in inflation would increase the value of the scheme liabilities by €4.4 million. A 1% reduction in inflation would reduce the value of the scheme liabilities by €3.8 million.
n The effect of assuming all members of the scheme will live one year longer would increase the scheme’s liabilities by €3.9 million.
n The current best estimate of 2020 contributions to be made by the Group to the pension fund is €nil (2019: €nil).

FBD Holdings plc Annual Report 2019 137Strategic Report
Governance
Financial Statements
Other Inform
ation
32 DEFERRED TAXATION LIABILITY
Retirementbenefit surplus
Unrealisedlosses on
investments& loans
Revaluationsurplus on
investmentproperties
Other timing
differences Total
€000s €000s €000s €000s €000s
At 1 January 2018 1,222 1,352 1,271 - 3,845
Debited/(credited) to the Consolidated Statement of Comprehensive Income 404 (981) - - (577)
(Credited)/debited to the Consolidated Income Statement (8) (46) 58 338 342
At 31 December 2018 1,618 325 1,329 338 3,610
(Credited)/debited to the Consolidated Statement of Comprehensive Income (530) 1,366 - - 836
Debited/(credited) to the Consolidated Income Statement 1 (46) 502 2 459
At 31 December 2019 1,089 1,645 1,831 340 4,905
A deferred taxation liability of €1,089,000 has been recognised in 2019 in respect of the retirement benefit asset of €8,723,000. In 2018 a deferred taxation liability of €1,618,000 was recognised on the retirement benefit asset of €12,944,000.
33 CURRENT TAXATION LIABILITY2019 2018
€000s €000s
Income taxation payable 3,128 3,312
This balance relates to corporation taxation payable.
34 PAYABLES
(a) GROUP2019 2018
€000s €000s
Amounts falling due within one year:
Payables and accruals 28,348 26,822
PAYE/PRSI 1,674 1,368
Payables arising out of direct insurance operations 5,743 5,044
Total payables 35,765 33,234

138
Notes to the Financial Statements (continued)
34 PAYABLES (continued)
(b) COMPANY2019 2018
€000s €000s
Amounts falling due within one year:
Payables and accruals 2,648 4,278
Total payables 2,648 4,278
35 DIVIDENDS2019 2018
€000s €000s
Paid during year:
2018 dividend of 8.4 cent (2017: 8.4 cent) per share on 14% non-cumulative preference shares of €0.60 each 113 113
2018 dividend of 4.8 cent (2017: 4.8 cent) per share on 8% non-cumulative preference shares of €0.60 each 169 169
2018 final dividend of 50.0 cents (2017: 24.0 cent) per share on ordinary shares of €0.60 each 17,432 8,320
Total dividends paid 17,714 8,602
2019 2018
€000s €000s
Proposed:
2019 dividend of 8.4 cent (2018: 8.4 cent) per share on 14% non-cumulative preference shares of €0.60 each 113 113
2019 dividend of 4.8 cent (2018: 4.8 cent) per share on 8% non-cumulative preference shares of €0.60 each 169 169
2019 final dividend of 100 cent (2018: 50.0 cent) per share on ordinary shares of €0.60 each 34,862 17,333
Total dividends proposed 35,144 17,615
The proposed dividend excludes any amounts due on outstanding share awards as at 31 December 2019 that are due to vest in March 2020 and is subject to approval by shareholders at the Annual General Meeting on 8 May 2020. The proposed dividends have not been included as a liability in the Consolidated Statement of Financial Position.

FBD Holdings plc Annual Report 2019 139Strategic Report
Governance
Financial Statements
Other Inform
ation
36 PRINCIPAL SUBSIDIARIES(a) Subsidiaries Nature of Operations % OwnedFBD Insurance plc General insurance underwriter 100%
FBD Insurance Group Limited Investment services, pensions and life brokers 100%
FBD Corporate Services Limited Employee services company 100%
The Registered Office of each of the above subsidiaries is at FBD House, Bluebell, Dublin 12.
All shareholdings are in the form of ordinary shares.
The financial year end for the Group’s principal subsidiaries is 31 December.
FBD Holdings plc is an Irish registered public limited company. The Company’s ordinary shares of €0.60 each are listed on Euronext Dublin and the UK Listing Authority and are traded on both Euronext Dublin and London Stock Exchange.
All individual subsidiary’s accounts are prepared in accordance with FRS 102, the financial reporting standard applicable in the UK and Republic of Ireland with the exception of FBD Insurance plc whose accounts are prepared in accordance with International Financial Reporting Standards (“IFRSs”) adopted by the European Union. The Directors considered it appropriate for FBD Insurance plc to transition to IFRS during 2019, mainly, as this will allow for uniformity when applying IFRS 17 – Insurance contracts, reference Note 3.
37 CAPITAL COMMITMENTSCapital expenditure contracted for at the end of 2019 but not recognised as liabilities for intangible assets is €nil (2018: €711,000).
38 CONTINGENT LIABILITIES AND CONTINGENT ASSETSThere were no contingent liabilities or contingent assets at either 31 December 2019 or 31 December 2018.
39 SHARE-BASED PAYMENTS
FBD Group Performance Share PlanConditional awards of ordinary shares are made under the FBD Group Performance Share Plan (“LTIP”). The LTIP was last approved by the shareholders of FBD Holdings plc at the 2018 AGM.
Conditional awards up to 2016 under the LTIP are dependent on the Group meeting onerous performance targets in terms of total shareholder returns, combined operating ratio, business scorecard metrics and share price performance (market conditions). The market conditions were removed from conditional awards in 2017 and subsequent years which are solely based on the non-market conditions as detailed. The extent to which these conditions have been met and any award (or part of an award) has therefore vested will be determined in due course by the Remuneration Committee of the Board of FBD Holdings plc. Further detail on the LTIP is available within the Report on Directors’ Remuneration on pages 57 to 67.

140
Notes to the Financial Statements (continued)
39 SHARE-BASED PAYMENTS (continued)
Fair value calculationsThe fair values of the below listed conditional share awards have been calculated as follows using the assumptions noted in a Monte Carlo simulation model.
LTIP award March 2015
LTIP award October 2015
LTIP award March 2016
Share price at grant €10.80 €6.65 €6.55Initial award price €10.80 €6.65 €6.55Expected volatility 30% 35% 35%Expected life in years 3 3 3Risk free interest rate 0.0% 0.0% 0.0%Expected dividend yield % n/a n/a n/aFair value €8.49 €5.39 €5.25
Expected volatility was determined by calculating the historical volatility of the Group’s share price over the previous two to three years preceding the date of grant.
The fair value of the LTIP awards for 2017, 2018 and 2019 were determined to be equal to the share price at the grant date on the basis that no market conditions were attached to these awards.
Accounting charge for share based payments
Grant date
Numberoutstandingat 1 January
2019
Grantedduring
year
Vestedduring
year
Lapsedduring
year
Forfeitedduring
year
Number outstanding
at 31 December
2019Performance
Period
Earliest vesting
date
09.10.2015 LTIP 54,545 - (42,317) (12,228) - - 2015-2017 Mar-1923.03.2016 LTIP 195,313 - (153,946) (41,367) - - 2016-2018 Mar-1928.03.2017 LTIP 189,046 - - 1,455 - 190,501 2017-2019 Mar-2023.08.2018 LTIP 204,069 - - - - 204,069 2018-2020 Aug-2125.03.2019 LTIP - 264,134 - 264,134 2019-2021 Mar-22
Total 642,973 264,134 (196,263) (52,140) - 658,704
Grant date
Vesting period(years)
Number outstanding at
31 December 2019
% of options
expected to vest
Share price at
grant date
Fair value of share
award atgrant date 2019 2018
% € € €000s €000s02.03.2015 LTIP 3.00 - 0% 10.80 8.49 - 1609.10.2015 LTIP 3.00 - 0% 6.65 5.39 56 (5)23.03.2016 LTIP 3.00 - 0% 6.55 5.25 220 1128.03.2017 LTIP 3.00 190,501 90% 7.95 7.95 483 42023.08.2018 LTIP 3.00 204,069 125% 10.80 10.80 1,009 26225.03.2019 LTIP 3.00 264,134 125% 8.79 8.79 613 -Total 658,704 2,381 704
During the financial year 42,317 shares of the October 2015 and 153,946 shares of the March 2016 awards vested, with a combined value of €583,235. It is not expected that any further shares will vest relating to these.
The Directors estimate 90% of the March 2017 awards will vest, 125% of the August 2018 awards will vest, 125% of the March 2019 awards will vest.

FBD Holdings plc Annual Report 2019 141Strategic Report
Governance
Financial Statements
Other Inform
ation
40 TRANSACTIONS WITH RELATED PARTIESFarmer Business Developments plc and FBD Trust Company Ltd have a substantial shareholding in the Group at 31 December 2019. Details of their shareholdings and related party transactions are set out in the Report of the Directors on pages 38 to 43.
As part of the subordinated debt investment in 2018, Farmer Business Developments invested €20.0m and FBD Trust Company Ltd invested €13.0m. Please refer to note 30 for further details.
For the purposes of the disclosure requirements of IAS 24, the term “key management personnel” (i.e. those persons having authority and responsibility for planning, directing and controlling the activities of the Group) comprises the Board of Directors and Company Secretary of FBD Holdings plc and the Group’s primary subsidiary, FBD Insurance plc and the members of the Executive Management Team.
The remuneration of key management personnel (“KMP”) during the year was as follows:
2019 2018
€000s €000s
Short term employee benefits1 3,501 3,545
Post-employment benefits 305 297
Share based payments 993 316
Charge to the Consolidated Income Statement 4,799 4,158
1 ShorttermbenefitsincludefeestoNon-ExecutiveDirectors,salariesandothershort-termbenefitstoallkeymanagementpersonnel.
Full disclosure in relation to the 2019 and 2018 compensation entitlements and share awards of the Board of Directors is provided in the Report on Directors’ Remuneration.
In common with all shareholders, Directors received payments/distributions related to their holdings of shares in the Company during the year, amounting in total to €27,830 (2018: €3,571).
41 FINANCIAL RISK MANAGEMENT
(a) Capital Management RiskThe Group is committed to managing its capital to ensure it is adequately capitalised at all times and to maximise returns to shareholders. The capital of the Group comprises of issued capital, reserves and retained earnings as detailed in notes 24 to 26. The Group has an Investment Committee, a Pricing & Underwriting Committee, a Capital Management Forum, an Audit Committee, a Reserving Committee and Board and Executive Risk Committees, all of which assist the Board in the identification and management of exposures and capital.
The Group maintained its robust capital position and complied with all regulatory solvency margin requirements throughout both the year under review and the prior year. In 2019, the Group maintained its Solvency Capital Requirement (SCR) coverage above its target range of 120-140% of SCR.
An experienced Actuarial team is in place with policies and procedures to ensure that Technical Provisions are calculated in an appropriate manner and represent a best estimate. Technical Provisions are internally peer reviewed every quarter, audited once a year and subject to external peer review every two years.
An approved Reinsurance Programme is in place to minimise the Solvency Impact of Catastrophe events to the Group.

142
Notes to the Financial Statements (continued)
41 FINANCIAL RISK MANAGEMENT (continued)
The annual ORSA provides a comprehensive view and understanding of the risks to which the Group is exposed or could face in the future and how they translate into capital needs or alternatively require mitigation actions.
The Chief Financial Officer (CFO) is responsible for consideration of the implications for capital position as part of the strategic planning process and key strategic decision-making and for ensuring appropriate action is taken as approved by the Board/CEO/relevant committee.
On at least an annual basis, a target range for its SCR Ratio, developed as part of the annual planning/budgeting process, is approved by the Board as part of the Risk Appetite Statements in the Risk Appetite Framework.
The Group also devotes considerable resources to managing its relationships with the providers of capital within the capital markets, for example, existing and potential shareholders, financial institutions, stockbrokers and corporate finance houses.
(b) Liquidity riskThe Group is exposed to daily calls on its cash resources, mainly for claims payments. The Group manages liquidity risk by continuously monitoring forecast and actual cash flows and ensuring that the maturity profile of its financial assets is shorter than or equal to the maturity profile of its liabilities and maintaining a minimum cash amount available on short term access at all times.
The following tables provide an analysis of assets and liabilities into their relevant maturity groups based on the remaining period to contractual maturity. The contracted value below is the undiscounted cash flow.
Assets – 2019
Carrying valuetotal
€000s
ContractedValue€000s
Cashflowwithin1 year€000s
Cashflow1-5 years
€000s
Cashflowafter
5 years€000s
Financial assets 871,174 881,186 179,209 567,255 134,722
Reinsurance assets 66,350 66,350 19,701 37,854 8,795
Loans and receivables 64,477 64,477 64,477 - -
Cash and cash equivalents 94,982 94,982 94,982 - -
Total 1,096,983 1,106,995 358,369 605,109 143,517
Liabilities - 2019
Insurance contract liabilities 866,877 866,877 283,051 475,893 107,933
Payables 35,765 35,765 35,765 - -
Other provisions 8,417 8,417 8,417 - -
Convertible debt* - - - - -
Subordinated bond** 49,485 72,500 2,500 10,000 60,000
Total 960,544 983,559 329,733 485,893 167,933
*See note 29**Seenote30

FBD Holdings plc Annual Report 2019 143Strategic Report
Governance
Financial Statements
Other Inform
ation
41 FINANCIAL RISK MANAGEMENT (continued)
Assets – 2018
Carrying valuetotal
€000s
ContractedValue€000s
Cashflowwithin1 year€000s
Cashflow1-5 years
€000s
Cashflowafter
5 years€000s
Financial assets 866,091 888,704 144,927 640,873 102,904
Reinsurance assets 80,925 80,925 25,262 49,119 6,544
Loans and receivables 63,483 63,483 63,483 - -
Cash and cash equivalents 77,639 77,639 77,639 - -
Total 1,088,138 1,110,751 311,311 689,992 109,448
Liabilities – 2018
Insurance contract liabilities 920,900 920,900 300,983 510,677 109,240
Payables 33,234 33,234 33,234 - -
Other provisions 7,738 7,738 7,738 - -
Convertible debt* - - - - -
Subordinated bond** 49,426 75,000 2,500 10,000 62,500
Total 1,011,298 1,036,872 344,455 520,677 171,740
*See note 29**Seenote30
(c) Market riskThe Group has invested in term deposits, listed debt securities, investment property, quoted and unquoted shares and externally managed collective investment schemes which provide exposure to a broad range of asset classes. These investments are subject to market risk, whereby the value of the investments may fluctuate as a result of changes in market prices, changes in market interest rates or changes in the foreign exchange rates of the currency in which the investments are denominated. The extent of the exposure to market risk is managed by the formulation of, and adherence to, an Investment Policy incorporating clearly defined investment limits and rules, as approved annually by the Board of Directors and employment of appropriately qualified and experienced personnel and external investment management specialists to manage the Group’s investment portfolio. The overriding philosophy of the Investment Policy is to protect and safeguard the Group’s assets and to ensure its capacity to underwrite is not put at risk.

144
Notes to the Financial Statements (continued)
41 FINANCIAL RISK MANAGEMENT (continued)
Interest rate and spread riskInterest rate and spread risk arises primarily from the Group’s investments in listed debt securities and deposits and their movement relatively to the Group’s liabilities. The Group reviews its exposure to interest rate and spread risk on a quarterly basis by conducting an asset liability matching analysis. As part of this analysis it monitors the movement in assets minus liabilities for defined interest rate stresses and ensures that they remain within set limits as laid out in its Asset Liability Management Policy. Similar monitoring is done for spread risk.
At 31 December 2019, the Group held the following deposits and listed debt securities:
2019 2018
MarketValue€000s
Weightedaverageinterest
rate%
MarketValue€000s
Weightedaverageinterest
rate%
Time to maturity
In one year or less 169,259 1.81 135,517 1.13
In more than one year, but not more than two years 148,245 0.88 182,949 2.19
In more than two years, but not more than three years 185,279 1.21 133,480 1.03
In more than three years, but not more than four years 157,866 1.11 181,957 1.25
In more than four years, but not more than five years 67,902 1.35 129,182 1.17
More than five years 142,623 1.20 103,006 1.57
Total 871,174 866,091
Equity price riskThe Group is subject to equity price risk directly due to its holdings in quoted and unquoted shares and indirectly due to its holdings in collective investment schemes which invest in equities.
The amounts exposed to equity price risk at the reporting date are:
2019€000s
2018€000s
Equity exposure 45,714 23,962

FBD Holdings plc Annual Report 2019 145Strategic Report
Governance
Financial Statements
Other Inform
ation
41 FINANCIAL RISK MANAGEMENT (continued)
Foreign currency riskThe Group does not directly hold investment assets in foreign currencies; however, it does have exposure to non-euro exchange rate fluctuations through its collective investment scheme holdings. The underlying exposure to foreign currency is as follows.
Assets2019
€000s2018
€000sEmerging Markets 32,928 22,023USD 4,554 -Other OECD 743 -
The Group did not directly hold any derivative instruments at 31 December 2019 or 31 December 2018.
(d) Credit riskCredit risk is the risk of loss in the value of financial assets due to counterparties failing to meet all or part of their obligations.
Financial assets are graded according to current credit ratings issued by the main credit rating agencies. Investment grade financial assets are classified within the range of AAA to BBB ratings. Financial assets which fall outside this range are classified as speculative grade. All of the Group’s bank deposits are with financial institutions which have a minimum A- rating. The Group holds the following listed Government bonds (average credit rating: A) and listed corporate bonds (average credit rating: A-), with the following credit profile:
2019 2018Market
Value€000s
WeightedAverage
Duration
Marketvalue€000s
WeightedAverage
DurationGovernment bondsAAA 54,997 1.1 55,181 2.1AA+ 21,306 3.6 21,067 4.6AA 42,579 5.4 41,023 3.2A+ 41,060 2.2 41,288 3.2BBB+ 71,236 6.9 42,039 7.2BBB- 71,178 2.8 96,786 3.5Total 302,356 3.8 297,384 3.8
Corporate BondsAAA 937 1.7 2,252 1.6AA 12,508 1.5 12,584 2.5AA- 45,509 1.9 34,710 2.3A+ 45,133 2.1 62,939 2.6A 68,909 2.2 73,793 2.4A- 96,016 2.8 91,648 2.7BBB+ 109,077 2.5 115,365 2.8BBB 100,812 2.9 78,759 2.8BBB- 29,917 2.6 25,659 2.5Total 508,818 2.5 497,709 2.6

146
Notes to the Financial Statements (continued)
41 FINANCIAL RISK MANAGEMENT (continued)
All of the Group’s current reinsurers either have a credit rating of A- or better. The Group has assessed these credit ratings and security as being satisfactory in diminishing the Group’s exposure to the credit risk of its reinsurance receivables. At 31 December 2019, the maximum balance owed to the Group by an individual reinsurer, including reinsurers’ share of insurance contract liabilities not yet called, was €11,295,000 (2018: €19,790,000).
The carrying amount of financial assets recorded in the financial statements, net of any allowances for losses, represents the Group’s most significant exposure to credit risk. There are no financial assets past due but not impaired.
Receivables arising out of direct insurance operations are considered by the Directors to have low credit risk and therefore no provision for bad or doubtful debts has been made. All other receivables are due within one year and none are past due.
(e) Concentration riskConcentration risk is the risk of loss due to overdependence on a singular investment or category of business. The main concentration risks to which the Group is exposed, and how they are mitigated, are as follows:
n Exposure to a single country, counterparty or security as part of its sovereign or corporate bond portfolio. The Group mitigates this risk by placing limits on these exposures with its investment managers which are continuously monitored.
n Exposure to a single counterparty as part of its cash and deposit holdings. The Group mitigates this risk by placing limits on its total exposures to banking counterparties as set out in the Group’s Investment Policy, which is approved annually by the Board of Directors.
n While all of the Group’s underwriting business is conducted in Ireland, with a significant focus on the agri sector, it is spread over a wide geographical area with no concentration in any one county or region. The resultant concentration risk from adverse weather events, i.e. floods, storms or freezes in Ireland, are mitigated by a flood mapping solution and an appropriate reinsurance strategy.
Receivables arising out of direct insurance operations and other receivables have no significant concentration of risk.
(f) Sensitivity analysisThe table below identifies the Group’s key sensitivity factors. For each sensitivity test the impact of a change in a single factor is shown, with other assumptions left unchanged.
Sensitivity factor Description of sensitivity factor applied
Interest rate and investment return The impact of a change in the market interest rate by an increase of 1% or a decrease of 0.25%. For example if a current interest rate is 2%, the impact of an immediate change to 3% and 1.75%.
Exchange rates movement The impact of a change in foreign exchange rates by ± 10%.
Equity market values The impact of a change in equity market values by ±10%.
Available for sale investments The impact of a change in corporate bond market values by ±5%.
Property market values The impact of a change in property market values by ±10%.
Net loss ratios The impact of an increase in underwriting net loss ratios by 5%.
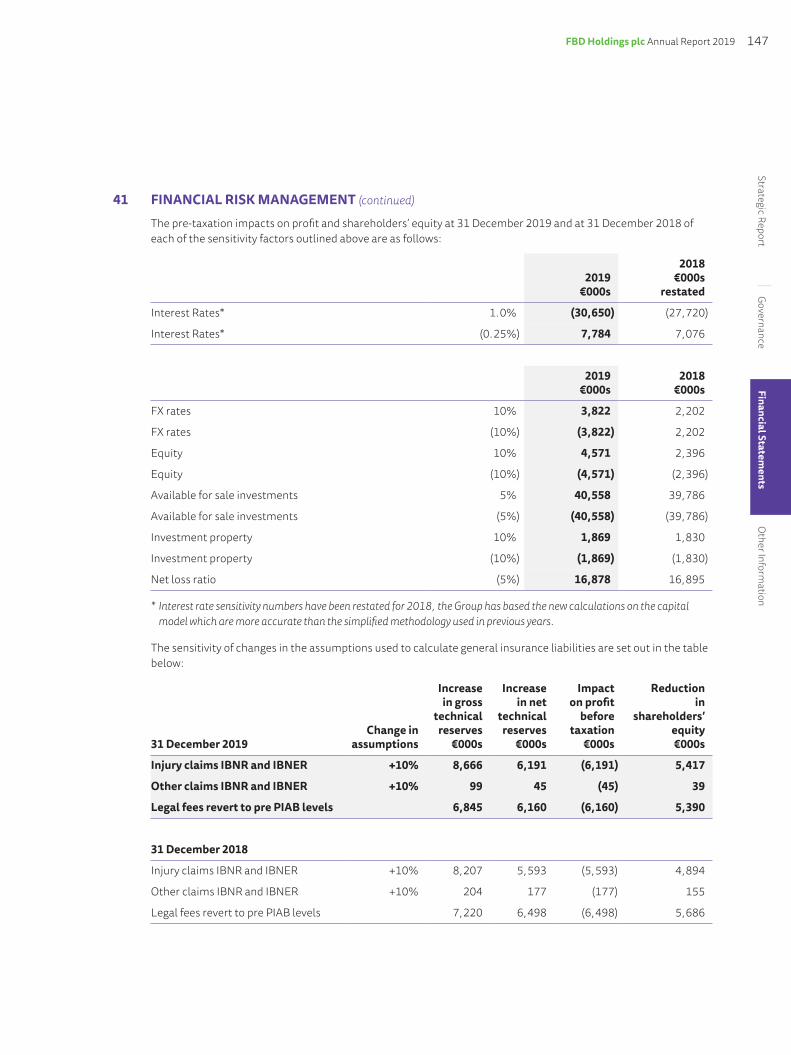
FBD Holdings plc Annual Report 2019 147Strategic Report
Governance
Financial Statements
Other Inform
ation
41 FINANCIAL RISK MANAGEMENT (continued)
The pre-taxation impacts on profit and shareholders’ equity at 31 December 2019 and at 31 December 2018 of each of the sensitivity factors outlined above are as follows:
2019€000s
2018€000s
restated
Interest Rates* 1.0% (30,650) (27,720)
Interest Rates* (0.25%) 7,784 7,076
2019€000s
2018€000s
FX rates 10% 3,822 2,202
FX rates (10%) (3,822) 2,202
Equity 10% 4,571 2,396
Equity (10%) (4,571) (2,396)
Available for sale investments 5% 40,558 39,786
Available for sale investments (5%) (40,558) (39,786)
Investment property 10% 1,869 1,830
Investment property (10%) (1,869) (1,830)
Net loss ratio (5%) 16,878 16,895
* Interestratesensitivitynumbershavebeenrestatedfor2018,theGrouphasbasedthenewcalculationsonthecapitalmodelwhicharemoreaccuratethanthesimplifiedmethodologyusedinpreviousyears.
The sensitivity of changes in the assumptions used to calculate general insurance liabilities are set out in the table below:
31 December 2019Change in
assumptions
Increasein gross
technicalreserves
€000s
Increasein net
technicalreserves
€000s
Impact on profit
beforetaxation
€000s
Reductionin
shareholders’equity€000s
Injury claims IBNR and IBNER +10% 8,666 6,191 (6,191) 5,417
Other claims IBNR and IBNER +10% 99 45 (45) 39
Legal fees revert to pre PIAB levels 6,845 6,160 (6,160) 5,390
31 December 2018
Injury claims IBNR and IBNER +10% 8,207 5,593 (5,593) 4,894
Other claims IBNR and IBNER +10% 204 177 (177) 155
Legal fees revert to pre PIAB levels 7,220 6,498 (6,498) 5,686

148
Notes to the Financial Statements (continued)
41 FINANCIAL RISK MANAGEMENT (continued)
Limitations of sensitivity analysisThe above tables demonstrate the effect of a change in a key assumption while other assumptions remain unchanged. In reality, there is a correlation between the assumptions and other factors. It should also be noted that these sensitivities are non-linear, and larger or smaller impacts should not be interpolated or extrapolated from these results. The sensitivity analysis does not take into consideration that the Group’s assets and liabilities are actively managed. Additionally, the financial position of the Group may vary at the time that any actual market movement occurs.
Other limitations in the above sensitivity analysis include the use of hypothetical market movements to demonstrate potential risk. They represent the Group’s view of possible near-term market changes that cannot be predicted with any certainty and assume that all interest rates move in an identical fashion.
42 IFRS 9 FINANCIAL INSTRUMENTS DEFERRAL DISCLOSURESAs set out in accounting policy K, the Group has chosen to defer application of IFRS 9 due to its activities being predominantly connected with insurance.
To facilitate comparison with entities applying IFRS 9, the table below presents an analysis of the fair value of the classes of financial assets as at the end of the reporting period, as well as the change in fair value during the reporting period. The financial asset classes are divided into two categories:
(i) Solely Payments of Principal and Interest (SPPI): assets of which cash flows represent solely payments of principal and interest on an outstanding principal amount, but are not meeting the definition of held for trading in IFRS 9, or are not managed on a fair value basis; and
(ii) Other (at FVTPL): all financial assets other than those specified in SPPI and Fair Value Option, financial assets:1. with contractual terms that do not give rise on specified dates to cash flows that are solely payments of
principal and interest on the principal amount outstanding;2. that meet the definition of held for trading in IFRS 9; or3. that are managed and whose performance are evaluated on a fair value basis.
Fair Values as of 31 December 2019
Financial assets
Financial assets that
passed SPPI€000s
Financial assets
measured on a fair
value basis€000s
Total€000s
Financial instruments
held for trading
€000s
Total Fair
Value€000s
Other receivables 63,866 - 63,866 - 63,866
Deposits with banks 60,000 - 60,000 - 60,000
Cash and cash equivalents 94,982 - 94,982 - 94,982
Available for sale investments - 811,986 811,986 - 811,986
Investments held for trading - - - 111,399 111,399
Total Financial Assets 218,848 811,986 1,030,834 111,399 1,142,233

FBD Holdings plc Annual Report 2019 149Strategic Report
Governance
Financial Statements
Other Inform
ation
42 IFRS 9 FINANCIAL INSTRUMENTS DEFERRAL DISCLOSURES (continued)
Fair Values as of 31 December 2018
Financial assets
Financial assets that
passed SPPI€000s
Financial assets
measured on a fair
value basis€000s
Total€000s
Financial instruments
held for trading
€000s
Total Fair
Value€000s
Other receivables 62,868 - 62,868 - 62,868
Deposits with banks 70,998 - 70,998 - 70,998
Cash and cash equivalents 77,639 - 77,639 - 77,639
Available for sale investments - 795,717 795,717 - 795,717
Investments held for trading - - - 78,778 78,778
Total Financial Assets 211,505 795,717 1,007,222 78,778 1,086,000
For receivables, loans and cash and cash equivalents carried at amortised cost, the carrying value is considered to be approximately equal to fair value.
The below table presents fair value movements on financial assets measured on a fair value basis and investments held for trading.
There was no material change in fair value during the year in respect of financial assets that passed the SPPI test.
Financial assets
measured on a fair
value basis€000s
Financial instruments
held for trading
€000s
Balance as at 1 January 2018 795,717 78,778
Additions 152,658 29,687
Disposals (143,289) (7,807)
Realised gains 432 138
Unrealised gains 6,468 10,603
Balance as at 31 December 2019 811,986 111,399
For financial assets whose cash flows represent SPPI as defined above, the table below provides information on credit risk exposure. The financial assets are categorised by asset class with a carrying amount measured in accordance with IAS 39 requirements.

150
Notes to the Financial Statements (continued)
42 IFRS 9 FINANCIAL INSTRUMENTS DEFERRAL DISCLOSURES (continued)
As at 31 December 2019
Rating
Other receivables
€000s
Deposits with banks
€000s
Cash and cash
equivalents€000s
AAA - - 6,577
AA- - - 18,000
A - 30,000 38,216
A- - 30,000 33,242
BBB - - (1,053)
Unrated 63,866 - -
Total 63,866 60,000 94,982
As at 31 December 2018
Rating
Other receivables
€000s
Deposits with banks
€000s
Cash and cash
equivalents€000s
AA- - - 3,918
A+ - 15,000 -
A - 30,000 50,748
A- - 25,998 20,202
BBB - - 37
BBB- - - 2,734
Unrated 62,868 - -
Total 62,868 70,998 77,639
Detail with respect to concentration risk is included at note 41(e).
43 SUBSEQUENT EVENTSThere have been no subsequent events which would have a material impact on the financial statements.

FBD Holdings plc Annual Report 2019 151Strategic Report
Governance
Financial Statements
Other Inform
ation
Alternative performance measures (APM’s)
For the financial year ended 31 December 2019
The Group uses the following alternative performance measures: Loss ratio, expense ratio, combined operating ratio, annualised investment return, net asset value per share, return on equity and gross premium written.
Loss ratio (LR), expense ratio (ER) and combined operating ratio (COR) are widely used as a performance measure by insurers, and give users of the financial statements an understanding of the underwriting performance of the entity. Investment return is used widely as a performance measure to give users of financial statements an understanding of the performance of an entities investment portfolio. Net asset value per share (NAV) is a widely used performance measure which provides the users of the financial statements the book value per share. Return on equity (ROE) is also a widely used profitability ratio that measures an entity’s ability to generate profits from its shareholder investments. Gross premium written refers to the revenue of an insurance company and is widely used across the general insurance industry.
The calculation of the APM’s is based on the following data:
Note2019
€000s2018
€000s
Loss ratio
Net claims and benefits 4(c) 148,679 183,367
Movement in other provisions 4(c) 7,946 7,064
Total claims incurred 4(c) 156,625 190,431
Net premium earned 337,553 337,903
Loss ratio (Total claims/Net premium earned) 46.4% 56.3%
Expense ratio
Other underwriting expenses 4(c) 87,259 84,054
Net premium earned 4(c) 337,553 337,903
Expense ratio (Underwriting expenses/Net premium earned) 25.9% 24.9%
Combined operating ratio % %
Loss ratio 46.4% 56.3%
Expense ratio 25.9% 24.9%
Combined operating ratio (Loss ratio + Expense ratio) 72.3% 81.2%
Note2019
€000s2018
€000s
Investment return
Investment return recognised in Consolidated Income Statement 5 17,892 2,482
Investment return recognised in Statement of Comprehensive Income 10,924 (7,845)
Total investment return 28,816 (5,363)
Average investment assets 1,073,429 1,047,711
Investment return % (Total investment return/Average investment assets) 2.7% -0.5%

152
2019 2018
Note €000s €000s
Net asset value per share
Shareholders’ funds – equity interests 372,228 283,483
Number of Shares
Number of ordinary shares in issue (excluding treasury) 24 34,862,464 34,666,201
Net asset value per share (NAV) (Shareholders funds/Closing number of ordinary shares)
Cent Cent
1,068 818
Return on Equity
Weighted average equity attributable to ordinary equity holders of the parent 327,856 277,555
Result for the period 98,225 42,383
Return on equity (Result for the period/Weighted average equity attributable to ordinary equity holders of the parent) 30% 15%
Gross premium written: The total premium on insurance underwritten by an insurer or reinsurer during a specified period, before deduction of reinsurance premium.
Expense ratio: Underwriting and administrative expenses as a percentage of net earned premium.
Loss ratio: Net claims incurred as a percentage of net earned premium.
Combined Operating Ratio: The sum of the loss ratio and expense ratio. A combined operating ratio below 100% indicates profitable underwriting results. A combined operating ratio over 100% indicates unprofitable results.
Alternative performance measures (APM’s) (continued)

Printed on paper sourced from sustainably managed forests.

fbd.ieFBD House, Bluebell, Dublin 12