protein analyses in myelomatosis - journal of clinical pathology
TRANSCRIPT

J. clin. Path., 28, Suppl. (Ass. Clin. Path.,) 6, 45-53
Protein analyses in myelomatosisP. M. CARTER, LINDA SLATER, JILL LEE, D. PERRY, AND J. R. HOBBS
From the Department of Chemical Pathology, Westminster Hospital, London
The criteria for the admission of patients to theMedical Research Council's (MRC) myeloma trialsare the finding of abnormal plasma cells in bonemarrow films or sections and in addition either ofcharacteristic skeletal lesions demonstrated radio-logically or of characteristic protein changes in theserum or urine. Ninety per cent of the patients inthe first myeloma trial satisfied all three criteria(Medical Research Council, 1971).
Before the introduction of alkylating agents in thetreatment of myelomatosis the median survival ofpatients with this disease was 17 months after theonset of symptoms and seven months after the startof treatment (Farhangi and Osserman, 1973). Thesurvival of patients is now much longer and this isdue partly to the introduction of alkylating agentssuch as melphalan and cyclophosphamide and partlyto improved techniques of biochemical monitoringof the tumour. The subject of this article is themonitoring of immunocytomas by biochemicalanalyses.
The Detection of Paraproteins
Plasma cells in the marrow and lymphoid tissuenormally make complete immunoglobulins. Thetwo heavy polypeptide chains are synthesized onlarge polyribosomes in about two and a half minutes,and the two light polypeptide chains are synthesizedon smaller polyribosomes in about one minute(Askonas and Williamson, 1967). The four poly-peptide chains are then assembled and carbohydrateis added in the Golgi apparatus. The production ofheavy and light chains is well balanced, there beingnormally a very small excess of light chains syn-thesized. About 2 to 3 mg of polyclonal free lightchain is excreted into the urine per day.
Differing chemical properties of the heavy chainsallow immunoglobulins to be divided into distinctclasses designated G, A, D, E, and M. Light chainsbelong to one of two types, K and A, which arecommon to all classes. Immunoglobulins in classesG, A, D, and E are, in normal adult serum, mono-mers of the basic four-chain unit, while those in classM are pentamers, and each immunoglobulin mole-
cule contains light chains of a single type only. In anormal mixture of immunoglobulins 70% of themolecules are type K and 30% are type A.Although normal immunoglobulins in any class
are heterogeneous and form a broad region oncellulose acetate electrophoresis, according toBurnett's theory each plasma cell synthesizesimmunoglobulins of one molecular type only(Marchalonis, 1968). Immunocytomas are tumoursderived from a single cell (Waldenstrom, 1962) andthe immunoglobulin products of all the cells in agiven tumour, whether they are complete moleculesor only fragments, are therefore identical. Suchhomogeneous products appear as discrete bandswhen stained after cellulose acetate electrophoresisand are termed 'paraproteins'. Some immunocyto-mas synthesize whole immunoglobulin moleculesonly but others synthesize immunoglobulin frag-ments either in addition to the whole molecules oras their sole product, and the significance of this isdiscussed later. By far the commonest fragmentproduced is intact light chain (molecular weightabout 22 000) which is excreted through the kidneyand is commonly present in the urine as a dimer.These light chains are the Bence-Jones proteins. Itis very much rarer for heavy chains to be made inexcess of light chains (Seligmann, 1972) and, whenpresent, they are usually incomplete polypeptidechains.The investigation of paraproteins can be of value
in the diagnosis of the underlying immunocytomaand for monitoring its progress. Serum, asciticfluid, and cerebrospinal fluid have all been analysedfor the presence of whole-molecular paraproteins andurine has been studied for small molecular weightfragments such as Bence-Jones proteins which canbe excreted through the kidney. If paraproteinstudies in body fluids are inconclusive, marrowtumour cells may be investigated (Hobbs, 1967)although this is rarely necessary.
Paraproteins are usually investigated by celluloseacetate electrophoresis and immunoelectrophoresisof serum and urine. Electrophoresis may be used toquantitate the amount of paraprotein present if thecellulose acetate strip is stained on completion of a
45
copyright. on 19 D
ecember 2018 by guest. P
rotected byhttp://jcp.bm
j.com/
J Clin P
athol: first published as 10.1136/jcp.s1-6.1.45 on 1 January 1975. Dow
nloaded from

P. M. Carter, Linda Slater, Jill Lee, D. Perry, and J. R. Hobbs
run and the proportion of dye bound to the para-
protein related to the total protein value of thesample. The techniques involved have recently beenreviewed by Kohn (1973). Before electrophoresis,urine may be concentrated up to 300 times byvacuum extraction through a collodion membrane(McLaughlin, 1972) and with this technique thelimit of detection of Bence-Jones protein can bereduced to about 6 mg/I. Serum paraproteins may
be detected by electrophoresis down to a level ofabout 2 g/l.
After detection of a discrete band on electro-phoresis, the presence of a paraprotein may beconfirmed by abnormal reactions on immunoelectro-phoresis, such as bowing or splitting of the arcs;
Bence-Jones proteins diffuse rapidly because of theirsmall size and characteristically form precipitin arcs
within two hours of adding antiserum to the plate.In addition to confirming the presence of a para-
protein, immunoelectrophoresis also identifies theclass of the abnormal immunoglobulin. In the firstMRC myeloma trial, of 258 patients 55% had an
IgG paraprotein, 26% had an IgA paraproteinand 19% Bence-Jones proteins only. Eight patientshad two paraproteins and five others had an IgDparaprotein (Medical Research Council, 1973).The detection of Bence-Jones protein by chemical
methods is not reliable (Hobbs, 1966). The Bradshaw
ring test is perhaps the best, although even this mayfail to detect about 1 in 20 Bence-Jones proteinurias.
Significance of the Presence of Paraproteins
The incidence of paraproteins in the serum of a
natural population is as high as 1 % over the age of50 and 3% over the age of 70 (Hall6n, 1966). Mostparaproteinaemias in populations outside hospitalare probably benign (Axelsson and Hallen, 1968),but this is not so for hospital patients. The diagnosesreached in 691 inpatients found to have serumparaproteins (Hobbs, 1969a) are shown in table I.About three-quarters of the patients had a widerange of malignant immunocytomas, myelomabeing the most common, and about one quarterhad benign conditions.
Paraproteins have rarely been reported in associa-tion with malignancies other than immunocytomasand a study of 2000 patients with various cancers
(Osserman, 1958) revealed only seven paraproteins,no more than the incidence for an age-matchednormal population.When a paraprotein has been found and identi-
fied, the laboratory results can be used to assesswhether the underlying lesion is likely to be malig-nant or benign. Table II shows the incidence of somebiochemical features in 517 patients with malignant
Diagnosis No. ofPatients Incidence (%)
1 Malignant immunocytomas (515 cases) 74Myclomatosis 420Waldenstrom's macroglobulinaemia 32Soft tissue plasmacytoma 20Lymphosarcoma 26Reticulosarcoina 6Chronic lymphatic leukaemia 5a-Chain disease 3Atypical myclosclerosis 2Giant follicular lymphoma I
2 Benign immunocytomas (158 cases) 23No associated pathology 112Monoclonal antibodies: 46
Primary cold agglutinins 37Lichen myxoedematosis 4Transient paraproteins 5
3 Uncertain 18 3
Table I Diagnoses in 691 inpatients with detectable serum paraproteins
Immunoglobulin Disorder Incidence (5%)
Malignant (517 Patients) Benign (112 Patients)
Immunoglobulin fragments present 84 0Immune paresis present 98 10Paraprotein level above 10 g/l serum 92 15Increase in paraprotein level with time 99 1
Table II Incidence of certain immunological disorders in 517 patients with malignant immunocytomas and112 with benign immunocytomas
46
copyright. on 19 D
ecember 2018 by guest. P
rotected byhttp://jcp.bm
j.com/
J Clin P
athol: first published as 10.1136/jcp.s1-6.1.45 on 1 January 1975. Dow
nloaded from

Protein analyses in myelomatosis
immunocytomas diagnosed by biopsy and in 112patients with benign immunocytomas who had beenfollowed for at least five years. Other findings whichcontribute to the diagnosis include, of course,
marrow biopsies and radiography, especially of theaxial skeleton. A low haemoglobin, low serum
albumin and high serum urea are further pointers tomalignancy.The finding of paraproteins in patients with
malignant immunocytomas is, however, not in-variable and 1 % of patients with myelomatosis donot synthesize sufficient paraproteins for them to bedetected in the serum by electrophoretic techniques(Hobbs, 1975).
Assessing Immunocytoma Mass
Apart from being diagnostically helpful, para-
protein studies may also be of value in assessing thesize of the underlying immunocytoma.
It was found from studies on experimentalplasmacytomata in mice that the weight of tumourwas proportional to the turnover of the associatedparaprotein (Nathans, Fahey, and Potter, 1958).Later it was found that tumour weight was alsorelated to the serum level of paraprotein (Osserman,Rifkind, Takatsuki, and Lawlor, 1964), andFakhri and Hobbs (1970), using 51Cr-labelled redcells to assess peritoneal fluid volume, showed a
direct relationship between the number of plasma-cytoma X5563 cells in the ascitic fluid of C3H miceand the serum paraprotein level (fig 1).
8
7
as
C.4
ctl
> 6
0)CU4 0 20 40 60 80 100 120 140 160 180
Millions of plasmacytomo cells in ascitic fluid
Fig 1 Serum paraprotein levels in C3H mice related tothe number ofplasmacytoma X5563 cells present in theascitic fluid.
Studies in vitro on marrow have shown that theamount of paraprotein synthesized by humanmyeloma cells is relatively constant at about 0.5 x
10-11 to 3-4 x 10-11 g/myeloma cell/day both fordifferent cultures and also for the same culture over
a period of time (Salmon and Smith, 1970). Thequantity of paraprotein synthesized in a givenpatient therefore varies with the tumour mass
(Salmon and Smith, 1970; Salmon, McIntyre, andOgawa, 1971), but the relationship with serum
concentration is not a simple one for all immuno-globulin classes, since the half-lives in vivo of some
immunoglobulins vary as a function of serum con-centration (Schultze and Heremans, 1966). Althoughthe fraction of the intravascular mass of IgG3, IgA,and IgM which is catabolized daily probably doesnot vary with changing serum concentrations, it doesvary for IgGi, IgG2, and IgG4 (Salmon, 1973).
Estimations of serum paraprotein levels do,however, allow assessments of tumour size, exceptin the 1 % of cases of myelomatosis in which para-protein synthesis is inadequate for detection byelectrophoresis of the serum.The average serum paraprotein levels in patients
with myelomatosis at the time of clinical presenta-tion are shown in table III. It can be calculated from
Paraprotein Level in Serum or Urine
IgG (subclasses 1, 2, 4) 43 g/l in serumIgG (subclass 3) 35 g/l in serumIgA 28 g/l in serumIgD 14 g/l in serumBence Jones only 5.4 g/24 hours in urine
Table III Average serum paraprotein levels in patientswith myelomatosis at clinical presentation
the turnover rate in vivo that for IgA the serum levelof 28 g/l reflects a tumour mass of about 4.6 x 10¹¹cells, approximately 1 kg of tumour. Similar cal-culations for IgG and IgD, allowing for differencesin their turnover rates at different serum levels,indicate that for these proteins also, the averageserum levels found on clinical presentation reflect atumour mass of about 1 kg. A similar value hasalso been reported by other authors for variousimmunoglobulin classes including an IgE para-protein (Salmon et al, 1971).
Examination of bone marrows from 230 patientswith myelomatosis at the time of clinical presenta-tion revealed on average a 33% replacement withtumour cells (Hobbs, 1971). Since it has been esti-mated that the average weight of bone marrow in a70-kg patient is 3-2 kg (Mechanik, 1926) thesefindings too suggest the presence of about a kilogramof myeloma.
47
0 .0
0 ,K, .
copyright. on 19 D
ecember 2018 by guest. P
rotected byhttp://jcp.bm
j.com/
J Clin P
athol: first published as 10.1136/jcp.s1-6.1.45 on 1 January 1975. Dow
nloaded from

P. M. Carter, Linda Slater, Jill Lee, D. Perry, and J. R. Hobbs
Kinetics of Tumour Growth
The way in which immunocytomas grow is thesubject of some debate. Using a 'sandwich' radio-immunoassay technique to estimate nanogramquantities of paraproteins secreted by fresh myelomacells in vitro (Salmon, Mackey, and Fudenberg,1969) 70 myeloma patients were studied over aperiod of two to four years. The findings suggestthat, while tumour growth is initially exponential,growth rate slows as the tumour enlarges and,although the doubling time of the tumour onpresentation may be four to six months, it initiallycould be very much shorter, perhaps one to threedays (Sullivan and Salnon, 1972). It has been arguedthat the growth of all animal tumours may be betterdescribed by a Gompertzian growth curve' (Laird,1964) than by a first-order kinetic model and thiswould imply that myelomas take only one to twoyears to develop from a single cell to a tumourwhich presents clinically. Support for the concept ofvery rapidly enlarging immunocytomas is given bythe appearance of bands on electrophoresis only afew weeks after antigenic challenge during mono-clonal responses to severe infection such as hepatitisor to bone marrow transplantation (Salmon, 1973),and by the generation time of myeloma cells in vivoas determined with tritiated thymidine (Killman,Cronkite, Fleidner, and Bond, 1962).The growth of plasmacytomas in mice, however,
has been shown to be exponential to a tumour sizeof 108 cells (Fakhri and Hobbs, 1970) and studies ofnearly 1000 MRC trial patients have enabledobservations to be made on 94 untreated patientswith progressive myelomatosis which also supportthe idea of simple exponential growth (Hobbs, 1967).The median tumour doubling time for IgA
myelomatosis at first presentation is 6.3 months(Hobbs, 1969b) and for IgG myelomatosis about sixmonths also (Salmon and Smith, 1970). Extra-polation, assuming simple exponential growth atthis rate, suggests that 21 years is required for anIgA myeloma to develop from one cell to a kilogramof tumour (Hobbs, 1971) and about 33 years for anIgG myeloma (Hobbs, 1969c).There is much evidence to support the existence
of a very long preclinical period in myelomatosis:(1) recurrence of disease has been reported as long as17 years after removal of a solitary plasmacytoma(Wiltshaw, 1969); (2) accidental detection of para-proteins has been reported 15 to 24 years before theclinical emergence ofmyelomatosis(N0rgaard, 1971);(3)no patients under the age of 29 had been reportedwith IgG or IgA myeloma (Hobbs, 1969b); (4) sixpatients in the MRC myeloma trial were found to'Progressive slowing of the rate of growth.
have a paraprotein eight years before any tumourwas clinically evident; (5) one patient is reported tohave developed an IgG myeloma with paraproteinantibody activity against horse 02-macroglobulin 33years after an injection of horse serum (Seligmann,Sassy, and Chevalier, 1973).A myeloma in most of the above patients could
not have evolved in the length of time suggested byGompertzian growth kinetics. Because of the natureof the tumour, it may be that myeloma growthkinetics differ from those of more discrete tumours.Whether tumour growth is Gompertzian or expo-nential throughout the natural history of the disease,serum paraprotein levels do reflect the mass of theunderlying tumour and may therefore be used tomonitor changes in tumour mass over a period oftime.
Monitoring Tumour Responses to Therapy
Without treatment, less than 50% of patients withmyelomatosis survive one year from clinical presen-tation (Feinleib and MacMahon, 1960; Innes andNewall, 1961). In patients surviving six months toone year after clinical presentation there would be afurther one to two doublings in tumour mass toabout 1-2 x 10¹² cells, about 3 kg oftumour, causingbone marrow failure. If areas other than normal redmarrow are invaded, larger masses of tumour maybe tolerated and higher levels of serum paraproteinsobserved.The introduction of alkylating agents has greatly
extended the time of survival of patients withmyeloma by causing reductions in tumour mass.Many criteria have been used to assess the re-
sponses of tumours to chemotherapy. It has beensuggested that a good response would be a 10 to100-fold reduction in tumour mass (Salmon, 1973)but criteria proposed by the Chronic LeukaemiaTaskforce of the National Cancer Institute (cited bySnapper and Kahn, 1971) included a 50% reductionin both serum paraprotein concentration andBence-Jones proteinuria compared with initial levels.By these latter criteria about 82% of patients in thefirst MRC myeloma trial would be considered tohave responded to chemotherapy.
Observations on MRC myeloma trial patientsover nine years indicate that paraprotein levelsreflect the response to treatment in 98% of patientsif both serum and urine are investigated (Hobbs,1974). In 2% of patients, however, a tumour maycontinue to enlarge with no corresponding rise inserum paraprotein levels.There is a variable rate of fall of serum paraprotein
levels in patients responding to chemotherapy, notexplained by differences in the in-vivo half-lives of the
48
copyright. on 19 D
ecember 2018 by guest. P
rotected byhttp://jcp.bm
j.com/
J Clin P
athol: first published as 10.1136/jcp.s1-6.1.45 on 1 January 1975. Dow
nloaded from

Protein analyses in myelomatosis
MONTHS
Fig 2 Changes in serum IgG, paraprotein levels infour representative patients with similar initial levels ofparaprotein during treatment ofmyelomatosis withcyclophosphamide or melphalan. Slow reduction is whenthe paraprotein level falls to 50% of the initial levelbut takes more than three months, and rapid reductionis when the paraprotein level falls to 50% of the initiallevel within three months.
various immunoglobulin classes and subclasses (fig2). The effects of chemotherapy on serum para-protein levels were studied in 167 patients. Onehundred and seven patients (64%) showed a slowresponse (a reduction of paraprotein level by 50%but not within three months), 30 patients (18%)showed a fast response (a reduction of paraproteinlevel by 50% within three months), 25 patients (15 %)showed little change, and five patients (3 %) showedan increasing paraprotein level (Hobbs, 1969c).The responses to therapy of myeloma patients withBence-Jones proteinuria only show a similarpattern.Whatever the rate of response to chemotherapy,
reduction in tumour size has been shown to fitGompertzian kinetics (Sullivan and Salmon, 1972).Their explanation is that as the tumour size decreasesso the 'proliferating compartment' of the tumour in-creases. Eventually the tumour size reaches a plateauwhere there is a balance between an increased tumourcell death due to chemotherapy and an increasedtumour cell birth due to an expanded proliferating
compartment. Such retarded regression would beexpected with drugs which produce a constantfractional kill of tumour cells. If the 'plateau'amount of tumour is such that the amount of para-protein synthesized is below the level of detection byelectrophoresis, monitoring of this phase of thedisease becomes impossible by usual methods andincreases in tumour size will only be detected whenthe paraprotein again becomes visible on the electro-phoretic strip. Another possibility is that chemo-therapy selects those subclones of the tumour whichare more resistant to the cytotoxic agents.
Factors of Prognostic Significance
The investigation of patients both at clinical presen-tation and subsequently has enabled the prognosticevaluation of many factors. Investigations of diag-nostic value tested for prognostic value in patientsgiven continuous cytotoxic treatment in the firstMRC myeloma trial, and found to be of no prognos-tic significance, are shown in table IV (Peto, 1971).It is interesting that the serum paraprotein level atpresentation is of no prognostic value in patients onchemotherapy.
Parameters at diagnosis which have been foundto be of prognostic value are listed in table V; eachis of value independently of the others.High serum urea and heavy non-Bence-Jones
proteinuria independently indicate renal damage, anda low haemoglobin may indicate preexisting bonemarrow suppression limiting effective cytotoxicchemotherapy.The presence of Bence-Jones proteinuria reflects
biochemical dedifferentiation and may indicate thepresence of a more dedifferentiated and fastergrowing tumour (Hobbs, 1969c). The finding of anyimmunoglobulin fragment in the sera of patientswith these tumours would have similar significance(Hobbs, 1971). The production of Bence-Jonesprotein alone, which may reflect an even greaterdegree of tumour dedifferentiation, is associated witha very poor prognosis (Medical Research Council,1973).Whether the Bence-Jones protein present is type K
orAmayalso be important. The median survival of 22patients in the first MRC myeloma trial with type-
Radiology Serum Blood
Lytic bone lesions Calcium Leucocyte countWedging of vertebrae Alkaline phosphatase Platelet countCollapse of vertebrae Uric acidOsteoporosis Paraprotein level
Table IV Factors at diagnosis ofno prognostic significance in patients receiving continuous cytotoxic treatment
49
copyright. on 19 D
ecember 2018 by guest. P
rotected byhttp://jcp.bm
j.com/
J Clin P
athol: first published as 10.1136/jcp.s1-6.1.45 on 1 January 1975. Dow
nloaded from

P. M. Carter, Linda Slater, Jill Lee, D. Perry, and J. R. Hobbs
Investigation Death Rate Relative toan Overall Value of 10
Serum albumin (g/l) Above 30 0.720-29 1*1Below 19 1-8
Serum urea (mmol/l) Below 6-7 0-66-7-13-1 1.1Above 13-1 3-2
Non-Bence-Jonesproteinuria (g/l) Below 0-4 0-8
Above 0.4 1-6Bence-Jones
proteinuria (g/l) Below 0-1 0-7Above 2-0 3.41
Haemoglobin (g/dl) Above 100 0575-99 1*1Below 7.5 2-0
Table V Parameters at diagnosis ofprognosticsignificance in patients receiving continuous cytotoxictreatmentThis high value is associated with an increased incidence of uraemia
0
j
-t
:9
ma
YEARS
Fig 3 Survival ofpatients in the first MRC myelomatrial related to their serum albumin concentration onadmission to the trial.
Bence-Jones-only myeloma was five months, whereasthe median survival of 31 patients with type KBence-Jones-only myeloma was only two months.Serum albumin levels on clinical presentation are
also of prognostic value and vary independently ofother factors such as proteinuria or paraprotein levelon presentation. The survival of patients in the firstMRC myeloma trial related to the serum albuminconcentrations on admission to the trial is shown infigure 3.The reasons for the correlation of original serum
albumin levels with prognosis are not fully under-stood; low albumin values have been reported in awide range of both benign and malignant diseases(Zilva and Pannall, 1971). It has been shown,however, that in tissue culture normal cells pino-cytose albumin in small regular droplets, whereasmalignant cells engulf albumin in larger, irregulardroplets (Cohen, Beiser, and Hsu, 1961). It may besuggested therefore that an originally low serumalbumin level, not due either to protein loss fromthe body or hepatic disease, could indicate a highconsumption of albumin by the tumour. Althoughour preliminary findings tend to support thisexplanation, no conclusive studies on albuminturnover in patients with myelomatosis have yetbeen reported.Apart from features present at clinical presenta-
tion, the rate of response of the tumour to chemo-therapy, as previously defined, has also correlatedwith subsequent prognosis (Hobbs, 1969c). Thesurvival of 167 patients in the first MRC myelomatrial according to the rate of response to chemo-therapy is shown in figure 4. It can be seen that thesurvival of those who responded slowly was betterthan those whose response was fast. It may be that
Co
YEARS
Fig 4 Survival of 167 patients in the first MRCmyeloma trial related to their response tochemotherapy, whether fast (paraprotein levelfalling tohalf initial level within three months, 30 patients) slow(paraprotein level falling to half initial level but notwithin three months, 107 patients) or insignificant (30patients).
those tumours which respond rapidly to chemo-therapy are those with the highest proportion ofmitotic cells and that a slow response reflects a lowfrequency of mitosis.
Results of Therapy
Of the 258 patients in the first MRC myeloma trial45% were alive two years after diagnosis and 11 %five years after diagnosis. Survival rates as high as40% of patients five years after diagnosis with anaverage survival of 55 months have been claimedfor other series (Farhangi and Osserman, 1973).
so
copyright. on 19 D
ecember 2018 by guest. P
rotected byhttp://jcp.bm
j.com/
J Clin P
athol: first published as 10.1136/jcp.s1-6.1.45 on 1 January 1975. Dow
nloaded from

Protein analyses in myelomatosis
During studies of patients admitted to the first MRCmyeloma trial (1964 to 1968) serum paraproteinsbecame undetectable in 21 patients of whom nineare still alive and well. This group forms a largeproportion of the 17 patients still surviving from thistrial.
Despite the introduction of chemotherapy, there-fore, perhaps half the patients with myelomatosisdie within two years of diagnosis. There are manycauses of death and in one series of 145 fatal cases ofmyelomatosis (Hobbs, 1971) the cause of death wasnot related to the myeloma in seven patients, in-directly related to the myeloma in 11 patients, dueto a failure to respond to chemotherapy and relent-less progression of the tumour in 40 patients anddue to an escape from chemotherapy after an initialresponse to therapy in 87 patients.
This last group of patients accounted for 60% ofthe deaths in this series, and the ways in whichthey escaped from therapy after initially respondingare shown in table VI. Simple escapes are those
Modes of Escape Incidence ( %)
Simple escape 55Growth rate escapes (42)
(a) Same paraprotein during relapse 2(b) Different paraprotein during relapse 5(c) More Bence-Jones during relapse 35
Non-myeloma escapes (3)(a) Reticulosarcoma 2(b) Monocytic leukaemia 1
Table VI Escapes from therapy in patients withmyelomatosis
where the paraprotein level rises at a rate identicalwith the rate of rise before the onset of therapywhilst growth rate escapes are those where the para-protein level rises faster than before, reflecting anincreased tumour growth rate.There are a number of ways in which increased
tumour growth rate may be detected: (1) there maybe an increased rate of appearance of the sameserum paraprotein that was present before the onsetof chemotherapy; (2) there may be an increased rateof synthesis of Bence-Jones protein only, by thetumour; (3) the paraprotein which increases duringtreatment may be different from that present beforethe onset of chemotherapy.
All the growth rate escapes in the MRC studieshave occurred after at least six months of cytotoxictherapy and it may be that the treatment has eitherselected or generated a faster growing element fromthe original clone. The latter is the more likely as ourcurrent cytotoxic agents acting on DNA may, by
their very actions, generate mutations (Hobbs, 1971).Fingerprint studies both of original paraproteins
and of different paraproteins which have appearedsubsequently during treatment may show singlepeptide changes due, perhaps, to single amino acidchanges (Hobbs, 1975). Such changes could beexplained by one-point alterations to single DNAcodons. The escape from treatment may also be dueto the development of another malignancy such as areticulosarcoma or a monocytic leukaemia. The riskof another such malignancy developing during treat-ment with cytotoxic agents increases after five yearsof chemotherapy (Osserman, 1969). Where adiagnosis of myeloma has been clearly establishedsuch a risk is worth taking. Where it is possible thatthe underlying lesion is a benign immunocytoma,however, it is probably best to wait until the diagno-sis of malignancy becomes more certain beforecommencing cytotoxic therapy.
Current Trends in Techniques of Monitoring
Serum paraprotein and urine Bence-Jones proteinlevels have so far been detected and quantitatedroutinely only by electrophoretic and dye-bindingtechniques within the relatively insensitive limits ofdetection already mentioned.We have recently developed a rocket immuno-
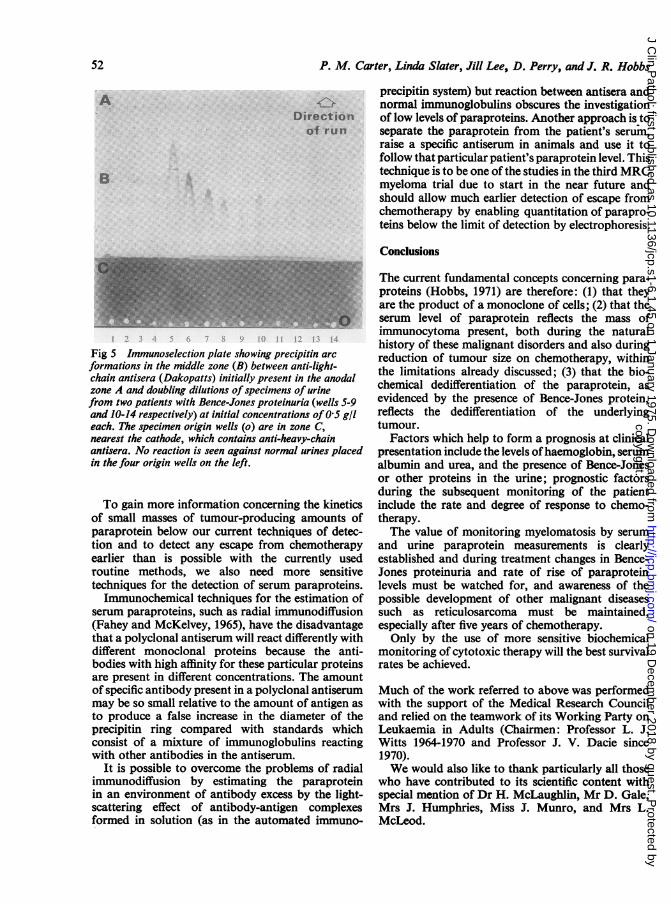
selection technique for the detection of free lightchains in unconcentrated urine down to a level of3 to 5 mg/1. The technique is similar in principle tothat recently described for the detection of heavychain fragments (Gale, Versey, and Hobbs, 1974).The sample is run through an agarose zone con-taining anti-heavy-chain antisera which precipitatesall the intact immunoglobulins. Free light chainscontinue to migrate anodally towards another aga-rose zone containing anti-light-chain antiseraagainst which precipitin 'rockets' are formed. Figure5 shows the reactions produced by normal urines andby doubling dilutions of specimens of urine fromtwo patients with Bence-Jones proteinuria at initialconcentrations of 0.5 g/l. The normal urines produceno reaction and the difference in peak heights forthe neat samples from the two patients with Bence-Jones proteinuria reflects the differing reactivity ofthe two monoclonal proteins with the same anti-serum. Although positive results would have to beconfirmed as representing Bence-Jones protein bythe demonstration of a discrete band on electro-phoresis of concentrated urine, negative resultseliminate the possible presence of Bence-Jonesprotein. This technique could therefore be useful asa very sensitive test for large numbers of urines andwould also be useful for follow-up studies onpatients known to have Bence-Jones proteinuria.
51
copyright. on 19 D
ecember 2018 by guest. P
rotected byhttp://jcp.bm
j.com/
J Clin P
athol: first published as 10.1136/jcp.s1-6.1.45 on 1 January 1975. Dow
nloaded from
P. M. Carter, Linda Slater, Jill Lee, D. Perry, and J. R. Hobbs
1 2 3 4 5 6 7 8 9 10 11 12 13 14
Fig 5 Immunoselection plate showing precipitin arc
formations in the middle zone (B) between anti-light-chain antisera (Dakopatts) initially present in the anodalzone A and doubling dilutions ofspecimens of urinefrom two patients with Bence-Jones proteinuria (wells 5-9and 10-14 respectively) at initial concentrations of 0.5 g/leach. The specimen origin wells (o) are in zone C,nearest the cathode, which contains anti-heavy-chainantisera. No reaction is seen against normal urines placedin the four origin wells on the left.
To gain more information concerning the kineticsof small masses of tumour-producing amounts ofparaprotein below our current techniques of detec-tion and to detect any escape from chemotherapyearlier than is possible with the currently usedroutine methods, we also need more sensitivetechniques for the detection of serum paraproteins.Immunochemical techniques for the estimation of
serum paraproteins, such as radial immunodiffusion(Fahey and McKelvey, 1965), have the disadvantagethat a polyclonal antiserum will react differently withdifferent monoclonal proteins because the anti-bodies with high affinity for these particular proteinsare present in different concentrations. The amountof specific antibody present in a polyclonal antiserummay be so small relative to the amount of antigen asto produce a false increase in the diameter of theprecipitin ring compared with standards whichconsist of a mixture of immunoglobulins reactingwith other antibodies in the antiserum.
It is possible to overcome the problems of radialimmunodiffusion by estimating the paraproteinin an environment of antibody excess by the light-scattering effect of antibody-antigen complexesformed in solution (as in the automated immuno-
precipitin system) but reaction between antisera andnormal immunoglobulins obscures the investigationof low levels of paraproteins. Another approach is toseparate the paraprotein from the patient's serum,raise a specific antiserum in animals and use it tofollow that particular patient's paraprotein level. Thistechnique is to be one of the studies in the third MRCmyeloma trial due to start in the near future andshould allow much earlier detection of escape fromchemotherapy by enabling quantitation of parapro-teins below the limit of detection by electrophoresis.
Conclusions
The current fundamental concepts concerning para-proteins (Hobbs, 1971) are therefore: (1) that theyare the product of a monoclone of cells; (2) that theserum level of paraprotein reflects the mass ofimmunocytoma present, both during the naturalhistory of these malignant disorders and also duringreduction of tumour size on chemotherapy, withinthe limitations already discussed; (3) that the bio-chemical dedifferentiation of the paraprotein, asevidenced by the presence of Bence-Jones protein,reflects the dedifferentiation of the underlyingtumour.
Factors which help to form a prognosis at clinicalpresentation include the levels ofhaemoglobin, serumalbumin and urea, and the presence of Bence-Jonesor other proteins in the urine; prognostic factorsduring the subsequent monitoring of the patientinclude the rate and degree of response to chemo-therapy.The value of monitoring myelomatosis by serum
and urine paraprotein measurements is clearlyestablished and during treatment changes in Bence-Jones proteinuria and rate of rise of paraproteinlevels must be watched for, and awareness of thepossible development of other malignant diseasessuch as reticulosarcoma must be maintained,especially after five years of chemotherapy.Only by the use of more sensitive biochemical
monitoring of cytotoxic therapy will the best survivalrates be achieved.
Much of the work referred to above was performedwith the support of the Medical Research Counciland relied on the teamwork of its Working Party onLeukaemia in Adults (Chairmen: Professor L. J.Witts 1964-1970 and Professor J. V. Dacie since1970).We would also like to thank particularly all those
who have contributed to its scientific content withspecial mention of Dr H. McLaughlin, Mr D. Gale,Mrs J. Humphries, Miss J. Munro, and Mrs L.McLeod.
52
copyright. on 19 D
ecember 2018 by guest. P
rotected byhttp://jcp.bm
j.com/
J Clin P
athol: first published as 10.1136/jcp.s1-6.1.45 on 1 January 1975. Dow
nloaded from

Protein analyses in myelomatosis 53
References
Askonas, B. A., and Williamson, A. R. (1967). Balanced synthesis oflight and heavy chains of Immunoglobulin G. Nature (Lond.),216, 264.
Axelsson, U., and Hallen, J. (1968). Review of fifty-four subjects withmonoclonal gammopathy. Brit. J. Haemat., 15, 417.
Cohen, S., Beiser, S. M., and Hsu, K. C. (1961). Immunohistochemicalstudy of the uptake of serum proteins by neoplastic liver cells.Cancer Res., 21, 1510.
Fahey, J. L., and McKelvey, E. M. (1965). Quantitative determinationofserum immunoglobulins in antibody-agar plates. J. Immunol.,94, 84.
Fakhri, 0., and Hobbs, J. R. (1970). The serum paraprotein levelrelated to the number of plasmacytoma-5563 cells in C3Hmice. Brit. J. Cancer, 24, 395.
Farhangi, M., and Osserman, E. F. (1973). The treatment of multiplemyeloma. Sem. Haemat., 10, 149.
Feinleib, M., and MacMahon, B. (1960). Duration of survival inmultiple myeloma. J. nat. Cancer Inst., 24, 1259.
Gale, D. S. J., Versey, J. M. B., and Hobbs, J. R. (1974). Rocketimmuno-selection for detection of heavy chain diseases. Clin.Chem., 20, 1292.
Halln, J. (1966). Discrete gammaglobulin (M-) components in serum:clinical study of 150 subjects without myelomatosis. Acta med.scand., Suppl. 462, 127pp.
Hobbs, J. R. (1966). The detection of Bence-Jones proteins. Biochem.J., 99, l5P.
Hobbs, J. R. (1967). Paraproteins, benign or malignant? Brit. med. J.,3, 699.
Hobbs, J. R. (1969a). Paraproteins. Proc. roy. Soc. Med., 62, 773.Hobbs, J. R. (1969b). lmmunochemical classes of myelomatosis. Brit.
J. Haemat., 16, 599.Hobbs, J. R. (1969c). Growth rates and responses to treatment in
human myelomatosis. Brit. J. Haemat., 16, 607.Hobbs, J. R. (1971). Immunocytoma o' Mice an' Men. Brit. med. J.,
2, 67.Hobbs, J. R. (1975). Monitoring myelomatosis. Arch. intern. Med.,
135, 125.Innes, 3., and Newall, J. (1961). Myelomatosis. Lancet, 1, 239.Killmann, S. A., Cronkite, E. P., Fleidner, T. M., and Bond, V. P.
(1962). Cell proliferation in multiple myeloma studied withtritiated thymidine in vivo. Lab. Invest., 11, 845.
Kohn, J. (1973). The laboratory investigation of paraproteinaemia.In Recent Advances in Clinical Pathology, edited by S. C. Dyke.Series VI, p. 363. Churchill Livingstone, Edinburgh andLondon.
Laird, A. K. (1964). Dynamics of tumour growth. Brit. J. Cancer, 18,490.
Marchalonis, J. 3., and Nossal, G. J. (1968). Electrophoretic analysisof antibody produced by single cells. Proc. nat. Acad. Sci.(Wash.), 61, 860.
McLaughlin, H. (1972). Immunoglobulin-bearing lymphocytes invarious immunocyte disorders. MD Thesis, University College,Dublin. 126pp.
Mechanik, N. (1926). Untersuchungen uber das Gewicht des Knocken-markes des Menschen. Z. Ges. Anat., Abt. 1., 79, 58.
Medical Research Council (1971). Myelomatosis: comparison ofmelphalan and cyclophosphamide therapy. Brit. med. J., 1,640.
Medical Research Council (1973). Report on the first myelomatosistrial. Part 1. Analysis of presenting features of prognosticimportance. Brit. J. Haemat., 24, 123-139.
Nathans, D., Fahey, J. L., and Potter, M. (1958). The formation of amyeloma protein by a mouse plasma cell tumor. J. exp. Med.,108, 121-130.
N0rgaard, 0. (1971). Three cases of multiple myeloma in which thepreclinical asymptomatic phases persisted throughout 15-24years. Brit. J. Cancer, 25, 417.
Osserman, E. F. (1958). Natural history of multiple myeolma beforeradiological evidence of disease. Radiology 71, 157-174.
Osserman E. F., Rifkind, R. A., Takatsuki, K., and Lawlor, D. P.(1964). Studies of morphogenesis and protein synthesis inthree mouse plasma cell tumours (X 5563, ADJ.PC-6C, andADJ.PC-20). Ann. N. Y. Acad. Sci., 113, 627.
Osserman, E. F. (1969). Clinical and biochemical studies of plasma-cytic and monocytic dyscrasias and their interrelationships.Trans. Coil. Physcns, Philad., 36, 134.
Peto, R. (1971). Urea, albumin and response rates. Brit. med. J., 2, 324.Salmon, S. E. (1973). Immunoglobulin synthesis and tumour kinetics
of multiple myeloma. Semi. Haemat., 10, 135.Salmon, S. E., Mackey, G., and Fudenberg, H. H. (1969). 'Sandwich'
solid phase radioimmunoassay for the quantitative determina-tion of human immunoglobulins. J. Immunol., 103, 129.
Salmon, S. E., McIntyre, 0. R., and Ogawa, M. (1971). IgE myeloma:total body tumour cell number and synthesis of IgE andD.N.A. Blood, 37, 696.
Salmon, S. E., and Smith, B. A. (1970). Immunoglobulin synthesis andtotal body tumor cell number in IgG multiple myeloma. J.clin. Invest., 49, 1114.
Schultze, H. E., and Heremans, J. F. (1966). Molecular Biology ofHuman Proteins, ch. 2. Elsevier, Amsterdam.
Seligmann, M. (1972). Heavy chain diseases. Europ. J. clin. biol. Res.,17, 349.
Seligmann, M., Sassy, C., and Chevalier, A. (1973). A human IgGmyeloma protein with anti-a, macroglobulin antibody activity.J. Immunol., 110, 85-90.
Snapper, I., and Kahn, A. (1971). Myelomatosis: Fundamentals andClinical Features, p. 293, ch. 28. Karger, Basel.
Sullivan, P. W., and Salmon, S. E. (1972). Kinetics of tumour growthand regression in IgG multiple mycloma. J. clin. Invest., 51,1697.
Waldenstrom, J. (1962). Monoclonal and polyclonal gammopathiesand the biological system ofgamma globulins. Progr. Allergy, 6,320.
Wiltshaw, E. (1969). The natural history of extramedullary plasma-cytoma. MD Thesis, University of London. 118pp.
Zilva, J. F., and Pannall, P. R. (1971). Clinical Chemistry in Diagnosisand Treatment, ch. 8. Lloyd-Luke, London.
copyright. on 19 D
ecember 2018 by guest. P
rotected byhttp://jcp.bm
j.com/
J Clin P
athol: first published as 10.1136/jcp.s1-6.1.45 on 1 January 1975. Dow
nloaded from