protein and energy requirements in infancy and …soh.iums.ac.ir/uploads/.11.pdfprotein and energy...
TRANSCRIPT


Protein and Energy Requirements in Infancy and Childhood


Protein and Energy
Requirements in Infancy
and Childhood
EditorsJacques Rigo, Liège, BelgiumEkhard E. Ziegler, Iowa City, IA, USA
Nestlé Nutrition Workshop Series Pediatric Program, Vol. 58

Nestec Ltd., 55 Avenue Nestlé, CH–1800 Vevey (Switzerland) S. Karger AG, P.O. Box, CH–4009 Basel (Switzerland) www.karger.com
© 2006 Nestec Ltd., Vevey (Switzerland) and S. Karger AG, Basel (Switzerland). All rights reserved.This book is protected by copyright. No part of it may be reproduced, stored in a retrieval system, ortransmitted, in any form or by any means, electronic, mechanical, photocopying, or recording, orotherwise, without the written permission of the publisher.
Printed in Switzerland on acid-free paper by Reinhardt Druck, BaselISSN 1661–6677ISBN-10: 3–8055–8081–9ISBN-13: 978–3–8055–8081–6
Library of Congress Cataloging-in-Publication Data
Protein and energy requirements in infancy and childhood / editors, Jacques Rigo, Ekhard E. Ziegler.p. ; cm. – (Nestlé Nutrition workshop series. Pediatric program,
ISSN 1661–6677 ; v. 58)Includes bibliographical references and index.ISBN 3-8055-8081-9 (hard cover : alk. paper)1. Infants–Nutrition. 2. Children–Nutrition. 3. Proteins. 4. Deficiency
diseases. I. Rigo, Jacques. II. Ziegler, Ekhard E. III. Nestlé NutritionInstitute. IV. Series: Nestlé Nutrition workshop series. Paediatric programme ; v. 58.
[DNLM: 1. Child Nutrition. 2. Infant Nutrition. 3. NutritionalRequirements. W1 NE228D v.58 2006 / WS 130 P967 2006]RJ206.P76 2006618.92�01–dc22
2006012322
Basel · Freiburg · Paris · London · New York ·
Bangalore · Bangkok · Singapore · Tokyo · Sydney
The material contained in this volume was submitted as previously unpublished material, except inthe instances in which credit has been given to the source from which some of the illustrative materialwas derived.
Great care has been taken to maintain the accuracy of the information contained in the volume.However, neither Nestec Ltd. nor S. Karger AG can be held responsible for errors or for anyconsequences arising from the use of the information contained herein.

V
Contents
VII Foreword
XI Contributors
Requirements for Protein and Energy
1 Long-Term Consequences of Early Feeding on
Later Obesity Risk
Koletzko, B. (Germany)
19 Energy Requirements of Infants and Children
Butte, N.F. (USA)
39 Protein Requirements of Infants and Children
Garlick, P.J. (USA)
Body Composition and Growth
51 Growth of Breast-Fed and Formula-Fed Infants
Ziegler, E.E. (USA)
65 Body Composition during the First Year of Life
Rigo, J. (Belgium)
79 Dietary Reference Intakes: Concepts and Approaches
Underlying Protein and Energy Requirements
Yates, A.A. (USA)

High Intakes of Protein and Amino Acids
95 Intestinal Amino Acid Metabolism in Neonates
van Goudoever, J.B.; van der Schoor, S.R.D (The Netherlands); Stoll, B.; Burrin, D.G. (USA); Wattimena, D.; Schierbeek, H.; Schaart,M.W.; Riedijk, M.A.; van der Lugt, J. (The Netherlands)
109 Amino Acid Requirements of Infants and Children
Pencharz, P.B.; Ball, R.O. (Canada)
121 Effects of High Protein Intakes
Axelsson, I. (Sweden)
Complementary Foods
133 Physiology of Food Intake Regulation: Interaction
with Dietary Components
Anderson, G.H.; Aziz, A.; Abou Samra, A. (Canada)
147 Complementary Food: International Comparison
on Protein and Energy Requirement/Intakes
Agostoni, C.; Riva, E.; Giovannini, M. (Italy)
161 What Is the Optimal Age for Introduction of
Complementary Foods?
Dewey, K.G. (USA)
New Proteins in Infant Feeding
177 Recent Issues in Energy-Protein Malnutrition in Children
Desjeux, J.-F. (France)
189 Protein Quality and Quantity in Cow’s Milk-Based Formula
for Healthy Term Infants: Past, Present and Future
Macé, K.; Steenhout, P. ; Klassen, P.; Donnet, A. (Switzerland)
207 Recombinant Human Milk Proteins
Lönnerdal, B. (USA)
219 Concluding Remarks
225 Subject Index
Contents
VI

VII
Foreword
The topic ‘Protein and Energy Requirements in Infancy and Childhood’ waschosen for the 58th Nestlé Nutrition Pediatric Workshop, which took place inNovember 2005 in Ho Chi Minh City, Viet Nam. In 1993 the 33rd NestléNutrition Workshop on ‘Protein Metabolism during Infancy’, chaired by Prof.Niels Raïhä, was held in South Africa. In this workshop, Prof. Raïhä
introduced a new concept in terms of protein requirements, proposing areduction in the protein level of infant formulas in order to come closer to thatof human milk. In 2000, the workshop entitled ‘Infant Formula: Closer to theReference’ (Nestlé Nutrition Workshop Series, Vol. 47, supplement) chairedby Prof. Niels Raïhä and Prof. Firmino Rubaltelli, included a review of morerecent information showing the safety and efficacy of reducing the proteincontent of infant formulas to a level closer to that of human milk.
The outcome of these workshops has enabled Nestlé R&D to successfullydevelop a new generation of starter infant formulas with significantly impro-ved protein quality at the level of 1.8 g/100 kcal, coming closer to that ofhuman milk during early lactation. After successful clinical testing, thesestarter infant formulas are now soliciting high interest among infant healthprofessionals. Of late, attention has also focused on whether or not it may alsobe desirable to optimize the protein quality and reduce the protein level offollow-up infant formulas. Moreover, other studies have suggested associationsbetween protein nutrition in the first year of life, and the subsequent risk ofobesity, diabetes and other related chronic diseases. Whilst proteinrequirements have received a great deal of attention, the aspect of energyrequirements has never been reviewed on a systematic basis in the NestléNutrition Workshop Series. Hence we believe it is timely to review the latestknowledge on the energy and protein requirements of infants and children.
We wish to thank the two chairpersons, Prof. Ekhard E. Ziegler and Prof.Jacques Rigo, recognized experts in this field, for establishing the workshopprogram and for bringing together the key opinion leaders in the field ofprotein and energy requirements.
Ekhard E. Ziegler, Professor of Pediatrics and Head of the Samuel J.Fomon Infant Nutrition Unit, at the University of Iowa, USA, is well known forhis work on protein metabolism. Prof. Jacques Rigo is the Head of theNeonatal Department of the University of Liege in Belgium and a member ofthe ESPGHAN Committee of Nutrition.

We also thank Mrs. Montip Nagsevi and Mrs. Vipapan Panitantum andtheir team from Nestlé Viet Nam who provided all logistical support, enablingparticipants from around the globe to enjoy the superb Vietnamesehospitality.
Prof. Ferdinand Haschke, MD, PhD Dr. Denis Barclay, PhD
Vice President and Chairman Scientific AdvisorNestlé Nutrition Institute Nestlé Nutrition InstituteVevey, Switzerland Vevey, Switzerland
Foreword
VIII

58th Nestlé Nutrition WorkshopPediatric ProgramHo Chi Minh City, Viet Nam, November 20–24, 2005


XI
Contributors
Chairpersons & Speakers
Prof. Carlo Agostoni
University of MilanDepartment of PediatricsSan Paolo Hospital8, via A. di RudiniIT–20142 MilanItalyE-Mail [email protected]
Prof. Harvey Anderson
Department of Nutritional SciencesRm 322, FitzGerald BuildingUniversity of Toronto150 College StreetToronto, Ont. M5S 3E2CanadaE-Mail [email protected]
Prof. Irene Axelsson
Children’s HospitalDepartment of PaediatricsUniversity Hospital of LundSE–222185 LundSwedenE-Mail [email protected]
Prof. Nancy Butte
Children’s Nutrition Research CenterDepartment of PediatricsBaylor College of Medicine1100 Bates StreetHouston, TX 77030USAE-Mail [email protected]
Prof. Jehan-FrançoisDesjeux
Conservatoire National des Arts etMétiers2, rue Conté FR–75003 ParisFranceE-Mail [email protected]
Prof. Kathryn Dewey
Department of NutritionUniversity of CaliforniaOne Shields AvenueDavis, CA 95616USAE-Mail [email protected]
Prof. Peter Garlick
University of IllinoisDepartment of Animal SciencesASL 4321207 West Gregory DriveUrbana, IL 61801USAE-Mail [email protected]
Prof. Berthold Koletzko
Division of Metabolic Diseases andNutritional MedicineDr. von Hauner Children’s HospitalLudwig Maximilian University of MunichLindwurmstrasse 4DE–80337 MunichGermanyE-Mail [email protected]

XII
Prof. Bo Lönnerdal
Department of NutritionUniversity of CaliforniaOne Shields AvenueDavis, CA 95616USAE-Mail [email protected]
Dr. Katherine Macé
Nestlé Research CenterNutrition and HealthPO Box 44CH–1000 Lausanne [email protected]
Prof. Paul B. Pencharz
Departments of Paediatrics andNutritional SciencesHospital for Sick ChildrenUniversity of Toronto555 University AvenueToronto, Ont. M5G 1X8CanadaE-Mail [email protected]
Prof. Jacques Rigo
CHR Citadelle NéonatologieUniversity of LiègeBlvd du XII de Ligne 1BE–4000 LiègeBelgiumE-Mail [email protected]
Prof. Johannes B. vanGoudoever
Erasmus MC/Sophia Children’sHospitalNeonatologyDr. Molewaterplein 60NL–3015 GJ RotterdamThe NetherlandsE-Mail [email protected]
Prof. Allison A. Yates
Environ Health Sciences Institute4350 N. Fairfax Drive, Suite 300Arlington, VA 22203USACurrent E-Mail [email protected]
Prof. Ekhard E. Ziegler
Department of PediatricsUniversity of Iowa200 Hawkins DriveIowa City, IA 52242-1083USAE-Mail [email protected]
Contributors
Dr. Thi Lan Huong Do
Department of Community HealthInstitute of Hygiene and PublicHealth159 Hung Phu, District 8Ho Chi Min CityViet NamE-Mail [email protected]
Prof. Van Dung Do
University of Medicine and PharmacyCenter for Medical Education159 Hung Phu, District 8Ho Chi Minh CityViet NamE-Mail [email protected]
Moderators

XIII
Prof. Cong Khanh Nguyen
Department of HematologyNational Hospital of PaediatricsNo. 18, Lane 879La Thanh AvenueDong Da District, HanoiViet NamE-Mail [email protected]
Prof. Gia Khanh Nguyen
No. 20, Hang Hom StreetHoan Kiem DistrictHanoiViet [email protected]
Prof. Thu Nhan Nguyen
4D/02 Home No. 2Dang Van Ngu StreetDong Da DistrictHanoiViet NamE-Mail [email protected]
Contributors
Dr. Md. Jahangir Alam/BangladeshProf. Francisco Martinez/BrazilProf. Nelson Diniz Oliveira/BrazilProf. Hugo Ribeiro/BrazilProf. Evanguelia Shwetz/BrazilDr. Ivor Margolis/CanadaDr. Reg Sauve/CanadaDr. Yun Cao/Greater China RegionDr. Yutao Cui/Greater China RegionDr. Zhuoqin Jiang/Greater China
RegionDr. Hanchu Liu/Greater China RegionDr. Fan Yang/Greater China RegionDr. Yi-hung Chou/Greater China
Region (Taiwan)Dr. Shiuh-Bin Fang/Greater China
Region (Taiwan)Dr. Ali Purbaya Arwin Akib/IndonesiaDr. Dany Hilmanto/IndonesiaDr. Muhammad Heru
Muryawan/IndonesiaDr. Adrian Umboh/IndonesiaProf. Marcello Assumma/ItalyProf. Marcello Giovannini/ItalyDr. Paola Roggero/ItalyDr. Mohd Suhaimi Abdul
Wahab/MalaysiaDr. Noor Khatijah Nurani/MalaysiaDr. Samuel Flores Huerta/MexicoDr. Edgar Vazquez Garibay/MexicoDr. Homero Martinez/Mexico
Prof. Hendrik Nicolaas Lafeber/TheNetherlands
Dr. Felizardo Gatcheco/PhilippinesProf. João Gomes-Pedro/PortugalProf. Alberto Antonio
Moreira/PortugalDr. Enriqueta Roman/SpainDr. Abdulwahab Telmesani/Saudi
ArabiaProf. Yam Thiam Daniel
Goh/SingaporeDr. Kah Tzay Low/SingaporeProf. Mehari Gebre-Medhin/SwedenProf. Olle Hernell/SwedenProf. Peter Baehler/SwitzerlandProf. Christian Peter
Braegger/SwitzerlandDr. Mahmoud Bozo/SyriaProf. Pramote Praisuwanna/ThailandDr. Robert Baker/USADr. Susan Baker/USADr. An Binh Bui/Viet NamMr. Quoc Lap Chu/Viet NamProf. Trong Kim Hoang/Viet NamDr. Nam Tra Le/Viet NamProf. Cong Khan Nguyen/Viet NamProf. Duc Vy Nguyen/Viet NamDr. The Dung Nguyen/Viet NamDr. Thi Hoa Nguyen/Viet NamProf. Thi Lam Nguyen/Viet NamDr. Thi Thanh Binh Nguyen/Viet Nam
Invited attendees
XIV
Dr. Trong Hieu Nguyen/Viet NamMr. Xuan Mai Nguyen/Viet NamDr. Gia Tien Pham/Viet NamMr. Dang Tran/Viet Nam
Mr. Quang Trung Tran/Viet NamMr. Trong Hai Tran/Viet NamProf. Cong Dong Vo/Viet NamDr. Thi Nhung Vu/Viet Nam
Contributors
Dr. Louis Dominique VanEgroo/France
Ms. Kelan Liu/Greater China RegionDr. Leilani Lestarina/IndonesiaMs. Mei Ching Wong/MalaysiaMs. Po Poh Yap/MalaysiaMs. Marjan Skotnicki-Hoogland/The
NetherlandsMs. Audrey Liow/SingaporeDr. Anette Järvi/SwedenDr. Denis Barclay/Switzerland
Dr. Bianca-Maria Exl-Preysch/Switzerland
Prof. Ferdinand Haschke/SwitzerlandDr. Petra Klassen/SwitzerlandMs. Edith Koch/SwitzerlandDr. Evelyn Spivey-Krobath/
SwitzerlandDr. Philippe Steenhout/SwitzerlandMs. Vipapan Panitantum/ThailandMs. Aummaruta Sirichai/ThailandMs. Montip Nagsevi/Viet Nam
Nestlé participants

Long-Term Consequences of EarlyFeeding on Later Obesity Risk
Berthold Koletzko
Division Metabolic Diseases and Nutritional Medicine, Dr. von Hauner Children’s Hospital,Ludwig Maximilian University of Munich, Munich, Germany
AbstractSome 30 years ago, Günter Dörner stated that the concentrations of hormones,
metabolites and neurotransmitters during critical periods of early development willprogram disease risk in human adulthood, a concept that since has received enormousscientific support and broad attention. Evidence has also accumulated showing thatearly nutrition programs later obesity risk. Breastfeeding reduces the odds ratio forobesity at school age by about 20%, relative to formula feeding, adjusted for biologicaland sociodemographic confounding variables. We propose that the protective effect ofbreastfeeding is explained at least in part by the induction of lower rates of infantweight gain, which may be related to differences in substrate intakes with breast milkand standard infant formulae. Protein intake per kilogram body weight is some55–80% higher in formula-fed than in breast-fed infants. We hypothesize that highearly protein intakes in excess of metabolic requirements may enhance weight gain ininfancy and later obesity risk (the ‘early protein hypothesis’). The European ChildhoodObesity Project is testing this hypothesis in a randomized double-blind interventiontrial in more than 1,000 infants in 5 European countries. Infants that are not breast fedare randomized to formulae with higher or lower protein contents and are followed upto school age. If an effect of infant feeding habits on later obesity risk should be estab-lished, there is great potential for effective preventive intervention with a significantpotential health benefit for the child and adult population.
Copyright © 2006 Nestec Ltd., Vevey/S. Karger AG, Basel
Evidence is accumulating to show that metabolic events during critical timewindows of pre- and postnatal development have marked modulating effects onhealth in later life, a concept often referred to as ‘programming’ or ‘metabolicprogramming’ [1]. It has been some three decades since Prof. Günter Dörner,
1
Requirements for Protein and Energy
Rigo J, Ziegler EE (eds): Protein and Energy Requirements in Infancy and Childhood.Nestlé Nutr Workshop Ser Pediatr Program, vol 58, pp 1–18,Nestec Ltd., Vevey/S. Karger AG, Basel, © 2006.

then head of the Institute of Experimental Endocrinology at the CharitéHospital, Humboldt University at Berlin, Germany, first introduced the term‘programming’ into the scientific literature to describe these phenomena [2]. Ina visionary article reviewing a series of clinical and experimental data, Dörner[3] concluded that the concentrations of hormones, metabolites and neuro-transmitters during critical early periods of development are capable of pre-programming brain development and, up to human adulthood, functionaldisturbances, diseases as well as syndromes of reproduction and metabolism.Dörner also proposed an interaction between the genetic material of the indi-vidual and environmental influences during early development to determinelater function in adult life, a concept that has only recently been confirmed byexperimental data [1, 4–6]. The concept has gained wide popularity followingepidemiological studies documenting inverse relationships between bodyweight at birth and at age 1 year, respectively, and the risks of hypertension,diabetes and coronary heart disease in adulthood [7].
These observations have led to the hypothesis that maternal malnutritionduring pregnancy would induce both fetal growth restriction and increasedlater disease risk, the fetal origins of the adult disease hypothesis [7]. How-ever, this interpretation has recently been challenged based on the observa-tion that low birth weight is associated with catch-up growth after birth, andaccelerated weight gain by itself seems to be a risk factor for later disease [8].Cole [9] substantiated the latter concept by multiple regression analysis ofblood pressure outcomes on weights at different ages. Data from cohort stud-ies in Brazil and the Philippines relating blood pressure in adolescence toweight through childhood showed small inverse weight effects in infancy, butearly weight proved to be less important than weight and weight gain duringadolescence [9].
Furthermore, Tu et al. [10] raised the possibility that evidence for the fetalorigins of adult disease hypothesis might be a statistical artifact known as the‘reversal paradox’, due in part to inappropriate statistical adjustment for vari-ables on the causal pathway such as early weight gain and current body size.They performed computer simulations for three hypothetical relationsbetween birth weight and adult blood pressure. The effect of statisticallyadjusting for different correlations between current weight and birth weightand between current weight and adult blood pressure was examined to assesstheir impact on associations between birth weight and blood pressure. Whenthere was no genuine relation between birth weight and blood pressure,adjustment for current weight created an inverse association the size ofwhich depended on the magnitude of the positive correlations between cur-rent weight and birth weight and between current weight and blood pressure.When there was a genuine inverse relation between birth weight and bloodpressure, the association was exaggerated following adjustment for currentweight, whereas a positive relation between birth weight and blood pressurecould be reversed after adjusting for current weight.
Koletzko
2

These questions need to be carefully elucidated, given the enormouspreventive potential of optimizing early nutrition for long-term health, well-being and performance. Not only in view of the possible improvement in qualityof life of individuals, but also in view of the enormous economic impact for soci-eties, major investments in research are justified to explore the mechanismsand effects of early nutritional programming on long-term health. Today a largenumber of scientific investigators study these issues. In Europe many leadingresearch groups collaborate in the international research cluster EARNEST(www.metabolic-programming.org) supported by the European Union.
Programming of Later Obesity Risk
Childhood obesity is now considered a global epidemic in view of thealarming increase in its prevalence and severity, not only in affluent but alsoin less privileged childhood populations worldwide [11–13]. Serious short-and long-term consequences of childhood obesity arise in terms of damage toquality of life, performance, health and life expectancy. In addition, the size ofthe obesity epidemic is estimated to create huge costs for society due to lossof productivity and ensuing costs for health care and social security. Facedwith the size of the problem, widely available and effective medical manage-ment of children who are already obese is needed, but at present the resultsof available treatment concepts are far less than satisfactory, and costs arehigh [14]. A recent Cochrane review on interventions for treating obesity inchildren found that no conclusions on the effects of treatment strategies andtheir components can be drawn with confidence [15]. Thus, in the present sit-uation the emphasis must be put on the development, evaluation and imple-mentation of effective primary prevention of obesity. Several indications existthat modification of infant nutrition may offer opportunities for contributingto the prevention of later obesity risk [1].
Early Growth and Later Obesity Risk
Already in the 1950s, McCance and Widdowson showed that alterations inearly growth by manipulating the feeding conditions of piglets during sensi-tive pre- and postnatal periods predetermined their ultimate weight in adult-hood [16]. In humans high birth weight has been proposed as a risk factor forlater overweight [17, 18], which could reflect both the roles of genetics andearly priming by intrauterine environment. Additionally recent studies pointedto further priming of childhood overweight in the first 2 years of life by a highpostnatal weight gain [19–22]. In order to assess the best anthropometricpredictor from birth to 2 years for later overweight, we performed a cohortstudy in Bavaria, southern Germany, on 4,235 German children aged 5–6 years
Long-Term Consequences of Early Feeding
3

participating in the obligatory school entry health examination in 1999/2000[23]. Overweight at school entry was assessed according to sex- and age-spe-cific body mass index (BMI) cutoff points. Data collected during the preven-tive pediatric health care screening led to calculation of weight, length, BMIand the ponderal index difference between birth, 6, 12 and 24 months whichwere analyzed as possible predictors by receiver operating characteristiccurves (ROC) and predictive values. For all parameters the highest areasunder ROC were observed with a 24-month follow-up. The area under ROCdecreased in the order from a weight gain of 0.76, to a BMI gain of 0.69, to alength gain of 0.58 (p � 0.001; table 1). The highest Youden Index ((sensitiv-ity � specifity) – 1) for weight gain from birth to 24 months (41%) wasattained for a cutoff point of 9,764 g with a corresponding likelihood ratio of2.39 and a positive predictive value of 19% despite an odds ratio of 5.7 (95%CI 4.5–7.1). Thus, a high weight gain during the first 24 months is the best
Koletzko
4
Table 1. Area under receiver operating characteristic (ROC) curves and cut points,sensitivity and specificity at highest Youden index for early anthropometricmeasurement prediction of overweight at school age in 4,235 children in Bavaria,Germany
Measure Area under Cut point at Sensitivity SpecificityROC curve highest at highest at highest
Youden index Youden Youden (Youden index)1 index, % index, %
Age 0–6 monthsWeight 0.63 (0.60–0.66) 5,100 g (19) 45 (40–50) 74 (73–76)Length 0.51 (0.48–0.55) 20 cm (4) 21 (17–25) 83 (81–84)BMI2 0.60 (0.57–0.63) 5 (15) 43 (38–48) 72 (70–73)Ponderal index3 0.59 (0.53–0.60) 0.2 (11) 32 (27–37) 78 (76–79)
Age 0–12 monthsWeight 0.68 (0.65–0.70) 6,933 g (27) 68 (63–72) 59 (58–61)Length 0.55 (0.52–0.58) 26 cm (9) 66 (61–71) 43 (42–45)BMI 0.63 (0.60–0.66) 4 (20) 66 (62–71) 53 (51–55)Ponderal index 0.57 (0.54–0.60) –0.3 (11) 64 (59–69) 47 (45–48)
Age 0–24 monthsWeight 0.76 (0.74–0.79) 9,764 g (41) 70 (65–75) 71 (69–72)Length 0.58 (0.55–0.61) 39 cm (13) 45 (40–50) 68 (66–69)BMI 0.70 (0.67–0.72) 4 (31) 57 (52–62) 74 (73–75)Ponderal index 0.61 (0.58–0.64) –0.5 (17) 44 (39–49) 72 (71–74)
Weight gain from birth to age 2 years is the best predictor of overweight at schoolage. Adapted from Toschke et al. [24].
Unless otherwise indicated, data are given as values with 95% confidence intervalsin parentheses.
1(Sensitivity � specificity) � 1.2Calculated as weight in kilograms divided by the square of height in meters.3Calculated as weight in kilograms divided by the length in meters cubed.

overall predictor of overweight at school entry compared to other anthropo-metric markers and time intervals.
In contrast to our results, Stettler et al. [25] recently proposed that theweight change in the first week after birth might be critical for modulatinglater obesity risk. They analyzed data obtained in interviews with 653 adultsaged 20–32 years who had participated as infants in controlled but not ran-domized trials testing the feeding of infant formulae based on cows milk orsoy proteins from 8 to 112 days of life. For an additional 100 g weight gainbetween birth and age 8 days, the odds ratio for being overweight in youngadulthood (BMI > 25) increased significantly by 20%, whereas there was onlya trend to an increase by 6% for 100 g weight gain between birth and age 122days. However, the data on which the authors’ conclusions are based appearquestionable because the dimension of weight gain between birth and either8 or 122 days, respectively, is markedly different. Thus the use of one and thesame absolute weight gain (100 g) as the denominator appears inappropriate.In fact, the recalculation of their data to percentage weight change indicatesthat a 10% change in weight gain between birth and day 8 (approx. 20.5 g)increases adult overweight risk by only 4.1%, whereas a 10% higher weightgain between birth and day 112 (approx. 309 g) leads to a 18.5% higher riskof adult overweight. Thus, also these data seem to support that it is growthrates over a long period in infancy that are predictive of later obesity.
The rate of weight gain in the first 2 years of life is influenced by the geneticfactors of the individual and its mother, birth weight, metabolic influences dur-ing pregnancy, health and disease factors, such as the occurrence of infections,and not least by diet and nutrient supply.
Protective Effects of Breastfeeding against Later Obesity
It has long been known that populations of infants fed breast milk or for-mula differ in their growth kinetics, with formula-fed infants showing higherweight and length gains [26]. Based on a systematic review of 19 studies inaffluent populations, Dewey [27] concluded that by the age of 12 months, thecumulative difference in body weight amounts to approximately 400 g ininfants breast fed for 9 months and as much as 600–650 g in infants who arebreast fed for 12 months. Given this very large effect of the mode of feedingon early weight gain, we attempted to study whether breastfeeding might alsoconfer protection against later obesity risk.
In a cross-sectional survey in Bavaria, Germany, we assessed the impact ofbreastfeeding on the risk of obesity and the risk of being overweight in childrenat the time of school entry [28]. Routine data were collected on the height andweight of 134,577 children participating in the obligatory health examinationat the time of school entry in Bavaria. In a sub-sample of 13,345 children,early feeding, diet, and lifestyle factors were assessed using responses to a
Long-Term Consequences of Early Feeding
5

questionnaire completed by the parents. The data of 9,357 children aged 5 and6 years who had German nationality were included in the final analysis. Beingoverweight was defined as having a BMI above the 90th percentile and obesitywas defined as a BMI above the 97th percentile of all 134,577 German childrenexamined in this year. The prevalence of obesity in children who had neverbeen breast fed was 4.5% as compared with 2.8% in breast-fed children. Aclear dose-response effect was identified for the duration of breastfeeding onthe prevalence of obesity: the prevalence was 3.8% for 2 months of exclusivebreastfeeding, 2.3% for 3–5 months, 1.7% for 6–12 months, and 0.8% for morethan 12 months. Similar relations were found with the prevalence of beingoverweight. The protective effect of breastfeeding was not attributable to dif-ferences in social class or lifestyle. After adjusting for potential confoundingfactors, breastfeeding remained a significant protective factor against thedevelopment of obesity (odds ratio 0.75, 95% CI 0.57–0.98) and being over-weight (odds ratio 0.79, 95% CI 0.68–0.93), again with a clear dose-responserelationship between the duration of breastfeeding and later risk of overweightand obesity, respectively (fig. 1). We conclude that promoting prolongedbreastfeeding may help decrease the prevalence of obesity.
Following our publication, a number of other investigators studied thisrelationship in data from various cohorts around the world. We thus per-formed a systematic review and meta-analysis of published epidemiologicalstudies (cohort, case-control or cross-sectional studies) comparing earlyfeeding mode and adjusting for potential confounding factors [29]. Electronicdatabases were searched and reference lists of relevant articles were che-cked. Calculations of pooled estimates were conducted in fixed-effects andrandom-effects models. Heterogeneity was tested by Q-test. Publication biaswas assessed from funnel plots and by a linear regression method. Nine stud-ies with more than 69,000 participants met the inclusion criteria. The meta-analysis showed that breastfeeding reduced the risk of obesity in childhood
Koletzko
6
0
0.25
0.5
0.75
1
<2 3–5 6–12
Duration of breastfeeding (months)
>12
Fig. 1. The adjusted odds ratio for overweight ( ) and obesity (�) at school entrydecreases with increasing duration of breastfeeding. Adapted from von Kries et al. [28].

significantly. The adjusted odds ratio was 0.78 (95% CI 0.71–0.85) in the fixedmodel (fig. 2). The assumption of homogeneity of the results of the studiesincluded could not be refuted (Q-test for heterogeneity, p � 0.3), stratifiedanalyses showed no differences regarding different study types, age groups,definition of breastfeeding or obesity and number of confounding factorsadjusted for. A dose-dependent effect of breastfeeding duration on the preva-lence of obesity was reported in 4 studies. Funnel plot regression gave noindication of publication bias. Another recently published meta-analysis con-firmed a protective effect of breastfeeding, but reported a smaller effect sizewith an odds ratio of 0.87, primarily influenced by the results of one publica-tion from the USA with a very large sample size [30].
Potential Causes for the Protective Effects of
Breastfeeding on Later Obesity
A number of hypotheses can be raised on the potential causes of a protec-tive effect of breastfeeding. Even though the inverse relationship of bothbreastfeeding and breastfeeding duration with later obesity persists afteradjustment for measurable confounding variables, residual confounding can-not be fully excluded. Since one cannot randomize healthy babies to eitherbreast milk or formula feeding for ethical and practical reasons, undisputable
Long-Term Consequences of Early Feeding
7
O’Callaghan 1997
Bergmann 2003
Hediger 2001
Li 2003
Poulton 2001
von Kries 1999
Liese 2001
Toschke 2001
Gillman 2001
AOR fixed effects
0 0.2 0.4 0.6 0.8
AOR
1.0 1.2 1.4
Fig. 2. Effect of breastfeeding vs. formula feeding on childhood obesity: covariate-adjusted odds ratios of 9 studies and pooled adjusted odds ratio (AOR). Adapted fromOwen et al. [30].

proof for a protective effect of breastfeeding can hardly be obtained. However,the consistent results of many studies and the dose-response effect betweenthe duration of breastfeeding and the later reduction of obesity risk observedin a number of studies make an effect of breastfeeding highly likely.
Differences in feeding behavior and mother-child interactions betweenpopulations of breast- and formula-fed infants might play a role. Breast-fedinfants show a different suckling pattern and a higher suckling frequency [31,32]. Breast-fed infants seem to have a greater degree of control on meal sizesand intervals than those fed formula. Sievers et al. [33] monitored marked dif-ferences in feeding patterns, with a 20–30% higher feeding volume of formula-fed infants after 6 weeks of life as well as a smaller number of total meals andof nightly meals in bottle-fed babies at 4 months of age. Such differences maymodulate later body size. Agras et al. [34] reported that early feeding patternswere predictive of BMI at 3 years of age, with high-pressure sucking meas-ured in the laboratory at 2 and 4 weeks of age (denoting a vigorous feedingstyle) associated with a greater degree of adiposity in toddlers.
In contrast to infant formula, breast milk shows marked variation in itstaste and smell from day to day, and even from meal to meal, depending onmaternal dietary habits and other metabolic factors. Since early taste experi-ence in infancy has been shown to favor later consumption of foods with thesame taste [35], it is conceivable that breast-fed infants might be programmedto different food selection and dietary habits in later life.
Moreover, breastfeeding appears to enhance the emotional bonding of themother to her child, mediated in part by the stimulation of maternal oxytocinrelease by infant suckling, and breastfeeding has been shown to lead todecreased neuroendocrine response to stressors and decreased negativemood in the mothers [36, 37]. These effects of breastfeeding might well haverepercussions on the interaction between mother and child and health-related behaviors. These and further behavioral hypotheses are plausible andattractive, but are difficult to test experimentally, thus for the time being theyremain somewhat speculative.
The mode of infant feeding at the breast cannot be copied by human milksubstitutes, but if the protective effects of breastfeeding were related to thecompositional aspects of breast milk and to the nature of substrate supply,such benefits might potentially be extended, at least in part, also to formula-fed populations by appropriate modifications to infant formula composition.Promising hypotheses can be deducted from studies evaluating physiologicaldifferences of breast- and bottle-fed infants. The higher growth rates obser-ved in populations of formula-fed infants compared to infants fed breast milkare most likely due to differences in metabolizable substrate intakes.
Infant formulae have a higher average caloric density (kcal/100 ml) thanthe mean values for breast milk, and energy supplies per kilogram bodyweight to formula-fed infants are 10–18% higher than those to breast-fedbabies between 3 and 12 months of age [38]. Even larger is the difference in
Koletzko
8

protein intake per kilogram body weight, which is 55–80% higher in formula-than in breast-fed infants (fig. 3) [39].
In rats, prenatal exposure to high protein decreased energy expenditureand increased later adiposity [40], and a high postnatal protein and nutrientsupply led to higher adult body fat deposition [41] and increased adult weightby 10–40% [42]. A high protein intake in excess of metabolic requirementsmay enhance the secretion of insulin and insulin-like growth factor-1 (IGF-1).Indeed, infants fed formula had far greater postprandial levels of insulin on day6 of life than infants fed cow’s milk-based formula [43]. High insulin and IGF-1values can enhance both growth during the first 2 years of life [44, 45] as wellas adipogenic activity and adipocyte differentiation [46] (fig. 4). High proteinintakes may also decrease human growth hormone secretion and lipolysis.
Indeed, high protein intakes in early childhood, but not the intakes ofenergy, fat or carbohydrate, were significantly related to an early occurrence
Long-Term Consequences of Early Feeding
9
3.5
Breast-fed
3 months 6 months
Formula-fed
10th percentile
10th percentile
50th percentile
50th percentile
90th percentile
90th percentile
3
2.5
2
1.5
1
0.5
0
Fig. 3. Protein intake at ages 3 and 6 months (g/kg body weight, median and 90th/10thpercentiles) in breast-fed and formula-fed infants, respectively, participating in theGerman DONALD study. Drawn from data from Alexy et al. [39].
Protein
Insulin, IGF-1
Early growth
(first 2 years)
Adipogenic activity
(adipocyte differentiation)
Fig. 4. Infant protein intake in excess ofmetabolic requirements may stimulatethe secretion of insulin and insulin-likegrowth factor-1 (IGF-1) which, in turn,can enhance both growth during the first2 years of life as well as adipogenicactivity and adipocyte differentiation.

of adiposity rebound and to high childhood BMI, corrected for parental BMI[47–50]. Thus, we hypothesize that a high protein intake with infant formula,in excess of metabolic requirements, may predispose to an increased obesityrisk in later life (early protein hypothesis).
Testing the Early Protein Hypothesis: The European
Childhood Obesity Project
In addition to prospective epidemiological and experimental studies,human intervention trials are needed to test this ‘early protein hypothesis’.Therefore, we have set up the European Childhood Obesity Project (www.childhood-obesity.org) funded by the European Commission’s 5th FrameworkResearch Programme to test, in a randomized double-blind intervention trial,whether variation in protein intakes during the first year of life affects growthkinetics and later obesity risk. This trial is being conducted in 5 European coun-tries which differ substantially in their prevalence of adult obesity and also inthe nutritional characteristics of the habitual diet of infants and children, inparticular in protein supply with complementary feeding, i.e. Germany (projectand center coordinator Prof. Berthold Koletzko, Munich), Belgium (centercoordinator Prof. Philippe Goyens, Brussels), Italy (center coordinator Prof.Marcello Giovannini, Milan), Poland (center coordinator Prof. Jerzy Socha,Warsaw) and Spain (center coordinator Dr. Ricardo Closa, Tarragona).Therefore the trial offers the opportunity to combine a multicenter interventiontrial on infant formulae which differ in their balance of protein and fat (Bledina,Steenvoorde, France), with an epidemiological observation study which canassess the balance of protein and fat in the overall early diet. This approach willenable us to assess the effect of variables which differ substantially withinEurope, as well as allowing the intervention trial results to be analyzed withincenters. The inclusion of a group of breast-fed infants in each center will alsoallow an epidemiological comparison of the effects of breastfeeding and for-mula feeding in the different countries. This approach will provide the opportu-nity for an external validation of the underlying hypothesis.
Growth from birth to age 2 years, a marker of later obesity risk, was chosenas the primary outcome variable. In addition, a variety of further variables aremeasured, including detailed data on diet, lifestyle and behavior, biochemicaland endocrine markers, markers of renal function, and others (fig. 5).Randomization and data collection are performed via the internet based onuniform electronic case report forms, using specially developed informationtechnology architecture with a central database and 12 remote data entry sta-tions as well as dedicated software that enables secure data protection.Mechanisms for quality assurance have also been established. Data input andtransfer to the central database are supervised by a contract research organi-zation participating in the project.
Koletzko
10

The intervention trial started on October 1, 2002, and recruitment wascompleted on June 30, 2004. Following the study protocol and the requi-rements to report the first results to the EU at the end of the first funding peri-ods, the study will not be blinded in the second half of 2006 to allow first dataevaluations. However, the children participating and their families will beinvited for further follow-up until 2010 as part of the EU 6th FrameworkResearch Project, EARNEST, which investigates long-term health effects orearly nutrition (www.metabolic-programming.org). Therefore, the EuropeanChildhood Obesity Project offers unique and exciting opportunities for evalu-ating the effects of early diet on long-term health in later life. If an effect ofinfant feeding habits and, in particular, of high protein intakes on long-termgrowth, development of later body composition and obesity risk can be estab-lished, there is great potential for effective preventive intervention by modifi-cation of the composition and use of dietary products for infants. Thus, theexpected results might have a very direct application with a significant poten-tial health benefit for the child and adult population.
Acknowledgments
The authors thank the participating families and all project partners for theirenthusiastic support of the project work. The studies reported herein have been
Long-Term Consequences of Early Feeding
11
Urine sampleR
ecru
itm
en
t
0 1 2 3 4 5 6 7 8 9 12 18 24 Age (months)
Infant milk Follow-on milk
1 year intervention period 1 year follow-up
period
Urine, blood samples, energy
expenditure, DNA sample
Infants: Medical examination, anthropometry
Parent questionnaires
food record & infantile behavior
feeding habits, food record & infantile behavior
food record, feeding habits & food recordLong term follow-up
(earnest)
Anthropometry parents
Fig. 5. Summary of the study design of the European Childhood Obesity Project.Infants are randomized to infant and follow-on formulae with higher or lower proteinintakes, respectively, from the neonatal age for the first year of life. Diet, behavior,growth, metabolic and endocrine markers, and a number of other variables aremonitored during regular follow-up visits. Adapted from Koletzko et al. [1].

carried out with partial financial support from the Commission of the EuropeanCommunities, specifically the RTD program ‘Quality of Life and Management of LivingResources’, within the 5th Framework Programme, research grants No. QLRT-2001-00389 and QLK1-CT-2002-30582, and the 6th Framework Programme, contract No.007036. This manuscript does not necessarily reflect the views of the Commission andin no way anticipates the future policy in this area. Additional support from theInternational Danone Institutes, the University of Munich, and the Child HealthFoundation is gratefully acknowledged.
Statement on Conflict of Interest
The author declares that there is no conflict of interest according to the defini-tions of the International Committee of Medical Journal Editors (http://www.icmje.org/).
References
1 Koletzko B, Akerblom H, Dodds PF, Ashwell M: Early nutrition and its later consequences:new opportunities. Adv Exp Med Biol 2005;569:1–237.
2 Koletzko B: Developmental origins of adult disease: Barker’s or Dörner’s hypothesis? Am JHum Biol 2005;17:381–382.
3 Dörner G: Perinatal hormone levels and brain organization; in Stumpf WE, Grant LD (eds):Anatomical Neuroendocrinology. Basel, Karger, 1975, pp 245–252.
4 Schmidt I, Schoelch C, Ziska T, et al: Interaction of genetic and environmental programmingof the leptin system and of obesity disposition. Physiol Genomics 2000;3:113–120.
5 Ozanne SE, Fernandez-Twinn D, Hales CN: Fetal growth and adult diseases. Semin Perinatol2004;28:81–87.
6 Plagemann A: ‘Fetal programming’ and ‘functional teratogenesis’: on epigenetic mechanismsand prevention of perinatally acquired lasting health risks. J Perinat Med 2004;32:297–305.
7 Barker DJ, Osmond C, Golding J, et al: Growth in utero, blood pressure in childhood and adultlife, and mortality from cardiovascular disease. BMJ 1989;298:564–567.
8 Singhal A, Lucas A: Early origins of cardiovascular disease: is there a unifying hypothesis?Lancet 2004;363:1642–1645.
9 Cole TJ: Modeling postnatal exposures and their interactions with birth size. J Nutr2004;134:201–204.
10 Tu YK, West R, Ellison GT, Gilthorpe MS: Why evidence for the fetal origins of adult diseasemight be a statistical artifact: the ‘reversal paradox’ for the relation between birth weight andblood pressure in later life. Am J Epidemiol 2005;161:27–32.
11 Koletzko B, Girardet JP, Klish W, Tabacco O: Obesity in children and adolescents worldwide:current views and future directions. J Pediatr Gastroenterol Nutr 2002;35:S205–S212.
12 Fisberg M, Baur L, Chen W, et al: Childhood obesity – a global perspective. J PediatrGastroenterol Nutr 2004;39:S678–S687.
13 Koletzko B, de la Guéronnière V, Toschke AM, von Kries R: Nutrition in children and adoles-cents in Europe: what is the scientific basis? Introduction. Br J Nutr 2004;92(suppl 2): S67–S73.
14 Koletzko B: Childhood obesity: time for treatment or prevention? Eur J Lipid Sci Technol2004;106:287–288.
15 Summerbell CD, Ashton V, Campbell KJ, et al: Interventions for treating obesity in children.Cochrane review. Cochrane Library, 2004, Issue 1.
16 Ashwell M (ed): McCance and Widdowson. A Scientific Partnership for 60 Years. London,British Nutrition Foundation, 1993.
17 Eriksson J, Forsen T, Osmond C, Barker D: Obesity from cradle to grave. Int J Obes RelatMetab Disord 2003;27:722–727.
18 Binkin NJ, Yip R, Fleshood L, Trowbridge FL: Birth weight and childhood growth. Pediatrics1988;82:828–834.
Koletzko
12

19 Ong KK, Ahmed ML, Emmett PM, et al: Association between postnatal catch-up growth andobesity in childhood: prospective cohort study. BMJ 2000;320:967–971.
20 Stettler N, Zemel BS, Kumanyika S, Stallings VA: Infant weight gain and childhood overweightstatus in a multicenter, cohort study. Pediatrics 2002;109:194–199.
21 Stettler N, Kumanyika SK, Katz SH, et al: Rapid weight gain during infancy and obesity inyoung adulthood in a cohort of African Americans. Am J Clin Nutr 2003;77:1374–1378.
22 Stettler N, Stallings VA, Troxel AB, et al: Weight gain in the first week of life and overweightin adulthood: a cohort study of European American subjects fed infant formula. Circulation2005;111:1897–1903.
23 Toschke AM, Grote V, Koletzko B, von Kries R: Identifying children at high risk for overweightat school entry by weight gain during the first 2 years. Arch Pediatr Adolesc Med2004;158:449–452.
24 Toschke AM, Vignerova J, Lhotska L, et al: Overweight and obesity in 6- to 14-year-old Czechchildren in 1991: protective effect of breastfeeding. J Pediatr 2002;141:764–769.
25 Stalling VA, Troxel AB, Zhao J, et al: Weight gain in the first week of life and overweight inadulthood: a cohort study of European American subjects fed infant formula. Circulation2005;111: 1897–1903.
26 Kramer MS, Guo T, Platt RW, et al, Promotion of Breastfeeding Intervention Trials StudyGroup: Feeding effects on growth during infancy. J Pediatr 2004;145:600–605.
27 Dewey KG: Growth characteristics of breast-fed compared to formula-fed infants. BiolNeonate 1998;74:94–105.
28 von Kries R, Koletzko B, Sauerwald T, et al: Breastfeeding and obesity: cross sectional study.BMJ 1999;319:147–150.
29 Arenz S, Rückerl R, Koletzko B, von Kries R: Breast-feeding and childhood obesity. A system-atic review. Int J Obesity 2004;28:1247–1256.
30 Owen CG, Martin RM, Whincup PH, et al: Effect of infant feeding on the risk of obesity acrossthe life course: a quantitative review of published evidence. Pediatrics 2005;115:1367–1377.
31 Bosma JF, Hepburn LG, Josell SD, Baker K: Ultrasound demonstration of tongue motions dur-ing suckle feeding. Dev Med Child Neurol 1990;32:223–229.
32 Mathew OP, Bhatia J: Sucking and breathing patterns during breast- and bottle-feeding interm neonates. Effects of nutrient delivery and composition. Am J Dis Child1989;143:588–592.
33 Sievers E, Oldigs HD, Santer R, Schaub J: Feeding patterns in breast-fed and formula-fedinfants. Ann Nutr Metab 2002;46:243–248.
34 Agras WS, Kraemer HC, Berkowitz RI, Hammer LD: Influence of early feeding style on adi-posity at 6 years of age. J Pediatr 1990;116:805–809.
35 Mennella JA, Jagnow CP, Beauchamp GK: Prenatal and postnatal flavor learning by humaninfants. Pediatrics 2001;107:E88.
36 Klaus M: Mother and infant: early emotional ties. Pediatrics 1998;102(suppl E):1244–1246.37 Mezzacappa ES: Breastfeeding and maternal stress response and health. Nutr Rev 2004;62:
261–268.38 Heinig MJ, Nommsen LA, Peerson JM, et al: Energy and protein intakes of breast-fed and
formula-fed infants during the first year of life and their association with growth velocity: theDARLING Study. Am J Clin Nutr 1993;58:152–161.
39 Alexy U, Kersting M, Sichert-Hellert W, et al: Macronutrient intake of 3- to 36-month-oldGerman infants and children: results of the DONALD Study. Dortmund Nutritional andAnthropometric Longitudinally Designed Study. Ann Nutr Metab 1999;43:14–22.
40 Daenzer M, Ortmann S, Klaus S, Metges CC: Prenatal high protein exposure decreases energyexpenditure and increases adiposity in young rats. J Nutr 2002;132:142–144.
41 Kim S, Mauron J, Gleason R, Wurtman R: Selection of carbohydrate to protein ratio and cor-relations with weight gain and body fat in rats allowed three dietary choices. Int J Vitam NutrRes 1991;61:166–179.
42 Jones A, Simson E, Friedman M: Gestational undernutrition and the development of obesityin rats. J Nutr 1984;114:1484–1492.
43 Lucas A, Boyes S, Bloom SR, Aynsley-Green A: Metabolic and endocrine responses to a milkfeed in six-day-old term infants: differences between breast and cow’s milk formula feeding.Acta Paediatr Scand 1981;70:195–200.
44 Karlberg J, Jalil F, Lam B, et al: Linear growth retardation in relation to the three phases ofgrowth. Eur J Clin Nutr 1994;48(suppl 1):S25–S43.
Long-Term Consequences of Early Feeding
13

45 Hoppe C, Udam TR, Lauritzen L, et al: Animal protein intake, serum insulin-like growth factor I,and growth in healthy 2.5-y-old Danish children. Am J Clin Nutr 2004;80:447–452.
46 Hauner H, Wabitsch M, Zwiauer K, et al: Adipogenic activity in sera from obese childrenbefore and after weight reduction. Am J Clin Nutr 1989;50:63–67.
47 Rolland-Cachera MF, Deheeger M, Akrout M, Bellisle F: Influence of macronutrients on adi-posity development: a follow-up study of nutrition and growth from 10 months to 8 years ofage. Int J Obes Metab Disord 1995;19:573–578.
48 Scaglioni S, Agostoni C, Notaris RD, et al: Early macronutrient intake and overweight at fiveyears of age. Int J Obes Relat Metab Disord 2000;24:777–781.
49 Parizkova J, Rolland-Cachera M: High proteins early in life as a predisposition for later obesityand further health risks. Nutrition 1997;13:818–819.
50 Hoppe C, Molgaard C, Thomsen BL, et al: Protein intake at 9 mo of age is associated with bodysize but not with body fat in 10-y-old Danish children. Am J Clin Nutr 2004;79:494–501.
Discussion
Dr. Cong Khanh Nguyen: What are the factors that lead to weight gain during thefirst week? Are they related to maternal nutrition? The second thing is you addressedthe issue of nutrition before 2 years of age as being really critical, not only breastfeed-ing but also weaning food, the starting time and quality. Somehow it is dealing withprotein and energy. So our topic is really interesting with regard to the protein andenergy requirements for infancy and childhood. Again it is exactly what we are doingand understand about the requirements of protein. In early childhood protein plays arole in development, but we need to do something with protein in terms of controllingweight gain. It is really important for Viet Nam at the moment; we have to do nutri-tional controls and also control weight because obesity occurs even in the malnour-ished population.
Dr. Koletzko: Thank you, I agree this is very important for Viet Nam but also formany other countries around the world that are affected by this double burden of dis-ease, where on the one hand you have a significant proportion of the population that isborn with low birth weight under less optimal conditions and then exposed to a dietthat predisposes to a high risk of obesity. As we have learned from a number of stud-ies, it appears that if you are born with a low birth weight then at a later age you havea higher risk not only for obesity but also for the metabolic consequences of obesity.There are studies showing that at the same body mass index (BMI) populations bornwith a low birth weight have a higher body fat content and a much worse metabolicpattern, and a higher disease risk. This is particularly relevant for countries such asViet Nam where you have this double burden of disease. Now the question whetherthe first week is relevant; I have my doubts. I have discussed my interpretation of thedata published by Stettler et al., but perhaps Dr. Ziegler can also contribute somethingto that. I have my doubts whether the first week is really so relevant. If you think aboutthe weight change in the first week, there are a lot of variables including water balance,and weight change after birth often is not really the substance of the body. If you lookat the first 2 years I think we still have a lot of questions because the analyses we havenow, not only from these two studies but also from many other studies, show thatthere is a relationship between early weight gain and later overweight. But we arereally not sure what the critical factors involved are. I think it is a bit premature tocome to direct conclusions about intervention. We need to have more data to drawthese conclusions. But I agree with you absolutely that it may be a bit short sightedjust to look at milk intake, and perhaps there are other factors involved such as com-plementary feeding. Also non-nutritional factors may be involved which could berelevant. We have seen in our own studies that smoking during early pregnancy also is
Koletzko
14

a marked risk factor for children later becoming obese, as opposed to smoking beforeor after pregnancy. Smoking during the first weeks and months of pregnancy is astrong independent risk factor which points out that not only are dietary and nutri-tional factors relevant but other factors as well.
Dr. Ziegler: I would like to make two comments regarding the Stettler study. AsDr. Koletzko pointed out, the subjects were studied as infants in Iowa. Although theyhad a totally different objective, we collaborated with a group in Philadelphia in a tele-phone follow-up study when the subjects were young adults. We asked the partici-pants about their current weight and height. So their weights are self-reported, withall the reservations one has to have about that. The data showed that overweightstatus in adulthood was associated with weight gain during the first week of life andwith weight gain from birth to 112 days of age, but not from 8 to 112 days of age. Wehave to conclude that it is really the weight change during the first week of life thatpredicted later obesity. Now that brings me to my second comment. There is an asso-ciation between the weight change during the first week of life and later obesity. Itdoes not imply or prove causality, and if there is no causality established, it does alsoimply that preventive measures aimed at altering weight change during the first weekof life should not be expected to be effective, although an effect cannot be ruled out.In other words, if you were to prevent a child from gaining weight in the first week oflife, it does not follow that you protect this child from being obese later in life, and i.e.because an association does not in itself establish causality. The studies that you men-tioned established an association between breastfeeding in infancy and obesity inchildhood, but they did not establish causality.
Dr. Koletzko: I couldn’t agree more with you. There is an association with themedium size or modest size effect, and we don’t really know where the causality lies andwhether that gives an opportunity for preventive intervention. However, if you thinkabout a 20 or 25% impact on later overweight and obesity on a population basis, thiscould be very relevant. Therefore I think it is worthwhile to look at this and investigatethe potential for improving infant feeding to utilize that preventive effect. But I agreethis is a research question, it is not a question that we can turn into policy at present.With respect to the comment on Stettler’s study; yes, I agree birth weight is an importantfactor and it has been shown in many studies that birth weight is a contributing factor tolater overweight risk. But I disagree with the conclusion that weight gain during the firstweek is a most important factor because it just results from using the same dimension, a100-gram weight gain from day 0 to 8 and day 0 to 112. I think this is inappropriatebecause 100 g is a huge difference in 1 week but it is a small difference in 112 days. If youuse the same proportion, i.e. percentage change in weight as I showed, then it is not thefirst week of life that is the most predictive time period but the total weight gain in 112days is more relevant.
Dr. Dewey: We are all fascinated by these recent data on which age interval duringthe first 2 years might be most critical with regard to weight gain. I think it is impor-tant to point out that breastfed infants on the average don’t have a net weight gain inthe first week of life, they tend to lose a little bit and then come back up, whereas for-mula-fed infants tend to gain from the very beginning. So it is very intriguing to won-der whether those first 3 days or so of caloric intake, which is minimal in the breastfedinfant, might be important metabolically. I think the jury is still out, and I agree withyou that we need much more data. I don’t know if you have the first week of life inyour data set, but the question I have for the whole first 2 years is whether you lookedseparately at the effect of weight gain during any of those intervals for the breastfedinfants in your study as compared to the formula-fed infants? I think there are ques-tions as to whether rapid weight gain in a breastfed infant has the same consequencesas it does in a formula-fed infant.
Long-Term Consequences of Early Feeding
15

Dr. Koletzko: That is a very good question. We have included in the publicationdata obtained on infant feeding at school age (5–6 years). While the data are very reli-able on whether the child was breastfed or not breastfed, the question on how long thechild was fed exclusively breast milk is not very precise in a retrospective interview atage 6. Even less precise is the question on when complementary feeding was intro-duced and the kind of complementary feeding. So we felt a bit uncomfortable aboutputting too much trust in these details of that study. But now we have the opportunityin the European Childhood Obesity Project to obtain very detailed characteristics ofthese populations, also in terms of the dietary habits with 3-day records every monthin the first year. It will be a much more reliable analysis, and we look forward to seeingwhat comes from that.
Dr. Haschke: The Nestlé Nutrition Institute recently appointed a committee underthe chairmanship of Prof. Lucas to look at all published data on the associationbetween breastfeeding and obesity. The committee pointed out that unfortunately inmost meta-analyses there is a selection bias towards positive studies showing an asso-ciation. However, one study which is continuously neglected is the Iowa Growth Studywhere more than 400 infants were followed prospectively until 8 years of age; theywere either breastfed or formula-fed and all the data on the duration of breastfeedingand type of formula feeding are available. So I would like to ask you to comment onthis; first what is the outcome at 8 years of age, and why is this study continuouslyneglected in meta-analyses?
Dr. Ziegler: The study we conducted was published in 1984 [1]. We followed up atotal of 471 children, of whom about one third had been breastfed and two thirds hadbeen formula-fed during the first 4 months of life. All infants participated in the stud-ies in Iowa. Follow-up measurements of height, weight and blood lipids were per-formed within 2 months of the subjects’ 8th birthday. Weight, height and BMI werenearly identical in the formula-fed and breastfed infants; there was no differencewhatsoever. The reason why this follow-up study is consistently ignored in all themeta-analyses I think has to do with the fact that our breastfed babies were permittedto receive modest amounts of other foods from an early age, so they were not allexclusively breastfed. But it shows absolutely no difference in adiposity at 8 years. Ihave to emphasize that we live and work in a small community which is dominated bythe university, so most families are somehow affiliated with the university and thatmay explain why the families are more health conscious than the average family, and itmay also explain why on follow-up in the Stettler study the rate of obesity and over-weight was unusually low, it was much lower than in the general population. Underthese circumstances, when all subjects are health conscious, one sees no associationbetween breast-feeding and late obesity in childhood.
Dr. Koletzko: Let me try to give some comfort as to whether you include 400infants more or less in a meta-analysis that includes 70,000 or 200,000 infants wouldnot change the result at all. I cannot speak for the meta-analyses published by Harderand by Owen but I can speak for our own meta-analysis and we, in keeping with theconcept of evidence-based medicine, defined upfront our criteria for inclusion whichincluded a clear description of exposure, a clear description of results, overweight-obesity as odds ratios so that they could be compared, and outcome measured at theage of at least 5 years because we felt that overweight-obesity before the time of obe-sity rebound doesn’t really give a strong predictive result. A journal plot analysis didnot give any indication of publication bias. So based on those criteria I think we cameto a very clear unbiased conclusion. But I agree, this is the observation of an associa-tion, it does not allow any conclusions on cause and effect.
Dr. Butte: Two of the biggest predictors of later obesity in children are maternal andpaternal BMI as well as the birth weight of the infant. If you look around the world wetend to put all this early programming into the same pot, and in some populations we
Koletzko
16

have very poor gestational weight gain and in other populations, like in United Statesand Europe, we see very high gestational weight gains, and I think it is unfair to putthese in the same basket. What might be occurring to infants born above 4,000 g is verydifferent from infants born at less than 2,500 g. Could you comment on the effects ofboth maternal and paternal BMI and gestational weight gain in your studies in Germany?
Dr. Koletzko: As you have probably seen we have done several studies on this issue.In the first study published in the British Medical Journal in 1999, we didn’t have data onmaternal BMI [2]. In the consecutive studies we collected such data, and what we foundis that if we adjust for maternal BMI, e.g. in the Czech study [3], then the effect size issmaller for breastfeeding, but it is still significant in the Czech study with a 20% riskreduction after adjusting for a variety of factors including maternal BMI. Weight gain inpregnancy is obviously a very relevant candidate to look at, but in our studies we did nothave such data included because it is very difficult to get precise measures on that in aretrospective analysis. We recently had a discussion with some obstetricians on thequestion of whether one come up with recommendations on desirable weight gain, and Istarted to appreciate how complex this issue is and how difficult it is to come to conclu-sions. But I would agree with you yes, that is an important area to look at.
Dr. Gomes-Pedro: You have talked about breastfeeding decreasing overweight andobesity at a later age. Can you comment about blood pressure?
Dr. Koletzko: There are some studies in the literature reporting that breastfed pop-ulations on average have a slightly lower blood pressure, the difference is in the orderof 3 mm Hg. You may wonder whether 3 mm Hg is relevant or not; you may say 3 mm Hgis something we can’t even measure, why should that be relevant? But on a populationbasis it seems to be relevant. If you look at the data from the Framingham study then a3-mm Hg difference in average blood pressure really has a relevant effect also on thepercentage with critically high blood pressure values, and may have a marked impacton the risk of stroke in the population. The relevant question now is whether this issomething that we can influence, and there are two insightful studies that suggest wemight. One is a study from the Netherlands [4] in which infants were given differentsodium intakes in early life, I believe it was 0.9 and 2.6 mmol sodium, total sodiumintake per day for the first 6 months. As might be expected there was a slight differ-ence in blood pressure at the end of the 6 months; but more importantly when thesechildren were revisited 15 years later, there was still a difference in blood pressure of3 mm Hg. So that would suggest that protection against very high sodium or sodiumchloride intake in the first months of life might be useful and beneficial. The secondinteresting study was published by Forsyth and coworkers [5]. They revisited childrenwho as infants had participated in randomized trials with and without long-chainpolyunsaturated fatty acids in infant formula. When they looked at these children atage 6 years, those children who had received formula with the long-chain polyunsatu-rated fatty acids again had a 3-mm Hg lower blood pressure; in other words they werecloser to breastfed children. However this was a small trial, and I think it is necessaryto revisit that question in a somewhat larger, more homogeneous study concept.
Dr. Bozo: My question is about high protein intake during infancy in infant formulaand the hypersecretion in insulin; is it related with all kinds of amino acids or is itrelated with specific amino acids present in the infant formula?
Dr. Koletzko: So far we don’t know. If you look at the literature there is a lot of datashowing that in animals and in humans, there are certain amino acids which have a par-ticular effect on insulin liberation. When it comes to infants first of all I would say wedon’t really know whether protein intake affects the described difference in insulinsecretion between infants. We have the hypothesis but I don’t think we have conclusivedata. We have to get them from the European Childhood Obesity Project obviously, butI don’t think we can make conclusions at the moment. If that is the case obviously thenext question is, is it total protein or is it the quality of protein, and maybe another
Long-Term Consequences of Early Feeding
17

opportunity if the hypothesis proves true is not only to manipulate total protein intakebut also to manipulate protein composition to try to adapt the metabolic profile. So I amexcited about the question you are asking but I can’t offer a perfect answer.
Dr. Rigo: Most of the time in the studies they look at the weight gain. Can youspeculate about the quality of the weight gain or length gain during the first part of lifeand the obesity rate?
Dr. Koletzko: In our study of 4,000 children we saw that length gain between 0 and6, 6 and 12, 12 and 24 months, the totality had a predictive value for later overweight,but the predictive value was less than the value of weight gain. Mind you what we choseas the outcome measure was BMI at 5–6 years. You can ask now is BMI really the bestindicator of health risk, and looking back it might have been better to have other meas-ures included to describe obesity worldwide than just BMI, perhaps central obesity,waist-hip ratio or body fat content or whatever might have been more useful than justBMI. In our prospective studies now we are looking at a variety of descriptors of bodysize and body composition to study some of these questions because BMI in childrenmay not be the best predictor of later health. We need to look at that more closely.
Dr. Kah-Tzay Low: From the epidemiological study by Barker et al. [6] on therelation of birth weight and later death from acute myocardial infarction during adult-hood, it was found that those who are born small (�3.4 kg) and do not reach 10 kg by1 year of age are at a higher risk of death from acute myocardial infarction. What areyour comments on their conclusion recommending that those who are born with a lowbirth weight should try to catch up by the first year of life?
Dr. Koletzko: That is a very important question. It points out that it is not onlyfetal development and fetal growth that are relevant but also postnatal development.It is in contrast with the conclusion of a paper from the same group just published inthe New England Journal of Medicine [7] where they propose that it would only begrowth after the age of 2 years that would be predictive of later health. The difficultyof course is that some of these are studies performed retrospectively in subjects bornin England between 1911 and 1930. So what has induced a high weight gain during thefirst year in these children is not necessarily what induces weight gain today. I wouldsuspect that, e.g., socioeconomic status would be a very important factor influencingthe choice of feeding. I suppose those who were not fed breast milk were fed cow’smilk or preparations made from cow’s milk rather than what we consider today infantformula. So I would be very careful in drawing conclusions from these observations towhat we should do with infants born today.
References
1 Fomon SJ, Rogers RR, Ziegler EE, et al: Indices of fatness and serum cholesterol at age eightyears in relation to feeding and growth during early infancy. Pediatr Res 1984;18:1233–1238.
2 von Kries R, Koletzko B, Sauerwald T, et al: Breast feeding and obesity: cross sectional study.BMJ 199917;319:147–150.
3 Toschke AM, Vignerova J, Lhotska L, et al: Overweight and obesity in 6- to 14-year-old Czechchildren in 1991: protective effect of breast-feeding. J Pediatr 2002;141:764–769.
4 Geleijnse JM, Hofman A, Witteman JC, et al: Long-term effects of neonatal sodium restrictionon blood pressure. Hypertension 1997;29:913–917.
5 Forsyth JS, Willatts P, Agostoni C, et al: Long chain polyunsaturated fatty acid supplementa-tion in infant formula and blood pressure in later childhood: follow up of a randomised con-trolled trial. BMJ 2003;326:953.
6 Barker DJ, Winter PD, Osmond C, et al: Weight in infancy and death from ischaemic heart dis-ease. Lancet 1989;ii:577–580.
7 Barker DJ, Osmond C, Forsen TJ, et al: Trajectories of growth among children who have coro-nary events as adults. N Engl J Med 2005;353:1802–1809.
Koletzko
18

Energy Requirements of Infantsand Children
Nancy F. Butte
USDA/ARS Children’s Nutrition Research Center, Department of Pediatrics, Baylor College of Medicine, Houston, TX, USA
AbstractThe energy requirements of infants and children are defined as the amount of
food energy needed to balance total energy expenditure (TEE) at a desirable level ofphysical activity, and to support optimal growth and development. New TEE datafrom doubly labeled water and heart rate monitoring are available to derive theenergy requirements. Compared with the 1985 FAO/WHO/UNU recommendations,the 2004 FAO/WHO/UNU and 2002 IOM recommendations are ~12–20% lower duringinfancy. The 2004 FAO/WHO/UNU recommendations are on average 18% lower forboys and 20% lower for girls �7 years of age, and 12% lower for boys and 5% lowerfor girls 7–11 years of age. From 12 to 18 years of age, the requirements are 12%higher for boys and girls. The 2002 IOM recommendations are 8% lower for children�7 years of age, 2% lower for children 7–11 years of age, and 8% higher for children12–18 years of age. Although the basic principles underlying energy requirementshave not changed, the recommendations for energy intake have been decreased ininfancy and early childhood, and increased in adolescence based on newly availableTEE data.
Copyright © 2006 Nestec Ltd., Vevey/S. Karger AG, Basel
Introduction
The energy requirements of infants and children are defined as the amountof food energy needed to balance total energy expenditure (TEE) at a desir-able level of physical activity, and to support optimal growth and develop-ment consistent with long–term health [1, 2]. Recommendations for dietaryenergy intake must meet energy requirements to avoid the double burden ofunder-and overnutrition. Unlike recommendations for other nutrients whichmeet or exceed the requirements of practically all individuals in the population,
19
Rigo J, Ziegler EE (eds): Protein and Energy Requirements in Infancy and Childhood.Nestlé Nutr Workshop Ser Pediatr Program, vol 58, pp 19–37,Nestec Ltd., Vevey/S. Karger AG, Basel, © 2006.

recommendations for dietary energy intake are based on the average require-ment of the population group to avoid energy intakes that exceed requ-irements. Recommendations for energy intake and physical activityare intended to support and maintain the growth and development of well-nourished and healthy children and adolescents.
Components of Energy Requirements
Energy requirements during development can be partitioned into compo-nents of basal metabolism, thermogenesis, physical activity, and energy costof growth. Basal metabolism is defined as that energy expended to maintaincellular and tissue processes fundamental to the organism. Energy is neededto maintain body temperature, support the minimal work of the heart andrespiratory muscles, and supply energy to other tissues at rest. The basalmetabolic rate (BMR) is measured under standard conditions defined asawake and supine in a fasting, relaxed state in a thermoneutral environment.The thermic effect of feeding (TEF) refers to the energy required for theingestion and digestion of food and for the absorption, transport and utiliza-tion of nutrients. The TEF amounts to about 10% of the daily energy expen-diture [3]. Thermoregulation can constitute an additional energy cost whenexposed to temperatures below and above thermoneutrality; however, cloth-ing and behavior usually counteract such environmental influences. Physicalactivity is the most variable component of energy requirements, and entailsboth obligatory and discretionary physical activities. The energy requirementfor growth relative to maintenance is low, except for the first months of life.The energy cost of growth as a percentage of total energy requirementsdecreases from around 35% at 1 month to 3% at 12 months of age, andremains low until the pubertal growth spurt, at which time it increases toabout 4% [1].
Approaches for Derivation of Energy Requirements
Energy requirements can be derived using the factorial estimates of TEEor measurements of TEE by the doubly labeled water (DLW) method or heartrate monitoring. The factorial approach is based on the time allocated toactivities that are performed habitually and the energy cost of those activi-ties. Factorial calculations are heavily dependent upon the estimation of basalmetabolism, and energy expended in obligatory and discretionary activities.DLW is a stable (nonradioactive) isotope method that provides an estimate ofTEE in free-living individuals [4, 5]. The DLW method entails administrationof two isotopic forms of water (H2
18O and 2H2O) and is based on the principle
Butte
20
that the disappearance rate of 2H reflects the water turnover rate and thedisappearance rate of 18O reflects both water and CO2 turnover rates. Thedifference between the disappearance rates of 2H and 18O represents the rateof CO2 production. The DLW method has been validated in preterm and term[6, 7]. In the heart rate method, TEE is predicted from heart rate based on thenearly linear relationship between heart rate and O2 uptake during submaxi-mal muscular work [8].
Consequences of Deficit and Excess Energy Intake
Deficit energy intake and negative energy balance can be acute or chronic[9]. Acute energy deficiency results in short-term negative energy balanceduring which there is a progressive loss of body weight. Chronic energy defi-ciency reflects long-term inadequate food intake during which a steady stateis achieved at a suboptimal nutritional status. Energy deficit in children leadsto growth retardation, loss of fat and muscle, delayed motor, cognitive andbehavioral development, diminished immunocompetence, and increasedmorbidity and mortality [10]. Adaptations in metabolic rate and physical acti-vity in response to chronic energy deficiency in children are difficult to assessfor technical problems and mitigating geographical and social circumstances.The functional and behavioral consequences of energy deficiency are respon-sive to food supplementation. Food policies and nutrition programs aimed atmeeting the energy requirements of children are clearly warranted, but theirimplementation should promote healthy diets with adequate, not excess,calories. Supplementation programs, especially in stunted populations, cancontribute to obesity. Program targeting to undernourished children, growthmonitoring and qualitative improvement in food provisions may be instru-mental in preventing energy excess [11].
Excess energy intake and positive energy balance are promoted by readilyavailable, energy-dense foods and sedentary lifestyles [11]. The consequencesof excess energy and obesity are well described in children [12]. Obesity-related co-morbidities include type-2 diabetes, hyperlipidemia, hypertension,hyperandrogenism in girls, sleep disorders, respiratory difficulties, nonalcoholicfatty liver disease, gallbladder disease, orthopedic problems, and idiopathicintracranial hypertension. Serious psychosocial problems including poor self-esteem and depression also are common. Childhood obesity and its co-morbidities have a significant likelihood of persisting throughout adolescenceand into adulthood.
Societies in transition are afflicted with the double burden of energydeficit and energy excess. As societies develop economically and adopt moreWesternized food habits and sedentary lifestyles, there is a shift away fromundernutrition towards overnutrition, as evidenced by the rise in the preva-lence of childhood obesity worldwide in the past two decades [13, 14].
Energy Requirements of Infants and Children
21

Energy Requirements of Infants
Previous recommendations for dietary energy intake of infants were basedon the observed intakes of healthy infants growing normally, largely due tothe lack of information on the energy expended in physical activity needed toestimate TEE. Since the 1985 FAO/WHO/UNU report [15], new scientific datahave allowed recommendations to be based on TEE plus the energy needs forgrowth [16].
Total Energy Expenditure of Infants
Thirteen DLW studies were available on infants from the United Kingdom,United States, Netherlands, Chile and China [16]. TEE ranged from 255 to393 kJ/kg/day (61–94 kcal/kg/day). Four studies demonstrated higher rates ofTEE in formula-fed than breast-fed infants in the first year of life, in the orderof 12, 7, 6 and 3% at 3, 6, 9 and 12 months of age [17–20]. A prediction equa-tion (equation 1) for TEE was developed based on longitudinal data on 76healthy infants studied at 3-month intervals for the first 2 years of life [18].Although TEE was a function of age, weight and height, only weight was usedin the prediction equation because of the high inter-correlations betweenvariables (r � 0.91–0.96).
TEE (MJ/day) � �0.416 � 0.371 weight (kg) SEE � 0.456 (1)TEE (kcal/day) � �99.4 � 88.6 weight (kg) SEE � 109
Energy Cost of Growth during Infancy
During infancy, energy is required to support the substantial changes inbody weight and composition. Not only does the infant increase in size, butbody fat increases from about 11% in newborns to 31% at 3–6 months [21]. Theenergy cost of growth consists of the energy deposited in newly synthesizedtissues plus the cost of synthesis which is encompassed in the DLW-derivedTEE. Energy deposition can be computed from the rates of protein and fat dep-osition assuming energy equivalents of protein (23.6 kJ/g or 5.65 kcal/g) and fat(38.7 kJ/g or 9.25 kcal/day). Serial measurements of body composition changesduring infancy are used to compute energy deposition [21, 22]. The energy costof growth decreases substantially during the first year of life from approxi-mately 730 kJ/day (175 kcal/day) at 0–3 months to 250 kJ/day (60 kcal/day) at4–6 months and 85 kJ/day (20 kcal/day) for 1–12 months of age.
Physical Activity Level of Infants
As infants grow and develop, physical activity represents an increasing, yetminor, component of TEE. The physical activity level (PAL) of infants can be
Butte
22

estimated from TEE, in conjunction with a measured or estimated BMR(PAL � TEE/BMR). The basal metabolism of infants has been investigatedextensively and prediction equations for BMR are available. Schofield et al.[23] compiled �300 measurements from historical data to develop predictivemodels based on weight and length. These equations have been evaluated inmore recent investigations, and have been found to underestimate BMR atearly ages by about 5–12% from 1 to 9 months of age [24, 25]. In infants, PALincreases from 1.2 at 3 months to 1.4 at 12 months of age [18, 26].
Dietary Energy Recommendations for Infants
In the recent FAO/WHO/UNU [1] and IOM [2] reports, the average energyrequirements of infants were based upon the TEE and growth rates ofhealthy, well-nourished infants (tables 1, 2). In the 2004 FAO/WHO/UNUreport, energy requirements are presented for all infants combined, as well asseparately for breast-fed and formula-fed infants [1]. In the FAO/WHO/UNUreport, the median weight-for-age and monthly rates of weight gain of theWHO pooled breast-fed data set were used to calculate energy requirements[27]. In the 2002 IOM report, the 50th percentiles for weight gain published byGuo [28] were used to compute the energy cost of growth. Compared with the1985 FAO/WHO/UNU report [15], the 2004 FAO/WHO/UNU and 2002 IOMrecommendations are �12% lower from 0 to 3 months, 17% lower from 3 to 9months, and 20% lower from 9 to 12 months of age (figs. 1, 2).
Energy Requirements of Infants and Children
23
Table 1. Energy requirements of boys during the first year of life
1985 FAO/WHO/ 2004 FAO/WHO/UNU [1] 2002 IOM [2]UNU [15]
age kJ/kg/ MJ/ kcal/ kJ/kg/ kcal/ age MJ/ kcal/ kJ/ kcal/months day day day day kg/day months day day kg/d kg/day
0–1 519 2.166 518 473 113 1 1.975 472 449 1071–2 485 2.387 570 434 104 2 2.372 567 448 1072–3 456 2.494 596 397 95 3 2.393 572 399 953–4 431 2.38 569 343 82 4 2.293 548 342 824–5 414 2.546 608 340 81 5 2.494 596 342 825–6 404 2.674 639 337 81 6 2.699 645 342 826–7 397 2.73 653 329 79 7 2.795 668 333 807–8 395 2.845 680 330 79 8 2.971 710 334 808–9 397 2.936 702 330 79 9 3.121 746 336 809–10 414 3.058 731 335 80 10 3.318 793 342 82
10–11 418 3.145 752 336 80 11 3.418 817 342 8211–12 437 3.243 775 337 81 12 3.531 844 343 82

Butte
24
Table 2. Energy requirements of girls during the first year of life
1985 FAO/WHO/ 2004 FAO/WHO/UNU [1] 2002 IOM [2]UNU [15]
age kJ/kg/ MJ/ kcal/ kJ/kg/ kcal/ age MJ/ kcal/ kJ/kg/ kcal/months day day day day kg/ months day day day kg/
day day
0–1 519 1.942 464 447 107 1 1.833 438 436 1041–2 485 2.162 517 421 101 2 2.092 500 427 1022–3 456 2.301 550 395 94 3 2.180 521 396 953–4 431 2.245 537 350 84 4 2.125 508 348 834–5 414 2.389 571 345 83 5 2.314 553 345 825–6 404 2.507 599 341 82 6 2.481 593 345 826–7 397 2.525 604 328 78 7 2.544 608 330 797–8 395 2.63 629 328 78 8 2.690 643 332 798–9 397 2.728 652 328 78 9 2.837 678 334 809–10 414 2.828 676 331 79 10 3.000 717 337 81
10–11 418 2.902 694 331 79 11 3.105 742 337 8111–12 437 2.981 712 331 79 12 3.213 768 338 81
0
300
400
500
600
0
60
80
100
120
140
0 2 4 6 8 10 12
Energ
y r
eq
uirem
ents
(kJ/k
g/d
ay)
Energ
y r
eq
uirem
ents
(kcal/kg
/day)
Age (months)
1985 FAO/WHO/UNU
2004 FAO/WHO/UNU
2002 IOM
0
70
80
90
100
0 2 4 6 8 10 12
%1985 FAO/WHO/UNU
Age (months)
Fig. 1. Energy requirements for girls 0–12 months of age.

Energy Requirements of Children and Adolescents
Because of insufficient data on the activity patterns of children under 10years of age, previous estimations of energy requirements were based uponobserved energy intakes [15]. For children over 10 years of age, the factorialapproach was taken. Since then, reliable information on the TEE of childrenand adolescents has become available to derive the energy requirements ofchildren and adolescents.
Total Energy Expenditure of Children and Adolescents
A substantial amount of DLW data have now accumulated across a widerange of ages and body sizes, so that the energy requirements of children andadolescents can be based on DLW measurements of TEE [2]. However, theavailable DLW data are not representative of the wide diversity in lifestylesfrom around the world. The majority of measurements were obtained fromthe children living in the United States or Europe where TEE is influenced bymodern technology and transportation systems that tend to demand lowphysical effort [29]. There are, however, TEE data derived from heart ratemonitoring available from a broader spectrum of populations.
In the 2004 FAO/WHO/UNU report [1], DLW and heart rate monitoringwere used to predict the TEE of children and adolescents. The TEE data of
Energy Requirements of Infants and Children
25
Fig. 2. Energy requirements for boys 0–12 months of age.
0
300
400
500
600
0
60
80
100
120
140
0 2 4 6 8 10 12
Energ
y r
eq
uirem
en
ts (kJ/k
g/d
ay)
Energ
y r
eq
uirem
en
ts (kcal/kg
/day)
Age (months)
1985 FAO/WHO/UNU
2004 FAO/WHO/UNU
2002 IOM
0
70
80
90
100
0 2 4 6 8 10 12
%1985 FAO/WHO/UNU
Age (months)

801 boys and 808 girls ages 1–18 years were compiled from Canada, Denmark,Italy, Sweden, Netherlands, Brazil, Chile, Columbia, Guatemala, and Mexico;specific prediction equations for TEE were developed for boys and girls [29].
For boys:
TEE (MJ/day) � 1.298 � 0.265 weight (kg) � 0.0011 weight2 (kg2) SEE � 0.518
TEE (kcal/day) � 310.2 � 63.3 weight (kg) � 0.263 weight2 (kg2) SEE � 124 (2)
For girls:
TEE (MJ/day) � 1.102 � 0.273 weight (kg) � 0.0019 weight2 (kg2) SEE � 0.650
TEE (kcal/day) � 263.4 � 65.3 weight (kg) � 0.454 weight2 (kg2) SEE � 155 (3)
In the 2002 IOM report [2], TEE was estimated from DLW measurementscompiled on normal weight children with body mass indexes between the 5thto 85th percentiles. Separate TEE predictive equations were developed fornormal-weight boys and girls from age, height, weight, and PAL categoryusing nonlinear regression techniques. The PAL categories were defined assedentary (PAL � 1.0 � 1.4), low active (PAL � 1.4 � 1.6), active (PAL �
1.6 � 1.9), and very active (PAL � 1.9 � 2.5). Specific prediction equationsfor TEE were developed for boys and girls.
For boys:
TEE � 88.5 � (61.9 � age [years]) � PA � (26.7 � weight [kg] � 903 �
height [m]) (4)
where PA, the physical activity coefficient, was equal to 1.00, 1.13, 1.26 or1.42 for the sedentary, low active, active and very active categories.
For girls:
TEE � 135.3 � (30.8 � age [years])� PA � (10.0 � weight [kg] � 934 �
height [m]) (5)
where PA, the physical activity coefficient, was equal to 1.00, 1.16, 1.31 or1.56 for the sedentary, low active, active and very active categories.
Energy Cost of Growth during Childhood and Adolescence
During adolescence, gender differences in body size and composition areaccentuated [30]. Adolescence in boys is characterized by rapid acquisition offat-free mass (FFM) and a modest increase in fat mass in early puberty, fol-lowed by a decline. Adolescence in girls is characterized by a modest increasein FFM and a continual accumulation of fat mass. Despite these maturationalchanges, the energy cost of growth is minor relative to maintenance and physi-cal activity.
In the 2004 FAO/WHO/UNU report [1], the energy cost of growth wasbased on mean rates of weight gain calculated from the WHO weight-for-age
Butte
26

standards [31]. The composition of weight gained was assumed to be 10% fatwith energy content of 38.7 kJ/g (9.25 kcal/g), 20% protein with an energycontent of 23.6 kJ/g (5.65 kcal/day) and 70% water, carbohydrate and miner-als with negligible energy content. In the 2002 IOM report [2], the energy costof growth was computed based on rates of weight gain of children enrolled inthe FELS Longitudinal Study [32] and rates of protein and fat deposition forchildren and adolescents [33]. The energy cost of tissue deposition wasapproximately 85 kJ/day (20 kcal/day), increasing to 125 kJ/day (30 kcal/day)at peak growth velocity.
Physical Activity Level of Children and Adolescents
A minimum of 60 min/day of moderate-intensity physical activity is recom-mended for children [1, 2], although there is no direct experimental or epi-demiological evidence on the minimal or optimal frequency, duration orintensity of exercise that promotes the health and well-being of children [34].Regular physical activity is often associated with decreased body fat in bothgenders and, sometimes, increased FFM, at least in males [35, 36]. Physicalactivity is associated with greater skeletal mineralization, bone density, andbone mass [37].
Energy requirements must be adjusted in accordance with habitual physi-cal activity. Torun [38] compiled 42 studies on the activity patterns of 6,400children living in urban, rural, industrialized and developing settings fromaround the world. Compared with children in industrialized societies, chil-dren in developing rural areas expended more energy in domestic and pro-ductive work, and less energy in low energy activities such as attendingschool. The TEE of rural boys and girls was 10, 15 and 25% higher at 5–9,10–14 and 15–19 years of age, respectively, than their urban counterparts.
As part of the compilation of TEE values described above, PAL values wereestimated by using measured or predicted BMR [29]. The Schofield equationsfor BMR [23] were used to predict the PAL for children and adolescents, if notprovided in the original publication. The average PAL (1.7) from these studiesreflects a moderate level of activity. To estimate the energy requirements ofchildren with different levels of habitual physical activity, a 15% allowancewas subtracted or added to the average PAL to estimate light (PAL � 1.5)and vigorous (PAL � 2.0) levels of activity in the 2004 FAO/WHO/UNU report(figs. 3, 4). In the 2002 IOM report, energy requirements are computed forsedentary, low active, active and very active levels of physical activity.
Dietary Energy Recommendations for Children and Adolescents
A marked variability in energy requirements exists for boys and girlsbecause of variations in growth rate and physical activity (tables 3, 4). In the
Energy Requirements of Infants and Children
27

Butte
28
Fig. 4. Energy requirement of boys at three levels of habitual physical activity.
0
100
200
300
400
500
600
0
50
100
150
0 2 4 6 8 10 12 14 16 18
Energ
y r
eq
uirem
ents
(kJ/k
g/d
ay)
Energ
y r
eq
uirem
ents
(kcal/kg
/day)
Age (years)
Light
Moderate
Heavy
Low active
Active
Very active
2004 FAO/WHO/UNU
2002 IOM
Fig. 3. Energy requirements of girls at three levels of habitual physical activity.
0
100
200
300
400
500
600
0
50
100
150
0 2 4 6 8 10 12 14 16 18
Energ
y r
eq
uirem
en
ts (kJ/k
g/d
ay)
Energ
y r
eq
uirem
ents
(kcal/kg
/day)
Age (years)
Light
Moderate
Heavy
Low active
Active
Very active
2004 FAO/WHO/UNU
2002 IOM

Energy Requirements of Infants and Children
29
2004 FAO/WHO/UNU report [1], the average energy requirements for a mod-erately active child were derived using the above TEE equations (equations 2and 3) and the energy cost of growth for the WHO reference values formedian weight [31]. Compared with the 1985 FAO/WHO/UNU recommenda-tions [15], the present recommendations are on average 18% lower for boysand 20% lower for girls under 7 years of age, and 12% lower for boys and 5%lower for girls 7–11 years of age. From 12 to 18 years, the requirements are12% higher for boys and girls (fig. 5).
In the 2002 IOM report [2], energy requirements for an active child werebased on TEE (equations 4 and 5) plus an average energy deposition of20–25 kcal/day. The IOM recommendations are 8% lower for children under7 years of age, 2% lower for children 7–11 years of age, and 8% higher forchildren 12–18 years of age than the 1985 FAO/WHO/UNU recommendations[15] (fig. 6).
Although the basic principles underlying the energy requirements of infantsand children have not changed, recommendations for energy intake have been
Table 3. Energy requirements of boys 0–18 years of age
1985 FAO/ 2004 FAO/WHO/UNU1 [1] 2002 IOM2 [2]WHO/UNU1 [15]
age kJ/kg/ MJ/ kcal/ kJ/kg/ kcal/ age MJ/ kcal/ kJ/kg/ kcal/years day day day day kg/day years day day day kg/day
1–2 439 4.0 950 345 82 1 3.531 844 343 822–3 418 4.7 1,125 350 84 2 4.393 1,050 346 833–4 397 5.2 1,250 334 80 3 6.213 1,485 434 1044–5 397 5.7 1,350 322 77 4 6.552 1,566 404 975–6 377 6.1 1,475 312 74 5 6.937 1,658 377 906–7 377 6.6 1,575 303 73 6 7.289 1,742 352 847–8 326 7.1 1,700 295 71 7 7.699 1,840 333 808–9 326 7.7 1,825 287 69 8 8.079 1,931 316 759–10 326 8.3 1,975 279 67 9 8.548 2,043 299 71
10–11 267 9.0 2,150 270 65 10 8.991 2,149 282 6711–12 267 9.8 2,350 261 62 11 9.535 2,279 266 6412–13 228 10.7 2,550 252 60 12 10.159 2,428 251 6013–14 228 11.6 2,775 242 58 13 10.954 2,618 240 5714–15 200 12.5 3,000 233 56 14 11.837 2,829 232 5615–16 200 13.3 3,175 224 53 15 12.606 3,013 224 5416–17 186 13.9 3,325 216 52 16 13.188 3,152 217 5217–18 186 14.3 3,400 210 50 17 13.498 3,226 209 50
18 13.652 3,263 203 49
1FAO/WHO/UNU energy requirements computed for moderate levels of physicalactivity.
2IOM energy requirements computed for active level of physical activity.

Butte
30
Fig. 5. Energy requirements for girls 1–18 years of age.
0
100
200
300
400
500
600
0
50
100
150
0 2 4 6 8 10 12 14 16 18
Energ
y r
eq
uirem
ents
(kJ/k
g/d
ay)
Energ
y r
eq
uirem
ents
(kcal/kg
/day)
Age (years)
1985 FAO/WHO/UNU
2004 FAO/WHO/UNU
2002 IOM
0
80
100
120
140
0 2 4 6 8 10 12 14 16 18
%1985 FAO/WHO/UNU
Age (years)
Table 4. Energy requirements of girls 0–18 years of age
1985 FAO/ 2004 FAO/WHO/ 2002 IOM2 [2]WHO/ UNU1 [1]UNU1 [15]
age kJ/ MJ/ kcal/ kJ/ kcal/ age MJ/ kcal/ kJ/ kcal/years kg/day day day kg/day kg/day years day day kg/day kg/day
1–2 439 3.6 850 335 80 1 3.213 768 338 812–3 418 4.4 1,050 339 81 2 4.171 997 345 823–4 397 4.8 1,150 322 77 3 5.837 1,395 420 1004–5 397 5.2 1,250 310 74 4 6.171 1,475 391 935–6 356 5.6 1,325 301 72 5 6.514 1,557 364 876–7 356 6.0 1,425 289 69 6 6.870 1,642 340 817–8 280 6.5 1,550 280 67 7 7.192 1,719 315 758–9 280 7.1 1,700 268 64 8 7.573 1,810 296 719–10 280 7.7 1,850 255 61 9 7.908 1,890 273 65
10–11 227 8.4 2,000 243 58 10 8.251 1,972 251 6011–12 227 9.0 2,150 230 55 11 8.665 2,071 233 5612–13 189 9.5 2,275 218 52 12 9.134 2,183 220 5213–14 189 10.0 2,375 205 49 13 9.544 2,281 208 5014–15 173 10.2 2,450 197 47 14 9.765 2,334 198 4715–16 173 10.4 2,500 188 45 15 9.883 2,362 190 4516–17 167 10.5 2,500 184 44 16 9.908 2,368 184 4417–18 167 10.5 2,500 184 44 17 9.845 2,353 179 43
18 9.774 2,336 174 42
1FAO/WHO/UNU energy requirements computed for moderate levels of physicalactivity.
2IOM Energy requirements computed for active level of physical activity.

decreased in infancy and early childhood, and increased in adolescence basedon newly available TEE data. Even though energy requirements are also pre-sented for varying levels of physical activity, moderately active lifestyles arestrongly encouraged to maintain fitness and health and to reduce the risk ofdeveloping obesity and its co-morbidities.
References
1 FAO/WHO/UNU Expert Consultation: Human Energy Requirements. Rome, World HealthOrganization, 2004.
2 Institute of Medicine: Dietary Reference Intakes for Energy, Carbohydrate, Fiber, Fat, FattyAcids, Cholesterol, Protein, and Amino Acids, ed 5. Washington, National Academy ofScience, 2002.
3 Danforth E: Diet and obesity. Am J Clin Nutr 1985;41:1132–1145.4 Schoeller DA, Van Santen E: Measurement of energy expenditure in humans by doubly
labeled water method. J Appl Physiol 1982;53:955–959.5 Schoeller DA, Leitch CA, Brown C: Doubly labeled water method: in vivo oxygen and hydro-
gen isotope fractionation. Am J Physiol 1986;1:R1137–R1143.6 Roberts SB, Coward WA, Schlingenseipen K-H, et al: Comparison of the doubly labeled water
(2H218O) method with indirect calorimetry and a nutrient-balance study for simultaneous
determination of energy expenditure, water intake, and metabolizable energy intake inpreterm infants. Am J Clin Nutr 1986;44:315–322.
7 Jensen CL, Butte NF, Wong WW, Moon JK: Determining energy expenditure in preterminfants: comparison of 2H2
18O method and indirect calorimetry. Am J Physiol 1992;32:R685–R692.
Energy Requirements of Infants and Children
31
Fig. 6. Energy requirements for boys 1–18 years of age.
0
100
200
300
400
500
600
0
50
100
150
0 2 4 6 8 10 12 14 16 18
Energ
y r
eq
uirem
ents
(kJ/k
g/d
ay)
Energ
y r
eq
uirem
ents
(kcal/kg
/day)
Age (years)
1985 FAO/WHO/UNU
2004 FAO/WHO/UNU
2002 IOM
0
80
100
120
140
0 2 4 6 8 10 12 14 16 18
%1985 FAO/WHO/UNU
Age (years)

8 Berggren G, Christensen EH: Heart rate and body temperature as indices of metabolic rateduring work. Arbeitsphysiologie 1950;14:255–260.
9 Kurpad AV, Muthayya S, Vaz M: Consequences of inadequate food energy and negative energybalance in adults and children. Public Health Nutr 2005;8:1053–1076.
10 Martorell R: The nature of child malnutrition and its long-term implications. Food Nutr Bull1999;20:288–292.
11 Uauy R, Diaz E: Consequences of food energy excess and positive energy balance. PublicHealth Nutr 2005;8:1077–1099.
12 Speiser PW, Rudolf MCJ, Anhalt H, et al: Consensus statement: childhood obesity. J ClinEndocrinol Metab 2005;90:1871–1887.
13 Nishida C, Uauy R, Kumanyika S, Shetty P: The joint WHO/FAO expert consultation on diet,nutrition and the prevention of chronic diseases: process, product and policy implications.Public Health Nutr 2004;7:245–250.
14 Lobstein T, Baur L, Uauy R: Obesity in children and young people: a crisis in public health.Obes Rev 2004;5:4–104.
15 Energy and protein requirements. Report of a Joint FAO/WHO/UNU Consultation: WorldHealth Organ Tech Rep Ser 1985;724:1–206.
16 Butte NF: Energy requirements of infants. Public Health Nutr 2005;8:953–956.17 Butte NF, Wong WW, Ferlic L, Smith EO: Energy expenditure and deposition of breast-fed
and formula-fed infants during early infancy. Pediatr Res 1990;28:631–640.18 Butte NF, Wong WW, Hopkinson JM, et al: Energy requirements derived from total energy expen-
diture and energy deposition during the first 2 years of life. Am J Clin Nutr 2000;72:1558–1569.19 Jiang Z, Yan Q, Su Y, et al: Energy expenditure of Chinese infants in Guangdong Province,
south China, determined with use of the doubly labeled water method. Am J Clin Nutr 1998;67:1256–1264.
20 Davies PSW, Ewing G, Lucas A: Energy expenditure in early infancy. Br J Nutr 1989;62:621–629.
21 Butte NF, Hopkinson JM, Wong WW, et al: Body composition during the first two years of life:an updated reference. Pediatr Res 2000;47:578–585.
22 de Bruin NC, Degenhart HJ, Gàl S, et al: Energy utilization and growth in breast-fed and for-mula-fed infants measured prospectively during the first year of life. Am J Clin Nutr 1998;67:885–896.
23 Schofield WN, Schofield C, James WPT: Basal metabolic rate – review and prediction,together with an annotated bibliography of source material. Hum Nutr Clin Nutr 1985;39C:1–96.
24 Butte NF, Wong WW, Garza C: Energy cost of growth during infancy. Proc Nutr Soc 1989;48:303–312.
25 Wells JCK, Davies PSW: Energy cost of physical activity in twelve week old infants. Am J HumBiol 1995;7:85–92.
26 Tennefors C, Coward WA, Hernell O, et al: Total energy expenditure and physical activitylevel in healthy young Swedish children 9 or 14 months of age. Eur J Clin Nutr 2003;57:647–653.
27 World Health Organization Working Group on Infant Growth: An Evaluation of Infant Growth.Nutrition Unit, World Health Organization. Geneva, World Health Organization, 1994, vol 94,pp 1–83.
28 Guo S: Reference data on gains in weight and length during the first two years of life.J Pediatr 1991;119:355–362.
29 Torun B: Energy requirements of children and adolescents. Public Health Nutr 2005;8:968–993.
30 Forbes GB: Human Body Composition. Growth, Aging, Nutrition, and Activity. New York,Springer, 1987.
31 Measuring Change in Nutritional Status. Geneva, World Health Organization, 1983.32 Baumgartner RN, Roche AF, Himes JH: Incremental growth tables: supplementary to previ-
ously published charts. Am J Clin Nutr 1986;43:711–722.33 Haschke F: Body Composition Measurements in Infants and Children. 98th Ross Conference
on Pediatric Research. Columbus, Ross Laboratories, 1989, pp 76–83.34 Boreham C, Riddoch C: The physical activity, fitness and health of children. J Sports Sci
2001;19:915–929.
Butte
32

35 Parizkova J: Particularities of lean body mass and fat development in growing boys as relatedto their motor activity. Acta Paediatr Belg 1974;28:S233–S242.
36 Deheeger M, Rolland-Cachera MF, Fontvieille AM: Physical activity and body composition in10 year old French children: linkages with nutritional intake? Int J Obes Relat Metab Disord1997;21:372–379.
37 Malina RM: Growth and maturation: normal variation and effect of training; in Gisolfi CV,Lamb DR (eds): Perspectives in Exercise Science and Sports Medicine. Vol 2: Youth, Exerciseand Sport. Indianapolis, Benchmark Press, 1989, pp 223–265.
38 Torun B: Energy cost of various physical activities in healthy children; in Schurch B,Scrimshaw NS (eds): Activity, Energy Expenditure and Energy Requirements of Infants andChildren. Geneva, International Dietary Energy Consultancy Group, 1989, pp 139–183.
Discussion
Dr. Koletzko: One should encourage people to use such refined methodology tolook further into better defining nutrient requirements where we still rely very muchon estimates. I think Dr. Pencharz will probably give us another example on wherethis could lead to. I am also impressed by your adaptation of the estimates of energyrequirements by 10–20% which have a real impact in infancy. If we consider thathigh energy intakes and high growth rates in this period of life might have long-termconsequences on overweight and obesity at later ages. The Codex Alimentarius ispresently discussing a revision of the global infant formula standard and, based onmuch of what you have presented, considered altering the range of energy density informula. However, I have a concern when I see your slide showing that the energyrequirement recommendations are intended to be prescriptive for populations. HereI have real difficulty in understanding because while this may be relevant for subjectswho are fed on one and the same formulation, infant formula or tube feeding in sickchildren, I am not sure how you can prescribe energy intake to populations. So I amnot sure where the real impact of that would be beyond infancy.
Dr. Butte: In many ways we implement these requirements on a population basis,on a group basis and on an individual basis in the United States. One thing that comesto mind, for instance, is how we feed children in school. They start somewhere and bylaw in the United States we are required to actually feed a certain percentage of theenergy requirement at lunch and at breakfast. So there are ways in which theserequirements get translated into policy and into programs. So in that sense I think weare contributing to the public health of individuals. Certainly I can’t dictate what anindividual child is going to eat under those circumstances, but at the group level weare influencing what the schools for instance will get. When you think of infant feedingprograms and preschool feeding programs, there has to be an estimate where to start,and I think to the best of our knowledge we should start where we think the require-ment is. Dr. Uauy has presented very nice data where policy in Chile has really influ-enced what happening to preschool children. Those programs were initiated manyyears ago to combat malnutrition; but malnutrition has now decreased in those coun-tries and overweight is being seen, he has had to fight hard to get some of those poli-cies changed and they are actually fitting in a very large national program inpreschoolers. So in that sense I think we can effect the health of infants and childrenthrough our programming. I certainly appreciate your first comment that we can takevery sophisticated techniques to better our knowledge of what the requirements reallyare. One of the things that was really very distressing for me is when we met with theFAO and tried to get the global data for doubly labeled water studies, and found therewere no data for the developing world. That is really a pity, and it coincides with when
Energy Requirements of Infants and Children
33

we were trying to use the technique, 18O became very scarce; so just as the study wasgaining momentum our supply was cutoff. But fortunately 18O is again available, and itis a wonderful opportunity at the Nestlé Institute to go into these transitional societiesand capture the energy expenditure of children. There is a lot of discussion; has phys-ical activity in children really changed? We don’t have good historical data inWesternized populations, but here is an opportunity to study traditional societies,societies in transition, as well as developed societies, and see what the range of physi-cal activities of children is. Here in Viet Nam the children ride bicycles; they can’t geta motorcycle before 18 years of age, so they still ride bicycles. It would be fascinatingto really see what the energy expenditure of these children is.
Dr. van Goudevoer: You showed us a lot of graphs and equations, and one of themattracted my attention. It showed that the energy expenditure of formula-fed infantsis higher than that of breastfed infants. Is that due to malabsorption problems for for-mulas; is it due to other qualities of protein or energy, or is it due to differences ingrowth?
Dr. Butte: We don’t know why the breastfed infants have lower energy expendi-ture than formula-fed infants. It doesn’t have anything to do with the absorption. Weare really talking about total energy expenditure which then impacts their require-ments. We know that theoretically because they are eating less, the thermic effect offeeding would contribute proportionally less; we know that if they are growing less,the energy cost of growth will be different; we know the composition of the tissuesbeing laid down also differs between breastfed and formula-fed infants. So all thesealthough they seem quite minor they do add up and contribute to that difference inenergy expenditure we see. We started out measuring sleeping metabolic rates in ourearlier studies, and found a difference in the sleeping metabolic rate as well as totalenergy expenditure. So there is a component of basal as well as a component of phys-ical activity.. We know that there are potential chemicals in breast milk that may havea different effect on energy expenditure, a depressive effect. But no one has actuallyproven that any of these are the source of that difference.
Dr. Pencharz: The one thing I wanted to ask you about, in you childhood data youchose, at least for the IOM, to have a body mass index between the 5th and 85th per-centiles, but surely normal distribution should be between the 15th and 85th per-centiles. There are recent data that actually say that the 15th percentile is a bettercutoff for undernutrition than the 5th percentile. What difference would it make onyour overall data, the choice of the 5th rather than 15th?
Dr. Butte: I would say very little because if we go back and eliminate all the chil-dren that were less than 5th percentile, the actual doubly labeled water that is avail-able is very minor in that group. So that extra 10% from the 5th to the 15th percentilewould make very little difference. We took the 5th percentile for a pediatric conven-tion defining undernutrition, not on the distribution of the population.
Dr. Dewey: I want to follow up on the question about the difference between breast-fed and formula-fed infants in energy expenditure. My understanding from your data isthat there wasn’t a difference in the physical activity component of the total energyexpenditure between breastfed and formula-fed infants. So it is just the basal metabolicrate and the thermic effect of food that differ. I think that is important because it is notthat they are less active. The question I have has to do with the difference between theIOM and FAO requirements for preschool children. You showed lower estimates for theFAO than for the IOM. Can you explain why that is and what the implications are?
Dr. Butte: It is really based on different databases. The FAO has a combination ofthose doubly labeled water studies and also the heart rate monitoring studies whichwere taken from around the world, and that is why it is based on different data. Theactual fitting of the curves was slightly different; a different approach was taken to the
Butte
34

development of the curves. The implications will just have to stand the test of time,and in that one period from about 5 to 10 years of age there is a difference.
Dr. Rigo: I am concerned about the energy intake evaluation, especially for thenewborn infant during the first week of life and also for the preterm infant. In factenergy intake is evaluated according to the feeding volume and the energy content,but the energy content is calculated by the metabolizable energy content using theup-water factor, and is the up-water factor adapted for the newborn infant? In factwhen we analyze metabolic balance studies we see that the energy available differsand probably improves according to postnatal age, and there is some differencebetween breastfed and formula-fed infants. So what is your opinion about that?
Dr. Butte: We don’t have as much information as we would like on the term infant.The committees have met and looked for more data, but they simply don’t exist for theterm breastfed infant. There are a lot of data on formula-balanced studies and there arenow many studies in the preterm infant, but there is just very little on the term breast-fed infant to address that question. We can avoid that whole debate now because totalenergy expenditure is measured directly and then metabolizable energy. So in the olderstudies you start with the gross energy intake doing bonb calorimetry on the milksource and you have to assume or measure metabolizable energy. But that is not anissue in these requirements or in these recommendations. But I agree there are differ-ences in the availability of energy from human milk vs. the formula sources.
Dr. Cong Khanh Nguyen: Your presentation on the new FAO/WHO/UNU recom-mendation for energy expenditure is very interesting, and I am concerned about theimplication of this new recommendation compared to the 1985 recommendation forenergy expenditure, especially for children. Interestingly for children under 10 yearsit is lower than the previous recommendation, but from 10 years onwards it is higherthan the previous recommendation. In Viet Nam we are in a period of developing rec-ommendations for dietary allowance, and we are also looking at physical growth activ-ity programs. So this has very important implications for us. There are three graphs,one from FAO/WHO/UNU in 1985, the second one in 2002 and the third one from theIOM. Is the thermic effect of food, the 10% of energy expenditure, the same? Forexample the pattern of food consumption, food intake, may have different energyexpenditures. Is 10% something standard for different food patterns? Perhaps weneed to do the same kind of study in Viet Nam because the doubly labeled watermethod is quite standard. Do you think that Viet Nam should do this kind of studybecause of different patterns of food intake? We need to do more and look at the phys-ical activity levels in different populations.
Dr. Butte: I think the most important thing is to measure the total energy expendi-ture and the physical activity component in your population of children. The thermiceffect of feeding is going to be around 10% and there will be some variation dependingon the composition of the diet, and possibly an effect on the pattern of intake as well.More importantly we know that the carbohydrate, protein and fat will affect the ther-mic effect of feeding, but not greatly. Where there is going to be the most variability isin knowing what the basal metabolic rate is and the physical activity of the children.So I encourage you to focus on getting a handle on the total energy expenditure ofyour children so that you don’t under- or over-feed them.
Dr. Haschke: I have a practical question. Infant formulas and in particular follow-up formulas are now produced and used assuming that an energy intake of 100 kcal/kgbody weight/day is adequate. According to what you have just shown, after 4 monthsof age the energy requirement is consistently around 80 kcal/kg/day. So if there is apractical consequence, these new requirements should be translated into adequaterecommendations for formula-fed infants, resulting in a change in the packaging labelsand feeding recommendations. So what is your recommendation? Should manufactur-ers now produce formulas with lower energy density for infants after 4 months of age,
Energy Requirements of Infants and Children
35

and also probably with a lower protein concentration? What would be the practicalconsequences? The breastfed infant can self-select what it wants to consume, whereasthe formula-fed infant relies on premixed formulas. What would be the consequences?
Dr. Butte: Up to now the formula companies have tried to simulate the energy con-tent of human milk and it is fairly close on average. Of course there are variationswithin a feed or between feeds, but the formula is set close to the energy content ofthe human milk. There are several trials going on where companies are altering theprotein and energy ratio in formulas and to see what impact that has on weight gain.What we know from Fomon and Nelson [1] is that probably in that early phase ofinfancy the children who receive a feeding at a lower energy density level just con-sume more. Also the studies show that, after a certain point, regulation is not as tight.We simply don’t know what the impact on weight gain will be at various stages ofinfancy if the protein-energy ratio in the formula is changed. As I said there are trialsgoing on and we will have the answer to that. Also as far as the recommendation onthe label: yes, they should be changed to reflect more what we think the requirementsof infants are. In the studies where we have carefully measured the formula intake offormula-fed infants, it is less than 100–120 kcal/kg/day. So I feel very comfortable inchanging what is on the labels, on how we suggest mothers feed their infants.
Dr. Haschke: It seems that we have also overestimated the energy density ofbreast milk. It is 58–60 rather than 67 kcal/l as shown by more recent publications.This would also have an impact on the energy density of follow-up formulas.
Dr. Butte: I think it depends on what studies you look at. We measured the 24-hourvolumes of human milk for years and our bonb calorimetry gave us averages of about0.67–0.68. Depending on the fraction you want to take for metabolizable energy, youdo get down to 62–64 kcal. I don’t think it has changed; if we look at the studies thatwere done very carefully to get 24-hour expressions of human milk, we have seenlower energy content all along. It is very difficult to get a representative sample ofhuman milk, and so when it is taken without paying attention to the time of day orwhat part of the feed, the answers can be different.
Dr. Sauve: You made your assumption on active children for the IOM and thenmoderate activity for the FAO and WHO. We know in North America in fact that veryfew children even do minor activity. I am worried that when people look at these num-bers they think that these are the requirements for all children. In fact you use themfor healthy active children, whereas very few children in North America are active.
Dr. Butte: The requirements have the flexibility of determining the physical activitylevels of your group. For instance, if you know that your children don’t get their60 min/day and you are feeding them for some program, then you could potentially usethe lower activity level. If you plug into the pyramid used in the USA you actually setwhat the physical activity of that individual child is or the group of children you are con-cerned with. I think the strong recommendation for physical activity of at least 60 min iswhat we would like to promote. But slowly we are seeing policy changing, and morephysical education and recesses are being re-instituted in schools. Both committeeshave recognized that there are differences and they can be customized to your needs.
Dr. Dewey: I would like to come back to the issue of compensation for the energydensity of the feeding. The earlier studies that Dr. Fomon and colleagues did werewonderful and really helped us to understand that issue. But I think it is important toremember that, if I recall correctly, the babies were fed by nurses and they were fed ina responsive way, in other words it was after the baby signaled fullness that they wouldstop in those trials. What I think we don’t know is the degree to which babies are rea-sonably good at compensating when fed by parents.
Dr. Ziegler: You are referring to our studies with formulas with decreased caloricdensity. These were all free-living infants at home, all feeding was done by the parents.
Butte
36

Dr. Dewey: Were they given instructions then?Dr. Ziegler: No, they were not even told that there was a different caloric density.
We just gave them the formula and told them to feed it to the babies.Dr. Dewey: Alright, but I do want to point out that perhaps we do need more stud-
ies on how parents of different socioeconomic levels feed formulas and the degree towhich babies do or do not compensate for different energy levels.
Dr. Butte: Equally important in this whole area of early infancy is that there hasbeen a lot of emphasis on the first 6 months of life, but from 6 to 24 months we reallydon’t have the data. Complementary feeding is critical in that area as well.
Dr. Ziegler: I have a question on the hypothetic assumption that it is possible tofeed formula-fed babies the caloric intakes that the new recommendations showwhich are largely based on energy expenditures of breastfed babies.
Dr. Butte: In the IOM we included both, breastfed and formula-fed infants.Dr. Ziegler: On the assumption that it is possible to make formula-fed babies have
energy intakes matching the recommendations, what do you think would happen?Dr. Butte: There are two things going on here. We talked a lot about total weight
gain but we often have to think about the composition of that weight gain. If the pro-tein:energy (PE) ratio is not changed, you still might see a higher accretion of fat-freemass in the formula-fed infants, as we found in our studies at Houston. If both the totalenergy consumed and the PE ratio are changed to simulate human milk, you might finda difference both in the weight gain and the composition of the tissue being deposited. Iknow it has been quite controversial, but our studies showed that we had higher rates offat deposition in our breastfed infants during the period of exclusive breastfeeding. Thedifferences decrease as we approach 12 and 24 months, but in the early period of exclu-sively breastfeeding we clearly saw higher rates of fat deposition, and that was bydiverse techniques. Both components, the total amount of energy delivered as well asthe PE ratio, must be addressed. Here we are focusing on protein and energy, but weoften notice differences in the other nutrients in human milk vs. formula. In the formulawe have much higher levels of the other minerals, and all this may be contributing to thedifferences we see in growth between the breastfed and formula-fed infants.
Reference
1 Fomon SJ, Nelson SE: Body composition of the male and female reference infants. Annu RevNutr 2002;22:1–17.
Energy Requirements of Infants and Children
37


Protein Requirements of Infants and Children
Peter J. Garlick
Department of Animal Sciences, University of Illinois, Urbana, IL, USA
AbstractDuring the last 35 years there have been various published assessments of human
protein needs, including those of infants and children. Most recently, the Institute ofMedicine of the US National Academies has published its report on Dietary ReferenceIntakes (DRI) for Macronutrients, and WHO/FAO/UNU have convened a new ExpertConsultation, which is due to be published soon.
Although there have been a number of published studies on children’s proteinrequirements determined by the nitrogen balance technique, the results of these stud-ies in themselves are insufficient to derive requirement values for all ages. Instead, ameta-analysis of the data from a range of studies in children has been used to derivevalues for the requirement for maintenance (i.e. no growth), and for the efficiency ofutilization of dietary protein for growth. These values were then combined with age-specific rates of protein deposition to calculate the average requirement at any age.New values for protein deposition in children have been derived from studies of potas-sium-40 accumulation in infants and children, and these have been employed in newcalculations of the average protein requirement. By combining values for the mainte-nance requirement, derived from adults, with the requirement for growth, estimatedby analysis of the data for total-body potassium at different ages, the age-specificaverage protein requirement was determined. The safe level of intake is the amount ofdietary protein that will provide the needs of almost all of the specified age group, andthis is usually taken as the average requirement plus 2 times the standard deviation(SD) of the requirement. The SD of the children’s requirement was determined bycombining the SD for maintenance (from the adult data) with the SD for protein dep-osition, derived by combining data for rates of growth of body mass and data for thewhole body potassium-40 content at different ages.
The resulting values for the average protein requirement range from 1.12 g/kg/dayat age 6 months to 0.74 g/kg/day at 10 years, with a small decline towards the adultvalue thereafter. The corresponding values for the safe level are 1.43 g/kg/day at6 months and 0.91 g/kg/day at 10 years.
Copyright © 2006 Nestec Ltd., Vevey/S. Karger AG, Basel
39
Rigo J, Ziegler EE (eds): Protein and Energy Requirements in Infancy and Childhood.Nestlé Nutr Workshop Ser Pediatr Program, vol 58, pp 39–50,Nestec Ltd., Vevey/S. Karger AG, Basel, © 2006.

Introduction
The proteins of the body are in a dynamic state, involving continuous degra-dation to free amino acids, and re-synthesis of new protein molecules, theprocess known as ‘protein turnover’. At the same time, free amino acids are con-tinually being degraded and oxidized to carbon dioxide and nitrogenous endproducts, such as urea and ammonia. These losses of amino acids must there-fore be replaced by consumption of dietary protein. Moreover, in children theremust be an additional intake of protein from the diet to furnish new tissuegrowth. The ‘requirement’ for dietary protein is therefore the sum of these twoseparate needs for ‘maintenance’ and ‘growth’.
Over the last few decades, various committees have been convened to deter-mine the values for the requirement for dietary protein of children and adults,notably the FAO/WHO/UNU report on ‘Energy and Protein Requirements’ in1985 [1], the recently published ‘Dietary Reference Intakes’ report of the USNational Academies [2], and the pending WHO/FAO/UNU report on ‘Proteinand Amino Acid Requirements in Human Nutrition’ [3]. In addition, the require-ments of infants and children were analyzed in detail by Dewey et al. [4].
Definitions
The protein requirement for an individual is defined as the minimumintake of high quality dietary protein that will provide the needs for mainte-nance at an appropriate body composition, and will permit growth at the nor-mal rate for age, assuming energy balance and normal physical activity.However, the requirement is expressed in two different ways. The first is the‘average requirement’, which is simply the mean value for the requirement ofthe population under study. The second is the ‘safe level’ [1, 3] or ‘recom-mended dietary allowance’ (DRI) [2], which is the amount of dietary proteinthat will provide for the requirements of almost all (97.5%) of the population.This is higher than the average requirement by two times (to be more precise,1.96 times) the standard deviation (SD) of the mean requirement of thepopulation under study. It is therefore important when considering the‘requirement’ to make a clear distinction between these two.
The use of these two values is often misinterpreted. The average requirement isthe amount of protein that will satisfy the needs of approximately 50% of thepopulation. Thus, for a population that has an average intake equal to the aver-age requirement, half of the individuals will be receiving less than their require-ment. The safe level is set at a value higher than the average requirement so thatonly a very small proportion of the population will have inadequate intakeswhen consuming that amount. However, since the intake also has a distribution,one cannot assume that if the average intake is equal to the safe level, thenthere will be no prevalence of inadequacy. If the average and distribution of
Garlick
40

both intake and requirement are normally distributed and their means and SDsknown, then it is possible to calculate the prevalence of inadequacy [1, 3, 4].
Measurement of the Protein Requirement
The procedure known as ‘nitrogen balance’ has been, and still is, the basisof all the procedures used to estimate the protein requirement. Nitrogenbalance is the difference between the dietary intake of nitrogen and the totallosses of nitrogen (including urine, feces and miscellaneous losses such assweat, skin and hair losses). As almost all the nitrogen in the body is in theform of protein, the nitrogen balance represents the protein balance, withprotein equal to 6.25 times nitrogen.
To measure the protein requirement of an individual, it is necessary to meas-ure the nitrogen balance at a series of different intakes above and below theestimated requirement value. For the adult, the requirement is then the amountof dietary protein at which the intake equals the total losses, as the healthyadult is not gaining or losing body protein. For the child, the interpretation issomewhat more complex due to growth, which is accounted for as follows.
The total literature on children’s protein requirements includes a number ofinvestigations, from various parts of the world, of nitrogen balance in infantsand children, in each of whom a series of different protein intakes was studied[5–13]. For each individual a straight line relating the nitrogen balance to theprotein (as nitrogen) intake was plotted and expressed mathematically as theintercept (on the intake axis) and the gradient. The intercept is the amount ofnitrogen intake that is required to balance the nitrogen losses (i.e. mainte-nance), and the gradient of the line is the efficiency of the utilization of dietarynitrogen. In reality, and as illustrated in figure 1, the scatter of points is usuallylarge, so that calculation of the requirement for an individual from theirown data would be subject to considerable error. Hence, in practice thedata from all of the published studies in which nitrogen balance was deter-mined in children at various levels of nitrogen intake have been utilized. Tenstudies of nitrogen balance in children have been published, and analysis hasbeen performed to determine the average values for the parameters of the line[2–4]. These are conveniently expressed as the value for maintenance (i.e.when nitrogen balance is zero and there is no growth), and the gradient whichexpresses the efficiency of utilization of dietary protein for growth. Therequirement can then be calculated for any target rate of growth, as main-tenance � (rate of protein deposition � efficiency).
The analysis included 10 studies with measurements on 53 individual sub-jects, varying in age between 9 months and 14 years, over a range of dietaryprotein intakes. In addition, there were 4 more studies that only determinedthe basal loss of nitrogen, i.e. the nitrogen excretion when a protein-free diet isgiven. When all studies were included in the analysis, the value for maintenance
Protein Requirements of Infants and Children
41

was 110 mg nitrogen/kg/day (0.687 g protein/kg/day) and the slope was 0.58.However, when those studies that included only animal protein (milk and egg)in the diets were used in the analysis, the maintenance value was 93 mg nitro-gen/kg/day (0.58 g protein/kg/day) and the slope was 0.66.
In order to use the data from the analysis of nitrogen balance vs. nitrogenintake for determining the protein requirements of infants or children, it is alsonecessary to know the rate of protein deposition (i.e. growth) at each age. Thefollowing therefore describes the methods that have been used to determineage-specific rates of growth and protein deposition.
Rates of Protein Deposition in Infants and Children
In the analysis of the protein requirement of infants by Dewey et al. [4], therate of growth of body mass, adjusted for the percentage of deposition as fatfrom the data of Fomon et al. [7], was employed to estimate the growth of pro-tein mass. The potential errors in this assessment have been discussed in detail,as well as their impact on the recommendations. More recently, there have beenmore direct determinations of the rate of gain of protein mass in infants and chil-dren by measurements of total body potassium, which can be used to calculatetotal body protein content [14]. Butte et al. [14] assessed total body potassium ininfants longitudinally from 2 weeks to 2 years of age, whereas Ellis et al. [15]made cross-sectional measurements in children from 4 to 18 years. These stud-ies provide the most comprehensive data set so far of protein growth in children,and have been used by the DRI [2] and WHO/FAO [3] committees in theirdeterminations of children’s protein requirement. However, because the datafor the two age ranges were collected differently (cross-sectional for ages 0–2 vs.longitudinal for ages 4–18), and no measurements were made between ages
Garlick
42
Fig. 1. Simulated nitrogen balance data.
Nitrogen balance
Nitrogen intakeBasal loss
Maintenance
X X
XX
X
X
X

2 and 4 years, the calculation is not straightforward. The DRI committee tookthe mean values for total body protein at each age over the full age range, 2weeks to 18 years, and used nonlinear regression to derive a fourth-order poly-nomial function for age vs. protein content. This equation was then differenti-ated, enabling the gradient of the curve, which is the growth rate, to becalculated for any chosen age. This approach, although theoretically sound, hasseveral drawbacks. The first is that it did not take advantage of the longitudinalnature of the data on each individual infant during the first 2 years, and second,it was not possible to derive the SD of growth (needed to calculate the recom-mended daily allowance/safe level) from the curves. A single value of 43%,derived from the data of Butte et al. [14], was employed. Subsequently, theWHO/FAO Committee employed more sophisticated curve-fitting techniques toderive the growth rates. In particular, the SDs of growth rates were calculated bythe following procedure: (1) for the first 2 years, each infant’s data were fitted toa polynomial function, so that growth rates at any age in the range could be cal-culated for each infant, and the mean value and the SD were determined; (2) forthe ages 4–18 years the mean values for body protein were fitted to a polynomialfunction to obtain the mean rate of growth at any age; (3) a separate functionwas used to bridge the gap in experimental data between 2 and 4 years, and (4)because the cross-sectional data between 4 and 18 years did not allow calcula-tion of the between individual SD for the rate of protein growth, values from aseparate longitudinal database on growth of body weight of children [16] wereused to calculate the between individual SD of the body growth rate at each age.This was then adjusted for the proportion of body weight that is protein, usingthe total body potassium data. By this process, it was possible to calculate therate of growth plus its SD at each age. A subset of these values is shown in table 1.
Protein Requirements of Infants and Children
43
Table 1. Protein deposition for infants and childrena
Age Protein deposition, g protein/kg/dayyears
females males SDb
0.5c 0.266 0.266 0.0351.0c 0.168 0.168 0.0311.5c 0.108 0.108 0.0292.0 0.076 0.073 0.0263.0 0.044 0.034 0.0224–5 0.024 0.011 0.0186–10 0.047 0.049 0.01611–15 0.031 0.041 0.01716–18 0.009 0.023 0.008
aDerived from Butte et al. [15] and Ellis et al. [16] (see text).bSee text.cBefore age 3, data for males and females were pooled.

In table 1, the selected age ranges are chosen because they represent phasesof faster or slower growth. Growth is very rapid at 6 months of age, but declinesquickly until the end of the 5th year. There is then an acceleration in growth inboth genders between 6 and 10 years, declining somewhat between 11 and 15years. By 16 years, growth has almost ceased in females, but continues at a rel-atively slow rate for a further 3 years in males.
Determination of Protein Requirements for
Infants and Children
Infants
Various groups have concluded that for infants up to age 6 months, breastmilk is the best source of nutrition [2–4]. Thus, the recommended intakes havebeen modeled on the intake of milk by healthy breastfed infants [2]. Dewey et al.[4] compared the intake of milk with the requirement calculated by the factorialmethod, on the basis that the calculated requirement should not be greater thanthe intake. However, this comparison is complicated by the fact that humanmilk contains about 25% of nitrogen that is not in protein. Some of this non-pro-tein nitrogen (NPN) is in the form of free amino acids, which would be utilizedas if it were protein, but a substantial part of the NPN consists of urea and othercompounds that might not be utilized as well as protein. It is therefore of inter-est to examine how the requirement for infants predicted by the factorialapproach compares with the actual intake of milk protein and NPN.
For the factorial calculation, the values for maintenance and efficiency ofutilization of dietary protein are those derived from the analysis of nitrogenbalance in children described earlier. In particular, it is most appropriate touse the values that are derived from children consuming only animal protein,mostly from milk and eggs. For these children the value for maintenance was0.58 g protein/kg/day and the slope (efficiency) was 0.66. Table 2 shows thedetails of the factorial calculation for the 6-month-old infant.
With the above derivation it is also possible to calculate the prevalence ofinadequacy by relating the mean values and the SDs for requirement andintake using the unit normal distribution [1, 3]. This indicates a prevalence ofinadequacy in the above example of about 15%.
It can be seen from the calculation that the predicted safe level of intake isintermediate between the intake of milk protein and the intake of milk nitrogen,suggesting that unless some infants are receiving less than their requirements,some of the NPN must be utilized. Alternatively, there is the possibility that theefficiency of utilization of dietary protein employed in the calculation is too lowfor infants at this age, giving rise to an apparent requirement that is too high. Inpractice it may be better to produce a requirement value that is on the high side(i.e. conservative) as the alternative, to have a value that is too low, might placesome infants at risk of receiving too little protein.
Garlick
44

Children Aged 6 Months to 18 Years
The procedure for calculating the average requirement and safe level forchildren follows the same procedure as that for infants, with the exceptionthat different values have been used for the maintenance and efficiency ofutilization. As these children will no longer be relying on breast milk, it isassumed that they will be taking a mixed diet from normal food. Therefore, inselecting the appropriate values for maintenance and the efficiency of utilization
Protein Requirements of Infants and Children
45
Table 2. Factorial calculation of the protein requirements of the 6-month-old infantcompared with total nitrogen and milk protein intake
Body weight, kg 7.54Total nitrogen intake, g/kg/day 14.9Crude protein intake (nitrogen � 6.38), g/kg/day 1.26Milk protein intake (crude intake � 0.75), g/kg/day 0.94Maintenance requirement, g/kg/day 0.58Growth rate, g/kg/day 0.266Efficiency of utilization 0.66Requirement for growth (growth/efficiency), g/kg/day 0.40Average requirement (maintenance plus growth/efficiency), g/kg/day 0.98Safe level of intake (average plus 2 � SD)a, g/kg/day 1.14
aThe SD of growth of protein is taken from table 1, and the SD of maintenance isassumed to be the same as the SD for maintenance in adults, i.e. 12%, derived from ameta-analysis of data from nitrogen balance studies in adults [17]. The combined SD isgiven by the expression �(SD12
� SD22).
Table 3. Average requirement and safe level of protein intake (g protein/kg bodyweight/day) for weaned infants and children up to 10 years of age
Age Maintenancea Growthb Average Safe levelc 1985years requirement requirement (�1.96 SD) committee
0.5 0.66 0.266 1.12 1.43 1.751 0.66 0.168 0.95 1.18 1.371.5 0.66 0.108 0.85 1.04 1.232 0.66 0.075 0.79 0.96 1.143 0.66 0.039 0.73 0.90 1.114–5 0.66 0.018 0.69 0.86 1.066–10 0.66 0.048 0.74 0.91 1.00
aDerived from the regression of nitrogen balance against intake in adults [17]: seetext.
bFrom table 1, adjusted for 58% efficiency of utilization derived from the regressionanalysis of nitrogen balance in children.
cSD for maintenance based on a CV of 12% in adults [17]: SD for growth calculatedfrom SD of deposition in table 1/0.58(efficiency of utilization). SDs for maintenanceand growth are calculated as described in the text.

from the analysis of nitrogen balance studies in children described above, val-ues for all children, including those taking mixed diets, have been used. Thisis appropriate, as children older than 6 months will progressively be consum-ing diets with a wide range of constituents of both animal and plant origin.However, in view of the close similarity of the value for maintenance in chil-dren (0.68) with the value derived from a much larger data set in adults(0.66), the adult value was also used for maintenance in children.
Conclusions
The protein requirement of the 6-month-old infant is 75% higher than in theadult due to the dominance of the requirement for growth. However, growthslows rapidly over the first 2 years of life, at which time the protein requirementis less than 20% higher than that of the adult. The new values for children areabout 25% higher than those derived 20 years ago by FAO/WHO/UNU [1], butfor teenagers the difference is much less apparent. The differences are mostlythe result of more sophisticated statistical analysis of the data, as well as thenew techniques of body composition measurement (total body potassium),which have enabled the growth of protein mass in children and its variability tobe evaluated more accurately.
References
1 Energy and protein requirements. Report of a Joint FAO/WHO/UNU Expert Consultation.World Health Organ Tech Rep Ser 1985;724:1–206.
2 Dietary Reference Intakes for Macronutrients. Washington, US National Academies, 2005.3 Protein Requirements. Report of a Joint WHO/FAO/UNU Expert Consultation. Geneva, World
Health Organization, 2005, in press.4 Dewey KG, Beaton G, Fjeld C, et al: Protein requirements of infants and children. Eur J Clin
Nutr 1996;50(suppl 1):S119–S147.
Garlick
46
Table 4. Safe level of protein intake (g protein/kg body weight/day) for adolescentgirls and boys
Age Maintenance Growth Average Safe level 1985years requirement (�1.96 SD) Committee
Girls11–15 0.66 0.03 0.71 0.88 0.9416–18 0.66 0.01 0.67 0.83 0.83
Boys11–15 0.66 0.04 0.73 0.90 0.9816–18 0.66 0.02 0.70 0.86 0.89
Calculations and notes as in table 3.

5 Huang PC, Lin CP, Hsu JY: Protein requirements of normal infants at the age of about 1 year:maintenance nitrogen requirements and obligatory nitrogen losses. J Nutr 1980;110:1727–1735.
6 Torun B, Viteri FE: Obligatory nitrogen losses and factorial calculations of protein requirementsof pre-school children; in Torun B, Young VR, Rand WM (eds): Protein-Energy Requirementsof Developing Countries: Evaluation of New Data. Tokyo, United Nations University, 1981,pp 159–163.
7 Fomon SJ, DeMayer EM, Owen GM: Urinary and fecal excretion of endogenous nitrogen byinfants and children. J Nutr 1965;85:235–246.
8 Egana JI, Fuentes A, Uauy R: Protein needs of Chilean pre-school children fed milk and soyprotein isolate diets; in Rand WM, Uauy R, Scrimshaw NS (eds): Protein-Energy RequirementStudies in Developing Countries: Results of International Research. Tokyo, United NationsUniversity, 1984, pp 249–257.
9 Gattas V, Barrera GA, Riumallo JS, Uauy R: Protein-energy requirements of prepubertalschool-age boys determined by using the nitrogen-balance response to a mixed-protein diet.Am J Clin Nutr 1990;52:1037–1042.
10 Gattas V, Barrera GA, Riumallo JS, Uauy R: Protein-energy requirements of boys 12–14 y olddetermined by using the nitrogen-balance response to a mixed-protein diet. Am J Clin Nutr1992;56:499–503.
11 Intengan CLI, Roxas BV, Loyola A, Estelita C: Protein requirements of Filipino children 20 to29 months old consuming local diets; in Torun B, Young VR, Rand WM (eds): Protein-EnergyRequirements of Developing Countries: Evaluation of New Data. Tokyo, United NationsUniversity, 1981, pp 171–181.
12 Intengan CLI: Protein requirements of Filipino children 20 to 29 months old consuming localdiets; in Rand WM, Uauy R, Scrimshaw NS (eds): Protein-Energy Requirement Studies inDeveloping Countries: Results of International Research. Tokyo, United Nations University,1984, pp 258–264.
13 Torun B, Cabrera-Santiago MI, Viteri FE: Protein requirements of Pre-school children: milkand soybean isolate; in Torun B, Young VR, Rand WM (eds): Protein-Energy Requirementsof Developing Countries: Evaluation of New Data. Tokyo, United Nations University, 1981,pp 182–190.
14 Butte NF, Hopkinson JM, Wong WW, et al: Body composition during the first 2 years of life: anupdated reference. Pediatr Res 2000;47:578–585.
15 Ellis KJ, Shypailo RJ, Abrams SA, Wong WW: The reference child and adolescent models ofbody composition. A contemporary comparison. Ann NY Acad Sci 2000;904:374–382.
16 Tanner JM, Whitehouse RH, Takaishi M: Standards from birth to maturity for height, weight,height velocity, and weight velocity: British children, 1965. I. Arch Dis Child 1966;41:454–471.
17 Rand WM, Pellett PL, Young VR: Meta-analysis of nitrogen balance studies for estimating pro-tein requirements in healthy adults. Am J Clin Nutr 2003;77:109–127.
Discussion
Dr. Pencharz: Something I would like everyone to appreciate is that the late PeterReeds worked on this a great deal, and a lot of the work Dr. Garlick has presented, andhas worked very hard on, was worked on first by Peter Reeds as well as Nancy Butte.The one thing that is also a new and which you didn’t emphasize was the work byButte and Ellis. I mean the maintenance components are really reworking of existingdata, but the growth data are much more sophisticated from Beila and Butte.
Dr. Koletzko: You discussed the question of maintenance requirements and thestandard deviation (SD) and pointed out that there might be some limitations in thestatistical approach you used, but basically you are confident with the assumption thatmaintenance requirement and SD for adults can be used for infants and children aswell. I wonder whether we should take into account that there might be differences.One factor that could probably contribute is the intestinal physiology. I am not surehow large the contribution of intestinal cell turnover and shedding is to the total main-tenance requirement. I would assume that there might well be a difference between
Protein Requirements of Infants and Children
47

infants and young children and adults if you consider intestinal cell mass to total bodysize, if you think about cell turnover in the intestine, and also if you consider that it isalmost intrinsic to young age, to preschool age and toddler age to have enteric infec-tion. It is a sort of physiological phenomenon to have frequent intestinal infectionwhich of course will enhance the intestinal cell turnover even more, particularly if youthink about less privileged populations. So my question simply is, do we need to put acaveat in that assumption? I was noting that you assume 75% non-protein nitrogenutilization in 3- to 4-month-old infants. My question here is how good are the data thatwe can base this on, both for breastfed and formula-fed infants? In formula-fed infantswe usually assume much less than 50% non-protein nitrogen utilization. Can you com-ment on that, on how good databases are?
Dr. Garlick: Firstly the non-protein nitrogen utilization is a chemical point, as tohow much of the milk nitrogen is not protein. We assumed about 75% just as an exam-ple to see how much of that would have to be used by making that assumption.Obviously it is going to be somewhat variable, but those are the figures in the litera-ture, the approximate percentage. We are not trying to claim this is the requirementfor infants of that age. That wasn’t the reason for the exercise. The reason was to seeif by making these assumptions, do we get a requirement which is consistent withtheir intake, which is obviously what is needed. If it had been inconsistent we wouldhave had to alter the calculation in some way to try and make it consistent. So we arenot trying to claim this is the requirement for children of that age, it is merely a checkon the numbers we are getting.
Dr. Koletzko: Are the maintenance requirement and SD for adults appropriatefor infants and young children, specifically considering differences in intestinalphysiology?
Dr. Garlick: It is only a small assumption really because the data that came fromchildren for the maintenance was 0.68. We chose 0.66 because simply they are so closethat they are not statistically significantly different. So we used 0.66 simply becausethe adult data have a much larger number of subjects. Statistically I don’t think it is abad assumption to make.
Dr. Dewey: You mentioned that the studies used were on children between 9months and 14 years of age, and my recollection is that there were very few studies ofchildren under 12 months, perhaps one or two. So I think that question is still veryimportant. We just don’t have enough nitrogen balance data for children under 12months, especially healthy children living in a normal environment. Many of the earlierstudies were from malnourished recovering infants who were confined to their bedsand not active. So it is questionable whether to use those data. There were some ear-lier studies by Dr. Fomon and his colleagues on nitrogen balance in healthy younginfants under 6 months of age that showed a quite low basal nitrogen requirement.Were you able to use that information in trying to assess this? The reason I bring it upis that in the 1995 calculations that we did with the factorial approach, we used thatinformation and came up with lower levels of requirements than you have shown herefor infants, which meant that the utilization of non-protein nitrogen did not have to beanywhere nearly as high as 75%, it was more in the order of 30% or so as I recall.
Dr. Garlick: There is an almost complete absence of really good nitrogen balancedata in small infants. I looked at Fomon’s data, tried to plot graphs and curves fromthem and get some idea of the reliability of the numbers, and they were so variablethat we decided not to use them. The other reason was if we had been using thesedata for older children then we would have had to include these data obviously, but weweren’t producing a requirement for children below 6 months of age, it was the realthing. Neither the IOM nor WHO are dealing with children of that age group who theysay should be breastfed. So in other words the recommendations we are producing areonly for children 6 months and older.
Garlick
48

Dr. Hilmanto: Can you give a reason or equation why total body potassium can beused to calculate the total body protein? If we look at the last table, the safe level isabout 1.2 times the average requirement, but in the introduction you mentioned thatthe safe level is about 2 times the average.
Dr. Garlick: On the second point, if I said it was above 2 times I was wrong; the safelevel is the average requirement plus 2 times the SD, which usually comes to about 25%higher than the average requirement. About the total body potassium in relation to pro-tein, there is a relationship between the potassium content of lean tissue and the proteincontent of lean tissue that enables the calculation. I think it will be better if Dr. Butteanswers that question in more detail because they are her data.
Dr. Butte: There is a constant relationship between the potassium to nitrogenratio, and it does change with growth and the actual value that we used was 2.15. Thisis the same value that was used in the reference infant that Dr. Fomon and Dr. Zieglerhad taken to look at body composition of infants. At the time we applied it, I did searchthe animal literature trying to see how confident we are of that ratio. It does changewith growth and there are values that are different during pregnancy in adult animalsand such, but I really could not come up with anything better than what Dr. Fomonand Dr. Ziegler used many years ago. So that is the value we used.
Dr. Ziegler: Most of the protein in the body is intracellular, and almost all of the potas-sium is intracellular, and therefore the ratio of potassium to protein is quite constant. Thatis the basis for estimating the protein content by determining total body potassium.
Dr. Do Van Dung: You gave us a new approach in the calculation of nutritionalrequirements. Because I work mostly in the methodology of nutrition I would like toraise some questions on your methodology and especially your assumption. First Iwould like to challenge your assumption on the regression of the nitrogen compositionon nitrogen intake because we think that if we have a low nitrogen intake the deposi-tion efficiency will be increased and if you have more nitrogen intake you will waste alot of nitrogen. Therefore I wonder why you use the linear regression model. The sec-ond question concerns the graph from the study by Ellis et al. [1] on body compositionand I would like to know why there are some negative values in that chart? The lastquestion, you said that the distribution of the nitrogen requirement is not normal andI wonder why you used a rather complicated formula and you admit that it is not par-ticularly correct. Why don’t you use the percentile instead of using the mean valueplus 2 times the SD. You said that the SD of the estimated average requirement isequal to the square of SD for maintenance plus the square of SD for growth. Is the for-mula correct if the two variables are independent, that means when the maintenanceand growth are independent?
Dr. Garlick: As I said previously, the data are limited. We don’t have sufficient datato be able to do any perfect calculations. We just have to make do with what we have.You can see from the actual distribution of data that it isn’t normal. We satisfy our-selves that by making it into log normal then at least we can calculate the reasonablycorrect safe level, and I think that is a sound way of doing it. So statistically I don’tthink we really have a problem with that, we are just finding a different way of calcu-lating the 97.5 or 98th percentile, that is all. The assumption that the maintenance forthe children is the same as the average requirement for the adult, the average num-bers are almost the same, so I don’t think there is any problem there.
Dr. Do Van Dung: Why do you use linear regression?Dr. Garlick: That is the way the data are. You cannot statistically show any differ-
ence from linearity. We have no basis to assume any other relationship. If the data sug-gested a curve then we would have to use the curve, but it doesn’t. The data show it tobe pretty linear. So statistically one always starts with the simplest model and provesit wrong and before moving to a more complex one. In this case we could not provethat the simple linear model was not valid.
Protein Requirements of Infants and Children
49

Dr. van Goudevoer: Protein deposition is basically based upon the availability ofthe most limiting amino acid. I think that the quality of milk proteins around the worldis rather standard, but whenever you go up into higher ages the intake of proteins dif-fers and also the quality of the proteins that you eat is different. So are you justifyingmaking recommendations on a whole protein intake level, whereas the quality of thatprotein might differ quite substantially?
Dr. Garlick: The assumption throughout the calculation, which I should havestated, was that it is high quality protein. This is the requirement for high quality pro-tein. If we are dealing with populations who typically have diets that consist of lowerquality protein, that has to be allowed for in the calculation.
Dr. Rigo: As you show there is a gap in the data of protein accretion between 2 and4 years. So you make the assumption that we can calculate the protein accretion accord-ing to the data that we obtain before and after with an extrapolation of the polynomialdata. If we look at your data you suggest that protein accretion during this periodbetween 2 and 4 years of age was lower than before and after. Do you think that yourextrapolation was correct or not? If we look at the curve of growth velocity betweenbirth and adolescence, it does not show this decrease between 2 and 4 years of life.
Dr. Garlick: I didn’t emphasize this because it gets too complicated to explain. Butthe actual body weight of children was used in the interpretation of those data, whichwere not from Dr. Butte or Ellis. Separate standard curves for growth were used toconstruct that bridging function. So I think it does take account of the actual growth.
Dr. Rigo: How do you explain that the protein accretion was lower at that period oftime?
Dr. Garlick: I am showing rates of protein accretion, so they slow down slightlyand then speed up again. That would not be seen unless you plot the actual rates ofgrowth, the gradients of the growth curve.
Dr. Axelsson: I know it is a very hard work to make recommendations. We havemany recommendations. What are the consequences of the new recommendations? Isit possible to follow them because when intake is calculated, even if milk and egg pro-teins are considered, it is very difficult. What are the practical consequences of thenew recommendations to make diets consistent to this?
Dr. Garlick: They are slightly lower for children than the previous recommenda-tions.
Dr. Axelsson: But still we have problems to follow them; even the recommenda-tions we have today are difficult to follow in practice. If you calculate the intake of achild or an infant and then look at the intake and the requirement, there is a big dif-ference. The intake is much higher than the requirements.
Dr. Garlick: The reason for that is that we are in a society which has ample food.For many areas of the world that would not be the case. The children will be eating amuch lower protein content in relation to energy, and they are getting less than therequirements. The total intake is usually determined by energy intake.
Dr. Yates: One of the reasons, although the protein might be higher, is that thereare other nutrients that a food-based diet would be providing and that might not be meteven where there are high levels of protein consumed. If you are talking about a for-mula that is one thing, if you are talking about food-based diets it would be different.
Reference
1 Ellis KJ, Shypailo RJ, Abrams SA, Wong WW: The reference child and adolescent models ofbody composition. A contemporary comparison. Ann NY Acad Sci 2000;904:374–382.
Garlick
50

Growth of Breast-Fed and Formula-FedInfants
Ekhard E. Ziegler
Fomon Infant Nutrition Unit, Department of Pediatrics, University of Iowa, Iowa City, IA, USA
AbstractGrowth and nutrition during infancy are being viewed with renewed interest
because of the possibility that they may be linked to cardiovascular and metabolichealth in later life. Of particular interest are differences between breast- and formula-fed infants with regard to nutrient intake and growth because breastfeeding has beenshown to be associated with a reduced risk of obesity in later life. During the first 6–8weeks of life there is little difference in growth (gain in weight and length) betweenbreast- and formula-fed infants. However, from about 2 months of age to the end of thefirst year of life formula-fed infants gain weight and length more rapidly than breast-fedinfants. There are no consistent differences in adiposity during the first 4–5 months oflife, but during the later part of the first year of life the preponderance of the evidencesuggests that breast-fed infants are leaner than formula-fed infants. Formula-fedinfants at 4–5 months of age show higher plasma levels of insulin-like growth factor-1(IGF-1), insulin and certain amino acids than breast-fed infants. Whereas the proteinintake of breast-fed infants decreases with age and closely matches the requirementsfor protein during the early months of life, the protein intake of formula-fed infantsexceeds requirements after the first 1–2 months of life. The data are consistent withthe hypothesis that differences in protein intake are mainly responsible for differencesin growth between breast- and formula-fed infants. Differences in energy intake proba-bly are responsible for differences in adiposity observed in older infants.
Copyright © 2006 Nestec Ltd., Vevey/S. Karger AG, Basel
Introduction
In recent years growth and nutrition during infancy have been thefocus of renewed and broad interest because of their association with healthoutcomes later in life. The seminal study by von Kries et al. [1] exemplifies
51
Body Composition and Growth
Rigo J, Ziegler EE (eds): Protein and Energy Requirements in Infancy and Childhood.Nestlé Nutr Workshop Ser Pediatr Program, vol 58, pp 51–63,Nestec Ltd., Vevey/S. Karger AG, Basel, © 2006.
recent studies that show breastfeeding during infancy to be associated with areduced risk of obesity in childhood. It has been appreciated for some timethat breast-fed infants grow less rapidly than formula-fed infants. Also, it hasbeen known or suspected for a long time that breastfeeding, besides its well-known health benefits in the short-term, confers protection against certaindiseases in adult life. For example, subjects who were breast-fed as infantshave lower plasma lipid concentrations and are therefore at a lower risk ofcardiovascular disease than subjects who were fed formula during infancy[2–4]. A number of subsequent reports [5] have confirmed the initial observa-tion by von Kries et al. [1] that breastfeeding is associated with less risk ofobesity in childhood. These observations have generated considerable inter-est in view of the worldwide increase in overweight and obesity.
It is likely that breastfeeding in infancy and improved later health are man-ifestations of one and the same genetic or other causative factor. But it is alsopossible that breastfeeding per se is causally related to improved health inlater life. If that is the case, it is pertinent to ask what it is that may confer tothe breast-fed infant protection against disease in later life. Although it wouldseem implausible to expect a single factor, such as a single component ofbreast milk, to be responsible for protection against a range of conditions laterin life, such a possibility is actually not entirely implausible. In prematureinfants it has been shown that a single factor (i.e., low protein intake during arelatively short period in infancy) is associated with lower blood pressure dur-ing adolescence [6] as well as reduced insulin resistance [7]. It is important tonote that in the studies by Singhal et al. [6, 7] those subjects who enjoyed rel-ative protection as young adults showed slower growth as infants than thosewith less protection. In other words, slow growth during infancy is a marker ofhealth advantages later in life. It appears possible that the rate of growth ininfancy is what determines individuals’ later cardiovascular health. Indeed,Singhal and Lucas [8] have proposed in their ‘growth acceleration hypothesis’that it is a high rate of growth during infancy that causes increased later car-diovascular risk. A high rate of growth has, incidentally, also been shown bythe same group to be associated with better neurocognitive outcome [9].
It is also possible that cardiovascular health in later life, rather than beingassociated with the rate of growth during infancy, is determined by the levelof protein intake that produces the differences in growth in the first place. Weshall show that high protein intakes during infancy elicit metabolic and hor-monal responses that could explain not only the observed differences in therate of growth but could also program individuals with regard to lifelong car-diovascular health. It is against this backdrop that the difference in growthbetween breast- and formula-fed term infants has become of renewed inter-est. A close examination of the growth differences, together with otherrelevant information, may not only shed light on the cause(s) of differentialgrowth but also provide hypotheses regarding the association between infantfeeding and later health.
Ziegler
52

Growth from Birth to 4 Months
From the perspective of comparing the growth of breast- and formula-fedinfants, the early months of life are of particular interest. This is so becauseduring that period breast- and formula-feeding exist for the most part in‘pure’ form, i.e. without the confounding presence of complementary foodsand, in the case of breast-fed infants, of supplemental formula. Also, beca-use growth is most rapid during the early months of life, the effect offactor(s) causing differences in growth is likely to be most marked duringthat period.
Differences in growth between breast- and formula-fed infants are evidentalready during the first week of life. Breast-fed infants typically have notquite regained birth weight by 8 days of age [10], whereas formula-fed infantsby 8 days of age exceed birth weight on average by 50–100 g [11]. This differ-ence is largely explained by the fact that breast-fed infants receive only smallamounts of colostrum during the first 2 days of life, a time during which for-mula-fed infants already have free access to formula. The difference in earlyweight change is potentially significant in view of the findings by Stettler et al.[12] who reported that, among formula-fed infants, the risk of overweight andobesity in early adulthood was increased in proportion to weight changes dur-ing the first week of life.
Dewey [13] presented a comprehensive review of data concerning thegrowth of breast- and formula-fed infants published since 1980. The reviewwas appropriately limited to studies in which data on breast- and formula-fedinfants were collected simultaneously using identical methods. Of 19 studies,5 reported data separately for the first 3–4 months of life. Of these, 2 showedsignificantly greater weight gain among formula-fed infants, with 1 study [14]showing also greater length gain. Two studies showed no difference in weightgain between breast- and formula-fed infants and 1 study showed actuallyhigher weight gain in breast-fed than in formula-fed infants.
The report by Nelson et al. [14] concerned by far the largest cohort (419breast-fed infants and 720 formula-fed infants). Infants were studied usingidentical methods between 1965 and 1987. Formula-fed infants received avariety of milk- and soy-based formulas. Until 1978 infants were permitted toreceive limited amounts of solid foods and, in the case of breast-fed infants, ofsupplemental formula, and the majority of infants did actually consume thesefoods, although generally only in modest amounts. After 1978 infants recei-ved no foods other than breast milk or formula through 112 days of age.
The data of Nelson et al. [14] show very convincingly that during the first6 weeks of life, although the small difference in weight that is establishedduring the first week of life persists, gain in weight and length are almostidentical in breast- and formula-fed infants. Data on gain in weight and lengthbetween 8 and 112 days of age reported by Nelson et al. [14] are summarizedin table 1 on a sex-specific basis. It is evident that between 8 and 42 days of
Growth of Breast-Fed and Formula-Fed Infants
53

age, differences in gain between breast- and formula-fed infants are verysmall and not statistically significant. In contrast, for the age interval 42–112days, and also for the entire period from 8 to 112 days of age, differences ingain in weight and length are larger and statistically significant.
To answer the question of whether consumption of solid foods and, in thecase of breast-fed infants, supplemental formula, may have had effects ongrowth during the early months of life, Nelson et al. [14] compared data forinfants observed before 1978 when infants were permitted to receive limitedamounts of other foods and formula, with data for infants observed after 1978when no other foods were permitted until 4 months of age. There were no sig-nificant differences in any of the growth parameters before vs. after 1978, andgrowth differed between breast- and formula-fed infants before as well asafter 1978. This shows that consumption of modest amounts of other foodsdoes not affect the growth of infants and does not blunt the growth differencebetween breast- and formula-fed infants.
It is important that the differences in growth reported by Nelson et al. [14]concern not only weight gain but also length gain. It is well established thatthe energy intakes of breast-fed infants are substantially less than those offormula-fed infants [15, 16]. A difference in energy intake alone in the pres-ence of an ample protein intake would be expected to lead to a modest differ-ence in weight gain, reflecting a difference in gain of fat mass, but it would notbe expected to lead to a difference in length gain since it would not have aneffect on gain in fat-free body mass. The fact that there is a difference inlength gain between breast- and formula-fed infants strongly suggests thatthe intake of protein is limiting gain in fat-free mass in breast-fed infants.
Ziegler
54
Table 1. Gain in weight and length according to gender and type of feeding
Males Females
breast-fed formula-fed breast-fed formula-fed(n � 230) (n � 380) (n � 216) (n � 340)
Weight, g/day8–42 days 38.9 � 9.7 39.8 � 7.7 33.8 � 7.7 33.3 � 7.442–112 days 25.4 � 6.2* 28.5 � 6.4 22.6 � 6.3* 24.7 � 5.28–112 days 29.8 � 5.8* 32.2 � 5.6 26.2 � 5.6* 27.5 � 4.9
Length, mm/day8–42 days 1.29 � 0.22 1.33 � 0.22 1.24 � 0.22 1.25 � 0.1942–112 days 0.96 � 0.17* 1.03 � 0.12 0.89 � 0.13* 0.94 � 0.118–112 days 1.07 � 0.12* 1.13 � 0.11 1.01 � 0.11* 1.04 � 0.09
Modified from Nelson et al. [14] with permission.*Significantly (p � 0.001) lower than corresponding value for formula-fed infants.

Plasma Levels of Insulin-like Growth Factor-1,
Insulin and Amino Acids
It is well established that insulin-like growth factor-1 (IGF-1) plasma concen-trations reflect the intake of dietary protein [17, 18]. In a study comparinggrowth of infants fed formulas with different protein concentrations [19], deter-minations of plasma concentrations of IGF-1 were obtained [20]. One formulacontained protein at a concentration of 2.39 g/100 kcal and the other at1.90 g/100 kcal. Similar determinations were made in a group of exclusivelybreast-fed infants participating in another study (unpublished). The resultssummarized in table 2 show that plasma IGF-1 concentrations were similar inthe 2 groups of formula-fed infants and in the breast-fed infants at 1 month ofage. However, by 4 months of age, the IGF-1 concentrations of breast-fed infantsand infants fed the lower protein formula had declined significantly, whereasthey remained unchanged in infants fed the higher protein formula. At 4 monthsof age, the IGF-1 levels of breast-fed infants were significantly lower than thelevels in either formula-fed group, and the IGF-1 levels in the lower proteingroup were significantly lower than those in the higher protein group.
The level of dietary protein also influences plasma insulin levels, probablymediated through the effect of the protein level on plasma concentrations ofcertain amino acids. Dewey et al. [21] reported that at 5 months of age breast-fed infants had lower plasma concentrations of insulin and of insulin-releasingamino acids than formula-fed infants (table 2).
Growth of Breast-Fed and Formula-Fed Infants
55
Table 2. Concentrations of IGF-1, insulin and insulin-releasing amino acids (IRAA) inbreast-fed and formula-fed infants
Age 1 month 4 months 5 monthsIGF-1, �g/l IGF-1, �g/l
insulin, pmol/l IRAA, mmol/l
Breast-fed 74.9 � 33.3 32.0 � 18.7* 42.6 � 25.8 0.967 � 0.178(n � 56) (n � 35) (n � 52) (n � 52)
Formula-fed 65.4 � 31.7 1.133 � 0.298(n � 62) (n � 62)
Formula-fed 79.3 � 34.0 58.9 � 37.8*protein 1.90 (n � 35) (n � 41)g/100 kcal
Formula-fed 77.5 � 31.0 80.7�37.8protein 2.39 (n � 21) (n � 27)g/100 kcal
IGF-1 data for formula-fed infants are from Steenhout et al. [20] and those for breast-fed infants are unpublished data. The insulin and IRAA data are from Dewey et al. [21].
Values in same column with different superscripts differ significantly: p � 0.01.*Value significantly lower than corresponding value at 1 month: p � 0.01.

The protein requirements of infants decline relatively rapidly during thefirst few months of life [22] (fig. 1). Although the protein intakes of breast-fedinfants match the requirements relatively closely, figure 1 suggests that, con-trary to the first 2 months, beginning at about 2 months of age protein intakesmay be marginally low relative to the requirements. The age at which proteinintake begins to be marginal coincides with the age at which growth of breast-fed infants begins to be less than that of formula-fed infants. This is consis-tent with the hypothesis that protein intake begins to limit the growth ofbreast-fed infants beginning at 2 months of age.
Contrary to the variable protein content of breast milk, the protein contentof formulas is constant. Their protein content is such that it meets the proteinneeds of infants at all times, including the first 2 months of life when proteinneeds are highest. Therefore, the protein intakes of formula-fed infantsexceed the protein needs by an increasing margin beginning at 2 months ofage. This relative excess over requirements is reflected in the plasma levels ofIGF-1, insulin and amino acids of formula-fed infants at 4–5 months of age(table 2). These hormonal responses to protein intakes are consistent withthe hypothesis that differences in protein intake explain differences in growthbetween breast- and formula-fed infants.
Growth from 4 to 12 Months
After 4 months of age the majority of breast-fed infants begin to receivecomplementary foods and many receive supplemental formula. Among the
Ziegler
56
Fig. 1. Protein requirements derived by the factorial method, and protein intake ofbreastfed infants. Data from Fomon [22].
0
0.5
1.0
1.5
Pro
tein
(g
/kg
/day)
2.0
2.5
0–1 1–2 2–3 3–4
Age (months)
4–5 5–6
Factorial
Breast

studies reviewed by Dewey [12], 12 reported measurements beyond 6 monthsof age. Ten of these studies reported that breast-fed infants gained sign-ificantly less weight at least during some portions of the first year of life. In 4of the 8 studies reporting length data, breast-fed infants also showed signifi-cantly slower gain in length than formula-fed infants. Thus, a clear predomi-nance of studies shows that breast- and formula-fed infants differ in growthduring the later parts of the first year of life.
As part of 2 unpublished studies concerning the iron nutritional status ofbreast-fed infants, weight and length were measured during the first year of life.Although many of the breast-fed infants also received supplemental formulaafter 4 months of age, a sizable number of infants did not receive supplementalformula in accordance with parental choice. The data therefore offer the oppor-tunity to examine the effect of supplemental formula on growth. Infants in theiron study were exclusively breast-fed for the first 4 months of life. They werepermitted to receive cereal and other complementary foods from 4 months ofage and most infants did receive complementary foods. Regardless of whetherthey received complementary foods, infants were classified as ‘breast-fed’ ifthey did not receive formula at 9 months of age, as ‘breast � formula-fed’ if theyreceived formula at 9 months of age, and as ‘formula-fed’ if they were no longerbeing breast-fed at 9 months of age. The data are summarized in table 3 which,for reference purposes, includes data for predominantly formula-fed infants[23] and for infants observed in the Euro-Growth study who were breast-fedaccording to WHO recommendations [24].
At 4 months of age there were no differences in weight. At 9 months ofage, female infants who were breast-fed with no supplemental formula were
Growth of Breast-Fed and Formula-Fed Infants
57
Table 3. Weight of breast-fed infants at 4, 9 and 12 months (mean � SD)
Age Iowa Euro-Growthb Fels [23]months
breast-feda breast� formula-feda
formula-feda
Females n � 33 n � 16 n � 154 6,232 � 595 6,267 � 550 6,310 � 369 6,380 � 690 6,347 � 7439 8,168 � 787a 8,527 � 872 8,758 � 637b 8,570 � 900 8,449 � 1,320
12 8,968 � 873 9,238 � 893 9,471 � 714 9,550 � 1,140 9,425 � 1,667Males n � 26 n � 19 n � 224 6,898 � 739 6,737 � 758 6,668 � 560 6,930 � 740 6,930 � 6559 8,937 � 628 8,883 � 869 9,165 � 837 9,160 � 960 9,087 � 832
12 9,704 � 686 9,707 � 957 9,925 � 964 10,120 � 1,010 10,059 � 949
Values in same row with different letters differ significantly (p � 0.05); analysisof combined genders by ANOVA shows differences between breast- and formula-fed infants to be significant at 9 (p � 0.014) and 12 months (p � 0.05).
aFeeding at 9 months of age.bInfants breast-fed according to WHO recommendations [23].

significantly (p � 0.018) lighter than infants fed formula. Breast-fed infantswho received supplemental formula (‘breast � formula’) weighed substan-tially more than breast-fed infants receiving no formula, but the difference wasnot statistically significant. Breast-fed infants receiving supplemental formulawere similar in weight to the Euro-Growth reference [24] and to formula-fedinfants [23]. By 12 months of age, the difference between breast- and formula-fed infants no longer was statistically significant (p � 0.0612), although sub-stantial differences persisted. Similar differences were observed among maleinfants, but the differences were smaller than in female infants and were notstatistically significant. However, for the combined (females and males) data,the differences between breast- and formula-fed infants were significant at 9months (p � 0.014) and remained significant (p � 0.05) at 12 months.
Body Composition
Dewey [12] found that of 9 studies that reported measures of adiposity, 5found that adiposity was less in breast-fed infants, 3 reported no differenceand 1 found that breast-fed infants had higher adiposity than formula-fedinfants. The latter study [25] concerned exclusively breast-fed infants whohad restricted length gain in addition to increased adiposity. In 2 of the stud-ies that found differences in adiposity, the differences persisted to 18–24months of age. The 3 studies that found no difference in adiposity were lim-ited to the first 4–6 months. This agrees with our own findings [26] in a groupof 18 infants who had total body water determinations at 42 days and again at84 days of age. Gain of fat-free mass between 42 and 84 days was significantlygreater in formula-fed than in breast-fed infants but gain in fat mass was not,regardless of whether fat mass was expressed as grams per day or as percent-age body mass. Thus it appears that during the first 4–6 months of life breast-fed infants do not differ in adiposity from formula-fed infants. In contrast,after 6 months of age there is considerable evidence that breast-fed infantsare leaner than formula-fed infants.
References
1 von Kries R, Koletzko B, Sauerwald T, et al: Breast feeding and obesity: cross sectional study.BMJ 1999;319:147–150.
2 Ravelli ACJ, van der Meulen JHP, Osmond C, et al: Infant feeding and adult glucose tolerance,lipid profile, blood pressure, and obesity. Arch Dis Child 2000;82:248–252.
3 Owen CG, Whincup PH, Odoki K, et al: Infant feeding and blood cholesterol: a study in ado-lescents and a systematic review. Pediatrics 2002;110:597–608.
4 Singhal A, Cole TJ, Fewtrell M, Lucas A: Breastmilk feeding and lipoprotein profile in adoles-cents born preterm: follow-up of a prospective randomised study. Lancet 2004;363:1571–1578.
5 Arenz S, Rückerl R, Koletzko B, von Kries R: Breast-feeding and childhood obesity – a sys-tematic review. Int J Obes Relat Med Disord 2004;28:1247–1256.
Ziegler
58

6 Singhal A, Cole TJ, Lucas A: Early nutrition in preterm infants and later blood pressure: twocohorts after randomised trials. Lancet 2001;357:413–419.
7 Singhal A, Fewtrell M, Cole TJ, Lucas A: Low nutrient intake and early growth for later insulinresistance in adolescents born preterm. Lancet 2003;361:1089–1097.
8 Singhal A, Lucas A: Early origins of cardiovascular disease: is there a unifying hypothesis?Lancet 2004;363:1642–1645.
9 Lucas A, Morley R, Cole TJ: Randomised trial of early diet in preterm babies and later intelli-gence quotient. BMJ 1998;317:481–487.
10 Filer LJ Jr, Fomon SJ, Thomas LT, Rogers RR: Growth and serum chemical values of normalbreastfed infants. Acta Paediatr Scand Suppl 1970;202:1.
11 Fomon SJ, Thomas LN, Filer LJ Jr, et al: Food consumption and growth of normal infants fedmilk-based formulas. Acta Paediatr Scand Suppl 1971;223:1–36.
12 Stettler N, Stallings VA, Troxel AB, et al: Weight gain in the first week of life and overweightin adulthood: a cohort study of European American subjects fed infant formula. Circulation2005;111:1897–1903.
13 Dewey KG: Growth characteristics of breast-fed compared to formula-fed infants. BiolNeonate 1998;74:94–105.
14 Nelson SE, Rogers RR, Ziegler EE, Fomon SJ: Gain in weight and length during early infancy.Early Hum Dev 1989;19:223–239.
15 Heinig MJ, Nommsen LA, Peerson JM, et al: Energy and protein intakes of breast-fed andformula-fed infants during the first year of life and their association with growth velocity: theDARLING study. Am J Clin Nutr 1993;58:152–161.
16 Butte NF, Wong WW, Hopkinson JM, et al: Energy requirements derived from total energyexpenditure and energy deposition during the first 2 y of life. Am J Clin Nutr 2000;72:1558–1569.
17 Clemmons DR, Underwood LE: Nutritional regulation of IGF-I and IGF binding proteins.Annu Rev Nutr 1991;11:393–412.
18 Smith WJ, Underwood LE, Keyes L, Clemmons DR: Use of insulin-like growth factor (IGF-I)and IGF-binding protein measurements to monitor feeding of premature infants. J ClinEndocrinol Metab 1997;82:3982–3988.
19 Ziegler EE, Jeter JM, Drulis JM, et al: Formula with reduced content of improved, partiallyhydrolyzed protein and probiotics: infant growth and health. Monatsschr Kinderheilk2003;151(suppl 1):565–571.
20 Steenhout P, Haschke F, Ziegler EE: Partially hydrolyzed whey formula with reduced proteincontent: impact on IGF-1 and leptin levels. PAS 2005;57:235.
21 Dewey KG, Nommsen-Rivers LG, Lönnerdal BG: Plasma insulin and insulin-releasing aminoacids (IRAA) concentrations are higher in formula-fed than in breastfed infants at 5 mo of age(abstract 564.1). Exp Biol 2004; abstract 564.1.
22 Fomon SJ: Requirements and recommended dietary intakes of protein during infancy. PediatrRes 1991;30:391–395.
23 Fomon SJ, Nelson SE: Size and growth; in Fomon SJ (ed): Nutrition of Normal Infants. St.Louis, Mosby-Year Book, 1993, p 36.
24 Haschke F, van’t Hoff MA, Euro-Growth Study Group: Euro-growth references for breast-fedboys and girls: influence of breast-feeding and solids on growth until 36 months of age.J Pediatr Gastroenterol Nutr 2000;31:S60–S71.
25 Salmenperä L, Perheentupa J, Siimes MA: Exclusively breast-fed healthy infants grow slowerthan reference infants. Pediatr Res 1985;19:307–312.
26 Ziegler EE: Growth and body composition of breast-fed and formula-fed infants:inferences regarding nutrient intakes; in Picciano MF, Lönnerdal B (eds): MechanismsRegulating Lactation and Infant Nutrient Utilization. New York, Wiley-Liss, 1992, pp 349–358.
Discussion
Dr. Lönnerdal: I wonder how you can call the low blood urea nitrogen (BUN) lev-els in the formula-fed infants unsafe when they were similar to those of breastfedinfants?
Growth of Breast-Fed and Formula-Fed Infants
59

Dr. Ziegler: The term ‘safe’ in the title of our paper did not apply to the BUN. Itapplied to the fact that these babies seemed to consume an excessive amount of calo-ries on the low protein formula.
Dr. Lönnerdal: I just question the validity of using BUN as an indicator for ade-quacy of protein intake.
Dr. Ziegler: The BUN is an indicator of current protein intake and that is true in allinfants. The BUN can be influenced by other factors such as the hydration state, butgiven other things being equal, the BUN is a reflection of protein intake.
Dr. Dewey: I am a bit puzzled by your conclusion. From what I understand you didnot find a significant difference in growth in the first study, in which you had the lowerprotein, and in the second one you also did not find a significant difference in lengthgain. We did a study in Honduras of babies who were exclusively breastfed to either 6or 4 months of age and then given complementary foods that were high in protein andhad high quality (egg) protein as well. These foods were fortified with iron and theywere nutritionally adequate so the infants’ growth wasn’t being limited by any othernutrients. Those complementary foods had no significant effect on growth. So if thegrowth of exclusively breastfed babies was being limited by protein I would haveexpected to see a difference, and you didn’t see one in your experimental studieseither. My conclusion is that giving them more protein does not affect their growth atthat age. We also did a double-blind randomized controlled trial with formulas that hadeither standard levels or lower levels of protein. We reported it in the abstract that youcited for the insulin levels. We used a two-stage lower protein formula, as close as wecould get to breast milk. We did not find significant differences in growth between thetwo groups, even though we did find differences in plasma amino acids and in BUN. SoI differ in my conclusion, which is that protein is not a limiting nutrient for breastfedinfants at that age.
Dr. Ziegler: We ask the same question and, looking at different data, we come todifferent conclusions. To come back to the study with the very low BUN, I think that isa question of statistical power. If we had more than 16 subjects, the difference ingrowth would almost surely have reached statistical significance. It was just a smallgroup of babies that we studied. The data that I showed you concerning breastfedbabies from 4 to 9 months were with formula supplements vs. without. I interpret thatto be the effect of protein so I think that is consistent with my hypothesis. InGuatemala and Honduras you fed foods other than formula, maybe therein is thedifference.
Dr. Dewey: There is fairly consistent evidence that milk products are in some waygrowth-enhancing or accelerating. This has been observed in populations in develop-ing countries and in other studies where they have compared different sources of pro-tein. Milk sources seem to have a growth-promoting effect, and we see thisconsistently in all the studies of infants. When they are supplemented with formulathey do grow more rapidly. I certainly agree with you on that. I don’t think it is protein,however; I think it is something else. I don’t know what it is but definitely milk has agrowth-promoting effect.
Dr. Koletzko: Following on from Dr. Dewey’s thought I would just like to point yourattention to a wonderful study that Michaelson et al. have done in Copenhagen. Theycompared the effect of milk protein and meat protein and found that milk protein hada significant effect on enhancing IGF-1 whereas meat protein did not, underlining theconcept that Dr. Dewey has just proposed, that it is something other than protein inmilk that might be relevant. I would just like to raise a question about the choice ofwords that you used, regardless of the underlying data you and Dr. Dewey just dis-cussed on how to interpret the data. If you chose to use the wording ‘protein intakelimits the growth of breastfed infants’, imagine that there is a reporter from the Saigon
Ziegler
60
Times in this room, tomorrow the headline of the Saigon Times might be ‘breastfedinfants need protein supplement from birth because breastfeeding limits growth’. Ihave some concern whether the your data should not be interpreted a bit more cau-tiously in order to avoid such a conclusion. I think with the evidence we have we reallycannot say that a higher growth rate would be of benefit in the long term.
Dr. Ziegler: I appreciate your comments, but I am speaking here not to the pressI am speaking to colleagues who are scientifically trained and this is a scientific dis-cussion. I would not speak to the press and say that breastfed babies are protein-deficient. And as I said earlier this is my interpretation of the same data that we allsee and I interpret it to indicate that breastfed babies grow slightly slower becausetheir protein intake is such that they can’t grow faster. And I am not attaching anyvalue to it. It may be that a slower growth is beneficial in the long run, just as it is inmany animal species; when you restrict food intake they live longer and have otherbenefits.
Dr. Hernell: Just alluding to what Dr. Koletzko mentioned about the growth-promoting effect of milk; are there any data similar to what you have shown that arebased on soy formulas? Do you see the same difference with soy formula as with milk-based formula?
Dr. Ziegler: The growth data I showed about formula-fed babies, about one thirdof the infants were fed soy-based formulas and two thirds were fed milk-based formu-las, and we have never seen a difference in growth between soy formula-fed and milkformula-fed babies. We have analyzed the data very extensively and especiallybecause the study that was mentioned by Stettler et al. [1] was based on our cohortand we carefully looked at soy vs. milk because the objective of the follow-up studywas to compare those who were fed soy formula with those who were fed milk formulaas infants. As you know, we found some differences in the young adult women, but wefound absolutely no difference in growth, and that is why I don’t think this so-calledgrowth-promoting effect of milk is something specific to milk.
Dr. Roggero: You said that IGF-1 is low when the protein intake is low [2]. Do youthink that IGF-1 could be a good prediction marker of adiposity or only of proteinintakes?
Dr. Ziegler: As I said IGF-1 reflects protein intake. I don’t think it has anything todo with later adiposity or energy intake. There was no difference between boys andgirls. Yes, I think IGF-1 is a marker of protein intake.
Dr. Lönnerdal: I just want to follow up the discussion about the potential growth-promoting effect of milk proteins. Perhaps what you just said is showing that, becausesoy formulas have an about 20–40% higher protein content. Therefore, if you had thesame growth with 20–40% higher protein, there would most likely be a growth-enhancing effect of milk protein.
Dr. Ziegler: What you said is true, soy formulas all contain more protein than milk-based formulas. But my concept of infant growth is that the infant has a certaingrowth potential, and you either realize it or you don’t realize it. I don’t believe thatyou can accelerate growth beyond the genetic potential. So whether the formula has alittle bit more or less protein, as long as it meets the requirements the baby grows atits predestined rate.
Dr. Rigo: I want to come back to the discussion that we had this morning regard-ing the long-term effect on obesity. Your data differ from what was shown this morningwhich was exclusively related to the formula-fed group. You showed that there is adecrease in body weight during the first 8 days of life in the human milk group and youhave an increase in body weight in the formula-fed group. So the causality is could berelated only to the fact that they were fed human milk and formula, and not only to theweight gain during the first week of life.
Growth of Breast-Fed and Formula-Fed Infants
61

Dr. Ziegler: What you are saying is that whatever later health benefits we seecould be strictly due to some property of breast milk and have nothing to do withgrowth; that is entirely possible.
Dr. Turck: Did you observe differences in head circumference between breastfedand formula-fed infants at any age?
Dr. Ziegler: We did not measure head circumference. We know that length andhead circumference growth are very tightly correlated. Head circumference growthcan be affected in severe malnutrition, which we did not study.
Dr. Zhuoqin Jiang: How do you control the preterm babies weight gain if thebody weight is increasing by less than 15 g/day? Should we use a standard fortifier orconcentrated fortifier?
Dr. Ziegler: You are asking about premature infants, if the weight gain is less than15 g/day; that is a very low weight gain. Regarding the use of a fortifier, I think all pre-mature infants who receive mother’s milk should receive a fortifier regardless of whattheir initial weight gain is, and they should receive it from early on. So it is given fromthe beginning, not only when the baby is not growing.
Dr. Fan Yang: You mentioned that there is a difference in the plasma IGF-1 offormula-fed and breastfed babies, and we know breast milk contains IGF-1. Regardingthe IGF-1 content of breast milk, does it also contribute to the difference in growth ofbreastfed and formula-fed babies?
Dr. Ziegler: I don’t think that the IGF-1 that is present in breast milk is absorbedintact, it is almost surely digested. So I think the IGF-1 in breast milk may have someeffect on the gastrointestinal tract but no systemic effect because it is digested downto its peptides and amino acids.
Dr. Do Van Dung: I appreciated your lecture very much and I understand that youwant to imply that formula feeding is better than breastfeeding, although there weredifferences in the measurement of the height, weight and length. To return to heightand length differences between the formula-fed and breastfed infants, I wonderwhether you took into consideration the role of confounding factors such as nutritionprogramming, the difference in height and weight, and the different anthropometricmeasurements of the infant’s parents? We suspect that confounders played a rolebecause you showed that breastfed infants had a lower birth weight than the formula-fed infants.
Dr. Ziegler: I simply pointed that out because I have never noticed before thatboth male and female breastfed babies are a little bit lower in birth weight. I have noidea what this means. I did not say that I prefer formula feeding over breastfeedingbecause the babies grow faster. I simply said that formula-fed babies grow a littlefaster than breastfed babies, and I don’t know whether it is good or bad. I am simplystating this as a fact.
Dr. Thu Nhan Nguyen: What about immunology? For instance we have comparedthe immunology in breastfeeding and formula feeding and the results show that thebreastfed infants have fewer diseases but formula-fed infants often become respira-tory insufficient, have gastroenteritis and diarrhea. In our cities people are using for-mula more than breastfeeding, and the babies vomiting more after the formula. Whatabout the immunology of formula compared to breast milk?
Dr. Ziegler: We did not measure immunologic components, but it is of course verywell documented that breastfed babies have much more advanced immunologicresponses because breast milk really complements the newborn infant’s immunity.My topic was to review growth. The reason why growth is currently of interest isbecause it seems that late health effects may be related to early growth, but there isabsolutely no question that the immunology of the breastfed infants and many otherthings are much better and preferable. As you pointed out, there is absolutely no
Ziegler
62

question that babies should be breastfed and should only be fed formula when breast-feeding is not possible for some reason.
Dr. Dewey: I just wanted to respond to the question about head circumferencethat was asked before. In the studies that we have done we matched on birth weight.The breastfed babies indeed grew less rapidly in weight by a substantial margin, a lit-tle bit less rapidly in length by 12 months, but there was absolutely no difference at allin head circumference. The same result has been found in a few other studies thathave also measured head circumference.
References
1 Stettler N, Stallings VA, Troxel AB, et al: Weight gain in the first week of life and overweightin adulthood: a cohort study of European American subjects fed infant formula. Circulation2005;111:1897–1903.
2 Hoppe C, Udam TR, Lauritzen L, et al: Animal protein intake, serum insulin-like growth factor I,and growth in healthy 2.5-y-old Danish children. Am J Clin Nutr 2004;80:447–452.
Growth of Breast-Fed and Formula-Fed Infants
63


Body Composition during theFirst Year of Life
Jacques Rigo
Department of Pediatrics, CHR Citadelle, University of Liège, Liège, Belgium
AbstractKnowledge of changes in body composition is of great potential benefit to the under-
standing of the nutritional needs and functional outcome of nutritional management forboth healthy and sick infants. This review evaluates the different methods presentlyavailable to evaluate whole-body composition analysis based on different models, i.e. 2,3, or more compartments. Analysis of the various approaches related to age, bodyweight and body length suggests that the major differences observed between the tech-niques could be preferentially related to differences in the population and that gender isone of the major determinants of whole-body composition during the first year of life.Among the techniques dual-energy X-ray absorptiometry (DEXA) and, more recently,air displacement plethysmography appear to be major techniques that have been evalu-ated in infants. Determination of weight gain composition is one of the major keys to theevaluation of the nutritional requirements, whereas the dynamic aspect during the firstyears of life could play a fundamental role in the nutritional programming of adult mor-bidity. Recent data suggest that protein intake and the protein:energy ratio are the maindeterminants of weight gain composition in preterm infants. Nevertheless, these dataneed to be confirmed in larger cohorts evaluated during the first year of life. To that,DEXA appears to be a useful technique to obtain sequential analysis of weight gain com-position over a longer period of time and in a less invasive fashion.
Copyright © 2006 Nestec Ltd., Vevey/S. Karger AG, Basel
Introduction
Infancy is the period of most rapid postnatal growth and is accompanied bymajor changes in body composition. Knowledge of these changes in bodycomposition in healthy infants is of great potential benefit to the understand-ing of the nutritional needs and functional outcome of nutritional manage-ment for both healthy and sick infants [1]. Recently much interest has beenfocused on the relationship between early nutrition and the future health of
65
Rigo J, Ziegler EE (eds): Protein and Energy Requirements in Infancy and Childhood.Nestlé Nutr Workshop Ser Pediatr Program, vol 58, pp 65–78,Nestec Ltd., Vevey/S. Karger AG, Basel, © 2006.

humans. Poor growth during early life as well as a large weight gain duringinfancy have been associated with disorders up to adulthood. Accurateassessment of body composition during infancy enables the determination ofweight gain composition and provides key information for evaluating nutri-tional requirements, the efficacy of diet and medical interventions, and theinfluence of chronic disease [2]. Therefore, studies on how the nutritional sit-uation interacts with the growth process and body and weight gain composi-tion during early life in humans are very important.
Evaluation of Body Composition
Direct Measurements of Body Composition
Most of our knowledge on the body composition of preterm infants isderived from body carcass analyses of stillborn preterm infants. The first val-ues were reported in 1877, and thus far 169 infants have been analyzed [3].However, not all analyzed fetuses can be considered for reference materialbecause gestational age, and time and cause of death were either not reportedor may not have been accurately obtained. Nevertheless, more recent studiesusing various technologies have confirmed the chemical analysis data andvalidated the interest in the evaluation of intrauterine reference values ofwhole body composition and in the determination of the postnatal nutritionalrequirements for preterm infants. With the exception of the composition of a4-year-old male who died of tuberculous meningitis, no data on whole bodychemical analyses are available from birth until adulthood and our knowledgeduring the first year of life is derived from indirect methods [4, 5].
Indirect Measurements of Body Composition
In infants, the only practical means of measuring body composition is bynoninvasive and indirect methods. Several methods have been developed toindirectly measure body composition in vivo (table 1). Unfortunately, thesemethods have limited application in infants, i.e. they are relatively invasive, mayinvolve significant radiation exposure, and/or need active cooperation of thesubject. Whole body composition analysis may be based on different models,i.e. 2, 3, or more compartments. The basic 2-compartment model, whichassumes that body mass is composed of adipose and non-adipose issue, i.e. fatmass (FM) and fat-free mass (FFM) or lean body mass (LBM), is the widelyused. The total body fat (TBF) compartment is the most variable one and mostsensitive to changes in nutritional status so most emphasis has been laid on itsmeasurement [5]. The three-compartment model adds a value for skeletalor bone mass, whereas in the multi-component model, body compositionis obtained by integrating data from various techniques (whole body density,total body water (TBW), bone mineral content (BMC) and anthropometry) [6, 7].
Rigo
66

Among the various techniques, anthropometric measurements, total bodyelectrical conductivity (TOBEC), bioelectrical impedance analysis (BIA), tracerdilution using stable isotopes (deuterium oxide: 2H2O), dual-energy X-rayabsorptiometry (DEXA) and, more recently, air displacement plethysmography(ADP) are major techniques that have been evaluated in infants.
Skin-fold thickness is a simple way of measuring FM. This approach makestwo assumptions: i.e. the thickness of the subcutaneous adipose tissue refle-cts a constant proportion of the TBF and the sites selected for measurementrepresent the average thickness of the subcutaneous adipose tissue. Soft tis-sue composition, derived from anthropometric measurements, shows goodcorrelation with several other techniques for in vivo body composition meas-urement, including isotope dilution, TOBEC, and DEXA [1]. However, therapidly changing distribution of fat accretion in young infants makes it diffi-cult to generate a consistent equation for predicting TBF [5, 8]. In addition,body composition data from anthropometric measurements have a poor pre-dictive value for individual measurements of body composition [1].
FM Evaluation Derived from LBM Determination
FM can also be estimated indirectly by determining LBM using methodssuch as TBW [9], TOBEC [10] and BIA [11]. TBW may be measured by isotopedilution using deuterium (2H2O) or oxygen 18 (H2
18O). Assuming that theratio of TBW to LBM is constant [12], LBM may then be estimated. However,TBW varies with gestation and changes rapidly in the first few weeks of life,limiting application in the neonate, particularly the preterm infant. In addition,the water content of LBM in infants is higher than that generally consideredfor adults and decreases progressively during the first 2 years of life [7].
The principle underlying TOBEC is that lean tissue is more electricallyconductive than fat, and the greater the LBM the greater the electromagneticdisturbance when a weak homogeneous electromagnetic field is applied. Withthis technique normative data close to older reference values have been
Body Composition during the First Year of Life
67
Table 1. Indirect in vivo techniques for measuring bodycomposition in infants
AnthropometryTotal body electrical conductivityTracer dilution: chemicals, stable isotopesTotal body potassiumBioelectrical impedanceImaging: magnetic resonance, ultrasoundMagnetic resonance spectroscopyDual-energy X-ray absorptiometryAcoustic plethysmographyAir displacement plethysmographyNear infrared interactance

reported in term infants between birth and 1 year of age [13]. However, thismethod is also sensitive to the hydration status factor of FFM. The error ofestimation is inversely related to FM and therefore is relatively inappropriatefor infants weighing �2,800 g [10].
BIA has the advantage that it can be used across a broad age spectrum andin a variety of settings. It appears to be a simple, cheap and easily availabletechnique requiring little cooperation of infants. It has been widely used formeasuring TBW and extracellular volume in preterm and term infants.Various algorithms have been proposed in order to improve the accuracy ofTBW and extracellular volume estimations in infants [8, 11, 14]. Unfortu-nately, data are influenced by the hydration coefficient of FFM, whereas theprecision and accuracy are still being questioned [15].
Densitometry is considered to be among the most accurate indirect bodycomposition methods. Body composition assessment by densitometry involvesmeasurement of the density of the whole body. Body density (body massdivided by body volume) is then used in a two-compartment model to calculatethe percentage of fat, FM, and FFM. Body mass is easily measured using anaccurate weighing device. Body volume is a more difficult measurement and iscommonly determined either by hydrodensitometry performed in water usingArchimedes’ principle or ADP performed in air using gas laws. Because hydro-densitometry requires subjects to be totally submerged during a test, compli-ance and safety issues prevent the implementation of this technique in theinfant population [16].
ADP has been successfully used to measure the body composition of chil-dren and adults, and recently a new ADP system has been developed (the PEAPOD Infant Body Composition System, Life Measurement, Inc.; fig. 1). Usingbody mass and volume measurements, the ADP system automatically calcu-lates the percent body fat by using a classic densitometric approach and age-and sex-specific FFM density values obtained from a multi-compartmentalstudy [7]. The ADP system has recently been evaluated in infants, and the reli-ability and accuracy results of these studies indicate that ADP is easily used byoperators, comfortable for infants, reliable, and accurate compared to the deu-terium (2H2O) dilution technique taken as reference. Future studies areneeded to determine ADP reference values compared to other referencemethods and to further evaluate weight gain composition during infancy [17].
Advances in imaging techniques have allowed more direct in vivo meas-urement of body composition. These methods include computed axial tomog-raphy, nuclear magnetic resonance imaging (MRI) and ultrasonography [18].Computed tomography scanning requires significant radiation exposure incontrast to MRI and ultrasonography. However, all three methods share theproblem of extrapolating cross-sectional slices from a part of the body towhole body composition slices. There are also very little data on infants usingthese techniques. However, data in infants during the first months of lifeusing MRI and isotope dilution have recently been reported [2, 19].
Rigo
68

In contrast, DEXA requires minimum radiation exposure (�0.3 mrem) andperforms whole body rather than slice measurements. Given the short scan-ning time (6–10 min) this method is becoming the most widely used methodfor the in vivo measurement of whole body composition in humans. Deter-minations are performed without sedation, but the naked infant is swaddledin a paper blanket to minimize the movement artifact. During a DEXA deter-mination an X-ray source generates two different energy levels and, depend-ing upon the differential absorption of the two photon emissions, bodycomposition (lean mass, FM, bone mineral density) is determined. In addi-tion, total bone area is also determined and BMC can be calculated. However,the accuracy and precision of the determinations may be affected by the typeof DEXA instrument [1], scan mode [20] and software programs used [21].Using the QDR 2000 (Hologic Inc., Waltham, Mass., USA) equipped with aninfant table pad and the infant whole body software V5.65P, we have per-formed validation studies in piglets and clinical studies in preterm and terminfants. In validation studies on piglets we observed that DEXA was accurateand precise in measuring lean mass and BMC but not FM [22, 23]. However,
Body Composition during the First Year of Life
69
Fig. 1. The PEA POD body composition system.
Keyboard
Touch pad
Emergency off switch
Acrylic window
Electromagnet
Test chamber
Urination shield
Test chamber tray
Volume phantom
Printer
Calibration weight
Locking casters (4)
Scale tray
Monitor/computer
Test chamber door

further evaluation indicated that FM measurements, which were overesti-mated, were highly improved using a correction factor [22, 23]. Using thistechnique and correction factor, we have obtained reference values of bodycomposition in ‘normal’ preterm and term infants (fig. 2). Unfortunately,DEXA accuracy and precision are device- and software-dependant and up tonow an optimal instrument specially designed for infants is not widely avail-able. Thus, in a comparative study, we found that the use of the more recentQDR 4500A (Hologic Inc.) appears to underestimate FM compared to theQDR 2000 (unpublished data).
Body Composition during the First Year of Life
In 1982 Fomon et al. [24] published their classical body composition modelthat provided age- and gender-specific data for TBF, FFW, TBW, and the degreeof hydration in FFW. The latter is of particular importance, as TBF is often cal-culated as the difference between body weight and FFW, obtained using director indirect estimates of TBW and a value for the degree of hydration in FFW.
Rigo
70
Fig. 2. Evolution of fat-free mass (g), fat mass (g) and fat mass (%) related to age,length and weight in term infants.
a
c
b
Fat
mass (%
)
Fat
mass (g
)
Fat-
free m
ass (g
)
Fat
mass (%
)10
9
8
7
6
5
4
3
2
1
0
50
45
40
35
30
25
20
15
10
5
0
Fat-
free m
ass (g
)
Fat
mass (g
)
Body weight (g)
10
9
8
7
6
5
4
3
2
1
0
50
45
40
35
30
25
20
15
10
5
0
–12 –6 0 6 121824303642485460
Age (weeks)
Fat
mass (%
)
10
9
8
7
6
5
4
3
2
1
0
50
45
40
35
30
25
20
15
10
5
0
35 40 45 50 55 60 65
Body height (cm)
70 75 80 85
Fat
mass (g
)
Fat-
free m
ass (g
)
0 1 2 3 4 5 6 7 8 9 101112
Fat-free mass (kg)
Fat mass (kg)
Fat mass (%)

However, the Fomon model, which provided data from birth to 10 years of age,was presented as preliminary and crude because it was based on quite a limiteddata set. Since that time, several studies have evaluated whole body composi-tion during infancy using different techniques. TOBEC reference values wereprovided by de Bruin et al. [13]. DEXA reference values were determined byKoo et al. [25] as well by our group [23]. More recently Olhager et al. [2] evalu-ated MRI data during the first 4 months of life, and a longitudinal study ofhuman body composition during the first 2 years of life was reported by Butteet al. [7] using a multi-compartmental system.
As shown in figure 3, there is good agreement between the variousapproaches. In addition, analysis of the data related to age, body weight andbody length suggest that the major differences observed between the tech-niques could be related to differences in the population evaluated in thestudy. Nevertheless, these studies suggest that gender is one of the majordeterminants of whole body composition during the first year of life and thatseparate data references need to be provided.
Evaluating body composition in infants and toddlers using various tech-niques, Butte et al. [26] suggested that methods are not interchangeable forgroup or individual estimations. The magnitude of method difference is afunction of age which makes it difficult for systematic biases.
Considering that the sequential evaluation of body composition is of inter-est for monitoring and evaluating growth patterns, efficacy of diet and med-ical interventions, progression of chronic disease, and recovery frommalnutrition, DEXA may be considered as one of the gold standards. It is aprecise, safe, noninvasive, easy to perform and widely available method pro-viding accurate information not only on FM and FFM but also on LBM, BMCand bone mineral density in infants and toddlers. However, the accuracy ofthe instrument and software used remain to be validated.
Weight Gain Composition during the First Year of Life
Evaluation of weight gain composition is of major importance in the assess-ment of the nutritional requirements of preterm and term infants. Up to now,duplicate analyses of 3-day metabolic and energy balances have been per-formed to estimate energy expenditure in association with nitrogen and energyretention in order to estimate FM deposition, LBM gain and protein accretion inpreterm and term infants according to the feeding regimen. In addition, meas-urement of calcium and phosphorus retention enabled estimation of the ade-quacy of mineral deposition compared to reference values. Those data wereconsidered as representative of growth quality over a larger period.
Analysis of the data presently available for preterm infants made it possibleto evaluate the main determinants of weight gain, nitrogen retention andFM deposition [27]. Protein intake and the protein energy ratio are the main
Body Composition during the First Year of Life
71

Rigo
72
determinants of weight gain. Protein intake is the only determinant of LBMgain in contrast to FM gain that is positively related to energy intake and neg-atively to protein energy ratio. Thus, protein and energy needs are reciprocallylimiting. If there is a surfeit, one affecting the ability of the infant to assimilate
a b
c d
e f
Girls
0 1 2 3 4 5 6 7 8 9 10 11 12 13
Age (months)
0
1
2
3
4
5
6
7
8
Fat
mass a
nd
fat-
free m
ass (kg
)
0 1 2 3 4 5 6 7 8 9 10111213
Age (months)
0
1
2
3
4
5
6
7
8
Fat
mass a
nd
fat-
free m
ass (kg
)Boys
48 52 56 60 64 68 72 76 80
Length (cm) Length (cm)
0
1
2
3
4
5
6
7
8
9
Fat
mass a
nd
fat-
free m
ass (kg
)
2 3 4 5 6 7 8 9 10 11 12
Weight (kg)
0
1
2
3
4
5
6
7
8
9
10
48 52 56 60 64 68 72 76 80
0
1
2
3
4
5
6
7
8
9
Fat
mass a
nd
fat-
free m
ass (kg
)
Fat
mass a
nd
fat-
free m
ass (kg
)
2 3 4 5 6 7 8 9 10 11 12
Weight (kg)
0
1
2
3
4
5
6
7
8
9
10
Fat
mass a
nd
fat-
free m
ass (kg
)
FM Rigo
FFM Rigo
De Bruin
De Bruin Olhager
Olhager Fomon
Fomon
Butte
Butte
Fig. 3. Evolution of fat mass (FM) and fat-free mass (FFM) related to age, weightand length. From De Bruin et al. [13], Olhager et al. [2], Rigo et al. [5], Fomon andNelson [4] and Butte et al. [7].

the other, and if energy intake is insufficient, protein is used as an energysource and nitrogen balance becomes less positive. Increasing the caloricintake will spare protein loss and improve nitrogen retention, but with limitedprotein intake, protein retention reaches a plateau and the energy excess isused only for fat deposition. Nevertheless, when protein supply is in the rangeof the protein requirement, the effect of the energy increase on protein reten-tion appears to be minimal. Therefore, with a view to increasing the LBMaccretion and limiting the FM deposition in the premature infant, an increasein the protein energy ratio is mandatory.
Unfortunately energy and metabolic balances, requiring the use of a meta-bolic bed, infant relative contention and a reduction in nursing, are relativelylimited. Therefore, we recently suggested that DEXA might also be used toanalyze weight gain composition over a longer period of time and in a lessinvasive fashion [28–30].
DEXA body composition was measured at the beginning of the study andthen 3 weeks later. Lean, fat and bone mass gain was determined by subtract-ing the second from the first determination. In preterm infants (birth weight�1,750 g) fed either fortified human milk or preterm infant formula, theweight gain composition evaluated between a mean of 34 and 37 weeks ofpost-conceptional age was in the range of the data obtained previously usingenergy and nutrient balance (fig. 4) [30]. Formula-fed infants showed a
Body Composition during the First Year of Life
73
50
45
40
35
30
25
20
15
10
5
0a PT HMF PT PTF PT PD T BF
b
b
a
a
a
a
a
T FF PT HMF PT PTF PT PD T BF T FF
Weig
ht,
FM
an
d F
FM
gain
(g
/day)
FM
and
FF
M g
ain
(%
of
WG
)
100
90
80
70
60
50
40
30
20
10
0
Weight FFM FM FFM FM
b
Fig. 4. Weight gain (WG) composition evaluated from successive DEXA scans inpreterm infants fed fortified human milk (n � 50) and preterm formula (n � 100; ap � 0.05 vs. PT HMF), in preterm infants fed formula after discharge (n � 26) andin breast-fed (n � 16) and formula-fed (n � 47) term infants (bp � 0.05 vs. T BF).BF � Breast-fed; FF � formula-fed; FFM � fat-free mass; FM � fat mass; HMF �
human milk fortified; PD � postdischarge; PT � preterm; PTF � preterm formula;T � term.

Rigo
74
greater weight gain, FM deposition, BMC gain and bone area increase com-pared with the fortified human milk group. In contrast, calcium retention esti-mated from bone mineral gain was greater than that determined with nutrientbalance techniques. The reasons for the latter observation are not entirelyclear but might be explained by the low threshold level of bone mineral detec-tion necessary to estimate bone mass in preterm infants [5].
In term infants, the growth pattern of breast-fed infants is known to deviatefrom that of formula-fed infants. Mainly after 3 months of life, breast-fed infantsgrow more slowly than formula-fed infants even if a relative catch-up growthtends to occur during the 2nd year of life. Evaluating body composition, Butte etal. [31] recently suggested that FFM was lower in breast-fed infants compared toformula-fed infants at 3, 6 and 9 months of age. In addition, a gender effect wasalso reported. Similarly, weight gain composition was also estimated in terminfants breast-fed and formula-fed during the first 2 months of life.
The use of DEXA allows evaluation of the weight gain composition in terminfants. From birth to 2 months of age, we compared body composition in alimited number of breast-fed (n � 16) and formula-fed (n � 47) infants.From birth up to 2 months, weight gain (31.3 � 6.9 vs. 35.8 � 7.4 g/day;p � 0.04) and FFM gain (19.7 � 3.9 vs. 22.7 � 4.5 g/day) were significantlylower in breast-fed than formula-fed infants. The percent FM increased in the2 groups from 15.1 to 23.8% in breast-fed infants and from 14.8 to 24.0% informula-fed infants. During the study period, weight gain corresponded toabout 75% of the birth weight and was similar in the 2 groups. FM depositionaccounted for 36.3 and 35.8% of the weight gain in breast-fed and formula-fedinfants, respectively [29].
During these studies [29, 30], it was also possible to determine the minimaldetectable changes in weight gain composition according to time in pretermand term infants in relation to the size of the population. In 3 weeks, between1,500 and 2,200 g body weight at the time of discharge, the minimaldetectable differences in body weight gain were 2.3 g for weight, 2.1 g forLBM, 1.2 g for FM, and 76 mg/kg for BMC between the 2 groups of 20 very lowbirth weight infants. Considering the relatively low FM content at the time ofdischarge, this sensitivity (�30%) appears to be better than could beobtained by other indirect methods in preterm infants [30].
In comparison, in term infants from birth to 2 months of age, the minimaldetectable differences in body weight gain were 1.9 g for weight, 0.8 g forLBM, 1.5 g for FM and 50 mg/kg for BMC between the 2 groups of 15 infants.In our study, the highest differences were for weight gain (0.7 g/kg/day;p � 0.37) and FM gain (0.5 g/kg/day; p � 0.39). These values, correspondingto 27 and 33% of the minimal significant differences, should be reevaluated ina larger cohort of infants [29].
In conclusion, determination of whole body and weight gain composition isone of the major keys to the evaluation of the nutritional requirements ofpreterm and term infants, whereas the dynamic aspect of body composition

during the first years of life plays a fundamental role in the nutritional program-ming of adult morbidity. In preterm and term infants, the only practical means ofmeasuring body composition is by noninvasive and indirect methods. Of the var-ious techniques presently available, anthropometry and impedancemetry havenot yet been appropriately validated in young infants. TOBEC and stable isotopetracer dilution techniques appear more appropriate but difficult to adapt forwidespread use in infants. In contrast, although in investigation, ADP seemseasy to use, comfortable, reliable, and accurate in infants, but further investiga-tions are needed to establish normative values and to validate weight gain deter-mination. DXA, a widely available technique using the three-compartmentmodel, is now considered by some as the reference technique for determiningbody and weight gain composition. The technical procedure for DXA scan acqui-sition and analysis is quite simple. Radiation exposure to the infant is minimal.DXA techniques have been validated for measuring body composition in infants.Unfortunately, commercial DXA instruments have major differences, and soft-ware especially adapted to preterm and term infants is not always available.
References
1 Koo WW: Body composition measurements during infancy. Ann NY Acad Sci 2000;904:383–392.
2 Olhager E, Flinke E, Hannerstad U, Forsum E: Studies on human body composition duringthe first 4 months of life using magnetic resonance imaging and isotope dilution. Pediatr Res2003;54:906–912.
3 Spark J: Human intrauterine growth and nutrient accretion. Semin Perinatol 1984;8:74–93.4 Fomon SJ, Nelson SE: Body composition of the male and female reference infants. Annu Rev
Nutr 2002;22:1–17.5 Rigo J, de Curtis M, Pieltain C: Nutritional assessment in preterm infants with special refer-
ence to body composition. Semin Neonatol 2001;6:383–391.6 Wells JC, Fuller NJ, Dewit O, et al: Four-component model of body composition in children:
density and hydration of fat-free mass and comparison with simpler models. Am J Clin Nutr1999;69:904–912.
7 Butte NF, Hopkinson JM, Wong WW, et al: Body composition during the first 2 years of life: anupdated reference. Pediatr Res 2000;47:578–585.
8 Schmelzle HR, Fusch C: Body fat in neonates and young infants: validation of skinfold thick-ness versus dual-energy X-ray absorptiometry. Am J Clin Nutr 2002;76:1096–1100.
9 Tang W, Modi N, Clark P: Dilution kinetics of H(2)18O for the measurement of total bodywater in preterm babies in the first week after birth. Arch Dis Child 1993;69:28–31.
10 Fiorotto M, de Bruin NC, Brans Y, et al: Total body electrical conductivity measurements: anevaluation of current instrumentation for infants. Pediatr Res 1996;37:94–100.
11 Tang W, Ridout D, Modi N: Assessment of total body water using bioelectrical impedanceanalysis in neonates receiving intensive care. Arch Dis Child Fetal Neonatal Ed 1997;77:F123–F126.
12 Heymsfield S, Waki M: Body composition in humans advances in the development of multi-compartment chemical models. Nutr Rev 1991;49:97–108.
13 de Bruin NC, van Velthoven KA, Stijnen T, et al: Body fat and fat-free mass in infants: new andclassic anthropometric indexes and prediction equations compared with total-body electricalconductivity. Am J Clin Nutr 1995;61:1195–1205.
14 Ellis KJ: Human body composition: in vivo methods. Physiol Rev 2000;80:649–680.15 Lafeber HN: Nutritional assessment and measurement of body composition in preterm infant.
Clin Perinatol 1999;26:997–1005.
Body Composition during the First Year of Life
75

16 Urlando A, Dempster P, Aitkens S: A new air displacement plethysmograph for the measure-ment of body composition in infants. Pediatr Res 2003;53:486–492.
17 Ma G, Yao M, Liu Y, et al: Validation of a new pediatric air-displacement plethysmograph forassessing body composition in infants. Am J Clin Nutr 2004;79:653–660.
18 Baumgartner RN, Rhyne RL, Garry PJ, Heymsfield SB: Imaging techniques and anatomicalbody composition in aging. J Nutr 1993;123:444–448.
19 Uthaya S, Bell J, Modi N: Adipose tissue magnetic resonance imaging in the newborn. HormRes 2004;62(suppl 3):143–148.
20 Koo WW, Hammami M, Hockman EM: Interchangeability of pencil-beam and fan-beam dual-energy X-ray absorptiometry measurements in piglets and infants. Am J Clin Nutr2003;78:236–240.
21 Picaud JC, Nyamugabo K, Braillon P, et al: Dual-energy X-ray absorptiometry in small sub-jects: influence of dual-energy X-ray equipment on assessment of mineralization and bodycomposition in newborn piglets. Pediatr Res 1999;46:772–777.
22 Picaud JC, Rigo J, Nyamugabo K, et al: Evaluation of dual-energy X-ray absorptiometry forbody-composition assessment in piglets and term human neonates. Am J Clin Nutr 1996;63:157–163.
23 Rigo J, Nyamugabo K, Picaud JC, et al: Reference values of body composition obtained bydual energy X-ray absorptiometry in preterm and term neonates. J Pediatr GastroenterolNutr 1998;27:184–190.
24 Fomon SJ, Haschke F, Ziegler EE, Nelson SE: Body composition of reference children frombirth to age 10 years. Am J Clin Nutr 1982;35:1169–1175.
25 Koo WW, Walters JC, Hockman EM: Body composition in human infants at birth and postna-tally. J Nutr 2000;130:2188–2194.
26 Butte N, Heinz C, Hopkinson J, et al: Fat mass in infants and toddlers: comparability of totalbody water, total body potassium, total body electrical conductivity, and dual-energy X-rayabsorptiometry. J Pediatr Gastroenterol Nutr 1999;29:184–189.
27 Rigo J: Protein amino acid and other nitrogen compounds; in Tsang R, Uauy R, Koletzko B,Zlotkin S (eds): Nutrition of the Preterm Infant: Scientific Basis and Practical Guidelines.Cincinnati, Digital Educational Publishing, 2005, pp 45–80.
28 De Curtis M, Pieltain C, Rigo J: Body composition in preterm infants fed standard term orenriched formula after hospital discharge. Eur J Nutr 2002;41:177–182.
29 De Curtis M, Pieltain C, Studzinski F, et al: Evaluation of weight gain composition during thefirst 2 months of life in breast- and formula-fed term infants using dual energy X-ray absorp-tiometry. Eur J Pediatr 2001;160:319–320.
30 Pieltain C, De Curtis M, Gerard P, Rigo J: Weight gain composition in preterm infants withdual energy X-ray absorptiometry. Pediatr Res 2001;49:120–124.
31 Butte NF, Wong WW, Hopkinson JM, et al: Infant feeding mode affects early growth and bodycomposition. Pediatrics 2000;106:1355–1366.
Discussion
Dr. Dewey: In Dr. Butte’s study the babies were exclusively breastfed during thefirst 4 months, but after that the infants may or may not have continued to be breastfedand I think by 1 year of age less than half of them were still being breastfed and theywere mainly were being supplemented with formula. So when we try to draw conclu-sions about whether breastfeeding affects fatness beyond 6 months for example, I thinkwe have to be very careful about how we define what we mean by breastfed. When welook at babies who are breastfed for the whole first year of life it is fairly consistentlyshown that there are differences, at least in skinfold thickness which is lower in breast-fed children. But again it is those who are breastfed for a whole year and not gettinginfant formula. The question I have has to do with methods for measuring body compo-sition. I was involved in a validation study of air displacement plethysmography using aninstrument called the PEA POD. The PEA POD is nice because it is relatively insensi-tive to the babies moving around a little bit or urinating or crying, i.e. you still get a good
Rigo
76

measurement. But I am not sure about dual-energy X-ray absorptiometry (DEXA), andI wonder if you could tell us how much it is affected by movement or crying or otheractivities of the babies? What do you have to do to use it under these circumstances?
Dr. Rigo: It is difficult to compare breastfed infants and formula-fed infantsbecause breastfed is not completely a homogenous group. In our study we limited thedata on the first 2 months of life in order to obtain exclusively breastfed and formula-fed infants. In my presentation, I stress the point that not only body composition, butalso weight gain composition are very important referring to the studies evaluating theinfluence of protein-energy ratio on weight gain composition.
Techniques evaluating body composition are also promising for weight gain evalua-tion. Techniques need to be useful, practical, and not time-consuming if we want toevaluate relatively large cohorts with sequential evaluations. The problem of DEXA isthat presently, the technique is still device and software dependent.
DEXA is relatively sensitive to movements but in small babies it is possible to wrapthe baby very carefully in a paper sheet to induce quietness and immobilization. Thepresent technique is relatively fast, and it is so possible to obtain data without anymovement. In addition, movements are recorded during the examination enabled theexclusion of the database or a second evaluation. I have never used the PEA POD, butI consider that it is a promising technique.
Dr. Roggero: Regarding exclusive breastfeeding, the UNICEF definition of exclu-sive breastfeeding is related to a baby who is only breastfed. The exclusively breastfedinfant does not receive any other sort of food or water. I have another comment on anew air displacement system (PEA POD). I routinely determine the body compositionin neonatal intensive care unit babies using this technique and usually we have no dif-ficulties performing this measurement. Generally the babies don’t cry because theplace where they are measured is comfortable. The temperature inside the box is ade-quate for them. At birth, term newborns have a mean fat mass of 6% and at 15 days oflife it is 12%. Preterm infants, at term-adjusted age, have a fat mass of close to 16%.This is significantly different to that found in term neonates.
Dr. Butte: With the PEA POD you can combine a dilution technique with the den-sity. So when you are uncertain of the hydration concentration the deuterium dilutionis quite easy to use as well. Dr. Ellis is in the process of validating the PEA POD in bothpreterm and term infants and hopefully the results will be out soon. I really appreciateall the emphasis put on body composition. I think that is what we have to do and notsimply look at weight gain. I was just trying to emerge the two talks of Dr. Ziegler andyourself, and it is time that we look beyond just weight gain. When we are thinkingabout the growth potential of the infant we have to think not only of linear growth butalso ponderal growth. I wanted to ask Dr. Ziegler if he really was referring to obtainingthe growth potential in terms of linear growth or in terms of ponderal growth. As weknow very well from animal studies, we can manipulate the composition of ponderalgrowth dramatically, and I don’t think infants are any different. What we are doingwith formulas, trying to look at the optimal PDE ratio and all the other nutrients andmacronutrients that are present, is influencing that ponderal growth and the composi-tion of it. Dr. Dewey and I have compared our studies over the years because theywere very parallel studies. They are quite similar, but from 6 to 12 months we havesome very significant differences. In our studies we didn’t control what the mothersfed and many of our mothers continued to breastfeed up to 12 months. The mediumbreastfeeding rate was up to 12 months, but many of the mothers were working andused formula when they were at work. That is a difference, and so we have a definitionof what the predominantly breastfed infant is but we have not defined what thosecomplementary foods are. The big debate is not about differences in breastfeeding butabout differences in how the children were complementarily fed. Again we have notspent a lot of time to see what the optimal way is to feed infants from 6 to 24 months.
Body Composition during the First Year of Life
77

Dr. Lafeber: I would like to ask you a question about gender differences in the firstyear regarding body composition. It is not so much related to the breastfed and bottle-fed differences, but let us concentrate on the differences between preterm, post-discharge preterm and term formula. For instance if we look at the results of olderstudies on body composition using the post-discharge formula, we see differences inthe body composition of boys and girls when post-discharge formula is given, andpost-discharge formula seems to make boys a bit fatter and to have less influence onthe girls [1, 2]. Can you speculate on the mechanism underlying the changes in bodycomposition? You suggest very much that it would be a relation not with energy butwith protein. I can understand that, but how do you explain differences between boysand girls? Is that just the physiology of the changes?
Dr. Rigo: There is a large difference in body composition between boys and girls.Analyzing now the weight gain in preterm infants from 1.5 g to 2.5 kg, gender appearsas one of the major determinant of weight gain composition. Girls seem programmedto make more fat, but also more bone mineral deposition than boys. It is relatively thesame if you investigate term and post-discharge formulas.
Nevertheless, there is some discrepancies in the published data. Using enriched post-discharge formulas. Cooke et al. [3, 4] reported a positive effect on growth rate in boysbut not in girls suggesting that an increase in protein energy ratio has some influence inboys. In contrast, Lucas et al. [2], evaluating weight gain and enriched formula inintrauterine growth retarded infants, found a significant difference in girls but not boys.So it was an inverse relationship to gender between the two studies, and it is very difficultto interpret the two studies. Are the results directly related to the diet composition or toa difference in programming between boys and girls, and preterm and IUGR term infants.
Dr. Turck: My question is related to the model. What should be the model if we lookcarefully at the body composition of a formula-fed infant, should it be the breastfedinfant? If you study the body composition on a clinical standpoint of a formula-fed infant,what would you do if let us say the fat content of the infant is higher than the breastfedmodel? Would you decrease the volume intake or would you change the formula?
Dr. Rigo: Your question is first about the reference; what is the body composition ref-erences that we need to take into account for formula fed infants. Presently the refer-ence is still the breastfed infant, at least during the first 6 months of life but probably alsoduring the second part of the first year of life. Neverthless, it is important to accumulatedata and particularly to investigate all the factors that can influence body compositionduring the first year of life such as exclusive breast feeding and weaning diet.
The second part of your question is related to the influence of diet content on bodyand weight gain composition. Is it possible to correct the differences between breast-fed and formula-fed infants, by manipulations of the formula content? Up to now, lim-ited results suggest that protein energy ratio could be major factor influencing bodyand weight gain composition. But we need additional investigations, and the E.U.childhood obesity project could partially answer to that question.
References
1 Carver JD, Wu PY, Hall RT, et al: Growth of preterm infants fed nutrient-enriched or term for-mula after hospital discharge. Pediatrics 2001;107:683–689.
2 Lucas A, Fewtrell MS, Morley R, et al: Randomized trial of nutrient-enriched formula versusstandard formula for postdischarge preterm infants. Pediatrics 2001;108:703–711.
3. Cooke RJ, Griffin IJ, McCormick K, et al: Feeding preterm infants after hospital discharge:effect of dietary manipulation on nutrient intake and growth. Pediatr Res 1998;43:355–360.
4. Cooke RJ, McCormick K, Griffin IJ, et al: Feeding preterm infants after hospital discharge:effect of diet composition. Pediatr Res 1999;46:461–464.
Rigo
78

Dietary Reference Intakes: Concepts and Approaches UnderlyingProtein and Energy Requirements
Allison A. Yates
Nutritional Sciences, ENVIRON Health Sciences, Arlington, VA, USA
AbstractNutrient reference values provide guidance for maintaining and enhancing health
via standard setting and development of nutritionally improved products to decreasethe risk of disease. Since 1941, the Food and Nutrition Board (FNB) of the NationalAcademy of Sciences in the United States has developed and periodically revised rec-ommendations for nutrients; the last (10th) edition of the Recommended DietaryAllowances (RDA) was released in 1989. In 1994 the FNB initiated an expandedapproach to develop dietary reference intakes (DRI), quantitative nutrient intakesthat include concepts of chronic disease risk and multiple reference values morespecifically suited to various applications. In concert with Canadian scientists, 10 DRIreports have been completed since 1997 and are available for review at www.nap.edu.The DRI reports explicitly review possible functional endpoints considered in deter-mining the adequacy of each nutrient, and differentiate between the statistical basisfor assessing the adequacy of intakes for individuals and groups and providing recom-mended intakes, as well as levels of nutrient intake that should not be exceeded.Recommended intakes for infants are based on average volumes of intake by healthy,full-term, exclusively breast-fed infants and nutrient analysis of human milk; the rec-ommended intake also includes nutrients contributed by complementary foods con-sumed during the second 6-month period of life.
Copyright © 2006 Nestec Ltd., Vevey/S. Karger AG, Basel
Introduction
Nutrient reference values provide guidance to maintain and enhance healthvia standard setting and development of nutritionally improved products todecrease the risk of disease. Quantitative reference values for nutrients usedin food and nutrition planning have been available since the early 1900s whenrecommended intakes for protein were included in early United States
79
Rigo J, Ziegler EE (eds): Protein and Energy Requirements in Infancy and Childhood.Nestlé Nutr Workshop Ser Pediatr Program, vol 58, pp 79–94,Nestec Ltd., Vevey/S. Karger AG, Basel, © 2006.

Department of Agriculture bulletins [1]. At the beginning of World War II, theFood and Nutrition Board (FNB) of the National Academy of Sciences estab-lished a set of nutrient standards in 1941: the Recommended DietaryAllowances (RDAs) [2]. Over the following five decades, these have beenperiodically revised and by 1989, served as tools to assess the adequacy ofdiets, as goals for intake, and as the basis for food and nutrition programs andpolicies in the US and other countries.
By the 1980s, research in nutrition and health had expanded beyond initialconcerns focused on deficiency diseases to looking at chronic disease rela-tionships. Such research broadened the definition of nutrient ‘deficiency’ andsupported the release of two companion reports by the FNB in 1989, the 10thedition of the Recommended Dietary Allowances [3] and a new report evalu-ating the role of nutrients and diet on chronic disease [4].
The definition of RDA has remained markedly constant over many revi-sions: the levels of intake of essential nutrients that were considered, in thejudgment of the FNB and on the basis of available scientific knowledge, to beadequate to meet the known nutritional needs of practically all healthy per-sons for nutrients known to be required [3]. Past concerns about nutrient tox-icity, of consuming too much of a nutrient, were typically not significant, withmajor exceptions being products such as infant formulas, which might well bethe sole source of nutrients for an important period of growth and develop-ment, or substances such as cod liver oil.
In 1994 the FNB proposed expanding the approach of its previous work inestablishing RDAs to include concepts of disease risk beyond traditional defi-ciency signs and symptoms [5]. Following the approach used by Great Britainin 1991 [6] and based on the diverse situations in which RDAs were increas-ingly being used as the reference values (table 1), it also became increasinglyimportant to provide multiple reference values more specifically suited to theapplication and which could be scientifically supported [5]. This expansion ofthe RDAs to provide additional reference values, termed dietary referenceintakes (DRIs), has resulted in a series of 10 DRI reports since 1997. This hasbeen a joint activity with Canadian scientists, supported by US governmentalagencies, Health Canada, private foundations, and industry.
Conceptual Basis of Dietary Reference Intakes
Brief descriptions of each category of reference intakes included in theDRI reports are provided in table 2, along with their typical uses. Initially, onlythree categories of DRIs for each nutrient were planned: an estimated aver-age requirement (EAR), an RDA, and a tolerable upper intake level (UL).Early on, however, it became apparent that for nutrients with little dose-response data, a reference value would still be needed as a recommendedlevel of intake, established on a different basis than the RDA (fig. 1). This
Yates
80
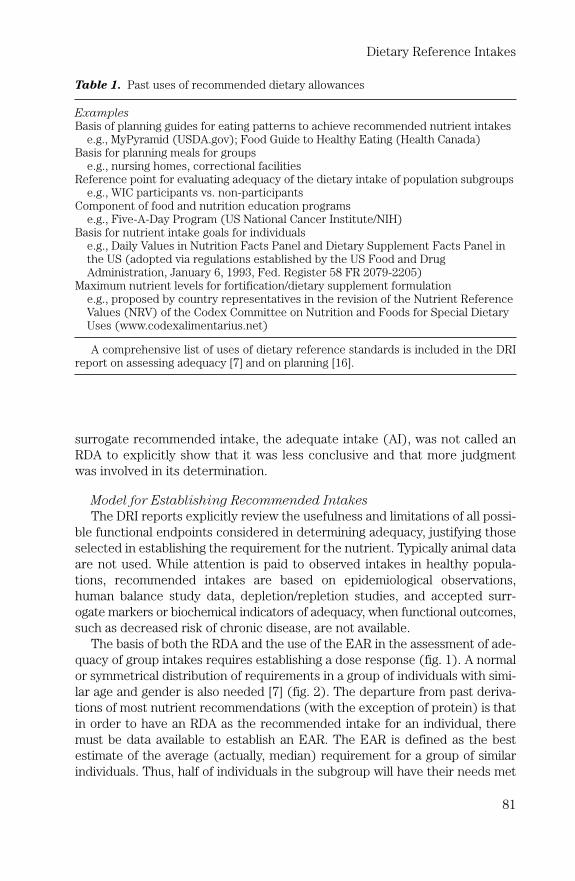
surrogate recommended intake, the adequate intake (AI), was not called anRDA to explicitly show that it was less conclusive and that more judgmentwas involved in its determination.
Model for Establishing Recommended Intakes
The DRI reports explicitly review the usefulness and limitations of all possi-ble functional endpoints considered in determining adequacy, justifying thoseselected in establishing the requirement for the nutrient. Typically animal dataare not used. While attention is paid to observed intakes in healthy popula-tions, recommended intakes are based on epidemiological observations,human balance study data, depletion/repletion studies, and accepted surr-ogate markers or biochemical indicators of adequacy, when functional outcomes,such as decreased risk of chronic disease, are not available.
The basis of both the RDA and the use of the EAR in the assessment of ade-quacy of group intakes requires establishing a dose response (fig. 1). A normalor symmetrical distribution of requirements in a group of individuals with simi-lar age and gender is also needed [7] (fig. 2). The departure from past deriva-tions of most nutrient recommendations (with the exception of protein) is thatin order to have an RDA as the recommended intake for an individual, theremust be data available to establish an EAR. The EAR is defined as the bestestimate of the average (actually, median) requirement for a group of similarindividuals. Thus, half of individuals in the subgroup will have their needs met
Dietary Reference Intakes
81
Table 1. Past uses of recommended dietary allowances
ExamplesBasis of planning guides for eating patterns to achieve recommended nutrient intakes
e.g., MyPyramid (USDA.gov); Food Guide to Healthy Eating (Health Canada) Basis for planning meals for groups
e.g., nursing homes, correctional facilitiesReference point for evaluating adequacy of the dietary intake of population subgroups
e.g., WIC participants vs. non-participantsComponent of food and nutrition education programs
e.g., Five-A-Day Program (US National Cancer Institute/NIH)Basis for nutrient intake goals for individuals
e.g., Daily Values in Nutrition Facts Panel and Dietary Supplement Facts Panel in the US (adopted via regulations established by the US Food and Drug Administration, January 6, 1993, Fed. Register 58 FR 2079-2205)
Maximum nutrient levels for fortification/dietary supplement formulatione.g., proposed by country representatives in the revision of the Nutrient Reference Values (NRV) of the Codex Committee on Nutrition and Foods for Special Dietary Uses (www.codexalimentarius.net)
A comprehensive list of uses of dietary reference standards is included in the DRIreport on assessing adequacy [7] and on planning [16].

Yates
82
Table 2. Dietary reference intakes: definitions and uses
Category of dietary reference intake (DRI) Use to
assess dietary planadequacy1/ dietsexcess
Recommended intakes for individualsAdequate intake2 (AI) � the recommended average XXdaily intake level based on observed or experimentally determined approximations or estimates of nutrient intake by a group (or groups) of apparently healthy people that are assumed to be adequate – used when an RDA cannot be determined
Recommended dietary allowance (RDA) � the XXaverage daily dietary nutrient intake level sufficient to meet the nutrient requirement of nearly all (97–98%) healthy individuals in a particular life stage and gender group
RDA � EAR � 2 � CVEAR
Acceptable macronutrient distribution range (AMDR) � XXthe range of intakes for an energy yielding macronutrient associated with reduced risk of chronic disease while providing adequate intakes of essential nutrients; given as a percent of energy intake
Reference intakes for individualsTolerable upper intake level (UL) � the highest average XXdaily nutrient intake level that is likely to pose no risk of adverse health effects to almost all individuals in the general population. As intake increases above the UL, the potential risk of adverse effects may increase
Reference intakes for groupsEstimated average requirement3 (EAR) � the average XXdaily nutrient intake level estimated to meet the requirement of half the healthy individuals in a particular life stage and gender group
Estimated energy requirement (EER) � the EER is XXdefined as the average dietary energy intake that is predicted to maintain energy balance in a healthy adult of a defined age, gender, weight, height, and level of physical activity consistent with good health. In children and pregnant and lactating women, the EER is taken to include the needs associated with the deposition of tissues or the secretion of milk at rates consistent with good health

Dietary Reference Intakes
83
Table 2. (continued)
Category of dietary reference intake (DRI) Use to
assess dietary planadequacy1/ dietsexcess
AMDR: use to estimate the proportion of the population that XXfalls outside the range to assess adherence to recommenda-tions and determine concern level about adverse consequences
1Evaluating an individual’s nutritional status requires data on biochemical, clinical,and anthropometric measures.
2The AI for infants is based on the average intake of the nutrient from human milkfor infants at the midpoint of the age range, and the corresponding average composi-tion of the nutrient from analyses of human milk obtained during the same stage oflactation. It should be used as a guide for infants, but actual intake and needs may varydepending on growth rate, etc.
3Requires statistically valid approximation of distribution of usual intakes.Source: The Institute of Medicine, Food and Nutrition Board [7, 11, 16].
Fig. 1. Conceptual model of dietary reference intakes (DRIs). The DRI modelrelating nutrient risk of inadequacy and excess includes four DRI categories. Theestimated average requirement (EAR) can be used to assess adequacy of populationintakes if assumptions are met and is the basis for the recommended dietaryallowance (RDA). The adequate intake (AI) lies somewhere in the area depicted inthe diagram, in that it is not directly related to the EAR, but may be an observedintake that appears adequate for all in the population. Its relationship to the EAR andthus the RDA is not known as it is only provided when it is not possible to determinean EAR from the available data. The goal in setting the tolerable upper intake level(UL) is that it is as high as possible without increasing the potential for adverse effectsdue to excess intake. It may actually be less than indicated in the conceptual model, ifa great deal of uncertainty exists in the available data used to set the UL.
Observed level of intake
UL
Ris
k o
f in
ad
eq
uacy
Ris
k o
f excess
0.5 0.5
RDAEAR
Increase
AI

at the EAR, half will not.1 In order to estimate a recommended intake that willprovide almost all healthy individuals in the group with enough to meet theirneeds, the EAR is increased by two standard deviations2 of requirements toobtain the RDA for the nutrient (fig. 2).
Adequate for What?
A key question is the determination of the criterion or criteria of adequacy.Which functional outcome, surrogate marker for disease, or biochemical or
Yates
84
Fig. 2. Model for dietary reference values. The theoretical model for establishing theestimated average requirement (EAR) and the recommended dietary allowance (RDA).The model assumes that the distribution of requirements is normal (or symmetrical);that members of the group are of similar age, gender, and size; and that each individual’srequirement for the nutrient is independent of that individual’s intake (not true forenergy). Within the dietary reference intake (DRI) conceptual model, the RDA isderived from the EAR � 2 standard deviations of the EAR; thus the RDA should meetthe needs of almost all (97.5%) of the individuals in the population. In this diagram, twomembers of the group, ab and ay, each from a similar subpopulation and age, havedifferent requirements. While consumption of the EAR would provide an adequateintake of the nutrient for individual ab, it would be inadequate for individual ay, whoneeds more than the EAR. Note that the EAR could be different (either greater or less)if a different indicator of adequacy was chosen, resulting in a higher or lower RDA.
Frequency distribution of
individual requirements
Increasing Intake
4.8 ab 6.0 ay 7.2
EAR – based on indicator
of adequacy
RDA
EAR�6; SDEAR�0.6
2�SDEAR �1.2
RDA�6�1.2 �7.2
Num
ber
of
ind
ivid
uals
in
gro
up
1The definition of the EAR is that of a median, while use of the word ‘average’ indicates a mean.The decision to call this DRI ‘EAR’ was made to follow precedent set by the UK [6], and because ifthe distribution of requirements is symmetrical, then the mean and median are the same.
2For some nutrients whose requirements are not symmetrically distributed such as iron,other statistical methods are used to establish both an average requirement (EAR) and RDA(amount that would be adequate for 97.5% of individuals in the group).

physiological indicator best reflects adequacy for a nutrient is not a trivialmatter. The DRI reports outline the possible candidates, and describe indetail choices made for establishing adequacy, explicitly recognizing that ifother criteria were chosen, the average requirement and the related RDAmight well be significantly different. It is at this step, choosing the indicator,that geographic and policy-based decisions may direct different choices.
When Dose-Response Data Are Not Available
For well-studied nutrients, response data from individuals fed varying lev-els of intake are available to develop EARs and, from that RDAs. For manynutrients, however, available human data may only be at markedly deficientlevels of intake or at amounts known to be more than adequate, with no infor-mation on intermediate levels needed to construct a dose response. For thissituation, or where there are conflicting data regarding the appropriate crite-rion, or where responses are not uniform, an additional reference value, theAI, is established as a recommended intake for individuals [8].
Determination of the Coefficient of Variation of Requirements
While the average requirement is important in order to establish the EARand thus the RDA, so too is the variation in requirements. In order to determinea reference value that will meet the needs of almost all in the population, thedistribution of requirements must be estimated. In most cases where therewere adequate data points to establish an EAR, there was not enough informa-tion to estimate the standard deviation (SDEAR) of the average requirement forthe group; errors in estimating the distribution of requirements were consid-ered sizable enough to not attempt to estimate it [8]. If cases where data on thevariability of requirements for a nutrient was insufficient to calculate an SDEAR,then the coefficient of variation (CV) for the EAR is assumed to be 10% [8].
The use of 10% as a default CV comes from variation in measured basalmetabolism of similar individuals estimated to be 10% [9], and on the distri-bution of protein requirements estimated to be 12.5% [9]. Seventeen nutri-ents have EARs; for six of them, the CV applied differs from the default CV of10%: 15% for copper, molybdenum, niacin, and carbohydrate [10–12], and20% for iodine and vitamin A [12]. For iron and protein [11, 12], where non-normal distributions of requirements were identified, statistical modeling wasused to establish the EAR and the RDA.
Establishing the Tolerable Upper Intake Level
With the growing availability of nutrients at high levels in the diet com-pared to amounts obtained from typical natural food-based sources, the needto ascertain a level of intake that would not pose an increased risk of adverseeffects due to overconsumption was needed. The traditional model for risk
Dietary Reference Intakes
85

assessment was adapted for nutrients, giving rise to the fourth category ofDRIs, the UL (table 2).
Establishing upper levels of nutrient intake that do not increase the risk ofadverse effects is often hampered by the following: (1) dose-response data athigh levels of nutrient intake are usually lacking, thus requiring animal datareview; (2) there are few chronic human or animal studies available in the lit-erature, as those published typically determine the toxicity of acute levels ofintake; (3) few surveillance studies are available in which high intakes areestimated to establish a ‘no observed adverse effect level’ (NOAEL); (4)intakes in the few studies available usually only include supplement intakerather than total intake, thus not capturing intakes from foods, which mayalso be fortified, and (5) estimates of bioavailability often differ due to thenutrient source.
Steps in Risk Assessment
Risk is defined as the probability of an adverse effect occurring at somespecified level of exposure. The risk assessment model is described in each ofthe DRI reports on nutrients, and is comprised of four steps, following tradi-tional toxicological risk assessment methodology: (1) hazard identification tofind adverse effects resulting from ingestion of a nutrient on a chronic basis;(2) dose-response assessment, using quantitative data relating the chosencritical adverse effect to nutrient intake to identify a NOAEL, a LOAEL (lowestobserved adverse effect level), and an uncertainty factor, which varies basedon the strength of the data and seriousness of the adverse effect; (3) exposureassessment, which estimates the percent of population subgroups exposed atintakes above the UL, and (4) risk characterization, which determines the pro-portion of each subgroup in the population who may be at risk for the criticaladverse effect associated with the UL. Since the UL is established taking intoaccount sensitive individuals in the population, it is not expected that all oreven many of those whose usual or chronic intake exceeds the UL will demon-strate the adverse effect. The term ‘tolerable’, however, was chosen to pointout that since no health benefits of intakes by the general population abovethe RDA or AI have been adequately documented, the ULs should not be con-sidered recommended intakes or desirable levels to attain.
Extrapolation
Given that the data on adverse effects of overconsumption of nutrients areminimal in most cases, age and gender groups are combined in establishingULs. Adult values based on available data are extrapolated to children, eld-erly, or during pregnancy and lactation, based on body size or based on differ-ences in route of ingestion, absorption, distribution, metabolism, or excretion.For vitamin E, boron, molybdenum, nickel, and vanadium, the ULs are basedon animal studies, and thus the uncertainty factor applied to each takes intoaccount extrapolating animal data to humans [12, 13].
Yates
86

Application of the Model of Nutrient Risk
Assessment to Macronutrients
As part of the DRI process, the risk assessment model was applied to allnutrients reviewed, including macronutrients. Much of the evidence reviewedregarding the intake of fat and carbohydrate relates to their long-term effectson chronic disease [11].
For fat and other dietary lipid components, a NOAEL could not be estab-lished as, at the lowest levels of intake, there appeared to be continued benefitin further decreasing intake to decrease the risk of cardiovascular disease.Thus, rather than provide a UL for a level at which there would be an expectedand quantifiable risk, the recommendation is to decrease intake of these dietaryfats as low as possible while consuming a nutritionally adequate diet [11].
In the case of added sugars which were also evaluated, no UL was establishedas there was ‘no clear and consistent association between increased intake ofadded sugars and body mass index’ [11], although there was a trend towarddietary inadequacy with higher intakes of added sugars. In place of a UL, the fol-lowing statement was provided: ‘A maximal intake of 25% of energy from addedsugars is suggested . . . based on ensuring sufficient intakes of essential micronu-trients that are for the most part present in relatively low amounts in food andbeverages that are major sources of added sugars in North American diets’ [11].
Distribution of Energy-Yielding Macronutrients
The dual roles that fat, carbohydrate, and protein play in normal growthand in metabolism are recognized in the DRI provision of both recommendedintakes (either AIs or RDAs) based on their independent roles in health aswell as their use as a source of energy. The acceptable macronutrient distri-bution range (AMDR) was created to describe this second role: as a percent-age of total energy consumed to provide guidance to individuals and to assesspopulation group intakes (table 2).
Chronic intake above the upper end of the range can be viewed as poten-tially putting an individual at risk of overconsumption, in part because it couldresult in under-consumption of another macronutrient resulting in an increasedrisk of it being inadequate for its specific role in metabolism. The lower level ofthe range can be considered as the minimum amount required. The lower levelof the protein range approximates the RDA; intake beyond the upper end of therange may result in under-consumption of fat or carbohydrate [11].
Approaches to Recommended Intakes for Infants
The AI was initially created for infants, where it would be unethical to inten-tionally feed infants varying levels of intake known to be deficient and evaluate
Dietary Reference Intakes
87

changes in body weight, growth, or other nutritional status indicators over time.Also of concern was the tendency seen with past reference standards for inac-curate comparisons to be made between recommended intakes and human milkcomposition. Human milk was frequently cited as inadequate for a number ofnutrients. To eliminate this misinterpretation, AIs based on the nutrient contentof human milk are provided for infants for nutrients for which there is no evi-dence indicating that breast-fed infants should have supplementary amountsabove that provided in human milk [8].
The AIs for infants are calculated by estimating an average volume of intakeby healthy, full-term, exclusively breast-fed infants midway through the first 6months or the second 6 months of life. The amount of a nutrient in that volumeis estimated from analysis of human milk samples taken during the same timeperiod of infant feeding (2–6 or 7–12 months of lactation). During the second 6months of life, the estimated contribution of complementary foods is added tothe average amount of the nutrient provided by human milk. The values shouldbe used in context; the DRI reports point out that there will be variation in boththe amount consumed and its composition during normal infancy, and thus thecomputed values represent average values, noting that it is expected thatinfants will consume increased volumes of human milk as they grow.
While separate recommendations for infants fed formula are not made, ifspecific issues relative to bioavailability or the source of a nutrient are rele-vant to developing an optimal formula, the issue is discussed and data pro-vided for modifying the recommended intake. Because of the reliance onhuman milk composition, the AI is less than previous recommended intakesfor infants in the US [3] or Canada [14].
Of the nutrients reviewed as part of the DRI process, two nutrients wereconsidered inadequate in the diets of infants beyond their 6th month of lifewhen fed exclusively human milk: iron and zinc [12]. Using a factorial methodto estimate average requirements that includes amounts for growth, EARswere developed for these two nutrients for infants 7–12 months of age, result-ing in the only RDAs provided for this age group.
Because of organ immaturity, no ULs were established for infants, with thestatement that infants should obtain nutrients from food (including humanmilk) or formula only.
Approaches to Values for Children
Age Groups
Since the age groups used in recent US RDAs [3] differed from those usedin the Canadian Recommended Nutrient Intakes [14], a number of expertswere initially queried on appropriate age cutoffs. New data on the onset ofmenarche indicated a need to revise female grouping. The new age categoriesnow take into account the age at which young children enter institutional
Yates
88

feeding settings (pre-kindergarten) in Canada and the United States, poten-tially affecting energy requirements, as well as the change in onset of adoles-cent growth spurts [8].
Extrapolations due to Data Gaps
In spite of the significant progress in research related to human nutritionalneeds, data were not usually available with multiple levels of nutrient intaketo directly determine nutrient requirements for each gender and life-stagegroup, including children. Thus available data from other subgroups wereextrapolated to develop EARs, AIs, and ULs for each subgroup (each DRIreport discusses extrapolation methodologies employed for nutrientsincluded in the report). Nutrients involved in energy metabolism wereextrapolated on the basis of metabolic body weight (B.Wt.3/4). Extrapolationbased directly on body weight was used for nutrients involved in bone main-tenance and growth. The size of compartment or tissue weight was used asthe basis for extrapolation for nutrients primarily distributed in the waterspace or other specific tissues.
Energy and Physical Activity
The DRIs include estimated energy expenditure at four levels of physicalactivity. Previous energy allowances were based on estimated time spent invarious activities in addition to measured or predicted basal metabolic rates [3].Rather than provide an RDA (a level of energy intake that would be adequatefor almost all the population), an estimated energy requirement (EER) is pre-dicted from regression equations derived from doubly labeled water databased on gender, age, weight, height, and four levels of physical activity (sede-ntary, low active, active, very active) [11].
The DRI process also recommended levels of activity to both decrease therisk of chronic disease and maintain body weight below a body mass index of25 [11]. The level of total activity recommended is �1.6 physical activity level(PAL, the ratio of total energy expenditure to basal energy expenditure), andis the equivalent of 60 min of moderate intensity activity on a daily basis abovesedentary levels (moderate activity equivalent to walking at 4.8–6.4 km/h).
Conclusions
While an important part of the DRI process and conceptual framework isto incorporate the growing body of evidence on the role of nutrients andfood components in decreasing the risk of chronic as well as deficiency dis-eases in order to maintain and enhance the quality of life through diet-related
Dietary Reference Intakes
89

benefits, there has been less evidence available to associate intakes of nutri-ents in childhood or infancy with long-term outcomes [15]. Future efforts toincorporate concepts of risk factor reduction in quantifying nutrient require-ments and recommendations will continue to increase, focusing on nutrientintake during early life and its impact on future health.
Acknowledgements
To date, the DRI process has involved over 200 scientists in Canada and the UnitedStates over the last decade or more, funded by US and Canadian federal agencies,non-profit foundations, and corporate sponsors. The Institute of Medicine and thechairs, members, consultants, and staff of the Food and Nutrition Board, all of whomworked on aspects of this continuing project over the last decade, have been essentialto its development. In particular, the contributions of the late Vernon R. Young, firstChair of the DRI Committee, who, through the grace of his wit and intellect, gave hisfull measure to the activity as he strove to imbed scientific validity in the process,must not be forgotten.
References
1 Atwater WA, Bryant MS: Bulletin No. 28. Washington, US Department of Agriculture, 1902.2 Roberts LJ: Beginnings of the recommended dietary allowances. J Am Diet Assoc 1958:34:
903–908.3 National Research Council: Recommended Dietary Allowances, ed 10. Report of the
Subcommittee on the 10th edition of the RDAs, Food and Nutrition Board, the Commissionon Life Sciences. Washington, National Academy Press, 1989.
4 National Research Council: Diet and Health: Implications for Reducing Chronic Disease Risk.Report of the Committee on Diet and Health, Food and Nutrition Board, the Commission onLife Sciences. Washington, National Academy Press, 1989.
5 Institute of Medicine, Food and Nutrition Board: How Should the Recommended DietaryAllowances Be Revised? Washington, National Academy Press, 1994.
6 Committee on Medical Aspects of Food Policy: Dietary Reference Values for Food Energy andNutrients for the United Kingdom. Report on Health and Social Subjects, No. 41. London,HMSO, 1991.
7 Institute of Medicine, Food and Nutrition Board: Dietary Reference Intakes: Applications inDietary Assessment. Washington, National Academy Press, 2000.
8 Institute of Medicine, Food and Nutrition Board: Dietary Reference Intakes for Calcium,Phosphorus, Magnesium, Vitamin D, and Fluoride. Washington, National Academy Press,1997.
9 Energy and Protein Requirements. Report of a Joint FAO/WHO/UNA Consultation. WorldHealth Organ Tech Rep Ser 1985;724:1–206.
10 Institute of Medicine, Food and Nutrition Board: Dietary Reference Intakes for Thiamin,Riboflavin, Niacin, Vitamin B6, Folate, Vitamin B12, Pantothenic Acid, Biotin, and Choline.Washington, National Academy Press, 1998.
11 Institute of Medicine, Food and Nutrition Board: Dietary Reference Intakes for Energy,Carbohydrate, Fiber, Fat, Fatty Acids, Cholesterol, Protein, and Amino Acids. Washington,National Academies Press, 2002.
12 Institute of Medicine, Food and Nutrition Board: Dietary Reference Intakes for Vitamin A,Vitamin K, Arsenic, Boron, Chromium, Copper, Iodine, Iron, Manganese, Molybdenum,Nickel, Silicon, Vanadium, and Zinc. Washington, National Academy Press, 2001.
13 Institute of Medicine, Food and Nutrition Board: Dietary Reference Intakes for Vitamin C,Vitamin E, Selenium, and Carotenoids. Washington, National Academy Press, 2000.
Yates
90

14 Health Canada: Nutrition Recommendations. The Report of the Scientific Review Committee1990. Ottawa, Canadian Government Publishing Centre, 1990.
15 Institute of Medicine, Food and Nutrition Board: Dietary Reference Intakes for Water,Potassium, Sodium, Chloride, and Sulfate. Washington, National Academies Press, 2004.
16 Institute of Medicine, Food and Nutrition Board: Dietary Reference Intakes: Applications inDietary Planning. Washington, National Academies Press, 2003.
Discussion
Dr. Butte: I have been involved in evaluating the diets of toddlers from the secondyear of life. I was personally surprised that some of the nutrient intakes, when wecompared them against the recommended daily allowances (RDAs) and the upperlimits, were approaching the upper limits, specifically zinc, niacin and vitamin A. Sowhen the upper limit committee was meeting, was one of their criteria to look atwhere they set the upper limit and then examine dietary intake from various agegroups? We all acknowledge that it is not ideal to extrapolate from adults to toddlers,but that is all we have. I was just wondering if those committees did check to see ifthese were consistent with what observed intakes are?
Dr. Yates: Yes and no. They did do a check to see where the nutrient was comingfrom, and if they found it was coming from a heavily fortified food source then it madethem less comfortable; although in fact it was acceptable, recognizing that what theywere establishing was a no observed effect level (NOAEL). In the case of zinc theadverse effect was determined to be a decrease in copper absorption. The issue wasare these individuals who are getting higher levels of zinc, primarily from breakfastcereal, also getting a lot of copper because it was being added to the breakfast cereals,and this is not the case. As there was documented copper deficiency resulting fromthe overconsumption of zinc (I believe it was in infants) their feeling was that by set-ting the upper limit as they did for the 1- to 3-year-old group, that was where the prob-lem lay. In the US companies were fortifying their cereal products with the adult RDAwhich was probably an inappropriate level. Now the upper level is not the same as anaverage requirement. The agencies involved in regulating how much can be added tovarious food products asked for a safe level, but we didn’t want to use the term ‘safe’.So in a way it is a level at which one feels comfortable, that even going over it for awhile is no problem. So it is much more of an average intake but it is on the other sideof the slope of the curve. If you look at the data, the issue about where zinc is comingfrom, whether people have been using it over the last 5 or 10 years or companies havebeen putting it in a product, is a little different than if it has been part of the naturaldiet over the last 50 years and there is no apparent adverse effect. So I think part of itis derivation. But I think it is getting at “where are those nutrients coming from?” andit could be the extrapolation method.
Dr. Cong Khanh Nguyen: I would like to ask two questions. Regarding the dietaryreference intakes, should they be based on the local bioavailability of food? The prob-lem of food bioavailability is quite considerable in a critical period like pregnancy andlactation. In Viet Nam we did some studies on food contamination, particularly in fishbecause in some areas fish is contaminated with heavy metal. What is the upper limitfor fish consumption in children? When we look at the level recommended by theMinistry of Public of Health the total intake is still lower than what is recommended asa toxicology issue. Do you think that we can recommend that reference intake from afood safety aspect?
Dr. Yates: The first question was about pregnancy and lactation with regard tobioavailability. The assumption is that you could determine requirements, and there
Dietary Reference Intakes
91

probably is very little difference (in requirements) depending on what geographic areayou are in or what your food supply is. When you want to set the recommendedallowance you are going to have to take into account bioavailability and, taking iron asan example and depending on the iron source, there is a different average requirementif the primary iron source is animal or vegetable. So yes, certainly you have to takebioavailability into account for the average requirement. That is why we say these RDAsare really for Canada and the US, given our food supply. How well they would apply toother areas, I don’t know. I assume that other countries are doing their own RDAs basedon their food supply and the typical bioavailability of nutrients that they are interestedin. Your other question was how do to deal with food such as fish which may have a lotof mercury contamination; the big question here is ‘are you below what you think is theallowable exposure to something like mercury, which is really a concern over time?’ Youhave to decide if fish is a really important staple for maintaining an individual in a stateof health, and if there is no alternative to providing fish, then you will likely cause moreproblems than the potential mercury contamination. Actually there is a report from theNational Academy of Sciences about 2 years ago looking at dioxin in the food supply andwhat should be the public health message. Because of it being in fat and certainly fish,what should they tell pregnant women? They essentially said if you follow our typicaldietary guidelines which are low fat diets you will be decreasing your exposure signifi-cantly, and that is probably the best public health message. But it is a problem, certainlyin the US, where people are really interested in n-3 fatty acid intake and increasing it byfish consumption, but at the same time they try to avoid types of fish that have heavymetal contamination. It is a public health problem that nobody has solved yet.
Dr. Koletzko: I would like to come back to the question from Dr. Butte as to howdo you extrapolate values for children, particularly for young children. I think it isquite important which method to use because the younger the child, the more differ-ent the results are. In 2003 the Scientific Committee on Food of the EuropeanCommission critically looked back at what it has been doing and pointed out that theapproach it used for extrapolating upper levels or safe levels has really severe limita-tions. They pointed out that if you extrapolate the upper level values for children fromadult values on body weight or body surface basis, in a number of cases you come upwith upper levels that are lower than the known nutrient requirements. So clearlythere are some severe limitations. If one looks around the world at reference nutrientintake values it is quite remarkable how big the differences in values are for the samenutrients for the children observed. I think that this can partly be explained by thelack of scientific knowledge and data, but also I think it has to do with the very differ-ent concepts, approaches and definitions that different people use. In that regard Iwas wondering why the Dietary Reference Intake Committee chose as a default valuea metabolic body mass with the exponent of 0.75? Looking at the recent literaturethere is still a hot controversy regarding the right exponent, and some people arefavouring the exponent of 0.66. As you know the younger the child, the bigger the dif-ference. If I compare extrapolations based on body surface area and body weight areathen at 10 years it is only a difference of 25%, and in 1 year it is a difference of 60%; inthe infant between newborn age and half a year there is a difference of 100%. So thisis really an important question. The second question I have is my interpretation is thatthe US DRI recommendations for upper levels in children were based on body weight,except for sodium.
Dr. Yates: I am sorry, I didn’t differentiate that. But you are right, the upper levelsexcept for the B vitamins.
Dr. Koletzko: And sodium, based on body weight and not on metabolic bodyweight. So the reference nutrient intake and upper levels for the same nutrient were
Yates
92

calculated on a different basis. I am wondering why this choice was made, becauseagain for young children this would lead to a proportionally much lower upper level.
Dr. Yates: This is a 10-year process, and what you start out with changes as you goalong; certainly there is new science and there are new people and approaches. Therewere quite difficult scientific discussions to get toxicologists away from uncertainty fac-tors of 10 and 100, depending on whether there were animal data, species extrapolation,and so on. Thinking in uncertainty factors of less than 5 was a major accomplishment.The big reason that the Food and Nutrition Board wanted to look at the upper levelmodel and try to use risk assessment was that in 1992 the Environmental ProtectionAgency in the United States came out with a report saying that the reference dose forzinc for children was 5 mg, I think, and at the time the RDA from 1989 for zinc for chil-dren was 7 or 8 mg. But again the Environmental Protection Agency used the traditionaltoxicology model. So when we started we were fairly careful to try to wrench awayuncertainty factors to find something that seemed reasonable. But I guess one of themajor issues is how do you extrapolate for children. I don’t think that has been solved,and I think it does make a difference whether you are looking at adequacy or upper lev-els. As you probably know the upper levels are not nearly as specific in terms of group-ings. So there is an adult upper level and then there is a child upper level and thenpotentially there is pregnancy and lactation, but they are not broken up by age. They arejust very general numbers at which there is assumed to be no risk of consuming thatlevel. Beyond that there is a potential for risk but there is not a definable risk. So it is nota well-cut criterion on and I think it is because it is probably 20 years behind where we arewith recommended reference intakes, and we just have to get the science to catch up.
Dr. Cong Khanh Nguyen: In Viet Nam we have a program for iron fortification infood. We did efficacy studies and published 2 studies; one in the American Journal ofClinical Nutrition [1] and the other in the Journal of Nutrition [2]. However, in imple-menting the program we used upper limits because excess iron is quite dangerous.But it is not easy as in the same family the women and men share the same food. Soupper limit here means for men or for women. Is it better for men or for women?
Dr. Yates: The data were so limited; trying to come up with the NOAEL or the low-est observed adverse effect level (LOAEL), there might be a database of 30 subjects orcases, often mixed with both men and women. So the data are too sparse to say thatfor women it is 1,000 and for men it is 1,200 for iodine. This is one of the reasons thatthe DRI reports are so large because they list all the studies that are available, and whythere are so many studies to use. So you look at all the data and for the situation estab-lish a NOAEL or LOAEL, and that would be one way of establishing whether you aregiving too much fortification.
Dr. Rigo: When we look at your conceptual model there is a relatively large gapbetween adequate intake and the upper level. How do you interpret this difference?
Dr. Yates: The adequate intake is an intake that is a recommended intake to con-sume, and in most cases it is based on the average intake of a population that does notappear to be inadequate for that nutrient. So it is definitely going to be more than mostpeople need. Now your question is why is the adequate level so far from the upper level?
Dr. Rigo: No, it is not why it is so far because it is calculated as such in the model.But I think that when we look at the upper level and the intake in the population, wedon’t know exactly if a large part of the population receives more than the adequateintake, and it is difficult to study the consequences of this relatively high level.
Dr. Yates: The only way you are going to be able to study the consequence of ahigh level of intake is obviously to have some examples or studies of specifically howmuch is too much.
Dr. Rigo: Take protein intake during infancy as an example. The upper level is dif-ficult to define and we have the adequate intake level; so what is the difference in thelong-term effect if we look at the higher level?
Dietary Reference Intakes
93

Dr. Yates: With proteins we didn’t establish upper levels because we could notcome up with any real adverse effects. We have this range of caloric intake, and 30 or35% is pretty high, but it is not set on the same basis. We don’t have an upper level forarsenic even though we know that arsenic is deadly; but there is no study of longexposure to chronic doses and then evaluation of adverse effects, and that is reallywhat you have to have in order to establish an upper level.
Dr. Giovannini: When you spoke about carbohydrate, why didn’t you speak aboutthe low or high glycemic index or about rapid or slow absorption? With the intake ofcarbohydrate it is very important to consider the glycemic index. It depends not onlyof the quality but also on the way something is cooked. I think a very important prob-lem in nutrition is quality control. In every country it is different, but quality control isof central importance for nutrition.
Dr. Yates: David Jenkins was a member of the committee and he is certainly inter-ested in the glycemic index. There is a carbohydrate recommendation related to totalcarbohydrate. The consensus of the committee was that the glycemic index waspotentially very useful for diabetic individuals or people with pre-diabetes, but interms of the normal healthy population there wasn’t enough information with a strongscientific basis to indicate that on a long-term basis glycemic index would maintainhealth. The other thing is this came out in 2002, but was finally printed in 2005. So wehad the information available in 2002, but there are new data since then so that mustbe put into context too. Things have changed, so what is available now may well showthat there is a need to look more closely at glycemic index and its role in health.
Dr. Giovannini: It may be useful to know the glycemic index because the mostpopular cereals sold in the world have the highest glycemic index, and every morningchildren receive milk and cereals. What Jenkins published is much higher in sucrose.For this reason it is very important to have nutritional education. In every part of theworld it is important to know what kind of carbohydrate is being consumed becausepeople think about eating fibers and do not realize that they are eating food with ahigh glycemic index.
Dr. Yates: Another interesting thing here is that at the request of the Food andDrug Administration in the US we came up with a definition of dietary fiber.Essentially fiber is endogenous in food. If it is an isolated fiber in terms of a chemicalmodification, then it has to have a demonstrated role in health to try and point peopleto the fact that it is the fiber in food and probably other things that are going to be ofhealth benefit, rather than what one might put into a food from an external source.
References
1 Thuy PV, Berger J, Davidsson L, et al: Regular consumption of NaFeEDTA-fortified fish sauceimproves iron status and reduces the prevalence of anemia in anemic Vietnamese women. AmJ Clin Nutr 2003;78:284–290.
2 Van Thuy P, Berger J, Nakanishi Y, et al: The use of NaFeEDTA-fortified fish sauce is an effec-tive tool for controlling iron deficiency in women of childbearing age in rural Vietnam. J Nutr2005;135:2596–2601.
Yates
94

Intestinal Amino Acid Metabolismin Neonates
Johannes B. van Goudoevera, Sophie R.D. van der Schoora,
Barbara Stollb, Douglas G. Burrinb, Darcos Wattimenac,
Henk Schierbeeka, Maaike W. Schaarta, Maaike A. Riedijka,
Jasper van der Lugta
aDepartment of Pediatrics, Erasmus MC-Sophia Children’s Hospital, Rotterdam, TheNetherlands; bDepartment of Pediatrics, USDA/ARS Children’s Nutrition Research Center,Baylor College of Medicine, Houston, TX, USA; cDepartment of Internal Medicine, Erasmus Medical Center, Rotterdam, The Netherlands
AbstractThe portal-drained viscera (stomach, intestine, pancreas and spleen) have a much
higher rate of both energy expenditure and protein synthesis than can be estimated onthe basis of their weight. A high utilization rate of dietary nutrients by the portal-drainedviscera might result in a low systemic availability which determines whole-body growth.From studies in our multiple catheterized piglet model, we conclude that more than halfof the dietary protein intake is utilized within the portal-drained viscera and that aminoacids are a major fuel source for the visceral organs. Specific stable isotope studiesreveal that there are large differences in the utilization rate amongst the different aminoacids. The majority of the results obtained from the piglet studies can be extrapolated tothe human (preterm) infant. First-pass, splanchnic uptake of lysine and threonine differsubstantially, while non-essential amino acids are oxidized to a great extend in thehuman gut. Overall, these studies indicate that gut amino acid metabolism has a greatimpact on systemic availability and hence growth in the neonate.
Copyright © 2006 Nestec Ltd., Vevey/S. Karger AG, Basel
Introduction
The intestine is best known for its instrumental role in the digestion andabsorption of nutrients. Less known, but important as well, is its immune fun-ction. Every fifth cell in the jejunum is a lymphocyte and, moreover, almost all
95
High Intakes of Protein and Amino Acids
Rigo J, Ziegler EE (eds): Protein and Energy Requirements in Infancy and Childhood.Nestlé Nutr Workshop Ser Pediatr Program, vol 58, pp 95–108,Nestec Ltd., Vevey/S. Karger AG, Basel, © 2006.

IgA and most of IgG is produced by the intestine. In addition to producingdefensins, mucins and glutathione for example, the intestine shows well-developed nonspecific immunity.
In conjunction with its immune function, the intestine shows hormonefunction as well. Hormones such as glucagon-like peptide II, peptide YY, andgastric inhibitory polypeptide are all produced in the intestine. And finally,large amounts of neuronal tissue are found in the gut: every cubic millimeteris estimated to contain 2 m of axons.
Considering all these functions, it is not surprising that the gut shows highenergy expenditure and a high protein synthesis rate in order to keep upintestinal metabolism. The fractional synthetic rate of proteins in the gut ishigher than in any other tissue in the body (fig. 1) [1–4]. In this review we willdiscuss several studies in piglets and preterm infants specifically aimed togain insight into the intermediate amino acid metabolism of the gut.
The piglet is the animal model of choice for this kind of study, seeing thatthe development of the pig intestine greatly resembles that of a humaninfant’s intestine [5, 6]. The studies were performed in the first month of life,the period in which gut metabolism has its greatest impact on total bodymetabolism. Gut growth in mammals is most rapid during the first month asshown in figure 2.
Piglet Studies
We used a multiply catheterized piglet model, with catheters placed in thecarotic artery, jugular vein, portal vein, stomach, and duodenum, and a flowprobe placed around the portal vein. The catheters were placed during surgery
van Goudoever et al.
96
Fig. 1. Fractional synthetic rates of different tissues in the body. Composed fromMcNurlan et al. [3], Preedy et al. [4], Burrin et al. [5] and Seve et al. [6]. � � Pigs; � � rats.
0
20
40
60
80
100
120
Intestine Skin Bone Liver Muscle
Day (%
)

in formula-fed piglets on the 21st day of life. After full recovery from surgery, asindicated by a similar weight gain rate as prior to surgery, metabolic studieswere performed in the fully conscious, enterally fed piglets [7]. This modelallowed us to measure the utilization rates of enteral and systemic substratesby the portal-drained viscera (stomach, spleen, pancreas, intestine).
Intestinal Energy Expenditure
We measured the energy expenditure of the portal-drained viscera of neona-tal piglets by means of sodium bicarbonate labeled with 13C [8]. It appeared to bealmost three times as high as could be expected on the basis of its weight. Whilesome 12% of total body energy expenditure occurred within the portal-drainedviscera, the weight of the portal-drained viscera accounted for only 4% of totalbody weight. This high energy expenditure reflects the rapid growth rate andhigh metabolic rate of these organs (especially the intestine).
Intestinal Sources of Energy
As early as 25 years ago, Windmueller and Spaeth [9] already examinedamino acid utilization rates in isolated perfused intestinal loops in rats. Fromthese in vivo experiments, they concluded that several substrates may serve asenergy sources. Glutamate and glutamine, and aspartate and glucose were themajor fuel sources found. We repeated these experiments in fully consciouspiglets, using the model described above [10]. We found amino acids to be themajor source of energy, with glutamate being the single most used amino acid.Almost all (90%) enterally administered glutamate was utilized in the firstpass, of which 47% was used for oxidative purposes. Not only non-essential
Intestinal Amino Acid Metabolism in Neonates
97
Fig. 2. Rate of postnatal weight gain of the small intestine.
0 50 150 2500
10
30
50
70
WeaningS
mall
inte
stine (g
/kg
bo
dy w
eig
ht)
Postnatal age (days)
Pig
Rat

amino acids were used, but also leucine (an essential branched chain aminoacid) was oxidized by the portal-drained viscera, slightly more than 10% of theintake. This is a crucial finding in that essential amino acids cannot be synthe-sized de novo, indicating that oxidation of such essential amino acids means anirreversible loss. Also a substantial part (31%) of whole-body lysine (anotheressential amino acid) oxidation occurred in the intestine, although lysine oxi-dation contributed little as an energy source [8]. But again, it meant an irre-versible loss of lysine which is one of the most limiting amino acids in the diet.Table 1 shows the contributions of different substrates to total energy expen-diture. At least half of the energy generated within the intestines is derivedfrom amino acid oxidation under normal feeding conditions. Interestingly,when we reduced protein intake to a maintenance level, visceral amino acidoxidation was substantially suppressed. This was only partially compensatedfor by an increase in glucose oxidation, indicating that other substrates such asfatty acids might become more important.
Intestinal Amino Acid Utilization and Systemic Availability
The higher the intestinal utilization rate, the lower the systemic availabilityof dietary amino acids. This indicates that the intestinal utilization rate ofamino acids determines whole body growth. We found that in piglets the uti-lization rate of essential amino acids was approximately 65% of the dietaryintake during the first few hours following feeding [8]. Thus the systemicavailability of essential amino acids was only 35%. For some amino acids likethreonine, the systemic availability was only 16% of the intake (table 2) [11].In a subsequent study, therefore, we examined whether the amino acids thatwere utilized within the intestine would perhaps become systemically avail-able the next day [12]. It appeared that 26% of the amino acids that were uti-lized within the intestine were released in the portal vein during the hoursfollowing the feeding period and thus became systemically available. So a sub-stantial part of dietary intake was again released into the systemic circulation
van Goudoever et al.
98
Table 1. Contributions (expressed as %) of different substrates to CO2 productionby the portal-drained viscera in piglets [10] (mean � SD)
Normal protein intake Low protein intake
Leucine 11 � 3 –Lysine 2 � 0 –Threonine 2 � 1 2 � 1Methionine 1 � 0 n.d.Glutamate 32 � 15 10 � 3Glucose 39 � 10 52 � 30Miscellaneous 13 36
n.d. � Not determined.

on the day after feeding. This can be attributed to either amino acid releaseby proteolysis of constitutive proteins in the intestinal wall or amino acidsderived from secreted glycoproteins that are degraded and reabsorbed fromthe intestinal lumen. Such secreted (glyco-)proteins can be mucins because,for instance, Muc-2 is rich in threonine, one of the most abundantly utilizedamino acids by the intestine [13].
Apart from oxidation, the metabolic fate of utilized amino acids in the intes-tine can be protein synthesis. For instance, enteral glutamate is preferentiallyused for glutathione synthesis [14]. We have recently measured the metabolicfate of methionine in the intestine of piglets. Interestingly, hardly any dietarymethionine was utilized in the first pass, but the gastrointestinal tissues con-sumed 20% of the arterially derived methionine which represented a signifi-cant site of transmethylation and transsulfuration [Riedijk et al., unpubl. data].Threonine is also utilized from the arterial site, but in equimolar amounts asfrom the luminal site [11].
The combined findings are consistent with the intestine being a major con-sumer of amino acids, inasmuch as it uses the equivalent of approximately halfof the dietary amino acid intake. These amino acids can be derived from theluminal site of the intestine or from the systemic site. The utilization grades ofthe various amino acids differ markedly. Some might be utilized almost com-pletely (glutamate, threonine) whereas, for instance, less than half of theintake of lysine is utilized. Oxidation is an important metabolic fate, but a sub-stantial part of the utilized amino acids is used for protein synthesis.
Human Preterm Studies
For obvious reasons, we cannot determine portal-drained viscera metabo-lism in human neonates. It is not feasible to obtain portal blood samples and to
Intestinal Amino Acid Metabolism in Neonates
99
Table 2. The net systemic availability of essential dietary amino acids as apercentage of enteral intake during the first 6 h following continuous feeding(mean � SEM; n � 9 piglets)
Amino acid Intake Systemic availability Systemic availability�mol/(kg/h) �mol/(kg/h) (% of intake)
Threonine 934 152 � 36 16 � 4Valine 765 315 � 31 41 � 4Isoleucine 780 218 � 18 28 � 2Leucine 748 350 � 33 47 � 4Phenylalanine 254 94 � 9 37 � 4Lysine 518 277 � 23 54 � 4
Total essential 3,999 1,406 � 101 35 � 3amino acids

quantify portal blood flow in infants. But the use of dual stable isotopicallylabeled tracers, administered enterally and systemically, allows us to quantifythe first-pass uptake of specific substrates. This is a reflection of the direct uti-lization rate of substrates by the duodenum, small intestine and liver, assum-ing that digestion and absorption are complete. The findings from severalstudies suggest that this is an appropriate assumption: hardly any enterallyadministered tracer (�1%) can be found in the stools [15], approximately 98%of milk proteins are digested [16] and intact proteins are rapidly and almostcompletely digested and absorbed before the terminal ileum in infants [17].
We used a labeled sodium bicarbonate infusion prior to a labeled substrateinfusion in order to measure the oxidation rates of different substrates. Inseveral studies we have shown that we can sample expiratory air directlyfrom the tracheal tube whenever the infants were mechanically ventilated orfrom a gastric tube inserted 1.5 cm into the nose when the infants werebreathing spontaneously [18]. The tracer can be administered enterally,which makes this kind of study minimally invasive [19].
First-Pass Splanchnic Amino Acid Utilization and Systemic
Availability during Full Enteral Feeding in the Human
Preterm Neonate
Although the pig is considered an appropriate model for the humanneonate, we wanted to confirm the previously described results in the humanneonate. So we determined first-pass utilization rates of lysine and threoninein fully enterally fed preterm infants. We opted for lysine as it is the first lim-iting amino acid in the diet of preterm infants, and for threonine as it is usedby the gut at the highest rate among essential amino acids in piglets. Ourresults confirmed most of the results obtained in the piglets. Approximatelyone fifth (18 � 7%) of dietary lysine was utilized in the first pass, versus 70%of dietary threonine [20; van der Schoor et al., unpubl. data]. In 2 earlier stud-ies approximately 50% of both leucine and glutamine were found to be uti-lized in the first pass [21, 22]. We recently finished a study revealing that72 � 10% of glutamate was utilized in the first pass [Van der Lugt et al.,unpubl. results]. All these results together show that there is a large varia-bility between the different amino acids in splanchnic extraction. The resultsare summarized in table 3.
Effect of Reduced Enteral Protein Intake on Systemic
Availability in the Human Preterm Neonate
Preterm infants do not tolerate full enteral feeding from birth onwards.This is why they are fed intravenously during the first few postnatal days,with enteral feeding being gradually introduced. Inevitably, enteral intakeduring the first few days to weeks is low, but the intestine is challenged withfeeding and will exert its function. This might lead to a high utilization rate ofenteral substrates with a low enteral intake, resulting in a subsequently low
van Goudoever et al.
100

systemic availability. Current practices to reduce parenteral amino acidintake as soon as enteral intake is established might thus lead to a reducedsystemic availability of amino acids.
Therefore we were also interested in learning whether enteral proteinrestriction would influence the fractional uptake of specific amino acids. In thepiglets we found that the fractional utilization increased whenever dietaryamino acid intake decreased. A similar finding was observed in preterm infantsreceiving 40% of their total amino acid intake enterally and 60% parenterally.While the fractional utilization rate of lysine almost doubled to 32 � 10% (18%during full enteral feeding), the first-pass uptake of threonine increased by 12%(82 � 6% of total threonine intake) during restricted enteral protein intake[20; van der Schoor et al., unpubl. data].
We measured glucose uptake to compare the splanchnic metabolism of dif-ferent kinds of substrates [23]. Glucose intake is of course much higher thanthat of individual amino acids (in millimolar instead of micromolar quanti-ties). Again we used the dual tracer methodology on two occasions, i.e. dur-ing full enteral feeding and during partial enteral feeding, as described above.Approximately one third of the glucose intake was utilized in the first passduring full enteral feeding, whereas the fraction increased to 44% during par-tial enteral feeding. So we can conclude that the fractional splanchnic utiliza-tion rate for both types of substrates (glucose and amino acids) increaseswhenever enteral intake is reduced.
Intestinal Sources of Energy in the Human
Preterm Neonate
Amino acids are the predominant fuel source for the intestine in piglets.As hardly any such data are available in humans, we examined the intestinal
Intestinal Amino Acid Metabolism in Neonates
101
Table 3. First pass splanchnic utilization and oxidation rates of amino acids andglucose in human preterm infants [20–23; unpublished data from van der Schoor et al.and van der Lugt et al.]
Substrate Utilization Utilization Oxidation Oxidationduring full during partial during full during partial enteral enteral enteral enteralfeeding feeding feeding feeding
Lysine 18 32 0 0Threonine 70 82 1 0Leucine 48 n.d. n.d. n.d.Glutamate 72 n.d. 63 n.d.Glutamine 46–53 n.d. n.d. n.d.Glucose 32 44 27 35
Data are expressed as percent of enteral intake. n.d. � Not determined.

oxidation rate of specific substrates in preterm infants (table 3). Althoughessential amino acids such as leucine and lysine were oxidized in piglets wecould not show this in preterm infants. On the other hand, dietary glutamatewas oxidized to a great extent. Almost 90% of the utilized glutamate in thefirst pass was oxidized. However, glucose oxidation contributed 5 times asmuch as glutamate oxidation to splanchnic CO2 production, probably indicat-ing that glucose is the major source of energy in the human neonatal intes-tine. Approximately three quarters of the glucose utilized by the intestine andliver was oxidized.
Conclusions
The visceral organs use great amounts of amino acids as is shown in both ani-mal and human studies. The utilization rates for the various amino acids differwidely, probably reflecting the specific metabolic fate of the different substrates.Glucose and amino acids are major fuel sources for the intestine which metaboli-cally is one of the most active organs in the body. Upon restriction of the proteinintake, the intestine is capable of resorting to substrates other than amino acids,although the utilization rate is still high especially when expressed as a propor-tion of dietary intake. During continuous feeding part of the intestinally utilizedamino acids become systemically available later on as a result of recycling ofsecreted (glyco-)proteins and/or proteolysis of intestinal constitutive proteins.
Acknowledgement
We thank Ko Hagoort for editorial assistance.Grant support was provided by: Sophia Foundation for Medical Research, the
Nutricia Research Foundation, the Royal Netherlands Academy of Arts and Sciences(Ter Meulen Fund), Federal funds from the US Department of Agriculture, Agri-cultural Research Service Cooperative Agreement No. 58-6250-6001, and CooperativeState Research, Education and Extensive Service grant No. 98–35206.
References
1 McNurlan MA, Garlick PJ: Protein synthesis in liver and small intestine in protein deprivationand diabetes. Am J Physiol 1981;241:E238–E245.
2 Preedy VR, McNurlan MA, Garlick PJ: Protein synthesis in skin and bone of the young rat. BrJ Nutr 1983;49:517–523.
3 Burrin DG, Shulman RJ, Reeds PJ, et al: Porcine colostrum and milk stimulate visceral organand skeletal muscle protein synthesis in neonatal piglets. J Nutr 1992;122:1205–1213.
4 Seve B, Reeds PJ, Fuller MF, et al: Protein synthesis and retention in some tissues of theyoung pig as influenced by dietary protein intake after early-weaning. Possible connection tothe energy metabolism. Reprod Nutr Dev 1986;26:849–861.
5 Darragh AJ, Moughan PJ: The three-week-old piglet as a model animal for studying proteindigestion in human infants. J Pediatr Gastroenterol Nutr 1995;21:387–393.
van Goudoever et al.
102

6 Moughan PJ, Birtles MJ, Cranwell PD, et al: The piglet as a model animal for studying aspectsof digestion and absorption in milk-fed human infants. World Rev Nutr Diet 1992;67:40–113.
7 Stoll B, Henry J, Reeds PJ, et al: Catabolism dominates the first-pass intestinal metabolism ofdietary essential amino acids in milk protein-fed piglets. J Nutr 1998;128:606–614.
8 van Goudoever JB, Stoll B, Henry JF, et al: Adaptive regulation of intestinal lysine metabo-lism. Proc Nat Acad Sci USA 2000;97:11620–11625.
9 Windmueller HG, Spaeth AE: Respiratory fuels and nitrogen metabolism in vivo in small intes-tine of fed rats. Quantitative importance of glutamine, glutamate, and aspartate. J Biol Chem1980;255:107–112.
10 van der Schoor SR, van Goudoever JB, Stoll B, et al: The pattern of intestinal substrate oxida-tion is altered by protein restriction in pigs. Gastroenterology 2001;121:1167–1175.
11 Schaart MW, Schierbeek H, van der Schoor SR, et al: Threonine utilization is high in the intes-tine of piglets. J Nutr 2005;135:765–770.
12 Van Der Schoor SR, Reeds PJ, Stoll B, et al: The high metabolic cost of a functional gut.Gastroenterology 2002;123:1931–1940.
13 Van Klinken JB, Dekker J, Buller HA, Einerhand AWC: Mucin gene-structure and -expression:protection vs. adhesion. Am J Physiol 1995;269:G613–G627.
14 Reeds PJ, Burrin DG, Stoll B, et al: Enteral glutamate is the preferential source for mucosalglutathione synthesis in fed piglets. Am J Physiol 1997;273:E408–E415.
15 Biolo G, Tessari P, Inchiostro S, et al: Leucine and phenylalanine kinetics during mixed mealingestion: a multiple tracer approach. Am J Physiol 1992;262:E455–E463.
16 Gaudichon C, Mahe S, Luengo C, et al: A 15N-leucine-dilution method to measure endogenouscontribution to luminal nitrogen in the human upper jejunum. Eur J Clin Nutr 1996;50:261–268.
17 Shulman RJ, Gannon N, Reeds PJ: Cereal feeding and its impact on the nitrogen economy ofthe infant. Am J Clin Nutr 1995;62:969–972.
18 van der Schoor SR, de Koning BA, Wattimena DL, et al: Validation of the direct nasopharyn-geal sampling method for collection of expired air in preterm neonates. Pediatr Res 2004;55:50–54.
19 Riedijk MA, Voortman G, van Goudoever JB: Use of [13C]bicarbonate for metabolic studiesin preterm infants: intragastric versus intravenous administration. Pediatr Res 2005;58:861–864.
20 van der Schoor SR, Reeds PJ, Stellaard F, et al: Lysine kinetics in preterm infants: the impor-tance of enteral feeding. Gut 2004;53:38–43.
21 Darmaun D, Roig JC, Auestad N, et al: Glutamine metabolism in very low birth weight infants.Pediatr Res 1997;41:391–396.
22 Beaufrere B, Fournier V, Salle B, Putet G: Leucine kinetics in fed low-birth-weight infants:importance of splanchnic tissues. Am J Physiol 1992;263:E214–E220.
23 Van der Schoor SR, Stoll B, Wattimena DL, et al: Splanchnic bed metabolism of glucose inpreterm neonates. Am J Clin Nutr 2004;79:831–837.
Discussion
Dr. Rigo: I would like to ask a question about the amino acid requirement inpreterm infants in oral and parenteral nutrition. Do you think that the requirementcould be different in parenteral and oral nutrition? I ask this question because whenwe design a parenteral amino acid solution we calculate the intake plasma relationshipand design the solution according to this relationship. We find that there is no signifi-cant difference between the intake plasma concentration relationship if the baby is fedparenterally or orally. With the exception of some amino acids, such as the aromaticamino acid, the plasma amino acid concentration differs in oral and parenteral nutri-tion if we give the same amount of this amino acid.
Dr. van Goudoever: I think that Dr. Pencharz is going to answer part of your ques-tion because there are some amino acids that clearly have different requirementswhether you feed humans or piglets intravenously or enterally, and he has shown that in
Intestinal Amino Acid Metabolism in Neonates
103

several studies. First of all I don’t think that amino acid concentrations in the blood showthe needs exactly. The gut is a very high amino acid consumer, and the requirements aredifferent for infants fed iv or enterally. When babies are fed parenterally for a long time,basically the gut is not working so more amino acids are not needed. We like the intes-tine to work for several reasons so we start giving all our preterm infants some enteralnutrition. Minimal enteral nutrition is necessary but for optimal gut function (includ-ing appropriate mucus production, enzyme production, etc.) much more amino acidsare needed and consequently the infant’s requirements will increase quite dramati-cally during enteral nutrition. My suggestion to all neonatologists is when you startenteral feeding but are still giving parenteral nutrition that you should go on with highamounts of parenteral amino acid supplementation and have around 1.5–2 g enteralprotein before tapering off parenteral amino acids supply.
Dr. Pencharz: What we have done in our piglets is to look at the differencebetween parenteral and enteral nutrition. Our work is parallel to the work that Dr. vanGoudoever has talked about, and so we have worked in a similar way. What we havedone is to define what the amino acid requirements are parenterally in the pig, and weare now trying to see how much of it relates to humans. If you have a patient with anatrophic gut on parenteral nutrition the levels are probably less; so I agree with every-thing Dr. van Goudoever has said in answering your question. Ultimately when wehave the ideal amino acid solution for parenteral use we may need to give less than forenteral feeding because the gut is atrophic. As the gut starts to recover, then it is a dif-ferent story. Dr. van Goudoever has talked mostly about essential amino acids, butamong the semi-essential amino acids is arginine which we have been very interestedin, and arginine is probably synthesized by the gut and is a very important one that weshould not forget about.
Dr. Lafeber: Over the last 5 years it has been very popular to study glutamine andnutrition, particularly in preterm infants, because of a concept proposed by Neu et al. [1]that orally supplemented glutamine would help to mature the gut wall and have a specialfunction in the gut. But looking at your studies in the pig and also in humans, do youthink it is glutamine that has such a special position or should we rather be looking atglutamate?
Dr. van Goudoever: There are glutamine believers and glutamine nonbelieversso to say. I am in the not so believing in glutamine camp. We are currently doing stud-ies, and I think that most of the glutamine is being oxidized by the gut in preterminfants. We have measured now about 5 or 6 infants, and almost 90% is being oxi-dized. But that stands aside from a signaling effect that glutamine might have. Fromadult studies in intensive care units many critically ill patients have shown some goodeffect when they were given glutamine. This was not so for the whole population, sothere might be a function of glutamine in gut integrity and maybe on immune func-tion, but I think that the majority of glutamine is being utilized via glutamate andbeing oxidized.
Dr. Yun Cao: From your lecture we can see that most of the amino acids was uti-lized in the first pass. What is the difference between bolus feeding and continuousfeeding in the gut?
Dr. van Goudoever: We didn’t do those kinds of studies. We looked at differentgut hormones when we fed the piglets enterally or in a bolus way or continuously. Ifyou then look at the area under the curve of these specific hormones, there was no dif-ference. The same amount of hormones were being produced. We put in a stomachcatheter and give them a drip in the stomach, and of course the pylorus will alwayslead some fluids from the stomach into the duodenum, so it is a semi-continuous way.To my mind there won’t be any difference whether you feed them via bolus or contin-uously. I think that approximately half of the dietary protein is utilized by the gut, and
van Goudoever et al.
104

actually I don’t think it is different between adults or infants. It might a little bit lowerin adults, but I don’t think so.
Dr. Axelsson: Do you think that consumption in the gut is higher in preterminfants than in term infants?
Dr. van Goudoever: That is also a nice question to which I don’t know the answer.I would think that the requirements would be a little bit higher in preterm than in terminfants as the gut is growing more rapidly.
Dr. Axelsson: What was the protein intake in these preterm infants?Dr. van Goudoever: In total it was 3.6 g/kg/day. So in the first period one third was
given enterally and 2.4 g were given in intravenously, and in the second period theywere fully enterally fed.
Dr. Axelsson: Can you speculate if your results maintain the composition ofpreterm infant formulas?
Dr. van Goudoever: That is also a nice question and not only for preterm infantsbut also, for instance, for children suffering from diarrhea. We now have oral rehydra-tion solutions to replenish the babies that suffer from diarrhea, and I would make anargument that it might be very good to have some amino acids in those solutions. Thesame applies when you start giving a preterm infant enteral nutrition; the proteincomposition of that could be a bit higher than a regular preterm formula in order toget optimal gut function.
Dr. Turck: Did you have a chance to perform experiments in piglets that hadundergone small bowel resection?
Dr. van Goudoever: No I didn’t. What we are doing currently is looking at babieswith small bowel resection following necrotizing enterocolitis (NEC). We are usingthese infants to look at the metabolic fate of the threonine because threonine is amajor substrate for mucin synthesis. We are measuring mucin synthesis in infants withileostomas. But to come back to your question, if you remove part of the intestine Iwould think that the requirements would be much less because the gut is using somuch amino acids.
Dr. Roggero: Could the intestinal utilization of amino acids differ if parenteralnutrition lasts longer than 7 days, for instance in babies who can’t eat by mouth for along time?
Dr. van Goudoever: I agree completely with that. If the intestine is not being usedthen fewer amino acids are needed to maintain the function of the gut. Dr. Pencharzjust said that parenterally fed animals and probably also infants have different require-ments for specific amino acids depending on how they are fed. So if the infants are fedonly intravenously then some of amino acid requirements will become much lowerthan when they are fed enterally.
Dr. Roggero: On the basis of your results, when you start with oral feeding, do youhave to consider the loss related to amino acid utilization by the enterocytes? Whenthe intestine is not used for a long time, is the absorption or utilization of the aminoacids by the intestine different from the normal intestine?
Dr. Van Goudoever: Yes, I think if there is adequate intestinal growth the require-ments will be a little bit higher, but of course there is a huge turnover. As I showed inone of the first slides, and actually Dr. Garlick did some studies on fractional syntheticrates of different organs, you can see that 100% of the protein mass in the gut is beingrenewed every day, and that is in normal living animals, and I think that will be aboutthe same in humans. When you start up having to reuse the gut you probably needsomewhat more, but I don’t think that is a huge difference from a fully enterally fed gut.
Dr. Hernell: You showed that when you reduce the protein intake you increaseoxidation from glucose. Fat is the major source of energy in human milk. How muchare these figures actually affected by the amount of fat given?
Intestinal Amino Acid Metabolism in Neonates
105

Dr. van Goudoever: We didn’t measure fat oxidation by the intestine. When youlower the amino acids the gut has to switch to another fuel source, but we showed thatbasically glucose has not really taken over the place of amino acids. So I think it has tobe either short chain fatty acids or even long chain fatty acids or ketone bodies; I don’tknow what is going to be utilized by the gut, but it might be fat.
Dr. Telmesani: I think more or less along the same line. Would using amino acidsonly with glucose reduce the utilization of amino acids for oxidation and fuel?
Dr. van Goudoever: The studies I showed you were with normal diets containinglactose and fat. This was a regular formula for piglets. If you only feed them aminoacids, I think the fraction that would oxidize would be even higher but we didn’tperform those studies.
Dr. Shiuh-Bin Fang: As we know the absorption of amino acids can be enhancedby peptides [2, 3]. Did you evaluate the effect of peptide, especially when enteral feed-ing was started in your study? Since intestinal growth is so rapid, do you suggest anymethod of monitoring intestinal growth, so that we can modify the introduction ofamino acids?
Dr. van Goudoever: The first question was related to peptide absorption. Whatwe measured here in those balance techniques across portal-drained viscera wereintact proteins. Intact proteins were given to the animals and then we tried to find freeamino acids in the portal vein. Barbara Stoll, one of the coworkers in Houston, tried tomeasure peptides in the portal vein; the peptides should be taken up and released aspeptides in the systemic circulation, but she could not find any. Although we knowthat peptides are being absorbed from the lumen, we think that the majority of theprotein substance is administered, appears as amino acids into the portal vein. Thenyour second question was regarding whether there is a measurement of intestinalgrowth, but basically there is none. There are of course techniques to look at total sur-face area with all kinds of tests, but I don’t think that they are able to pick up small dif-ferences in growth. You have to see whether the infants tolerate the food and that isthe basic way to step up enteral feeding.
Dr. Martinez: I have a comment on oral rehydration solution and the potential useof amino acids. We have been working since 1988 in a WHO task force for improvingoral rehydration solutions, and unfortunately our experience is that neither alaninenor glutamine seem to improve oral rehydration solutions. We believe the reason forthis is due to the impact of osmolarity when amino acids are added to the solution andoften no compensate is made.
Dr. van Goudoever: I agree with the osmolarity issue. Since we have now done allthese studies and if you look at the utilization rates of enterally given amino acids, ala-nine and glutamine might not be the best choice. But there could be other amino acidsor peptides if you want to reduce the osmolarity. Osmolarity is an issue, but in recov-ering a gut, amino acids are important.
Dr. Turck: Do you have any indication on the proportion of amino acids taken upby the gut that is used for the synthesis of mucins? And if so is there any influence ofgestational age and the type of feeding as opposed to artificial feeding?
Dr. van Goudoever: The proportion being secreted, of which the mucins are themajority, is around 15% of total protein intake. That is basically by recalculating all thedata. We are able now to separate mucins but to quantify the amount of mucins pro-duced by humans is very hard because they are very sticky and it is very difficult to getthem all. But by deduction of all numbers I think about 15% is being utilized for mucinsynthesis. If you look at the peptide backbone of mucins there are three specific aminoacids: threonine, serine and proline. They are abundantly present in mucins. Withregard to the second question whether there is a difference in gestational age, basi-cally I don’t know because it is very difficult to do this kind of study.
van Goudoever et al.
106

Dr. Gia Tien Pham: Is there any difference in the digestion and absorption ofamino acids in intact protein and modified protein?
Dr. van Goudoever: Metges et al. [4] have actually looked at this, and there issome difference in absorption but mostly in the metabolic fate. They looked at intrin-sically labeled proteins versus free amino acids and what they observed was that theoxidation rate of free amino acids was higher than of an amino acid in a specific pro-tein. If you look at absorption, especially in newborns and also in older children,almost all milk proteins are being digested completely. So I think that for milk proteinsthe digestion/absorption is virtually complete.
Dr. Mohd Suhaimi Abdul Wahab: As in the first few days of increased growth ofthe gut the need to utilize amino acids is quite high, does an inadequate supply ofamino acids play a role in the pathogenesis of NEC? If we give amino acids in the firstdays of life, would that reduce the incidence of NEC?
Dr. van Goudoever: This is another good question which I don’t know the answerto. We of course know that human milk seems in some way to lower the incidence ofNEC. In our unit, we start enteral nutrition in preterm infants already on the first day oflife and our incidence of NEC is rather low. But next year it might be very high becausein some years there is very low incidence and then suddenly there is a high incidence ofNEC. Basically it is a good question and it needs to be addressed, but the difficulty withthese kinds of studies to lower the incidence of NEC is that you usually need about1,500 infants, making these studies very expensive studies and difficult to conduct.
Dr. Agostoni: In the case of diarrhea do you have an idea of the proportion ofamino acids that are consumed by bacteria and which type of bacteria?
Dr. van Goudoever: In these kinds of studies you cannot sort out what is being con-sumed by bacteria and what is being consumed by the gut because these animals wererunning around, they would have loads of bacteria in their intestine. From a method-ological point of view it is a very interesting question. From a real life situation basicallyit doesn’t matter because we are feeding infants and they will also have intestinal bacte-ria and those bacteria will use some amino acids as well. But the other thing is thatMetges et al. [5] also showed that lysine for instance is produced by intestinal bacteria toa great extent. They actually argued that approximately 15–20% of the systemic avail-ability of lysine was derived from bacterial production. So on one hand bacteria can bebig consumers but on the other hand they can be producers of essential amino acids.
Dr. Do Van Dung: You said that in developed countries when you perform oralrehydration, you provide more amino acids in the solution. But we are afraid that if weput more amino acids into the solution it will increase the osmolarity of the solutionand have a negative impact on diarrhea, and it might create a better environment forthe bacteria to develop. What is your advice?
Dr. van Goudoever: I agree with the osmolarity issue, but there are ways to solvethis by giving dipeptides, tripeptides, so you would reduce the osmolarity by a factorof 2 or even 3. Also inducing a good bacterial load in the intestine would actually helpreduce the severity of diarrhea. There are studies with pre- and probiotics inHonduras that actually show that they are good in lowering the incidence and thetime of diarrhea. But I think the osmolarity can be dealt with, but it would make oralrehydration solutions far more expensive.
References
1 Neu J, Roig JC, Meetze WH, et al: Enteral glutamine supplementation for very low birthweight infants decreases morbidity. J Pediatr 1997;131:691–699.
2 Erickson RH, Kim YS: Digestion and absorption of dietary protein. Annu Rev Nutr 1992;12:19–35.
Intestinal Amino Acid Metabolism in Neonates
107

3 Banapathy V, Bransch MJ, Leibach FH: Intestinal transport of amino acids and peptides; inJohnson LR (ed): Physiology of the Gastrointestinal Tract, ed 3. New York, Raven Press, 1994,pp 1773–1794.
4 Metges CC, El-Khoury AE, Selvaraj AB, et al: Kinetics of L-[1-(13)C]leucine when ingestedwith free amino acids, unlabeled or intrinsically labeled casein. Am J Physiol EndocrinolMetab 2000;278:E1000–E1009.
5 Metges CC, El-Khoury AE, Henneman L, et al: Availability of intestinal microbial lysine forwhole body lysine homeostasis in human subjects. Am J Physiol Endocrinol Metab 1999;277:E597–E607.
van Goudoever et al.
108

Amino Acid Requirements of Infants and Children
Paul B. Pencharza–d, Ronald O. Ballc,d
aResearch Institute, Hospital for Sick Children, Departments of bPaediatrics and cNutritionalSciences, University of Toronto, Toronto, Ont., dDepartment of Agriculture, Food andNutritional Sciences, University of Alberta, Edmonton, Alta., Canada
AbstractNitrogen balances have been conducted in preterm infants, preschool children, and
6- to 10-year-old children to determine dietary indispensable amino acid. A recentreview concluded that the data, being sufficiently uncertain, could not be used as thebasis for defining amino acid requirements in infants and children. Therefore, it wasdecided to use a factorial approach (basal plus growth). This approach is based on theassumption that basal requirements are the same throughout the life cycle. Recently,using indicator oxidation, the requirements of the eight classical indispensable aminoacids have been defined in adults. These values have been used as the basal compo-nent of requirement in childhood. The growth component was based on the changes inbody protein with age. We have recently shown that the maintenance requirements forbranched chain amino acids are similar in children and adults, thereby validating thefactorial approach.
Copyright © 2006 Nestec Ltd., Vevey/S. Karger AG, Basel
Introduction
This review is restricted to the 20 �-amino acids for which t-RNAs exist andhence are part of protein. These amino acids can be divided into the classicalindispensable (essential) amino acids, the conditionally indispensable aminoacids and the dispensable (nonessential) amino acids [1]. The 8 classically indis-pensable amino acids cannot be made by humans and hence must be obtainedfrom the diet, hence dietary requirements have been defined for them. For the9th classical indispensable amino acid in infants and children, histidine, it hasproven impossible to determine its requirements in adults, since it takes �40days to deplete body histidine stores [2]. Conversely, in infants [3] and in youngpigs [4] it has proven straightforward to determine the histidine requirement,
109
Rigo J, Ziegler EE (eds): Protein and Energy Requirements in Infancy and Childhood.Nestlé Nutr Workshop Ser Pediatr Program, vol 58, pp 109–119,Nestec Ltd., Vevey/S. Karger AG, Basel, © 2006.

since body histidine stores are much smaller. The term ‘conditionally indispensa-ble amino acid’ implies that the infant or child is unable to make sufficientamounts of that amino acid and hence all or a part of the daily needs for thatamino acid have to be provided by the diet. For infants the literature evidence isthat only 5 �-amino acids are truly dietary dispensable amino acids, namely, ala-nine, aspartate, asparaginine, glutamate and serine [1].
Components of Requirements
Requirements for �-amino acids are made up of components, namely howmuch is needed for net incorporation into protein, plus that which is neededfor other biological processes. While biologically important, some of theseprocesses such as neurotransmitter synthesis from tyrosine and tryptophanare quantitatively small [5, 6]. Conversely others require significant amountsof the amino acids, namely: (a) cysteine, glutamate and glycine for glutathionesynthesis; (b) arginine for urea cycle activity, and (c) arginine, glycine andmethionine for creatine synthesis [6].
Determination of Amino Acid Requirements
The determination of dietary requirements in infants and children hasproven to be a challenging task. Whatever method is used, graded levels ofthe amino acid under study have to be fed to the subjects, ranging from belowto above the requirement level [7–9], and changes determined in a biologicalresponse. The biological responses which have been used include: nitrogenbalance; plasma amino acid level; direct amino acid oxidation and balance,and indicator amino acid oxidation and balance [5, 8]. Plasma amino acid lev-els have not proven to be useful except possibly for tryptophan [8]. Nitrogenbalances have been conducted in preterm infants [3, 10, 11], preschool chil-dren [12], and 6- to 10-year-old children [13–17] to determine dietary indis-pensable amino acid. As recent extensive review of this work concluded thatthe data were sufficiently uncertain so that they could not be used as thebasis for defining dietary indispensable amino acid requirements in infantsand children [5]. Direct oxidation and balance are limited to the few aminoacids whose carboxyl group is released as soon as the amino acid is committedto degradation and, in addition, there are several potential biological limitationswith direct oxidation/balance which have been reviewed in detail [8]. Hence,indicator oxidation and balance are regarded as the optimal methods todetermine dietary indispensable amino acids [5, 8, 18]. There is some dis-agreement as to how much adaptation time is needed prior to conducting aindicator study at a particular level of intake of the test amino acid [5, 8]. Ithas long been known that if nitrogen balance is used as the method to determine
Pencharz/Ball
110

the requirement it takes 7 days to achieve equilibrium in the body urea pooland in urinary urea excretion. Hence if nitrogen balance is used then subjectsmust be adapted on the test intake for a minimum of 7 days. It is unaccept-able to place an infant or young child on a markedly deficient level of testamino acid intake for 7–10 days (7 days of adaptation plus 3 days to conductthe nitrogen balance study). Conversely the indicator method is based on thepartitioning of the indicator amino acid between net incorporation into pro-tein or oxidation. In which case the adaptation needed does not relate in any-way to the urea pool but does relate to the turnover of acylated t-RNAs,which is a matter of a few hours [8]. Therefore we have developed a minimallyinvasive method to determine essential amino acid requirements in infantsand children which uses fed state as an indicator of oxidation [7–9, 19, 20].
Since there are limited published data on dietary amino acid requirementsin children using indicator amino acid oxidation (IAAO), and in light of thedecision not to use the earlier nitrogen balance data [5], it was decided to usea factorial approach to define dietary indispensable amino acid requirementsin infants and children [5, 18]. The factorial approach is based on the assump-tion that the basal requirements of a component are the same throughout thelife cycle and that requirements in infants and children are higher than thosein adults due to growth [5]. Using a combination of IAAO and indicator bal-ance, the requirements of the 8 classical indispensable amino acids haverecently been defined [5, 18] and these have been used as the basal compo-nent of requirement for infants and children. Recent data from the Children’sNutrition Research Center in Houston have provided much improved esti-mates of the growth component and this has been used to define the growthcomponent for each indispensable amino acid [21, 22]. Because of all theassumptions involved in the factorial method, we are in the process of deter-mining dietary indispensable amino acid requirements in children and com-paring them with estimates obtained in adults using the same IAAO method.So far our studies support the use of the factorial method [8, 9, 23, 24].Specifically for branched chain amino acids in 6- to 10-year-old children, theirrequirements approximate the maintenance (adult) requirement plus the smallgrowth component.
Requirement Estimates for Dietary Indispensable Amino Acids
For infants �6 months of age estimates of dietary indispensable aminoacids have been based on the average intake from mother’s milk (table 1).These were calculated based on the average amino acid content of humanmilk protein [5, 18] multiplied by the average protein intake from mother’smilk [5, 18].
For infants �6 months of age, children and adolescents amino acid requ-irement estimates were calculated using the factorial approach described above.
Amino Acid Requirements of Infants and Children
111

The protein deposition estimates used are shown in table 2. Since there wereonly small differences due to gender, it was decided to use an average of theresults for the two genders [18]. Details are given in the footnote to table 3 asto how amino acid requirements were calculated. Briefly, the maintenancepattern derived from adult requirement estimates were multiplied by themaintenance protein requirement (0.686 g protein/kg/day) to calculate themaintenance need for each amino acid, to which was added the growth com-ponent. The growth component is calculated from tissue protein compositionmultiplied by the amino acid content of that tissue protein (table 3). Finally acorrection is made for dietary protein utilization which has been estimated asbeing approximately 58% of the ingested protein. The efficiency factor isderived from the slope as regression analysis of nitrogen balance studies con-ducted in children with a variety of different protein sources [5, 18]. Thesenew estimates of dietary indispensable amino acid requirements differ fromthe previous World Health Organization report [25] to a variable degree asshown in table 4. The variability is less when the estimates are compared as arequirement pattern, namely as milligrams of each amino acid per gram ofprotein intake. The biggest differences are for tryptophan and for the aro-matic amino acid, the sum of phenylalanine and tyrosine. There is no doubtthat the maintenance estimates for the dietary indispensable amino acids arebased on more complete data than were available in 1985 [5, 8, 18]. Similarlythe growth estimates are based on extensive new data [21, 22]. However, it isimportant to mention that the maintenance estimates for the aromatic aminoacid are based on the averaging of two very different results and may be anunderestimate. If that proves to be the case the requirement patterns will
Pencharz/Ball
112
Table 1. Indispensable amino acid intakes in exclusively breast-fed infants
AAA1 HIS ILE LEU LYS SAA1 THR TRP VAL
Average amino acid content of human milk2, mg/g protein
94 21 55 96 69 33 44 17 55
Age, months Amino acid intakes3, mg/kg/day
1 162 36 95 165 119 57 76 29 952 118 26 69 121 87 42 55 21 693 102 23 60 105 75 36 48 19 604 93 21 54 95 68 33 44 17 546 88 20 52 90 65 31 41 16 52
1AAA � Aromatic amino acids, the sum of phenylalanine and tyrosine; SAA � sul-fur amino acids, the sum of methionine and cysteine.
2Values taken from the WHO/FAO/UNO Protein and amino acid report [18].3Protein content in human for each age group (75% crude protein) multiplied by
the average amino acid content as mg/g of protein shown above.

only differ markedly for tryptophan. Clearly, there is a need to directly deter-mine the tryptophan requirements of children.
Requirement Estimates in Disease
The development of the minimally invasive indicator amino acid oxidationmodel for the first time opened the way to directly determine requirementsfor inborn errors of amino acid metabolism: phenylketonuria [19, 20] andmaple syrup urine disease [26]. In addition we have been able to use the indi-cator oxidation technique to determine essential amino acid requirements dur-ing intravenous feeding and compare the results with estimates obtainedduring enteral feeding. The work was conducted initially in neonatal pigletsas a model for human neonates [27, 28] and has been partially confirmed inhuman neonates [29]. Overall this work has shown that the intestinal mucosais active in amino acid metabolism. The key findings are that: up to 60% ofdietary threonine in the neonatal piglet is taken up and used for the synthesis
Amino Acid Requirements of Infants and Children
113
Table 2. Protein deposition for infants and children1
Age, years Protein deposition, g/kg/day
females males combined average
0.5 0.266 0.266 0.2661.0 0.168 0.168 0.1681.5 0.108 0.108 0.1082.0 0.076 0.073 0.0753.0 0.044 0.034 0.0394.0 0.026 0.013 0.0205.0 0.022 0.009 0.0166.0 0.038 0.032 0.0357.0 0.048 0.048 0.0488.0 0.051 0.055 0.0539.0 0.050 0.056 0.053
10.0 0.047 0.054 0.05111.0 0.043 0.050 0.04712.0 0.037 0.045 0.04113.0 0.031 0.041 0.03614.0 0.025 0.036 0.03115.0 0.018 0.032 0.02516.0 0.012 0.027 0.02017.0 0.005 0.023 0.01418.0 0.000 0.018 0.009
1Derived from Butte et al. [21] and Ellis et al. [22], data smoothedusing non-linear regression. For details see [18].

Pencharz/Ball
114
Table 3. Amino acid requirements of infants, children and adolescents
AAA HIS ILE LEU LYS SAA THR TRP VAL
Amino acid content (mg/g protein)
Tissue amino 73 27 35 75 73 35 42 12 49acid pattern1
Maintenance 38 15 30 59 45 22 23 6 39pattern2
Age, years Protein Amino acid requirements5, mg/kg/dayrequirements for
maintenance3 growth4
0.5 0.686 0.46 59 22 36 73 64 31 34 9.5 491–2 0.686 0.19 40 15 27 54 45 22 23 6.4 362–10 0.686 0.06 30 12 23 44 35 18 18 4.8 2910–14 0.686 0.07 30 12 22 44 35 17 18 4.8 2914–18 0.686 0.04 28 11 21 42 33 16 17 4.5 28�18 0.66 nil 25 10 20 39 30 15 15 4.0 26
1Amino acid content of whole body protein [18].2Maintenance amino acid requirements expressed as mg/g of protein per day.3Maintenance protein requirements in childhood and for adults (�18 years) deter-
mined as described by WHO/FAO/UNO Protein and amino acid report [18].4Calculated as an average value from the growth data in table 2 adjusted for a pro-
tein utilization of 58% [18].5Sum of the maintenance protein � the adult maintenance amino acid pattern and
growth (tissue deposition adjusted for a 58% dietary efficiency of utilization � tissueamino acid pattern).
Table 4. Comparison of the factorial requirement estimates for preschool children(1–4 years old) with previous values
AAA ILE LEU LYS SAA THR TRP VAL
Requirement pattern, mg/g protein1985 FAO/WHO Report [25] 69 31 73 64 27 37 13 38New WHO/FAO Report [18] 40 27 55 45 22 24 6.4 36Ratio New/1985 values 0.60 0.87 0.75 0.70 0.81 0.65 0.49 0.95
Requirement pattern, mg/g protein1985 FAO/WHO Report [25] 63 28 66 58 25 34 11 35New WHO/FAO Report [18] 47 32 64 53 27 28 7.5 42Ratio New/1985 values 0.75 1.14 0.97 0.91 1.08 0.82 0.68 1.2

of intestinal mucins [27, 28]; about 40% of the branched chain amino acids areoxidized, and the gut is necessary for arginine synthesis [27, 28].
Future Directions
More work needs to be conducted to verify whether the factorial method ofcalculating dietary indispensable amino acid requirements is valid in infants aswell as in children. Chronic diseases such as liver and kidney failure are know toalter amino acid metabolism and hence may also alter dietary indispensableamino acid requirements [8, 9]. The minimally invasive indicator model makesstudies possible in these chronically ill children. Of much larger public healthimportance, many of the world’s children live in poverty and have chronic diar-rheal illnesses. We believe that this increases their amino acid requirementsand there is a need to define by how much.
References
1 Pencharz PB, House JD, Wykes LJ, Ball RO: What are the essential amino acids for thepreterm and term infant? 10th Nutricia Symposium. Dordrecht, Kluwer Academic, 1996, vol 21,pp 278–296.
2 Kriengsinyos W, Wykes LJ, Ball RO, Pencharz PB: Is histidine an indispensable amino acid inhealthy adults. J Nutr 2002;132:3340–3348.
3 Snyderman SE, Boyer A, Roitman E, et al: The histidine requirement of the infant. Pediatrics1963;31:786–802.
4 Kim KI, McMillan I, Bayley HS: Determination of amino acid requirements of young pigs usingindicator amino acid. Br J Nutr 1983;50:369–382.
5 Garlick P, Pencharz PB, Reeds P: Protein and amino acids; in Panel on Macronutrients:Dietary Reference Intakes Energy, Carbohydrate. Fiber, Fat, Fatty Acids, Cholesterol, Proteinand Amino Acids. Institute of Medicine, National Academy of Sciences. Washington, NationalAcademies Press, 2002, pp 589–768.
6 Young VR: Protein and amino acids; in Bowman BA, Russell RM (eds): Present Knowledge inNutrition. Washington, ILSI Press, 2001, pp 43–58.
7 Pencharz PB, Ball RO: How to assess amino acid requirements; in Bachmann C, Koletzko B(eds): Genetic Variation and Nutrition. Nestlé Nutrition Workshop Series Pediatric Program.Vevey/Philadelphia, Nestec/Lippincott Williams & Wilkins, 2002, vol 50, pp 37–50.
8 Pencharz PB, Ball RO: Different approaches to define individual amino acid requirements.Annu Rev Nutr 2003;23:101–116.
9 Pencharz PB, Ball RO: Amino acid needs for early growth and development. J Nutr2004;134:1566S–1568S.
10 Holt L, Snyderman SE: The amino acid requirements of infants. Nutr Abstr Rev 1965;35:1–13.11 Snyderman SE, Holt LE Jr, Dancis J, et al: ‘Unessential’ nitrogen: a limiting factor for human
growth. J Nutr 1962;78:57–72.12 Pineda O, Torun B, Viteri FE, Arroyave G: Protein quality in relation to estimates of essential
amino acid requirements; in Bodwell CE, Adkins JS, Hopkins DT (eds): Protein Quality inHumans: Assessment and in vitro Estimation. Westport, AVI, 1981, pp 29–42.
13 Nakagawa I, Takahashi T, Suzuki T, Kobayashi K: Amino acid requirements of children: nitro-gen balance at the minimal level of essential amino acids. J Nutr 1964;83:115–118.
Amino Acid Requirements of Infants and Children
115

14 Nakagawa I, Takahashi T, Suzuki T, Kobayashi K: Amino acid requirements of children: mini-mal needs for threonine, valine and phenylalanine based on nitrogen balance method. J Nutr1962;77:61–68.
15 Nakagawa I, Takahashi T, Suzuki T, Kobayashi K: Amino acid requirements of children: mini-mal needs for tryptophan, arginine and histidine based on nitrogen balance method. J Nutr1963;80:305–308.
16 Nakagawa I, Takahashi T, Suzuki T: Amino acid requirements of children: isoleucine andleucine. J Nutr 1961;73:186–190.
17 Nakagawa I, Takahashi T, Suzuki T: Amino acid requirements of children: minimal needs oflysine and methionine based on nitrogen balance method. J Nutr 196;74:401–406.
18 Protein and amino acid requirements of infants and children. Report of a Joint WHO/FAO/UNU Expert Consultation: Protein and Amino Acid Requirements in Human Nutrition. WorldHealth Organ Tech Rep Ser 2005, in press.
19 Bross R, Ball RO, Clarke JTR, Pencharz PB: Tyrosine requirements in children with classicalPKU determined by indicator amino acid oxidation. Am J Physiol 2000;278:E195–E201.
20 Courtney-Martin G, Bross R, Rafii M, et al: Phenylalanine requirement in children with classi-cal phenylketonuria determined by indicator amino acid oxidation. Am J Physiol 2002;283:E1249–E1256.
21 Butte NF, Hopkinson JM, Wong WW, et al: Body composition during the first 2 years of life: anupdated reference. Pediatr Res 2000;47:578–585.
22 Ellis KJ, Shypailo RJ, Abrams SA, Wong WW: The reference child and adolescent models ofbody composition. A contemporary comparison. Ann NY Acad Sci 2000;904:374–382.
23 Mager DR, Wykes LJ, Ball RO, Pencharz PB: Branched chain amino acid requirements inschool aged children determined by indicator amino acid oxidation (IAAO). J Nutr 2003;133:3540–3545.
24 Riazi R, Wykes LJ, Ball RO, Pencharz PB: Requirement of total branched chain amino acidsdetermined by indicator amino acid oxidation using L-[1-13C]phenylalanine. J Nutr 2003;133:1383–1389.
25 Energy and protein requirements. Report of a Joint FAO/WHO/UNU Expert Consultation.World Health Organ Tech Rep Ser 1985;724:1–206.
26 Riazi R, Clarke J, Ball RO, Pencharz PB: Total branched chain amino acid requirement inpatients with maple syrup urine disease by use of indicator amino acid oxidation using L-[13C]phenylalanine. Am J Physiol 2004;287:E142–E149.
27 Bertolo RFP, Pencharz PB, Ball RO: Role of intestinal first-pass metabolism on whole bodyamino acid requirements; in Burrin DG, Mersmann HJ (eds): Biology of Metabolism inGrowing Animals. New York, Elsevier, 2005, pp 127–156.
28 Brunton JA, Ball RO, Pencharz PB: Current total parenteral nutrition solutions for theneonate are inadequate. Curr Opin Clin Nutr Metab Care 2000;3:299–304.
29 Roberts SA, Ball RO, Moore AM, et al: The effect of graded intake of glycyl-L-tyrosine onphenylalanine and tyrosine metabolism in parenterally-fed neonates, with an estimation oftyrosine requirements. Pediatr Res 2001;49:111–119.
Discussion
Dr. van Goudoever: Thank you very much and congratulations on all the workyou have done in improving all these requirements. The figures you showed onbranched chain amino acid requirements in adults versus 6- to 10-year-old childrensaying that 6 mg/kg/day is the amount needed for growth, have you calculated howmuch g/kg/day that is and whether it would fit the normal growth pattern of infants ofthat age?
Dr. Pencharz: Those were actually based on the data of Butte et al. [1] and Elliset al. [2] in children 6–10 years of age and then corrected for utilization; so that is thenumber we came up with. Now the actual direct isotope breakpoint we think reallyreflects expenditure. In one day the growth component cannot actually be measuredanymore than with doubly labeled water; you are just measuring the expenditure. In
Pencharz/Ball
116

our case it is an 8-hour period; in Dr. Butte’s case with the doubly labeled water it is 5,3 days, whatever, and then adding the growth on top of that.
Dr. van Goudoever: But if I understood correctly, the requirements were 1.43 foradults and 1.47 for 6- to 10-year-olds, and those were measured by your indicator ofamino acids?
Dr. Pencharz: That is correct.Dr. van Goudoever: And so the 6 mg/kg/day is calculated separately.Dr. Pencharz: The 1.43 and 1.47 are the numbers we actually found. I will admit
that we did not initially interpret our data completely correctly. We said there is a dif-ference there of 4, and 6 and 4 are very close. So we come to realize that in piglets withthe rapid growth we are measuring the growth component as well as maintenance. Inour studies in the slow growing children we are measuring only maintenance, we arenot measuring the growth component.
Dr. van Goudoever: Because the 6 mg would not represent let’s say 2 g/kg/day ofgrowth.
Dr. Pencharz: I can’t remember but you have to go back and see what they aregrowing and what proportion of that is the three branched amino acids, etc.
Dr. Dewey: One of the issues that I think is interesting to explore is the assump-tion that in the first 6 months human milk does meet all the essential amino acidrequirements. Does that fit with your estimates of requirements from 6 monthsonward? I was just comparing your tables showing intake from human milk and therequirements. It looks as though for most of them intakes are higher than require-ments, except for histidine, lysine and the sulfur amino acids it is very close. Couldyou comment on that?
Dr. Pencharz: It is a really good question, and we don’t know because the data justdon’t exist. The human milk data are based on analysis of the true protein amino acidcomposition plus adding free amino acids on top, and so it is just like being anaccountant and adding everything together. We are in the process of doing measure-ments using indicator oxidation techniques in neonates and we hope to have estimatesfor both the enteral and parenteral requirements of branched chains of threonine andso on. But that hasn’t been done yet, so we don’t really have good data. Peter Reedsand I have tried to subject the Holt and Snyderman data [3] to nonlinear regression butthe data are too weak, so we don’t have a good estimate. At the moment, we needmore data to be able to answer your question.
Dr. Garlick: The major difference between your approach with the indicator andthe approach that other people have used previously, either with isotopes or nitrogenbalance, is the adaptation issue. Even when using an indicator method, people havestill used the traditional adaptation period of a couple of weeks on each diet becausethey felt that this was required for the enzymes to readapt to the new level. You don’t;you use the time it takes for the subject to start with the meals with the new aminoacid content, a few hours rather than 2 weeks. Could you elaborate on why it is thatyou feel that you can dispense with this adaptation period?
Dr. Pencharz: I did mention adaptation briefly in my written paper but I haven’tbrought any slides. The adaptation business really relates to the urea pool. The ureapool in the body is distributed within body water, so 60% of our body composition asadults is water. Rand et al. [4] showed years ago that the adaptation when you go fromone level of protein to another or one level of amino acid to another is 5–7 days; so thatis what is behind Dr. Garlick’s question. The big question is does this apply to enzymeadaptation with regard to oxidation of an indicator amino acid and to formation oftransfer RNA and protein synthesis. We thought not, and in fact in our piglet studiessuggested that this was not the case and it was not necessary. So in our first studies inhumans we actually looked at two very different levels of phenylalanine intake and
Amino Acid Requirements of Infants and Children
117
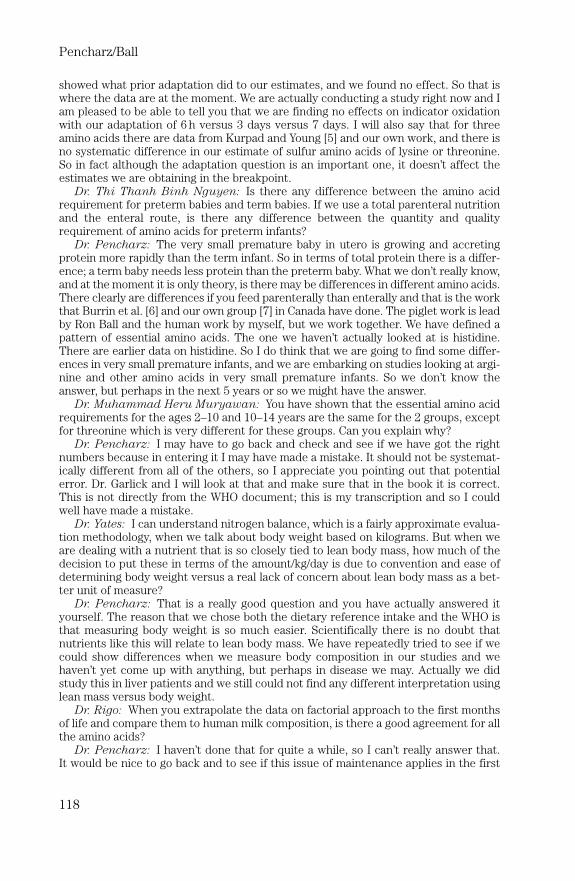
showed what prior adaptation did to our estimates, and we found no effect. So that iswhere the data are at the moment. We are actually conducting a study right now and Iam pleased to be able to tell you that we are finding no effects on indicator oxidationwith our adaptation of 6 h versus 3 days versus 7 days. I will also say that for threeamino acids there are data from Kurpad and Young [5] and our own work, and there isno systematic difference in our estimate of sulfur amino acids of lysine or threonine.So in fact although the adaptation question is an important one, it doesn’t affect theestimates we are obtaining in the breakpoint.
Dr. Thi Thanh Binh Nguyen: Is there any difference between the amino acidrequirement for preterm babies and term babies. If we use a total parenteral nutritionand the enteral route, is there any difference between the quantity and qualityrequirement of amino acids for preterm infants?
Dr. Pencharz: The very small premature baby in utero is growing and accretingprotein more rapidly than the term infant. So in terms of total protein there is a differ-ence; a term baby needs less protein than the preterm baby. What we don’t really know,and at the moment it is only theory, is there may be differences in different amino acids.There clearly are differences if you feed parenterally than enterally and that is the workthat Burrin et al. [6] and our own group [7] in Canada have done. The piglet work is leadby Ron Ball and the human work by myself, but we work together. We have defined apattern of essential amino acids. The one we haven’t actually looked at is histidine.There are earlier data on histidine. So I do think that we are going to find some differ-ences in very small premature infants, and we are embarking on studies looking at argi-nine and other amino acids in very small premature infants. So we don’t know theanswer, but perhaps in the next 5 years or so we might have the answer.
Dr. Muhammad Heru Muryawan: You have shown that the essential amino acidrequirements for the ages 2–10 and 10–14 years are the same for the 2 groups, exceptfor threonine which is very different for these groups. Can you explain why?
Dr. Pencharz: I may have to go back and check and see if we have got the rightnumbers because in entering it I may have made a mistake. It should not be systemat-ically different from all of the others, so I appreciate you pointing out that potentialerror. Dr. Garlick and I will look at that and make sure that in the book it is correct.This is not directly from the WHO document; this is my transcription and so I couldwell have made a mistake.
Dr. Yates: I can understand nitrogen balance, which is a fairly approximate evalua-tion methodology, when we talk about body weight based on kilograms. But when weare dealing with a nutrient that is so closely tied to lean body mass, how much of thedecision to put these in terms of the amount/kg/day is due to convention and ease ofdetermining body weight versus a real lack of concern about lean body mass as a bet-ter unit of measure?
Dr. Pencharz: That is a really good question and you have actually answered ityourself. The reason that we chose both the dietary reference intake and the WHO isthat measuring body weight is so much easier. Scientifically there is no doubt thatnutrients like this will relate to lean body mass. We have repeatedly tried to see if wecould show differences when we measure body composition in our studies and wehaven’t yet come up with anything, but perhaps in disease we may. Actually we didstudy this in liver patients and we still could not find any different interpretation usinglean mass versus body weight.
Dr. Rigo: When you extrapolate the data on factorial approach to the first monthsof life and compare them to human milk composition, is there a good agreement for allthe amino acids?
Dr. Pencharz: I haven’t done that for quite a while, so I can’t really answer that.It would be nice to go back and to see if this issue of maintenance applies in the first
Pencharz/Ball
118

6 months, and is our backward extrapolation correct, but the answer is we haven’tdone it recently. When we have looked at it approximately rather than systematically,it looked as though it was right, but we haven’t done it systematically.
Dr. Dewey: You mentioned that the maintenance requirement was determined tobe similar between 6- and10-year-old children and adults. How much evidence do wehave that this is also true under 12 or 6 months of age?
Dr. Pencharz: We don’t know the answer. I can only fall back on animal studieswhich we have done in pigs. It looks as though the maintenance in newborn pigs is thesame as in adult pigs, so it is likely true in humans as well.
References
1 Butte NF, Hopkinson JM, Wong WW, et al: Body composition during the first 2 years of life: anupdated reference. Pediatr Res 2000;47:578–585.
2 Ellis KJ, Shypailo RJ, Abrams SA, Wong WW: The reference child and adolescent models ofbody composition. A contemporary comparison. Ann NY Acad Sci 2000;904:374–382.
3 Holt L, Snyderman SE: The amino acid requirements of infants. Nutr Abstr Rev 1965;35:1–13.4 Rand WM, Young VR, Scrimshaw NS: Change of urinary nitrogen excretion in response to low-
protein diets in adults. Am J Clin Nutr 1976;29:639–644.5 Kurpad AV, Young VR: What is apparent is not always real: lessons from lysine requirement
studies in adult humans. J Nutr 2003;133:1227–1230.6 Burrin DG, Stoll B, Chang X, et al: Parenteral nutrition results in impaired lactose digestion
and hexose absorption when enteral feeding is initiated in infant pigs. Am J Clin Nutr 2003;78:461–470.
7 Elango R, Goonewardene LA, Pencharz PB, Ball RO: Parenteral and enteral routes of feedingin neonatal piglets require different ratios of branched-chain amino acids. J Nutr 2004;134:72–78.
Amino Acid Requirements of Infants and Children
119


Effects of High Protein Intakes
Irene Axelsson
Department of Pediatrics, University of Lund, Lund, Sweden
AbstractAmong other nutrients of breast milk, the amino acid pattern is considered norma-
tive throughout infancy. Exclusive breastfeeding by a healthy mother should be thestandard from birth to 6 months. During the breastfeeding period the protein intake islow in the human being compared too many other animals. The protein content inbreast milk is about 1 g/100 ml and the daily protein intake approximately 1 g/kg/day.When other foods are introduced during the weaning period the protein intakeincreases remarkably to 3–4 g/kg/day in spite of the fact that the protein requirementis decreasing. The long-term consequences of this phenomenon are obscure. A highprotein intake has endocrine effects, such as the high levels of insulin and insulin-likegrowth factor-1. Furthermore, the metabolic effects with high levels of urea in serumand urine, and the high levels of many amino acids may exceed the capacity of thehepatic and renal systems to metabolize and excrete the excess of nitrogen. This maylead to acidosis and hypernatremic dehydration during periods of fever and diarrhea.Whether the risk of obesity later in life is decreased because of a low intake of proteinduring the breastfeeding period is still obscure.
Copyright © 2006 Nestec Ltd., Vevey/S. Karger AG, Basel
During the breastfeeding period, protein intake is low in the human beingcompared too many other animals. The protein content of breast milk is about1 g/100 ml and the daily protein intake approximately 1 g/kg/day. During theweaning period, protein intake increases remarkably, even after the first yearof life. There is a shift from about 1 to 3–4 g/kg/day in spite of the fact that theprotein requirement is decreasing. The long-term consequences of this phe-nomenon are obscure. A high protein intake may have both endocrine, meta-bolic, physiologic effects and may increase the risk of obesity.
Studies in humans are still surrounded by a number of uncertainties. Fewstudies have addressed the nutritional needs of infants at the time of weaningand the long-term consequences of the changes in the diet.
121
Rigo J, Ziegler EE (eds): Protein and Energy Requirements in Infancy and Childhood.Nestlé Nutr Workshop Ser Pediatr Program, vol 58, pp 121–131,Nestec Ltd., Vevey/S. Karger AG, Basel, © 2006.

Here the methods by which the international recommendations for pro-tein intake have been determined will be discussed. Furthermore the meta-bolic, endocrine and physiologic effects of a high protein intake will beconsidered.
Requirement and Recommended Protein Intake
of Term Infants
Protein requirement during the first 6 months of life has been estimatedusing the healthy breast-fed infant as a model [1, 2]. Another approach to esti-mate the protein requirement of infants is the theoretical calculations used inthe ‘factorial method’ [2]. This method for calculation of protein requirementsis used especially in infants between 6 and 12 months of age who are not nor-mally exclusively breast-fed. Different authorities give different recommen-dations depending on the method used for calculating the requirement. Thefactorial method consists of two parts, the requirement for maintenance andthe requirement for growth.
The protein requirement for maintenance is that needed to replace lossesthrough urine, feces and the skin. The factorial method uses many assum-ptions such as the adequacy of nitrogen balance data for calculating mainte-nance requirements, the method used for estimation of the needs for growth,the degree of intra-individual variation of growth and the efficiency of con-verting dietary protein to body protein. According to Dewey et al. [3] the pro-tein requirement has been overestimated using this method. Revisedestimates for the mean requirement and safe level of protein intake by Deweyet al. [3] are given in table 1.
In addition to the methods mentioned above, clinical investigations areuseful in which protein intakes are accurately determined and measurementsof growth and protein nutritional status are carried out.
Calculation of Protein Content in Formulas
Authors refer to protein content in infant formula in different ways. Thereare three possible methods to determine the protein content: calculation ofnitrogen content, protein determination, and protein as a sum of amino acids.
Crude protein includes all non-protein nitrogen (NPN)-containing sub-stances. In cow’s milk this NPN amounts to 25–30 mg/100 ml consisting ofurea nitrogen and free amino acids. True protein has been defined most oftenas total nitrogen minus NPN multiplied by the appropriate conversion factor.This calculation excludes nitrogen that is partially metabolically available tothe body. Levels of NPN and urea nitrogen in formulas are dependent on the
Axelsson
122

type of whey used. Ion exchange whey gives the highest concentration (26%)followed by electrodialyzed (14–18%) and ultrafiltrated whey (6–8%) asshown by Donovan and Lönnerdal [4]. The Scientific Committee for Food [5]proposes to determine the crude protein content of all types of infant formulaand follow-on formula as total nitrogen � 6.25. In addition, the NPN contentmust not be higher than 15 of the total nitrogen content in formula based onintact proteins. The recommendation given by the Scientific Committee ofFood for protein content in formula is 1.8 g/100 kcal (minimal protein con-tent) for formula based on intact cow’s milk protein. The maximum value is3.0 g/100 kcal based on all types of protein sources. The same values are pro-posed for follow-on formula.
Metabolic Consequences of Different Protein Intakes
Most metabolic experimental studies of infants have been on formula-fedinfants during the first 3 months of life. Several of these studies have shownthat infants fed formula with a true protein level of 15 g/l or higher haveshown significantly higher plasma levels of several amino acids and ureanitrogen than those found in breast-fed infants [6–12].
A true protein level of 13 g/l has been shown to result in a plasma aminoacid pattern similar to that of breast-fed infants [13]. It should be noted thatbovine casein and whey are quite different from human casein and whey. Acasein-predominant (18:82) formula gives higher concentrations of plasmatyrosine and phenylalanine and lower values of threonine compared to a for-mula with a whey:casein ratio of 60:40 [14]. Picone et al. [13] showed that for-mula with a whey:casein ratio of 50:50 provided an amino acid pattern more
Effects of High Protein Intakes
123
Table 1. Revised estimates for mean requirement andsafe level of protein intake for infants
Age Protein requirement of intake Safe levelmonths g/kg/day g/kg/day
0–1 1.99 2.691–2 1.54 2.042–3 1.19 1.533–4 1.06 1.374–5 0.98 1.255–6 0.92 1.196–9 0.85 1.099–12 0.78 1.02
From: Dewey et al. [3] with permission.

characteristic of that of human milk than any of the widely used infant formu-las with whey:casein ratios of 60:40 or 20:80.
In a series of studies, a low protein formula (13 g/l or 1.8 g/100 kcal) givento infants from 3 to 12 months resulted in serum urea and plasma amino acidconcentrations similar to that found in breast-fed infants [13, 15–17].
In a recent study by Räiha et al. [14, 18] the plasma concentrations ofvaline were 132 (breast-fed), 149 (experimental whey-modified) and 210(standard formula) �mol/l, respectively. For threonine the figures were 124,147 and 201 �mol/l, respectively. Even for cysteine the plasma concentrationsin the infants fed whey-modified low protein were closer to that found inbreast-fed infants [14] (formula closer to the reference Nestlé Workshop,vol 47, suppl, Bachman [14]). Thus an improvement in the amino acid metab-olism was found for several amino acids in this study.
Protein Intake and Growth
Since the theoretical calculations regarding protein requirements are some-what insufficient as pointed out above, clinical experiments are necessary as acomplement.
Räihä et al. [9, 10] published studies in which normal term infants were fedeither human milk, a standard formula (protein 15 g/l, 2.2 g/100 kcal), or a for-mula with reduced protein content of 12 g/l (18 g/100 kcal). Growth was ade-quate in all feeding groups from birth to 3 months of age. At 8 and 12 weeksthe protein intake was significantly higher in infants fed standard formulawhen compared to breast-fed infants or the infants fed the reduced proteinformula: 2.7 vs. 1.6 and 1.7 g/kg/day, respectively. Other studies confirm thatformulas with protein concentrations of 11–12 g/l or 1.6–1.8 g/100 kcal resultin adequate growth rates [13, 15, 19].
Between 4 and 8 months, the mean protein intake in exclusively breast-fedinfants varies between 0.9–1 and 2 g/kg/day [20–22] and in partly breast-fedinfants between 0.85 and 1.5 g/kg/day [16, 20, 23]. In this age group both for-mula feeding and cow’s milk feeding increased the mean protein to 2.74 and4.75 g/kg/day, respectively [15, 19, 24–28]. After 9 months the correspondingprotein intakes were 3.1 and 4.35 g/kg/day in formula and cow’s milk-fed infants[24, 26–28]. Thus, during the weaning period the protein intake increasesremarkably although the requirement decreases.
Infants who were exclusively breast-fed, with a protein intake of0.9 g/kg/day at 9 months [21], had a slower growth rate than formula-fedinfants. Even if supplementary foods were given to breast-fed infants after 4months of age, the weight gain was significantly lower in breast-fed comparedto formula-fed infants between 4 and 18 months [29, 30]. Weight for lengthand skin-fold thickness were also found to be higher in formula-fed infants
Axelsson
124

than in breast-fed infants during this age period [31]. The explanations for thedifference in weight gain may be differences in protein intake together withdifferences in energy intake [24, 29]. If a formula with a protein content of15 g/l is given together with supplementary foods during the first year of life,no deviation from current growth curves has been noticed in the studies thatare currently available [9, 12, 15, 19, 23, 30]. In one published study, thegrowth pattern of infants who were gradually weaned between 3 and 12months of age to a formula with a protein content of 13 g/l did not deviatefrom the standard growth curves [23].
Hormonal Effects and Relation to Growth
The effects of different protein intakes on weight gain, insulin secretion,and plasma concentrations of amino acids have been evaluated in a prospec-tive study involving term infants fed breast milk, low protein formula, or highprotein formula. The urinary C-peptide excretion in the infants fed the highprotein formula was significantly higher than that in the infants fed the lowprotein formula or the breast-fed infants. Weight gain correlated with urinaryC-peptide excretion and with protein intake [32].
These results were confirmed in another study [33]. Between 3 and 12months, 71 healthy infants were breast-fed (BM group) or fed formulas with13, 15 or 18 g/l of protein (F13, F15, F18 groups, respectively) and given thesame weaning foods. Plasma BCAA (isoleucine, leucine, valine) and plasmaC-peptide and urinary C-peptide were analyzed, and weight and length weremeasured at 6 and 12 months.
At 6 months, plasma BCAA was higher in F18 (p � 0.0001), F15(p � 0.0001) and F13 (p � 0.022) than in BM and slightly higher in F18 thanin F13 (p � 0.053; fig. 1). At 12 months, plasma BCAA was higher in F18 thanin BM (p � 0.015). At 6 months, urinary C-peptide was higher (p � 0.017),and at 12 months slightly higher (p � 0.09) in F18 than in BM (fig. 1). PlasmaC-peptide did not differ significantly between the groups at 6 or 12 months.At 6 months, protein intake in formula-fed infants was found to correlate withplasma BCAA (rs � 0.50; p � 0.016) and urinary C-peptide (rs � 0.48;p � 0.017). Plasma BCAA at 6 months in formula-fed infants was found tocorrelate with weight gain between 6 and 12 months (rs � 0.55; p � 0.0084).
In conclusion this study indicates that a higher protein formula induceshigher plasma BCAA and higher insulin release at 6 months than if breastmilk or lower protein formula is given. The effects of breast milk on plasmaBCAA and insulin release persist, though attenuated throughout infancy.Positive correlations between plasma BCAA at 6 months and weight gainbetween 6 and 12 months may indicate that protein intake influences growth.
Furthermore in the same study we evaluated the effects of protein intakeon insulin-like growth factor (IGF)-1 and IGF-binding protein (IGFBP)-1 in
Effects of High Protein Intakes
125

3- to 12-month-old infants fed breast milk or formulas with different proteinconcentrations [34].
During the period 3–6 months, plasma IGF-1 decreased (median 43.0(range 60.0) vs. 37.0 (63.0) �g/l, respectively; p � 0.02) whereas plasmaIGFBP-1 was found to increase (66.0 (164) vs. 90.0 (206) �g/l, respectively;p � 0.012) in breast-fed infants. Plasma IGF-1 and plasma IGFBP-1 thenremained unchanged between 6 and 12 months in breast-fed infants. At 6months, plasma IGF-1 tended to be lower in infants fed formula with 13 g/lprotein than in those fed formula with 18 g/l protein (39.0 (8.0) vs. 43.0(23.0) �g/l, respectively; p � 0.073). At 2 months, plasma IGF-1 was signifi-cantly lower in infants fed formula with 13 g/l of protein than in those fed for-mula with 18 g/l (34.5 (46.0) vs. 46.0 (59.0) �g/l, respectively; p � 0.009; fig.2). Plasma IGFBP-1 was similar in breast-fed and formula-fed groups at 6 and12 months.
Protein intake seems to influence plasma IGF-1 during infancy. Despite anincreasing intake of weaning foods, the influence of breastfeeding on plasmaIGF-1 remains during the second half of infancy.
Axelsson
126
Fig. 1. At 6 months, urinary C-peptide was higher (p � 0.017), and at 12 monthsslightly higher (p � 0.09), in F18 than in BM. At 6 months, insulin-releasing aminoacids (plasma BCAA) were higher in F18 (p � 0.0001), F15 (p � 0.0001) and F13(p � 0.022) than in BM and slightly higher in F18 than in F13 (p � 0.053). At 12months, plasma BCAA were higher in F18 than in BM (p � 0.015). With permissionfrom Åkeson et al. [33].
Urin
ary
C-p
ep
tid
e (nM
) 16
12
8
4
0
BM F13 F15
6 months
F18
Urinary
C-p
ep
tid
e (nM
) 16
12
8
4
0
BM F13 F15
12 months
F18
Pla
sm
a B
CA
A (
µM
) 100
80
40
BM F13 F15
6 months
F18
60
Pla
sm
a B
CA
A (
µM
) 100
80
40
BM F13 F15
12 months
F18
60
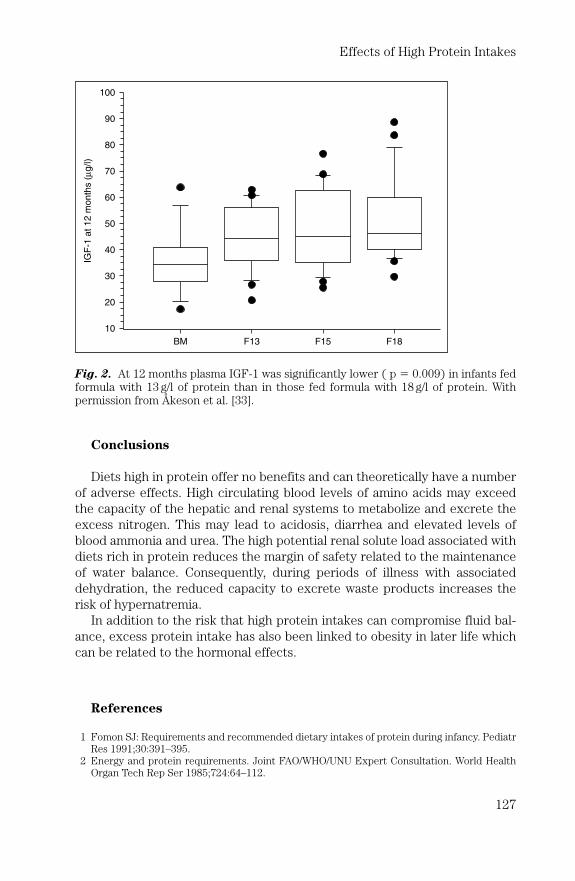
Conclusions
Diets high in protein offer no benefits and can theoretically have a numberof adverse effects. High circulating blood levels of amino acids may exceedthe capacity of the hepatic and renal systems to metabolize and excrete theexcess nitrogen. This may lead to acidosis, diarrhea and elevated levels ofblood ammonia and urea. The high potential renal solute load associated withdiets rich in protein reduces the margin of safety related to the maintenanceof water balance. Consequently, during periods of illness with associateddehydration, the reduced capacity to excrete waste products increases therisk of hypernatremia.
In addition to the risk that high protein intakes can compromise fluid bal-ance, excess protein intake has also been linked to obesity in later life whichcan be related to the hormonal effects.
References
1 Fomon SJ: Requirements and recommended dietary intakes of protein during infancy. PediatrRes 1991;30:391–395.
2 Energy and protein requirements. Joint FAO/WHO/UNU Expert Consultation. World HealthOrgan Tech Rep Ser 1985;724:64–112.
Effects of High Protein Intakes
127
Fig. 2. At 12 months plasma IGF-1 was significantly lower ( p � 0.009) in infants fedformula with 13 g/l of protein than in those fed formula with 18 g/l of protein. Withpermission from Åkeson et al. [33].
IGF
-1 a
t 12 m
onth
s (
µg
/l)
80
70
60
50
40
30
20
10
BM F13 F15 F18
100
90

3 Dewey KG, Beaton GH, Fjeld B, et al: Protein requirements of infants and children. Eur J ClinNutr 1996;50(suppl 1):S119–S150.
4 Donovan SM, Lönnerdal B: Non-protein nitrogen and true protein in infant formulas. ActaPaediatr Scand 1989;78:497–504.
5 European Commission: Report of the Scientific Committee on Food on the Revision ofEssential Requirements of Infant Formulae and Follow-on Formulae. Brussels, COM, 2003.
6 Järvenpää AL, Räihä NCR, Rassin DK, Gaull GE: Milk protein quantity and quality in the terminfant I. Metabolic responses and effects on growth. Pediatrics 1982;70:214–220.
7 Järvenpää AL, Rassin DK, Räihä NCR, Gaull GE: Milk protein quantity and quality in the terminfant I. Effects on acidic and neutral amino acids. Pediatrics 1982;70:221–230.
8 Janas LM, Picciano MF, Hutch TF: Indices of protein metabolism in term infants fed humanmilk whey-predominant formula or cow’s milk formula. Pediatrics 1985;75:775–784.
9 Räihä N, Minoli I, Moro G, et al: Milk protein intake in term infants II. Acta Paediatr Scand1986;75:887–892.
10 Räihä N, Minoli I, Moro G: Milk protein intake in term infants I. Acta Paediatr Scand1986;75:881–886.
11 Axelsson I, Borulf S, Abildskov K, et al: Protein and energy intake during weaning. III. Effectson plasma amino acids. Acta Paediatr Scand 1988;77:42–48.
12 Lönnerdal B, Chen CL: Effect of formula protein level and ratio on infant growth, plasmaamino acids and serum trace elements. Acta Paediatr Scand 1990;79:257–265.
13 Picone TA, Benson JD, Moro G, et al: Growth, serum biochemistries, and amino acids in terminfants fed formulas with amino acid and protein concentrations similar to human milk.J Pediatr Gastroenterol Nutr 1989;9:351–360.
14 Räiha NC, Fazzolari-Nesci A, Cajozzo C, et al: Protein quantity and quality; in Räiha NC,Rubaltelli FF (eds): Infant Formula: Closer to the Reference. Nestlé Workshop SeriesPediatric Program. Vevey/Philadelphia, Nestec/Lippincott Williams & Wilkins, 2002, vol 47,pp 111–120.
15 Janas LM, Picciano MF, Hatch TF: Indices of protein metabolism in term infants fed eitherhuman milk or formula with reduced protein concentration and various whey/casein ratios.J Pediatr 1987;110:838–848.
16 Axelsson IE, Jakobsson I, Räihä NC: Formula with reduced protein content: effects on growthand protein metabolism during weaning. Pediatr Res 1988:24:297–301.
17 Karlsland Åkeson PM, Axelsson IEM, Räihä NCR: Protein and amino acid metabolism in threeto twelve-month-old infants fed human milk or formulas with varying protein concentrations.J Pediatr Gastrenterol Nutr 1998;26:297–304.
18 Räiha NC, Fazzolari-Nesci A, Cajozzo C, et al: Whey predominant, whey modified infant for-mula with protein/energy ratio of 1.8 g/100 kcal: adequate and safe for term infants from birthto four months. J Pediatr Gastroenterol Nutr 2002;35:275–281.
19 Lönnerdal B, Chen C-L: Effects of formula protein level and ratio on infant growth, plasmaamino acids and serum trace elements. II. Follow-up formula. Acta Pediatr Scand1990;79:266–273.
20 Dewey KG, Beaton GH, Fjeld B, et al: Protein requirement of infants and children. Eur J ClinNutr 1996;50(suppl 1):119–150.
21 Salmenperä L, Perheentupa J, Siimes MA: Exclusively breast-fed healthy infants grow slowerthan reference infants. Pediatr Res 1985;19:307–312.
22 Butte NF, Wong WW, Ferlic L, et al: Energy expenditure and deposition of breast-fed andformula-fed infants during early infancy. Pediatr Res 1990;28:631–640.
23 Åkeson PM, Axelsson IEM, Räihä NCR: Growth and nutrient Intake in three to twelve-month-old infants fed human milk or formulas with varying protein concentrations. J PediatrGastroenterol Nutr 1998;26:1–8.
24 Kylberg E, Hofvander Y, Sjölin S: Diets of healthy Swedish children 4–24 months old. III.Nutrient intake. Acta Paediatr Scand 1986;75:937–946.
25 Horst CH, Obermann-de Boer GL, Kromhout D: Type of milk feeding and nutrient intake dur-ing infancy. Acta Paediatr Scand 1987;76:865–871.
26 Martinez GA, Ryan AS, Malec DJ: Nutrient intakes of American infants and children fed cow’smilk or infant formula. Am J Dis Child 1985;139:1010–1018.
27 Martinez GA, Ryan AS: Nutrient intake in the United States during the first 12 months of life.J Am Diet Assoc 1985;85:826–830.
Axelsson
128

28 Montalto MB, Benson JD, Martinez GA: Nutrient intakes of formula-fed infants and infants fedcow’s milk. Pediatrics 1985;75:343–351.
29 Axelsson I, Borulf S, Righard L, et al: Protein and energy intake during weaning: I. Effects ongrowth. Acta Paediatr Scand 1987;76:321–327.
30 Dewey KG, Heinig MJ, Nommsen LA, et al: Breast-fed infants are leaner than formula-fedinfants at 1 year of age: The Darling Study. Am J Clin Nutr 1993;57:140–145.
31 Räihä NCR, Axelsson IE: Protein intake during infancy. Scand J Nutr 1996;40:151–155.32 Axelsson IE, Ivarsson SA, Räiha NC: Protein intake in early infancy: effects on plasma amino
acid concentrations, insulin metabolism, and growth. Pediatr Res 1989;26:614–617.33 Åkeson PK, Räihä N, Axelsson I: Insulin release in breast and formula-fed infants during sec-
ond half of infancy. J Pediatr Gastroenterol Nutr 2000;31:87.34 Åkeson PK, Räihä N, Axelsson I: Protein intake: effects of insulin release, insulin-like growth
factor and growth during infancy. J Pediatr Gastroenterol Nutr 2000;31:74.
Discussion
Dr. Haschke: I have a short comment on the formula with lower protein content.The formulas that you are addressing, with 1.8 g of protein/100 kcal are now on themarket, mainly due to the pioneering work of your group and Prof. Räihä. They arenow available for infants who need formula feeding. Our company for example hasintroduced the 1.8 g formula/100 kcal starter formula in 68 countries around the worldalready, and in Viet Nam it will come during the next few weeks. The problem remain-ing is the regulatory framework for follow-up formulas. The protein level of follow-upformulas should go down as well as we all know, and you have demonstrated that.However, our regulatory framework, at least in the European Union and CodexAlimentarius, at present does not allow a reduction in the protein level.
Dr. Axelsson: But the new data from the Scientific Committee for Food say that youcan use the same protein content in a standard infant formula as in a follow-on formula.
Dr. Haschke: Yes, but this is an expressed opinion; it has not been translated inEuropean law so far.
Dr. Axelsson: I think there are still problems with the follow-on formulas in theUnited States.
Dr. Haschke: I am not so sure about the follow-on formulas because in the UnitedStates they play a minor role. It is clear that you can have formulas above1.8 g/100 kcal as far as I am aware.
Dr. Ziegler: May I comment on this? The regulations in the United States are thatevery formula has to be suitable for the entire first year of life. So with a follow-on for-mula you still have to be able to meet the nutrient requirements of very young infants.That is the current rule.
Dr. Axelsson: I think that is good. But don’t you use follow-on formulas later?Dr. Ziegler: In the United States we do not have any follow-on formulas.Dr. Haschke: I think there are soy formulas that have stage 1 and stage 2. Good
Start has just one stage. Maybe one more comment which is also important: in Europethere is the regulation that partially hydrolyzed protein formulas should have a higherprotein concentration than regular formulas, and we are also working towards bring-ing down the protein content in partially hydrolyzed formulas. We feel that the highprotein intake with partially hydrolyzed formulas is unnecessary and once the safetyof reduced protein partially hydrolyzed formulas can be shown, they should also comeonto the market with a protein level of 1.8 g/100 kcal.
Dr. Giovannini: Could you speculate on the possible association between higherprotein intakes in older formulas in the later development of type-1 or type-2 diabetesand the possible link with reduced glucose tolerance? Because everybody speaksabout obesity but glucose intolerance may be interesting.
Effects of High Protein Intakes
129

Dr. Axelsson: I think it is very difficult to speculate. We have a very high frequencyof obesity, even in Sweden. In 4-year-old children we find overweight and obesity inabout 20%, and we have a very high frequency of breastfeeding. I don’t know if a highprotein intake would increase the risk of diabetes. There is so much speculation aboutthat, and in the studies by Åkerblom et al. [1] from Finland they used Nutramigenhydrolysate of casein in infants who have diabetes in the family.
Dr. Giovannini: In the future young investigators must study glucose tolerance inthe older people in our population, especially people born in the 1950s when humanmilk was not used very much. There are a lot of people who receive hypoglycemicdrugs nowadays, and the clinicians forget to ask whether they were breastfed or not.So we need more data, and for this reason we need young investigators to check thisin the future. Years ago there was a study on protein intake at 1 year of age in Italywhere supposedly the Mediterranean diet is tradition [2]. But the Mediterranean dietexists only on paper because in the north of Italy the diet is similar to the middleEuropean diet. In this study we found a protein intake 1.5 times higher than theallowance. Now in every part of the world you see mothers who think that giving moreprotein to children is healthy. This is a problem, it is important not only to think ofweight but also of all the metabolic parameters.
Dr. Pencharz: I just wanted to touch on Dr. Haschke’s question. In the report thatKoletzko et al. [3] put together the recommendation to the Codex AlimentariusCommission is to basically not have a different protein intake, but it has not yet beenagreed upon. First of all it has to be accepted by the Codex and ultimately in terms ofEuropean regulations, but it is moving in that direction.
Dr. Bozo: I have a comment and a question about hypernatremic dehydration andits relation to sodium in infant formula. To make this relation I think it is very impor-tant also to note the sodium concentration in the oral rehydration solution utilizedduring acute gastroenteritis. There are some recommendations to have a lowersodium concentration in the oral rehydration solution. Was this mentioned in thestudy you presented?
Dr. Axelsson: The sodium content in this formula was also high; both sodium andprotein.
Dr. Bozo: What was the sodium concentration in the oral rehydration solutionused during acute diarrhea? Was it high or 60 or 90?
Dr. Axelsson: It was 60, and the baby was given a very small amount, about 25 ml.Dr. Gomes-Pedro: Kidney growth seems to be related to increased IGF-1 produc-
tion with high protein diet. Have you got some data on urinary IGF-1 and kidneygrowth?
Dr. Axelsson: No, I have not.Dr. Yates: When you were talking about complementary feeding, you mentioned
that the high protein intake in the young child was perhaps too high because of thetypes of foods that were being given to the children or the very young child. Whattypes of food would you suggest as a better source of weaning foods?
Dr. Axelsson: I can speculate. I think it is very difficult to come down to therequirement and the recommendation. You have to change a lot in the diet. Cow’s milkis good for calcium and perhaps we should fortify it. You need meat for iron. It is diffi-cult; it is a paradox.
Dr. Shiuh-Bin Fang: I am quite interested in what you said about the changes inkidney size between 3- and 18-month-old infants [4]. If there is an adaptation of kidneysize, is it possible to find any functional changes or long-term defects after a transientrenal adaptation? If it is an anatomic phenomenon, do you perform any functionalevaluation on those babies who are formula-fed or partially formula-fed, such as hor-monal tests or their long-term outcome?
Axelsson
130

Dr. Axelsson: In studies in rats for example, more has been shown about thefunction and the long-term effects. I can’t answer regarding the long-term effects inchildren.
Dr. Shiuh-Bin Fang: Some changes in the kidney size are seen, however we don’tknow whether or not there are any long-term effects such as a hormone defect; hyper-tension may even develop in these babies.
Dr. Axelsson: Changes in the glomerular infiltration rate have been shown in ratsfor example, and also we have shown higher values of creatinine in urine. But I can’tsay more about that.
Dr. Turck: The Danish group of Hoppe et al. [5] showed that there was a strongrelationship between protein intake in infancy and final height. On the other hand,even if the literature is contradictory, it has been suggested that there is a relationbetween growth rate, meaning length not weight, and an increased risk of cancer. Doyou think that there might be a bridge between high protein intake and infancy andrisk of cancer in adulthood?
Dr. Axelsson: I forgot to mention the study from Denmark. We are looking at thesechildren who are now 7 years old, but I can’t answer your question.
Dr. Ziegler: Could I ask you a sort of philosophical question? Why is there such astrong tendency in most cultures to provide older infants and toddlers with undulyhigh protein intakes? Is it that the mothers think it is good, or why is it?
Dr. Axelsson: I think it is tradition.Dr. Telmesani: A question for Dr. Haschke. In the formulas that are partially
hydrolyzed, why do we need to go higher on the proteins? Are we losing some of theproteins in the process of hydrolyzation?
Dr. Haschke: The EU initially recognized that measurements such as nitrogen bal-ance in animals indicated lower protein retention from hydrolyzed formulas. Howeverthis was the first generation of hydrolyzed formulas. In the meantime, considerableprogress has been made in the process of protein hydrolysis. Indeed, Dr. Ziegler hasdone a balance study with such a new formula showing that with 1.8 or 1.9 g/100 kcal,protein nutrition is perfectly adequate. So it was an improvement in technology thatnow allows us to decrease the protein content in hydrolyzed formulas.
References
1 Akerblom HK, Virtanen SM, Ilonen J, et al: Dietary manipulation of beta cell autoimmunity ininfants at increased risk of type 1 diabetes: a pilot study. Diabetologia 2005;48:829–837.
2 Agostoni C, Riva E, Scaglioni S, et al: Dietary fats and cholesterol in Italian infants and chil-dren. Am J Clin Nutr 2000;72(suppl):1384S–1391S.
3 Koletzko B, Baker S, Cleghorn G, et al: Global standard for the composition of infant formula:recommendations of an ESPGHAN coordinated international expert group. J PediatrGastroenterol Nutr 2005;41:584–599.
4 Schmidt IM, Damgaard IN, Boisen KA, et al: Increased kidney growth in formula-fed versusbreast-fed healthy infants. Pediatr Nephrol 2004;19:1137–1144.
5 Hoppe C, Molgaard C, Thomsen BL, et al: Protein intake at 9 mo of age is associated with bodysize but not with body fat in 10-y-old Danish children. Am J Clin Nutr 2004;79:494–501.
Effects of High Protein Intakes
131


Physiology of Food Intake Regulation:Interaction with Dietary Components
G. Harvey Anderson, Alfred Aziz, Rania Abou Samra
Department of Nutritional Sciences, University of Toronto, Toronto, Ont., Canada
AbstractFood intake is regulated in both the short- and long-term by a complex physiolog-
ical system that involves neuroendocrine pathways that are both distinct and overlap-ping. The underlying causes and mechanisms of the dysregulation of food intake inobesity is poorly understood; however, it is clear that dietary components interactwith the physiological determinants of food intake and can cause profound alterationsduring the development of control mechanisms. The objective of this review is to dis-cuss possible food solutions to the obesity epidemic based on our current understand-ing of food intake regulation and its interaction with dietary components. First, thephysiology of long- and short-term food intake regulation is reviewed. The effects ofdietary components on food intake, satiety and intake regulatory markers are thendiscussed with particular emphasis on macronutrient class and source. Finally, theimpact of nutritional manipulations during the early stages of development on foodintake and metabolic regulation is examined, followed by a brief description of thepossible genetic and epigenetic mechanisms involved.
Copyright © 2006 Nestec Ltd., Vevey/S. Karger AG, Basel
Introduction
Food intake is controlled by an extraordinarily complex system. The urgencyto understand the system is obvious in order to determine how physiologymight contribute, or be harnessed, to reverse the current epidemic of obesity.Progress is being made in understanding the complexity of the system, but itis clear that evolution has built in sufficient room for conservation of energyso that in an environment of plentiful food and limited activity the majority ofindividuals accumulate excess energy.
133
Complementary Foods
Rigo J, Ziegler EE (eds): Protein and Energy Requirements in Infancy and Childhood.Nestlé Nutr Workshop Ser Pediatr Program, vol 58, pp 133–145,Nestec Ltd., Vevey/S. Karger AG, Basel, © 2006.

A genetic or pharmacologic solution does not appear likely in the nearfuture. Although more than 600 genes that play a role in obesity and its disor-ders have been identified [1], a fundamental change in the genome would nothave occurred concurrently with the increase in obesity over the past 30years. In addition, the connectivity and integration of brain and peripheralcircuits associated with feeding is characterized by redundancy. That is, thefeeding circuit can rearrange itself even if one of the components of the sys-tem is removed or enhanced [2], suggesting that a single and safe drug solu-tion might be unlikely for either prevention or treatment of obesity.
Of some certainty, however, is the fact that the interaction of genes withlifestyle and the food supply is a strong contributor to the obesity epidemic.There is very limited understanding, yet, of how environmental factors affectthe development and function of physiological mechanisms of food intakecontrol [3]. Thus, it is unclear whether obesity and its associated disordersdevelop in susceptible individuals because the physiological mechanisms offood intake control are compromised first, beginning in utero, or if they aresimply overridden by the environment and become compromised later.Because the focus of this review is on the physiology of intake regulation,lifestyle will not be considered. Rather the goal is to determine if there is afood solution to intake control. Food triggers multiple physiologic responsesthat induce satiety, and its components may cause profound alterations dur-ing the development of control mechanisms.
The question to be examined is: Arising from the new advances of under-standing the circuitry, anatomy, and neurochemical processes involved in intakecontrol, do we have new insights on food characteristics that interact with theintake regulatory system? If not, what might be emerging as a solution?
To encourage a discussion of this question, a background review of theintake regulatory system is provided first, followed by an examination of theinteraction of dietary components with intake control mechanisms.
Physiology of Intake Regulation
Food intake is regulated in the central nervous system, which receivesinput from sensory properties of food, mechanical and chemical receptors inthe gut, circulating metabolites, and hormones. A complex neuronal circuitryinvolving the hypothalamus, brainstem and cortex integrates these signals andtranslates them into information regulating meal size and duration, interval tothe next meal, the amount of food consumed over the day or several days,weeks and months, and possibly the composition of food as well as the intakeof total energy (fig. 1). The hypothalamus regulates both long-term and short-term intake. The long-term regulation of food intake is mediated by leptin andinsulin secreted in proportion to the adipose tissue mass and exerting theiraction in the hypothalamus [4, 5]. These hormones affect the amount of food
Anderson/Aziz/Abou Samra
134
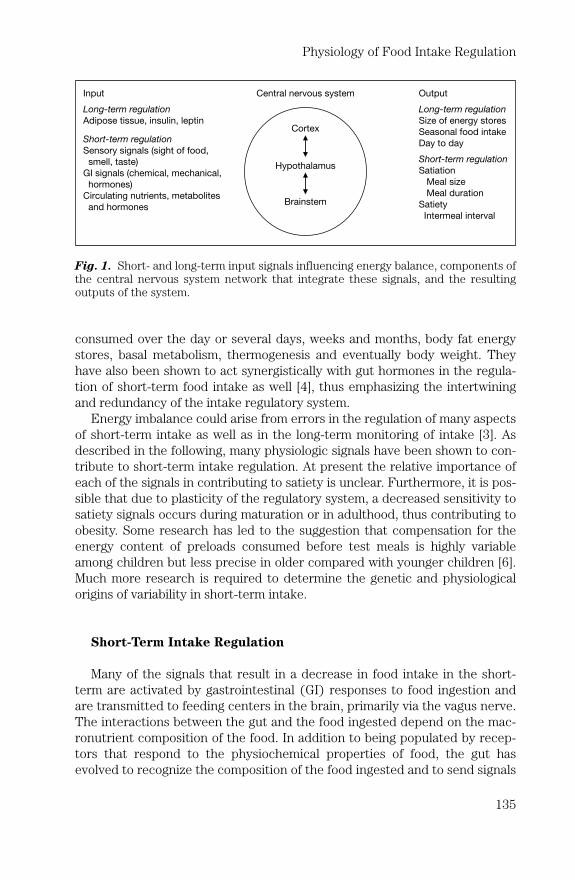
consumed over the day or several days, weeks and months, body fat energystores, basal metabolism, thermogenesis and eventually body weight. Theyhave also been shown to act synergistically with gut hormones in the regula-tion of short-term food intake as well [4], thus emphasizing the intertwiningand redundancy of the intake regulatory system.
Energy imbalance could arise from errors in the regulation of many aspectsof short-term intake as well as in the long-term monitoring of intake [3]. Asdescribed in the following, many physiologic signals have been shown to con-tribute to short-term intake regulation. At present the relative importance ofeach of the signals in contributing to satiety is unclear. Furthermore, it is pos-sible that due to plasticity of the regulatory system, a decreased sensitivity tosatiety signals occurs during maturation or in adulthood, thus contributing toobesity. Some research has led to the suggestion that compensation for theenergy content of preloads consumed before test meals is highly variableamong children but less precise in older compared with younger children [6].Much more research is required to determine the genetic and physiologicalorigins of variability in short-term intake.
Short-Term Intake Regulation
Many of the signals that result in a decrease in food intake in the short-term are activated by gastrointestinal (GI) responses to food ingestion andare transmitted to feeding centers in the brain, primarily via the vagus nerve.The interactions between the gut and the food ingested depend on the mac-ronutrient composition of the food. In addition to being populated by recep-tors that respond to the physiochemical properties of food, the gut hasevolved to recognize the composition of the food ingested and to send signals
Physiology of Food Intake Regulation
135
Input
Long-term regulation
Adipose tissue, insulin, leptin
Short-term regulation
Sensory signals (sight of food,
smell, taste)
GI signals (chemical, mechanical,
hormones)
Circulating nutrients, metabolites
and hormones
Output
Long-term regulation
Size of energy stores
Seasonal food intake
Day to day
Short-term regulation
Satiation
Meal size
Meal duration
Satiety
Intermeal interval
Central nervous system
Cortex
Hypothalamus
Brainstem
Fig. 1. Short- and long-term input signals influencing energy balance, components ofthe central nervous system network that integrate these signals, and the resultingoutputs of the system.

in anticipation of their metabolic effects by release of peptide hormones todifferent organs involved in the processing of the nutrients derived fromdigestion and absorption [7]. Whereas long-term food intake is controlled byadiposity signals, the regulation of short-term food intake is dictated mainlyby food signals arising from both their preabsorptive action in the gut andtheir postabsorptive metabolism.
Preabsorptive Signals
The ingestion of food and the passage of its subsequent digestion productsthrough the GI tract prior to absorption gives rise to a myriad of signals thatare transmitted to the brain, primarily by the vagus nerve, and are integratedwith long-term energy signals to ensure an appropriate food intake response[8]. Mechanoreceptors, osmoreceptors and chemoreceptors in the stomachand the small intestine provide direct signals to the brain. In addition, nutri-ents stimulate the release of GI hormones that act directly on receptors in thevagus nerve and in the brain.
Slower gastric emptying is associated with increased satiety [9]. Many fac-tors contribute to the rate of emptying, including the physical state and tem-perature of the meal, volume ingested, osmolality, caloric content, releaseddigestive products and hormonal interactions. Solid foods are emptied moreslowly from the stomach than liquid, increased volume accelerates the rate of gas-tric emptying, and solutions of high osmolality slow gastric emptying. However,while gastric distension contributes to food intake regulation, it alone cannotexplain the state of satiety that typically lasts for several hours after a meal [10].
The secretion of hormones controlling food intake is regulated by the pres-ence of food in the GI tract. The gut is a source of numerous peptides that con-tribute to the regulation of intake and metabolism. These include, from thesmall intestine, cholecystokinin (CCK), glucagon-like peptides (GLPs) 1 and 2,bombesin, gastrin-releasing peptide, neuromedin B, glucagon, apolipoproteinA-IV, amylin, somatostatin, enterostatin and peptide YY (3–36) and from thestomach, ghrelin and leptin [7, 11]. Many of the GI hormones and/or their recep-tors are also expressed in the central nervous system, underlining their impor-tant role in appetite control [11]. Some enter the central circulation via leakyareas (brainstem and hindbrain) in the blood-brain barrier, or send signalsthrough vagal afferents that are relayed to the hypothalamus. The macronutri-ent-dependent release of gut hormones might explain, at least in part, differ-ences in the satiating and satiety effect of macronutrients. For example, fat andprotein are the main CCK secretagogues in humans and rats, respectively [12],whereas carbohydrate and fat are stronger stimulants of GLP-1 release [13].
While the emergence of knowledge of the multiple satiety signals arisingfrom the GI tract adds to the understanding of intake control, it has not yetled to an integrative picture of the action of these peptide hormones or to anunderstanding of their relative importance in response to food ingestion.Similarly, the role of postabsorptive signals remains unclear.
Anderson/Aziz/Abou Samra
136

Postabsorptive Signals
Postabsorptive signals are generated after nutrients have been digestedand have entered the circulation where they stimulate satiety centers in thebrain by endocrine and metabolic actions. The glucostatic, aminostatic andlipostatic hypotheses of intake regulation have been the main theoriesdescribing how absorbed nutrients generate and influence satiety signals [14].
The glucostatic theory postulates that fluctuations in blood glucose levelstrigger an appropriate change in food intake. In support of the hypothesis,transient declines in blood glucose of the correct magnitude and time coursehave been associated with meal initiation as they are detected by peripheraland central glucoreceptive elements.
Similar to the glucostatic theory, the aminostatic hypothesis is based uponthe brain monitoring of nutrients, in this case amino acids derived from pro-tein ingestion, and consequently shaping consumption patterns. An inverserelationship between serum amino acid concentration and appetite in hum-ans has been observed. It has been further postulated that amino acids act onfood intake regulation through their ability to act as precursors to certainneurotransmitters known to influence food consumption. But as reviewedelsewhere, this may be a mechanism determining later food selection and theinter-meal interval rather than within meal satiation [15].
The lipostatic theory, advanced over 50 years ago, was based on signals aris-ing from the metabolism of fats. In recent years, new evidence has emerged tosupport the hypothesis. Transport mechanisms and enzymes for both fat oxi-dation and synthesis are present in the brain and inhibitors of fatty acid oxida-tion increase food intake. Although this could be a peripheral effect, it is clearthat the hypothalamus senses a nutrient surfeit in fatty acid metabolism aris-ing from circulating lipids from either dietary sources or adipose tissue [16].
In addition to glucose, fatty acids and amino acids, a number of intermedi-ate products of metabolism associate with satiety. Ketones, lactate, and pyru-vate suppress food intake in animals [8].
Dietary Components and Intake Regulation
Food and its components contribute to both short- and long-term regulation offood intake. The challenge is to understand the relative importance of food com-ponents and how to optimize their interaction with intake regulatory systems.
Energy
At the physiological level, energy requirement is a powerful determinant offood intake [14]. Thus growth, increased activity, and exposure to coldincrease intake. Physiological systems in both experimental animals andhumans are remarkably precise in regulating energy intake in relation torequirements. For example, exposure to cold or to exercise, or alterations in
Physiology of Food Intake Regulation
137

the energy density of the diet or to food availability and choice result in ratsquantitatively adjusting their food intake, thus maintaining energy balancewhen provided with their usual diets [14, 17]. However, it is also clear thatexperimental animals will become obese when provided a variety of palatablefoods, or high fat diets, showing that factors other than the physiologicaldrive toward energy balance determine food intake [18].
Similarly, humans adjust their energy intake to meet their energy expendi-ture in response to changes in activity, or ambient temperatures. As withexperimental animals, humans consume excess energy when they areexposed to an environment of low activity [19] and highly palatable energydense foods [20].
Although all macronutrients provide energy, their effect on food intakecannot be predicted simply from their energy content. Each macronutrientpossesses unique properties that provide signals to the central nervous sys-tem independent of their energy content [14].
Macronutrients
Protein suppresses food intake more than carbohydrate, which in turnsuppresses food intake more than fat. This hierarchy has been shown in bothhumans and rats [15]. Less appreciated is that even within a macronutrientclass, the source is a factor influencing short-term food intake and appetite.However, it is not possible at present to identify the primary biomarkers ofsatiety that arise from proteins, carbohydrates and fats.
ProteinsThe mechanisms by which proteins stimulate intake regulatory systems are
many, making them unique compared with carbohydrates and fats.Furthermore, the systems stimulated are dependent on the source. The sati-ety cascade arising from protein is as follows. First, protein initiates satietythrough its digestion and the subsequent release of biologically active peptides(BAP) encrypted within the protein. These BAP affect feeding through theiractions in the GI tract. They activate receptors, thus providing signals via thevagus nerve either directly, or by interacting with gut hormones that areinvolved in intake regulation. Second, free amino acids arising from digestionactivate neurochemical systems, thereby contributing not only to satiety, butalso to macronutrient choice. Finally, the end products of amino acid metabo-lism, ammonia and urea, probably play a part in determining intervals betweenmeals, but act primarily to signal excess intake or errors in metabolism [14].
Protein source, in addition to protein quantity, is a determinant of satiety[15]. Greater subjective satiety was reported by young men fed a 50-grammeal of lean fish compared with an equivalent amount of either beef orchicken [21]. Whey and soy protein drinks (45–50 g protein) suppressed foodintake 1 h later compared with the energy-free control and with sucrose,whereas egg albumen did not [22].
Anderson/Aziz/Abou Samra
138

The differential effect of protein source on food intake and subjectiveappetite might be explained by the action of BAP released during proteindigestion. These peptides are unique to the protein source and dependent onits tertiary structure and amino acid composition. Among the most exten-sively studied BAP are those derived from milk digestion. A glycosylated formof caseinomacropeptide (GMP), a peptide derived from the in vivo and invitro digestion of casein, is a potent CCK secretagogue [23], and preliminarystudies from our laboratory show that GMP is a potent inhibitor of food intakein rats [24]. In addition to GMP, opioid peptides derived from the digestion ofcasein (casomorphins) suppress food intake through opioid receptors locatedin the GI tract [25].
CarbohydratesConsistent with the glucostatic hypothesis are the observations that car-
bohydrate consumption and the resulting increase in blood glucose are asso-ciated with satiety. In the short-term, high glycemic carbohydrates suppressfood intake (up to 2 h) more than low-glycemic carbohydrates [26]. Althoughthere is much indirect support for the hypothesis that satiety is associatedwith the glycemic effects of carbohydrates, a primary role for blood glucosein determining satiety remains uncertain [27], perhaps because the glycemicresponse to carbohydrates primarily depicts their absorption characteristics.Many other mechanisms, including those based on the rate of gastric empty-ing and gut hormones, may explain the different effects on satiety of slowcompared to rapidly digested carbohydrates. For example, a rapid increasein the stimulation of glucoreceptors would be expected following ingestionand digestion of carbohydrates, but this stimulation does not last longenough to account for the prolonged satiety effect. A more extended effect ofcarbohydrates on satiety could arise from the stimulation of a multitude ofgut peptides, such as GLP-1 and CCK [28, 29]. Gastric emptying is slowed byGLP-1, a putative satiety peptide whose release is stimulated by carbohy-drates in the small intestine and that regulates carbohydrate metabolism[13]. A rise in blood glucose concentrations is also a factor that slows gastricemptying [30].
FatsIn general, fat suppresses food intake less than carbohydrate or protein on
a calorie for calorie basis. However, this ranking may also depend on thesource. Among fats, both the chain length and the degree of saturation havebeen shown to impact short-term food intake and subjective appetite.Medium-chain triglycerides and polyunsaturated fatty acids suppressed foodintake more than long-chain triglycerides and monounsaturated or saturatedfatty acids, respectively. These effects have been attributed to the CCK andapolipoprotein A-IV releasing properties of these types of fats [31].
Physiology of Food Intake Regulation
139
It is clear that an understanding of the interaction between food compo-nents and the intake regulatory mechanisms continues to develop. However,as noted earlier, there is little information on the stability of the system oncethe development of the circuitry has been completed. Similarly lacking isinformation on the role of environmental or nutritional factors in the develop-ment of the intake regulatory system in utero and in early life.
Nutrients and Development of Intake
Control Mechanisms
Although it is clear that increased risk of chronic disease and obesity areassociated with exposure to both deficiencies and excesses of energy andnutrients in utero and in early life [32], there has been very little examinationof the role of nutrients in the development of food intake regulatory mecha-nisms in the etiology of metabolic disease. As with many physiological sys-tems, the development of intake control mechanisms would be expected tooccur both in utero and in the early life of the offspring.
The interaction among nutrients and development of regulatory systems indetermining effects in later life is complex and there are likely multiple mech-anisms to explain the outcome. Altered gene expression is a likely factor. Inaddition, the development of regulatory systems in the GI tract continuesafter birth and depending on the composition of the food may have long-last-ing effects.
Altered expression of genes regulating insulin has been offered as anexplanation of the development of obesity through loss of intake control earlyin life. Insulin is intimately involved in both long- and short-term intake con-trol and the actions of both insulin and leptin are modified by malnutrition.Programmed development of obesity and adipogenic diabetes in rats hasbeen attributed to a permanent dysregulation of the adipoinsular feedbacksystem, again amplified by a hypercaloric diet, leading to hyperleptinemia,leptin resistance, hyperinsulinemia, and compensatory leptin production bypancreatic � cells [33]. The offspring of undernourished mothers (30% of thead libitum intake of the control mothers), cross-fostered during lactation tothe control mothers, had lower birth weights than the offspring of controlmothers [34]. After weaning, they exhibited higher food intake, systolic bloodpressure, and fasting plasma insulin and leptin concentrations than controlpups. These effects were amplified by a hypercaloric diet (30 vs. 5% fat),prompting the authors to conclude that hyperphagia is programmed in fetaldevelopment and exacerbated by environmental factors.
Epigenetic effects of nutrients and other dietary factors (e.g. antioxidants)during embryonic development, not gene mutations, have recently provided aplausible link between genetic makeup and susceptibility to development ofchronic diseases [35]. DNA methylation is a major modifier of the genome,
Anderson/Aziz/Abou Samra
140

repressing transcription and thus a ‘gene silencing’ mechanism. Early indevelopment, the genes are not methylated, but this process is thought tooccur after implantation of the zygote. Methylation occurs through the actionof the DNA methyltransferase, a process in which many vitamins participate.Therefore, certain dietary supplements given during pregnancy and earlypostnatal life may have an unintended silencing or deleterious effect on geneexpression [36] as shown by the effect of feeding a diet high in vitaminsinvolved in methyl group metabolism on the expression of coat color in theviable yellow Agouti mouse (Avy). The expression of the Agouti gene is char-acterized by a yellow coat color, obese, diabetic and cancer-prone phenotype.A 3- to 5-fold higher intake of methyl donors and methylation cofactors in theform of choline, betaine, B12 and folate during pregnancy led to a shifttowards offspring with the brown coat color phenotype, indicating an epige-netic regulation of the Avy gene through methylation [36]. The resulting phe-notype is characterized by a brown coat color, lean body weight, andnormoinsulinemia [37].
The development of the gene expression of gut hormones involved inthe regulation of food intake is at present unknown, as is the influence of thecomposition of food consumed in early life, but this requires exploration. Theability to potentially modify different populations of enteroendocrine cellsmay become an important therapeutic strategy for treating and/or preventingexcessive food intake and obesity [38].
Preliminary data support the importance of epigenetic events in the devel-opment of intake control mechanisms [39, 40]. Increasing the vitamin contentof the diet fed to Wistar rats, only during pregnancy and after implementationof the zygote, predisposes the offspring to impairment of intake control,altered gut hormone response, insulin resistance and obesity. Altered pheno-typic expression due to epigenetic changes appears to be a likely explanation.
Conclusion
The advances in understanding the physiology of intake control mecha-nisms has not led to a food solution for the obesity epidemic. However, theyhave provided incentive for testing new hypotheses of food- and diet-basedstrategies and the interaction between food components and physiologicalresponses. Continued research at the level of physiologic and molecular mech-anisms shows promise to contribute to a food-based solution to intake control.
References
1 Perusse L, Rankinen T, Zuberi A, et al: The human obesity gene map: the 2004 update. ObesRes 2005;13:381–490.
2 Horvath TL: The hardship of obesity: a soft-wired hypothalamus. Nat Neurosci 2005;8:561–565.
Physiology of Food Intake Regulation
141
3 Anderson G: Hunger, appetite, and food intake; in Ziegler E, Filer LJ Jr (eds): PresentKnowledge in Nutrition. Washington, ISLI Press, 1996, pp 13–18.
4 Schwartz MW, Woods SC, Porte D Jr, et al: Central nervous system control of food intake.Nature 2000;404:661–671.
5 Wilding JP: Neuropeptides and appetite control. Diabet Med 2002;19:619–627.6 Cecil JE, Palmer CN, Wrieden W, et al: Energy intakes of children after preloads: adjustment,
not compensation. Am J Clin Nutr 2005;82:302–308.7 Badman MK, Flier JS: The gut and energy balance: visceral allies in the obesity wars. Science
2005;307:1909–1914.8 Havel PJ: Peripheral signals conveying metabolic information to the brain: short-term and
long-term regulation of food intake and energy homeostasis. Exp Biol Med 2001;226:963–977.9 Santangelo A, Peracchi M, Conte D, et al: Physical state of meal affects gastric emptying,
cholecystokinin release and satiety. Br J Nutr 1998;80:521–527.10 Phillips RJ, Powley TL: Gastric volume rather than nutrient content inhibits food intake. Am
J Physiol 1996;40:R766–R779.11 Woods SC: Gastrointestinal satiety signals. I. An overview of gastrointestinal signals that influ-
ence food intake. Am J Physiol Gastrointest Liver Physiol 2004;286:G7–G13.12 Liddle RA: Regulation of cholecystokinin secretion by intraluminal releasing factors. Am J
Physiol 1995;269:G319–G327.13 Brubaker PL, Anini Y: Direct and indirect mechanisms regulating secretion of glucagon-like
peptide-1 and glucagon-like peptide-2. Can J Physiol Pharmacol 2003;81:1005–1012.14 Anderson GH: Regulation of food intake; in Shils ME, Olson JA, Shike M (eds): Modern
Nutrition in Health and Disease. Philadelphia, Lea & Febiger, 1994, pp 524–536.15 Anderson GH, Moore SE: Dietary proteins in the regulation of food intake and body weight in
humans. J Nutr 2004;134:974S-979S.16 Lam TK, Schwartz GJ, Rossetti L: Hypothalamic sensing of fatty acids. Nat Neurosci 2005;8:
579–584.17 Anderson GH, Li ET: Protein and amino acids in the regulation of quantitative and qualitative
aspects of food intake. Int J Obes 1987;11(suppl 3):97–108.18 Kanarek RB, Hirsch E: Dietary-induced overeating in experimental animals. Fed Proc
1977;36:154–158.19 Prentice A, Jebb S: Energy intake/physical activity interactions in the homeostasis of body
weight regulation. Nutr Rev 2004;62:S98–S104.20 Drewnowski A: Energy density, palatability, and satiety: implications for weight control. Nutr
Rev 1998;56:347–353.21 Uhe AM, Collier GR, O’Dea K: A comparison of the effects of beef, chicken and fish protein on
satiety and amino acid profiles in lean male subjects. J Nutr 1992;122:467–472.22 Anderson GH, Tecimer SN, Shah D, Zafar TA: Protein source, quantity, and time of consump-
tion determine the effect of proteins on short-term food intake in young men. J Nutr2004;134:3011–3015.
23 Brody EP: Biological activities of bovine glycomacropeptide. Br J Nutr 2000;84(suppl 1):S39–S46.
24 Peng S: Milk Proteins, Glycomacropeptide and Regulation of Short-Term Food Intake in Rats;M. Sc. thesis. Nutritional Sciences. Toronto, University of Toronto Press, 2005.
25 Pupovac J, Anderson GH: Dietary peptides induce satiety via cholecystokinin-A and periph-eral opioid receptors in rats. J Nutr 2002;132:2775–2780.
26 Anderson GH, Catherine NL, Woodend DM, Wolever TM: Inverse association between theeffect of carbohydrates on blood glucose and subsequent short-term food intake in youngmen. Am J Clin Nutr 2002;76:1023–1030.
27 Anderson GH, Woodend D: Effect of glycemic carbohydrates on short-term satiety and foodintake. Nutr Rev 2003;61:S17–S26.
28 Aziz A, Anderson GH: Exendin-4, a GLP-1 receptor agonist, modulates the effect of macronu-trients on food intake by rats. J Nutr 2002;132:990–995.
29 Bellissimo N, Anderson GH: Cholecystokinin-A receptors are involved in food intake suppres-sion in rats after intake of all fats and carbohydrates tested. J Nutr 2003;133:2319–2325.
30 Vella A, Camilleri M, Rizza RA: The gastrointestinal tract and glucose tolerance. Curr OpinClin Nutr Metab Care 2004;7:479–484.
31 French S: Effects of dietary fat and carbohydrate on appetite vary depending upon site andstructure. Br J Nutr 2004;92(suppl 1):S23–S26.
Anderson/Aziz/Abou Samra
142

32 Barker DJ: The developmental origins of chronic adult disease. Acta Paediatr Suppl2004;93:26–33.
33 Vickers MH, Reddy S, Ikenasio BA, Breier BH: Dysregulation of the adipoinsular axis – amechanism for the pathogenesis of hyperleptinemia and adipogenic diabetes induced by fetalprogramming. J Endocrinol 2001;170:323–332.
34 Vickers MH, Breier BH, Cutfield WS, et al: Fetal origins of hyperphagia, obesity, and hyper-tension and postnatal amplification by hypercaloric nutrition. Am J Physiol Endocrinol Metab2000;279:E83–E87.
35 Scarano MI, Strazzullo M, Matarazzo MR, D’Esposito M: DNA methylation 40 years later: itsrole in human health and disease. J Cell Physiol 2005;204:21–35.
36 Waterland RA, Jirtle RL: Early nutrition, epigenetic changes at transposons and imprintedgenes, and enhanced susceptibility to adult chronic diseases. Nutrition 2004;20:63–68.
37 Wolff GL, Kodell RL, Moore SR, Cooney CA: Maternal epigenetics and methyl supplementsaffect agouti gene expression in Avy/a mice. FASEB J 1998;12:949–957.
38 Schonhoff SE, Giel-Moloney M, Leiter AB: Development and differentiation of gut endocrinecells. Endocrinology 2004;145:2639–2644.
39 Szeto IMS, Das PJ, Taha AY, et al: Effect of increase multivitamin intake of rats during pregnancyon food intake and glucose metabolism of male offspring (abstract). FASEB J 2005;19:970.4.
40 Das PJ, Szeto IMS, Taha AY, et al: High multivitamin intake by pregnant rats affects growth,body composition, and food intake in the offspring (abstract). FASEB J 2005;19:LB278.
Discussion
Dr. Butte: After the digestion of human milk is there evidence of guanosinemonophosphate (GMP)? My second question is, if I followed you correctly in the stud-ies by Waterland and Jirtle [1] increased manipulation lead to leaner animals, but inyour study the increased vitamin intake lead to obesity [2]. Could you clarify that?
Dr. Anderson: I can’t give the reason for the contrasting effect. The Agouti mouseand Wistar rat are different genetically. However, we expected that the increase invitamin intake would be protective for the offspring in the development of insulinresistance and perhaps enhancing appetite regulation. But we got quite the opposite.Scientists in Nestlé research have done some preliminary studies on the release ofGMP during digestion in infants.
Dr. Butte: I was just wondering when you were talking about cow’s milk. Is thereany evidence regarding the release after human milk digestion?
Dr. Anderson: There was some discussion of that at the whey protein conferencein Chicago in September. GMP appears but the duration, which is what I am uncertainabout and whether it has functional significance, was not looked at.
Dr. Dewey: In terms of the development of appropriate appetite regulation andcontrol of food intake, is there evidence that overfeeding, i.e. from animal studies, hasa negative effect on control of food intake later in life?
Dr. Anderson: There are some data that support the notion that overfeeding hashealth consequences [3], but the effect on food intake control has not been examined.
Dr. Desjeux: You mentioned that during fetal life the nutrient could alter geneticprogramming and it could be an epigenetic phenomenon. We also know that there aredirect interactions between nutrients from amino acids to glucose and fatty acids, anddirect interactions with genes. Do you know if these interactions could be permanentor could have long-term effects?
Dr. Anderson: I think there is very little mechanistic exploration that wouldexplain what is happening to the phenotypic expression. What I neglected to mentionis that we have given these mother rats a complete vitamin mix but not at the highamount that Waterland and others have done in order to get the methyl addition to theDNA. From our own studies we don’t know which of the vitamin groupings might be
Physiology of Food Intake Regulation
143

Anderson/Aziz/Abou Samra
144
generating the effect. Other mechanisms need to be explored, as you suggested, butcurrently DNA methylation and histone modification are the favored mechanisms [4].
Dr. Desjeux: Did you purposely not speak on energy density as a regulatorymechanism?
Dr. Anderson: No, I am quite familiar with the volumetric idea and energy densityas a factor determining food intake. However, there has been little exploration of phys-iological mechanisms. Because I am in the center of the glycemic index universe at theUniversity of Toronto, I would like to point out that a high energy-dense, rapidlydigestible, high glycemic index food is much more effective in shutting down short-term food intake than is a low glycemic index food [5].
Dr. Pencharz: As I listen to your talk it sounds to me like studying rats is studyingrats, and we around this table are mostly interested in people, particularly children,and as you mentioned in fact children behave differently to adults. Thinking forthe future, should the focus be on studies in humans or might some other animalmodel help us understand the mechanisms, or are we stuck with the difficulty ofhuman studies?
Dr. Anderson: I believe that to explore mechanisms you need animal models. Forexample, with our studies on the effect of high vitamin intakes in the rat and theincrease in insulin resistance, surely that provides a motivation to explore whether ornot this applies to the human population. But otherwise you would have no justifica-tion for entering into a human study.
Dr. Fan Yang: You talked about fetal programming. In our clinic we have foundthat some babies born with intrauterine growth retardation do not show catch-upgrowth in later life. Is there any evidence that in utero influences have some effect onthe long-term and short-term food intake regulation by the baby which may contributeto the baby losing catch-up growth in later life?
Dr. Anderson: It is assumed that there is a distortion in food intake regulation, butI am unaware of any evidence for this. I think that our own studies provide some justi-fication for trying to understand whether the satiety hormone responses are differ-ent in obese vs. normal children and whether or not there is a developmental aspect.
Dr. Yi-hung Choi: Can you comment on the role of other food components includ-ing appetizers? Some vitamin or mineral components can have an influence on the foodintake of children. Can you also comment on the very early feeding behavior of the care-givers in relation to the food preferences of young infants from a behavioral aspect?
Dr. Anderson: I am certainly no expert on the subject of the impact of caregivers;Dr. Dewey and others could probably answer that question much better than I. Thequestion of whether caregivers giving extra calories influences long-term food intakeand the regulatory system is a good one and needs to be explored. Your other questionaddressed vitamins and minerals; we gave vitamins but one of the reasons for startingto look at milk protein and the biologically active peptides, at least here in NorthAmerica, is that there have been published associations between dairy consumptionand healthier body weight. One of the popular hypotheses relates to calcium and vita-min D metabolism in adipose tissue. Perhaps increased calcium intake is the factor,but it is certainly not the only answer, because the studies that have been conductedsuggest that the dairy product itself is more beneficial than simply calcium. We haveshown that whey protein reduces food intake more than soy or egg protein. So I thinkmilk proteins and their bioactive peptides are important factors [6]. However, thereare minerals that affect food intake regulation, and zinc is a classic example, but thatusually is a deficiency that causes anorexia.
Dr. Ziegler: The obesity epidemic seems to be worldwide and concerns us all,and seems to have occurred in parallel with an increase in the use of non-caloric or
low-caloric foods and drinks. Would you care to comment on the effect of non-caloricfoods on the regulatory systems?
Dr. Anderson: In our own studies, if you sum up the calories in the preload withwhat is eaten at the meal, you very often get a net gain in calories over and above whatyou would get if the preload was a high intensity sweetened beverage. Not only that,we often see that just a sweet taste from a high intensity sweetener tends to suppressfood intake at a meal a little more than just the water preload [7]. If you go around theworld, there are many dietary patterns that lead to obesity and are associated witheconomic advancement. So I don’t think it is a factor. Generally, calorie-free sweet-ened beverages lead to less caloric intake than those containing calories [8].
References
1 Waterland RA, Jirtle RL: Early nutrition, epigenetic changes at transposons and imprintedgenes, and enhanced susceptibility to adult chronic diseases. Nutrition 2004;20:63–68.
2 Das PJ, Szeto Im, Taha AY, et al: High multivitamin intake by pregnant rats affects growth,body composition, and food intake in the offspring. FASEB J Abstr 2005;19:LB278.
3 Armitage JA, Taylor PD, Poston L: Experimental models of developmental programming: con-sequences of exposure to an energy rich diet during development. J Physiol 2005;565:3–8.
4 Rodenhiser D, Mann M: Epigenetics and human disease: translating basic biology into clinicalapplications. CMAJ 2006;174:341–348.
5 Anderson GH, Catherine NL, Woodend DM, Wolever TM: Inverse association between theeffect of carbohydrates on blood glucose and subsequent short-term food intake in youngmen. Am J Clin Nutr 2002;76:1023–1030.
6 Anderson GH, Moore SE: Dietary proteins in the regulation of food intake and body weight inhumans. J Nutr 2004;134:974S–979S.
7 Anderson GH, Woodend D: Consumption of sugars and the regulation of short-term satietyand food intake. Am J Clin Nutr 2003;78:843S–849S.
8 Abou Samra R, Anderson GH: Intense sweeteners and sugar replacers in the regulation offood intake and body weight; in Mela D (ed): Food, Diet and Obesity. Cambridge, Woodhead,2005, pp 292–310.
Physiology of Food Intake Regulation
145


Complementary Food: InternationalComparison on Protein and EnergyRequirement/Intakes
Carlo Agostoni, Enrica Riva, Marcello Giovannini
Department of Pediatrics, San Paolo Hospital, University of Milan, Milan, Italy
AbstractThe possible role of early dietary habits as the origin of later consequences on
health has raised questions on the optimal macronutrient intakes of the growinginfant. Infants and toddlers in developed countries usually show a high dietary pro-tein:energy ratio during the complementary feeding period, averaging 2.5–3, becauseof the protein density of solid weaning foods and the low percentage of mothers stillbreastfeeding beyond the first 6 months of life. In conditions of very high proteinintakes, those in the higher classes of consumption seem to carry a higher risk ofbecoming obese later on. Over the limit of 14% energy from proteins in the 8- to 24-month period, some mechanisms may begin to operate leading young childrentowards an early adiposity rebound and overweight development. On the other hand,in many developing countries the only available weaning foods are cereals, with a lowprotein: energy ratio value. When the protein concentration of weaning foods fallsbelow the limits of human milk (that is, from 1 g/100 kcal to lower levels), the infants’dietary requirements cannot be met. In planning interventions, the coverage ofinfants’ dietary needs through all the various world regions should be consideredtogether with the opportunity not to exceed higher limits.
Copyright © 2006 Nestec Ltd., Vevey/S. Karger AG, Basel
While exclusive breastfeeding is strongly recommended for the first 6months of life [1], solids should progressively be introduced afterwardsin order to complement those nutrients becoming insufficient if suppliedonly by human milk (particularly energy, protein, iron, zinc and fat-solublevitamins). The process is called ‘weaning’, and represents the progressiveintroduction of solid foods into children’s diet in order to fulfill their changingnutritional needs [2].
The recent interest in the role of dietary proteins at early ages and thepossible origin of later consequences on health (first of all the connections with
147
Rigo J, Ziegler EE (eds): Protein and Energy Requirements in Infancy and Childhood.Nestlé Nutr Workshop Ser Pediatr Program, vol 58, pp 147–159,Nestec Ltd., Vevey/S. Karger AG, Basel, © 2006.

overweight and obesity development) has raised questions regarding the optimalmacronutrient intakes in terms of total proteins, energy and protein:energy ratio(PER; grams protein per 100 kcal energy) required by the growing infant.
Why the Protein:Energy Ratio?
As a general rule, higher energy intakes may allow more efficient utilizationof nitrogenous sources derived from catabolic processes and intakes. There-fore, protein and energy are inversely associated for recommendations withindefinite ranges.
An example of the operational approach to calculate the changing proteinrequirements in relation to different energy intakes and applied to young,healthy male adults is given in figure 1 (here PER is given in grams per1,000 kcal) [3]. To derive a reference PER in this way, one should divide the�2SD protein requirements (i.e., the safe level of protein intake) by the average
Agostoni/Riva/Giovannini
148
Protein
requirements
Energy
requirements
Mean
Mean
�2SD
�2SD
�2SD
�2SD 7.2 10.3 13.2
9.4 13.3 17.3
13.4 19.0 24.6
Some possible protein:energy ratios
(17.5-year-old male subject)
g/1,000 kcal
Fig. 1. An example of calculation of protein:energy ratios. Distributions of bothprotein requirements and energy requirements are portrayed on the axes. Thepublished average energy need and recommended protein intake are marked byarrows. The values shown are based on 1983 Canadian requirement estimates foryoung male adults. Partially modified from Beaton [3].

energy need (mean requirement for energy) at all ages and then computePER values, as portrayed schematically, by selecting various arbitrary points onthe distributions. Since these factors are difficult to estimate, the results arebased on assumptions. This approach, even if convenient, might not seem tobe logical, since it does not convey the meaning of either the protein require-ments (sufficient for almost all individuals) or the average energy needs (suf-ficient for half the individuals). The consequent ratio involves two factors,each with its own variance [4]. Finally, the example does not include the fur-ther variable of the additional protein/energy requirements of a growing indi-vidual, which would make the model even more complicated.
Pragmatic and physiological considerations justify expressing the proteinrequirements in relation to energy intake for situations as diverse as weaningdiets, catch-up growth, and hypercatabolic states [4]. Infants and toddlers indeveloped countries usually show a high dietary PER during the comple-mentary feeding period, averaging 2.5–3, because of the protein density ofsolid weaning foods and the low percentage of mothers still breastfeedingbeyond the first 6 months of life [5]. In conditions of very high protein intakes,those in the higher classes of consumption seem to carry a major risk tobecome obese later on. On the other hand, in many developing countries theonly available weaning foods are cereals, with a low PER value. When the pro-tein concentration of weaning foods falls below the limits of human milk (witha PER of �1, i.e., �1 g protein/100 kcal to lower levels), the infants’ dietaryrequirements cannot usually be met [6].
Protein intakes and PER values show great variability in the 6- to 24-monthperiod, starting from around 7% energy as protein (PER � 1.7) in 6-month-old infants at the end of the exclusive breastfeeding period. Given the vari-ability of the average protein content of human milk, in those cases in whichprotein supply represents less than 6% energy (PER � 1.5), within a limitedenergy supply, even fully breast-fed infants are likely to enter a status of neg-ative nutrient balance [7]. Indeed, Wharton [4] has already underlined that itis ‘probably unsafe to adopt the very low protein/energy ratio in breast milk asa minimum safe standard, since the nitrogen present is utilized with unusualefficiency’ and ‘there should be caution in accepting also very low ratios of1.7’ for those who are not breast fed.
On the other hand, high protein intakes in the complementary feeding period(from the 8th up to 24th month) are even more frequently reported in bothdeveloped and developing countries considering children from both rich andpoorer classes [8–10]. From the collected data, it seems that over the limit of14% energy from proteins (PER � 3.5) in the 8- to 24-month period some mech-anisms may begin to operate leading young children towards an early adiposityrebound and overweight development, beyond any genetic predisposition.Preliminary data seem to indicate a causal role for whole cow’s milk proteins.
Complementary Food
149

In the following the limits mentioned here will be discussed as far ascauses, potential consequences and measures to prevent low or high dietaryPER values.
Protein, Energy and PER in Developing Countries:
Old Issues and New Questions
In most developing countries the main (or even only) weaning foods arestill represented by local staple cereal foods such as maize, rice or cassava.The daily servings supplied with these cereals should match an adequateamount of milk in order to keep both the PER value higher than 1.5 andenough energy to promote anabolic processes and prevent catabolic states,also considering the rates of infections in these child populations. Since dif-ferent milk sources are theoretically available, schemes have been developedin order to check the adequacy of the source of complementary foods accord-ing to the type of milk supplied in the complementary feeding period.According to Wharton [4], possible options are human milk (advantageous forthe high quality of the protein content, the anti-infective properties and thefunctional effects, including the close mother-infant relationship), a follow-onformula (balanced as far as nutrient composition but with more protein com-pared to human milk and lacking its anti-infective and functional properties),and whole cow’s milk (unbalanced as far as nutrient composition for a grow-ing infant and with the highest PER ratio). For instance, in the case rice is the(almost) exclusive staple food, and considering the PER of the milk beingsupplied, the protein requirements may be met when human milk providesaround 70% energy, follow-on formula 50%, and cow’s milk 30%. When oil isadded to rice, the energy requirements may be met at lower intakes, but atthe expense of the protein intake, since also the PER value of the comple-mentary foods is proportionally reduced.
Recently, dietary enrichment with ‘ad-hoc’ designed complementary foodsand/or drinks with enhanced protein and also enhanced (even if less marked)energy content has been considered to improve the PER value of diets andprevent malnutrition. Indeed, in communities where malnutrition is endemicthe 6- to 24-month period is the most critical for nutritional interventionsand the introduction of specifically designed supplementary feedings can pre-vent the onset of wasting in a large proportion of children [11].
In progressing (‘transition’) countries the PER values of diets are higherthan 2 also in disadvantaged groups (for instance, those living in rural areas)[10, 12], but they generally result from an adequate protein intake and a lowerthan recommended energy supply with nutritionally poor food sources.Therefore, a ‘second level’ adjustment in terms of both total energy andmicronutrient balance (vitamins, minerals, trace elements) is needed. Preli-minary, ‘qualitative’ reports from China raises strong suspicious that large
Agostoni/Riva/Giovannini
150

groups of children (either deprived of complementary foods at appropriateages or complemented by means of low PER foods, with proteins of low bio-logic value) are in a negative protein/energy balance [13, 14]. Since the simpleaddition of micronutrients does not reverse the effects of malnutrition ongrowth, energy intakes should be increased by supplying foods with a highenergy density and/or more frequent meals. Care should be taken to preventthe energy addition through fat and/or sugars from further reducing the pro-tein and micronutrient density below critical limits. Therefore, interventionsto improve the quality of protein sources are still urgently required also inthese environments in an advanced stage of socioeconomic transition, besidesspecific dietary enrichments (e.g., with iron, zinc and/or liposoluble vitamins).
Finally, child populations from Asian and African countries, still sufferingfrom both protein and energy malnutrition, should progressively be involved inprocesses leading to an improvement in both the supply and adequacy of foods.Within these processes, the improvement in the infants’ general health condi-tions (including the prevention of vertical viral transmission from mothers)should be considered in order to improve their general nutrition status.
Economic conditions (e.g., the cost of complementary foods), environ-mental backgrounds (e.g., availability of additional foods, microbiologicalsafety of waters and milk), family traditions and sociocultural convictionsmay all influence the final dietary schedules and intakes of children in developingcountries during the complementary feeding period, the discussion of whichgoes well beyond the scope of this presentation.
High Protein Intakes, High PER and Obesity
Over the last 10 years, there has been a common consensus that the aver-age PER in the diets of children from Western countries is around 2.5–3 [3, 7,15], in some cases reaching values close to 5 [16] (table 1). Reports fromlow income urban families confirm that in Western countries the protein
Complementary Food
151
Table 1. Reports of nutrient intakes in European countries in the 8- to 24-monthperiod
Country Age Protein Protein Lipid Carbohydratemonths g/kg % % %
Spain 9 4.4 15.7 26.4 58France 10 4.3 15.6 27.1 57Italy 12 5.1 19.5 30.5 50Denmark 12–36 3.3 15 28 57
Partially adapted from Agostoni et al. [7].

requirements are easily met and exceeded also under poor conditions [9],even if we lack data from communities of immigrants, whose nutritional con-ditions should be investigated in the near future.
In general high protein intakes are believed to have an impact on theglomerular filtration rate and to increase the renal solute load, while leadingto elevations in certain plasma amino acid levels with possible effects on bodymetabolism and the production of neurotransmitters, which has not yet beensufficiently investigated [17].
Rolland-Cachera et al. [18] were the first to propose an early adiposityrebound as a first predictor of later obesity in infants. They speculated thatthe age at body mass index rebound may be influenced by the amount of pro-tein supplied in the 10- to 24-month period [19]. They investigated 112French children who were measured for weight and length and skin-foldthickness (two sites) at 10 months, 2, 4, 6 and 8 years of age. At 2 years ofage, protein intake as percent of energy was �14.8% (PER 3.7) in the lowestquartile, 14.8–18% (3.7–4.5 PER) in the next two quartiles and more than18% (4.5 PER) in the highest quartile. Significant correlations were foundbetween the percentage of protein and both body mass index and subscapu-lar skin-fold thickness at 8 years after adjusting for energy intake at 2 yearsand parental body mass index. The percentage of protein at 2 years was alsonegatively associated with the age at adiposity rebound. Similar results werereported in 150 Italian children, followed from birth through 5 years [20]. At 5years, children with a body mass index above the 90th percentile had a higherprotein intake (as energy percentage) at 1 year than those who were notoverweight (�90th percentile). The protein intakes at 12 months were veryhigh, 22 and 20% of energy (equivalent to 5.5 and 5 PER) in both the over-weight and the non-overweight groups, respectively.
On the other hand, Dorosty et al. [21], who attempted to reproduce theresults of the relatively small study of Rolland-Cachera et al. [19], followed acohort of 889 British children born in 1991 and 1992 from birth through 5years. Ten anthropometric measurements were performed in 5 years and two3-day dietary records were taken at 8 and 18 months of age. Dietary proteinsas percent of energy intake were on average 14 � 2% (3.5 � 0.5 PER) at 18months in each of the three categories in which the participants were subdi-vided on the basis of age at adiposity rebound (very early, early, later). Onlyparental body mass index or obesity were significantly correlated to an earlyadiposity rebound. In a Danish cohort, protein intakes averaging 13 (females)to 14% (males) of energy intake (PER around 3.5) were not associated withthe percentage of body fat at 10 years of age [22]. Similar findings have beenreported in children treated for hyper-phenylalaninemic syndromes (classicand mild forms), who showed an association between overweight at age 8years and early adiposity rebound, but no associations with early proteinintakes [23]. Also in this case the average protein intake in the mild form(with the higher protein supply) averaged 14% of the daily energy intake (3.5
Agostoni/Riva/Giovannini
152

PER) and overweight was more likely in children with, rather than without,parental overweight.
Biologic Plausibility of the Protein Hypothesis:
Role of Quantity and Quality
Commenting on the results from the study by Dorosty et al. [21], Rolland-Cachera et al. [24] have underlined that, in spite of the contrasting results onproteins, a common finding is represented by the lack of any relationshipbetween earlier energy and fat intakes and age at adiposity rebound. Indeed,human milk, the reference food, contains a low proportion of protein (around7% energy) and a high proportion of fat (around 50% energy). Accordingly, arapid metabolic adaptation to low fat intakes in the complementary feedingperiod would make the child unprepared to face a high-fat diet later on [24].
The first explanations on the high protein – early adiposity rebound asso-ciation were almost speculative and hypothesized a possible stimulatingeffect of dietary proteins on insulin-like growth factor-1 (IGF-1) [25], induc-ing both adipocyte differentiation and adipogenesis [26]. Accepting thishypothesis, we could speculate that adipocytes, differentiated early and over-stimulated, would be more prone to be filled through the years by fats deriv-ing (either directly or after endogenous synthesis) from the high energy, highsaturated fat diets commonly reported in Western children. Then, accordingto our previous observations, the critical point would be represented by thedietary unbalance at 8–24 months of age, when dietary proteins approaching4–5 g/kg weight/day (around 16–20% of total energy intake, PER � 4–5) areassociated with later overweight [8], while with dietary proteins below 14%energy an association is not found.
A Danish group has recently published a series of reports partly expan-ding these hypotheses. At 2.5 years of age the serum IGF-1 concentration of90 Danish children was positively associated with intakes of animal proteinsand milk, but not with those of vegetable proteins or meat [27]. Height wasalso associated with serum IGF-1 and the intakes of animal proteins andmilk. The 90th percentile of protein intake in this study was 4.0 g/kg/day(around 16% of energy, PER � 4), and presumably this level matched themaximum effect on IGF-1 secretion. Further randomized studies in 8-year-old children have shown that 7 days of increased protein intakes (13–20% ofthe daily energy, 3.2–5 PER) by additional milk supply (but not meat)increased serum IGF-1 by around 20% [28] and fasting serum insulin levelsby 100% [29]. These observations, while raising debate on the possible long-term effects in older children, put more light on the mechanisms possiblylinking early over-intake of proteins (particularly from milk and dairy prod-ucts), synthesis of endocrine mediators, age at adiposity rebound and lateroverweight.
Complementary Food
153

Solutions for the high PER levels are in line, but opposed to those formalnourished children: first of all, supporting breastfeeding at least up to 12months in order to balance not just the excess protein but also balance theother macronutrients and micronutrients; then using less protein-dense wean-ing foods (with a PER ideally ranging 2–3), and finally introducing an appropri-ate formula with ‘adjusted’ PERs when human milk is insufficient. Within thiscontext, producers and regulatory bodies should consider the opportunity tofurther modulate the PER level of follow-on formulae, to counteract the appar-ently unavoidable trend to a high protein, high PER diet. According to recentreports, follow-on formulae with 1.3 g/l protein and 67 kcal/100 ml (with a PERclose to 2) are adequate for diets in Swedish infants [30, 31]. The protein con-tent and PER levels of follow-on formulae could be tailored further according todietary habits differing in usual weaning foods [32].
Conclusions
Protein intakes should be maintained in the safe range of 8–12% calories(equivalent to 2–3 PER) with a diet adequate in energy and balanced for bothmacronutrients and micronutrients. In planning interventions, the coverage ofinfants’ dietary needs through all the various world regions should be consid-ered according to local traditions, food availability and the socioeconomic back-grounds. The maintenance of breastfeeding during the introduction of solidsmay help to modulate the trend towards excessive dietary proteins in devel-oped countries and the declining protein quality in the case of poorer countries.In this case, a dietary PER ranging from 1.5 to 2 could be acceptable for provid-ing adequate energy, for the high efficiency of human milk protein utilization.For developed countries, a reassessment of the composition of complementaryfoods, and also follow-on formulae in the case human milk is lacking, should beconsidered to prevent the overload of dietary proteins. Available data suggestthat above the limit of 14% energy derived from dietary proteins (3.5 PER) inthe 8- to 24-month period, some mechanisms may begin to operate, beyond, orunmasking, a genetic predisposition towards the phenomenon of early adipos-ity rebound and overweight development.
Finally, it is tempting to speculate that differences in early feeding habits(breastfeeding vs. formula feeding) could be associated with different sched-ules for the introduction of solids, and differences in suggested PER values ofthe complementary foods.
References
1 American Academy of Pediatrics: Breastfeeding and the use of human milk. Pediatrics2005;115:496–506.
2 Hendricks KM, Badruddin SH: Weaning recommendations: the scientific basis. Nutr Rev1992;50:125–133.
Agostoni/Riva/Giovannini
154

3 Beaton GH: Criteria of an adequate diet; in Shils ME, Young VR (eds): Modern Nutrition inHealth and Disease, ed 7. Philadelphia, Lea & Febiger, 1988, pp 649–665.
4 Wharton BA: International recommendations on protein intakes in infancy: some points fordiscussion; in Raiha NCR (ed): Protein Metabolism during Infancy. Nestlé Nutrition WorkshopSeries Pediatric Program. Vevey/New York, Nestec/Raven Press, 1994, vol 33, pp 67–86.
5 Giovannini M, Riva E, Banderali G, et al: Feeding practices on infants through the first year oflife in Italy. Acta Paediatr 2004;93:492–497.
6 Dupont C: Protein requirements during the first year of life. Am J Clin Nutr 2003;77:1544S–1549S.
7 Agostoni C, Scaglioni S, Ghisleni D, et al: How much protein is safe? Int J Obes 2005; in press.8 Rolland-Cachera MF, Deheeger M, Bellisle F: Increasing prevalence of obesity among 18-year-
old males in Sweden: evidence for early determinants. Acta Paediatr 1999;88:365–367.9 Nolan K, Schell LM, Stark AD, Gomez MI: Longitudinal study of energy and nutrient intakes
for infants from low-income, urban families. Public Health Nutr 2002;5:405–412.10 Faber M: Complementary foods consumed by 6–12-month-old rural infants in South Africa
are inadequate in micronutrients. Public Health Nutr 2005;8:373–381.11 Rivera JA, Habicht JP: Effect of supplementary feeding on the prevention of mild-to-moderate
wasting in conditions of endemic malnutrition in Guatemala. Bull World Health Organ2002;80:926–932.
12 Dannhauser A, Bester C, Joubert G, et al: Nutritional status of preschool children in informalsettlement areas near Bloemfontein, South Africa. Public Health Nutr 2000;3:303–312.
13 Wang X, Wang Y, Kang C: Feeding practices in 105 counties of rural China. Child Care HealthDev 2005;31:417–423.
14 Dang S, Yan H, Yamamoto S, Zeng L: Feeding practice among younger Tibetan children livingat high altitudes. Eur J Clin Nutr 2005;59:1022–1029.
15 Dewey KG: Nutrition, growth, and complementary feeding of the breastfed infant. PediatrClin North Am 2001;48:87–104.
16 Bellù R, Ortisi MT, Incerti P, et al: Nutritional survey on a sample of one-year-old infants inMilan: intake of macronutrients. Nutr Res 1991;11:1221–1229.
17 Michaelsen KF, Hoppe C, Schack-Nielsen L, Molgaard C: Does an excessive protein intakeearly in life cause health problems such as obesity later in life?; in Black RE, Michaelsen KF(eds): Public Health Issues in Infant and Child Nutrition. Nestlé Nutrition Workshop SeriesPediatric Program. Vevey/Philadelphia, Nestec/Lippincott Williams & Wilkins, 2002, vol 48, pp279–291.
18 Rolland-Cachera MF, Deheeger M, Bellisle F, et al: Adiposity rebound in children: a simpleindicator for predicting obesity. Am J Clin Nutr 1984;39:129–135.
19 Rolland-Cachera MF, Deheeger M, Akrout M, Bellisle F: Influence of macronutrients on adi-posity development: a follow up study of nutrition and growth from 10 months to 8 years ofage. Int J Obes 1995;19:573–578.
20 Scaglioni S, Agostoni C, Notaris RD, et al: Early macronutrient intake and overweight at fiveyears of age. Int J Obes 2000;24:777–781.
21 Dorosty AR, Emmett PM, Cowin IS, Reilly JJ: Factors associated with early adiposity rebound.Pediatrics 2000;105:1115–1118.
22 Hoppe C, Molgaard C, Thomsen BL, et al: Protein intake at 9 mo of age is associated with bodysize but not with body fat in 10-y-old Danish children. Am J Clin Nutr 2004;79:494–501.
23 Scaglioni S, Verduci E, Fiori L, et al: Body mass index rebound and overweight at 8 years ofage in hyperphenylalaninemic children. Acta Paediatr 2004;93:1596–1600.
24 Rolland-Cachera MF, Deheeger M, Bellisle F: Early adiposity rebound is not associated withenergy or fat intake in infancy. Pediatrics 2001;108:218–219.
25 Ketelslegers JM, Maiter D, Maes M, et al: Nutritional regulation of insulin-like growth factor-I.Metabolism 1995;44(suppl 4):50–57.
26 Soriski A: From preadipocyte to adipocyte: differentiation-directed signals of insulin from thecell surface to the nucleus. Crit Rev Clin Lab Sci 1999;36:1–34.
27 Hoppe C, Udam TR, Lauritzen L, et al: Animal protein intake, serum insulin-like growth factorI, and growth in healthy 2.5-y-old Danish children. Am J Clin Nutr 2004;80:447–452.
28 Hoppe C, Molgaard C, Juul A, Michaelsen KF: High intakes of skimmed milk, but notmeat, increase serum IGF-I and IGFBP-3 in eight-year-old boys. Eur J Clin Nutr 2004;58:1211–1216.
Complementary Food
155

29 Hoppe C, Molgaard C, Vaag A, et al: High intakes of milk, but not meat, increase s-insulin andinsulin resistance in 8-year-old boys. Eur J Clin Nutr 2005;59:393–398.
30 Akeson PM, Axelsson IE, Raiha NC: Growth and nutrient intake in three- to twelve-month-oldinfants fed human milk or formulas with varying protein concentrations. J PediatrGastroenterol Nutr 1998;26:1–8.
31 Karlsland Akeson PM, Axelsson IE, Raiha NC: Protein and amino acid metabolism in three-totwelve-month-old infants fed human milk or formulas with varying protein concentrations.J Pediatr Gastroenterol Nutr 1998;26:297–304.
32 Karlsland Akeson PK, Axelsson IE, Raiha NC, Warm A, Minoli I, Moro G: Protein intake andmetabolism in formula-fed infants given Swedish or Italian weaning foods. Acta Paediatr2000;89:158–164.
Discussion
Dr. Haschke: I was most interested in your studies. I think for the work from Indiathat you cited at the beginning, and as far as I understood they were evaluating theeffect of the so-called low and high energy density supplementary foods in relation tobreast milk intake, the outcome was that there was no effect. But it is my understand-ing that an energy density of 35 kcal/100 g is not a high-density complementary food.So the question would be: if you were to take 100 kcal/100 g, which would be reallyenergy dense, whether there would be an influence? So were the results influenced bythe study design?
Dr. Agostoni: These two studies [1, 2] have been thoroughly discussed within theeditorial committee of the Journal of Pediatric Gastroenterology and Nutrition, and wefinally decided to publish them due to the clear differences in intakes on the short-term (24 h), even if data on the medium or long-term effects were lacking.Nevertheless, it could represent a good starting point to consider the effects of com-plementary feeding on breastfeeding for developing (or better, ‘transition’) countries.Perhaps Dr. Dewey could add some information from their previous studies in CentralAmerica.
Dr. Pencharz: What you have described is really important in infancy which isgreat, and we have actually done some work in children with cystic fibrosis (CF). Butbecause they are compelled to thrive, the question is how to approach that. So we didone relatively long-term study [3] published a number of years ago where the childrenwere under the classical fat-restricted diet. We followed them for a whole yearbecause children grow at different rates at different times of the year, and then wegave them basically high caloric milk shakes made from grocery foods of 1 cal/ml or100 cal/100 ml, and they grew faster. In that undernourished group who were taking alow fat feeding, we were able to get them to gain weight. Working later at the Hospitalfor Sick Children in Toronto we did a study which we called the boost study [4], that isa proprietary product which is 1 cal/ml which can be bought from the pharmacy inNorth America. Quite classically undernourished CF children in clinic would be giventhis boost, and all we found when we studied it was that it replaced food. In the clinicthis pharmacological product boost, which was high in fat, in other words about 35%of calories as fat, and is complete nutrition, just displaced food. It was only when wewent to tube feeding at night that we were able to increase the total calories in 24 h.
Dr. Agostoni: I am really now interested in CF because it is a very challengingmodel. I think that for CF infants we now are on the way to change some older beliefs,as you already underlined. First of all, there are very good examples of the functionalbenefits of human milk [5]. We have unpublished data showing that prolonged breast-feeding in CF patients, regardless of the genetic form of the disease, is associated witha 20% improvement in lung function years later. Once human milk was suggested not
Agostoni/Riva/Giovannini
156

to be good for CF, but today we know that it is also a good source of n-3 long-chainpolyunsaturated fatty acids [6] that may be beneficial for CF patients [7]. Regardingweaning in breastfed CF patients, we also have some preliminary indications [unpub-lished] that those who got better are those who received complementary food earlier,before 6 months, perhaps preventing some marginal form of undernutrition, in associ-ation with their increased demand.
Dr. Dewey: I want to come back to the energy density issue. Our study that youwere referring to was comparing intakes of infants whose mothers’ milk had differentfat contents and therefore different energy density. The infants were quite able tocompensate for that by changing the volume that was consumed, which is consistentwith what Dr. Ziegler was describing for formula-fed infants in those early studies. ButI think when it comes to complementary foods we still don’t completely understandthe consequences of different energy density of complementary foods on intake. Mycolleague Ken Brown has done quite a few studies on this, most of them with non-breastfed children. In that case, increasing energy density of the foods does tend toincrease the overall energy intake, even the volume consumed decreases a little bit.But in breastfed infants there is very little information. The study you showed fromIndia was for only 24 h. There is a small study in Bangladesh [8] which used acrossover design with higher and lower energy density complementary foods. Thehigher energy density did increase the total energy intake but when the children inthat group crossed back over to the lower energy density diet, we expected that thebreast milk intakes would respond by going back up, and that didn’t occur. I think wecertainly need to keep in mind that although lactation is probably very flexible in earlyinfancy we are not sure that it is quite as flexible later on. If you have a reduction inbreast milk intake you may not be able to rebound quite as easily as when the baby isyoung. So adding fat or increasing the intake from other foods may permanentlyreduce breast milk intake, which may not be a desirable consequence.
Dr. Agostoni: Do you mean in the second part of the first year of life, for example?Dr. Dewey: Yes, after 6 months, but I would like to ask a question about the stud-
ies that you mentioned on the relationship between breastfeeding and child obesity.You mentioned the most recent meta-analysis by Owen et al. [9] and I want to maketwo points about that. It is very different from the other meta-analyses because it is onthe mean body mass index, not the percentage overweight, and that is importantbecause breastfeeding may be affecting both ends of the distribution, both the per-centage overweight and the percentage underweight. If that is true then the meanbody mass index may not change at all even if you have a reduction in the percentageoverweight. The other point is that they group all the ages together in terms of whenbody mass index was measured later on. From my reading of the literature the rela-tionship between breastfeeding and later obesity is strongest when you look at over-weight between, for example, 6 and 14 years of age. The relationship is not very clearin early childhood and it is not very clear after about 18 years. So by putting the agegroups all together I think you dilute any relationship.
Dr. Agostoni: First of all, I would like to take the opportunity to give my opinion.Yesterday I mentioned that there are glutamine believers and glutamine non-believers.We can say the same about breastfeeding; we are humans and therefore have our opin-ions, and it is sometimes difficult to adjust for this. The second point, you mentionedcorrectly that the preventive effects of breastfeeding on obesity are more evident inthe first 6–14 years. Some years ago in the New England Journal of Medicine, therewas a paper showing that overweight in adolescence predicted a broad range ofadverse health effects that were independent of adult weight after 55 years of follow-up [10]. Even if we still do not know when overweight has its major negative impact onthe later outcome, a prevention of overweight in adolescence could also have relevantpreventive effects.
Complementary Food
157

Dr. Barclay: I have a question about the protein-energy ratio in complementaryfoods. For rural regions in developing countries, if I understood you correctly, you saidthat there is a risk of protein deficiency during weaning. You showed on one of yourslides that the minimum protein-energy ratio required during weaning is about 6–7%.Now if you look at the protein-energy ratio of cereal-based diets, rice has a protein-energy ratio of about 7–8% and cereals such as wheat about up 12–15%. A large multi-centric study in Mexico, Egypt and Kenya published by Beaton et al. [11] in the early1990s showed that for young children consuming cereal-based diets, protein defi-ciency was unlikely as long as the energy requirements were covered, since theprotein-energy ratio of the diet would be at least 8–12%. Although the protein require-ments could be somewhat higher in these regions due to higher infection rates, can weconclude that there is a risk of protein deficiency?
Dr. Agostoni: This is a complex question. First of all I was referring to a mixeddiet, including animal and vegetal proteins. Moreover, reaching the correct limits ofenergy requirements could also be positive with regard to the nitrogenous balance,since the re-utilization rate could be more efficient. Third, I would like to emphasizethat when you add minimal amounts of animal protein, as a source of essential aminoacids, you automatically improve the nutritional efficiency of vegetable proteins,because you also supply some essential amino acids otherwise limiting if you just sup-ply vegetal proteins. The present indications for developing countries are to find localsolutions combining some animal sources of ‘exceeding’ essential amino acids togetherwith staple cereals. It is a matter of present research to optimize interventions in thisway; it is not simply the question to increase the protein-energy ratio of foods.
Dr. Axelsson: You showed a slide about the recommendations for Italian infants onhow to introduce different complementary feedings. We start with human milk andstandard infant formula, and then when we have standard infant formula we try tomake it similar to human milk. Then why do we adapt it to cows’ milk, and why do weneed long-term formula?
Dr. Agostoni: There are some discrepancies between expert opinions and thepolitical conclusions from regulatory bodies. My personal opinion would be to putmuch effort into the formula for the first weeks of life, to plan a sort of ‘functional for-mula’ very rich in bioactive compounds, followed by a different formula for the 4–6- to52-week period, reduced in proteins compared to actual standards. Human milk com-position in Italy seems always to be the same, starting from 10–15 days of lactation upto 12 months of age, as we have shown for fat content and composition [6].
Dr. Axelsson: Since evolution we have been adapting; we were hunters. But whycan’t we make formulas for the later part of infancy on meat?
Dr. Agostoni: It is interesting because this is a typical question from Sweden orNorway, also considering the changing genetic pattern with regard to lactose toler-ance from the north to the south. On the evolutionary standpoint there are some basicquestions still unanswered: who is the best human to adapt himself; the most intelli-gent; the most beautiful for reproduction? Perhaps those who were stronger adaptedthemselves to meat; those who were more pacifist raised cows; so we would speculatethat what people have done in the evolutionary process represents the basis of somedifferent dietary habits.
Dr. Roggero: I was impressed by one of your slides showing that insulin-likegrowth factor-1 (IGF-1) doesn’t increase when you give meat to the children. It isknown that IGF-1 increases when the protein intake increases and, from the lecturesof this meeting, it appears that IGF-1 is related to the level of proteins. Can you com-ment on that?
Dr. Agostoni: I can just comment on the work from Hoppe et al. [12] who didn’t findany association between insulin secretion and blood levels of branched chain amino
Agostoni/Riva/Giovannini
158

acids. This is the key point as leucine (the main branched chain amino acid) is a strongpromoter of insulin secretion and also IGF-1. Perhaps the tertiary structure of proteinsplays some role, or something else that we still don’t know. So we are still far from theexplanation; we only have these preliminary, yet very interesting observations.
References
1 Singh PK, Sachdev HP, Nagpal J, et al: Short-term effect of complementary feeding frequencyon total ad libitum consumption in 6- to 10-month-old breast fed Indian infants. J PediatrGastroenterol Nutr 2005;41:422–425.
2 Bajaj M, Dubey AP, Nagpal J, et al: Short-term effect of oil supplementation of complementaryfood on total ad libitum consumption in 6- to 10-month-old breastfed Indian infants. J PediatrGastroenterol Nutr 2005;41:61–65.
3 Pencharz PB: Energy intakes and low-fat diets in children with cystic fibrosis. J PediatrGastroenterol Nutr 1983;2:400–402.
4 Ellis L, Kalnins D, Corey M, et al: Do infants with cystic fibrosis need a protein hydrolysateformula? A prospective, randomized, comparative study. J Pediatr 1998;132:270–276.
5 Parker EM, O’Sullivan BP, Shea JC, et al: Survey of breast-feeding practices and outcomes inthe cystic fibrosis population. Pediatr Pulmonol 2004;37:362–367.
6 Marangoni F, Agostoni C, Lammardo AM, et al: Polyunsaturated fatty acid concentrations inhuman hindmilk are stable throughout 12-months of lactation and provide a sustained intaketo the infant during exclusive breastfeeding: an Italian study. Br J Nutr 2000;84:103–109.
7 Cawood AL, Carroll MP, Wootton SA, Calder PC: Is there a case for n-3 fatty acid supplemen-tation in cystic fibrosis? Curr Opin Clin Nutr Metab Care 2005;8:153–159.
8 Kimmons JE, Dewey KG, Haque E, et al: Low nutrient intakes among infants in ruralBangladesh are attributable to low intake and micronutrient density of complementary foods.J Nutr 2005;135:444–451.
9 Owen CG, Martin RM, Whincup PH, et al: The effect of breastfeeding on mean body massindex throughout life: a quantitative review of published and unpublished observational evi-dence. Am J Clin Nutr 2005;82:1298–1307.
10 Must A, Jacques PF, Dallal GE, et al: Long-term morbidity and mortality of overweight ado-lescents. A follow-up of the Harvard Growth Study of 1922 to 1935. N Engl J Med 1992;327:1350–1355.
11 Beaton GH, Calloway DH, Murphy SP: Estimated protein intakes of toddlers: predicted preva-lence of inadequate intakes in village populations in Egypt, Kenya, and Mexico. Am J ClinNutr 1992;55:902–911.
12 Hoppe C, Molgaard C, Vaag A, et al: High intakes of milk, but not meat, increase s-insulin andinsulin resistance in 8-year-old boys. Eur J Clin Nutr 2005;59:393–398.
Complementary Food
159


What Is the Optimal Age forIntroduction of Complementary Foods?
Kathryn G. Dewey
Department of Nutrition, University of California, Davis, CA, USA
AbstractIn 2001, a WHO Expert Consultation concluded that waiting until 6 months to
introduce complementary foods to breastfed infants confers several benefits for bothinfants and mothers. Nonetheless, there is still controversy about this issue. In devel-oping countries, the reduced risk of infant gastrointestinal illness and increased dura-tion of maternal lactational amenorrhea associated with exclusive breastfeeding for 6months make the benefit-risk ratio of this recommendation highly favorable. In indus-trialized countries, the case is less clear-cut, but the benefit-risk ratio is also likely tobe favorable with regard to infant infectious morbidity, motor development and mater-nal weight loss postpartum. For outcomes such as infant growth, food acceptance andiron or zinc status, the evidence for industrialized countries suggests no particularbenefit but also very little risk of following this recommendation. Some exclusivelybreastfed infants may become iron- or zinc-deficient before 6 months, but this can beprevented more effectively by targeted iron and zinc supplementation to high-riskinfants than by introducing complementary foods. On the whole, the evidence to datesupports the WHO recommendation to introduce complementary foods at 6 months,but further research in industrialized countries would be useful.
Copyright © 2006 Nestec Ltd., Vevey/S. Karger AG, Basel
Introduction
Complementary foods are defined as the foods that are provided alongwith breast milk [1]. In the past, such foods were often called ‘weaning foods’.However, the term ‘complementary foods’ is preferred because weaning impliesthe cessation of breastfeeding, whereas the goal is that such foods shouldcomplement breast milk, not replace it. In May 2001 the 54th World HealthAssembly urged Member States to promote exclusive breastfeeding for 6months as a global public health recommendation [2]. This recommendation
161
Rigo J, Ziegler EE (eds): Protein and Energy Requirements in Infancy and Childhood.Nestlé Nutr Workshop Ser Pediatr Program, vol 58, pp 161–175,Nestec Ltd., Vevey/S. Karger AG, Basel, © 2006.

followed a report by a WHO Expert Consultation on the optimal duration ofexclusive breastfeeding [3], which considered the results of a systematicreview of the evidence [4]. The Expert Consultation concluded that waitinguntil 6 months to introduce complementary foods to breast-fed infants con-fers several benefits on the infant and the mother. Prior to 2001, the WHOrecommendation had been to introduce complementary foods at ‘4–6 months’of age, but by the time of the systematic review, enough evidence had accu-mulated to warrant changing the wording to ‘6 months’. The WHO recom-mendation is meant to apply to all countries, but its ramifications areprobably greatest in developing countries. A large percentage of developingcountries have now adopted a government policy in concordance with theWHO 2001 recommendation.
In several industrialized countries, however, there is a difference of opin-ion among professionals about whether to recommend 6 months or 4–6months as the optimal age for introduction of complementary foods. Forexample, in the most recent American Academy of Pediatrics PediatricNutrition Handbook [5], both views are expressed. In the chapter onComplementary Feeding (p 108), the main text states, ‘It seems reasonable,therefore, to recommend that in developing countries, where the use ofpotentially contaminated and/or low-nutrient dense foods puts infants at riskfor diarrhea and undernutrition, infants should be exclusively breast fed for 6months. If this is not the case (either in developing or, in particular, devel-oped countries), complementary foods may be introduced between ages 4and 6 months. This is a population-based recommendation, and the timing ofintroduction of complementary foods for an individual infant may differ fromthis recommendation*.’ The asterisk refers to a footnote at the bottom of thepage, which states ‘There is a difference of opinion among AAP experts onthis matter. The Committee on Nutrition acknowledges that the Section onBreastfeeding recommends exclusive breastfeeding for at least 6 months’. Infact, the footnote has an error, and should have stated ‘recommends exclusivebreastfeeding for about 6 months’, not ‘at least 6 months’ [Gartner L, personalcommun.]. This error will be corrected in an erratum.
This lack of agreement among health professionals in some countries is inpart due to the paucity of evidence on this issue from randomized trials inindustrialized countries. In the systematic review conducted for WHO [4],studies were included if they were clinical trials or observational studies thatcompared outcomes between full-term infants and their mothers who hadbreast fed exclusively for �6 months (EBF) vs. those who had breast fedexclusively for at least 3 months, with continued mixed breastfeeding andcomplementary feeding until at least 6 months (MBF). The literature searchidentified 2,668 unique citations, but only 36 met the selection criteria for thereview. These 36 citations were from 20 separate studies, of which 9 were car-ried out in developing countries and 11 in industrialized countries. However,of these 20 studies, only two were controlled clinical trials of EBF vs. MBF.
Dewey
162
Both of these were conducted in Honduras by our research team [6–13]. Inthe first study, 141 low-income mother-infant pairs who were exclusivelybreastfeeding at 4 months postpartum were randomly assigned to begin com-plementary foods at 4 months or continue exclusive breastfeeding until 6months. Nutrient-rich, commercially prepared baby foods were provided injars to the former group. The second study used a similar design but wasrestricted to low birth weight (but full-term) infants (n � 119). To date, therehave been no published randomized trials of EBF vs. MBF in industrializedcountries.
Several health outcomes may be influenced by the age at introduction ofcomplementary foods, including infant growth, iron and zinc status, infec-tious morbidity, behavioral development and food acceptance, and maternalduration of lactational amenorrhea and the rate of postpartum weight loss.The following sections address each of these categories of outcome, withemphasis on studies relevant to comparing 4–6 months vs. 6 months as theoptimal age for introduction of complementary foods.
Infant Growth
The authors of the systematic review concluded that there was no evi-dence for any deficit in weight or length gain among infants who are exclu-sively breast fed for 6 months compared to those given complementary foods[4]. This is probably because the energy provided by complementary foodslargely displaces breast milk during the 4- to 6-month age interval. For exam-ple, in the first of our controlled trials in Honduras, breast milk intakedecreased by �100 g/day in the group that received complementary foodsand were breast fed ad libitum between 4 and 6 months, but was unchangedin the EBF group [6]. Similar results were found in the second controlled trialof term, low birth weight infants in Honduras [12]. In a previous observationalstudy in the US, the breast milk intake of infants given complementary foodsat 4–6 months was significantly lower than that of infants who were exclu-sively breast fed for 6 months, with the difference being �150 ml/day at both6 and 9 months of age [14]. As a result, total energy intake (from both breastmilk and complementary foods) and growth status did not differ significantlybetween these 2 groups at 6, 9 or 12 months.
Other observational studies in industrialized countries have also shown lit-tle or no growth difference between EBF and MBF infants [15–17]. For exam-ple, in a pooled analysis of data from 7 studies in North America and northernEurope, infants given complementary foods (but not formula) in addition tobreast milk between 4 and 6 months (n � 122) did not differ from EBF infants(n � 200) in weight gain (936 � 330 vs. 925 � 283 g) or length gain(3.48 � 0.96 vs. 3.44 � 0.86 cm) during the 4- to 6-month interval, with orwithout controlling for initial size at 4 months [1]. In a large cohort study
What Is the Optimal Age for Introduction of Complementary Foods?
163

nested within a randomized trial in Belarus, Kramer et al. [17] found thatweight and length gain from 3–6 months were slightly greater in the 2,862infants who were exclusively breast fed for 3 months and then mixed-fedthrough �6 months (MBF) than in the 621 infants who were exclusivelybreast fed for �6 months (EBF). However, the EBF group had greater lengthgain from 9 to 12 months and a larger head circumference at 12 months thanthe MBF group. In subsequent analyses of the same cohort, the MBF groupwas subdivided based on the types of complementary foods consumed: for-mula or other milks, cereals, juices or other liquids, and other solids. Theseanalyses revealed that formula and other milks had a growth-acceleratingeffect on weight and length gain throughout infancy (a result that is consistentwith the differences in growth observed between breast-fed and formula-fedinfants [15]), whereas the intake of cereal at 3–6 months was associated withsubstantially lower weight, length and head circumference gain during thatinterval (z-score differences of –0.29, –0.24 and –0.29, respectively), com-pared to the EBF group [18]. Thus, the type of complementary food consumedappears to influence the nature of the growth response.
Infant Iron and Zinc Status
There is very little information on the effects of the age at introduction ofcomplementary foods on iron or zinc status of breast-fed infants. These twonutrients have been identified as the most likely limiting nutrients amongEBF infants during the first 6 months of life [19]. Although the adequacy ofcertain vitamins during the period of exclusive breastfeeding may also be ofconcern, depending on maternal diet and nutritional status, these concernscan generally be addressed by assuring that the mother’s intake is adequate(e.g. for vitamin A, B6, or B12). By contrast, the concentrations of iron andzinc in human milk are not altered by maternal supplementation.
During the first 6 months, infant iron status is largely dependent on ironstores at birth, which are influenced by gestational age, birth weight, maternalprenatal iron status, and the timing of clamping of the umbilical cord. Afterbirth, infant iron needs are influenced by the rate of growth and certain typesof infections. Thus, although full-term, normal birth weight infants whosemothers had adequate prenatal iron status can generally maintain adequateiron status through �6 months of exclusive breastfeeding, certain subgroupsof infants may be at risk of iron deficiency prior to 6 months.
In the first controlled trial in Honduras, very few of the EBF infants with abirth weight of �3 kg had low hemoglobin (5% � 103 g/l) or plasma ferritin(0% � 12 �g/l) at 6 months of age, but in those with a birth weight of �3 kg,the EBF infants were at higher risk of iron deficiency than the infants whoreceived complementary foods (�49 vs. 27% for low hemoglobin; �26 vs.10% for low ferritin) [10]. This is not surprising given that the complementary
Dewey
164

foods were fortified with ferrous sulfate. However, the provision of free iron-fortified complementary foods during the age interval of 4–6 months did noteliminate iron deficiency at 6 months. Evidence from a separate study of ironsupplementation in the same population [20] indicates that iron supplementsgiven to high-risk infants are likely to be more efficacious for preventing irondeficiency than feeding iron-fortified complementary foods prior to the age of6 months. In the second Honduras trial, with term, low birth weight infants,there was a significant interaction effect between the provision of comple-mentary foods and iron supplementation. Among infants not given medicinaliron drops, iron status was higher in the group given iron-fortified comple-mentary foods than in the EBF group. However, in those given medicinal irondrops, iron status was higher in the EBF group, suggesting that comple-mentary foods interfered with iron utilization [11]. Given the recommen-dation that low birth weight infants should receive iron supplementsbeginning in early infancy, these results suggest that exclusive breastfeedingfor 6 months, together with iron supplementation, is likely to optimize ironstatus for such infants.
There is a paucity of data on the effects of age at introduction of comple-mentary foods on the iron status of breast-fed infants in other countries. In asmall observational study of breast-fed infants in Italy [21], the EBF group hadsignificantly higher hemoglobin concentration than the MBF group (117 vs.109 g/l) at 12 months of age. Although iron-fortified cereals are usually one ofthe first complementary foods given to infants in the US, the bioavailability ofthe electrolytic iron typically used in such foods is estimated to be quite low[22]. Among the breast-fed cohort (n � 173) in an intervention trial in Chile inwhich infants were randomly assigned to receive iron-fortified (55 mg elec-trolytic iron/100 g dry cereal) or unfortified rice cereal at 4 months [23], therewas no significant difference in iron status (e.g. serum ferritin) between groupsat 8 months of age, but by 12 months the group receiving unfortified cereal hada lower iron status and was more likely to be anemic (10.8 vs. 1.4%). This sug-gests that the iron in the cereal was absorbed, but that the breast-fed infantsdid not benefit from the extra iron until after 8 months of age.
As is the case for iron, the zinc concentration of human milk is relativelylow, and it is thought that low stores of zinc at birth may predispose certainsubgroups of infants to zinc deficiency [24]. In disadvantaged populations,zinc supplementation during infancy has generally had positive effects ongrowth and morbidity [25]. However, in the Honduras study of low birthweight infants, there was no impact of complementary foods on plasma zinc,even though the mean zinc intake of infants in the complementary foodsgroup was twice that of the EBF group [11]. In a randomized trial in the US inwhich infants at 5 months of age were given either beef or iron-fortified ricecereal as the first complementary food [24], no effect on growth, developmentor biochemical indices of iron or zinc status at 9 months was observed despitesignificant differences in zinc intake at 5–7 months. Thus, there is no evidence
What Is the Optimal Age for Introduction of Complementary Foods?
165

that complementary feeding prior to 6 months would enhance zinc status.High-risk infants, however, may benefit from zinc supplementation.
Infant Infectious Morbidity
Observational studies in developing countries show a much higher risk ofdiarrhea in breast-fed infants exposed to complementary foods at 4–6 monthsthan in those who were exclusively breast fed [1]. This difference was notobserved in the two controlled trials in Honduras [6, 12], presumably becausethe complementary foods were provided in sealed jars and leftovers were dis-carded after use, thus eliminating the risk of bacterial contamination. In indus-trialized countries, the study in Belarus demonstrated a significantly lower riskof gastrointestinal infection during the first year of life in the EBF group thanin the MBF group (adjusted incidence density ratio 0.35 (0.13, 0.96)), eventhough the overall rate of gastrointestinal infection was very low [17]. Pooledresults from studies in Australia [26], Arizona [27] and Belarus [17] showed nosignificant differences between EBF and MBF groups in the risk of upper orlower respiratory infection or otitis media [4]. However, a recent analysis ofdata from a US national survey indicated a reduced risk of respiratory infec-tion in infants who were fully breast fed for 6 vs. 4 months [28], though it isunclear what percentage of infants in the latter group continued to be breastfed (while receiving complementary foods) through 6 months.
Infant Behavioral Development
Motor development was assessed in the two controlled trials in Honduras.In both studies, infants in the EBF group crawled at an earlier age thaninfants in the group given complementary foods (6.3 vs. 7.3 months in thefirst study; 6.8 vs. 7.4 months in the second study) [13]. In the first study(but not in the second study), infants in the EBF group were also more likelyto be walking by 12 months of age (60 vs. 39%, p � 0.02). The mechanism bywhich exclusive breastfeeding during the 4- to 6-month age interval mightaffect motor development is unknown. Certain constituents of breast milk(e.g. docosahexaenoic acid) are known to be associated with infant mentaldevelopment, but there is little evidence that they affect motor develop-ment. On the other hand, Vestergaard et al. [29] reported that achievementof two motor skills (crawling and pincer grip) was linked to the duration ofbreastfeeding in a large sample of Danish infants, even after adjustment forpotentially confounding variables. Thus, it is possible that a greater consu-mption of breast milk by EBF infants could contribute to enhanced motordevelopment. To date there have been no published studies evaluating theeffect of age at introduction of complementary foods on infant cognitivedevelopment.
Dewey
166

Infant Food Acceptance
Some parents and health care providers believe that there is a ‘critical age’for infants to be introduced to complementary foods, and that waiting toolong will interfere with the infant’s acceptance of foods at a later age. This islinked to the notion of developmental ‘readiness’, an ill-defined concept thatnonetheless has a strong influence on parental behavior. In an effort toaddress this concern, our first study in Honduras included an assessment ofinfant dietary intake at 9 and 12 months, as well as the mother’s report ofinfant acceptance of 20 commonly consumed foods [8]. There were no signif-icant differences between intervention groups in breastfeeding frequency,amount or number of foods consumed, percentage of food offered that wasconsumed, usual daily number of meals and snacks, number of food groupsconsumed, or overall food acceptance score. In our study of breast-fed infantsin the US [14], 4-day weighed intake records of all foods and fluids (includingbreast milk) were completed every 3 months. Infants in the EBF group hadsignificantly higher intake of breast milk and lower intake of energy fromcomplementary foods at 9 months, compared to those introduced to comple-mentary foods before 6 months, but the differences were no longer significantat 12 months of age. As stated above, there were no significant differencesbetween groups in total energy intake at any age. Thus, delaying the intro-duction of complementary foods until 6 months does not appear to adverselyaffect subsequent infant appetite or food acceptance.
Maternal Duration of Lactational Amenorrhea
In the systematic review conducted for WHO [4], the authors concludedthat exclusive breastfeeding through 6 months is associated with delayedresumption of menses, which can promote more optimal birth spacing in pop-ulations with relatively low rates of contraceptive use. Their conclusion wasbased on the results of the two Honduras trials. The difference in the per-centage of mothers who were amenorrheic at 6 months postpartum was notstatistically significant in the first trial (though in the expected direction), butwas significant in the second trial (89% in the EBF group vs. 68% in the MBFgroup, p � 0.02) [13].
Maternal Weight Change Postpartum
Maternal weight change was also assessed in the two Honduras studies [13].Maternal weight loss between 4 and 6 months was significantly greater in theEBF group than in the complementary feeding group in the first study(�0.7 � 1.5 vs. �0.1 � 1.7 kg, p � 0.05), but not in the second study. The dif-
What Is the Optimal Age for Introduction of Complementary Foods?
167
ference between the two studies is probably related to the fact that the net dif-ference between intervention groups in milk volume, and thus in maternalenergy demand, was larger in the first study than in the second. In fact, theestimated additional energy burden of exclusive breastfeeding during the 4- to6-month interval was in close agreement with the between-group weight dif-ference in both studies (assuming that the weight lost was nearly all fat).Thus, the results support the conclusion that the degree of breastfeeding dur-ing this time period affects the rate of maternal weight loss. It should be notedthat only about 10% of the mothers in the Honduras studies had a low bodymass index (�19 kg/m2), so these results may also apply to women in industri-alized countries. In observational studies, the effect of lactation on maternalweight loss is most evident between 3 and 6 months postpartum, when breastmilk volume is still high but prolactin levels (which are thought to stimulateappetite) are lower than they are in early lactation [30]. Given the high rates ofobesity among women in many countries, promotion of exclusive breastfeed-ing for 6 months may thus be beneficial to maternal health.
Conclusions
The evidence to date supports the WHO recommendation to introducecomplementary foods at 6 months. In developing countries, the reduced riskof infant gastrointestinal illness and increased duration of maternal lacta-tional amenorrhea associated with exclusive breastfeeding for 6 months makethe benefit-risk ratio of this recommendation highly favorable. In industrial-ized countries, the case is less clear-cut, but the benefit-risk ratio is also likelyto be favorable. In these settings, waiting until 6 months to introduce comple-mentary foods is likely to be of benefit with regard to outcomes such as infec-tious morbidity, motor development and maternal weight loss postpartum.With regard to other outcomes, such as infant growth, food acceptance andiron or zinc status, the evidence suggests no particular benefit but also verylittle risk of following this recommendation. Some EBF infants may becomeiron or zinc deficient before 6 months, but this can be prevented more effec-tively by targeted iron and zinc supplementation to high-risk infants than byintroducing complementary foods. Further research is needed to documentthe impact of age at introduction of complementary foods on infants in indus-trialized countries.
References
1 World Health Organization: Complementary Feeding of Young Children in DevelopingCountries: a Review of Current Scientific Knowledge. Geneva, World Health Organization,1998, WHO/NUT/98.1.
2 World Health Assembly: Infant and Young Child Nutrition. Geneva, World HealthOrganization, 2001, Resolution 54.2.
Dewey
168

3 World Health Organization: The Optimal Duration of Exclusive Breastfeeding. Report of anExpert Consultation. Geneva, World Health Organization, 2001.
4 Kramer MS, Kakuma R: The Optimal Duration of Exclusive Breastfeeding. A SystematicReview. Geneva, World Health Organization, 2002.
5 Kleinman RE (ed): Pediatric Nutrition Handbook, ed 5. Chicago, American Academy ofPediatrics, 2004.
6 Cohen RJ, Brown KH, Canahuati J, et al: Effects of age of introduction of complementaryfoods on infant breast milk intake, total energy intake, and growth: a randomised interventionstudy in Honduras. Lancet 1994;344:288–293.
7 Cohen RJ, Brown KH, Canahuati J, et al: Determinants of growth from birth to 12 monthsamong breast-fed Honduran infants in relation to age of introduction of complementaryfoods. Pediatrics 1995;96:504–510.
8 Cohen RJ, Landa Rivera L, Canahuati J, et al: Delaying the introduction of complementaryfood until 6 months does not affect appetite or mother’s report of food acceptance of breast-fed infants from 6 to 12 months in a low-income, Honduran population. J Nutr 1995;125:2787–2792.
9 Dewey KG, Cohen RJ, Landa Rivera L, et al: Effects of age of introduction of complementaryfoods to breastfed infants on duration of lactational amenorrhea in Honduran women. Am JClin Nutr 1997;65:1403–1409.
10 Dewey KG, Cohen RJ, Landa Rivera L, Brown KH: Effects of age of introduction of comple-mentary foods on iron status of breastfed infants in Honduras. Am J Clin Nutr 1998;67:878–884.
11 Dewey KG, Cohen RJ, Brown KH: Exclusive breastfeeding for 6 months, with iron supple-mentation, maintains adequate micronutrient status among term, low birthweight, breastfedinfants in Honduras. J Nutr 2004;134:1091–1098.
12 Dewey KG, Cohen RJ, Brown KH, Landa Rivera L: Age of introduction of complementaryfoods and growth of term, low-birth-weight, breast-fed infants: a randomized interventionstudy in Honduras. Am J Clin Nutr 1999;69:679–686.
13 Dewey KG, Cohen RJ, Brown KH, Landa Rivera L: Effects of exclusive breastfeeding for 4 ver-sus 6 months on maternal nutritional status and infant motor development: results of two ran-domized trials in Honduras. J Nutr 2001;131:262–267.
14 Heinig MJ, Nommsen LA, Peerson JM, et al: Intake and growth of breast-fed and formula-fedinfants in relation to the timing of introduction of complementary foods: the DARLING study.Acta Paediatr 1993;82:999–1006.
15 WHO Working Group on Infant Growth: An Evaluation of Infant Growth: a Summary ofAnalyses Performed in Preparation for the WHO Expert Committee on ‘Physical Status: theUse and Interpretation of Anthropometry’. Geneva, World Health Organization, 1994,WHO/NUT/94.8.
16 WHO Working Group on the Growth Reference Protocol, WHO Task Force on Methods for theNatural Regulation of Fertility: Growth of healthy infants and the timing, type, and frequencyof complementary foods. Am J Clin Nutr 2002;76:620–627.
17 Kramer MS, Guo T, Platt RW, et al: Infant growth and health outcomes associated with 3 com-pared with 6 months of exclusive breastfeeding. Am J Clin Nutr 2003;78:291–295.
18 Kramer MS, Guo T, Platt RW, et al: Feeding effects on growth during infancy. J Pediatr2004;145:600–605.
19 Butte NF, Lopez-Alarcon MG, Garza C: Nutrient Adequacy of Exclusive Breastfeeding forthe Term Infant during the First Six Months of Life. Geneva, World Health Organization, 2002.
20 Domellof M, Cohen RJ, Dewey KG, et al: Iron supplementation of Honduras and Swedishbreastfed infants from 4 to 9 months of age: effects on hemoglobin and other indices of ironstatus. J Pediatr 2001;138:679–687.
21 Pisacane A, de Vizia B, Valiante A, et al: Iron status in breast-fed infants. J Pediatr1995;127:429–431.
22 Lynch SR, Stoltzfus R: Iron and ascorbic acid: proposed fortification levels and recommendediron compounds. J Nutr 2003;133:2978S–2984S.
23 Walter T, Dallman PR, Pizarro F, et al: Effectiveness of iron-fortified infant cereal in preven-tion of iron deficiency anemia. Pediatrics 1993;91:976–982.
24 Krebs NF: Zinc and breastfed infants: if and when is there a risk of deficiency?; in Davis MK,Isaacs CE, Hanson LA, Wright AL (eds): Integrating Population Outcomes, Biological
What Is the Optimal Age for Introduction of Complementary Foods?
169
Mechanisms and Research Methods in the Study of Human Milk and Lactation. New York,Kluwer Academic, 2002, pp 69–75.
25 Osendarp SJM, Santosham M, Black RE, et al: Effect of zinc supplementation between 1 and6 months of life on growth and morbidity of Bangladeshi infants in urban slums. Am J ClinNutr 2002;76:1401–1408.
26 Oddy W, Holt P, Sly P, et al: Association between breast feeding and asthma in 6 year old chil-dren: findings of a prospective birth cohort study. BMJ 1999;319:815–819.
27 Duncan B, Ey J, Holberg C, et al: Exclusive breastfeeding for at least 4 months protectsagainst otitis media. Pediatrics 1993;91:867–872.
28 Chantry C, Howard C, Auinger P: Full breastfeeding duration and associated decrease in res-piratory tract infection in US children. Pediatrics 2006;117:425–432.
29 Vestergaard M, Obel C, Henriksen T, et al: Duration of breastfeeding and developmental mile-stones during the latter half of infancy. Acta Paediatr 1999;88:1327–1332.
30 Dewey KG: Impact of breastfeeding on maternal nutritional status; in Pickering LK, Morrow AL,Ruiz-Palacios GM, Schanler RJ (eds): Protecting Infants through Human Milk: Advancing theScientific Evidence Base. New York, Kluwer Academic, 2004, pp 91–100.
Discussion
Dr. Dewey: With regard to the effects of iron supplements, Dr. Lönnerdal, Dr. Hernell and I conducted a joint study [1]. The two countries studied were Swedenand Honduras, with the goal being to have a very wide range in iron status of theinfants. It was a double-blind randomized controlled trial of babies who were exclu-sively breastfed for 6 months and then given other foods while continuing to be breast-fed until 9 months or longer. They were randomized to receive iron from 4 to 9 or from6 to 9 months of age, with a placebo from 4 to 6 months or from 4 to 9 months of age.We were interested in both the 4- to 6- and the 6- to 9-month intervals. We found thatin Honduras, where iron deficiency is common, iron supplementation had a beneficialeffect on iron status. In Sweden, where iron deficiency is not common, there was noimpact on the already low rates of iron deficiency anemia. Giving iron supplements tobabies who had normal hemoglobin levels at 4 months of age had an adverse effect onlinear growth and it also increased the risk of diarrheal morbidity. Even in Honduras,where most of the babies were at a greater risk of iron deficiency, we found the samething among those who had normal hemoglobin. Thus there was an interaction effectbetween the initial iron status of the infant and the effect of the supplement: beneficialfor those who need it but risky for those who don’t need it. That is why we don’t rec-ommend routine iron supplementation to breastfed infants.
Dr. Turck: I have two questions. The first is related to the Kramer study inBelarus. You said that infants exclusively breastfed for at least 6 months had a largerhead circumference at 12 months of age, which is very interesting. Could you com-ment on that further? The second question is related to the allergy issue. Obviouslythe literature is controversial in that. Could you give us your own opinion; how do youfeel on the issue of the optimal time of complementary feeding in infants at risk?
Dr. Dewey: Those are both very good questions. For the first one, the head cir-cumference data were analyzed as an observational study [2]. In other words, eventhough it was a randomized trial of the baby friendly hospital initiative, the growthdata were examined by feeding mode controlling for socioeconomic status, educa-tional level and several other variables. We have not found differences in our own pop-ulation in head circumference between breastfed and formula-fed infants, but in theBelarus study they had a very large sample size, more than 17,000 infants. So it isprobably a very small difference in head circumference that they detected. Whetherthat is biologically meaningful, I don’t know. Regarding the second question on allergy,
Dewey
170

I am going to ask others in the audience to comment. I think the allergy area is so com-plicated that it is difficult to know where things stand in terms of duration of exclusiveor any breastfeeding because of the potential exposure both in utero as well as frombreast milk and other foods. I would like Dr. Hernell to talk a little bit about someissues regarding the age at introduction of complementary foods and celiac disease,because that is one issue that has come up recently.
Dr. Hernell: We have studied the effect of breastfeeding on the introduction ofgluten with respect to the risk of developing celiac disease [3]. In the case referentstudy that we did in Sweden, we found that the most beneficial way of introducinggluten was to introduce it in small amounts and gradually, while the mother is stillbreastfeeding. With respect to the question whether there is a particular age windowwhen it is more favorable to introduce gluten, the results are conflicting. We foundthat it was perhaps a greater risk to introduce gluten-containing foods between 4 and6 months than before or after that age. However, age was not found to be an inde-pendent risk factor in multivariate analysis adjusting for breastfeeding and the amountof gluten. There are two other more recent studies on the development of celiac dis-ease in infants with heredity for diabetes mellitus type-1. With respect to age at intro-duction being a risk factor, these two studies come to different conclusions. Hence, Idon’t think that we know whether there is a particular age when it is beneficial tointroduce gluten. For the moment we can conclude that more important than the ageat introduction is that the introduction occurs under the umbrella of breastfeeding.The question arises if, for one reason or another, a mother decides to stop breastfeed-ing before 6 months, the recommended duration of exclusive breastfeeding, should werecommend that the mother introduce gluten-containing foods before she stopsbreastfeeding? I believe it is routine in most cultures to introduce other foods duringbreastfeeding. Whether or not that is beneficial also in terms of developing oral toler-ance to other food antigens than gluten is an unsolved question. There are very fewstudies that have addressed this question.
Dr. Lafeber: What always puzzles me in this type of study is how the randomiza-tion has been organized because it is difficult to have a good randomized control trialwhen dealing with the implementation of breastfeeding followed by weaning foods.How sure are you about the fact that the groups have been randomly divided regard-ing the introduction of complementary foods?
Dr. Dewey: Of course the studies in Honduras could not be double-blind becausethe mothers obviously knew that they were feeding other foods to their babies. I willsay though that the mothers were not aware of what our objectives were or whetherwe had any hypothesis about what the outcomes would be. The two groups were notsignificantly different in any variables that would have affected the outcomes. In termsof adherence to their assignments, we had virtually 100% adherence in the solid foodsgroup because they were given the foods free of charge. We did have a few mothers inthe group assigned to exclusive breastfeeding who didn’t necessarily completelyadhere to that, but they gave very small amounts of food so that was not a major issue.
Dr. Giovannini: Do you have any data on 1-year lactational amenorrhea and onnipple erosion in this period? In some countries there is a risk of nipple erosion andinfection due to hygiene problems. Have you any data about this from 12 to 24months?
Dr. Dewey: For the first question, the data that I presented were for lactationalamenorrhea at 6 months postpartum, when there was a significant difference. The dif-ference was no longer significant at 12 months, which is not too surprising because wewere looking for what happened right after that period of 4–6 months, and there aremany other influences on what is going to happen after that. You could ask if there isany longer term consequence of sustaining amenorrhea a little bit longer during that
What Is the Optimal Age for Introduction of Complementary Foods?
171

period of time, but in any case this is what we found. I have not heard of nipple erosionas a problem in the populations that I have worked with. In most cases breast milk hassome anti-infective properties that usually protect the mother’s nipple as well. Unlessthere is some underlying immune disorder I would think it would be relatively uncom-mon. We do have problems with yeast infection but that is more common in industrial-ized countries to my knowledge than it is elsewhere.
Dr. Telmesani: I always tell the mothers that when Eve came to earth she didn’thave anything but her breast milk. I believe your talk is in keeping with nature. Youmentioned that in areas where there is not enough sun, vitamin D needs to be added.In Saudi Arabia we have plenty of sun but occasionally we see rickets because peoplethere are afraid of the sun and tend to cover their babies to protect them, and so theyget rickets. I think this is an issue that needs to be taken into consideration in certainsocieties where people think that the sun is harmful.
Dr. Dewey: I agree with you. I think the phrase I used was insufficient exposure tosunlight, not necessarily insufficient sunlight. Certainly in cultures where people arecovered or use sunscreen they will not get adequate vitamin D conversion in the skin,and that is why the American Academy of Pediatrics recently recommended vitamin Dsupplementation for breastfed infants, beginning around 2 months of age. It is an issuethat developing countries really have to struggle with because that is a difficult rec-ommendation to implement in countries with poor resources. I think one has to evalu-ate very carefully whether sunlight exposure is or is not adequate in those places.
Dr. Pencharz: You fully persuaded me and provided very good data that supportthe WHO recommendation. I work at the Hospital for Sick Children where the firstprecooked infant cereals were developed by Tisdale, Drake and Robertson. At thattime infant mortality in Toronto was something like 100 per 1,000 live births, and theprofessor of pediatrics took on these researchers to develop a precooked infant cerealwith added iron and vitamins to reduce infant mortality rates. In fact they did reducethe mortality rates down to about 17–20 per 1,000 live births. So you told us when, Irather now challenge you but it wasn’t your mandate to say what should we be dealingwith complementary foods from 6 months on.
Dr. Dewey: Let me refer you to some documents that have been published. Firstthere was a book published by the WHO in 1998 [4] and then an update to the bookand a document published in 2003 [5]. The latter was meant for health care workers.There are 10 guidelines and for each of them there is a scientific rationale. Several ofthose deal with what types of food should be given, with particular emphasis on nutri-tional quality. The most limiting nutrients in most populations are iron, zinc, vitaminB6, possibly calcium and some other B vitamins. One of the conclusions is that animalsource foods need to be a part of the diet as much as possible because they are thericher sources of those nutrients. If that is not possible or the amounts consumed aretoo small, then some sort of fortified product or some sort of supplementation is rec-ommended. We have been doing several studies on various strategies to achieve that,either with fortified foods or with micronutrient supplements that can be added tofood in the home. You are familiar with Sprinkles which Dr. Zlotkin developed, andthere are other products as well. I think Dr. Desjeux is going to talk about a fat-basedproduct developed in France that is very promising. We used it recently in a random-ized trial in Ghana and it had very positive effects on infant growth and motor devel-opment. So I think we are moving forward in terms of how we approach that issue.
Dr. Butte: I want to emphasize one point that you made from WHO statement,which I think is very important, that the recommendation for exclusive breastfeedingto 6 months is a public health recommendation at the population level. You alluded tobut didn’t show the list of warnings that we also put in our report that it doesn’t pre-clude growth monitoring at the individual child. So the recommendation at the clinicalsetting is different and we can’t lose sight of that. Do you have any experience with
Dewey
172

iron drops in the clinical setting in the developing world, and is there a potential formisuse in illiterate populations?
Dr. Dewey: Let me comment on your first point and then answer the second. Ithink it is important to emphasize that on the individual level one always has to moni-tor whether exclusive breastfeeding is working. In my experience when there areproblems with exclusive breastfeeding they usually occur early on, in the first fewmonths of life, and it is not so common that a mother would breastfeed exclusively for4 months and then have a problem with sustaining exclusive breastfeeding. Evenmothers who are moderately malnourished tend to be able to continue to produce anadequate amount of milk. But I do agree that growth monitoring is important and Iwant to mention the new growth charts that are going to be put out next year, whichwere developed by the WHO based on children who were breastfed. To answer thesecond question, we did give iron supplements using drops in the trial in Honduras.We were worried about either misuse or toxicity, but we didn’t have any problems atall. I was pleased that they used them as instructed and we had no accidents or poi-sonings. Now certainly it can happen and has happened, but I think the supplementsare manufactured so that the dose one would get from an entire bottle would not befatal. So I think they are safe products. The Sprinkles that I just alluded to are one pos-sibility after the age of 6 months when you are giving other foods, but prior to 6months we don’t have too many options.
Dr. Margolis: The Canadian Pediatric Society went with the WHO recommenda-tions, and my question relates to the American Academy of Pediatrics and practice interms of what you presented and the clear lack of evidence in developed countries.Could you comment on why the American Academy of Pediatrics did what it did, andhow do we look at the changes based on the fact that there is no good evidence con-trary to using exclusive breastfeeding to 6 months?
Dr. Dewey: I am not sure I can comment on the American Academy of Pediatricsdocument, as I am not a member of either of those committees. In the US there is along history of recommending 4–6 months and we have a large government program,the Women, Infants and Children Nutrition Program, that has been doing that fordecades. So I think there is a lot of inertia around making a change and I think the atti-tude is that until there is really strong evidence to change it, they would rather stickwith what they had before.
Dr. Baker: I am in the committee so I will try to make a comment. We had exactlythe same literature that you had to review and we came up with different conclusions.There just didn’t seem to be a significant amount of negative effects from introducingcomplementary feeding between 4 and 6 months. It seems as though there would be asubgroup of babies with definitely detrimental effects so that is why we came up withthat recommendation of 4–6 months. It was argued long and hard and that is the rea-son we could not come to an agreement between breastfeeding group and the com-mittee on nutrition. I would like to ask another question about your presentation. Youpresented a slide on the Honduras study where you showed that breastfeeding pluscomplementary feeding, the amount of breast milk went down in the mothers whowere giving complementary foods, but stayed level in the mothers who were exclu-sively breastfeeding. At the same time those babies were growing significantlybetween 4 and 6 months. How do you explain that, because they weren’t getting morebreast milk during that time?
Dr. Dewey: We have also observed in the US and in other populations that thebreast milk volume changes very little between around 2 and 6 months of age, even inexclusively breastfed infants. I think the reason is that growth becomes a lower andlower proportion of the energy requirements. I can’t tell you the exact percentage at 6months, but by that time you can grow normally with a small amount of additionalenergy. We have calculated whether they meet the new energy requirements that have
What Is the Optimal Age for Introduction of Complementary Foods?
173

been published, and they were right on the mark. We have observed the same phe-nomenon in the US too, that when babies are given solid foods they reduce theirintake of breast milk and there is very little net increase in total energy intake. Thathas been observed in Texas as well. What is interesting though is that when formula-fed infants were given solid foods, they did not reduce their formula intake, which isvery different from breastfed infants. I think this raises some questions about the self-regulation of energy intake in the formula-fed group.
Dr. Macé: In the case of insufficient delivery of human milk, what will be your rec-ommendation, to complement with infant formula or complementary foods?
Dr. Dewey: What I would say is when there is a problem, first try to understandwhy there appears to be a low transfer of breast milk, and work with the mother toresolve that problem. If there is no resolution after doing that (without waiting toolong), before 6 months I would recommend supplementing with infant formula andnot with foods. The reason for that is that the nutrient composition of infant formula isusually much better than the composition of most complementary foods. The findingsfrom the analysis by Kramer et al. [2] in Belarus showed that cereal intake at 3–6months was associated with potentially adverse consequences. I hesitate to make toomuch out of that because it was an observational study, but infant cereals in largequantities are not really what human infants were designed to consume. In evolution-ary times, mothers pre-masticated meats and other food such as nuts, to feed theirinfants. Grains have only become a major part of our diet in the last 10,000 years or so.
Dr. Mohd Suhaimi Abdul Wahab: Do you think that in the future the recommen-dation will go up to 9 months rather than 6 months?
Dr. Dewey: No I don’t, and the reason is that after 6 months of age infants really doneed to get nutrients from other sources because by that time a larger and larger per-centage of them will be running low on iron stores and probably also zinc. In addition,giving foods is important for oral development and speech because moving food in themouth is part of normal oral development. From a practical point of view, even if youwanted to delay giving other foods to a baby beyond 6 months, it is really hard to dothat because then they start grabbing and putting things in their mouths. So I don’tsee much of push to go beyond 6 months.
Dr. Hilmanto: Do you recommend giving iron supplements in the early infancy forlow birth weight infants even though they are being exclusively breastfeeding for 6months? If yes, when do you recommend to start giving iron supplements?
Dr. Dewey: I will do my best on that, but there may be other people in the roomwho would also like to answer. There is a WHO recommendation to give iron supple-ments to low birth weight infants beginning at 1–2 months of age. There is good evi-dence that low birth weight infants start running low on iron stores by around thattime. The definition of exclusive breastfeeding that the WHO uses includes the use ofvitamin and mineral supplements as needed. So when you are giving iron supplementsto babies who are getting only breast milk, they can still be considered exclusivelybreastfed. In terms of when exactly to begin those supplements, I don’t think there isenough research right now to know the answer to that question. Perhaps Dr. Hernellwould like to comment.
Dr. Hernell: There is a study going on in Sweden right now on preterm infants andiron supplement, a control trial. There is no information as to when you should start,how much iron should be given, and for how long.
Dr. Bozo: I have a comment about the age at introduction of solid foods. For exam-ple, in developing countries a real problem is the reaction of the family to the programof introduction of solid foods. At 6 months of age we have to start introducing nutri-ents fortified with iron, zinc, etc., but we cannot be sure that the family will complywhen we make this recommendation. There could be a risk of developing zinc defi-ciency and iron deficiency if the age at introduction of solid foods is delayed.
Dewey
174
Dr. Dewey: As I indicated I think that one of the outstanding issues is how to iden-tify which exclusively breastfed infants might be at risk of iron deficiency before 6months of age. My recommendation would be that if a baby is a full-term normalweight breastfed baby whose mother did not have iron deficiency during pregnancy,you would not need to worry about that. Otherwise I personally would recommenddoing assessments at perhaps 4 months of age to determine if the baby has low ironstatus at that time. But as I mentioned I am not sure providing foods to them at thatpoint would solve the problem even if they do have iron deficiency, because we stillhad a substantial percentage in Honduras who were iron-deficient at 6 months despitegetting iron-fortified foods. But I think in terms of iron supplementation some sort oftesting for those who might be at high risk would be worthwhile.
References
1 Dewey KG, Domellof M, Cohen RJ, et al: Iron supplementation affects growth and morbidityof breast-fed infants: results of a randomized trial in Sweden and Honduras. J Nutr 2002;132:3249–3255.
2 Kramer MS, Guo T, Platt RW, et al: Feeding effects on growth during infancy. J Pediatr2004;145:600–605.
3 Ivarsson A, Hernell O, Stenlund H, Persson LA: Breast-feeding protects against celiac disease.Am J Clin Nutr 2002;75:914–921.
4 WHO: Complementary Feeding of Young Children in Developing Countries: a review of cur-rent scientific knowledge. Geneva, World Health Organization, 1998.
5 Guiding Principles for Complementary Feeding of the Breastfed Child. Washington, PAHO/WHO, Division of Health Promotion and Protection/Food and Nutrition Program, 2003.
What Is the Optimal Age for Introduction of Complementary Foods?
175


Recent Issues in Energy-ProteinMalnutrition in Children
Jehan-François Desjeux
Chaire de Biologie, Conservatoire national des arts et métiers, Paris, France
AbstractThirty years ago, protein deficiency was perceived to be the major nutritional prob-
lem of children in developing countries. Later on increasing the energy intake ofyoung children during the complementary feeding period became a priority. Earlystudies on the pathophysiology of malnutrition are now turned into strategic and prac-tical consequences for the prevention and treatment of severe malnutrition, four ofwhich are presented. (1) Almost half of the deaths worldwide are due to being under-weight. Nowadays, well-defined preventive and curative interventions have been iden-tified. (2) An efficient and rigorous technique based on linear programming is nowavailable to design a diet suitable for the complementary feeding period using locallyavailable foods with a minimum budget to cover the nutritional requirements of atleast 97% of the children. (3) Managing acute malnutrition in emergencies has greatlyimproved by the use of a spread that a child can eat directly without the addition ofwater (often called Ready-to-Use Therapeutic Food) and Community TherapeuticCare that treats the majority of severely malnourished children at home. (4) Recentdata strongly suggest that it is possible to avoid death due to careful and rapid rehy-dration despite the high purging rate even if many of the risk factors for mortality arepresent in these severely malnourished children. Recovery from malnutrition wasachieved in 7 days.
Copyright © 2006 Nestec Ltd., Vevey/S. Karger AG, Basel
Thirty years ago protein deficiency was perceived to be the major nutritionalproblem of children in developing countries. This idea was later challenged whenit became clear that the protein requirements were overestimated and that proteindeficiency was almost always associated with an insufficient energy intake [1–3].
The term ‘protein malnutrition’ was subsequently replaced, first by ‘protein-calorie malnutrition’ and later by ‘energy-protein malnutrition’ [4]. Increasing
177
New Proteins in Infant Feeding
Rigo J, Ziegler EE (eds): Protein and Energy Requirements in Infancy and Childhood.Nestlé Nutr Workshop Ser Pediatr Program, vol 58, pp 177–188,Nestec Ltd., Vevey/S. Karger AG, Basel, © 2006.

the energy intake of young children during a complementary feeding periodthen became a priority. In the meantime, kwashiorkor and marasmus, the twomain clinical forms of severe malnutrition, were found to be associated witha change in body composition: essentially loss of fat, muscle and cellular pro-teins; changes in body water distribution (increased extracellular but decreasedintracellular water), and potassium and magnesium deficiency. It is remark-able that in the 1960s the Tropical Metabolism Research Unit in Jamaicaobtained a small whole body counter with which total body potassium couldbe determined from the radiation of the natural isotope 40K. This is how it wasfirmly established that potassium deficiency is a common and important fea-ture of energy-protein malnutrition [5–7]. Then trace element deficiencies,essentially vitamin A and zinc, were also recognized. Thus, energy-proteinmalnutrition is by far the most lethal form of malnutrition.
In addition to the deficit in food intake, other factors can also contribute tomalnutrition. They could broadly be classified as medical and environmental. Inthe medical or nutritional category one can include: associated diseases whichare essentially bacterial, viral or parasitic infections, and a selective deficit innutrients in the daily monotonous diet. It is not uncommon that the food foundin the local market does not provide all the nutrients required for child growth.Therefore a protein and energy deficit is often associated with a deficit in min-erals and vitamins, and an imbalance between the nutrients is also common.
In the environmental category the list is long, including a lack of hygieneand clean water, overcrowding, illiteracy, poverty, an unstable political situa-tion, and war. Malnutrition has been known to affect a large population ofchildren throughout the history of humanity. In Europe, until the end of the19th century, it was one of the leading causes of mortality, even thoughbreastfeeding was the rule [8]. One of the most appalling accounts of malnu-trition can be found in the celebrated lecture of Dickens who for the benefitof the Great Ormond Street Hospital described an Edinburgh slum [9]. In therest of the world, the epidemic was later ‘discovered’ by Europeans.
The nutritional and medical aspects of infantile malnutrition have beenstudied in detail and presented in reference books [9–13] and journal articlesin the case of famine [14, 15]. Furthermore, in 1999 the World Health Organi-zation published a manual for physicians and health workers on the mana-gement of severe malnutrition [10].
The aim of this presentation is not to repeat what has already been com-municated on infantile malnutrition, rather I would like to stress four recentissues of practical importance for preventing and treating malnutrition: (1)assessment of the magnitude of the problem; (2) assessment of the nutrientsin food markets; (3) home-based therapy for malnutrition, and (4) rehydra-tion therapy in dehydrated and malnourished children. It appears that theearly studies on the pathophysiology of malnutrition have now turned intostrategic and practical consequences for the prevention and treatment ofsevere malnutrition.
Desjeux
178

The Magnitude of the Problem
More than 10 million children younger than 5 years of age die everyyear. When facing such statistics it seems that malnutrition is beyond thenutritionists’ reach. In the last 5 years an overall estimate of the determinantsof child mortality has been published with specific targets identified [16, 17].To summarize, it is notable that six countries account for 50% of worldwidedeaths and 42 countries for 90%, this implies that national or regional policiesshould be implemented. Even if the causes of death differ substantiallyamong countries, almost half the deaths are due to being underweight, whichindicates that malnutrition is a key determinant, in addition to genetics andthe infectious environment. It is well known that malnutrition alters the imm-une response, which leads to two main groups of diseases, respiratory infec-tion and diarrhea (20% each), with neonatal disorders taking approximately35% of the death toll. Also according to the prevalence of other diseases,essentially malaria, measles and AIDS, five different main profiles emerge inthe 42 countries with 90% of global child deaths.
Fortunately, well-defined preventive and curative interventions exist for alarge series of identified causes of death [18]. Those interventions can bedelivered through the health sector with maternal education or birth control.In addition to immunization and specific treatments, nutritional interventionsinclude appropriate use of breastfeeding and complementary feeding, andsupplementation such as a pharmacological dosage of zinc and vitamin A. It isof note that other nutritional interventions are not considered in the analysis,and for this reason they will be discussed below. As a result of extensiveanalysis, 23 interventions were proven to be effective in a context of middleor low income countries identified. They were then put into an economicmodel where 18 contacts between the child or mother and a health careprovider were incorporated into a delivery timetable from birth to 5 years ofage [19]. The conclusion was that approximately USD 5 billion in newresources is required to save the lives of 6 million children annually in the 42countries where 90% of the deaths occur. The average cost per life saved isUSD 900.
Assessment of Nutrients in the Food Market
Ideally malnutrition should be prevented by using locally available food.However, this approach is restricted to the availability and cost of food. Evenin industrialized nations the recommended daily allowances in toddler diets,especially for iron, is difficult to achieve [20]. During complementary feeding,children require a nutrient-dense diet to meet their high nutritional require-ments. In addition, the cost of food may also limit proper feeding. Tradition-ally, research was conducted using a trial-and-error approach or by expert
Recent Issues in Energy-Protein Malnutrition in Children
179

guessing. Nowadays, an efficient and rigorous technique based on linearprogramming offers solutions to previous questions [21]. This method oper-ates on widely available programs, including Microsoft Excel, and it aims toanswer the following question: is it possible to design a diet suitable for com-plementary feeding periods using locally available foods? If this is possible,what is the minimum budget for designing a diet covering the nutritionalrequirements for at least 97% of children?
To understand the principle of this method one can look at a simple exam-ple, though nonrealistic and theoretical: a complementary diet based on cow’smilk and maize flour. Any nutritionist would say that the calcium requirementcould be met, but not iron. However, linear programming further indicatesgraphically how far iron is out of the present regimen, and if designing a properdiet is feasible (fig. 1).
The second question is the determination of a maize flour and cow’s milkcombination that provides enough energy for a 12- to 23-month-old breastfedchild (746 kcal/day according to FAO table and 196 of calcium at the lowestcost). Linear programming again presents a basic and immediate answer. Itcan help design a graphic solution for a local diet problem taking into accountboth the availability of food and its cost (fig. 2).
Linear programming is much more efficient than the empirical trial-and-error approach currently used for formulating diets. It could become an indis-pensable tool for pediatricians and nutrition program planners. Severalexamples are already available [22, 23] and short courses on linear progra-mming are available on the internet: http://www.nutrisurvey.de/lp/lp.htm
Desjeux
180
Fig. 1. Graphical illustration representing no solution for the diet problem. FromBriend [personal commun.].
No feasible region
Energy�746 kcal
Iron�11.8 mg
0 50 100 150
Maize flour (g)
200 250
5,000
4,000
3,000
Milk
(m
l)
2,000
1,000
0

Home-Based Therapy for Malnutrition and
Ready-to-Use Therapeutic Food
A review of the literature over the past 5 decades indicates that themedian case fatality from severe malnutrition has remained unchanged overthis period and was typically 20–30%, with the highest levels (50–60%) beingamong those with edematous malnutrition [24]. The authors indicated that alikely cause of this continuing high mortality was faulty case management. Inthe 1990s, malnutrition was revisited. Most recently, the management ofsevere acute malnutrition in refugee camps has been examined. It was pro-posed that a formula containing 100 kcal/100 ml, and called F100, was used ina well-defined setting called the therapeutic feeding center (TFC) [11, 25].This diet is prepared as a liquid formula by mixing together dried skimmedmilk, oil, sugar, and a vitamin and mineral complex. Similar diets have beenused in relief operations for more than 25 years. In this case the practice wastested with striking results on several hundred children in refugee camps sit-uated in sub-Saharan regions [26], and the mortality was often found to bebelow 5%. In its 1999 manual, the WHO recommended the use of F100 duringthe rehabilitation phase of severe malnutrition [10].
However, TFCs are difficult to establish, expensive to operate, and havevery limited coverage. They do not build on the capacity of the community,and at times they can undermine traditional coping strategies. Mothers areoften required to stay with their malnourished children in the TFC for severalweeks. In addition, F100 has some disadvantages as bacteria grow very
Recent Issues in Energy-Protein Malnutrition in Children
181
Fig. 2. Optimal solution presented by linear programming analysis taking into accountthe presence of beans and rice on the market From Briend [personal commun.].
Bean
s (cu
ps)
Rice (cups)
12
10
8
6
4
2
0
0 0.5 1 1.5 2
Optimal
solution
rice�0
beans�1.89
Feasible region
2.5 3
Fat
Na
Energy
Proteins

rapidly in it and safety becomes an issue when prepared under unhygienicconditions. Plus, before water is added, F100 looks like any milk powder, andmay undermine efforts to promote breastfeeding if given to families.
In 2001 a new approach to managing acute malnutrition in emergenciesand other situations was proposed by Collins and Sadler [27]. Communitytherapeutic care (CTC) aims to treat the majority of the severely malnourishedchildren at home, build local capacity to better manage the care of acutelymalnourished children, and address repeated cycles of relief and recovery.Recently, the use of the F100 formula has been revised by replacing part ofthe skimmed milk with peanut butter. Instead of dissolving a powdered prod-uct in water, this new recipe gives a spread that a child can eat directly with-out the addition of water. This is often called ready-to-use therapeutic food(RUTF). The nutritional composition of RUTF in relation to its energy con-tent is very similar to F100. Since its energy density is five times higher (5.4vs. 1 kcal/g), its micronutrient content in relation (per 100 g) is also five timeshigher [28] (table 1). It can be prepared locally at approximately USD 15–20/kg.Also, it has been tested against F100 in the TFC and proved to be well acceptedand comparable to F100 with regard to weight gain [29].
Together, CTC and RUTF have proved to be a major innovation in thetreatment of severe malnutrition. Mainly in Africa, RUTF has increasinglybeen used in emergency and non-emergency situations. The objective hasbeen to shift the treatment of severe malnutrition from the TFC towards thecommunity. To date, CTC programs have treated over 7,000 children inAfrica. Results indicate lower mortality rates (perhaps as a reduction ofcross-infection), fewer dropouts and better coverage than standard center-based approaches. As a whole, the CTC program has demonstrated that chil-dren suffering from severe acute malnutrition without complications can besafely treated at home. According to these data, a new classification of severemalnutrition has been proposed [30].
Desjeux
182
Table 1. Daily energy and macronutrient intakes from F100 and RTUF
F100 group RTUF group
F100 local total RTUF local totalrecipe recipe
Energy, kJ/kg body weight 275* 298 573* 557* 251 808*Proteins, g/kg body weight 2.0 3.9 5.9 3.3 3.1 6.5Lipids, g/kg body weight 3.3* 1.6 4.9* 8.8* 1.4 10.2*Carbohydrates, g/kg body weight 7.2 10.0 17.2 10.3 8.8 19.1
*Significantly diiferent between groups.

Rehydration Therapy in Dehydrated and
Malnourished Children
There is a scope to further reduce the case fatality rate and enhance recov-ery from malnutrition by improving the recovery from common associated ill-nesses including diarrhea. Malnutrition predisposes to an increased incidenceand duration of diarrhea. As it is associated with further loss of weight, earlyrecovery and lessening the severity of diarrhea will help to prevent furtherweight loss and deficiency of the nutrients in severely malnourished children.In addition to the active secretion and defective absorption of water and elec-trolytes in the small intestine, colonic dysfunction has also been demon-strated in cholera due to a lack of short-chain fatty acids. Recently, weinitiated a clinical study to test the hypothesis that the addition of an amy-lase-resistant starch to a glucose-based oral rehydration solution would fer-ment in the colon to stimulate salt and water absorption in order to alleviatethe severity of diarrheal illness and enhance recovery from it. Additionalenergy from the absorption of short-chain fatty acids through the colonic
Recent Issues in Energy-Protein Malnutrition in Children
183
Fig. 3. Weight gain in the first 72 h in severely malnourished and dehydrated childrenreceiving one of the three oral rehydration solutions (ORS), containing 40 mEq/lpotassium and glucose (G), glucose and amylase-resistant starch (ARS), or rice.Weight gain was significant in all three groups but it was greater in the rice group.From Alam et al. [unpublished data].
16
14
12
10
8
Weig
ht
gain
(%
)
6
4
2
20 40 60
Time (h)
80 100
0
0
ARS-ORS
Rice-ORS
G-ORS

mucosa would also be supplied to assist nutritional recovery [Alam et al.unpublished] (fig. 3).
In a prospective randomized study, 174 children (mean � SE age �
27.6 � 0.9 months) were included as severely malnourished (weight/ height �
68.5 � 5.5 with or without pedal edema) and dehydrated because of cholera.After intravenous fluid therapy (602 � 46 ml) for 84% of them, they were ran-domly assigned one of the three high potassium (40 mEq/l) oral rehydrationsolutions containing glucose, rice or amylase-resistant starch. On the mainparameters, there was no significant difference among the groups at inclu-sion. Although the death risk factors were frequently present (55% notbreastfed; 84% severe dehydration; 9% severe hypoglycemia), all the chil-dren recovered from dehydration. In the first 2 days, stool volume and oralrehydration solution intake were significantly different in the 3 groups, butthe number of unscheduled intravenous therapies (15%), duration of diar-rhea (66.3 � 2.2 h), weight gain (0.8 � 0.1 kg), and time to recover 80% ofthe weight/height ratio (7.1 � 0.2 days) were not different.
Despite the high purging rate and although many of the risk factors for mor-tality were present in these severely malnourished children, in this study wewere clearly able to avoid any death by using careful and rapid rehydration.After recovery from life-threatening dehydration, we expected that an amylase-resistant starch would have had a beneficial effect on malnutrition recovery,but this was not found. We are now testing the possibility that the intestinalmicroflora may not appropriately metabolize starch into short-chain fatty acidsin severe malnutrition.
References
1 McLaren DS: The great protein fiasco. Lancet 1974;ii:1079.2 McLaren DS: The great protein fiasco. Lancet 1974;ii:93–96.3 Waterlow JC, Payne PR: The protein gap. Nature 1975;258:113–117.4 McLaren DS: Energy-protein malnutrition. Lancet 1973;i:994.5 Alleyne GA: Studies on total body potassium in malnourished infants. Factors affecting potas-
sium repletion. Br J Nutr 1970;24:205–212.6 Alleyne GA, Millward DJ, Scullard GH: Total body potassium, muscle electrolytes, and glyco-
gen in malnourished children. J Pediatr 1970;76:75–81.7 Alleyne GA, Viteri F, Alvarado J: Indices of body composition in infantile malnutrition: total
body potassium and urinary creatinine. Am J Clin Nutr 1970;23:875–878.8 Desjeux E: De l’alimentation par le lait cru chez l’enfant à l’état de santé et de maladie. Tours,
Imprimerie Deslis frères, 1904.9 Kerpel-Fronius E: The Pathophysiology on Infantile Malnutrition. Protein-Energy Malnutrition
and Failure to Thrive. Budapest, Akademia Kiado, 1983.10 WHO: Management of Severe Malnutrition: a Manual for Physicians and Other Senior Health
Workers. Geneva, World Health Organization, 1999.11 Prudhon C: Assessment and Treatment of Malnutrition in Emergency Situation. Paris, Action
contre la Faim, 2002. www.acf-fr.org12 Waterlow JC: Protein Energy Malnutrition. London, Arnold, 1992.13 Golden MHN: Severe malnutrition; in Weatherall DJ, Ledingham JGG, Warrell DA (eds): The
Oxford Textbook of Medicine. Oxford, Oxford University Press, 1995, pp 1278–1296.
Desjeux
184

14 Gebre-Medhin M: Famine in Ethiopia. Ethiop Med J 1974;12:105–107.15 Gebre-Medhin M, Vahiquist B: Famine in Ethiopia – the period 1973–75. Nutr Rev 1977;35:
194–202.16 Black RE, Morris SS, Bryce J: Where and why are 10 million children dying every year? Lancet
2003;361:2226–2234.17 Bryce J, Boschi-Pinto C, Shibuya K, Black RE: WHO estimates of the causes of death in chil-
dren. Lancet 2005;365:1147–1152.18 Jones G, Steketee RW, Black RE, et al: How many child deaths can we prevent this year?
Lancet 2003;362:65–71.19 Bryce J, Black RE, Walker N, et al: Can the world afford to save the lives of 6 million children
each year? Lancet 2005;365:2193–2200.20 Ferguson EL, Devlin M, Briend A, Darmon N: How achievable are recommended dietary
allowances for 12–24 month old New Zealand children? Asia Pac J Clin Nutr 2004;13(suppl):S62.21 Briend A, Darmon N, Ferguson E, Erhardt JG: Linear programming: a mathematical tool for
analyzing and optimizing children’s diets during the complementary feeding period. J PediatrGastroenterol Nutr 2003;36:12–22.
22 Darmon N, Ferguson E, Briend A: Linear and nonlinear programming to optimize the nutrientdensity of a population’s diet: an example based on diets of preschool children in ruralMalawi. Am J Clin Nutr 2002;75:245–253.
23 Darmon N, Ferguson E, Briend A: Do economic constraints encourage the selection of energydense diets? Appetite 2003;41:315–322.
24 Schofield C, Ashworth A: Why have mortality rates for severe malnutrition remained so high?Bull World Health Organ 1996;74:223–229.
25 Golden MH, Briend A: Treatment of malnutrition in refugee camps. Lancet 1993;342:360.26 Desjeux JF, Briend A, Prudhon C, et al: Definition and evaluation of therapeutic food for
severely malnourished children in situations of humanitarian emergencies (in French). BullAcad Natl Med 1998;182:1679–1695.
27 Collins S, Sadler K: Outpatient care for severely malnourished children in emergency reliefprogrammes: a retrospective cohort study. Lancet 2002;360:1824–1830.
28 Briend A, Lacsala R, Prudhon C, et al: Ready-to-use therapeutic food for treatment of maras-mus. Lancet 1999;353:1767–1768.
29 Diop el HI, Dossou NI, Ndour MM, et al: Comparison of the efficacy of a solid ready-to-usefood and a liquid, milk-based diet for the rehabilitation of severely malnourished children: arandomized trial. Am J Clin Nutr 2003;78:302–307.
30 Collins S: Changing the way we address severe malnutrition during famine. Lancet 2001;358:498–501.
Discussion
Dr. Desjeux: Feeding children with a high protein diet could be dangerous espe-cially for kidney function. Therefore, at the suggestion of Prof. John Waterloo, whenF100 was initially proposed as treatment in emergency situations, we also added F75which is less dense, that is 75 kg cal/0 ml. But if you look at the results, F100 alreadyreduces mortality to almost zero. It is of course given progressively. I know that somecenters still use F75, but I think it would be extremely difficult to show a beneficialeffect of F75 on mortality because, as seen under extreme conditions when there issevere malnutrition and dehydration, none of the children died and they were fed withF100 according to the WHO protocol.
Dr. Dewey: I want to thank you for bringing up linear programming. It is a tech-nique that sounds intimidating to some people but I can testify that it is very simpleto use. We have used it extensively for a document on feeding of the non-breastfedchild from 6 to 24 months of age that the WHO has published. As you said, what itinvolves is having information on the types of foods consumed and their costs. One ofthe cautions that I would like to mention is that when you work with the youngest age
Recent Issues in Energy-Protein Malnutrition in Children
185

group, which is 6–9 months approximately, usually when the local foods are enteredinto this program there will be no solution. In other words you cannot meet all theirnutrient needs with local foods, and that is usually because of iron, sometimes zinc aswell. So what you can do is include in the program another entry for supplements andput in a cost that is very high, artificially high, so you minimize how much of the sup-plement is required in the solution. This is one way we determine what the gaps areand how they need to be met in the diet of any particular local area. I stronglyencourage people to go to the website that you mentioned and try it out. The othercomment I want to make is that the ready-to-use therapeutic food (RUTF), as yousaid, was originally developed to treat malnourished children. We have recently useda different formulation of it for complementary feeding of healthy normal children inGhana, and in this case we used a very strongly fortified concentrated version and weonly need 20 g/day, about 4 teaspoons. So far the results look very encouraging forimproving growth as well as other outcomes. I think this is one product that deservesa lot more attention.
Dr. Desjeux: Thank you very much for your very appropriate comments. For lin-ear programming, a tutorial can be found at www.nutrisurvey.de/lp/background_info.htm. You can enter what you have bought at the market, together with the cost,and then you get this kind of graph that I showed you. It also shows you how much ofthe requirements have been covered and, as you mentioned, iron is the most difficultmicronutrient to fulfill. You can decide to add iron from a source other than local foodand see if the diet is now appropriate according to the recommendations. So it is anextremely simple linear program, and extremely powerful for designing and checkingthe quality of the diet according to the cost. It goes from food to nutrient and cost, andincludes all these items together.
Dr. Telmesani: Some studies suggest adding some lactobacillus or bifidobacteriato the oral rehydration solution (ORS), and report a positive effect in reducing theduration of diarrhea. What is your view?
Dr. Desjeux: We already discussed adding amino acids, adding bacteria. Manythings can be added, but as you have seen very simple ORSs are quite effective, and areduction of 6 h in the duration of acute disease that last 2–3 days does not matter.From the clinical point of view I don’t think it is very relevant, and therefore I thinkwe have to keep it simple and teach people how to use it, but still there is a need toimprove its use all over the world. In my view it is more a matter of marketing thancomposition [1]. For probiotics there are some clinical trials showing a statisticaleffect. Now to answer the question that was raised earlier about amino acids;amino acids are provided with ORSs because after 4 h the children are fed so theyreceive amino acids. That is probably one reason why the addition of amino acids inclinical trials doesn’t show any striking effect, if at all. Adding glucose to glucosedoesn’t help very much and adding glutamine to a protein diet doesn’t add very mucheither.
Dr. Macé: Do you have an idea which of the short-chain fatty acids could be themost efficient? Is it acetate butyrate?
Dr. Desjeux: It depends; if you want to rehydrate it is butyrate that stimu-lates sodium absorption [2]. But the other amino acids are also important becausethey would provide energy and could help to improve colon function which is veryfrequently altered in infectious diseases including cholera, and also in malnutrition [3].
Dr. Noor Khatijah Nurani: How long do you use RUTF and when do you startintroducing other proteins from locally available food?
Dr. Desjeux: It starts in the rehabilitation phase, and I am referring to the WHOmanual for the definition. It depends on the local circumstances but a weight forheight of 80% of the National Center for Health Statistics can be obtained in 7 days,even in severely malnourished children.
Desjeux
186

Dr. Barclay: You have shown that the higher nutrient density refeeding formulaswere useful for malnutrition. I was wondering about the same concept for refeedingduring diarrhea. As you probably remember about 10 years ago, based on the resultsof studies mainly in the Indian subcontinent and some which you cited, we developedan improved rice-based ORS containing about 50 g/l of rice and showed that this rice-based ORS improved diarrhea outcome vs. standard glucose ORS. Nestlé R&D devel-oped a ‘super’ rice-based ORS containing 160 g/l of rice, electrolytes and �-amylase.The product has to be cooked just prior to administration by the caregiver so the prod-uct is actually sterilized preventing further microbial contamination. Studies inEcuador and Columbia showed that children treated with this new rice-based ORShad a significantly shorter duration of diarrhea, a lower number of stools and a greaterweight gain during treatment vs. standard glucose ORS [4]. So my question is, do youthink that there is any need for more energy-dense, more nutrient-dense ORS, keep-ing osmolarity below say 280 mosm, or that standard ORS with normal feeding sched-ules are sufficient?
Dr. Desjeux: First of all you showed very clearly is that it is essential to giveenough energy as soon as the child is rehydrated. I don’t know how it is in your coun-try, but in my country the doctors would prescribe no food to the child for 3 or 4 days,which of course would be impossible for the mother to follow. So feeding is reallyessential in the treatment of diarrhea. Now which type of feeding? I would be a bitreluctant to use RUTF in this condition for two reasons. One is that RUTF has beendesigned specifically for malnutrition. It is used in different kinds of malnutrition; forinstance in mentally retarded children with malnutrition the effect of RUTF isabsolutely spectacular. But to have another energetically dense diet for diarrhea couldbe interesting. This is really a paste and we were a bit afraid that giving such a highenergy-dense paste would dehydrate the child, but it does not. I would be afraid of giv-ing that diet to dehydrated children, at least at first.
Dr. Butte: You were focusing on the recovery of weight for height. Is there any new progress being made in treating the stunted child, in recovering lineargrowth?
Dr. Desjeux: In therapeutic feeding centers growth is faster than in home-basedtherapy. I would say that growth is really the proper indicator of efficacy, but does itreally matter if the gain is 15, 16 or 12 g/day? After all if they are happy and healthyand alive, this is already quite an achievement. Now can we get a better indicatorfor recovery from malnutrition, does it matter, does the first phase of rehabilitationfrom malnutrition have long-term consequences? I know there are some peopletrying to address that question, but it is very difficult to have a follow-up in thesepopulations.
Dr. Huerta: How do you give infants with marasmus, weight for height below 2standard deviations and a mean age of 13 months, this amount of protein, 6.5/kg/day?How many days do you use it?
Dr. Desjeux: We are often afraid of giving too much protein, but this is not onlyprotein. This diet also contains a high density energy and lipids, carbohydrates, min-eral and vitamin mix. I think we have more from the clinical results than the theoreti-cally expected results to base our recommendation on. I am not absolutely sure how itworks, but for the time it works. For instance, as a gastroenterologist I am not toomuch concerned with protein but with fat. We have learned, and it is true, that insevere malnutrition the pancreas does not function well, and although we provide ahuge amount of lipids, it works. So there are some discrepancies between what wehave learned and what we see now with this treatment. It is a major breakthrough inthe treatment of these children.
Recent Issues in Energy-Protein Malnutrition in Children
187

Desjeux
188
References
1 Desjeux D, Favre I, Simongiovanni J, et al: Why is oral therapy associated with drugs in thetreatment of diarrhea? J Pediatr Gastroenterol Nutr 1996;22:112–114.
2 Ramakrishna BS, Venkataraman S, Srinivasan P, et al: Amylase-resistant starch plus oralrehydration solution for cholera. N Engl J Med 2000;342:308–313.
3 Roediger WE: Famine, fiber, fatty acids, and failed colonic absorption: does fiber fermentationameliorate diarrhea? JPEN J Parenter Enteral Nutr 1994;18:4–8.
4 Barclay DV, Gil-Ramos J, Mora JO, Dirren H: A packaged rice-based oral rehydration solutionfor acute diarrhea. J Pediatr Gastroenterol Nutr 1995;20:408–416.

Protein Quality and Quantity in Cow’sMilk-Based Formula for Healthy TermInfants: Past, Present and Future
Katherine Macéa, Philippe Steenhoutb, Petra Klassena,
Anne Donneta
aNestlé Research Center, Lausanne, bNestlé Nutrition, Vevey, Switzerland
AbstractThe development of infant formula with optimized protein quality and quantity has
been, and still is, the subject of intense investigation. A better understanding of theprotein composition of breast milk and infant needs in association with technologicalbreakthroughs in cow’s milk fractionation, has led to the development of infant formu-las with a protein content that is closer to that of human milk. Today, infant formulaswith a protein/energy ratio of 1.8 g/100 kcal are commercially available. These formu-las have been shown to be safe and nutritionally adequate for term infants. However,the short-term and potentially long-term metabolic benefits of formulas with reducedprotein content have still to be elucidated and are currently under investigation. Inaddition to providing amino acids as building blocks for growth, milk is the source ofnumerous bioactive factors/hormones which are involved in multiple physiologicalprocesses. Continuous efforts are being made to identify new bioactive compounds inhuman milk. However, a better understanding of their biological functions in sucklinginfants as well as a comparison with their bovine counterparts are needed. Technologicalprocesses, which preserve some bioactive factors in cow’s milk already exist. Theseprocesses could be applied to infant formulas.
Copyright © 2006 Nestec Ltd., Vevey/S. Karger AG, Basel
Introduction
Since the first commercially prepared infant formulas were available as pow-ders in the late 1800s, constant improvement in the formulation has been doneto match the composition of human milk more closely and, most importantly, tomimic the functional outcome of breast-fed infants (i.e., appropriate growth,development and health). In this context, the development of infant formula
189
Rigo J, Ziegler EE (eds): Protein and Energy Requirements in Infancy and Childhood.Nestlé Nutr Workshop Ser Pediatr Program, vol 58, pp 189–205,Nestec Ltd., Vevey/S. Karger AG, Basel, © 2006.

with optimized protein quality and quantity has been, and still is, the subject ofintense investigation.
From Casein-, Whey-Predominant to Modified
Whey Infant Formula
In 1919, Gerstenberger and Ruh [1] developed the first commercially avail-able formula with cow’s milk as the exclusive source of proteins. The originalprotein content of the manufactured formula was 1.8 g/100 kcal, but wasincreased to 2.2 g/100 kcal in 1945 [2]. In the middle of the 20th century, itwas considered that formula-fed (FF) infants require a considerably greaterintake of protein than breast-fed (BF) infants. This recommendation wasbased on an overestimation of both the nutritionally available protein contentof human milk and the protein intake requirements of the infants [3, 4].Furthermore, cow’s milk protein quality and digestibility was considered farinferior to that of human milk for satisfying the amino acid needs of infants. Inthe 1960s, the protein content of a number of widely used formulas rangedfrom 3.3 to 4.0 g/100 kcal and some formulas, designed for managing diarrhea,even provided up to 6.7 g/100 kcal [5]. Subsequently, national health institutesand pediatric associations defined standards for protein content in infant for-mulas (table 1). While there is now a consensus for the minimum requiredvalues (1.8 g protein/100 kcal), a broader range of recommended maximumvalues can be found (2.8–4.5 g protein/100 kcal). In 1991, a EuropeanDirective set the maximum protein content to 3.0 g/100 kcal. However, theFood and Drug Administration still recommended a maximum requiredintake level of 4.5 g/100 kcal, in spite of the revisions proposed by a task forceof the American Academy of Pediatrics [5]. A current revision of the Codex
Macé/Steenhout/Klassen/Donnet
190
Table 1. Standards for protein content in infant formulas
Institutions/associations g protein/100 kcal Year of issue
Food and Drug Administration [54] 1.8–4.5 1985Codex [55] 1.8–4.0a 1981
1.8–3.0b under revisionEuropean Economy Community [56] 1.8–3.0 1991Committee on Nutrition of the American 1.8–4.5 1976Academy of Pediatrics [57]
European Society for Pediatric 1.8–2.8 1977Gastroenterology and Nutrition [58, 59] 1.8–3.0b 2005
aFollow-on formula (1989): 3.0–5.5 g protein/100 kcal.bStarter and follow-on formulas.

Protein Quality and Quantity in Cow’s Milk-Based Formula
191
proposes a maximum protein content of 3.0 g/100 kcal, for both starter andfollow-on formulas, based on new recommendations from the EuropeanSociety for Pediatric Gastroenterology, Hepatology and Nutrition (table 1).
The intrinsic superiority of human milk protein over that of cow’s milk isdue to its higher whey to casein protein ratio (approximately 60:40 in humanmilk and 20:80 in bovine milk). In 1961, a major technological breakthrough(i.e. demineralization of whey protein through an electrodialysis process)allowed the addition of equal parts of casein and whey in formula, and by themid 1990s, whey-predominant formulas prevailed in the US and Europe.Nevertheless, both the whey and casein fractions of cow’s milk are quite dif-ferent from those of human milk (fig. 1). Consequently, the amount of aminoacids delivered by breast milk and formula differ. Compared to breast milk,the levels of most of the essential amino acids are, per gram of protein (ornitrogen), lower in the casein-predominant formulas, while leucine, pheny-lalanine, tryptophan, and to a lesser extent valine, are limited in whey-predominant formulas (fig. 2). In order to compensate for these quantitativedifferences, the amount of proteins per energy content must be higher in for-mula than in human milk. A casein- or a whey-predominant formula contain-ing 2.5 g protein/100 kcal, provides, an excess of most of the essential aminoacids found in breast milk. Nevertheless, tryptophan and the conditionallyessential amino acid cystine are limiting factors for further reducing the pro-tein quantity in cow’s milk formula (fig. 3). Indeed, Janas et al. [6] demon-strated that term infants fed formulas with reduced protein content(1.8 g/100 kcal) and various whey/casein ratios had normal plasma cystinelevels but depressed levels of tryptophan when compared to those fed humanmilk. New approaches/processes were therefore needed to adjust the pro-tein/energy ratio to the minimal recommended value (1.8 g/100 kcal) and,thereafter, to that more closely resembling human milk.
In principle, the easiest way to avoid lower plasma levels of tryptophan inFF infants is to supplement the formula with free tryptophan. In 1992, studiesdemonstrated that term infants, fed a casein-predominant formula, reducedin protein (1.9–2.0 g/100 kcal) but fortified in free tryptophan, had similarplasma tryptophan levels to BF infants [7, 8]. However, taking into accountthe absorption kinetics of free and protein-bound tryptophan, as well as toxi-cological and economical considerations, supplementing with free tryptophanis not the most favorable option. Addition of �-lactalbumin (�LA) may pro-vide a promising alternative [9]. The �LA fraction is rich in tryptophan (5.9%)but the proportion of �LA in bovine milk (4%) is considerably lower than inhuman milk (28%; fig. 1). Whey protein concentrates, or isolates enriched in�LA and produced by either ion exchange or membrane fractionation,became commercially available in the late 1990s [10]. The effect of �LAenrichment on tryptophan supply has been studied in healthy term infantsfed a whey-predominant formula containing 2.0 g protein/100 kcal and 2.2 gtryptophan/16 g N over a 2-week period [11]. It was demonstrated that the
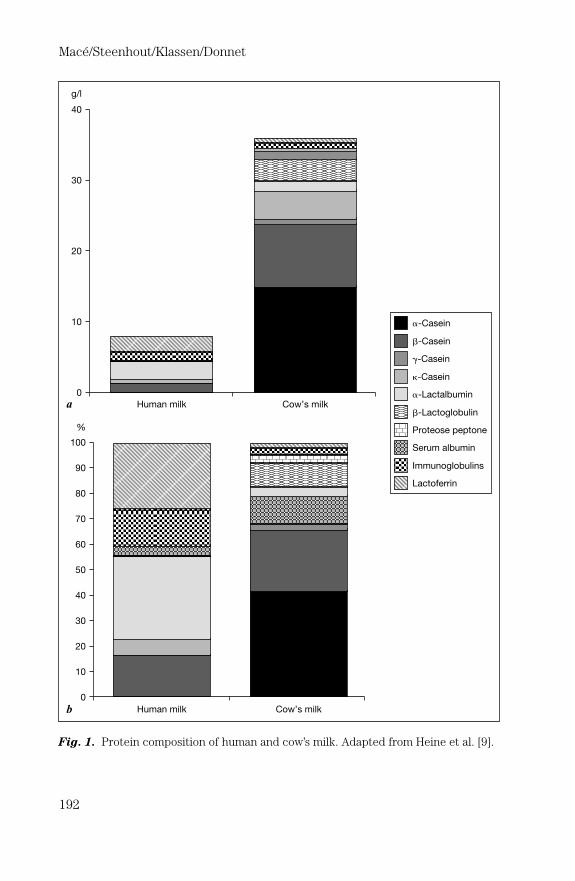
Macé/Steenhout/Klassen/Donnet
192
Fig. 1. Protein composition of human and cow’s milk. Adapted from Heine et al. [9].
40
30
20
10
0
a
b
Human milk Cow’s milk
Human milk Cow’s milk
0
10
20
30
40
50
60
70
80
90
100
%
g/l
�-Casein
�-Casein
�-Casein
�-Casein
�-Lactoglobulin
�-Lactalbumin
Proteose peptone
Serum albumin
Immunoglobulins
Lactoferrin

serum tryptophan levels of the FF infants did not differ significantly from thatof an exclusively BF group [11]. A growth and safety study was recently per-formed in term infants fed a whey-predominant control formula or a reducedprotein experimental formula with added bovine �LA [12]. The �LA/�LA ratiowas 0.4 in the control formula and 1.6 in the �LA-enriched formula. Growthand serum albumin were comparable in both groups of infants for the first 12weeks of life, suggesting adequate protein delivery using the reduced proteinformula with added bovine �LA. However, as pointed out by Raiha [13], thedifference in protein content between the control (15.1 g/l) and experimentalformula (14.4 g/l) was in fact rather small (2.25 and 2.15 g protein/100 kcal,respectively, assuming an energy density of 67 kcal/100 ml). Additional stud-ies are still required to address the safety of formulas with an even lower pro-tein content (e.g. 1.8 g/100 kcal).
In the meantime, other approaches have been explored. Caseinogly-comacropeptide is released from casein during the enzymatic precipitationof �-casein and remains in the sweet whey fraction commonly used for theproduction of whey-predominant infant formulas. An original process of whey
Protein Quality and Quantity in Cow’s Milk-Based Formula
193
Fig. 2. Amino acid composition (g/16 g N) of human milk (�), casein- (�) and whey-predominant ( ) formulas. aEssential amino acids.
0
2
4
6
8
10
12
14
Iso
leucin
ea
Leucin
ea
Lysin
ea
Meth
ionin
ea
Phenyla
lanin
ea
Thre
onin
ea
Try
pto
phan
a
Valin
ea
Cystine
Tyro
sin
e
Arg
inin
e
His
tid
ine
g/1
6 g
N

fractionation was developed to first of all remove the caseinoglycomacro-peptide fraction, which is rich in threonine but poor in tryptophan, and thento increase the proportion of the �LA fraction which is rich in tryptophan(patent WO 01/11990). The resulting modified sweet whey (MSW) allowedthe development of an infant formula with an essential amino acid profile thatwas closer to human milk (table 2; g amino acids/16 g N). In theory, this newformula allows the reduction of the protein/energy ratio to the minimum rec-ommended value (1.8 g/100 kcal), without a deficit in essential and condition-ally essential amino acids (table 2; mg amino acids/100 kcal). The proteinadequacy of the MSW formula (1.83 g/100 kcal) was established with meta-bolic balance studies. The results showed that, despite the lower protein con-tent, infants had similar nitrogen retention to those infants fed a formula withhigher protein content (2.24 g/100 kcal) [14]. The nutritional adequacy oflong-term feeding with a MSW formula (whey/casein ratio 70/30, protein con-tent 1.8 g/100 kcal) was tested in healthy, term infants from birth to 4 monthsand compared to a conventional whey-predominant formula (whey/caseinratio 60/40, protein content 2.2 g/100 kcal) and to breast milk [15]. No differ-ences were found among the 3 feeding groups for weight or length gains orfor body mass indices. Protein intakes were lower in the infants fed the MSW
Macé/Steenhout/Klassen/Donnet
194
Fig. 3. Amino acid composition (mg/100 kcal) of human milk (�), casein- (�) andwhey-predominant ( ) formulas. aEssential amino acids.
0
50
100
150
200
250
Iso
leucin
ea
Leucin
ea
Lysin
ea
Meth
ionin
ea
Phenyla
lanin
ea
Thre
onin
ea
Try
pto
phan
a
Valin
ea
Cystine
Tyro
sin
e
Arg
inin
e
His
tid
ine
mg
/100 k
cal
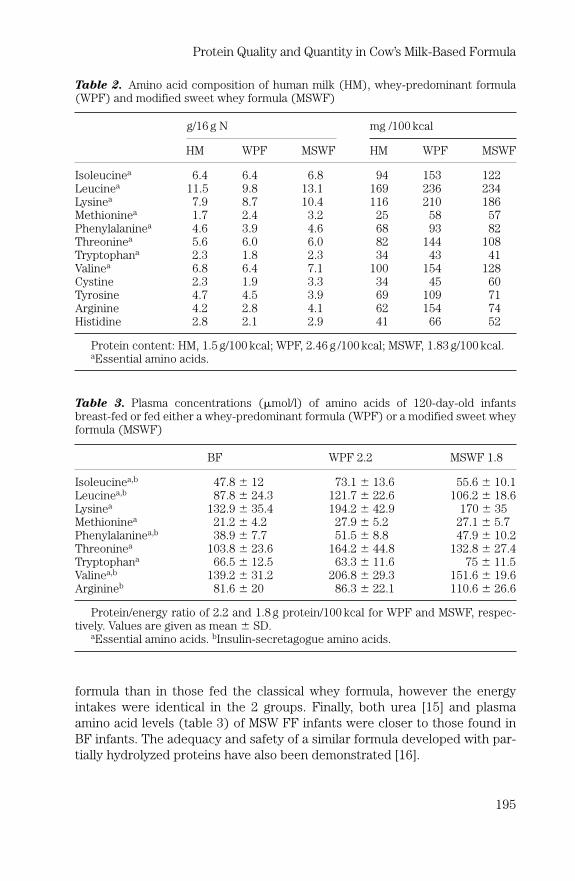
formula than in those fed the classical whey formula, however the energyintakes were identical in the 2 groups. Finally, both urea [15] and plasmaamino acid levels (table 3) of MSW FF infants were closer to those found inBF infants. The adequacy and safety of a similar formula developed with par-tially hydrolyzed proteins have also been demonstrated [16].
Protein Quality and Quantity in Cow’s Milk-Based Formula
195
Table 2. Amino acid composition of human milk (HM), whey-predominant formula(WPF) and modified sweet whey formula (MSWF)
g/16 g N mg /100 kcal
HM WPF MSWF HM WPF MSWF
Isoleucinea 6.4 6.4 6.8 94 153 122Leucinea 11.5 9.8 13.1 169 236 234Lysinea 7.9 8.7 10.4 116 210 186Methioninea 1.7 2.4 3.2 25 58 57Phenylalaninea 4.6 3.9 4.6 68 93 82Threoninea 5.6 6.0 6.0 82 144 108Tryptophana 2.3 1.8 2.3 34 43 41Valinea 6.8 6.4 7.1 100 154 128Cystine 2.3 1.9 3.3 34 45 60Tyrosine 4.7 4.5 3.9 69 109 71Arginine 4.2 2.8 4.1 62 154 74Histidine 2.8 2.1 2.9 41 66 52
Protein content: HM, 1.5 g/100 kcal; WPF, 2.46 g /100 kcal; MSWF, 1.83 g/100 kcal.aEssential amino acids.
Table 3. Plasma concentrations (�mol/l) of amino acids of 120-day-old infantsbreast-fed or fed either a whey-predominant formula (WPF) or a modified sweet wheyformula (MSWF)
BF WPF 2.2 MSWF 1.8
Isoleucinea,b 47.8 � 12 73.1 � 13.6 55.6 � 10.1Leucinea,b 87.8 � 24.3 121.7 � 22.6 106.2 � 18.6Lysinea 132.9 � 35.4 194.2 � 42.9 170 � 35Methioninea 21.2 � 4.2 27.9 � 5.2 27.1 � 5.7Phenylalaninea,b 38.9 � 7.7 51.5 � 8.8 47.9 � 10.2Threoninea 103.8 � 23.6 164.2 � 44.8 132.8 � 27.4Tryptophana 66.5 � 12.5 63.3 � 11.6 75 � 11.5Valinea,b 139.2 � 31.2 206.8 � 29.3 151.6 � 19.6Arginineb 81.6 � 20 86.3 � 22.1 110.6 � 26.6
Protein/energy ratio of 2.2 and 1.8 g protein/100 kcal for WPF and MSWF, respec-tively. Values are given as mean � SD.
aEssential amino acids. bInsulin-secretagogue amino acids.
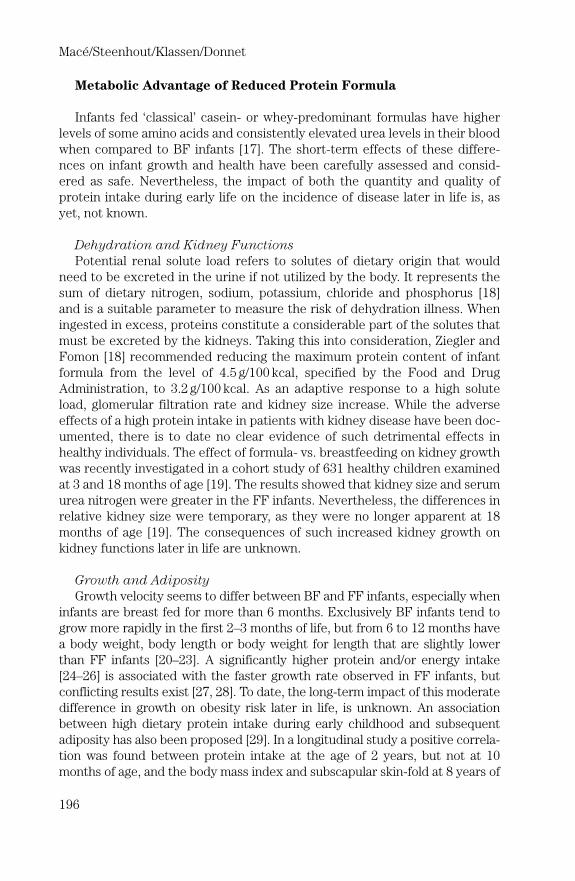
Metabolic Advantage of Reduced Protein Formula
Infants fed ‘classical’ casein- or whey-predominant formulas have higherlevels of some amino acids and consistently elevated urea levels in their bloodwhen compared to BF infants [17]. The short-term effects of these differe-nces on infant growth and health have been carefully assessed and consid-ered as safe. Nevertheless, the impact of both the quantity and quality ofprotein intake during early life on the incidence of disease later in life is, asyet, not known.
Dehydration and Kidney Functions
Potential renal solute load refers to solutes of dietary origin that wouldneed to be excreted in the urine if not utilized by the body. It represents thesum of dietary nitrogen, sodium, potassium, chloride and phosphorus [18]and is a suitable parameter to measure the risk of dehydration illness. Wheningested in excess, proteins constitute a considerable part of the solutes thatmust be excreted by the kidneys. Taking this into consideration, Ziegler andFomon [18] recommended reducing the maximum protein content of infantformula from the level of 4.5 g/100 kcal, specified by the Food and DrugAdministration, to 3.2 g/100 kcal. As an adaptive response to a high soluteload, glomerular filtration rate and kidney size increase. While the adverseeffects of a high protein intake in patients with kidney disease have been doc-umented, there is to date no clear evidence of such detrimental effects inhealthy individuals. The effect of formula- vs. breastfeeding on kidney growthwas recently investigated in a cohort study of 631 healthy children examinedat 3 and 18 months of age [19]. The results showed that kidney size and serumurea nitrogen were greater in the FF infants. Nevertheless, the differences inrelative kidney size were temporary, as they were no longer apparent at 18months of age [19]. The consequences of such increased kidney growth onkidney functions later in life are unknown.
Growth and Adiposity
Growth velocity seems to differ between BF and FF infants, especially wheninfants are breast fed for more than 6 months. Exclusively BF infants tend togrow more rapidly in the first 2–3 months of life, but from 6 to 12 months havea body weight, body length or body weight for length that are slightly lowerthan FF infants [20–23]. A significantly higher protein and/or energy intake[24–26] is associated with the faster growth rate observed in FF infants, butconflicting results exist [27, 28]. To date, the long-term impact of this moderatedifference in growth on obesity risk later in life, is unknown. An associationbetween high dietary protein intake during early childhood and subsequentadiposity has also been proposed [29]. In a longitudinal study a positive correla-tion was found between protein intake at the age of 2 years, but not at 10months of age, and the body mass index and subscapular skin-fold at 8 years of
Macé/Steenhout/Klassen/Donnet
196

age [29]. Although some studies [30, 31] have described an association betweenprotein intake at �9 months of age and adiposity in later childhood, other stud-ies have reported an association with body size but not with body fat mass [32].Interestingly, the influence of excess protein intake during the first year of lifeon weight gain in infancy and the risk of obesity later in life is now being stud-ied in a large European Childhood Obesity Project [33].
A high protein intake is likely to have endocrine effects. It has been sug-gested that the higher growth velocity reported in FF vs. BF infants is due toa high protein intake early in life that promotes secretion of insulin-likegrowth factor-1 (IGF-1), a trophic hormone involved in longitudinal growth aswell as muscle and fat mass development. Although there is limited knowl-edge about neonatal endocrine responses to milk feeding, there is increasingevidence that at 2 [34] and 6 months of age [35] FF infants have greater serumIGF-1 levels than BF infants. In a recent study, Savino et al. [34] observed thatplasma IGF-1 levels are directly correlated with the Z score for weight, bodymass index and tricipital skin-fold thickness in 2-month-old infants.Interestingly, we have observed that, during the first 4 months of life, infantsfed a MSW formula (1.9 g protein/100 kcal) have a different evolution of theirIGF-1 plasma levels to infants fed a normal sweet whey formula (2.4 g pro-tein/100 kcal). IGF-1 levels decrease significantly (p � 0.013) between 28and 112 days in infants fed formulas with a reduced level of protein (fig. 4).
Protein Quality and Quantity in Cow’s Milk-Based Formula
197
Fig. 4. IGF-1 levels (�g/l) in infants fed a modified sweet whey protein formula witha reduced protein content of 1.9 g protein/100 kcal (�) or a normal sweet wheyformula containing 2.4 g protein/100 kcal (�).
0 25 50 75 100 125
50
60
70
80
90
100IG
F-1
(�
g/l)
Days after birth
P0.05

IGF-1 levels average 79.3 � 34.0 ng/ml (mean � SD, n � 35) at 28 days and58.9 � 37.8 ng/ml (n � 41) at 112 days of age. On the other hand, in infantsfed control formula IGF-1 levels did not decrease. IGF-1 levels average77.5 � 31.0 ng/ml (n � 21) at 28 days and 80.8 � 37.8 ng/ml (n � 27) at 112days of age (fig. 4). This confirms the strong influence of protein intake onIGF-1 levels. Interestingly, IGF-1 levels with a reduced protein formula aresimilar to those reported for BF infants [36].
Insulin acts as a growth factor during development and is considered as ananabolic factor of lean and fat mass. Moreover, protein intake is known topotentiate glucose-stimulated insulin secretion [37]. The amino acid profile ofthe ingested protein itself plays a role in the insulin response to feeding. Inthis respect, lysine, leucine, phenylalanine, valine and arginine are the aminoacids which are the most potent insulin secretagogues [38]. Interestingly, FFnewborns show higher postprandial plasma insulin levels than their BF coun-terparts [39]. Up to 6 months of age, urinary C-peptide (a marker of insulinsecretion) correlates with plasma valine levels and is 2 to 3 times greater inFF infants than in BF infants [40]. Similarly, infants fed a formula containing2.5 g protein/100 kcal between 4 and 6 months of age have higher levels of uri-nary C-peptide than BF infants or infants fed a formula containing 1.8 g pro-tein/100 kcal [24]. In this study, weight gain is reported to correlate withC-peptide excretion, protein intake and plasma concentrations of thebranched-chain amino acids, valine, leucine and isoleucine [24]. Interestingly,infants fed a modified sweet whey formula (1.8 g protein/100 kcal) vs. a classicalwhey-predominant formula (2.2 g protein/100 kcal) displayed significantlylower plasma levels of a number of amino acids, such as valine, leucine andisoleucine (table 3), which are considered to be insulin secretagogues. Whilethe arginine levels were higher with the modified formula, the phenylalaninelevels were unchanged (table 3). It would be of interest to investigate whether these differences are associated with decreased insulin levels inthe plasma and/or C-peptide excretion. Additional studies are also neededto determine the short- and long-term metabolic consequences of these dif-ferences.
Future Development for Improving the Protein
Quality in Infant Formula
New technological processes have allowed the development of nutritionallyadequate and safe infant formulas with a protein content closer to breast milk.The benefits of further decreasing the protein/energy ratio of infant formulasto 1.8 g/100 kcal are probably limited. However, providing the required pro-tein and energy intake is not the only means to prevent malnutrition or dis-ease. In addition to its nutritional qualities, human milk provides a diversity ofspecific bioactive proteins such as hormones, cytokines, and growth factors
Macé/Steenhout/Klassen/Donnet
198

which have physiological relevance beyond purely nutritional properties [41].These factors are implicated in growth and development, protective defensemechanisms, energy metabolism and immune homeostasis in multiple tissues.Despite the improvement in infant formula development, differences inresponse to infection and the development of allergy and atopic disease havebeen reported for FF and BF infants [42]. Although some of these bioactiveproteins are also present in bovine milk [41], it has generally been assumedthat they do not survive the technological processing used in the manufactureof infant formulas. As such, infant formulas are considered to lack some of theprotective factors which human milk inherently provides.
With the advent of new methodology, the identification of milk proteinsand their biological activity has received more attention. Indeed, we haverecently reported that human milk contains proteins such as transforminggrowth factor (TGF)-� [43], osteoprotegerin [44] and soluble CD14 [45],which are involved in immune homeostasis, innate responses to bacterialcomponents and bone metabolism. TGF-� is a multifunctional polypeptide. Itacts upon a variety of different cells to regulate their growth, differentiationand survival, and plays a crucial immunoregulatory function in mechanisms oftolerance and the prevention of disease and autoimmunity [46]. TGF-� ispresent in milk and may be activated by acidification or mild enzymatic treat-ment [47], thus it is feasible that it is activated during intestinal transit toexert a biological effect in the intestinal epithelium of the host. Furthermore,since TGF-� is present in bovine milk, we considered that it may remain bio-logically active after exposure to some manufacturing processes. To addressthis possibility, we analyzed a range of milk-based preparations and raw mate-rials for their TGF-� content. As expected, its presence is dependent on themilk protein source and the processing conditions [43]. Interestingly, weshowed that a casein-based formulation, with acceptable preserved levels ofTGF-�, prevents diarrhea in animal models of inflammation [48, 49] andinduces remission and mucosal healing in children with small bowel Crohn’sdisease [50, 51]. It is acknowledged that the technological process used tomake the TGF-�-containing casein may also have preserved some otherbioactive molecules. Nevertheless, this work on TGF-� casein, although car-ried out for a different application, is one illustration of how further improve-ment in infant formula products may be possible. It remains to bettercharacterize the bioactive molecules in human milk and more importantly todemonstrate their biological activities and their benefits for infant growth anddevelopment.
To mediate optimal biological activity some factors will require binding tospecific host receptors. In this respect, supplementation with recombinanthuman proteins may be advantageous. Indeed, the potential benefits of usingrecombinant human lactoferrin expressed in plants [52] or transgenic cows[53] is currently being investigated. However, such approaches have legal andregulatory issues, which are unlikely to be resolved in the immediate future.
Protein Quality and Quantity in Cow’s Milk-Based Formula
199
In the interim, new biotechnology is preferred which enables the use of natu-rally occurring molecules in physiological doses and in an environment whichis more likely to exert optimal biological activity.
Conclusions
Human milk composition is unique and breastfeeding provides compo-nents that nourish, protect and develop infants in the best way. Since thebeginning of infant formula development, much effort has been made to try tomimic the characteristics of human milk. A better understanding of the pro-tein composition of breast milk in association with technological break-throughs in cow’s milk fractionation, have led to the development of infantformulas with a protein content that is closer to that of human milk. Today,infant formulas with a protein/energy ratio of 1.8 g/100 kcal are commerciallyavailable. These formulas have been shown to be safe and nutritionally ade-quate for term infants. However, the short-term and potentially long-termmetabolic benefits of formulas with reduced protein content have still to beelucidated and are currently under investigation. Further improvement in theprotein quantity in infant formula and the health benefits for the infants willbe difficult. However, in addition to providing amino acids as building blocksfor growth, milk is a source of numerous bioactive factors which are involvedin multiple physiological processes. Continuous efforts are being made toidentify new bioactive compounds in human milk. However, a better under-standing of their biological functions in suckling infants as well as a compari-son with their bovine counterparts are needed. Technological processeswhich preserve some bioactive factors in cow’s milk already exist. Theseprocesses could certainly be applied to infant formulas. Finally, the use ofrecombinant proteins is an interesting option for the development of infantformulas, which provide functions that resemble even more those providedby human milk.
References
1 Gestenberger HJ, Ruh HO: Studies in the adaptation of an artificial food to human milk. II:a report of three years clinical experience with the feeding of SMA. Am J Dis Child 1919;171:1–9.
2 Raiha NCR, Fazzolari Nesci A, Cajozzo C, et al: Protein quantity and quality in infant formula:closer to the reference; in Raiha NCR, Rubaltelli FF (eds): Infant Formula: Closer to theReference. Nestlé Nutrition Workshop Series Pediatric Nurition. Vevey/Philadelphia,Nestec/Lippincott Williams & Wilkins, 2002, vol 47, pp 111–120.
3 Fomon SJ: Requirements and recommended dietary intakes of protein during infancy. PediatrRes 1991;30:391–395.
4 Dewey KG, Beaton G, Fjeld C, et al: Protein requirements of infants and children. Eur J ClinNutr 1996;50:S119–S150.
5 Fomon S: Infant feeding in the 20th century: formula and beikost. J Nutr 2001;131:409S–420S.
Macé/Steenhout/Klassen/Donnet
200

6 Janas LM, Picciano MF, Hatch TF: Indices of protein metabolism in term infants fed eitherhuman milk or formulas with reduced protein concentration and various whey/casein ratios.J Pediatr 1987;110:838–848.
7 Fazzolari-Nesci A, Domianello D, Sotera V, Raiha NC: Tryptophan fortification of adapted for-mula increases plasma tryptophan concentrations to levels not different from those found inbreast-fed infants. J Pediatr Gastroenterol Nutr 1992;14:456–459.
8 Hanning RM, Paes B, Atkinson SA: Protein metabolism and growth of term infants in responseto a reduced-protein, 40:60 whey: casein formula with added tryptophan. Am J Clin Nutr1992;56:1004–1011.
9 Heine WE, Klein PD, Reeds PJ: The importance of alpha-lactalbumin in infant nutrition.J Nutr 1991;121:277–283.
10 Jost R, Maire J-C, Maynard F, Secretin M-C: Aspects of whey protein usage in infant nutrition,a brief review. Int J Food Sci Technol 1999;34:533–542.
11 Heine W, Radke M, Wutzke KD, et al: Alpha-lactalbumin-enriched low-protein infant formulas:a comparison to breast milk feeding. Acta Paediatr 1996;85:1024–1028.
12 Lien EL, Davis AM, Euler AR: Growth and safety in term infants fed reduced-protein formulawith added bovine alpha-lactalbumin. J Pediatr Gastroenterol Nutr 2004;38:170–176.
13 Raiha NC: Growth and safety in term infants fed reduced-protein formula with added bovinealpha-lactalbumin. J Pediatr Gastroenterol Nutr 2004;39:302.
14 Ziegler EE: Protein requirements in infancy; in Raiha NCR, Rubaltelli FF (eds): InfantFormula: Closer to the Reference. Nestlé Nutrition Workshop Series Pediatric Program.Vevey/Philadelphia, Nestec/Lippincott Williams & Wilkins, 2002, vol 47, pp 97–110.
15 Raiha NC, Fazzolari-Nesci A, Cajozzo C, et al: Whey predominant, whey modified infant for-mula with protein/energy ratio of 1.8 g/100 kcal: adequate and safe for term infants from birthto four months. J Pediatr Gastroenterol Nutr 2002;35:275–281.
16 Ziegler EE, Jeter JM, Drulis JM, et al: Formula with reduced content of improved, partiallyhydrolyzed protein and probiotics: infant growth and health. Monatsschrift Kinderheilkd2003;151:S65–S71.
17 Janas LM, Picciano MF, Hatch TF: Indices of protein metabolism in term infants fed humanmilk, whey-predominant formula, or cow’s milk formula. Pediatrics 1985;75:775–784.
18 Ziegler EE, Fomon SJ: Potential renal solute load of infant formulas. J Nutr 1989;119: 1785–1788.19 Schmidt IM, Damgaard IN, Boisen KA, et al: Increased kidney growth in formula-fed versus
breast-fed healthy infants. Pediatr Nephrol 2004;19:1137–1144.20 Dewey K, Peerson J, Brown K, et al: Growth of breast-fed infants deviates from current refer-
ence data: a pooled analysis of US, Canadian and European data sets. Pediatrics 1995;96:495–503.
21 Agostoni C, Grandi F, Gianni ML, et al: Growth patterns of breast fed and formula fed infantsin the first 12 months of life: an Italian study. Arch Dis Child 1999;81:395–399.
22 Kramer M, Guo T, Platt R, et al: Feeding effects on growth during infancy. J Pediatr 2004;145:600–605.
23 Haschke F, van’t Hof MA: Euro-Growth references for breast-fed boys and girls: influence ofbreast-feeding and solids on growth until 36 months of age. Euro-Growth Study Group.J Pediatr Gastroenterol Nutr 2000;31:S60–S71.
24 Axelsson IE, Ivarsson SA, Raiha NC: Protein intake in early infancy: effects on plasma aminoacid concentrations, insulin metabolism, and growth. Pediatr Res 1989;26:614–617.
25 Nielsen GA, Thomsen BL, Michaelsen KF: Influence of breastfeeding and complementaryfood on growth between 5 and 10 months. Acta Paediatr 1998;87:911–917.
26 Heinig MJ, Nommsen LA, Peerson JM, et al: Energy and protein intakes of breast-fed andformula-fed infants during the first year of life and their association with growth velocity: theDARLING Study. Am J Clin Nutr 1993;58:152–161.
27 Motil KJ, Sheng HP, Montandon CM, Wong WW: Human milk protein does not limit growth ofbreast-fed infants. J Pediatr Gastroenterol Nutr 1997;24:10–17.
28 Akeson PM, Axelsson IE, Raiha NC: Growth and nutrient intake in three- to twelve-month-oldinfants fed human milk or formulas with varying protein concentrations. J Pediatr GastroenterolNutr 1998;26:1–8.
29 Rolland-Cachera MF, Deheeger M, Akrout M, Bellisle F: Influence of macronutrients on adi-posity development: a follow up study of nutrition and growth from 10 months to 8 years ofage. Int J Obes Relat Metab Disord 1995;19:573–578.
Protein Quality and Quantity in Cow’s Milk-Based Formula
201

30 Scaglioni S, Agostoni C, Notaris RD, et al: Early macronutrient intake and overweight at fiveyears of age. Int J Obes Relat Metab Disord 2000;24:777–781.
31 Gunnarsdottir I, Thorsdottir I: Relationship between growth and feeding in infancy and bodymass index at the age of 6 years. Int J Obes Relat Metab Disord 2003;27:1523–1527.
32 Hoppe C, Molgaard C, Thomsen BL, et al: Protein intake at 9 mo of age is associated with bodysize but not with body fat in 10-y-old Danish children. Am J Clin Nutr 2004;79:494–501.
33 Koletzko B, Broekaert I, Demmelmair H, et al: Protein intake in the first year of life: a risk fac-tor for later obesity? The EU childhood obesity project. Adv Exp Med Biol 2005;569:69–79.
34 Savino F, Nanni GE, Maccario S, et al: Relationships between IGF-I and weight Z score, BMI,tricipital skin-fold thickness, type of feeding in healthy infants in the first 5 months of life.Ann Nutr Metab 2005;49:83–87.
35 Socha P, Janas R, Dobrzanska A, et al: Insulin like growth factor regulation of body mass inbreastfed and milk formula fed infants. Data from the E.U. Childhood Obesity Programme.Adv Exp Med Biol 2005;569:159–163.
36 Steenhout P, Haschke F, Ziegler EE: Partially hydrolyzed whey formula with reduced proteincontent: impact on IGF-1 and leptin levels. Pediatric Academic Societies’ Annual Meeting,Washington, 2005, p 4902.
37 Rabinowitz D, Merimee TJ, Maffezzoli R, Burgess JA: Patterns of hormonal release after glu-cose, protein, and glucose plus protein. Lancet 1966;ii:454–456.
38 van Loon LJ, Saris WH, Verhagen H, Wagenmakers AJ: Plasma insulin responses after ingestionof different amino acid or protein mixtures with carbohydrate. Am J Clin Nutr 2000;72: 96–105.
39 Lucas A, Boyes S, Bloom SR, Aynsley-Green A: Metabolic and endocrine responses to a milkfeed in six-day-old term infants: differences between breast and cow’s milk formula feeding.Acta Paediatr Scand 1981;70:195–200.
40 Ginsburg BE, Lindblad BS, Lundsjo A, et al: Plasma valine and urinary C-peptide in breast-fedand artificially fed infants up to 6 months of age. Acta Paediatr Scand 1984;73:213–217.
41 Campana WM, Baumrucker CR: Hormones and growth factors in bovine milk; in Jensen RC(ed): Handbook of Milk Composition. London, Academic Press, 1995, pp 476–493.
42 Hanson LA, Ashraft R, Carlsson B, et al: The Second John Soothill Lecture: breastfeeding,infections and immunology; in Chandra RK (ed): Nutrition and Immunology. St. John’s, ARTSBiomedical Publishers, 1992, pp 45–60.
43 Donnet-Hughes A, Duc N, Serrant P, et al: Bioactive molecules in milk and their role in healthand disease: the role of transforming growth factor-beta. Immunol Cell Biol 2000;78:74–79.
44 Vidal K, van den Broek P, Lorget F, Donnet-Hughes A: Osteoprotegerin in human milk: apotential role in the regulation of bone metabolism and immune development. Pediatr Res2004;55:1001–1008.
45 Labeta MO, Vidal K, Nores JE, et al: Innate recognition of bacteria in human milk is mediatedby a milk-derived highly expressed pattern recognition receptor, soluble CD14. J Exp Med2000;191:1807–1812.
46 Letterio JJ, Roberts AB: Regulation of immune responses by TGF-beta. Annu Rev Immunol1998;16:137–161.
47 Cox DA, Burk RR: Isolation and characterisation of milk growth factor, a transforming-growth-factor-beta 2-related polypeptide, from bovine milk. Eur J Biochem 1991;197:353–358.
48 Oz HS, Ray M, Chen TS, McClain CJ: Efficacy of a transforming growth factor beta 2 contain-ing nutritional support formula in a murine model of inflammatory bowel disease. J Am CollNutr 2004;23:220–226.
49 Schiffrin EJ, Yousfi ME, Faure M, et al: Milk casein-based diet containing TGF-beta controlsthe inflammatory reaction in the HLA-B27 transgenic rat model. JPEN J Parenter EnteralNutr 2005;29:S141–S150, S184–S188.
50 Beattie RM, Schiffrin EJ, Donnet-Hughes A, et al: Polymeric nutrition as the primary therapyin children with small bowel Crohn’s disease. Aliment Pharmacol Ther 1994;8:609–615.
51 Beattie RM, Camacho-Hubner C, Wacharasindhu S, et al: Responsiveness of IGF-I and IGFBP-3to therapeutic intervention in children and adolescents with Crohn’s disease. Clin Endocrinol(Oxf) 1998;49:483–489.
52 Lonnerdal B: Expression of human milk proteins in plants. J Am Coll Nutr 2002;21:218S–221S.53 van Berkel PH, Welling MM, Geerts M, et al: Large scale production of recombinant human
lactoferrin in the milk of transgenic cows. Nat Biotechnol 2002;20:484–487.54 Food and Drug Administration Rules and Regulations: Nutrient Requirements for Infant
Formulas. 21 CFR, Part 107. Fed Reg 1985;50:45106.
Macé/Steenhout/Klassen/Donnet
202

55 Codex Standard for Infant Formula. Codex Stan 72–1981. 1981, pp 1–7.56 EEC: Commission Directive 91/321/ECC f May 1991 on Infant Formulae and Follow-On
Formulae. No. L175. 1991, pp 35–49.57 American Academy of Pediatrics, Committee on Nutrition: Commentary on breastfeeding and
infant formulas, including proposed standards for formulas. Pediatrics 1976;57:278.58 ESPGAN Committee on Nutrition: Guidelines on infant nutrition. I. Recommendations for the
composition of an adapted formula. Acta Paediatr Scand Suppl 1977;262:1–20.59 Koletzko B, Baker S, Cleghorn G, et al: Global standard for the composition of infant formula:
recommendations of an ESPGHAN coordinated international expert group. J PediatrGastroenterol Nutr 2005;41:584–599.
Discussion
Dr. van Goudoever: Does your study mean that other factors are more rate-limiting than tryptophan or what explanation do you have, although you find a bettermetabolic tolerance by lowering the nitrogen excretion rate and the urea levels?
Dr. Macé: Perhaps I misunderstood but there is no deficit in tryptophan today ininfant formula I believe there are casein-predominant formula or whey-predominantformula or this modified sweet whey. They are all going to supply an adequate amountof tryptophan. But if you want to reduce the whey-predominant formula to 1.8 g pro-tein/100 kcal, here you will have an issue. But today there is no whey-predominant for-mula on the market at this level for this reason. With the modified sweet whey proteinformula you can lower the protein to 1.8 and there will be no deficit in tryptophan oressential amino acids.
Dr. van Goudoever: Let me rephrase the question then. Do you think by giving thisspecific formula, you said 1.8 g/100 kcal, that by giving 2.0 g/100 kcal, you will improve theweight gain rates?
Dr. Macé: I don’t know because we have not tested this. We have tested1.9 g/100 kcal with partially hydrolyzed formula, but we didn’t make a comparisonbetween growth in these two studies.
Dr. Haschke: May I comment on this? We are fully satisfied with the weight gainrates because they correspond to those of breastfed infants. So there is no reason tomake them fatter.
Dr. Pencharz: What you are basically doing is producing a better quality breastmilk substitute protein source. I just have a comment and then a question. In present-ing your nitrogen balance data I would suggest that you give the nitrogen balance asnitrogen percent or as a percent of nitrogen balance divided by nitrogen intakebecause that would show you have a better nitrogen percent utilization in this newproduct, the sweet whey protein-enhanced product. Now the question I have is inregard to amino acid balance. Threonine is a chronic problem, and it wasn’t clear tome from your star graphs whether the threonine was still high or whether you broughtit down. As we have shown the utilization of threonine from formula is different thanhuman milk, the oxidation is not as good; not that hyperthreonemia is pathological butwe do see that with whey protein. What did you see with this new product in terms ofplasma threonine levels? Finally the other amino acid of interest to me is cysteine;have you looked at glutathione levels? We are not just talking about protein, we arealso talking about other physiological issues like antioxidants in terms of glutathione;so threonine and cysteine and the various points I raised.
Dr. Macé: I will follow your advice for the metabolic study. The threonine levelsare quite reduced in this formula. I am not sure about the cysteine level. I will have tocheck that.
Protein Quality and Quantity in Cow’s Milk-Based Formula
203

Dr. Butte: It was fascinating to see that you had equal energy intake, equal weightgain, with the new formula vs. the breastfed group. So of course it would be very niceto measure the body composition in these children. Have you thought about measur-ing the sleeping metabolic rate? Another study we did a long time ago was sleep mon-itoring and in those studies we found that breastfed infants had higher rates of rapideye movement vs. non-rapid eye movement compared to the formula-fed infants. It isalso intriguing that you are now matching the plasma tryptophan levels to see theeffects on the sleeping metabolic rate and doing sleep studies.
Dr. Dewey: I want to follow up on Dr. Butte’s question because you mentioned thegrowth data but you didn’t show them. I am very interested to know what the samplesize was in your groups; whether the birth weights were similar between the breastfedand the modified formula group; if it was sex balanced; was the breastfed group exclu-sively breastfed, and lastly have you looked separately at birth to 4 months, or was it1–4 months?
Dr. Haschke: May I clarify this? All infants were enrolled during the first week oflife and were measured for the first time at 7 days of age. The data that were shownhere were the weight gains between 30 and 120 days. All other questions can beanswered by looking at the publication. Prof. Räihä was the first author and it waspublished 2 years ago in the Journal of Pediatric Gastroenterology and Nutrition [1].The trial was done according to the FDA rules, and was FDA approved. All the ques-tions you have related to sex, birth weight and breastfeeding are explained in thatpublication. We followed the rules.
Dr. Macé: There is no statistical difference in length gain but the size of the cohortwas limited: 28 per group.
Dr. Rigo: Can you speculate on the results of the study on �-lactalbumin where itwas shown that there is a reduction in blood urea nitrogen in boys only [2]? In yourstudy you have two levels of protein intake so it is more difficult to see if there was aneffect on blood urea nitrogen.
Dr. Macé: I have to admit that I put the two formulas in protein density which wasnot mentioned in the paper; it was grams per liter. The calorie density of the formulaswas not also mentioned. In fact we don’t know what the protein density of these for-mulas was, but at least with the information we got the difference was not so high andit is surprising that they saw a difference in urea excretion. But I am not a pediatrician;perhaps someone can answer that.
Dr. Haschke: The energy density of the two formulas was 67 kcal/100 ml.Dr. Rigo: What is the bioactive role of glycomacropeptide?Dr. Macé: This morning Dr. Butte also asked if cyclic guanosine monophosphate
(cGMP) is released in human milk. I cannot answer this question; I don’t know if any-one else has the answer. The �-casein content of human milk is only 5% so I doubt thatthis small amount of cGMP, even if it is released during the ingestion of human milk, isgoing to have a biological impact on satiety for example. What has also been shownwith cGMP, but again with high levels of cGMP, is that it increases the glucagon-likepeptide-1 levels and cholecystokinin. So it seems that it can trigger the secretion ofsome of the ingredients involved in food intake, but this has been done in rats or evenin vitro. Unfortunately I can’t answer your question; it is not clear what the role ofcGMP is in human milk.
Dr. Haschke: There is a very interesting effect of cGMP, in that it protects againstcaries. We discovered that approximately 10 years ago when we began to modify theformula protein level, and the cGMP fraction became available. Now the ColgateCompany has bought our patent and they add it to toothpaste.
Dr. Lönnerdal: To follow up the question about cGMP; I think that there are twopossible physiological effects and we should be a bit concerned about the concentration
Macé/Steenhout/Klassen/Donnet
204

dependency. Some of these bioactive components can be quite potent at low concentra-tions, but I will come back to that in my talk. cGMP provides oligosaccharides in boundform and oligosaccharides have prebiotic effects and also other potential antibacterialeffects with regard to attachment, and potentially the cGMP-bound carbohydrates couldbe somewhat more stable in the gut. Further, cGMP is heavily sialylated so it is nega-tively charged and when we used a formula enriched in cGMP in infant rhesus monkeys,we found a positive effect on both iron and zinc absorption [3]. The concentration ofcGMP may be too low in breast milk to have any significant effect but in formulas itpotentially could have some significance with regard to absorption of these cations.
Dr. Giovannini: Do you have any data about the neural behavior of children withthis formula? We studied long-chain polyunsaturated fatty acids and behavior someyears ago [4]. Because tryptophan is the basis for serotonin metabolism, it is interest-ing to see how the children cry and sleep. I think these are very important parameterswhen there is more tryptophan in a formula with less protein vs. a traditional standardformula. It is important to recognize this problem because when we use differentamino acids and different diet systems we may see differences in crying in the firstperiod of life and also later in sleep.
Dr. Macé: I fully agree that tryptophan is important for the sleep pattern and thingslike that because of serotonin, but we haven’t found a deficit, it is like in human milk. Soto answer your question, no we didn’t measure behavior in infants on these formulas.But I would not expect to see a difference with breastfed infants because the aminoacids or the tryptophan levels are not higher or lower, they are close to human milk.
References
1 Raiha NC, Fazzolari-Nesci A, Cajozzo C, et al: Whey predominant, whey modified infant for-mula with protein/energy ratio of 1.8 g/100 kcal: adequate and safe for term infants from birthto four months. J Pediatr Gastroenterol Nutr 2002;35:275–281.
2 Lien EL, Davis AM, Euler AR, Multicenter Study Group: Growth and safety in term infants fedreduced-protein formula with added bovine alpha-lactalbumin. J Pediatr Gastroenterol Nutr2004;38:170–176.
3 Kelleher SL, Chatterton D, Nielsen K, Lonnerdal B: Glycomacropeptide and alpha-lactalbuminsupplementation of infant formula affects growth and nutritional status in infant rhesus mon-keys. Am J Clin Nutr 2003;77:1261–1268.
4 Agostoni C, Riva E, Scaglioni S, et al: Dietary fats and cholesterol in Italian infants and chil-dren. Am J Clin Nutr 2000;72(suppl):1384S–1391S.
Protein Quality and Quantity in Cow’s Milk-Based Formula
205


Recombinant Human Milk Proteins
Bo Lönnerdal
Department of Nutrition, University of California, Davis, CA, USA
AbstractHuman milk provides proteins that benefit newborn infants. They not only provide
amino acids, but also facilitate the absorption of nutrients, stimulate growth anddevelopment of the intestine, modulate immune function, and aid in the digestion ofother nutrients. Breastfed infants have a lower prevalence of infections than formula-fed infants. Since many women in industrialized countries choose not to breastfeed,and an increasing proportion of women in developing countries are advised not tobreastfeed because of the risk of HIV transmission, incorporation of recombinanthuman milk proteins into infant foods is likely to be beneficial. We are expressinghuman milk proteins known to have anti-infective activity in rice. Since rice is a nor-mal constituent of the diet of infants and children, limited purification of the proteinsis required. Lactoferrin has antimicrobial and iron-binding activities. Lysozyme is anenzyme that is bactericidal and also acts synergistically with lactoferrin. These recom-binant proteins have biological activities identical to their native counterparts. Theyare equally resistant to heat processing, which is necessary for food applications, andto acid and proteolytic enzymes which are needed to maintain their biological activityin the gastrointestinal tract of infants. These recombinant human milk proteins maybe incorporated into infant formulas, baby foods and complementary foods, and usedwith the goal to reduce infectious diseases.
Copyright © 2006 Nestec Ltd., Vevey/S. Karger AG, Basel
Introduction
It is well recognized that there are several benefits associated with breast-feeding. Breast-fed infants have fewer infections [1], even in higher socioeco-nomic groups in affluent countries, and when they get sick, the illness is ofshorter duration than in formula-fed infants [2]. This, of course, is even moreaccentuated in developing countries where sanitary conditions are poor andexposure to pathogens is high. The lower prevalence of infections is likely tobe due to several factors, but many of these are unique milk proteins
207
Rigo J, Ziegler EE (eds): Protein and Energy Requirements in Infancy and Childhood.Nestlé Nutr Workshop Ser Pediatr Program, vol 58, pp 207–217,Nestec Ltd., Vevey/S. Karger AG, Basel, © 2006.

that have anti-infective properties. Breast-fed infants also have a differentgrowth pattern, different nutritional status and different gut microflora thanformula-fed infants. The high bioavailability of nutrients from breast milk isbelieved to be due in part to proteins in the milk that facilitate nutrient uti-lization [3]. While many modifications have been introduced to make infantformula more similar to breast milk, e.g. mixing vegetable oils, adding long-chain fatty acids, adding cow’s milk protein fractions, oligosaccharides andminerals/vitamins, the performance of formula-fed infants is still differentthan that of breast-fed infants [4]. Many biological activities have been associ-ated with various proteins in breast milk, and it has still not been possible tomimic the protein composition of breast milk, as these proteins are speciesspecific [5]. Among the protein are immunoglobulins, lactoferrin, �-lactalbu-min, lysozyme, haptocorrin and �1-antitrypsin. Although bovine lactoferrinand �-lactalbumin are commercially available and have been added to infantformula, no biological activities have yet been correlated to these proteins inclinical studies, possibly because they are different in structure from theirhuman milk counterparts. This may be important, as some proteins, likelactoferrin, have specific receptors in the small intestine that only recognizethe species-specific protein [6].
By using genetic engineering, human milk proteins can now be producedin microorganisms, plants or milk from dairy animals [7]. Recombinant humanmilk proteins can thus be produced in large quantities and may be used inproducts such as infant formula. However, before this can be achieved, thebioactivities of these proteins need to be evaluated, their safety assessed andthe attitude of the consumers carefully considered.
Expression Systems
Expression of Human Milk Proteins in Microorganisms
Microorganisms such as Saccharomyces and Aspergillus are being usedfor expression of human milk proteins. Human lactoferrin has been expressedin Saccharomyces, but is not commercially available, possibly due to lowexpression levels [8]. Aspergillus, however, is successfully used for the pro-duction of recombinant human lactoferrin [9], which is commercially avail-able. Expression levels are very high, making it an attractive system; however,extensive purification is needed and the cost is most likely too high for use asa food additive. Consequently, pharmaceutical applications, being more costtolerant, are being pursued for recombinant proteins produced in this expres-sion system.
Expression of Human Milk Proteins in Milk of Dairy Animals
Some of the first commercial applications for recombinant proteins wereobtained following their expression in the milk of transgenic animals.
Lönnerdal
208
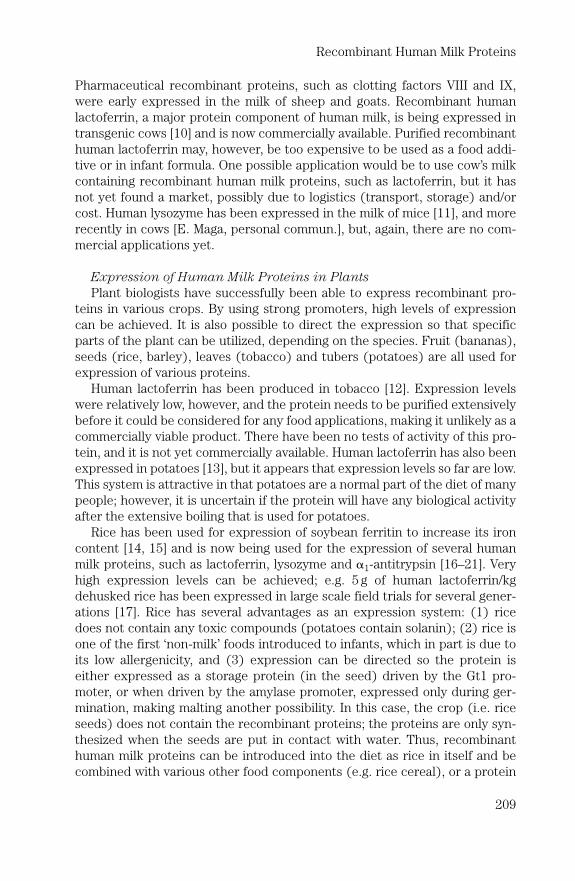
Pharmaceutical recombinant proteins, such as clotting factors VIII and IX,were early expressed in the milk of sheep and goats. Recombinant humanlactoferrin, a major protein component of human milk, is being expressed intransgenic cows [10] and is now commercially available. Purified recombinanthuman lactoferrin may, however, be too expensive to be used as a food addi-tive or in infant formula. One possible application would be to use cow’s milkcontaining recombinant human milk proteins, such as lactoferrin, but it hasnot yet found a market, possibly due to logistics (transport, storage) and/orcost. Human lysozyme has been expressed in the milk of mice [11], and morerecently in cows [E. Maga, personal commun.], but, again, there are no com-mercial applications yet.
Expression of Human Milk Proteins in Plants
Plant biologists have successfully been able to express recombinant pro-teins in various crops. By using strong promoters, high levels of expressioncan be achieved. It is also possible to direct the expression so that specificparts of the plant can be utilized, depending on the species. Fruit (bananas),seeds (rice, barley), leaves (tobacco) and tubers (potatoes) are all used forexpression of various proteins.
Human lactoferrin has been produced in tobacco [12]. Expression levelswere relatively low, however, and the protein needs to be purified extensivelybefore it could be considered for any food applications, making it unlikely as acommercially viable product. There have been no tests of activity of this pro-tein, and it is not yet commercially available. Human lactoferrin has also beenexpressed in potatoes [13], but it appears that expression levels so far are low.This system is attractive in that potatoes are a normal part of the diet of manypeople; however, it is uncertain if the protein will have any biological activityafter the extensive boiling that is used for potatoes.
Rice has been used for expression of soybean ferritin to increase its ironcontent [14, 15] and is now being used for the expression of several humanmilk proteins, such as lactoferrin, lysozyme and �1-antitrypsin [16–21]. Veryhigh expression levels can be achieved; e.g. 5 g of human lactoferrin/kgdehusked rice has been expressed in large scale field trials for several gener-ations [17]. Rice has several advantages as an expression system: (1) ricedoes not contain any toxic compounds (potatoes contain solanin); (2) rice isone of the first ‘non-milk’ foods introduced to infants, which in part is due toits low allergenicity, and (3) expression can be directed so the protein iseither expressed as a storage protein (in the seed) driven by the Gt1 pro-moter, or when driven by the amylase promoter, expressed only during ger-mination, making malting another possibility. In this case, the crop (i.e. riceseeds) does not contain the recombinant proteins; the proteins are only syn-thesized when the seeds are put in contact with water. Thus, recombinanthuman milk proteins can be introduced into the diet as rice in itself and becombined with various other food components (e.g. rice cereal), or a protein
Recombinant Human Milk Proteins
209

extract can be produced, yielding a product with higher protein and lowerstarch content.
Expression of Human Milk Proteins in Rice
We are using rice as an expression system to evaluate the biological activ-ity of select human milk proteins. To date, we have expressed lactoferrin,lysozyme and �1-antitrypsin at very high levels, and large-scale field trials forseveral generations show that the transgenic rice is stable, expression levelsare similar through generations, and the proteins are only expressed in theseeds. The genes were synthesized using codon optimization [22], i.e. the GC(guanine-cytosine) content was increased by nucleotide substitution butwithout changing any amino acid residue. Sequencing of the recombinantproteins confirmed that the amino acid sequence was identical to that of thenative proteins. The signal sequence coding for storage was used. The genewas inserted by the so-called ‘gene gun’ technique and calli were grown inculture. Positive plants, detected by extraction and Western blots, weregrown in greenhouses to obtain mature seeds. Seeds positive for the recombi-nant protein were subsequently grown in fields according to USDA regula-tions. Purified recombinant human lactoferrin and �1-antitrypsin were foundto be glycosylated, but the carbohydrate content was less than that of theirnative counterparts. In other words, rice does recognize the signals for N-linked glycosylation and the specific sites were glycosylated, but the glycansare smaller than those in the native proteins. The carbohydrates in the riceglycans are similar to those in the human N-linked glycoproteins, i.e. man-nose and fucose. The terminal residues, however, are usually mannose orxylose, while the native proteins usually have fucose or sialic acid. This differ-ence in terminal monosaccharides in the recombinant proteins may affect sta-bility (e.g. liver clearance) when used for intravenous applications, but isunlikely to have an effect on food applications or to affect allergenicity. In thecase of lactoferrin, which has its own specific receptor in the small intestine[6], we have shown that de-glycosylated human lactoferrin as well as differentrecombinant forms of human lactoferrin (Aspergillus, rice) bind equally wellto the receptor, i.e. the glycan moiety of lactoferrin is not involved in thebinding to the receptor. Thus, we conclude that the glycosylation of thesehuman milk proteins when synthesized in rice is unlikely to affect their nutri-tional value.
Biological Activity of Recombinant Human Milk Proteins
We have verified that the recombinant human milk proteins have theirintended biological activities in vitro (fig. 1). Recombinant human lactoferrinwas shown to both bind and release iron at low pH in a manner similar to thatof native human lactoferrin [16]. It also bound similarly to the human lactoferrin
Lönnerdal
210

receptor, which is present on the surface of the human intestinal cell line,Caco-2, grown in culture, and with an affinity similar to that of native lacto-ferrin. In addition, recombinant human lactoferrin was shown to inhibit thegrowth of enteropathogenic Escherichia coli (EPEC), one of the most common
Recombinant Human Milk Proteins
211
Fig. 1. Comparison of functional and biological activities between nHLf and rHLf. (aa)Iron-binding capacity, (bb) pH dependent iron-release properties, (cc) antimicrobialactivity against enteropathogenic E. coli (EPEC): 1 �g/ml of either nHLf or rHLf wereincubated with 106 cfu/ml of EPEC in the synthetic broth and bacterial growth weremeasured at various time points by absorbance at 630 nm. Control does not containany protein but 106 cfu/ml EPEC. (dd) binding of nHLf and rHLf to Caco-2 cells. (ee)uptake of nHLf and rHLf by Caco-2 cells (from [16]).
pm
ol/m
illio
n o
f cells
pm
ol/m
illio
n o
f cells
AB
S630 (nm
)
Time (h)
Kd (rHLf)�106�12nM
n�1.2�0.07pmol
Kd (nHLf)�57�7nM
n�0.55�0.03pmol
Iro
n s
atu
ratio
n (%
)
Molar ratio (Fe/HLf)
0
a d
b
c
e
0 2 4 6 8 10 12 14
20
0
40
60
80
1001.0
2.5
0.25
0.2
0.15
0.1
0.05
0
2.0
1.5
1.0
0.5
0
0.8
0.6
0.4
0.2
00
0 5 10 15 20 25
0.05 0.1 0.15
125l-HLf (�M)
0.2 0.25
nHLf
rHLf
1 2 3 4
Iro
n s
atu
ratio
n (%
)
pH Time (h)
1
20
0
40
60
80
100
32 5 6 7 84
nHLf
rHLf
nHLfControl
rHLf
nHLf
rHLf

causes of diarrhea in infants and children, and at a concentration similar tothat of native human lactoferrin. When tested in the conventional assay forlysozyme activity, which is based on the lysis of Micrococcus lysodeiktus, therecombinant human lysozyme had an activity similar to that of native humanlysozyme. The recombinant human lysozyme also inhibited the growth ofEPEC at the same concentration as the native enzyme. Breast milk contains asignificant concentration of �1-antitrypsin [23], and we have hypothesizedthat this inhibitor of proteolytic activity in the small intestine contributes tothe ‘survival’ of some human milk proteins, so that they can exert their phys-iological activities in the upper small intestine. The recombinant human �1-antitrypsin inhibited trypsin and elastase to an extent similar to that of nativehuman �1-antitrypsin [21]. Thus, for these three human milk proteins we havedemonstrated that they have activities similar to those of their native coun-terparts. For two of these proteins, lactoferrin and �1-antitrypsin, thisoccurred in spite of some differences in glycosylation.
Stability of Recombinant Human Milk Proteins
To be active in the small intestine, the recombinant proteins need to beable to withstand exposure to low pH in the stomach. While the gastric pH ofinfants rarely is below pH 4–5 for the first 6 months of life, in some cases thepH may be as low as pH 2–3. We therefore exposed the recombinant humanmilk proteins to low pH, from pH 2 to 5, for 30 min and then adjusted the pHback to neutral. Activities of all three recombinant proteins, assessed asabove, were similar to those of the native proteins [16, 18, 21]. If recombinanthuman milk proteins are to be added to infant formula or baby foods, somedegree of processing may be involved. We therefore exposed the recombinantproteins, both in pure form in solution and as added to infant formula, to var-ious heat treatments, ranging from 78 to 100�C for 8 s up to 30 min. Except forthe most severe treatment, 100�C for 5 min, which partially inactivated bothrecombinant and native human milk proteins, these proteins maintainedactivities similar to those of the native proteins [16, 18, 21].
Digestive Fate of Recombinant Human Milk Proteins
Proteins are in general effectively digested by the combined proteolyticactivities in the stomach and small intestine. Infants, however, are an excep-tion to this. Infants have low pepsin secretion and the pH of the infant stom-ach is usually around pH 4–5 [24], a pH too high for significant pepsin activity.In addition, secretion of pancreatic enzymes is immature, limiting the prote-olytic activity in the small intestine. Further, some human milk proteins havestructures that make them relatively resistant against proteolytic enzymes.
Lönnerdal
212

As an illustration of this, we have found significant concentrations of lactofer-rin, secretory IgA and �1-antitrypsin in the stool of breast-fed infants [23, 25]and this persists up to at least 4–6 months of age. The proportion of proteinssurviving decreases with increasing age, most likely as digestive functionmatures. It is, of course, also possible that some milk proteins survive passageof the stomach and the duodenum and may exert actions in the upper gut, tobecome digested further down in the small intestine.
We have developed an in vitro digestive system [26] to evaluate the survivalof recombinant human milk proteins. Briefly, the proteins, in pure form oradded to infant formula, are exposed to low pH and pepsin for 30 min at 37�C.The pH is then adjusted to pH 7 and pancreatin (a mixture of pancreaticenzymes) is added. The solution is then incubated for 30 or 60 min, and theproteolytic enzymes are inactivated by brief (2–3 min) boiling. The molecularweights of the proteins are assessed by Western blotting, and their activitiesare assessed as described earlier. For all three proteins we studied, activitiesremained after treatment, and to an extent similar to that of the native humanmilk proteins. While some degradation did occur, the major part of the activ-ity remained, and the extent of degradation was similar for recombinant andnative proteins.
Further Testing
We have shown that recombinant human milk proteins can be produced atvery high levels in rice and that they can withstand low pH and heat treat-ment, as well as proteolytic digestion in vitro. Further efficacy and safety tri-als in animals and humans will be needed next.
Safety studies in rats will be necessary prior to human trials. For efficacystudies, we have chosen to first use a rat pup model, in which we can assessthe resistance against proteolytic activity as well as anti-infective properties(incubate with pathogens). We have also used infant rhesus monkeys. Thisnon-human primate model of human infants has a high degree of validity astheir gastrointestinal physiology is very similar to that of human infants, andrhesus milk is reasonably similar to human milk both in nutrient content andwith regard to bioactive proteins (e.g. lactoferrin). Another advantage of thismodel is that they can be fed regular infant formulas, without any modifica-tion of nutrient content, exclusively for 4–6 months. The addition of recombi-nant human milk proteins to infant formula can therefore be evaluated underrealistic conditions. This model also allows us to infect the infant monkeywith a pathogen, such as EPEC, and evaluate the effect of the added proteinon diarrhea prevalence, severity and duration [27]. Such studies, of course,are not possible in human infants.
Once efficacy has been shown in these models, human trials are needed bothwith regard to efficacy and safety. Recently, we have evaluated the effects of
Recombinant Human Milk Proteins
213

adding recombinant human lactoferrin and lysozyme to the WHO oral rehydra-tion solution (ORS) used to treat children with acute diarrhea in a prospective,double-blind, randomized controlled trial in Peru. Children receiving ORS withadded recombinant human milk proteins had a significant decrease in the dura-tion of diarrhea as compared to children receiving control ORS [Zavaleta andLönnerdal, in preparation]. These recombinant human milk proteins may beincorporated into infant formulas, baby foods and complementary foods andused in industrialized as well as developing countries with the goal of reducinginfectious diseases. However, for infant formula efficacy trials are essential asinfant formulas are regulated by federal law, the Infant Formula Act, whichdoes not allow additions of novel components unless benefits have beendemonstrated. Thus, addition of components primarily for marketing reasons,which occurs in some countries, will not be allowed.
Conclusions
Expression of recombinant human milk proteins in rice is realistic and apossibility for the addition of bioactive factors to infant formula and babyfoods. We have been able to produce several such proteins at very highexpression levels and have shown that the transmission is stable through sev-eral generations. Large-scale field trials have produced such rice in severaltons, making it possible for evaluation of efficacy. In vitro studies have shownthat these proteins have activities and stabilities similar to those of the nativeproteins and that they, to a considerable extent, withstand heat treatment.Further animal work and studies in human subjects are needed to documenttheir efficacy and safety.
References
1 Kovar MG, Serdula MK, Marks JS, Fraser DW: Review of the epidemiological evidence for anassociation between infant feeding and infant health. Pediatrics 1984;74:615–638.
2 Dewey KG, Heinig MJ, Nommsen-Rivers LA: Differences in morbidity between breast-fed andformula-fed infants. J Pediatr 1995;126:696–702.
3 Lönnerdal B: Nutritional and physiologic significance of human milk proteins. Am J Clin Nutr2003;77:1537S–1543S.
4 Lönnerdal B: Breast milk and breastfed infants: implications for improving infant formula. AmJ Clin Nutr 2003;77:1535S–1536S.
5 Lönnerdal B: Human milk proteins – key components for the biological activity of humanmilk. Adv Exp Biol Med 2004;554:423–426.
6 Kawakami H, Lönnerdal B: Isolation and function of a receptor for human lactoferrin inhuman fetal intestinal brush border membranes. Am J Physiol 1991;261:G841–G846.
7 Lönnerdal B: Recombinant human milk proteins – an opportunity and a challenge. Am J ClinNutr 1996;63:622S–626S.
8 Liang Q, Richardson T: Expression and characterization of human lactoferrin in yeastSaccharomyces cerevisae. J Agric Food Chem 1993;41:1800–1807.
Lönnerdal
214

9 Ward PP, Lo JY, Duke M, et al: Production of biologically active recombinant human lactofer-rin in Aspergillus oryzae. Biotechnology (NY) 1992;10:784–789.
10 Krimpenfort P: The production of human lactoferrin in the milk of transgenic animals. CancerDetect Prev 1993;17:301–305.
11 Maga EA, Anderson GB, Cullor JS, et al: Antimicrobial properties of human lysozyme trans-genic mouse milk. J Food Prot 1998;61:52–56.
12 Salmon V, Legrand D, Slomianny MC, et al: Production of human lactoferrin in transgenictobacco plants. Protein Expr Purif 1998;13:127–135.
13 Chong DK, Langridge WH: Expression of full-length bioactive antimicrobial human lactoferrinin potato plants. Transgenic Res 2000;9:71–78.
14 Goto F, Yoshihara T, Shigemoto N, et al: Iron fortification of rice seed by the soybean ferritingene. Nature Biotechnol 1999;17:282–286.
15 Drakakaki G, Christou P, Stoger E: Constitutive expression of soybean ferritin cDNA in trans-genic wheat and rice results in increased iron levels in vegetative tissues but not in seeds.Transgenic Res 2000;9:445–452.
16 Suzuki YA, Kelleher SL, Yalda D, et al: Expression, characterization and biological activity ofrecombinant human lactoferrin in rice. J Pediatr Gastroenterol Nutr 2003;36:190–199.
17 Nandi S, Suzuki Y, Huang J, et al: Expression of human lactoferrin in transgenic rice grains forthe application in infant formula. Plant Sci 2002;163:713–722.
18 Huang J, Wu L, Yalda D, et al: Expression of functional recombinant human milk lysozyme intransgenic rice cell culture. Transgenic Res 2002;11:229–230.
19 Huang J, Nandi S, Wu L, et al: Expression of recombinant human lysozyme in rice grain. MolecBreeding 2002;10:83–94.
20 Terashima M, Murai Y, Kawamura M, et al: Production of functional human alpha(1)-antitrypsinby plant cell culture. Appl Microbiol Biotechnol 1999;52:516–523.
21 Chowanadisai W, Huang J, Huang N, Lönnerdal B: Potential of using recombinant humanalpha-1-antitrypsin produced in rice in infant formula. J Nutr Biochem 2003;14:386–393.
22 Huang N, Simmons CR, Rodriguez RL: Codon usage patterns in plant genes. J CAASS1990;1:73–86.
23 Davidson LA, Lönnerdal B: Fecal alpha-1-antitrypsin in breast-fed infants is derived fromhuman milk and is not indicative of enteric protein loss. Acta Paediatr Scand 1990;79: 137–141.
24 Agunod M, Yamaguchi N, Lopez R, et al: Correlative study of hydrochloric acid, pepsin, andintrinsic factor secretion in newborns and infants. Am J Dig Dis 14:401–414, 1969.
25 Davidson LA, Lönnerdal B: Persistence of human milk proteins in the breast-fed infant. ActaPaediatr Scand 1987;76:733–740.
26 Rudloff S, Lönnerdal B: Solubility and digestibility of milk proteins in infant formulas exposedto different heat treatments. J Pediatr Gastroenterol Nutr 1992;15:25–33.
27 Kelleher SL, Casas I, Carbajal N, Lönnerdal B: Probiotic Lactobacillus reuteri and zinc sup-plementation of infant formula affects growth, nutritional status and incidence of experimen-tal gastroenteritis diarrhea in infant rhesus monkeys. J Pediatr Gastroenterol Nutr 2002;35:162–168.
Discussion
Dr. Hernell: I just wanted to add to the discussion that also recombinant humanmilk bile salt-stimulated lipase produced in transgenic sheep has been subjected totwo small clinical trials to treat fat malabsorption in patients with cystic fibrosis. Sothe recombinant enzyme has been proven safe and has a clinical effect as expected.Then in your list of various expression systems, I missed mammalian cell lines, e.g.Chinese hamster ovary (CHO) cells. If for expression of glycosylated proteins you areconcerned about the glycosylation pattern, mammalian cells would probably be a use-ful alternative because they are likely to yield a glycosylation pattern closer to thenative human protein.
Dr. Lönnerdal: It is a good point. I am not sure how economically realistic it wouldbe to add CHO-produced proteins to food products. I don’t know what kind of capac-
Recombinant Human Milk Proteins
215

ity you have to produce them in quantities needed for foods. I am happy that youbrought up the glycosylation issue because it is also possible to insert enzymes on theterminal carbohydrates of the human glycan in rice. Thus, you can produce not justthe recombinant human milk protein but you can also put in recombinant enzymesthat will start mimicking the glycan. That is something that, if needed, can be done,but for lactoferrin we just have not yet seen a need for it. When it comes to �-casein,where glycan plays a much more fundamental role, something like that may be neededor the use of CHO cells that will provide a mammalian glycosylation pattern.
Dr. Haschke: Thank you for introducing the fascinating world of bioactive compo-nents. From the industrial stand point as you have mentioned, there are so many vari-ables to overcome to apply this concept. The first one is the safety issue, and safetymust finally be demonstrated in infants, even if there is no theoretical reason thatthere might be a safety question. Phase-1 studies cost a lot of money and are verytime-consuming. The other thing is the functional outcome study. You showed onestudy in which the duration of diarrhea was reduced. This is similar to what we canachieve with lactobacillus GG, which is now added to infant formulas. It is exactly thesame outcome; a reduction in the duration of diarrhea from 5.4 to 4 days. So of courseprobiotics are not 100% safe either. But they are more accepted by the consumer andit is very difficult for the industry to make the consumer believe that there is really anadvantage unless we can really show positive effects in favor of the infant receiving it.So we have a long way to go, I don’t know whether you would agree with this. In theend, if we are doing something wrong, we will be punished.
Dr. Lönnerdal: You are quite right and I have sympathy with you. I am primarilyinterested in the function of the proteins and not the commercial applications, but Iam acutely aware of the fact that the attitudes are very different. In the US the probi-otic concept is not an easy-sell at all because these are live bacteria and ‘you don’t eatthat’. In Europe, including Sweden, this is a common part of the diet and there are nonegative associations with probiotics, whereas in the US there is a much more adversereaction. Then you have the opposite: in the US you actually have limited negativepublicity and attitudes against recombinant proteins as such, so there is not at all thesame pressure on the industry to refrain from this because they are in soy, in corn, andon the market already. So again the attitude will depend on what the market will be.
Dr. Hernell: Just a comment to follow that. Today I think no one would evendream of not using recombinant insulin and growth hormone. That shows how fast weare moving. Some 20 years ago these recombinant hormones were new on the market;now it is established routine to use them. No one talks about safety anymore.
Dr. Klassen: Can you speculate on what the next step will be to demonstrate thesynergistic effect you mentioned? In your opinion what bioactive factors should becombined to achieve further benefit? In Dr. Dewey’s presentation we have also seenthat there is a tremendous amount of bioactive components present in milk and hencecombinations thereof.
Dr. Lönnerdal: I can speculate. I have always believed in Aristotle who said, ‘thereis a reason behind everything in Nature’. Why would you have so much �1-antitrypsinin breast milk? In a way you can view �1-antitrypsin as a ‘break molecule’. We havedone in vitro studies, and �1-antitrypsin will basically delay digestion by pancreaticenzymes to some extent [1]. The possibility would then exist for some of the humanmilk proteins to have an effect in the duodenum, and perhaps the upper part of thejejunum, and then, after that, they would start being digested. It is a possibility that wehave a synergistic effect by which �1-antitrypsin would limit the digestion of some ofthese bioactive milk components in order to allow them to perform various functions.
Dr. Telmesani: There is active research towards animals that can produce organscompatible to humans for transplantation. Is there any possibility and/or are there anystudies towards cloning the human mammary gland to produce human milk?
Lönnerdal
216

Dr. Lönnerdal: I am not sure how easy it would be. We dreamt about many ofthese things 20 years ago, and we are moving fast. When it comes to whole organs andtissues like that I am not sure. We have immortalized human cell lines so certainly thepossibilities are there to get closer to organs, but we may not reach the stage wherewe would have ‘human dairy industries’.
Dr. Yun Cao: Does the breast milk of mothers with very premature babies alsocontain this kind of active protein?
Dr. Lönnerdal: That is a very good question. In fact, for many of these bioactiveproteins, the richest source you can find is colostrum and the milk of women whodeliver prematurely, because in a way premature milk can be viewed as almost a ‘supercolostrum’. Previous research on colostrum and ‘premature milk’ has shown that con-centrations of lactoferrin are incredibly high, those of secretory IgA are high, andmany of these bioactive proteins are very high in concentration. It is very costly tocare for premature infants, and premature milk fortifiers or preterm formula may beapplications where you would start to see such proteins added, as it is so important toprotect the preterm infant.
Dr. Roggero: Could conservation (human milk bank) or pasteurization alter thesebiological proteins or substances?
Dr. Lönnerdal: It varies. One of my former students, Dr. Madeleine Sigman, hasactually studied banked human milk and found that the extent to which these proteinssurvive varies with the protein. Lactoferrin is relatively tough, secretory IgA is also rel-atively tough, whereas lysozyme may be more affected by heat. The problem we havehad is that the technical qualities of the milk change with heat treatment, so purifyingproteins from breast milk is much more difficult because they tend to aggregate moreafter pasteurization. But from the infant point of view, it still seems that most of thebioactive proteins are still active after pasteurization.
Dr. Hernell: I just want to add that if you compare fresh and pasteurized humanmilk with respect to functional effects, the most striking difference is decreased fatabsorption from pasteurized milk. The reason being that the milk bile salt-stimulatedlipase is rapidly activated at 62.5�C. This temperature, which is typical for the pas-teurization of human milk, is critical for both lactoferrin and IgA. A slight increase intemperature will rapidly increase the inactivation of both.
Reference
1 Davidson LA, Lönnerdal B: Fecal alpha 1-antitrypsin in breast-fed infants is derived fromhuman milk and is not indicative of enteric protein loss. Acta Paediatr Scand 1990;79:137–141.
Recombinant Human Milk Proteins
217


Concluding Remarks
I would like first to thank you all for sharing your experiences andexchanging knowledge; we all have benefited from it. We all shared the objec-tives and the goal that we wish to further the lot of children in the world. Tothat goal these exciting 3 days have enhanced our ability to carry out ourobjectives. It is appropriate that we thank the sponsors who have brought ustogether here, and that is the Nestlé Nutrition Institute, its director, Dr.Ferdinand Haschke and Dr. Denis Barclay who have organized this meeting,and we must also not forget Dr. Philippe Steenhout who conceived this con-ference and organized it initially before he turned things over to Dr. Barclayand we are grateful for all their efforts. We also express our gratitude to thelocal organizers, Pierre Schaufelberger; we thank Vipapan Panitantum andMontip Nagsevi and all the other staff of Nestlé Viet Nam for organizing thisso splendidly and for feeding us so excellently.
Now it is Dr. Rigo’s and my job to summarize what has happened in the last 3days and that is essentially impossible. We decided to steal a few of your slidesand show them again, mainly to remind you of what you heard during the meet-ing. That is what we are going to do over the next 30 min and Dr. Rigo will startand I will finish up.
Ekhard Ziegler
First of all I want to thank you, Dr. Ziegler, for his collaboration in thismeeting; it was so easy for me to work with him. If any of you are asked toorganize a meeting, you need to do it with Dr. Ziegler.
We started the workshop with a beautiful overview by Berthold Koletzkoon the early feeding and the programming effect up to adult age. His topicfocused on the protein hypothesis, and all of us are now waiting for theresults of this wonderful controlled randomized study.
After that we had a very elegant presentation by Allison Yates on thedietary reference intakes and the new concept for protein and energyrequirements. She showed us that all the components of the dietary reference
219
Rigo J, Ziegler EE (eds): Protein and Energy Requirements in Infancy and Childhood.Nestlé Nutr Workshop Ser Pediatr Program, vol 58, pp 219–224,Nestec Ltd., Vevey/S. Karger AG, Basel, © 2006.

intake were used in the new reference for the different nutrients and macro-and micronutrients in the diet of pediatric patients and also adults. Sheshowed us the different components of this dietary reference intake.
After that we had the opportunity to meet a few of the main workers in thenew recommendation data, and it was very interesting to discuss the new pro-tein and energy requirements for infants and children. First of all, Nancy Buttepresented the energy requirements. These data were based on the increase intotal energy expenditure which was evaluated with doubly labeled water andalso heart rates. She presented the new energy requirements in infants. Thenew energy requirement is far from the previous one, and at the end of thefirst year of life the new energy requirement is quite decreased to about 15%.Then it was shown that in large infants there is also a significant differencebetween the new energy requirements when the children are 5–12 years old.
In the following presentation Peter Garlick showed us the protein require-ments for infants and children which are mainly based on multiple nitrogen bal-ance studies in order to evaluate the need for maintenance and the question ofutilization for growth. We can base the requirements on maintenance and pro-tein deposition according to the slope observed during multiple metabolic bal-ance studies in infancy. The protein deposition was calculated using recentmeasurements of total body potassium content in infants and children between4 and 18 years of life. If we now look at the new approach to protein require-ments we see that there is a relative reduction in the protein requirement dur-ing the first 6 months of life which was also based on the human milk intake inthose infants. There is very good agreement between the milk protein intakeand the requirement calculated by the factorial approach. So the proteinrequirement seems also to be slightly lower for large infants. Amino acidrequirements were also presented according to the same technology. It was afactorial approach because presently there are some insufficient results on theindicator of amino acid oxidation. Dr. Garlick presented data for infantsbetween 1 and 4 years of age and the new recommendation represents between60 and 95% of the previous one according to the different essential amino acids.
Following this presentation the question was to know what the potentialtoxic effect or deleterious effect of high protein supply could be, and this waspresented by Irene Axelsson. From these data we can see that there are dif-ferent indices of protein overload when we increase the protein supply in thenewborn infant. Eventually we can speculate on some long-term effects, andshe presented data on the increase in kidney growth in formula-fed versusbreastfed infants, and we know that nephrogenic activity is completely closedat the time of birth.
After that the second discussion was on the growth of breastfed and for-mula-fed infants, and in his presentation Ekhard Ziegler tried to answer thequestion, can the energy and protein intake of breastfed infants be emulatedin formula-fed infants. He showed that for energy intake, even with this per-turbation in the energy density of formulas, it is only possible to affect the
Ziegler/Rigo/Haschke
220

energy intake and growth during the first 2 months of life but no later. Interms of protein intake he concluded that emulating the protein intake ofbreastfed infants in the first 4 months of life is possible, but with complexinterventions. It can probably also be achieved with starter formula with 1.8 gprotein/100 kcal and follow-up formula with 1.5 g/100 kcal. But at a borderlineprotein concentration it appears possible that infants compensate with agreater intake of formula thereby consuming an excess amount of energy.
So following the first 2 days the question arose, is it possible to translate thenew recommendations into clinical practice. When I teach nutrition to stu-dents in Belgium I have the habit of discussing the evolution of energy andprotein supply during the first year of life, and I use this example: body weightaccording to time. During the first month of life we provide close to 200 ml/kg,or 600 ml of milk. The babies receive only milk until about 5 months of ageand at this time the milk intake decreases progressively to 150 ml/kg bodyweight/day. At 5 months we start with complementary feeding and providesome food mixtures. At 6 months we start with a little meal at lunch, and anevening meal at 9 months of age. Therefore from the feeding we can calculatewhat could be the energy and protein supply during the first year of life.Presently the recommendation for the mother is to use the lowest protein con-tent formula during all the first year of life. If we then recommend decreasingthe protein supply, not giving too much meat or protein during the eveningmeal, and then calculate the protein supply, we find that energy is relativelyhigh during the first month of life, 130 kcal/kg/day. It decreases at 3 monthsbut stays close to 100 kcal, which is about 20% more than the new recommen-dations. When we look at protein supply it is about 2.4 during the first monthsof life and after 6 months it is still about 2 g protein/kg body weight/day. Somuch more than the new recommendation. We need to think about what couldbe the consequences of the new recommendations. Recommendations shouldbe translated into regulations. We have the Codex Alimentarius and theEuropean Union directives needed to provide the new recommendations. Ialso think that there is an implication for industry; products need to beadapted to the recommendations. We also need prospective studies to evalu-ate the safety of the new recommendations in newborn infants.
Jacques Rigo
The first talk I will review is Jacques Rigo’s talk about body compositionand he obviously has spent a great deal of effort and has immense data on thebody composition of growing premature and full-term infants. He producedgraphs showing, for instance, that the various methods we have, includingTOBEC, DEXA and the indirect methods that Nancy Butte used, all produceabout the same pattern of change in fat-free body mass; the change in fatmass is expressed as percentage per kilogram. But Jacques Rigo showed that
Concluding Remarks
221
premature infants who are fed formula do better in terms of gain in fat-freemass, but they also gain a little bit more in fat mass.
We come now to the very exciting talk by Hans van Goudoever. I gainedseveral insights that furthered my knowledge. One was that the gut of younganimals, and by extension probably also of young infants, undergoes tremen-dous growth disproportional to body weight and body growth. One of theimplications is that most infants who are growing rapidly probably haveabdominal discomfort most of the time because their gut is also growing sofast. But the real scientific insight for me was that premature infants whoreceive not unreasonable protein intakes in the first few days don’t oxidizeany amino acids. This can only mean that they are not getting enough proteinbecause oxidation is turned on only when there is a surfeit of amino acids.Lysine oxidation is close to 0.3 and in oxidation it is close to 0 in prematureinfants. I really admire him for these studies because they are not easy to do;they are easy to do in piglets but in human infants they are quite involved.Therefore we are grateful to him for having done these excellent studies. Heconcluded overall that both in humans and pigs high amounts of dietaryamino acids are utilized first pass by the intestine, and one implication is that,when we estimate required dietary intakes of protein for premature infants,we make a correction for the inefficiency of intestinal absorption and we usefactors like 10 or 15%. I think we probably have to apply a much higher cor-rection factor because some of the limiting amino acids are retained by thegut and not made available systemically.
Now we come to the talk by Harvey Anderson that we heard over thephone this morning. It was quite a feat for Denis Barclay to arrange this andfor the audiovisual people to pull it off; I have never been at a conferencewhere we had a speaker more than 9,000 km away. You remember that as hespoke he mostly raised questions which is for the most part where the field is;the regulation of food intake consists of a large number of questions with veryfew answers. He showed us some very interesting findings, but we are farfrom any good understanding. One of the real problems is that when we sayregulation we have to think of very short-term, short-term and long-term, andultimately what counts in human nutrition or any nutrition is long-term regu-lation, week to week. After all what makes us obese is long-term excess ofenergy intake or energy retention.
Now next we come to Carlo Agostoni who told us that most studies thathave looked at the protein intake of older infants and toddlers find that theprotein intake is high in terms of requirements. We don’t know why toddlersand older infants are receiving such high protein intakes, perhaps tradition orcustom, but we cannot conclude that the infant has a need for such highprotein intake. So the infant must somehow select because at that age it hasvery limited selection, but it is not an impossibility. Of course the currenthypothesis is that such high protein intakes have adverse effects on the laterdevelopment of obesity, and this I have to remind you is a useful hypothesis,
Ziegler/Rigo/Haschke
222

nothing more. I think that being big is not necessarily going to be a disadvan-tage because we all know that height confers very significant advantages inlife. So there may be a higher risk of diabetes, but everything being equal a bigchild could succeed in life much more than their little sibling.
Kathryn Dewey gave us a wonderful talk about breastfeeding and why andwhen we should introduce complementary foods. I found her arguments verycompelling, even though I feel that in industrialized countries it is not a bigissue and I think she agrees with that. But in developing countries it is a bigand important issue, and we are grateful to her. We all heard her conclusionsand I think they are well supported by the data. I especially like her findingsabout iron deficiency because I find the same thing that breastfed babies areat a considerable risk of becoming iron-deficient.
Then we heard from Jehan-François Desjeux about a new development inthe rehabilitation of malnourished infants and children. The food that he told usabout is the RUFT, ready-to-use therapeutic food, and I was quite impressed bythe benefits of this food. I know very little about malnutrition but I think this isa very promising approach. The conclusion was that, in severely malnourishedchildren presenting with dehydration and secondary cholera, rigorous intra-venous and oral rehydration is effective with full and rapid recovery.
Katherine Macé gave us a wonderful overview of the new developments indairy technology. A summary of plasma tryptophan levels in babies receivingthe various formulas shows that the tryptophan levels in �-lactalbumin-enriched formula are similar to those in breastfed babies, and when casein gly-comacropeptide is removed the threonine levels become more like those inbreastfed babies. Later we heard that the glycomacropeptide isn’t perhaps allthat bad after all if we were able to get rid of the threonine it contains, which isthe problem. She gave us her overview of what she thinks technology is going togo. She thinks that a further decrease in the protein quantity in infant formulasis certainly feasible, but their added benefit of health in term infants is ques-tionable, and that implies also for follow-on formulas, not for starter formulas.
Finally Bo Lönnerdal’s wonderful presentation, which you must still havein mind. He and his colleagues have expressed human recombinant humanmilk proteins in rice and this is a very exciting development. The nice thing isthat this is an edible plant, no extensive purification is needed, essentially therecombinant rice can be fed. The conclusions were that bioactive proteinscould be added to infant foods, hopefully that will happen in our lifetime, theregulatory agencies and the public willing.
I wish you all a good and safe trip home. It was great to have you all here.
Ekhard Ziegler
A few words from the perspective of the Nestlé Nutrition Institute. Thisworkshop is coming to an end and I must say it was very attractive, compelling
Concluding Remarks
223

and motivating because we learned a great deal, with a lot of new findingswhich we could discuss and to which we could observe your reactions. So forus at the Nestlé Nutrition Institute, it was a great opportunity being togetherwith you here in Viet Nam.
I must say there were a number of key issues that became completely clearto me, among these being protein energy requirements, amino acid require-ments and utilization. There are also a few issues which remain unclear, suchas breast feeding and obesity, and the timing and way to introduce comple-mentary feeding. The speakers addressed all aspects in a very fair and bal-anced way and I would like to thank them sincerely for their efforts; manywere not easy to present. Then there also issues where considerable researchis needed for clarification. For example, Dr. Axelsson mentioned that we arehunters and that we should feed meat to infants. This is something completelynew, and I think you would all agree that we need research to clarify this.
Another question which surprised me is that cereals are not consideredamongst the best choices for complementary feeding. I am surprised for tworeasons. The first is that in 1867 the founder of our company developed acereal-based milk to promote child survival. Scientific publications on cerealswere already in German publications, dominating pediatric literature, 40years before appearance of the first US infant nutrition publications. I knowthis because I had to review all the literature for Dr. Sam Fomon for his bookon the history of pediatric nutrition. I am also surprised because cereals arean integral part of culture and feeding habits in many countries. Emigration ofEuropean populations to North America and elsewhere have propagatedEuropean complementary feeding practices in which cereals are not the pri-mary source of nutrition. However in Latin America, Africa and especiallyAsia where 80% of the world’s babies are born, infants and children would notreceive adequate nutrition nor even survive without cereal-based comple-mentary foods. Finally, cereals are very convenient since they are well suitedto fortification and can thus contribute to enhancing the nutrition of infantsand children in many emerging as well as industrialized countries. Soresearch is needed; we are listening to you and perhaps we will meet 5 yearsfrom now to discuss the next generation of findings.
I would like to close by thanking the two Chairpersons of this workshop,Ekhard Ziegler and Jacques Rigo, for putting together this fascinating scien-tific program. Thanks also to all the speakers and participants for their con-tributions, as well as the local Nestlé team headed by Ms. Montip Nagsevi andMs. Vipapan Panitantum, for their most professional workshop organizationand wonderful social events. Hopefully we will all meet somewhere else in theworld at another Nestlé Nutrition Workshop.
Ferdinand Haschke
Ziegler/Rigo/Haschke
224

Adequate intake (AI), dietary referenceintake 85
Adiposity, see Body compositionAgouti, epigenetic regulation 141Air displacement plethysmography
(ADP)body composition assessment 67, 68,
76, 77infants 75
Amino acidscow’s milk formula 191, 193, 203diarrhea and amino acid metabolism
107dietary requirements
adaptation 117, 118biological processes 110determination 110, 111disease effects 113, 115dispensable amino acids 110human milk sufficiency 117indispensable amino acids 109,
111–114, 116–119preterm versus term infants 118prospects for study 115
glutamine versus glutamate studies104, 157
oral rehydration solution utilization106, 107
piglet studies of metabolismamino acid utilization and systemic
availability 98, 99
energy sources 97, 98infant model 96intestinal energy expenditure 97overview 96, 97
preterm infant studies of metabolismfirst-pass splanchnic amino acid
utilization and systemicavailability 100
parenteral versus oral amino acidrequirements 103, 104
reduced enteral protein intakeeffects on systemic amino acidavailability 100–102
tracers 100Anthropometry, body composition
assessment 66, 67�1-Antitrypsin, milk functions 216Appetite, see Food intake regulation
Basal metabolic rate (BMR),measurement 20
Bioelectric impedance analysis (BIA),body composition assessment 67, 68
Blood urea nitrogen (BUN), proteinintake relationship 59, 60
Body compositionbreast-fed versus formula-fed infants
58, 76, 77evaluation
direct measurements 66
225
Subject Index

fat mass determination from leanbody mass 67–70
indirect measurements 66, 67, 76,77
infants 70–75preterm infants 74sex differences 78
Bombesin, food intake regulation 136Breastfeeding
amenorrhea duration 167, 171, 172blood pressure in later life 17energy density of breast milk 36growth in breast-fed versus formula-
fed infantsbirth to 4 months 53, 544 to 12 months 56–58
immune effects 62, 63maternal weight effects 167, 168premature birth milk composition
217protection against later obesity, see
also Metabolic programmingevidence 5–7mechanisms 7–10
protein content versus cow’s milk191, 192
protein intake 121recombinant proteins, see
Recombinant human milk proteinsrecommendations 147, 161, 162total energy expenditure effects 34,
35volume change over time 173weaning, see Complementary food
Calcium, metabolism in adipose tissue144
Cancer, early high-protein intake risks131
Caseinoglycomacropeptidefood intake regulation 139sweet whey fraction 193, 194
Celiac disease, breastfeeding protection171
Cholecystokinin (CCK), food intakeregulation 136, 139
Community therapeutic care (CTC),energy-protein malnutritionmanagement 182
Complementary foodage for introduction
behavioral development studies166
food acceptance 167infant growth studies 163, 164infection morbidity studies 166iron and zinc status considerations
164–166, 170, 174, 175recommendations 161–163,
172–174cereals 224definition 161protein:energy ratio
calculation 148, 149developing countries and
malnutrition 150, 151, 156, 158obesity relationship with high
values 151–153, 157rationale for study 148–150recommendations 154, 158variability 149
weaning 147, 161Computed tomography (CT), body
composition assessment 68Cow’s milk formula
historical perspective 189, 190protein content
human milk comparison 191, 192modified sweet whey studies
193–195prospects for improvement
198–200standards 190tryptophan sources 191, 193, 203
reduced protein formula advantagesover classic formuladehydration and kidney function
196growth velocity and adiposity
196–198, 204transforming growth factor-� content
199Crohn’s disease, transforming growth
factor-� containing casein benefits informula 199
Cystic fibrosis, infant diet 156, 157
Diarrheaintestinal amino acid metabolism 107rehydration therapy, see Rehydration
therapyDietary reference intake (DRI)
adequacy criteria 84, 85bioavailability considerations 91, 92
Subject Index
226
Body composition (continued)evaluation (continued)

children 88, 89coefficient of variation of
requirements 85conceptual basis 80, 82, 83energy and physical activity 89estimated average requirement 81,
84, 85infants 87, 88macronutrients 87, 93, 94origins 80tolerable upper intake level
barriers to determination 86extrapolation 86, 92, 93risk assessment model application
to macronutrients 87risk assessment steps 86
uses 82, 83Doubly labeled water (DLW), total
energy expenditure measurement 20,21
Dual-energy X-ray absorptiometry(DEXA)body composition assessment 67, 69,
70, 77infants 71, 73–75
Energy-protein malnutritionclinical features 178community therapeutic care 182complementary foods in developing
countries 150, 151, 156, 158environmental factors 178epidemiology 179food evaluation 179, 180ready-to-use therapeutic food 182,
186, 187rehydration therapy 183, 184, 186therapeutic feeding center 181, 187
Energy requirements, see also Totalenergy expenditurechildren and adolescents 25, 27, 29, 31components 20imbalance consequences 21infants 22, 23, 35, 36measurement 20, 21
Enterostatin, food intake regulation 136
F100, energy-protein malnutritionmanagement 181, 182, 185
Ferritin, recombinant protein production209
Food intake regulationdietary components
carbohydrate 139, 145energy 137, 138, 144epigenetic effects in development
140, 141fat 139, 140protein 138, 139
environmental influences 134genetics 134neurocircuitry 134, 135obese versus normal children
144short-term intake regulation
overview 135, 136postabsorptive signals 137preabsorptive signals 136
Formula, see Cow’s milk formula
Gastrin-releasing peptide, food intakeregulation 136
Ghrelin, food intake regulation 136Glucagon, food intake regulation
136Glucagon-like peptides (GLPs), food
intake regulation 136, 139Glucose tolerance, early diet effects
129, 130Glycemic index, carbohydrate intake
considerations 94Growth, breast-fed versus formula-fed
infantsbody composition effects 58head circumference 62, 63plasma levels
amino acids 55, 56insulin 55, 56insulin-like growth factor-1 55, 56,
60–62premature infants 62time periods
birth to 4 months 53, 544 to 12 months 56–58
Guanosine monophosphate (GMP)cyclic GMP in human milk 204,
205milk postprandial response 143
Head circumference, breast-fed versusformula-fed infants 62, 63, 170
Heart rate, total energy expendituremeasurement 20, 21
Immunoglobulin A (IgA), breast milkcomposition 217
Subject Index
227

Insulinbreast-fed versus formula-fed infants
55, 56, 198high-protein diet response 9, 125
Insulin-like growth factor-1 (IGF-1)breast-fed versus formula-fed infants
55, 56, 60–62, 197, 198high-protein diet response 9, 125,
126, 130, 153, 158, 159Intestine
fat oxidation 105, 106immune function 96mucin synthesis 106necrotizing enterocolitis 105, 107peptide effects on amino acid
absorption 106piglet studies
amino acid utilization and systemicavailability 98, 99
energy sources 97, 98infant model 96intestinal energy expenditure 97overview 96, 97
preterm infant studiesfirst-pass splanchnic amino acid
utilization and systemicavailability 100
parenteral versus oral amino acidrequirements 103, 104
reduced enteral protein intakeeffects on systemic amino acidavailability 100–102
tracers 100Iron status, complementary food
considerations 164–166, 170, 174, 175
Kidneyadaptation to high-protein intake 130,
131formula effects 196
�-Lactalbumin, tryptophan content andcow’s milk formula supplementation191, 193
Lactation, see BreastfeedingLactoferrin
biological activity assays 210, 211recombinant protein production 209,
210Leptin, food intake regulation 136Lysozyme
biological activity assays 212
recombinant protein production 209,210
Magnetic resonance imaging (MRI),body composition assessment 68
Malnutrition, see Energy-proteinmalnutrition
Metabolic programmingage interval for later effects 15, 16, 18complementary food protein:energy
ratioobesity relationship with high
values 151–153, 157rationale for study 148–150
EARNEST international researchcluster 3, 11
first-week weight gain 14, 15high-protein intake effects 127obesity risks
breastfeeding protectionevidence 5–7mechanisms 7–10
costs 3early-growth association 3–5European Childhood Obesity
Project 10, 11overview 1, 2, 51, 52reversal paradox 2study design 16, 17
Necrotizing enterocolitis, amino acidstudies 105, 107
Neuromedin B, food intake regulation136
Nitrogen balance, protein requirementmeasurement 40–42, 48
Obesity, see also Metabolicprogrammingbreastfeeding and maternal weight
effects 167, 168food intake regulation in children 144
Oral rehydration solutions, seeRehydration therapy
Oxytocin, breastfeeding response 8
Peptide YY, food intake regulation 136Preterm infant
amino acid metabolismfirst-pass splanchnic amino acid
utilization and systemicavailability 100
Subject Index
228

parenteral versus oral amino acidrequirements 103, 104
reduced enteral protein intakeeffects on systemic amino acidavailability 100–102
requirements 118tracers 100
body composition 74breast milk composition 217
Protein-energy malnutrition, seeEnergy-protein malnutrition
Protein:energy ratio (PER)complementary food
calculation 148, 149developing countries and
malnutrition 150, 151, 156, 158obesity relationship with high
values 151–153, 157rationale for study 148–150recommendations 154, 158variability 149
human milk versus formula 37, 200Protein requirements
blood urea nitrogen 59, 60cow’s milk formula, see Cow’s milk
formuladefinitions 40formula content calculation 122, 123,
131growth response 124, 125, 131measurement
children and adolescents 44–46infants 44, 48, 122, 123nitrogen balance 40–42, 48statistical analysis 40, 47–49
metabolic consequences of differentintakes 123–127, 129
protein deposition rates 42–44, 49, 50renal adaptation to high-protein
intake 130, 131total body potassium relationship with
total body protein 48, 49
Ready-to-use therapeutic food (RUTF),energy-protein malnutritionmanagement 182, 186, 187, 223
Recombinant human milk proteinsbiological activity 210–212clinical trials 213, 214digestion 212, 213expression systems
mammalian cells 215
microorganisms 208plants 209, 210rice 210, 214transgenic dairy animals 208, 209
rationale for production 207, 208safety studies 213, 216stability 212
Recommended Dietary Allowance(RDA)origin and definition 79, 80uses 80, 81
Rehydration therapymalnourished children 183, 184oral rehydration solutions
amino acid utilization 106, 107probiotics 186sodium composition 130
Sodiumhypernatremic dehydration and
formula composition 130oral rehydration solution composition
130Somatostatin, food intake regulation 136
Therapeutic feeding center (TFC),energy-protein malnutritionmanagement 181, 187
Thermal effect of feeding (TEF),components 20
Tolerable upper intake levelbarriers to determination 86extrapolation 86, 92, 93risk assessment model application to
macronutrients 87risk assessment steps 86
Total body electrical conductivity(TOBEC)body composition assessment 67, 68infants 71, 75
Total body potassium, total body proteinrelationship 49
Total energy expenditure (TEE)balancing 19children and adolescents
growth costs 26, 27physical activity level 27, 36prediction 25, 26public health implications 33, 34
infantsbreastfeeding versus formula
feeding 34, 35
Subject Index
229

growth costs 22physical activity level 22, 23prediction 22
measurement 20, 21Transforming growth factor-� (TGF-�),
cow’s milk content 199
Tryptophanbehavioral effects 205cow’s milk formula 191, 193, 203, 223
Vitamin D, supplementation in breast-fed infants 172
Zinc status, complementary foodconsiderations 164–166, 174
Subject Index
230
Total energy expenditure (TEE)(continued)infants (continued)