protein homology analysis for function prediction with
TRANSCRIPT

Protein Homology Analysis for Function Prediction with Parallel Sub-Graph
Isomorphism
Alper Küçükural1,2, Andras Szilagyi1, O. Uğur Sezerman2, Yang Zhang1*
1Center for Bioinformatics and Department of Molecular Bioscience,
University of Kansas, Lawrence, KS, 66047 USA 2Faculty of Engineering and Natural Sciences, Sabanci University,
Orhanli, Tuzla, Istanbul, Turkey
*Correspondence should be addressed to [email protected]
ABSTRACT To annotate the biological function of a protein molecule, it is essential to have information on its 3D structure. Many successful methods for function prediction are based on determining structurally conserved regions because the functional residues are proved to be more conservative than others in protein evolution. Since the 3D conformation of a protein can be represented by a contact map graph, graph matching algorithms are often employed to identify the conserved residues in weakly homologous protein pairs. However, the general graph matching algorithm is computationally expensive because graph similarity searching is essentially a NP-hard problem. Parallel implementations of the graph matching are often exploited to speed up the process. In this chapter, we review theoretical and computational approaches of graph theory and the recently developed graph matching algorithms for protein function prediction. INTRODUCTION Computational assignment of protein function from the 3D protein structure is one of the important open problems in structural proteomics. Currently, many proteins deposited in the Protein Data Bank (PDB) have limited or no biological function annotation. Protein functions are usually derived from evolutionarily related proteins. Evolutionary association can be determined

2
from sequence and structural similarities. The methods using sequence information are based on the detection of functional motifs (Huang and Brutlag, 2001; Hulo, et al., 2006; Stark and Russell, 2003), global sequence similarity search (Conesa, et al., 2005; Hawkins, et al., 2006; Martin, et al., 2004), determination of similar loci (Hawkins, et al., 2006), and similarities in phylogeny (Engelhardt, et al., 2005; Storm and Sonnhammer, 2002). However, only around 30% of the protein pairs with less than 50% sequence identity have a similar function. Therefore, sequence similarity itself is not sufficient to develop a robust function prediction (Rost, 2002). In addition, several studies indicate that the inclusion of structural information increases the accuracy of predictions (Devos and Valencia, 2000; Thornton, et al., 2000; Wilson, et al., 2000), because structural features are usually more conserved than sequence.
Similarities between protein structures can be identified by structural alignment methods such as DALI (Holm, et al., 2008), CE (Shindyalov and Bourne, 1998), and TM-align (Zhang and Skolnick, 2005). Several function prediction methods employ structural alignment programs to identify the structurally closest proteins and transfer the functional annotation to the target protein. However, the correlation between function and overall protein fold is weak (Martin, et al., 1998). This can in part be explained by the fact that global structural alignment methods do not always capture locally conserved regions, and the biochemical function of a protein is usually determined by the local structure of a few active residues. Therefore, algorithms that aim to extract local structural information should achieve more robust function prediction (Laskowski, et al., 2005; Weinhold, et al., 2008).
The structures and sequences of remotely homologous protein pairs may have diverged during evolution while local structures involved in protein function may have been preserved. The aim of searching for local structural similarities is to detect these preserved, functionally important structural patterns. To discover local structural motifs, the following methods have been described in the literature. In a method based on 3D templates (Laskowski, et al., 2005), the specific 3D conformations of sets of 2-5 residues were extracted from the structures of functionally significant units. This template set was manually compiled to include four types of templates: the enzyme active site, ligand-binding residues, DNA-binding residues, and reverse templates. Given a target protein, the template set is searched for structures locally matching some part of the target protein, within spheres of a 10 Å radius. The matches are ranked using the SiteSeer scoring function. The degree of overlap between target and template residues is calculated, and the
3
algorithm maximizes the sum of the overlap scores of the matched residues in all possible configurations. The method was tested on various distantly related protein pairs with widely divergent sequences. Significant functional matches were found, e.g. two TIM-barrel proteins with very low sequence identity were found to have a high SiteSeer score, and their functional sites were correctly matched. Moreover, some of the predictions for newly released structures with unknown function have later been experimentally verified. In another study, the combination of sequence and structural features were employed to identify functional similarities, based on the assumption that the preserved amino acids at key sites in similar local structures hint at a functional similarity as well (Friedberg, 2006).
Conserved local regions may contain residues that are not adjacent in sequence. Structurally adjacent residues, however, are preserved in most cases. These structurally conserved patterns have been explored by various tools such as JESS (Barker and Thornton, 2003), PINTS (Stark and Russell, 2003), PDBSiteScan (Ivanisenko, et al., 2004), and PAR-3D (Goyal, et al., 2007). Local structural similarities can be detected with search algorithms based on contact map networks. The algorithms can be described in terms of three major characteristics: representation, scoring, and searching. The contact maps are searched for similar regions with graph matching algorithms. However, the possible mutations, insertions and deletions in the protein structures yield very different contact maps. To discover similarities in the presence of such conformational differences, inexact sub-graph matching algorithms are necessary. Because the problem is NP-hard, parallel computing implementations are often used to speed up the process.
In this chapter, we will review the current status in the field of local structure based function annotation. The topics include contact maps for representation, distance functions with graph theoretical properties for scoring, and parallel inexact sub-graph matching algorithms for local structural similarity search. REPRESENTATION SCHEME There are a number of different ways to represent 3D protein structures as a linear string as a simplification. Pattern search and motif discovery algorithms that use sequential information are then utilized with this representation scheme (Barker and Thornton, 2003; Lo, et al., 2007; Matsuda, et al., 1997). Contact maps constitute a different type of representation method, and can

4
incorporate more information than linear strings. They are extracted from the PDB files using the coordinates of alpha carbon atoms. Graph Representations of Protein Structure Protein structures can be converted into a graph where the nodes represent the Cα atoms and the links represent interactions (or contacts) between the corresponding residues (Albert and Barabási, 2002; Strogatz, 2001).
The two most commonly used graph representations of protein structures are contact maps and the Delaunay tessellated graphs (Atilgan, et al., 2004; Taylor and Vaisman, 2006). Both types of graphs can be described as an N×N matrix S for a protein with N residues. The definition of a contact differs between the two types. In a contact map, if the distance between Cα atoms of two residues is smaller than a certain cut-off, they are considered to be in contact (Atilgan, et al., 2004).
Delaunay tessellated graphs consist of points connected by edges defined in a special way. A point corresponds to an atom for each residue in the protein. For example, α carbon, β carbon, or the center of mass of the side chain can be used to represent each residue. There is a certain way to connect these points by edges so as to have the Delaunay simplices which form non-overlapping tetrahedra (Taylor and Vaisman, 2006). A Delaunay tessellated graph contains the neighborhood (contact) information of the residues represented by its vertices (Barber, et al., 1996).
Contact maps have been widely used as a representation method of protein structures in the literature (Fariselli and Casadio, 1999; Gupta, et al., 2005; Huan, et al., 2004; Vassura, et al., 2008; Vendruscolo, et al., 2002). This is a convenient way to capture the actual neighborhood information of each residue because the contacting residues are determined on the basis of a distance cut-off. An example of the contact map extraction is illustrated in Figure 1. In the Delaunay tessellation, the neighbors of a residue are defined by the Delaunay tetrahedra. However, these neighbors may be quite far away especially if the residue is on the surface. Using the Delaunay tessellated graphs to represent protein structures does not offer definite advantages compared to contact maps (Huan, et al., 2004; Küçükural, et al., 2008).
In many studies, small molecules (ligands) that bind to the proteins are also represented by graphs. This representation serves as a basis for the construction of a metric for the classification of these small molecules, and is a popular area in chemoinformatics, with many challenges (Schietgat, et al., 2008). This classification can help reduce the time to find ligands similar to a

5
given ligand in chemical compound databases, e.g. the Chemical Abstract Service Registry containing 40 million compounds. The graph representations of ligand molecules and proteins differ from each other in how the vertices and edges are defined. In the graph representation of the 3D structure of a protein, vertices represent Cα atoms and edges are defined between neighboring Cα atoms (i.e. those close to each other in space) (Fariselli and Casadio, 1999), whereas in the graph representation of a small molecule, all the atoms are represented by vertices, and chemical bonds between the atoms define the edges (Schietgat, et al., 2008). Here, we only use graphs to represent proteins and their binding sites; we do not use the ligand molecules themselves for our purposes. Our goal is to identify binding sites based on the detection of similar and conserved regions in proteins that are weakly homologous to each other.
Figure 1. a) An illustration of contact map extraction from a protein structure. The distance between residue 18 (methionine) and residue 15 (asparagine) is 5.5 Å. b) If the distance between two residues is below a certain cut-off, the residue pair is represented by a value 1 in the 2D contact map matrix (1s are shown here as grey dots). The elements of the matrix are indexed by the residue numbers of the protein. SCORING FUNCTION WITH NETWORK PROPERTIES Defining a suitable scoring function and tuning its parameters are vital to the success of sub-graph matching algorithms. The graph representation of the proteins also provides some features that can be used in matching operations. These properties include intrinsic information about the contribution of each

6
residue to the stability or the function of the protein. Structurally similar parts in two proteins can be found using a target function based on network properties. Graph Theoretical (Network) Properties A variety of graph theoretical properties are defined in the literature. This chapter presents nine of them. The first property, defined for each vertex of the graph, is the degree (k), which is the number of edges incident to the vertex, i.e. for a graph describing a protein, the number of neighbors of each residue (Taylor and Vaisman, 2006). The next measure is the number of second neighbors, k2, which is a measure of the compactness of the graph. Even though k2 is highly correlated to the degree k, it still provides additional information. For example, if the structure is a single globular unit rather than a number of distinct, small domains, most residues will have a high k2 value (Küçükural, et al., 2008). The third network property is the clustering coefficient, also known as cliquishness, which measures how well the neighbors of a node are connected to each other. The clustering coefficient for each node is calculated as
)1(2
−=
kkEC n
n (1)
where En is the number of edges connecting the neighbors of the residue n, and k is its degree (Taylor and Vaisman, 2006; Vendruscolo, et al., 2002).
The characteristic path length L of the network, i.e. the average of the minimum paths between all node pairs, is also one of the most commonly used network properties (Bagler and Sinha, 2005; Taylor and Vaisman, 2006). Globular proteins yield smaller L values, whereas fibrous proteins yield larger ones. The characteristic path length Ln for residue n is calculated by the average of the shortest paths from the residue to all the other residues given as in (2);
∑=−
=N
jnjn N
L1)1(
1 σ
(2) where σnj is the shortest path length between nodes n and j, and N is the number of residues (Taylor and Vaisman, 2006). The only difference between L and the weighted characteristic path length wL is that weighted edges are used in the calculation of the latter. Contact potentials can be used to assign a weight for each contact (Liang and Dill, 2001; Miyazawa and Jernigan, 1996).

7
Several more graph theoretical properties can be calculated. The centrality of a node can be described by various measures. Many different centrality measures have been defined in the literature; here we present four of them. Firstly, betweenness measures to what extent a node i lies in between other nodes (Freeman, 1977):
∑∈≠≠
=N
Vtis st
stB
iiCσ
σ )()( (3)
where σst is the number of shortest paths between nodes s and t, and σst(i) is the number of shortest paths between nodes s and t that pass through the node i (V denotes the set of all nodes).
The stress centrality measures the total number of shortest paths that pass through a node i (Shimbel, 1953):
∑∈≠≠
=N
VtisstS iiC )()( σ (4)
The closeness centrality is defined as a measure that shows how long the information takes to spread from a given node to other reachable nodes (Sabidussi, 1966):
∑∈
=
VtG
C tidiC
),(1)( (5)
where dG (i, t) is the length of the shortest path from node i to node t. Lastly, graph centrality measures the length of the shortest path to reach
the node farthest away from the given node (Hage and Harary, 1995):
),(max1)(
tidiC
GVt
G
∈
= (6)
Centrality measures aim to quantify the “importance” of the individual nodes in the network (Brandes, 2001; Newman, 2003). If a node is central to a network representing a protein structure, this node may have an important role in the stability of the protein or in the transduction of signals from one part of the structure to another. A summary of the graph theoretical properties is given in Table 1.
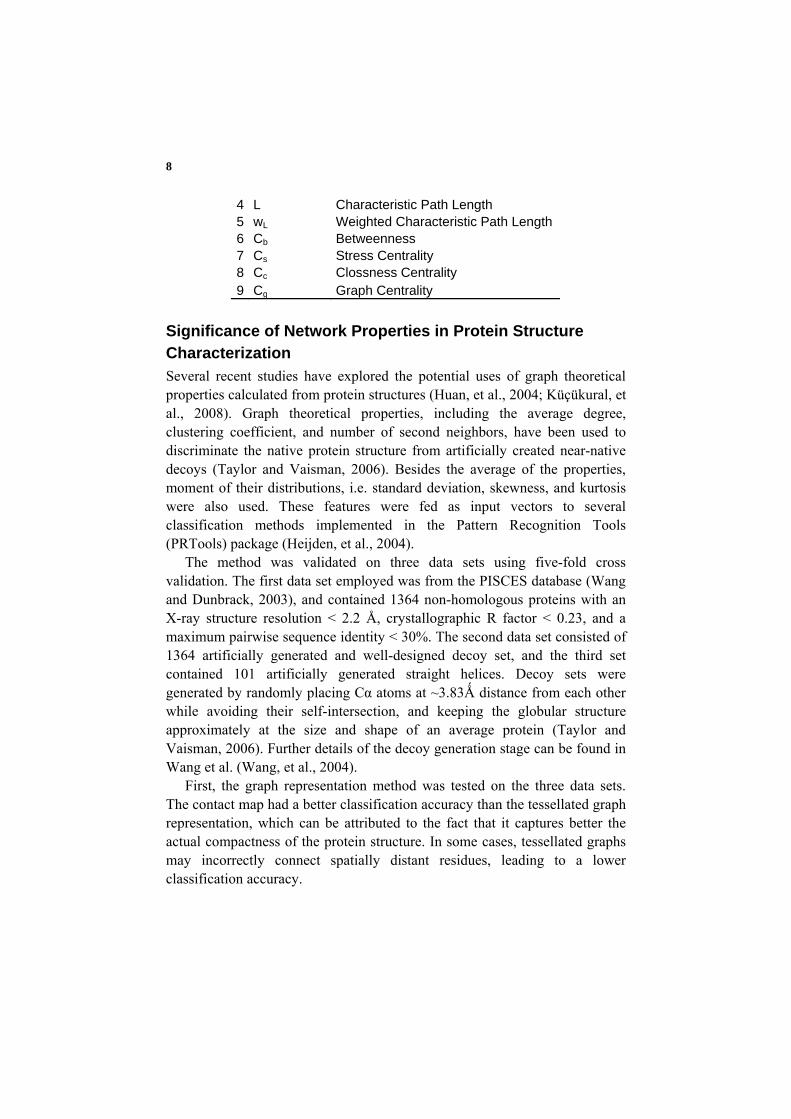
Table 1.Summary of the graph theoretical properties. # Abreviation Graph Theoretical Property 1 k Degree 2 k2 Second Neighbors 3 C Clustering Coefficient
8
4 L Characteristic Path Length 5 wL Weighted Characteristic Path Length 6 Cb Betweenness 7 Cs Stress Centrality 8 Cc Clossness Centrality 9 Cg Graph Centrality
Significance of Network Properties in Protein Structure Characterization Several recent studies have explored the potential uses of graph theoretical properties calculated from protein structures (Huan, et al., 2004; Küçükural, et al., 2008). Graph theoretical properties, including the average degree, clustering coefficient, and number of second neighbors, have been used to discriminate the native protein structure from artificially created near-native decoys (Taylor and Vaisman, 2006). Besides the average of the properties, moment of their distributions, i.e. standard deviation, skewness, and kurtosis were also used. These features were fed as input vectors to several classification methods implemented in the Pattern Recognition Tools (PRTools) package (Heijden, et al., 2004).
The method was validated on three data sets using five-fold cross validation. The first data set employed was from the PISCES database (Wang and Dunbrack, 2003), and contained 1364 non-homologous proteins with an X-ray structure resolution < 2.2 Å, crystallographic R factor < 0.23, and a maximum pairwise sequence identity < 30%. The second data set consisted of 1364 artificially generated and well-designed decoy set, and the third set contained 101 artificially generated straight helices. Decoy sets were generated by randomly placing Cα atoms at ~3.83Ǻ distance from each other while avoiding their self-intersection, and keeping the globular structure approximately at the size and shape of an average protein (Taylor and Vaisman, 2006). Further details of the decoy generation stage can be found in Wang et al. (Wang, et al., 2004).
First, the graph representation method was tested on the three data sets. The contact map had a better classification accuracy than the tessellated graph representation, which can be attributed to the fact that it captures better the actual compactness of the protein structure. In some cases, tessellated graphs may incorrectly connect spatially distant residues, leading to a lower classification accuracy.
9
Second, the discriminatory power of graph theoretical properties was evaluated. When degree, clustering coefficient, number of second neighbors, and contact potential score were used together, the classification accuracy was 99%. Even without the contact potential score, the method had a 98.13% prediction accuracy after the exclusion of outliers.
The degree (k) had the highest discriminatory power; using only the degree distribution, we could distinguish the native and non-native structures with an accuracy of 96.74%. Addition of the number of second neighbors did not improve the accuracy much (96.93%). Cliquishness (C) along with degree (k) yielded a classification accuracy of 98.72% (Küçükural, et al., 2008).
The intrinsic power of graph theoretical properties to distinguish between native and non-native proteins is also exploited in another application: to align protein structures using dynamic programming. The idea behind the approach is that similar structures yield similar contact maps and other network properties derived from contact maps. This similarity is used for the alignment of protein structures (Küçükural and Sezerman, 2009).
Scoring Function For the problem of inexact sub-graph matching, a suitable scoring function is needed. The scoring function measures the distance or the similarity of nodes, and transforms the problem of inexact sub-graph matching into an optimization problem.
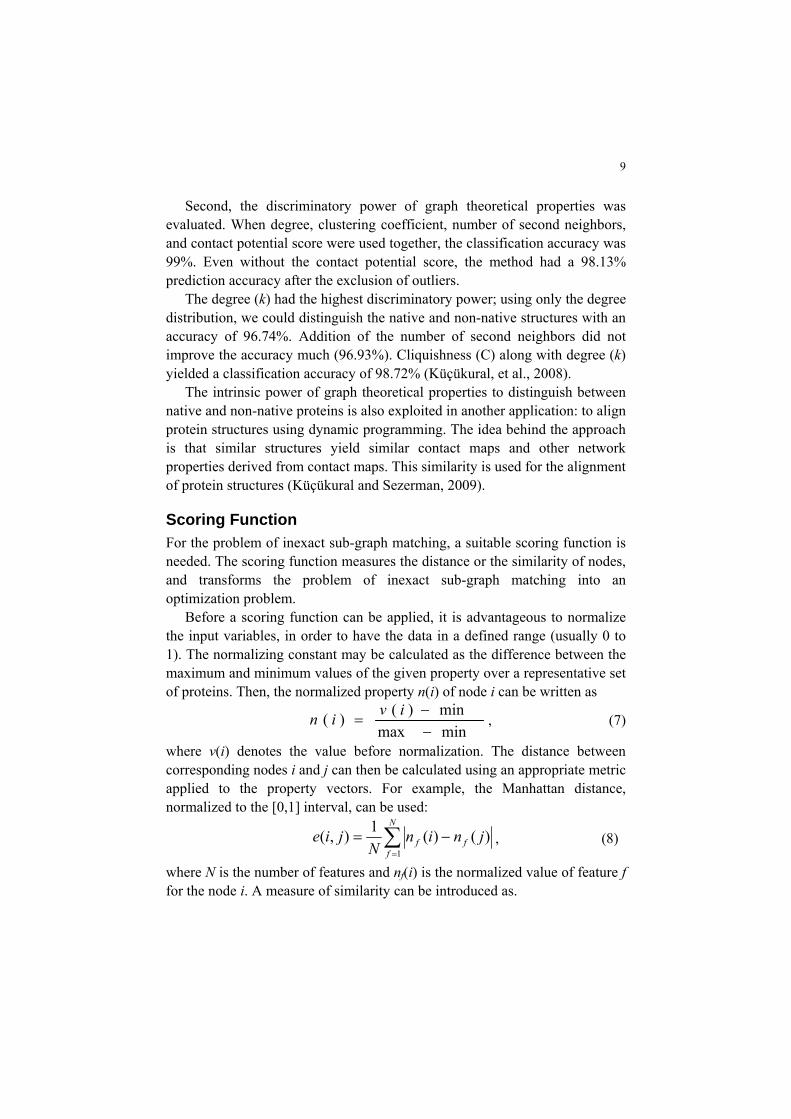
Before a scoring function can be applied, it is advantageous to normalize the input variables, in order to have the data in a defined range (usually 0 to 1). The normalizing constant may be calculated as the difference between the maximum and minimum values of the given property over a representative set of proteins. Then, the normalized property n(i) of node i can be written as
minmaxmin)()(
−−
=ivin , (7)
where v(i) denotes the value before normalization. The distance between corresponding nodes i and j can then be calculated using an appropriate metric applied to the property vectors. For example, the Manhattan distance, normalized to the [0,1] interval, can be used:
∑=
−=N
fff jnin
Njie
1)()(1),( , (8)
where N is the number of features and nf(i) is the normalized value of feature f for the node i. A measure of similarity can be introduced as.

10
),(1),( jiejim −= , (9)
Matching nodes can then be identified based on a cut-off value applied on the distance or the similarity. Figure 2 shows an illustrative example of sub-graphs in two proteins, with a pair of matching nodes. The nodes n1 and n2 are very similar to each other by their network properties, which are reflected by their high similarity score.
Figure 2. Contact maps of two proteins and network property vectors for two matching nodes (n1, n2). SEARCH ALGORITHM Several methods can be designed for local structural similarity search by adapting one of the known computational search algorithms. Graph matching (Kreher and Stinson, 1998) and parallel graph matching algorithms (Marek and Wojciech, 1998) are the preferred search methods when the structures are represented by graphs. Attributed Relational Graphs (ARG) and Graph Matching An attributed relational graph (ARG) G = (V, E, A) is composed of a set of vertices (nodes) V = {v1, v2, …, vn}, a set of edges E = {e1, e2, …, em}, and a set of attributes A = {a1, a2,…,an} that contain additional information on the nodes and/or the edges. Thus, an ARG contains both syntactic and semantic information: Syntactic information specifies the topological properties of the graph (nodes and edges), while semantic information is contained by attributes assigned to each node in the graph (Cordella, et al., 1998). For protein contact maps, the nodes represent residues and edges represent the
n1(5, 0.4, ... )
n2(5, 0.33, ... )
Protein B
Protein A

11
neighborhood information on the residues. The attributes can be any additional properties calculated for the residues.
Two varieties of the graph matching problem exist depending on whether errors are allowed: exact and inexact graph matching. Exact matching is equivalent to identifying isomorphous graphs. The exact matching of the two graphs G1 = {V1, E1, A1} and G2 = {V2, E2, A2} yields a mapping between the nodes of G1 and the nodes of G2 such as
2121 )),((),(:: EvvfEvvVVf jiji ∈∃∈∀→ (10)
The mapping f yields a set of matched pairs (vi, vj) where vi is from V1 and vj from V2 (Cordella, et al., 1998).
Matching whole graphs is rarely needed in real-world problems. The sizes of the graphs to be matched are often different, and isomorphous subgraphs are sought. Graph Matching Algorithms Since graph matching algorithms are computationally expensive, developing more efficient graph matching algorithms is an open and challenging area. The aim is to reduce memory consumption and processing time. Obviously, the brute-force method is very slow and inefficient. In 1974, Ullmann proposed an algorithm based on elimination of successor nodes in tree search (Ullmann, 1976). Today, the most useful and effective algorithms are VF algorithms (named after the inventors of the original algorithm, M. Vento and P. Foggia), in terms of both time requirement and memory consumption. There are various types of exact matching algorithms depending on whether the goal is to find a monomorphism, an isomorphism or a graph-subgraph isomorphism (Cordella, et al., 1999; Cordella, et al., 2001). The VF algorithm was compared with Ullmann’s algorithm in a study by Cordella et al. The running time of Ullmann’s algorithm is Θ(N3) in the best case, where N denotes the size of the graph, while that of the VF algorithm is Θ(N2). In the worst case, the running time of Ullmann’s algorithm is Θ(N!N3), and that of the VF algorithm is Θ(N!N). The memory consumption of the two methods also differs: the memory needed by the VF algorithm is uniformly Θ(N2), while Ullmann’s algorithm needs Θ(N3) (Cordella, et al., 1999). The VF algorithm was improved by Cordella et al., resulting in VF2, which has a reduced memory usage can handle large graphs more efficiently (Cordella, et al., 2001).

12
Figure 2. Pseudo-code of the beam search algorithm.
For large systems, beam search algorithms are preferred, due to their low memory consumption. Beam search is an iterative, heuristic search algorithm that keeps the N best solutions in each iteration, and discards the rest of the matches ranked by a predefined scoring function (Yuehua and Alan, 2007). The algorithm uses two lists, named parentLists and childLists. The solutions obtained in the previous iteration are kept in parentLists, and the possible matches at the current iteration are held in childLists. After pruning and constraint checks specific to the matching operation, approved matches in the childLists are transferred into parentLists. The matching operation starts with a node that is chosen from heavily connected nodes and walks on neighboring nodes that are ranked by their degrees. The pseudo-code of the beam search algorithm is shown in Figure 2.
Numerous graph matching algorithms have been produced in the last three decades. Some of these algorithms are capable of reducing computational complexity and memory by using constraints and restrictions (Yuehua and Alan, 2007). When the task is to match a sample graph against a large set of prototypes, computationally efficient algorithms have an increasing memory consumption (Cordella, et al., 2001). For that reason, scientists have
Select the most heavily connected node to start with while there are more heavily connected nodes in G1
if it is a new inital node for all the comparable nodes
find a matching pair for each match in the parentList if the matching pair is not already included newSolutionSet = new matching pair insertChildList(newSolutionSet) else
for all the solutionSets in the parentList if the solutionSet contains any neighbors of currentNode
Locate the neighbor and its match pair for all the neighbors of the match pair in G2
compare neighbor with currentNode if matches solutionSet = solutionSet + new pair insertChildList(solutionSet) for all solutionSets in childList rank solutionSets prune according to scoring function and check constraints add the solutions in the childList to parentList

13
attempted to solve this problem by using parallelizable algorithms such as divide and conquer (Marek and Wojciech, 1998). Parallel Graph Matching Algorithms Biological systems can often be described by extremely large graphs. Parallel graph matching algorithms reduce processing time by performing a parallel search on graph trees. Sheng et al. (Sheng, et al., 2003) developed an algorithm for parallel computers, especially those with distributed memory. The implementation uses an asynchronous parallel algorithm, and the processing time was found to be inversely proportional to the number of processors. The main algorithm consists of three steps. In the first step, the master processor broadcasts the two graphs to be matched to all other processors. In the second step, each processor starts to search for matches between subgraphs assigned to it. If any of the processors finds isomorphous subgraphs, it informs the other processors of the match. In the third step, when all the processors have completed their jobs, the search operation for the original graphs can be completed.
Subgraph isomorphism is defined as an exact match between a subgraph from the first graph and a subgraph from the second graph. However, in real-world applications, we are often interested in subgraphs that are similar but not necessarily isomorphous. For example, homologous proteins have the same overall structure but mutations, insertions and deletions result in small differences between the conformations. To find such similarities, graph matching algorithms allowing for errors, i.e. inexact subgraph matching algorithms are needed (Küçükural and Sezerman, 2009). A Parallel Inexact Graph Matching Algorithm The beam search algorithm (Yuehua and Alan, 2007) can be to parallelized and adapted to allow for errors. For each process, the initiation nodes are selected from the most heavily connected nodes in the first graph.
Attributed relational graphs describing proteins can be represented as binding residue matrices (BRM) containing both structural neighborhood information and attributes of residues such as cliquishness, degree, and centrality. These matrices constitute the input to the algorithm.
Master and child processes are designed with different responsibilities. The master process manages the child processes, monitors their states, and sends them the necessary data whenever they need it (Sheng, et al., 2003). The master process itself does not perform any matching operations.

14
Matching is done by the child processes which report their state to the master. Initially, the master process sends the BRM to all child processes, and then each process receives the number of the node with which it should start the matching operation.
Once the initiation nodes have been distributed among child processes, the graph matching operations are run until all the heavily connected nodes have been processed. When the matching operation for a node is finished, the child process sends a signal to the master process to report this event. This process can then accept new initial nodes to start a new matching operation. When all the heavily connected nodes have been processed, the master sends a stop signal to the child processes to close their connections. Each child process employs a beam search algorithm for matching (see Figure 2). To reduce the computation time, problem-specific constraints are used (Küçükural and Sezerman, 2009). Problem Specific Constraints Graph matching operations are generally very complex, and their computation time scales at least as Θ(N2) (Cordella, et al., 1999). Therefore, some constraints are used to reduce computational complexity.
One of the most important constraints prunes the childList. For example, a child list is not allowed to contain more than ten matches. Each residue has at most 15 neighbors for an average protein. When a match between two nodes is found, their neighbors are examined for potential new matches. However, constraints derived from the parent match are applied. For example, let Xi be a residue number from the first protein and Yj a residue number from the second protein, and let us suppose that a match has been found between Xi and Yj. Then new potential match such as between Xi+1 and Yj+1 will have the first match as parent. The following constraint can be introduced for the residue numbers of the parent and child matches:
11 ++ ≥⇒≥ jiji YXYX (11) For a child match, this constraint has to be met for each parent match leading up to the child, in order to prevent “cross matches”.
Another constraint, designed to speed up the algorithm is not to examine matches had been already found by other processes (otherwise, because the algorithm walks the graph following the edges, the same pair of residues could be repeatedly examined for a potential match) (Küçükural and Sezerman, 2009).

15
Function Prediction Using Sub Graph Matching Algorithms With appropriate search parameters, the graph matching algorithm finds the most similar parts of two graphs rather than trying to match most of the nodes even though the attributes do not show a significant similarity. Therefore, the graph matching algorithm can detect functional similarity in cases when the global alignment algorithm fails.
When two proteins are compared, all possible structurally similar regions are generated using the inexact sub-graph matching algorithm, the results are ranked by the scoring function given in (9). When the function of a target protein is to be predicted, the target protein is compared with all the proteins in a database. The function of a protein is then predicted on the basis of the functions of the closest protein structures.
A preliminary test of the methodology was performed on a set of 88 proteins (enzymes) with a pairwise sequence identity <30%. The function of each enzyme is described by its EC number. EC (Enzyme Commission) numbers provide a hierarchical classification of enzymes and have four digits (e.g. EC a.b.c.d) (Moss, 2006). The success of a function prediction is judged by counting common EC number digits. If all four EC digits of the predicted function equal the actual function, the prediction is exact. If the first three digits match, the function is still correctly predicted but the enzyme acts on a different ligand than the one hit by the search procedure. The accuracy of the method was evaluated by counting correct predictions based on matching EC numbers. For each protein in the data set, there was a single other enzyme with the same function. During the test, each protein was used as a target, and the remaining structures were scanned for local structural similarities with the target; the function of the target was predicted based on the best hit. When matching first three digits were required for correct prediction, the accuracy was found to be 61.2%, which increased to 76.43% when the best hit in the top 5 hits was considered. When all four EC digits were required to match, the accuracy was 55.28% with the top hit, and 72.87% with the best hit in the top 5 hits considered.
The scores and the ranking depend on the definition of the scoring function and its parameters; therefore, detailed tuning is necessary to obtain optimum results. CONCLUSION In this chapter, we have reviewed the use of graph theoretical properties and parallel inexact sub-graph matching algorithms for the prediction of protein
16
function based on finding local structural similarities between the target protein and proteins with known function. Structure representation, scoring, and searching are addressed with contact maps, network properties, and inexact sub-graph matching algorithms, respectively. These representations and scoring functions are less dependent on the actual coordinates, and therefore more robust than other methods; they also allow for more flexibility. Other methods are highly dependent on the actual coordinates of the protein, and are therefore dependent on the accuracy of the experimental procedure used to determine the structure.
Graph theoretical attribute sets have been used to find better matches between two graphs. Although nine specific network properties are presented in this chapter, other features can be added, weighted according to their contribution to the similarity. The inclusion of these properties into the scoring function has been shown to significantly improve the discovery of similar regions in proteins. The conserved structural patterns that are most informative for function annotation can be extracted using this approach. Moreover, since the matching procedure is based on the preservation of contacts, one can determine the network of contacts that are crucial for the functionality of the given protein. This is the type of information that the experimentalist would be interested in. The conserved network of contacts within a family can be detected via this method, and the functional importance of each contact can then be verified by experiment.
One potential application of this method is to determine the conserved contact networks and the key residues in potential drug targets. This information may be helpful for the design of drug molecules targeting the key residues, which could be a new strategy of drug development. Future development may include adding various amino acid properties, side chain information, exposed surface areas and other features to the scoring function in order to find even better matches between regions. In addition, fuzzy contact maps and more versatile contact definitions may be introduced, allowing for a higher structural flexibility in the represented proteins. ACKNOWLEDGEMENT The work has been performed under the project HPC-Europa (RII3-CT-2003-506079), with the support of the European Community - Research Infrastructure Action under the FP6 "Structuring the European Research Area" Programme. It is also supported in part by the Alfred P. Sloan Foundation; NSF Career Award (DBI 0746198); and the National Institute of General Medical Sciences (R01GM083107).

17
REFERENCES Albert, R. and Barabási, A.-L. (2002) Statistical mechanics of complex networks, Reviews of Modern Physics, 74, 47. Atilgan, A.R., Akan, P. and Baysal, C. (2004) Small-World Communication of Residues and Significance for Protein Dynamics, Biophysical Journal, 86, 85-91. Bagler, G. and Sinha, S. (2005) Network properties of protein structures, Physica A: Statistical Mechanics and its Applications, 346, 27-33. Barber, C.B., David, P.D. and Hannu, H. (1996) The quickhull algorithm for convex hulls, ACM Transactions on Mathematical Software, 22, 469-483. Barker, J.A. and Thornton, J.M. (2003) An algorithm for constraint-based structural template matching: application to 3D templates with statistical analysis. 1644-1649. Brandes, U. (2001) A faster algorithm for betweenness centrality, Journal of Mathematical Sociology, 25, 163-177. Conesa, A., Gotz, S., Garcia-Gomez, J.M., Terol, J., Talon, M. and Robles, M. (2005) Blast2GO: a universal tool for annotation, visualization and analysis in functional genomics research, Bioinformatics, 21, 3674-3676. Cordella, L.P., Foggia, P., Sansone, C. and Tortorella, F. (1998) Graph Matching: a Fast Algorithm and its Evaluation. Proc. 14th Int. Conf. On Pattern Recognition. Cordella, L.P., Foggia, P., Sansone, C. and Vento, M. (1999) Performance Evaluation of the VF Graph Matching Algorithm. Proceedings of the 10th International Conference on Image Analysis and Processing. IEEE Computer Society. Cordella, L.P., Foggia, P., Sansone, C. and Vento, M. (2001) An Improved Algorithm for Matching Large Graphs. Proc. of the 3rd IAPR-TC-15 International Workshop on Graph-based Representation. Italy. Devos, D. and Valencia, A. (2000) Practical limits of function prediction, Proteins: Structure, Function, and Bioinformatics, 41, 98-107. Engelhardt, B.E., Jordan, M.I., Muratore, K.E. and Brenner, S.E. (2005) Protein Molecular Function Prediction by Bayesian Phylogenomics, PLoS Computational Biology, 1, e45.

18
Fariselli, P. and Casadio, R. (1999) A neural network based predictor of residue contacts in proteins, Protein Engineering, 12, 15-21. Freeman, L. (1977) A Set of Measures of Centrality Based on Betweenness, Sociometry, 40, 35-41. Friedberg, I. (2006) Automated protein function prediction--the genomic challenge, Briefings in Bioinformatics, 7, 225-242. Goyal, K., Mohanty, D. and Mande, S.C. (2007) PAR-3D: a server to predict protein active site residues. gkm252. Gupta, N., Mangal, N. and Biswas, S. (2005) Evolution and similarity evaluation of protein structures in contact map space, Proteins, 59, 196-204. Hage, P. and Harary, F. (1995) Eccentricity and centrality in networks, Social Networks, 17, 57-63. Hawkins, T., Luban, S. and Kihara, D. (2006) Enhanced automated function prediction using distantly related sequences and contextual association by PFP, Protein Science, 15, 1550–1556. Heijden, F.v.d., Duin, R.P.W., Ridder, D.d. and Tax, D.M.J. (2004) Classification. parameter estimation and state estimation - an engineering approach using Matlab. Holm, L., Kaariainen, S., Rosenstrom, P. and Schenkel, A. (2008) Searching protein structure databases with DaliLite v.3. 2780-2781. Huan, J., Wang, W., Bandyopadhyay, D., Snoeyink, J., Prins, J. and Tropsha, A. (2004) Mining protein family specific residue packing patterns from protein structure graphs. Proceedings of the eighth annual international conference on Resaerch in computational molecular biology. ACM, San Diego, California, USA. Huang, J.Y. and Brutlag, D.L. (2001) The EMOTIF database, Nucleic Acid Research, 29, 202-204. Hulo, N., Bairoch, A., Bulliard, V., Cerutti, L., De Castro, E., Langendijk-Genevaux, P.S., Pagni, M. and Sigrist, C.J.A. (2006) The PROSITE database, Nucleic Acid Research, 34, D227-230. Ivanisenko, V.A., Pintus, S.S., Grigorovich, D.A. and Kolchanov, N.A. (2004) PDBSiteScan: a program for searching for active, binding and posttranslational modification sites in the 3D structures of proteins. W549-554. Kreher, D.L. and Stinson, D.R. (1998) Combinatorial Algorithms: Generation, Enumeration and Search. CRC Press.

19
Küçükural, A. and Sezerman, O.U. (2009) Protein Strcuture Characterization Using Attributed Sub-Graph Matching Algorithms with Parallel Computing, (In preperation). Küçükural, A., Sezerman, O.U. and Ercil, A. (2008) Discrimination of Native Folds Using Network Properties of Protein Structures. In Brazma, A., Miyano, S. and Akutsu, T. (eds), APBC. Imperial College Press, Kyoto, Japan, 59-68. Küçükural, A. and Sezerman, U. (2009) Structural Alignment of Proteins Using Network Properties with Dynamic Programming, (In preperation). Laskowski, R.A., Watson, J.D. and Thornton, J.M. (2005) Protein Function Prediction Using Local 3D Templates, Journal of Molecular Biology, 351, 614-626 Liang, J. and Dill, K.A. (2001) Are Proteins Well-Packed?, Biophysical Journal, 81, 751-766. Lo, W.-C., Huang, P.-J., Chang, C.-H. and Lyu, P.-C. (2007) Protein structural similarity search by Ramachandran codes, BMC Bioinformatics, 8, 307. Marek, K. and Wojciech, R. (1998) Fast parallel algorithms for graph matching problems. Oxford University Press, Inc. Martin, A.C., Orengo, C.A., Hutchinson, E.G., Jones, S., Karmirantzou, M., Laskowski, R.A., Mitchell, J.B., Taroni, C. and Thornton, J.M. (1998) Protein folds and functions Structure, 6, 875-884 Martin, D., Berriman, M. and Barton, G. (2004) GOtcha: a new method for prediction of protein function assessed by the annotation of seven genomes, BMC Bioinformatics, 5, 178. Matsuda, H., Taniguchi, F. and Hashimoto, A. (1997) An approach to detection of protein structural motifs using an encoding scheme of backbone conformations. Proc. of 2nd Pacific Symposium on Biocomputing. 280-291. Miyazawa, S. and Jernigan, R.L. (1996) Residue-residue potentials with a favorable contact pair term and an unfavorable high packing density term. for simulation and threading, J Mol Biol, 256. Moss, G.P. (2006) Recommendations of the Nomenclature Committee, International Union of Biochemistry and Molecular Biology on the Nomenclature and Classification of Enzymes by the Reactions they Catalyse. Newman, M.E.J. (2003) A measure of betweenness centrality based on random walks arXiv.org:cond-mat/0309045.

20
Rost, B. (2002) Enzyme function less conserved than anticipated, Journal of Molecular Biology, 318, 595-608 Sabidussi, G. (1966) The centrality index of a graph, Psychometrika, 31, 581-603. Schietgat, L., Ramon, J., Bruynooghe, M. and Blockeel, H. (2008) An Efficiently Computable Graph-Based Metric for the Classification of Small Molecules. In, Discovery Science. 197-209. Sheng, Y.E., Xicheng, W., Jie, L. and Chunlian, L. (2003) A New Algorithm For Graph Isomorphism And Its Parallel Implementation. International Conference on Parallel Algorithms and Computing Environments ICPACE. Hong Kong, China. Shimbel, A. (1953) Structural parameters of communication networks, Bulletin of Mathematical Biology, 15, 501-507. Shindyalov, I.N. and Bourne, P.E. (1998) Protein structure alignment by incremental combinatorial extension (CE) of the optimal path, Protein Engineering, 11, 739-747. Stark, A. and Russell, R.B. (2003) Annotation in three dimensions. PINTS: Patterns in Non-homologous Tertiary Structures, Nucleic Acid Research, 31, 3341-3344. Storm, C.E.V. and Sonnhammer, E.L.L. (2002) Automated ortholog inference from phylogenetic trees and calculation of orthology reliability, Bioinformatics, 18, 92-99. Strogatz, S.H. (2001) Exploring complex networks, Nature, 410, 268-276. Taylor, T.J. and Vaisman, I.I. (2006) Graph theoretic properties of networks formed by the Delaunay tessellation of protein structures, Physical Review E (Statistical, Nonlinear, and Soft Matter Physics), 73, 041925-041913. Thornton, J.M., Todd, A.E., Milburn, D., Borkakoti, N. and Orengo, C.A. (2000) From structure to function: Approaches and limitations, Nat Struct Mol Biol, 7, 991-994. Ullmann, J.R. (1976) An Algorithm for Subgraph Isomorphism, Journal of the ACM (JACM), 23, 31-42. Vassura, M., Margara, L., Di Lena, P., Medri, F., Fariselli, P. and Casadio, R. (2008) FT-COMAR: fault tolerant three-dimensional structure reconstruction from protein contact maps, Bioinformatics, 24, 1313-1315.
21
Vendruscolo, M., Dokholyan, N.V., Paci, E. and Karplus, M. (2002) Small-world view of the amino acids that play a key role in protein folding, Phys Rev E Stat Nonlin Soft Matter Phys, 65. Wang, G. and Dunbrack, R.L., Jr. (2003) PISCES: a protein sequence culling server, Bioinformatics, 19, 1589-1591. Wang, K., Fain, B., Levitt, M. and Samudrala, R. (2004) Improved protein structure selection using decoy-dependent discriminatory functions, Bioinformatics, 4, 8. Weinhold, N., Sander, O., Domingues, F.S., Lengauer, T. and Sommer, I. (2008) Local Function Conservation in Sequence and Structure Space, PLoS Computational Biology, 4, e1000105. Wilson, C.A., Kreychman, J. and Gerstein, M. (2000) Assessing annotation transfer for genomics: quantifying the relations between protein sequence, structure and function through traditional and probabilistic scores, Journal of Molecular Biology, 297, 233-249. Yuehua, X. and Alan, F. (2007) On learning linear ranking functions for beam search. Proceedings of the 24th international conference on Machine learning. ACM, Corvalis, Oregon. Zhang, Y. and Skolnick, J. (2005) TM-align: a protein structure alignment algorithm based on the TM-score. 2302-2309.