protein & peptide with shodex columns · 2021. 1. 12. · iec qa-825 • weak anion exchange...
TRANSCRIPT

Protein & Peptide with Shodex columns
No.7TECHNICAL NOTEBOOK

Contents
1. Introduction
2. Separation of Proteins and Peptides by HPLC
3. Separation modes
3-1. Size exclusion chromatography
3-1-1. Separation mechanism
3-1-2. Introduction of Shodex columns
• PROTEIN KW-800 series
• KW400 series
3-2. Ion exchange chromatography
3-2-1. Separation mechanism
3-2-2. Introduction of Shodex columns
3-2-2-1. Anion exchange
• Strong anion exchange IEC QA-825
• Weak anion exchange IEC DEAE-825, Asahipak ES-502N 7C
3-2-2-2. Cation exchange
• Strong cation exchange IEC SP-825
• Weak anion exchange IEC CM-825, Asahipak ES-502C 7C
3-2-2-3. Non-porous gel (Fast analysis)
• Anion exchange DEAE3N-4T
• Cation exchange SP-420N
(Appendix) Selection of a suitable buffer
3-3. Reversed phase chromatography
3-3-1. Separation mechanism
3-3-2. Introduction of Shodex columns
• Asahipak ODP, C8P, C4P series
• ODP2 HP series
• RSpak RP18, DS, DE series
3-4. Hydrophobic interaction chromatography
3-4-1. Separation mechanism
3-4-2. Introduction of Shodex columns
• HIC PH-814
3-5. Affinity chromatography
3-5-1. Separation mechanism
3-5-2. Introduction of Shodex columns
• AFpak series
3-6. Multi mode
3-6-1. Separation mechanism
3-6-2. Introduction of Shodex columns
• Asahipak GS series
1
1
3
3
3
3
5
6
7
7
8
10
12
13
14
14
14
18
18
18
20
20
20
28
28
28
1. Introduction
The analysis of proteins and peptides is essential to food science, biomolecular, and pharmaceutical studies. One of the most useful tools for this purpose is HPLC, which relies on wide variety of separation techniques. The main separation modes used for the analysis of proteins by HPLC are: Size exclusion chromatography, Reversed phase chromatography, Ion exchange chromatography, Hydrophobic interaction chromatography and Affinity chromatography. In addition, Multi mode chromatography, which combines Size exclusion and Reversed phase chromatography (or Ion exchange chromatograpgy) can also be used. In this technical notebook, we will first re-view each separation mechanism, and then introduce the corresponding Shodex columns along with relevant ap-plication data.
2. Separation of Protein and Peptide by HPLC
In order to plan the separation and purification of proteins or peptides, it is necessary to study the character of the target substances and select a suitable separation mode. Accordingly to choose a suitable separation mode, one must first consider which of the following case best describes the analytes:
(1) The case where there is large difference of molecular weight between the target substance and the matrix Ô Size exclusion chromatography(2) The case where the difference in isoelectric points between the target substance and the matrix is greater
than 1 Ô Ion exchange chromatography(3) The case where there is the difference in hydrophobicity between the target substance and the matrix Ô Reversed phase chromatography, Hydrophobic interaction chromatography(4) The case where a resin with affinity to the target substance is available Ô Affinity chromatography(5) The pH, salt concentration, and thermostability of the target substance
When analysis is the main purpose, studying points (1) – (4) is enough for the selection of a suitable separation mode. If purification is the main purpose, studying aspect (5) is also necessary in order to prevent protein denatu-ration.
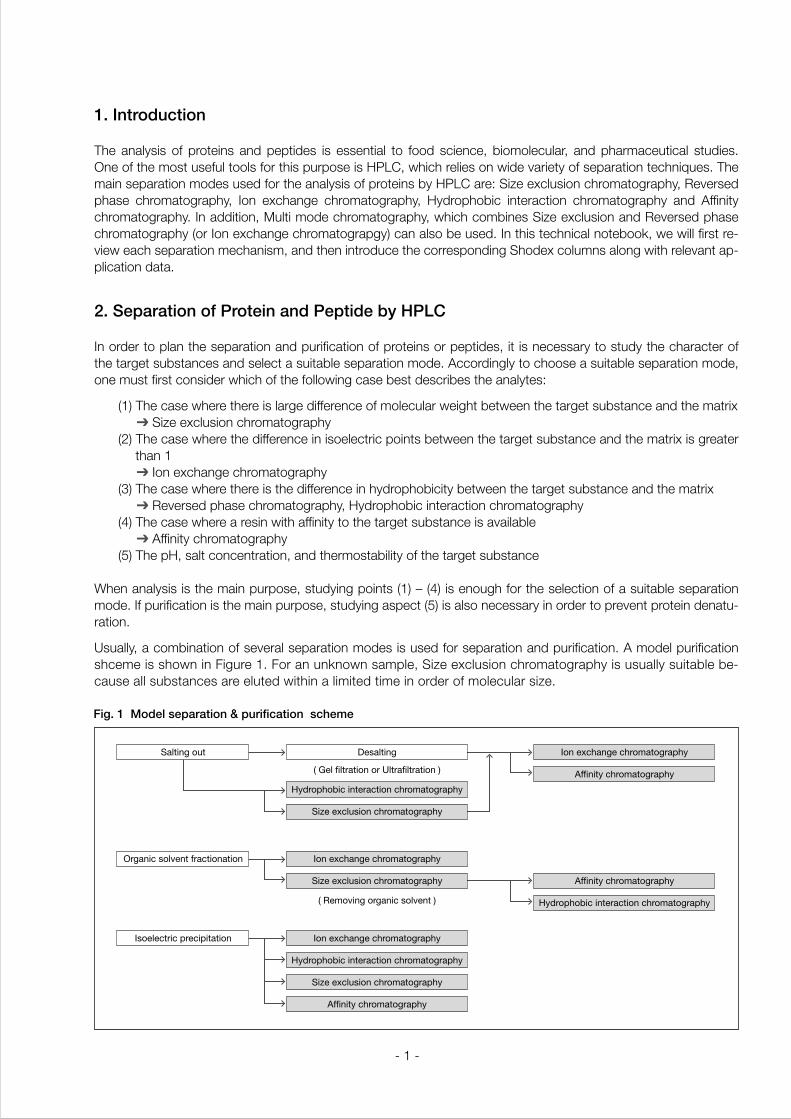
Usually, a combination of several separation modes is used for separation and purification. A model purification shceme is shown in Figure 1. For an unknown sample, Size exclusion chromatography is usually suitable be-cause all substances are eluted within a limited time in order of molecular size.
- 1 -
Fig. 1 Model separation & purification scheme
Organic solvent fractionation
Hydrophobic interaction chromatography
Desalting
( Gel filtration or Ultrafiltration )
( Removing organic solvent )
Size exclusion chromatography
Ion exchange chromatography
Size exclusion chromatography
Ion exchange chromatography
Affinity chromatography
Affinity chromatography
Hydrophobic interaction chromatography
Isoelectric precipitation
Salting out
Ion exchange chromatography
Hydrophobic interaction chromatography
Size exclusion chromatography
Affinity chromatography

- 2 -
Shodex provides columns corresponding to each of the above mentioned-separation modes for the analysis of proteins and peptides. Figures 2-1 & 2-2 can be used for the selection of a suitable column, and each separation mode is explained in chapter 3.
MW
103
104
105
106
107
MW
Low
High
Fig. 2-1 Shodex column selection guide (Size exclusion, Reversed phase)
Fig. 2-2 Shodex column selection guide (Ion exchange, Hydrophobic interaction, Multi mode, Affinity)
Protein, Peptide GFC
Separation mode Suitable Shodex columns
Reversed phase
KW-802.5, KW402.5
DE-413, DE-613RP18-413, RP18-613
C8P-50 C4P-50ODP-50, ODP-40
RP18-415
KW-804, KW404
PI
3
5
7
9
11
102
103
104
105
106
107
MW
Protein Peptide Ion exchangeDEAE-825 DEAE3N-4T ES-502N
Separation mode Suitable Shodex columns
Multi mode
Hydrophobic interaction
QA-825
SP-420N CM-825 ES-502C
Affinity AFpak series
SP-825
PH-814
GS-220 HQ
GS-320 HQ
GS-520 HQ
GS-620 HQ
KW-803, KW403
KW405

- 3 -
The packing material has a network of small wedged holes called pores. When proteins are introduced into a col-umn, they diffuse into pores by capillary action. Proteins which are larger than the pore size cannot penetrate in-to the pore and move forward with eluent, therefore eluting from the column earlier. On the other hand, proteins smaller than the pore size can get into the pore and elute from the column later. With SEC, proteins are eluted from the largest one on.
SEC has a disadvantage, which is a low loading capacity and the impossibility to increase the capacity factor (k’) above 1.0. SEC is therefore not suitable for the separation of complex samples. In spite of that, SEC is frequently used as the first screening method for the separation of unknown proteins, because of the following three rea-sons: (1) The eluent can be easily selected. (2) It is possible to separate by molecular size. (3) The purification ra-tio is effective.
3. Separation modes
3-1. Size exclusion chromatography
3-1-1. Separation mechanism
Size exclusion chromatography (SEC) relies on the separation of molecules based on their size whereby larger molecules, which have a larger 3-dimensional volume in the eluent, elute faster. The principle of size exclusion chromatography is shown in Figure 3.
3-1-2. Introduction of Shodex columnsTwo types of base materials can be packed into a column, i.e. silica-based, and polymer-basedmaterials. Gener-ally speaking for proteins and peptides analysis, silica-based stationary phases show the best separation per-formance because the base material has a smaller pore size distribution. On the other hand, polymer-based sta-tionary phases are at an advantage in alkaline eluents of pH higher than 7.5, because silica gel dissolves in alkaline eluents. Figure 4 shows the comparison chromatograms of a Polyethylene glycol (PEG) mixture between the polymer-based column OHpak SB-803 HQ and the silica-based PROTEIN KW-803 & KW-802.5. OHpak SB-803 HQ is suitable for the analysis of synthetic polymers with a wider molecular range thanks to its wider pore size distribution. On the other hand, the PROTEIN KW-803 & KW-802.5 columns are suitable for the analy-sis of proteins thanks to their narrower pore size distribution.
Fig. 3 The principle of SEC
SEC : Size Exclusion Chromatography
Exclusion limit
• Substances are eluted in decreasing order of molecular size.
• There is no interaction with the packing material.
Elution volume
The largest substance
The smallest substance
Packing material

- 4 -
Fig. 4-1 Comparison of chromatograms
Fig. 4-2 Comparison of calibration curves
Fig. 4 Comparison between silica-based columns KW-803 & KW-802.5 and polymer-based column SB-803 HQ
Columns : Shodex OHpak SB-803 HQ or PROTEIN KW-802.5 or KW-803 (8.0mmID x 300mm each)Eluent : H2OFlow rate : 0.5mL/minDetector : Shodex RI Column temp. : 30°C
Sample : 1. Poly(ethylene glycol) (MW: 20,000) 2. Poly(ethylene glycol) (MW: 4,000) 3. Poly(ethylene glycol) (MW: 1,000)4. Poly(ethylene glycol) (MW: 400) 5. EG, Ethylene glycol (MW: 62)
KW-803KW-802.5
SB-803 HQ
1016 18 20 22 24
100100
1000
10000
Elution time (min)
MW
10
1 23 4
5
1
23
4
5
12 3 4 5
15 20 25 min
KW-802.5
KW-803
SB-803 HQ

- 5 -
PROTEIN KW-800 series (Silica-based)
The packing material of the Shodex PROTEIN KW-800 series is based on silica particles whose surface is coat-ed with a hydrophilic polymer. This column is for aqueous SEC, and indexed in the Shodex catalogue under Gel filtration chromatography (GFC). It enjoys a positive reputation thanks to its high recovery ratio of proteins and peptide. The PROTEIN KW-800 series comprises three kinds of columns, differing in pore and particle size.
Figure 5 shows the analysis of a mixture of 10 standard proteins with the PROTEIN KW-800 series.
The PROTEIN KW-800 series line-up
Fig. 5 Calibration curve of the PROTEIN KW-800 series
Column : Shodex PROTEIN KW-800 series (8.0mmID x 300mm)Eluent : 50mM Sodium phosphate buffer (pH7.0) + 0.3M NaClFlow rate : 1.0mL/minDetector : UV (220nm)Column temp. : Room temp.
Sample 1. Thyroglobulin (Mw: 669,000) 2. Aldolase (Mw: 158,000) 3. BSA (Mw: 67,000) 4. Ovalbumin (Mw: 43,000) 5. Peroxidase (Mw: 40,200) 6. Adenylate kinase (Mw: 32,000) 7. Myoglobin (Mw: 17,000) 8. Ribonuclease A (Mw: 13,700) 9. Aprotinin (Mw: 6,500)10. Vitamin B12 (Mw: 1,350)
PROTEIN KW-802.5
PROTEIN KW-803
PROTEIN KW-804
5 7 9 116 8 10 12 13
Elution volume (mL)
Mol
ecul
ar W
eigh
t (P
rote
in)
KW-804
KW-802.5KW-803
102
103
104
105
106
107
KW-802.5
KW-803
KW-804
KW-G
8.0 x 300
8.0 x 300
8.0 x 300
6.0 x 50
5
5
7
7
> 21,000
> 21,000
> 16,000
(Guard column)
60,000
170,000
500,000
—
400
1,000
1,500
-—
150
300
500
—
150,000
700,000
1,000,000
—
PROTEIN
KW-800 series
Size (mm)
I.D. x L
Plate Number
(TP/column)
Particle Size
(µm)
Exclusion Limit
Pullulan Max. Avg.Protein
Pore Size (Å)
1
2
3
45
6 78 9
10
1 2 3
4
56
7 8 910
1 2
34
56
7
8 9
10
6 8 10 12 min
6 8 10 12 min
6 8 10 12 14 min

- 6 -
KW400 series (Silica-based)
The Shodex KW400-4F series is the high-performance semi-micro column version of the KW-800 series. The theoretical plate number and the sensitivity are improved by reducing the diameter of the packed particle to 3 micrometers.
KW405-4F, the newest addition to the KW400 line-up, has a larger pore size than any columns in the existing KW-800 series, and can analyze proteins whose molecular weight is larger than 1,000,000. It enables the scien-tist to carry out the analysis of protein complexes. Figure 6 shows the calibration curves of the KW400 series with proteins.
Figure 7 shows the comparison between the high-performance semi-micro column KW402.5-4F and the original PROTEIN KW-802.5 column for protein analysis. The KW400-4F series exhibits approximately a 1.5 times higher theoretical plate number and 4 times better sensitivity compared to the KW-800 series.
The KW400 series line-up
Columns : (A) Shodex KW402.5-4F (4.6mmID x 300mm) (B) Shodex PROTEIN KW-802.5 (8.0mmID x300mm)Eluent : 50mM Sodium phosphate buffer (pH7.0) + 0.3M NaClFlow rate : (A) 0.33mL/min, (B) 1.0mL/minDetector : UV (280nm)Column temp. : Room temp.(25˚C)
Sample : 10µL1. Blue dextran 2000 0.2mg/mL2. γ-Globulin 0.8mg/mL3. Ovalbumin 0.8mg/mL4. Myoglobin 0.56mg/mL5. Uridine 0.04mg/mL
Fig. 6 Calibration curves of the KW400-4F seriesFig. 7 Comparison between KW402.5-4F and KW-802.5 columns
KW402.5-4F
KW403-4F
KW404-4F
KW405-4F
KW400G-4A
4.6 x 300
4.6 x 300
4.6 x 300
4.6 x 300
4.6 x 10
3
3
5
5
5
> 35,000
> 35,000
> 25,000
> 25,000
(Guard column)
60,000
150,000
500,000
1,300,000
—
400
800
1,500
2,000
-—
150
250
500
1,000
—
150,000
600,000
1,000,000
20,000,000
—
KW400 seriesSize (mm)
I.D. x L
Plate Number
(TP/column)
Particle Size
(µm)
Exclusion Limit
Pullulan Max. Avg.Protein
Pore Size (Å)
1.5 2.52.0 3.0 4.03.5 4.5
Elution volume (mL)
Mol
ecul
ar W
eigh
t (P
rote
in)
KW404-4F
KW402.5-4F
KW403-4F
KW405-4F
102
103
104
105
106
107
5
43
21
1
0 5 10 15
23 4
5
(A) KW402.5-4F
(B) KW802.5
min
The following semi-micro and micro columns can be prepared.• Inner diameter : 2.0mm, 1.0mm • Length : 250mm, 150mm, 50mm
- 7 -
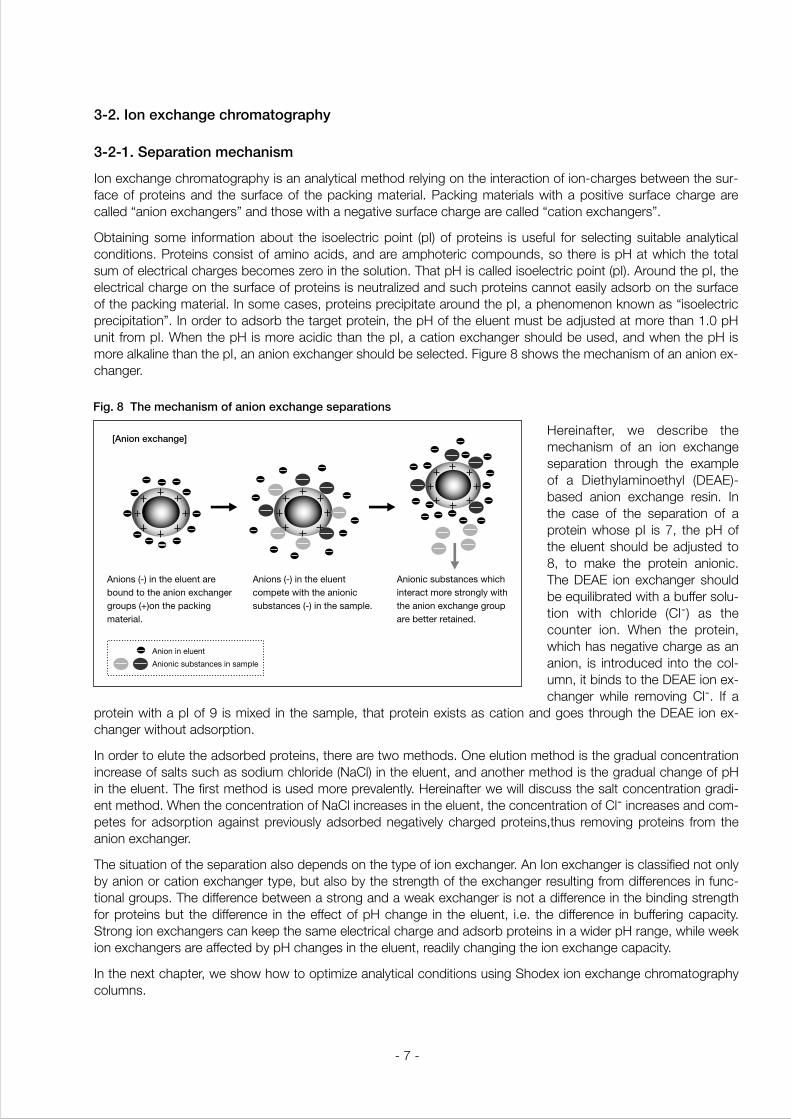
[Anion exchange]
Anion in eluent
Anionic substances in sample
Anions (-) in the eluent arebound to the anion exchangergroups (+)on the packing material.
Anions (-) in the eluent compete with the anionic substances (-) in the sample.
Anionic substances which interact more strongly withthe anion exchange groupare better retained.
Hereinafter, we describe the mechanism of an ion exchange separation through the example of a Diethylaminoethyl (DEAE)-based anion exchange resin. In the case of the separation of a protein whose pI is 7, the pH of the eluent should be adjusted to 8, to make the protein anionic. The DEAE ion exchanger should be equilibrated with a buffer solu-tion with chloride (Cl-) as the counter ion. When the protein, which has negative charge as an anion, is introduced into the col-umn, it binds to the DEAE ion ex-changer while removing Cl-. If a
protein with a pI of 9 is mixed in the sample, that protein exists as cation and goes through the DEAE ion ex-changer without adsorption.
In order to elute the adsorbed proteins, there are two methods. One elution method is the gradual concentration increase of salts such as sodium chloride (NaCl) in the eluent, and another method is the gradual change of pH in the eluent. The first method is used more prevalently. Hereinafter we will discuss the salt concentration gradi-ent method. When the concentration of NaCl increases in the eluent, the concentration of Cl- increases and com-petes for adsorption against previously adsorbed negatively charged proteins,thus removing proteins from the anion exchanger.
The situation of the separation also depends on the type of ion exchanger. An Ion exchanger is classified not only by anion or cation exchanger type, but also by the strength of the exchanger resulting from differences in func-tional groups. The difference between a strong and a weak exchanger is not a difference in the binding strength for proteins but the difference in the effect of pH change in the eluent, i.e. the difference in buffering capacity. Strong ion exchangers can keep the same electrical charge and adsorb proteins in a wider pH range, while week ion exchangers are affected by pH changes in the eluent, readily changing the ion exchange capacity.
In the next chapter, we show how to optimize analytical conditions using Shodex ion exchange chromatography columns.
Fig. 8 The mechanism of anion exchange separations
3-2. Ion exchange chromatography
3-2-1. Separation mechanism
Ion exchange chromatography is an analytical method relying on the interaction of ion-charges between the sur-face of proteins and the surface of the packing material. Packing materials with a positive surface charge are called “anion exchangers” and those with a negative surface charge are called “cation exchangers”.
Obtaining some information about the isoelectric point (pI) of proteins is useful for selecting suitable analytical conditions. Proteins consist of amino acids, and are amphoteric compounds, so there is pH at which the total sum of electrical charges becomes zero in the solution. That pH is called isoelectric point (pI). Around the pI, the electrical charge on the surface of proteins is neutralized and such proteins cannot easily adsorb on the surface of the packing material. In some cases, proteins precipitate around the pI, a phenomenon known as “isoelectric precipitation”. In order to adsorb the target protein, the pH of the eluent must be adjusted at more than 1.0 pH unit from pI. When the pH is more acidic than the pI, a cation exchanger should be used, and when the pH is more alkaline than the pI, an anion exchanger should be selected. Figure 8 shows the mechanism of an anion ex-changer.
- 8 -
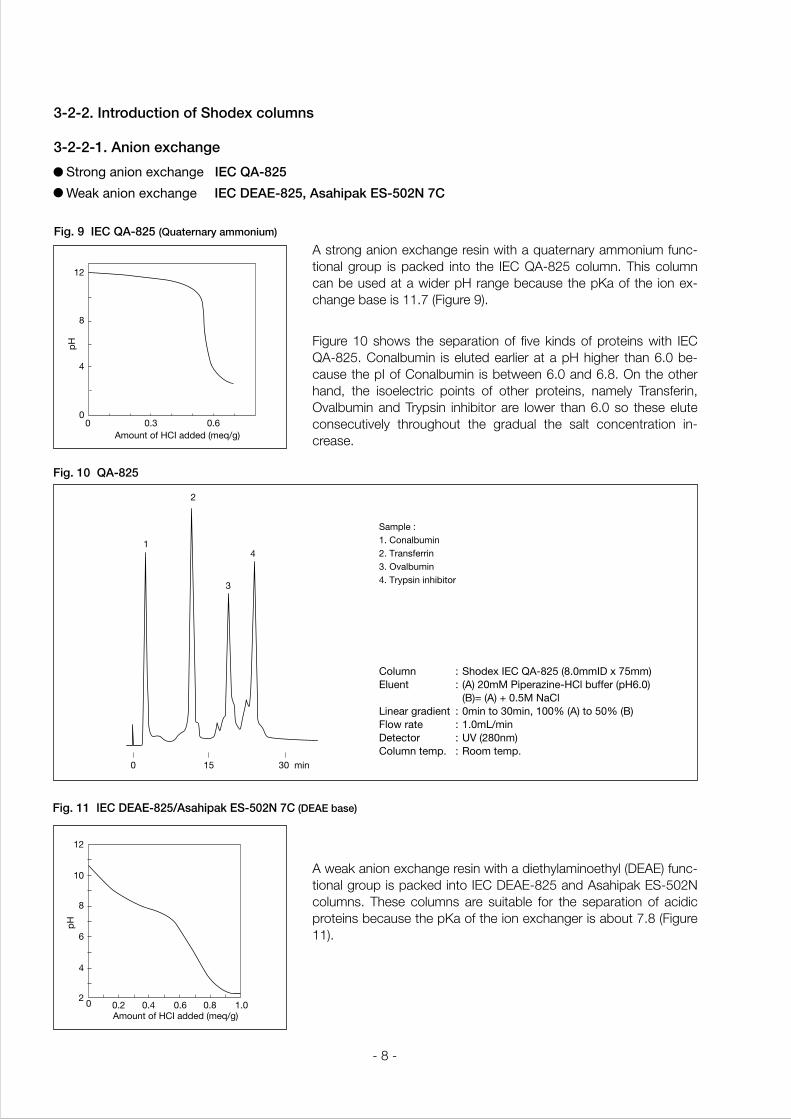
Fig. 11 IEC DEAE-825/Asahipak ES-502N 7C (DEAE base)
Fig. 10 QA-825
Column :Shodex IEC QA-825 (8.0mmID x 75mm)Eluent : (A) 20mM Piperazine-HCl buffer (pH6.0) (B)= (A) + 0.5M NaClLinear gradient :0min to 30min, 100% (A) to 50% (B)Flow rate :1.0mL/minDetector :UV (280nm)Column temp. :Room temp.
Sample : 1. Conalbumin 2. Transferrin 3. Ovalbumin 4. Trypsin inhibitor
Strong anion exchange IEC QA-825
Weak anion exchange IEC DEAE-825, Asahipak ES-502N 7C
1
2
3
4
0 15 30 min
3-2-2-1. Anion exchange
Fig. 9 IEC QA-825 (Quaternary ammonium)
A strong anion exchange resin with a quaternary ammonium func-tional group is packed into the IEC QA-825 column. This column can be used at a wider pH range because the pKa of the ion ex-change base is 11.7 (Figure 9).
Figure 10 shows the separation of five kinds of proteins with IEC QA-825. Conalbumin is eluted earlier at a pH higher than 6.0 be-cause the pI of Conalbumin is between 6.0 and 6.8. On the other hand, the isoelectric points of other proteins, namely Transferin, Ovalbumin and Trypsin inhibitor are lower than 6.0 so these elute consecutively throughout the gradual the salt concentration in-crease.
A weak anion exchange resin with a diethylaminoethyl (DEAE) func-tional group is packed into IEC DEAE-825 and Asahipak ES-502N columns. These columns are suitable for the separation of acidic proteins because the pKa of the ion exchanger is about 7.8 (Figure 11).
12
8
4
00 0.3 0.6
Amount of HCI added (meq/g)
pH
12
10
8
6
4
20 0.2 0.4 0.6 0.8 1.0
Amount of HCI added (meq/g)
pH
3-2-2. Introduction of Shodex columns

- 9 -
Figure 13 shows the analysis of Lipoxidase (reagent grade) with the IEC QA-825 (strong anion exchange resin) and IEC DEAE-825 (week anion exchange resin). Enzymatic activity was detected in the range delimited by dou-ble arrows.
Figure 12 shows the effect of pH on the separation of proteins on weak anion exchange chromatography column IEC DEAE-825. Under acidic eluents, the four kinds of protein can be separated well but under alkaline eluents, the separation worsens with increasing pH. It is due to the ion exchanger not being properly ionized at alkali pH.
Weak anion exchangers (DEAE) are preferably used for protein analysis, even though the pH range for protein reten-tion is narrower than the range for a strong anion exchanger, because milder analytical conditions can be used.
Fig. 12
Fig. 13 Comparison between QA-825 and DEAE-825
Column :Shodex IEC DEAE-825 (8.0mmID x 75mm)Eluent : (A) 20mM Piperazine-HCl buffer (pH6.0) 20mM Tris-Trispropanol-HCl buffer (pH7.0) 20mM Tris-HCl buffer (pH8.0) 20mM Ethanolamine-HCl buffer (pH9.0) 20mM 1,3-Diaminopropane-HCl buffer (pH10.0) (B)=(A) + 0.5M NaClLinear gradient : 0min to 20min, (A) to (B)Flow rate :1.0mL/min
Columns :Shodex IEC QA-825 (8.0mmID x 75mm) Eluent : (A); 20mM Ethanolamine-HCl buffer (pH9.0) (B); (A) + 0.5M NaClLinear gradient :0min to 60min, (A) to (B)Flow rate :1.0mL/minDetector :UV(280nm)Column temp. :Room temp.
Columns :Shodex IEC DEAE-825 (8.0mmID x 75mm)Eluent : (A); 20mM Tris-HCl buffer (pH8.0) (B); (A) + 0.5M NaClLinear gradient :0min to 60min, (A) to (B)Flow rate :1.0mL/minDetector :UV(280nm)Column temp. :Room temp.
Sample:1. Conalbumin2. Transferrin3. Ovalbumin4. Trypsin inhibitor
Sample : Lipoxidase from soybean
0 5 10 15 min 0 5 10 15 min 0 5 10 15 min 0 5 10 15 min0 5 10 15 min
1
1
pH6.0 pH8.0pH7.0 pH9.0 pH10.0
2 2
43
1
24
3
1
2
43
1,2
4
343
0 0 15 30 4515 30 45
QA-825 DEAE-825
Lipoxidase 1.0%100µL
Sample :Lipoxidase 0.5%150µL
min min
The following semi-micro and micro columns can be prepared.• Inner diameter : 2.0mm, 1.0mm, 0.8mm, 0.5mm, 0.3mm • Length : 150mm, 50mm, 35mm
Anion exchange
IEC QA-825
IEC DEAE-825
Asahipak ES-502N 7C
Strong
Weak
Weak
8.0 x 75
8.0 x 75
7.5 x 100
0.45
0.6
0.55
5,000
5,000
2,000
12
8
9
Polyhydroxymethacrylate
Polyhydroxymethacrylate
Polyvinyl alcohol
Product TypeSize (mm)
ID x LIon Exchange
Capacity (meq/g)Base material
Pore size (Å)
Particle size(µm)

- 10 -
Fig. 14 IEC SP-825 (Sulfopropyl base)
Fig. 15 Effect of pH (SP-825)
Column :Shodex IEC SP-825 (8.0mmID x 75mm)Eluent : (A) 20mM Sodium formate buffer (pH4.0) 20mM Sodium malonate buffer (pH5.0 and 6.0) 20mM Sodium phosphate buffer (pH7.0) 20mM HEPES (pH8.0) (B)= (A) + 0.5M NaClLinear gradient :0min to 20min, (A) to (B)Flow rate :1.0mL/min
A strong cation exchange resin with a sulfopropyl functional group is packed into the IEC SP-825 column. This column can be used at a wider pH range because the pKa of the ion exchange base is 2.3 (Figure 14).
Figure 15 shows the effect of pH on the separation of proteins with IEC SP-825. The proteins can be retained at a wide pH range, and the five kinds of proteins were separated particularly well at pH 7.0 and pH 8.0. The retention time of Ribonuclease A increases at low-er pH and it is eluted after α Chymotrypsinogen A under pH 6.0. At pH 6.0 the separation between Ribonuclease A and α Chymotrypsi-nogen A is insufficient, while at pH 4.0 and pH 5.0, the peak shape of Myoglobin is not sharp.
Fig. 16 IEC CM-825/Asahipak ES-502C 7C (Carboxymethyl base)
IEC CM-825 and Asahipak ES-502C are packed with a weak cation exchange resin with Carboxymethyl as the functional group. These columns are suitable for the separation of basic proteins because the pKa of the ion exchange base is 5.7 (Figure 16).
Strong cation exchange IEC SP-825
Weak cation exchange IEC CM-825, Asahipak ES-502C 7C
3-2-2-2. Cation exchanger
3
3
33
31 1
1
2
22 2
24
4 4 44
5
5 5
5
5
0 010 30 min 15 min 0 15 min 0 15 min 0 15 min
pH4.0 pH5.0 pH6.0 pH7.0 pH8.0
Sample :1. Myoglobin2. Ribonuclease A3. α Chymotrypsinogen A4. Cytochrome c5. Lysozyme
12
4
6
8
10
12
0 0.2 0.4 0.6Amount of NaOH added (meq/g)
pH
0.2 0.4
12
10
8
6
4
2
8
Amount of NaOH added (meq/g)
pH

- 11 -
Fig. 17 Comparison between CM-825 and SP-825
Columns :(Left) Shodex IEC CM-825 (8.0mmID x 75mm) (Right) Shodex IEC SP-825 (8.0mmID x 75mm)Eluent : (A) 20mM Sodium phosphate buffer (pH7.0) (B)= (A) + 0.5M NaClLinear gradient :0min to 60min, (A) to (B)Flow rate :1.0mL/minDetector :UV (280nm) Column temp. :Room temp.
Figure 17 shows the separation of six kinds of proteins including Trypsinogen with the IEC CM-825 (week cation exchange resin) and IEC SP-825 (strong cation exchange) columns. The elution patterns are similar but the elu-tion is faster with SP-825 than with CM-825.
Sample : 1. Myoglobin2. Trypsinogen3. Ribonuclease A4. α Chymotrypsinogen A5. Cytochrome c6. Lysozyme
0 15 30 45 min 0 15 30 min
11
2
2
33
4
4
5
5
6 6
CM-825 SP-825
The following semi-micro and micro columns can be prepared.• Inner diameter : 2.0mm, 1.0mm, 0.8mm, 0.5mm, 0.3mm • Length : 150mm, 50mm, 35mm
Cation exchange
IEC SP-825
IEC CM-825
Asahipak ES-502C 7C
Strong
Weak
Weak
8.0 x 75
8.0 x 75
7.5 x 100
0.4
0.4
0.55
5,000
5,000
2,000
8
8
9
Polyhydroxymethacrylate
Polyhydroxymethacrylate
Polyvinyl alcohol
Product TypeSize (mm)
ID x LIon Exchange
Capacity (meq/g)Base material
Pore size (Å)
Particle size(µm)
- 12 -
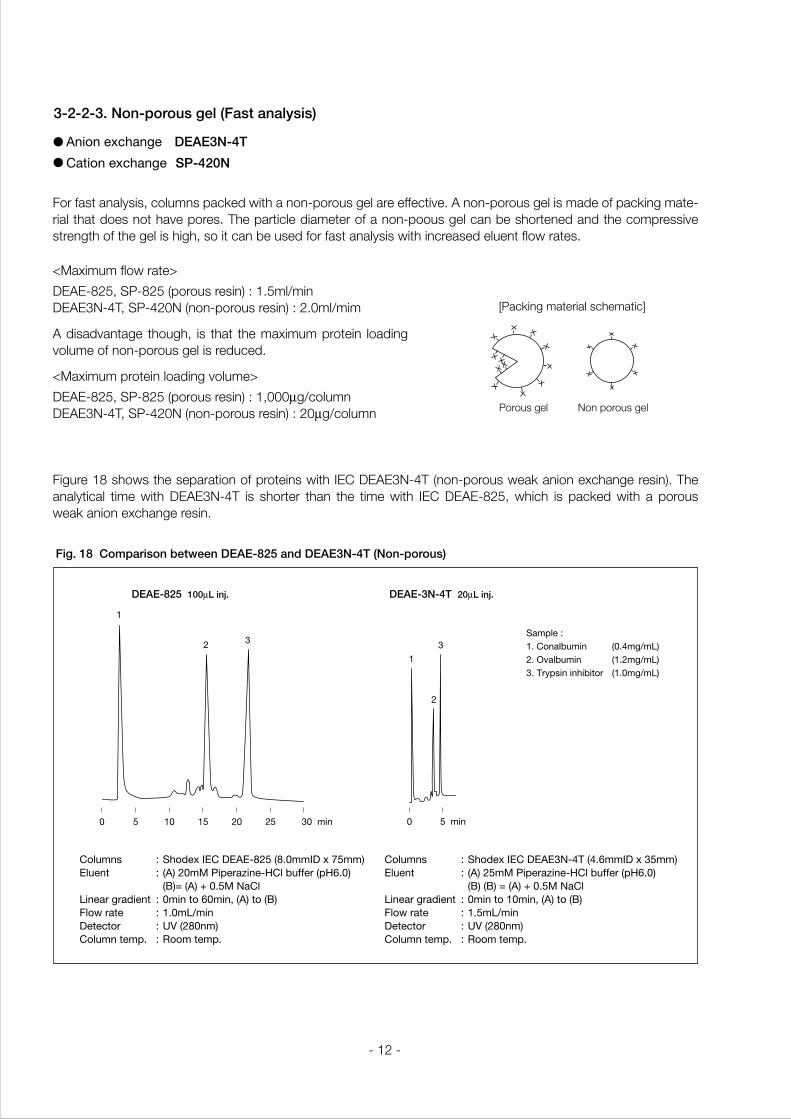
Fig. 18 Comparison between DEAE-825 and DEAE3N-4T (Non-porous)
Columns :Shodex IEC DEAE-825 (8.0mmID x 75mm)Eluent : (A) 20mM Piperazine-HCl buffer (pH6.0) (B)= (A) + 0.5M NaClLinear gradient :0min to 60min, (A) to (B)Flow rate :1.0mL/minDetector :UV (280nm)Column temp. :Room temp.
Columns :Shodex IEC DEAE3N-4T (4.6mmID x 35mm)Eluent : (A) 25mM Piperazine-HCl buffer (pH6.0) (B) (B) = (A) + 0.5M NaClLinear gradient :0min to 10min, (A) to (B)Flow rate :1.5mL/minDetector :UV (280nm)Column temp. :Room temp.
For fast analysis, columns packed with a non-porous gel are effective. A non-porous gel is made of packing mate-rial that does not have pores. The particle diameter of a non-poous gel can be shortened and the compressive strength of the gel is high, so it can be used for fast analysis with increased eluent flow rates.
Figure 18 shows the separation of proteins with IEC DEAE3N-4T (non-porous weak anion exchange resin). The analytical time with DEAE3N-4T is shorter than the time with IEC DEAE-825, which is packed with a porous weak anion exchange resin.
<Maximum flow rate>
DEAE-825, SP-825 (porous resin): 1.5ml/minDEAE3N-4T, SP-420N (non-porous resin) : 2.0ml/mim
A disadvantage though, is that the maximum protein loading volume of non-porous gel is reduced.
<Maximum protein loading volume>
DEAE-825, SP-825 (porous resin): 1,000µg/columnDEAE3N-4T, SP-420N (non-porous resin) : 20µg/column
Anion exchange DEAE3N-4T
Cation exchange SP-420N
3-2-2-3. Non-porous gel (Fast analysis)
Sample : 1. Conalbumin (0.4mg/mL) 2. Ovalbumin (1.2mg/mL) 3. Trypsin inhibitor (1.0mg/mL)
DEAE-825 100µL inj. DEAE-3N-4T 20µL inj.
0 5 10 15 20 25 30 min
1
2 3
0 5 min
1
2
3
[Packing material schematic]
Porous gel Non porous gel

- 13 -
A buffer with a sufficient buffering power at the pH of the eluent and with an ion of identical electrical charge to that of the ion exchanger should be selected for the eluent. The table below shows some examples. We recom-mend the use of a salt solution of NaCl, KCl, Na2SO4 or K2SO4, possibly in combination with a buffer solution. The total salt concentration should remain within the 20mM to 600mM range.
(Appendix) Selection of a suitable buffer for the eluent
3.8 ~ 4.3
4.3
4.8 ~ 5.2
5.0 ~ 6.0
5.5 ~ 6.7
6.7 ~ 7.6
7.6 ~ 8.2
8.2 ~ 8.7
Sodium formate
Sodium succinate
Sodium acetate
Sodium malonate
MES
Sodium phosphate
HEPES
BICINE
PH Cation Exchange Resin
4.8 ~ 5.0
5.0 ~ 6.0
5.8 ~ 6.4
6.4 ~ 7.3
7.3 ~ 7.7
7.5 ~ 8.0
8.0 ~ 8.5
8.4 ~ 8.8
8.5 ~ 9.0
9.0 ~ 9.5
N-Methylpiperazine HCl
Piperazine HCl
Bis Tris HCl
Bis Tris Propane HCl
Triethanolamine HCl
Tris HCl
N-Methyldiethanolamine HCl
Diethanolamine HCl
1,3-Diaminopropane HCl
Ethanolamine HCl
PH Anion Exchange Resin
MES : 2-(N-morpholino)ethanesulfonic acid
HEPES : 4-(2-hydroxymethyl)-1-piperazine ethanesulfonic acid
BICINE : N,N-bis(2-hydroxyethyl)glycine
Tris : tris(hydroxymethyl)aminomethane
Bis Tris : Bis(2-hydroxyethyl)iminotris(hydroxymethyl)methane
Bis Tris propane : 1,3-Bis[tris(hydroxymethyl)methylamino]propane
The following semi-micro and micro columns can be prepared.• Inner diameter : 2.0mm, 1.0mm, 0.8mm, 0.5mm, 0.3mm • Length : 50mm, 35mm
Non-porous
IEC DEAE3N-4T
IEC SP-420N
Strong anion
Strong cation
4.6 x 35
4.6 x 35
0.4
0.3
—
—
2.5
2.5
Polyhydroxymethacrylate
Polyhydroxymethacrylate
Product TypeSize (mm)
ID x LIon Exchange
Capacity (meq/g)Base material
Pore size (Å)
Particle size(µm)

- 14 -
Fig. 19 Separation mechanism of reversed phase chromatography
Low polarity area Packing material : Low polarity (ex.C18)
Eluent : Highly polar solvent (ex. CH3CN/H2O)
High polarity area
Packing material polarity Eluent polarity
Elution order : From the most polar substance on
Fig. 20 Characteristics and applications of packing materials for normal & reversed phase columns
3-3-1. Separation mechanism
The separation mode of reversed phase chromatography is based on the hydropho-bic interactions governing the distribu-tion/adsorption equilibrium between nonpo-lar amino acids in proteins and the surface of the packing material (See Figure 19). The surface of the packing material’s poly-mer- or silica-based gel is bound with a hy-drophobic functional group such as octa-decyl (C18). Some types of polymer gels can be used for reversed phase chroma-tography without the need for a functional group because the base material in itself is hydrophobic. Proteins with a higher hydro-phobicity are retained more strongly, so proteins are eluted from the most hydrophil-ic one on.
In order to separate the target substance well, several kinds of columns are available with varying polarity and gel pore sizes (Figure 20). A smaller pore size is suitable for peptides, and larger pore size is suitable for proteins.
The RSpak RP18-415 column has the largest pore size (about 450 Å) in the Shodex lineup and is suitable for pro-tein analysis. The pore size of Asahipak ODP, C8P and C4P columns is about 250 Å and these can be used for analyzing both proteins and peptides. The RSpak DE column has a smaller pore size (about 25 Å) and is suitable for analyzing smaller molecules like oligopeptides. The above-mentioned columns are polymer-based but can be used with similar analytical condition as silica-based ODS columns. In case the adsorption of the target sub-stance is not sufficient with DE-613, DE-413 or ODS columns, RSpak RP18-413 and RP18-613 are recommend-ed.
3-3. Reversed phase chromatography
Large
Small
High
SaccharidesSugar alcohols
Low molecular weight substances,medicines, organic acids, food additives, ets.
Polycyclicaromatic
compounds
Proteins
Peptides
Vitamins
LowPolarity of packing materials
Po
re s
ize
of
pac
king
mat
eria
ls
SilicapakSIL
5NH 5CN 5TMS 5C4 5C8 ODS
NH2P-50DC-613
DM-614 DS-413, 613RP18-413, 613
C4P-50 C8P-50
ODP2 HPDE
ODP-40, 50
RP18-415
Highly polar substance Low polarity substance Retention strength :
Asahipak ODP, C8P, C4P series ODP2 HP series RSpak RP18, DS, DE series
3-3-2. Introduction of Shodex columns
- 15 -
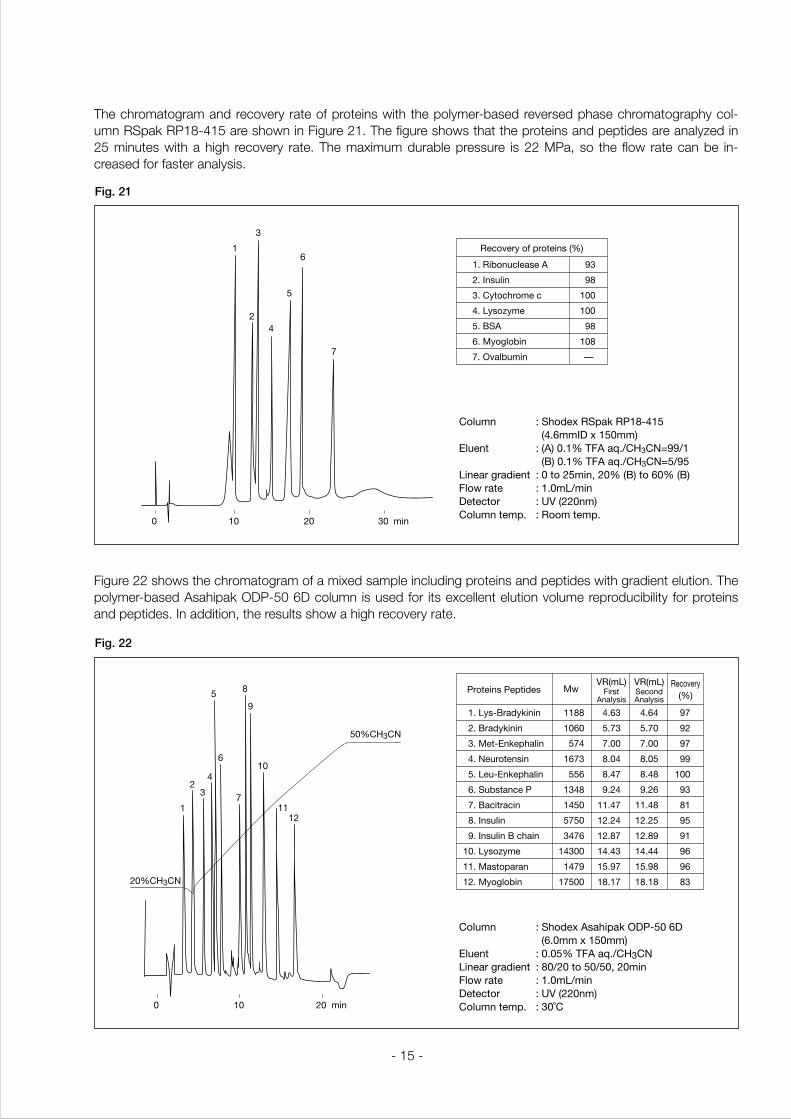
Fig. 21
The chromatogram and recovery rate of proteins with the polymer-based reversed phase chromatography col-umn RSpak RP18-415 are shown in Figure 21. The figure shows that the proteins and peptides are analyzed in 25 minutes with a high recovery rate. The maximum durable pressure is 22 MPa, so the flow rate can be in-creased for faster analysis.
Fig. 22
Figure 22 shows the chromatogram of a mixed sample including proteins and peptides with gradient elution. The polymer-based Asahipak ODP-50 6D column is used for its excellent elution volume reproducibility for proteins and peptides. In addition, the results show a high recovery rate.
0 10 20 30 min
2
1
3
4
5
6
7
1. Ribonuclease A
2. Insulin
3. Cytochrome c
4. Lysozyme
5. BSA
6. Myoglobin
7. Ovalbumin
93
98
100
100
98
108
—
Recovery of proteins (%)
0 10 20 min
23
4
5 8
9
10
1112
6
71
20%CH3CN
50%CH3CN
Proteins Peptides MwVR(mL)
FirstAnalysis
Recovery(%)
1. Lys-Bradykinin
2. Bradykinin
3. Met-Enkephalin
4. Neurotensin
5. Leu-Enkephalin
6. Substance P
7. Bacitracin
8. Insulin
9. Insulin B chain
10. Lysozyme
11. Mastoparan
12. Myoglobin
1188
1060
574
1673
556
1348
1450
5750
3476
14300
1479
17500
4.63
5.73
7.00
8.04
8.47
9.24
11.47
12.24
12.87
14.43
15.97
18.17
VR(mL)SecondAnalysis
4.64
5.70
7.00
8.05
8.48
9.26
11.48
12.25
12.89
14.44
15.98
18.18
97
92
97
99
100
93
81
95
91
96
96
83
Column :Shodex RSpak RP18-415 (4.6mmID x 150mm)Eluent :(A) 0.1% TFA aq./CH3CN=99/1 (B) 0.1% TFA aq./CH3CN=5/95Linear gradient :0 to 25min, 20% (B) to 60% (B)Flow rate :1.0mL/minDetector :UV (220nm)Column temp. :Room temp.
Column :Shodex Asahipak ODP-50 6D (6.0mm x 150mm)Eluent :0.05% TFA aq./CH3CNLinear gradient :80/20 to 50/50, 20minFlow rate :1.0mL/minDetector :UV (220nm)Column temp. :30˚C

- 16 -
Fig. 23
Figure 23 shows the separation of dipeptides with the polymer-based RSpak DE-613.
Fig. 24
Figure 24 shows the comparison of the retention of 3 kinds proteins with the polymer-based reversed phase chromatography columns Asahipak ODP-50, C8P-50 and C4P-50. The Octadecyl functional group (C18) is bond-ed onto the base material of ODP-50, the Octyl group (C8) is on C8P-50, and the Butyl group (C4) is on C4P-50. The shorter alkyl chain has the weakest hydrophobic interaction. If the retention of the ODP-50 column is too strong, it is recommended to use C8P-50 or C4P-50 because the ratio of organic solvent in the eluent can be re-duced and the analytical conditions for proteins and peptides can be milder.
Column :Shodex RSpak DE-613 (6.0mmID x 150mm)Eluent : (A) 0.05% TFA aq./CH3CN=96/4 (B) 0.05% TFA aq./CH3CN=75/25Linear gradient :0 to 30min, (A) to (B)Flow rate :1.0mL/minDetector :UV (220nm)
Sample : Dipeptides1. Gly-val2. Phe-Gly3. Ala-Gly4. Val-Phe5. Tyr-Leu
Columns :Shodex Asahipak ODP-50, C8P-50, C4P-50 (4.6mmID x 150mm each)Eluent :0.05% TFA aq./CH3CN=72/28Flow rate :0.6mL/minDetector :UV (220 nm)Column temp. :30˚C
Sample : 1. β-Endorphin2. Big gastrin3. Insulin
10
1
2
3
4
5
0 20 min
3
1
2
1
3
2
12
3
20 min100
ODP
C8P
C4P
- 17 -
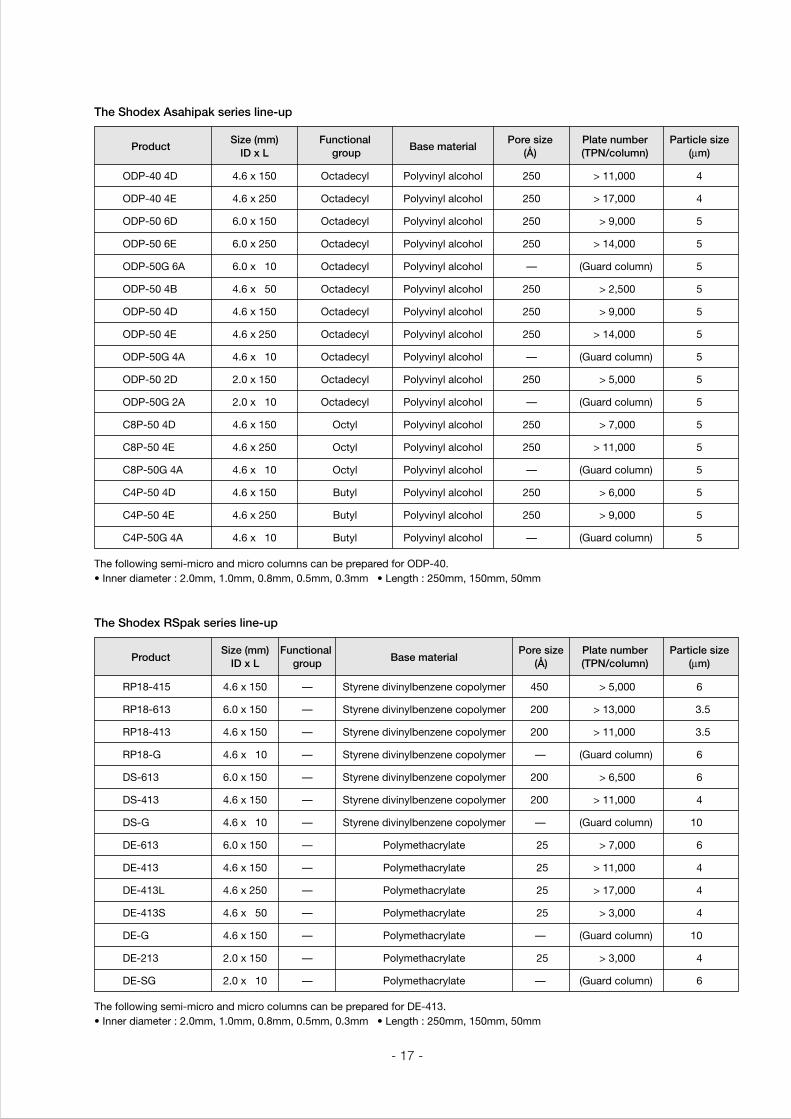
The Shodex Asahipak series line-up
ODP-40 4D
ODP-40 4E
ODP-50 6D
ODP-50 6E
ODP-50G 6A
ODP-50 4B
ODP-50 4D
ODP-50 4E
ODP-50G 4A
ODP-50 2D
ODP-50G 2A
C8P-50 4D
C8P-50 4E
C8P-50G 4A
C4P-50 4D
C4P-50 4E
C4P-50G 4A
4.6 x 150
4.6 x 250
6.0 x 150
6.0 x 250
6.0 x 10
4.6 x 50
4.6 x 150
4.6 x 250
4.6 x 10
2.0 x 150
2.0 x 10
4.6 x 150
4.6 x 250
4.6 x 10
4.6 x 150
4.6 x 250
4.6 x 10
250
250
250
250
—
250
250
250
—
250
—
250
250
—
250
250
—
4
4
5
5
5
5
5
5
5
5
5
5
5
5
5
5
5
> 11,000
> 17,000
> 9,000
> 14,000
(Guard column)
> 2,500
> 9,000
> 14,000
(Guard column)
> 5,000
(Guard column)
> 7,000
> 11,000
(Guard column)
> 6,000
> 9,000
(Guard column)
Octadecyl
Octadecyl
Octadecyl
Octadecyl
Octadecyl
Octadecyl
Octadecyl
Octadecyl
Octadecyl
Octadecyl
Octadecyl
Octyl
Octyl
Octyl
Butyl
Butyl
Butyl
Polyvinyl alcohol
Polyvinyl alcohol
Polyvinyl alcohol
Polyvinyl alcohol
Polyvinyl alcohol
Polyvinyl alcohol
Polyvinyl alcohol
Polyvinyl alcohol
Polyvinyl alcohol
Polyvinyl alcohol
Polyvinyl alcohol
Polyvinyl alcohol
Polyvinyl alcohol
Polyvinyl alcohol
Polyvinyl alcohol
Polyvinyl alcohol
Polyvinyl alcohol
ProductSize (mm)
ID x LFunctional
groupBase material
Pore size (Å)
Plate number (TPN/column)
Particle size(µm)
The Shodex RSpak series line-up
RP18-415
RP18-613
RP18-413
RP18-G
DS-613
DS-413
DS-G
DE-613
DE-413
DE-413L
DE-413S
DE-G
DE-213
DE-SG
4.6 x 150
6.0 x 150
4.6 x 150
4.6 x 10
6.0 x 150
4.6 x 150
4.6 x 10
6.0 x 150
4.6 x 150
4.6 x 250
4.6 x 50
4.6 x 150
2.0 x 150
2.0 x 10
450
200
200
—
200
200
—
25
25
25
25
—
25
—
6
3.5
3.5
6
6
4
10
6
4
4
4
10
4
6
> 5,000
> 13,000
> 11,000
(Guard column)
> 6,500
> 11,000
(Guard column)
> 7,000
> 11,000
> 17,000
> 3,000
(Guard column)
> 3,000
(Guard column)
—
—
—
—
—
—
—
—
—
—
—
—
—
—
Styrene divinylbenzene copolymer
Styrene divinylbenzene copolymer
Styrene divinylbenzene copolymer
Styrene divinylbenzene copolymer
Styrene divinylbenzene copolymer
Styrene divinylbenzene copolymer
Styrene divinylbenzene copolymer
Polymethacrylate
Polymethacrylate
Polymethacrylate
Polymethacrylate
Polymethacrylate
Polymethacrylate
Polymethacrylate
ProductSize (mm)
ID x LFunctional
group Base materialPore size
(Å) Plate number (TPN/column)
Particle size(µm)
The following semi-micro and micro columns can be prepared for ODP-40.• Inner diameter : 2.0mm, 1.0mm, 0.8mm, 0.5mm, 0.3mm • Length : 250mm, 150mm, 50mm
The following semi-micro and micro columns can be prepared for DE-413.• Inner diameter : 2.0mm, 1.0mm, 0.8mm, 0.5mm, 0.3mm • Length : 250mm, 150mm, 50mm
- 18 -
3-4. Hydrophobic interaction chromatography
3-4-1. Separation mechanism
The mechanism of hydrophobic interaction chromatography is based on the hydrophobic interaction between proteins and the surface of the packing material. It is like reversed phase chromatography, however eluent condi-tions differ. As the salt concentration increases, the hydrophobicity of the protein surface also increases and the protein adsorbs onto the packed material. This effect is similar to the “salting out” of proteins, a procedure usual-ly carried out with ammonium sulfate. After adsorption, the adsorbed protein is eluted by decreasing the salt con-centration thus weakening the hydrophobic interaction with the packing material.
The protein is adsorbed under high salt concentration, so this separation mode is usable after ammonium sulfate precipitation or ion exchange chromatography. Moreover a less hydrophobic base like phenyl is used as the func-tional group, hence the analytical conditions for proteins are milder than the conditions of reversed phase chroma-tography, preserving the bio-activity of protein.
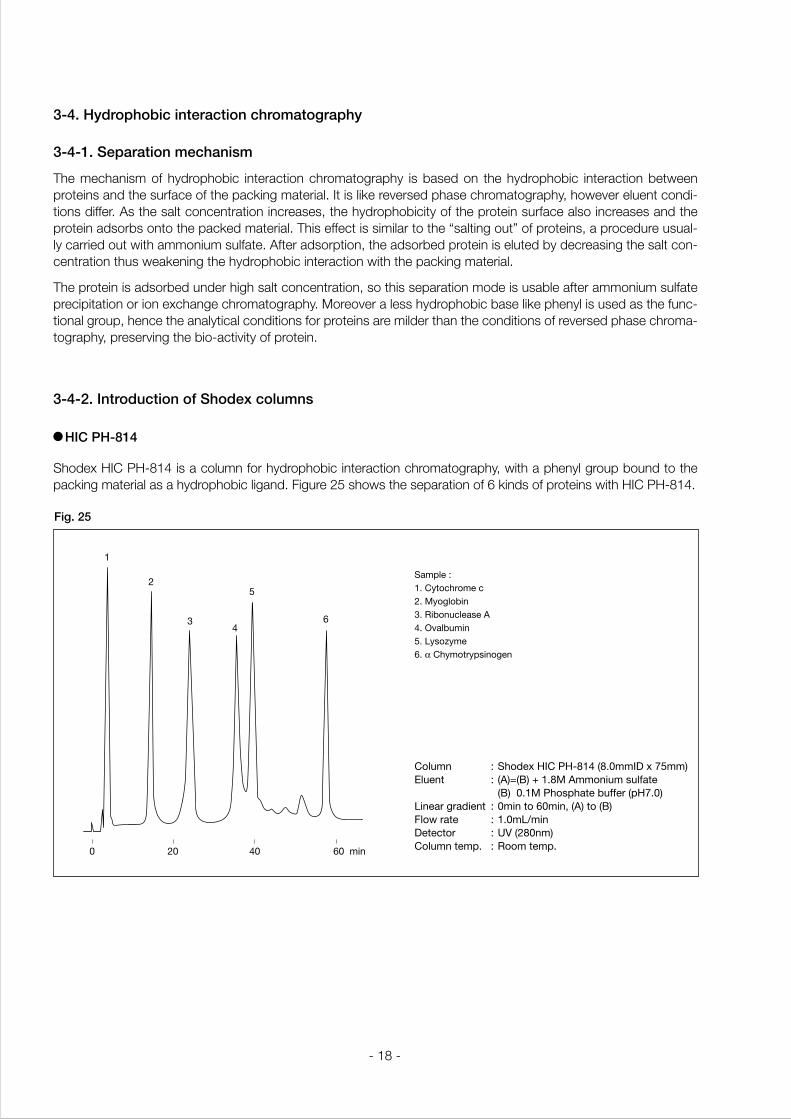
Shodex HIC PH-814 is a column for hydrophobic interaction chromatography, with a phenyl group bound to the packing material as a hydrophobic ligand. Figure 25 shows the separation of 6 kinds of proteins with HIC PH-814.
HIC PH-814
3-4-2. Introduction of Shodex columns
Fig. 25
Column :Shodex HIC PH-814 (8.0mmID x 75mm)Eluent : (A)=(B) + 1.8M Ammonium sulfate (B) 0.1M Phosphate buffer (pH7.0)Linear gradient :0min to 60min, (A) to (B)Flow rate :1.0mL/minDetector :UV (280nm)Column temp. :Room temp.
Sample : 1. Cytochrome c2. Myoglobin3. Ribonuclease A4. Ovalbumin5. Lysozyme6. α Chymotrypsinogen
0 20 40 60 min
1
2
34
5
6

- 19 -
The effect of the ammonium sulfate concentration in the eluent on protein separation with HIC PH-814 is illustrat-ed in Figure 26. The retention of proteins is controlled not only by the salt concentration but also by pH and tem-perature. The retention is stronger at higher pH or temperatures and weaker under lower pH and temperatures.
The Shodex HIC PH-814 column
HIC PH-814 8.0 x 75 2,000 10Phenyl Polyhydroxymethacrylate
ProductSize (mm)
ID x LFunctional
groupBase material
Pore size (Å)
Particle size(µm)
Fig. 26
Column :Shodex HIC PH-814 (8.0mmID x 75mm)Eluent : (A)=(B) + Ammonium sulfate (B) 0.1M Phosphate buffer (pH7.0)Linear gradient : (A) to (B)Flow rate :1.0mL/min
Sample : 1. α Chymotrypsinogen A2. α Chymotrypsin3. Lysozyme4. Ovalbumin5. Ribonuclease A6. Myoglobin7. Cytochrome c
0
0
20
30
40
50
60
1.0
12
34
5
6
7
2.0 3.0 4.0
10
Ret
entio
n tim
e (m
in)
Ammonium Sulphate Concentration (M)

- 20 -
3-5. Affinity chtromatography
3-5-1. Separation mechanism
Affinity chromatography is a highly selective separation method relying on biochemical interaction. The mechanism is explained in Figure 27.
The rigid polymer-based packing material used with the various ligands for Shodex AFpak columns, has the fol-lowing advantages.
1) High-speed and high-pressure (5~10 MPa) analysis2) Minimizes the detachment of ligands, ensuring highly reproducible analyses
Application data with each AFpak column is shown below.
1) Inject sample into an initially equilibrated affinity chromatography column (AFpak).2) Only the substances with affinity for the ligand are retained in the column.3) Substances with no affinity for the ligand are eluted from the column without interacting with the stationary
phase.4) The substances retained in the column can be eluted by changing the pH or salt or organic solvent concentra-
tions of the eluent.
AFpak series
3-5-2. Introduction of Shodex columns
Fig. 27
injection ofmixture
Adsorption of target substance
Elution of the target substance
Target substanceligandspacer
Regeneration
Matrix(Shodex GEL)
Washing outof impurities
Washing ElutionAdsorption
1 2 3 4

- 21 -
Fig. 28 Ovalbumin
Column :Shodex AFpak ACA-894 (8.0mmID x 50mm)Eluent : (A) 0.02M Tris-HCl buffer (pH7.4) + 0.5M NaCl (B)= (A) + 0.05M α-Methyl-D(+)-glucosideLinear gradient : (A) to (B) for 60minFlow rate :0.3mL/min Detector :UV (280nm) Column temp. :Room temp.
Column :Shodex AFpak ACB-894 (8.0mmID x 50mm)Eluent :(A) 0.1M Potassium phosphate buffer (pH5.0) (B) 0.1M Potassium phosphate buffer (pH7.5) + 1.5M KClStep gradient :(A) to (B)Flow rate :1.0mL/minDetector :UV (280nm)Column temp.:Room temp.
Column : Shodex AFpak AHR-894 (8.0mmID x 50mm)Eluent : (A) 0.01M Tris-HCl (pH7.5) + 0.01M NaCl (B) = (A) + 0.3 M NaClLinear gradient : (A) to (B)Flow rate : 0.5mL/minDetector : UV ( 280nm)Column temp. : 25˚C
Column :Shodex AFpak ADS-894 (8.0mmID x 50mm)Eluent : (A) 0.02M Tris-HCl (pH7.4) (B) = (A) + 1.0M NaClLinear gradient : (A) to (B) for 60min Flow rate :1.0mL/minDetector :UV ( 280nm)Column temp. :Room temp.
Fig. 29 α1 Antitrypsin
Fig. 30 Bovine serum albumin Fig. 31 Ovalbumin / Conalbumin / Lysozyme
0
1
2
3
20 40 60 min
0 0 15 30 45 6020 40 60 min 75 min
0 10 20 min
20%
Ligand : Concanavain A
Sample : Ovalbumin
Ligand : Cibacron blue
Sample: Bovine serum albumin
Ligand : Hepanin
Sample : 1. Ovalbumin2. Conalbumin3. Lysozymea
Ligand : Dextran sulfate
Sample : Antitrypsin(Human plasma SIGMA)
10%
Eluent A Eluent B

- 22 -
Fig. 32 Glutathione S-transferase
Column :Shodex AFpak AGT-894 (8.0mm ID x 50mm)Eluent : (A) 22mM Phosphate buffer (pH7.0) (B) 50mM Tris buffer (pH9.6) + 5mM GlutathioneStep gradient : (A) to (B)Flow rate :1.0mL/minDetector :UV ( 280nm)Column temp. :Room temp.
Column :Shodex AFpak AIA-894 (8.0mmID x 50mm)Eluent : (A) 0.1M Sodium acetate buffer (pH7.7) + 0.5M NaCl (B) 0.05M Tris-HCl (pH8.0) + 0.15M NH4ClStep gradient :(A) to (B)Flow rate :0.5mL/minDetector :UV (280nm)Column temp.:Room temp.
Column : Shodex AFpak ALC-894 (8.0mmID x 50mm)Eluent : (A) 0.05M Tris-HCl (pH7.4) + 0.15M NaCl + 0.5mM CaCl2 + 0.5mM MnCl2 (B) = (A) + 1M0.1 M Methyl mannosideStep gradient : (A) to (B)Flow rate : 0.5mL/minDetector : UV (280nm)Column temp. : Room temp.
Column :Shodex AFpak ANA-894 (8.0mmID x 50mm)Eluent : (A) 0.01M Potassium phosphate buffer (pH7.0) (B) = (A) + 0.5M KClStep gradient : (A) to (B)Flow rate :1.0mL/minDetector :UV (280nm)Column temp. :Room temp.
Fig. 33 L-lactate dehydrogenasepsin
Fig. 34 Super oxide dismutase Fig. 35 Fibrinogen (Sigma)
00 4 8 12 16 5 10 15 20 min20 min
Eluent A Eluent B
Eluent A
Eluent A
Eluent B
Eluent B
00 20 40 20 40 60 min60 min
Eluent A Eluent B
Ligand : Glutathione
Sample : Glutathione S-transferase
- 23 -
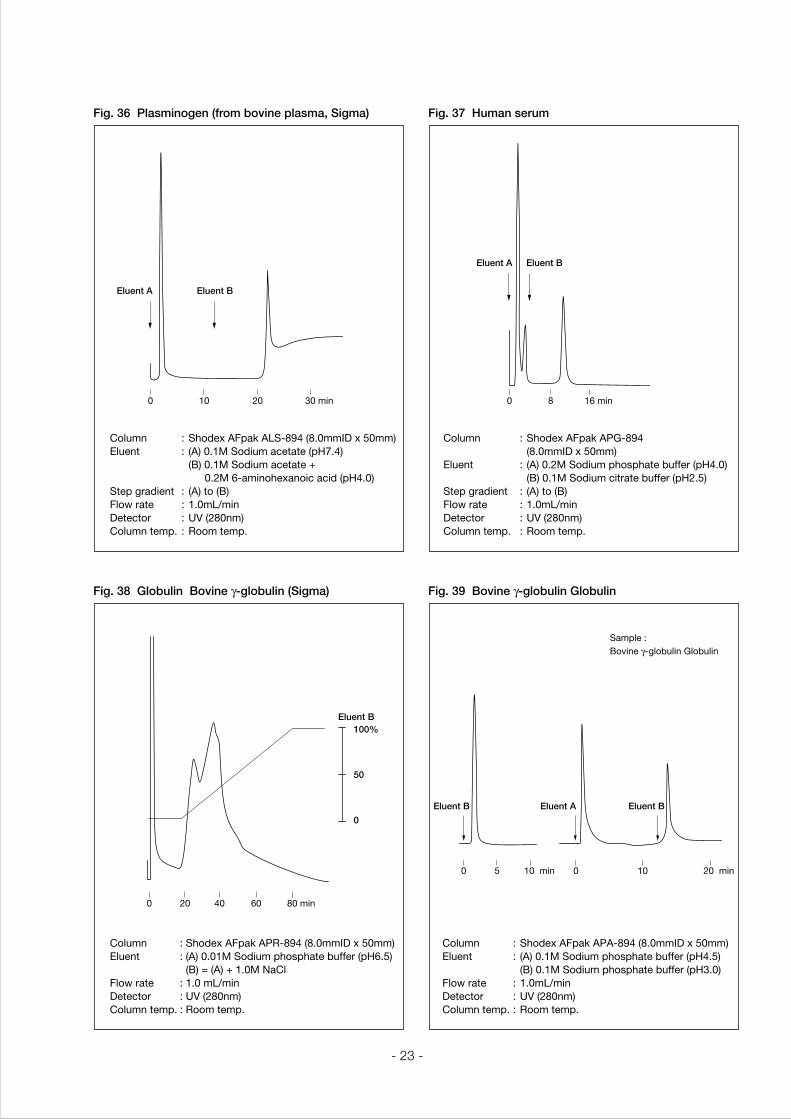
Fig. 36 Plasminogen (from bovine plasma, Sigma)
Column :Shodex AFpak ALS-894 (8.0mmID x 50mm)Eluent : (A) 0.1M Sodium acetate (pH7.4) (B) 0.1M Sodium acetate + 0.2M 6-aminohexanoic acid (pH4.0)Step gradient : (A) to (B)Flow rate :1.0mL/minDetector :UV (280nm)Column temp. :Room temp.
Column :Shodex AFpak APR-894 (8.0mmID x 50mm)Eluent :(A) 0.01M Sodium phosphate buffer (pH6.5) (B) = (A) + 1.0M NaClFlow rate :1.0 mL/minDetector :UV (280nm)Column temp.:Room temp.
Column :Shodex AFpak APA-894 (8.0mmID x 50mm)Eluent : (A) 0.1M Sodium phosphate buffer (pH4.5) (B) 0.1M Sodium phosphate buffer (pH3.0)Flow rate :1.0mL/minDetector :UV (280nm)Column temp.:Room temp.
Column :Shodex AFpak APG-894 (8.0mmID x 50mm)Eluent : (A) 0.2M Sodium phosphate buffer (pH4.0) (B) 0.1M Sodium citrate buffer (pH2.5)Step gradient : (A) to (B)Flow rate :1.0mL/minDetector :UV (280nm)Column temp. :Room temp.
Fig. 37 Human serum
Fig. 38 Globulin Bovine γ-globulin (Sigma) Fig. 39 Bovine γ-globulin Globulin
0 0 810 20 30 min 16 min
Eluent A Eluent B
Eluent BEluent A
Eluent B Eluent A Eluent B
0
0 5 10 min 0 10 20 min
20 40 60 80 min
Sample : Bovine γ-globulin Globulin
Eluent B100%
50
0
- 24 -
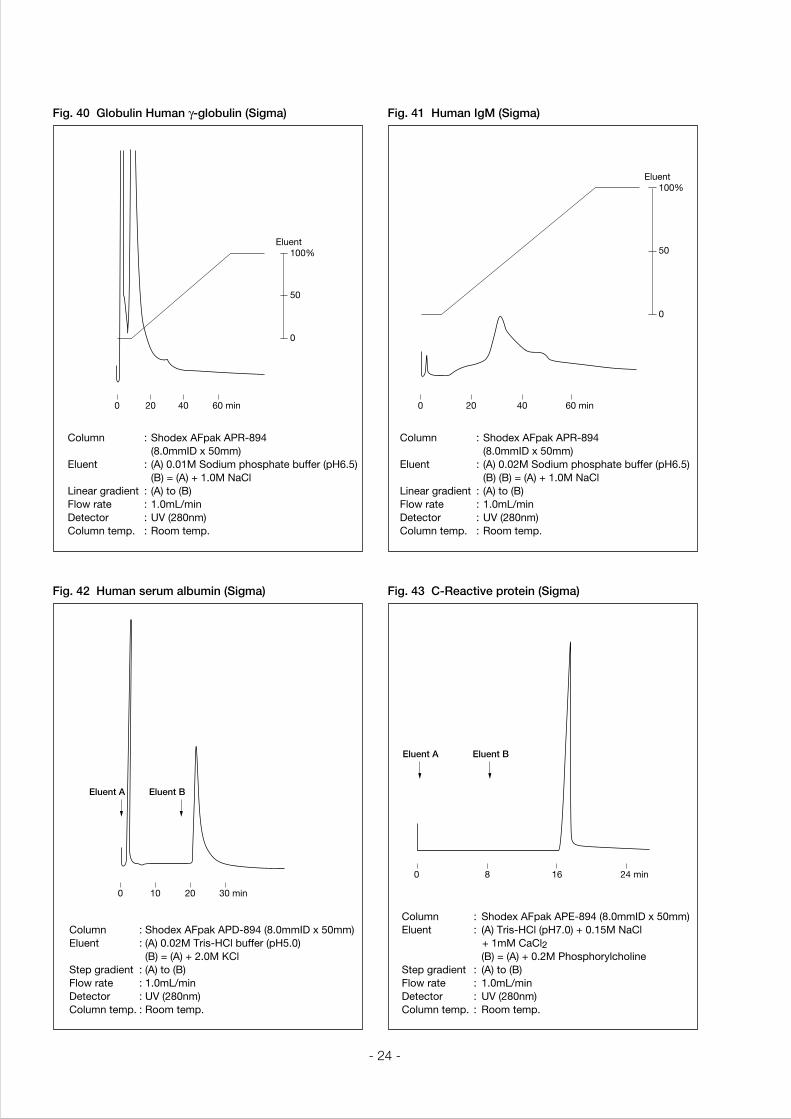
Fig. 40 Globulin Human γ-globulin (Sigma)
Column :Shodex AFpak APR-894 (8.0mmID x 50mm)Eluent : (A) 0.01M Sodium phosphate buffer (pH6.5) (B) = (A) + 1.0M NaClLinear gradient : (A) to (B)Flow rate :1.0mL/minDetector :UV (280nm)Column temp. :Room temp.
Column :Shodex AFpak APD-894 (8.0mmID x 50mm)Eluent :(A) 0.02M Tris-HCl buffer (pH5.0) (B) = (A) + 2.0M KClStep gradient :(A) to (B) Flow rate :1.0mL/minDetector :UV (280nm)Column temp.:Room temp.
Column : Shodex AFpak APE-894 (8.0mmID x 50mm)Eluent : (A) Tris-HCl (pH7.0) + 0.15M NaCl + 1mM CaCl2 (B) = (A) + 0.2M PhosphorylcholineStep gradient : (A) to (B) Flow rate : 1.0mL/minDetector : UV (280nm)Column temp. : Room temp.
Column :Shodex AFpak APR-894 (8.0mmID x 50mm)Eluent : (A) 0.02M Sodium phosphate buffer (pH6.5) (B) (B) = (A) + 1.0M NaClLinear gradient : (A) to (B)Flow rate :1.0mL/minDetector :UV (280nm)Column temp. :Room temp.
Fig. 41 Human IgM (Sigma)
Fig. 42 Human serum albumin (Sigma) Fig. 43 C-Reactive protein (Sigma)
0 20 40 60 min
0 10 20 30 min
0 20 40 60 min
0 8 16 24 min
Eluent100%
50
0
Eluent100%
50
0
Eluent A Eluent B
Eluent A Eluent B
- 25 -
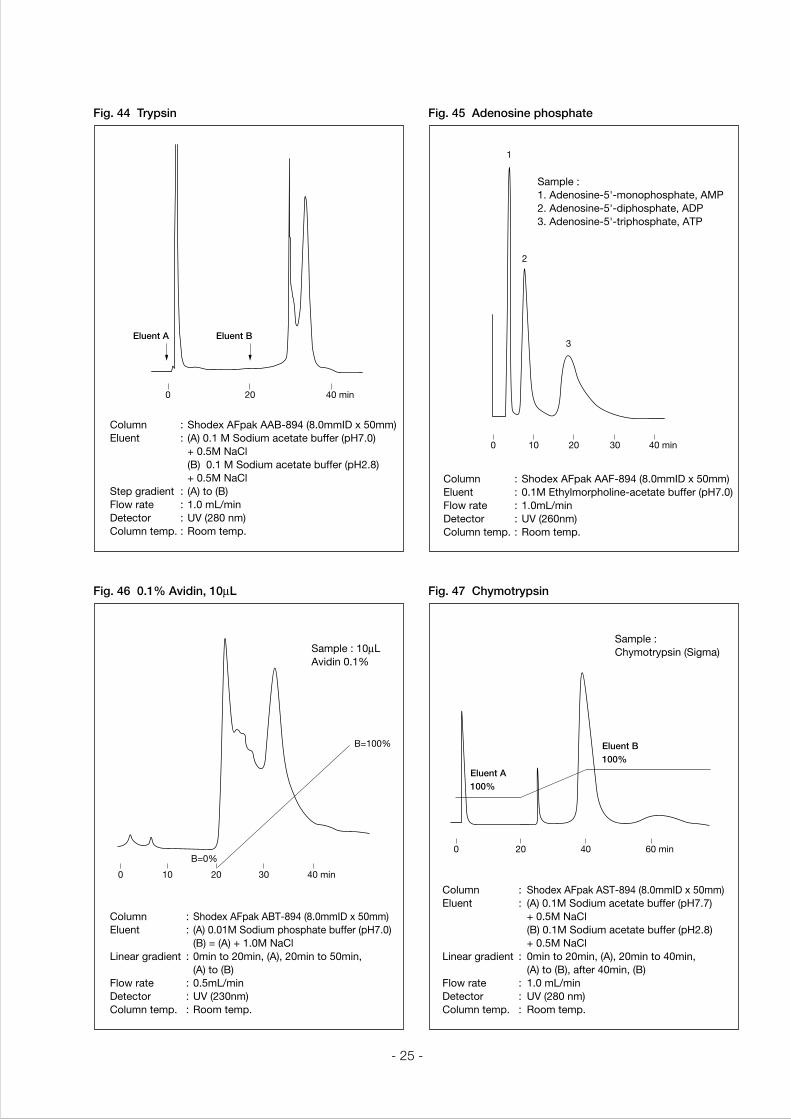
Fig. 44 Trypsin
Column :Shodex AFpak AAB-894 (8.0mmID x 50mm)Eluent : (A) 0.1 M Sodium acetate buffer (pH7.0) + 0.5M NaCl (B) 0.1 M Sodium acetate buffer (pH2.8) + 0.5M NaCl Step gradient : (A) to (B) Flow rate :1.0 mL/minDetector :UV (280 nm)Column temp.:Room temp.
Column :Shodex AFpak ABT-894 (8.0mmID x 50mm)Eluent : (A) 0.01M Sodium phosphate buffer (pH7.0) (B) = (A) + 1.0M NaClLinear gradient :0min to 20min, (A), 20min to 50min, (A) to (B)Flow rate :0.5mL/minDetector :UV (230nm)Column temp. :Room temp.
Column : Shodex AFpak AST-894 (8.0mmID x 50mm)Eluent : (A) 0.1M Sodium acetate buffer (pH7.7) + 0.5M NaCl (B) 0.1M Sodium acetate buffer (pH2.8) + 0.5M NaClLinear gradient : 0min to 20min, (A), 20min to 40min, (A) to (B), after 40min, (B) Flow rate : 1.0 mL/minDetector : UV (280 nm) Column temp. : Room temp.
Column :Shodex AFpak AAF-894 (8.0mmID x 50mm)Eluent :0.1M Ethylmorpholine-acetate buffer (pH7.0)Flow rate :1.0mL/minDetector :UV (260nm)Column temp.:Room temp.
Fig. 45 Adenosine phosphate
Fig. 46 0.1% Avidin, 10µL Fig. 47 Chymotrypsin
0 20 40 min
0
1
2
3
10 20 30 40 min
0 10 20 30 40 min
0 20 40 60 min
B=100%
Eluent A100%
Eluent B100%
B=0%
Eluent A Eluent B
Sample :1. Adenosine-5'-monophosphate, AMP2. Adenosine-5'-diphosphate, ADP3. Adenosine-5'-triphosphate, ATP
Sample : 10µLAvidin 0.1%
Sample :Chymotrypsin (Sigma)

- 26 -
Fig. 48 Lysozyme
Column :Shodex AFpak AGA-894 (8.0mmID x 50mm)Eluent : (A): 0.01M Tris-HCl buffer (pH7.5) + 0.01M NaCl (B) 0.01M Tris-HCl buffer (pH7.5) + 0.5M NaCl Step gradient : (A) to (B)Flow rate :0.5mL/minDetector :UV (280nm)Column temp. :Room temp.
Column :Shodex AFpak AGE-894 (8.0mmID x50mm)Eluent :(A) 50mM Tris-HCl buffer (pH7.4) + 0.01M NaCl (B) = (A) + 4M UreaStep gradient :(A) to (B)Flow rate :0.3mL/minDetector :UV (280nm)Column temp.:Room temp.
Column : Shodex AFpak AOV-894 (8.0mmID x 50mm)Eluent : (A) 0.1M Sodium acetate buffer (pH7.7) + 0.5M NaCl (B) 0.1M Sodium acetate buffer (pH2.8) + 0.5M NaClStep gradient : (A) to (B)Flow rate : 1.0mL/minDetector : UV (280nm)Column temp. : Room temp.
Column :Shodex AFpak AHR-894 (8.0mmID x 50mm)Eluent : (A) 0.01M Tris-HCl buffer (pH7.5) + 0.01M NaCl (B) 0.01M Tris-HCl buffer (pH7.5) + 0.3M NaClStep gradient : (A) to (B)Flow rate :1.0 mL/minDetector :UV (280nm)Column temp.:Room temp.
Fig. 49 Lysozyme
Fig. 50 Fibronectin Fig. 51 Trypsin (type I)
0 0 10 204 8 12 16 20 min 30 min
0 10 20 30 40 min
0 10 20 30 min
Eluent A
Eluent A
Eluent B
Eluent B
Sample : Lysozyme Sample : Lysozyme
Eluent A Eluent B
Eluent BEluent A
Sample : Fibronectin(Human plasma, Green Cross)
Sample : Trypsin type I Sigma

- 27 -
The Shodex AFpak (Column size : I.D. 8.0mm x L 50mm)
18
18
18
18
18
18
18
18
18
18
18
18
18
18
18
18
18
18
10
18
18
18
18
18
18
18
18
18
Aminobenzamidine
5'AMP
Aprotinin
Biotin
Concanavalin A (ConA)
Cibacron Blue
Dextran sulfate
Ethylenediamine diacetic acid
N-acetyl-glucosamine
Gelatin
Glutathione
Heparin
Iminodiacetic acid
Lentil lectin
Lysine (LCA)
NAD
Ovomucoid
Protein A
Aminophenyl boronic acid
Procion red
Phosphorylethanolamine
Protein G
Phenyl alanine
Proteamine
RCA-I
Soybean trypsin inhibitor
Wheat germ agglutinin (WGA)
Serine protease
NAD, ATP dependent enzymes
Serine proteases
Avidin
Glycoprotein, polysaccharides
Nucleic acids, serum proteins
Fibronectin
Enzymes related to glutathione
Interferon, serum proteins
Glycoproteins, polysaccharides
NAD-Dependent dehydrogenase
Trypsin-like protease
Human IgG, immune complexes
NAD, NADP, interferon enzymes
C-reactive protein, enzymes
IgG immune complex
Subtilisin Carlsberg
IgM
Glycoproteins, polysaccharides
Trypsin-like proteases
Glycoproteins, polysaccharides
Choline, acetylcholine
AAB-894
AAM-894
AAP-894
ABT-894
ACA-894
ACB-894
ADS-894
AED-894
AGA-894
AGE-894
AGT-894
AHR-894
AIA-894
ALC-894
ALS-894
ANA-894
AOV-894
APA-894
APB-894
APD-894
APE-894
APG-894
APH-894
APR-894
ARC-894
AST-894
AWG-894
ACH-494
100µmol
10µmol
5mg
—
15mg
40µmol
30mg
30µmol
—
30mg
50µmol
5mg
70µmol
6-7mg
—
10µmol
10mg
4mg
800µmol
40-60µmol
—
4-5mg
50µmol
4-5mg
20mg
20mg
14mg
—
—
Trypsin 3mg/g
Avidin 9mg/g
—
BSA 20mg/column
LDL 5mg/g
—
Lysozyme 0.6mg
Fibronectin 150mg/g
—
Lysozyme 4mg/column
BSA 70mg/column
—
Trypin 100mg/g
IgG Human 20mg/g
Sorbitol 0.2mg/column
BSA 72mg/g
IgG Humnan 10mg/g
—
Trypsin 100mg/g
—
—
ProductAFpak
Ligand Application Ligand load/gel(g)
Capacity Particle size(µm)
Lactic dehydronase1.5mg/g
Albumin, NDA dependent enzymes
Lipoproteins, blood coagulation factors
Lectins, carbohydrate metabolizing enzymes
Lipoproteins, blood coagulation factors
Plasminogen, plasminogenactivator, RNA, DNA
Lactic dehydronase1.4mg/g
Nucleic acids and cathecholamines
C-reactive protein0.91mg/g
Subtilisin Carlsberg 9mg/g
IgM Human1.9mg/column
Plasminogen 54µg/g
Choline oxydase, acetylcholine esterase
The following semi-micro and micro columns can be prepared.• Inner diameter : 2.0mm, 1.0mm, 0.8mm, 0.5mm, 0.3mm • Length : 50mm, 35mm
- 28 -
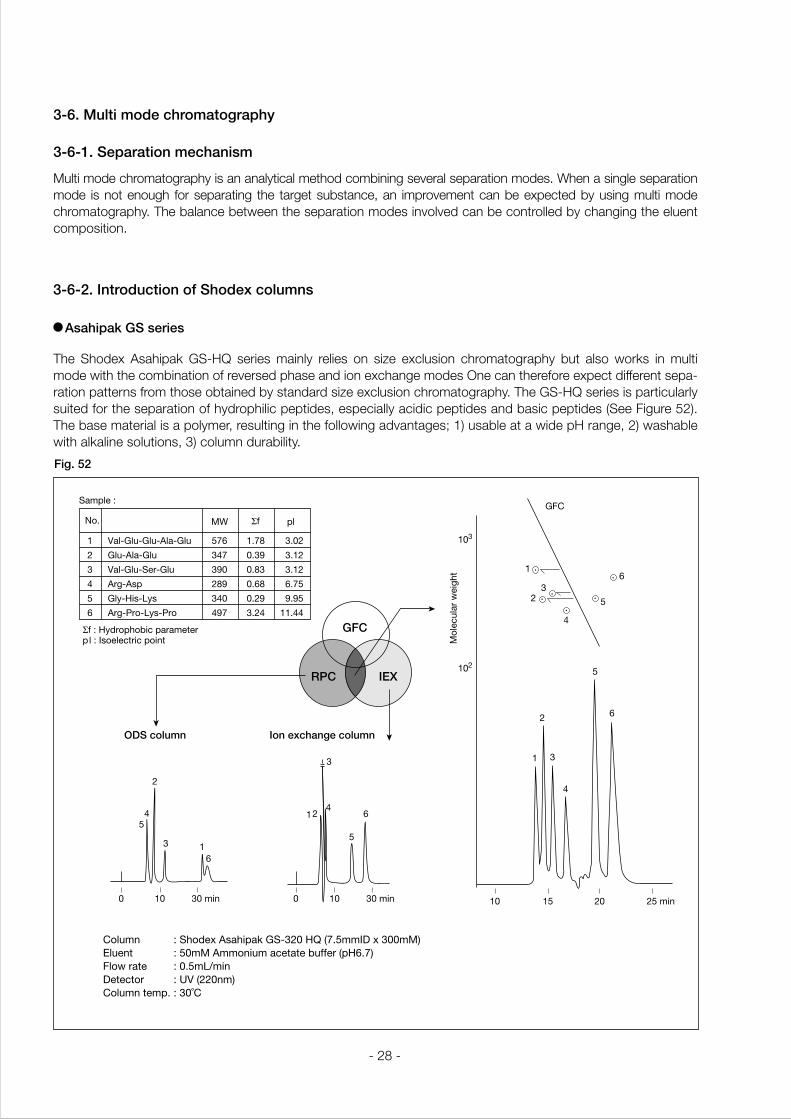
3-6. Multi mode chromatography
3-6-1. Separation mechanism
Multi mode chromatography is an analytical method combining several separation modes. When a single separation mode is not enough for separating the target substance, an improvement can be expected by using multi mode chromatography. The balance between the separation modes involved can be controlled by changing the eluent composition.
The Shodex Asahipak GS-HQ series mainly relies on size exclusion chromatography but also works in multi mode with the combination of reversed phase and ion exchange modes One can therefore expect different sepa-ration patterns from those obtained by standard size exclusion chromatography. The GS-HQ series is particularly suited for the separation of hydrophilic peptides, especially acidic peptides and basic peptides (See Figure 52). The base material is a polymer, resulting in the following advantages; 1) usable at a wide pH range, 2) washable with alkaline solutions, 3) column durability.
Asahipak GS series
3-6-2. Introduction of Shodex columns
Fig. 52
Column :Shodex Asahipak GS-320 HQ (7.5mmID x 300mM)Eluent :50mM Ammonium acetate buffer (pH6.7)Flow rate :0.5mL/minDetector :UV (220nm)Column temp.:30˚C
GFC
Mol
ecul
ar w
eigh
t
1
1
103
102
23
4
5
6
2
3
4
5
6
10 15 20 25 min
Σf : Hydrophobic parameterpl : Isoelectric point
pl�Σf
Val-Glu-Glu-Ala-Glu
Glu-Ala-Glu
Val-Glu-Ser-Glu
Arg-Asp
Gly-His-Lys
Arg-Pro-Lys-Pro
1.78
0.39
0.83
0.68
0.29
3.24
3.02
3.12
3.12
6.75
9.95
11.44
MW
576
347
390
289
340
497
1
2
3
4
5
6
No.
Sample :
0
55
44
2
2
3
3
1
1
6
6
10 30 min 0 10 30 min
RPC
ODS column Ion exchange column
IEX
GFC
- 29 -
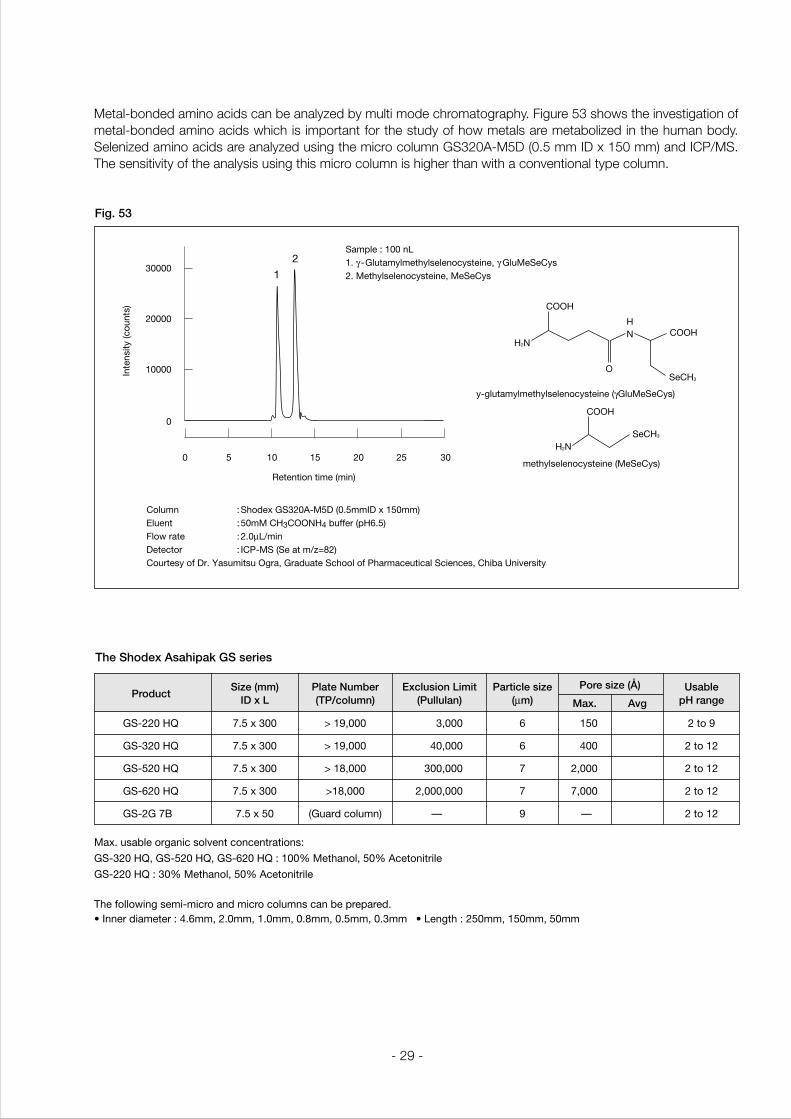
Metal-bonded amino acids can be analyzed by multi mode chromatography. Figure 53 shows the investigation of metal-bonded amino acids which is important for the study of how metals are metabolized in the human body. Selenized amino acids are analyzed using the micro column GS320A-M5D (0.5 mm ID x 150 mm) and ICP/MS. The sensitivity of the analysis using this micro column is higher than with a conventional type column.
The Shodex Asahipak GS series
GS-220 HQ
GS-320 HQ
GS-520 HQ
GS-620 HQ
GS-2G 7B
7.5 x 300
7.5 x 300
7.5 x 300
7.5 x 300
7.5 x 50
6
6
7
7
9
2 to 9
2 to 12
2 to 12
2 to 12
2 to 12
150
400
2,000
7,000
—
> 19,000
> 19,000
> 18,000
>18,000
(Guard column)
ProductSize (mm)
ID x LPlate Number(TP/column)
3,000
40,000
300,000
2,000,000
—
Exclusion Limit(Pullulan)
UsablepH range
Pore size (Å)
Max. Avg
Particle size(µm)
Fig. 53
Max. usable organic solvent concentrations:
GS-320 HQ, GS-520 HQ, GS-620 HQ : 100% Methanol, 50% Acetonitrile
GS-220 HQ : 30% Methanol, 50% Acetonitrile
Column :Shodex GS320A-M5D (0.5mmID x 150mm)Eluent :50mM CH3COONH4 buffer (pH6.5)Flow rate :2.0µL/minDetector :ICP-MS (Se at m/z=82)Courtesy of Dr. Yasumitsu Ogra, Graduate School of Pharmaceutical Sciences, Chiba University
Sample : 100 nL1. γ-Glutamylmethylselenocysteine, γ GluMeSeCys2. Methylselenocysteine, MeSeCys1
0
0
10000
20000
30000
5 10 15 20 25 30
2
Retention time (min)
Inte
nsity
(cou
nts) COOH
y-glutamylmethylselenocysteine (γGluMeSeCys)
COOH
HN COOH
OSeCH3
SeCH3
H2N
H2N
methylselenocysteine (MeSeCys)
The following semi-micro and micro columns can be prepared.• Inner diameter : 4.6mm, 2.0mm, 1.0mm, 0.8mm, 0.5mm, 0.3mm • Length : 250mm, 150mm, 50mm

TNE.No.07E.(1)09.1500.APR.TR
Welcome tohttp://www.shodex.com/
Shodex provides information of new products and new analysis technologies by e-mail.
If you are interested in receiving newsletters by email, please join our "Chromato Mail" newsletter list,
through our website.
If you have any question regarding this technical notebook, we welcome your questions through the
website below.
http://www.shodex.com/english/toiawase.html
Manufactured by
Shodex (Separation & HPLC) Group5-1, Ogimachi, Kawasaki-ku, Kawasaki, Kanagawa 210-0867 JAPANTEL: +81-44-329-0733 FAX: +81-44-329-0794
Shodex Sales offices(NORTH AMERICA)Shodex / Showa Denko America, Inc.
420 Lexington Avenue, suite 2850, NY 10170 USA Tel : +1-212-370-0033 Fax : +1-212-370-4566 email : [email protected]
(EUROPE)Shodex / Showa Denko Europe GmbH
Konrad-Zuse-Platz 4 D-81829 Munich, GermanyTel : +49-(0)89-93996236 Fax : +49-(0)89-9399627734 email : [email protected]
(ASIA & PACIFIC)Shodex / Shoko Co., LTD.
4-1, Shibakohen 2-chome, Minato-ku, Tokyo, 105-8432, JapanTel : +81-(0)3-3459-5104 Fax : +81-(0)3-3459-5081 e-mail : [email protected]