proteomic analysisof human brown adipose tissue r eveals ... fileproteomic analysisof human brown...
TRANSCRIPT
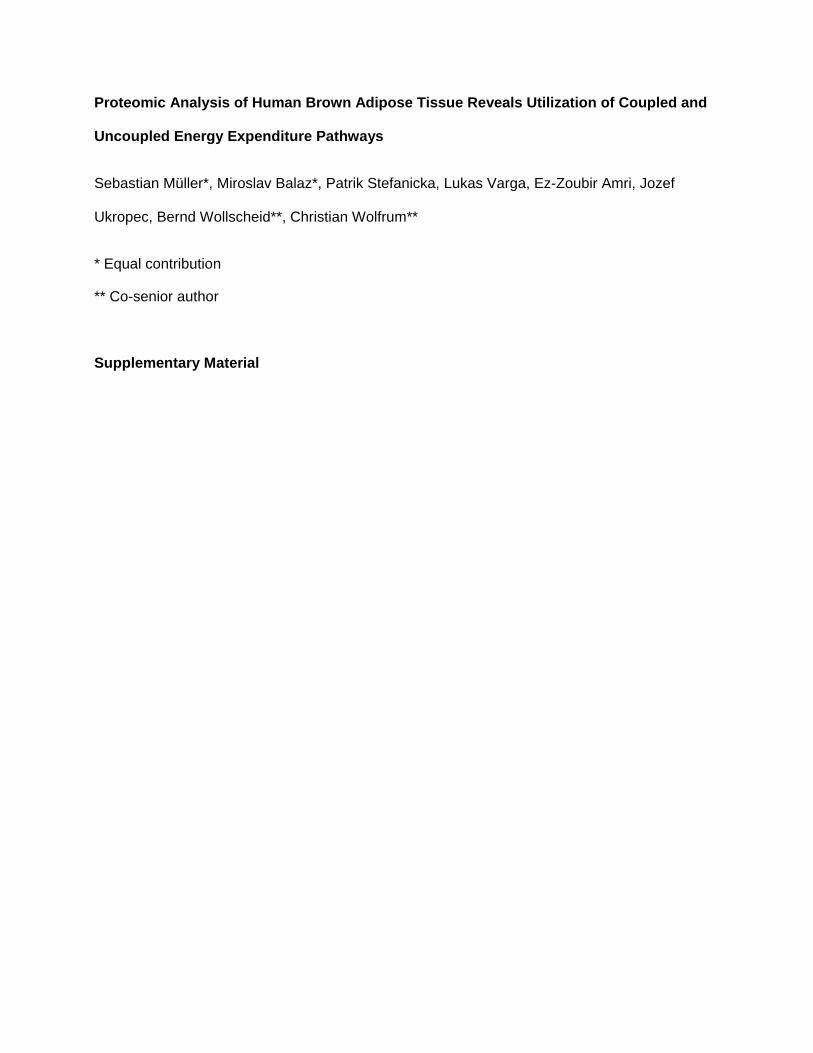
Proteomic Analysis of Human Brown Adipose Tissue Reveals Utilization of Coupled and
Uncoupled Energy Expenditure Pathways
Sebastian Müller*, Miroslav Balaz*, Patrik Stefanicka, Lukas Varga, Ez-Zoubir Amri, Jozef
Ukropec, Bernd Wollscheid**, Christian Wolfrum**
* Equal contribution
** Co-senior author
Supplementary Material
a) Albumin p=n.s.
1 2 3 4 5 6 7 8patient ID
106
105
104repo
rter i
on in
tens
ity
(a.u
.)
Transferrin p=n.s.
1 2 3 4 5 6 7 8patient ID
105
104
103
ApoB100 p=n.s.
1 2 3 4 5 6 7 8patient ID
105
104
103
Hemoglobin beta p=n.s.
1 2 3 4 5 6 7 8patient ID
106
105
104repo
rter i
on in
tens
ity
(a.u
.)
b)Spectrin beta, ery p=n.s.
1 2 3 4 5 6 7 8patient ID
105
104
103
Spectrin alpha, ery p=n.s.105
104
1031 2 3 4 5 6 7 8
patient ID
SATBAT
SATBAT
Actin p=n.s.105
104
1031 2 3 4 5 6 7 8
patient ID
c)
1 2 3 4 5 6 7 8patient ID
Tubulin alpha p=n.s.105
104
103
104
103
102
Tubulin beta p=n.s.
1 2 3 4 5 6 7 8patient ID
HSP90 alpha p=n.s.105
104
1031 2 3 4 5 6 7 8
patient ID
104
103
1021 2 3 4 5 6 7 8
patient ID
RPLP0 p=n.s.
SATBAT
repo
rter i
on in
tens
ity
(a.u
.)re
porte
r ion
inte
nsity
(a
.u.)
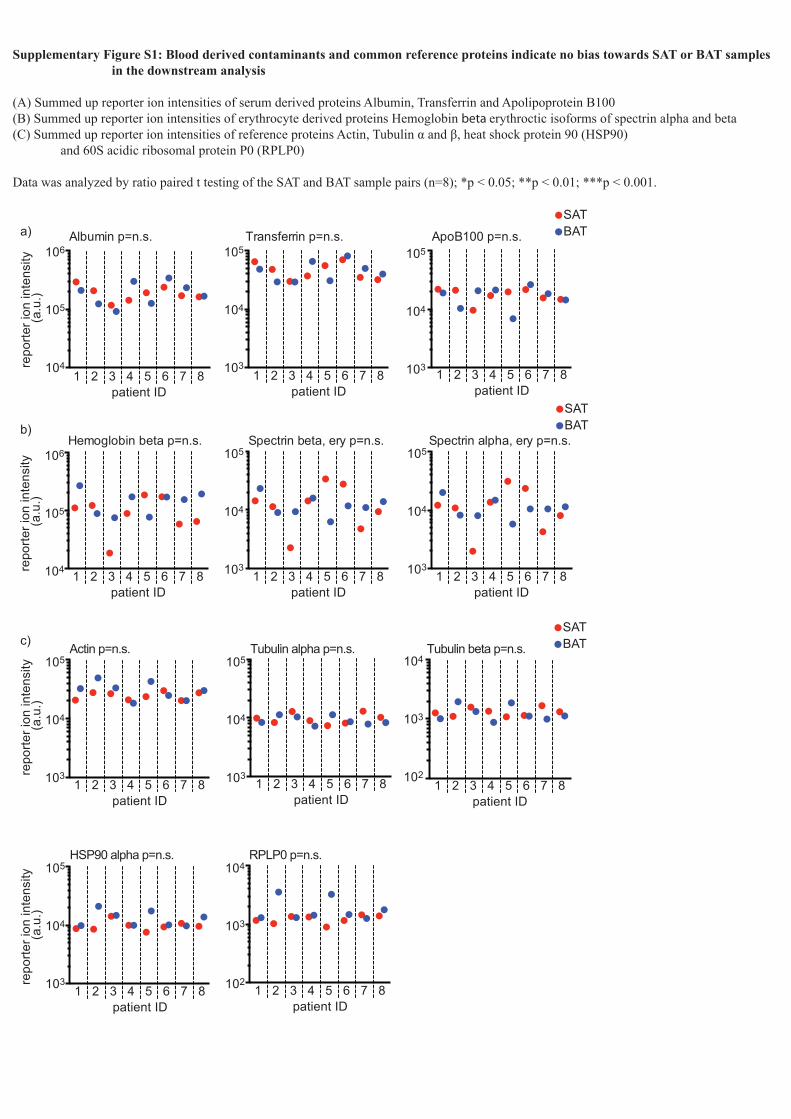
Supplementary Figure S1: Blood derived contaminants and common reference proteins indicate no bias towards SAT or BAT samples in the downstream analysis
(A) Summed up reporter ion intensities of serum derived proteins Albumin, Transferrin and Apolipoprotein B100(B) Summed up reporter ion intensities of erythrocyte derived proteins Hemoglobin beta erythroctic isoforms of spectrin alpha and beta(C) Summed up reporter ion intensities of reference proteins Actin, Tubulin α and β, heat shock protein 90 (HSP90) and 60S acidic ribosomal protein P0 (RPLP0)
Data was analyzed by ratio paired t testing of the SAT and BAT sample pairs (n=8); *p < 0.05; **p < 0.01; ***p < 0.001.
Glycine & Arginine Ornithine
Guanidinioacetat L-Glut-s.ald
Creatine
Creatine-P
Glutamate
Proline
Hydroxy-Proline
ARG
OAT
ALDH18H P4HA2
PYCR
GATM
GAMT
CKMT1/2
CKB
a)
b)
104
103
1021 2 3 4 5 6 7 8
patient ID
SATBAT
Arginase-1 ***p<0.001
repo
rter i
on in
tens
ity
(a.u
.)
1 2 3 4 5 6 7 8patient ID
103
102
101
OAT p=n.s.
1 2 3 4 5 6 7 8patient ID
103
102
101
ALDH18A1 p=n.s.
1000100
101
0.10.01
0.001
repo
rter i
on in
tens
ity
(a.u
.)
1 2 3 4 5 6 7 8patient ID
P4AH2 p=n.s. CKB p=n.s.
1 2 3 4 5 6 7 8patient ID
104
103
102
Creatine
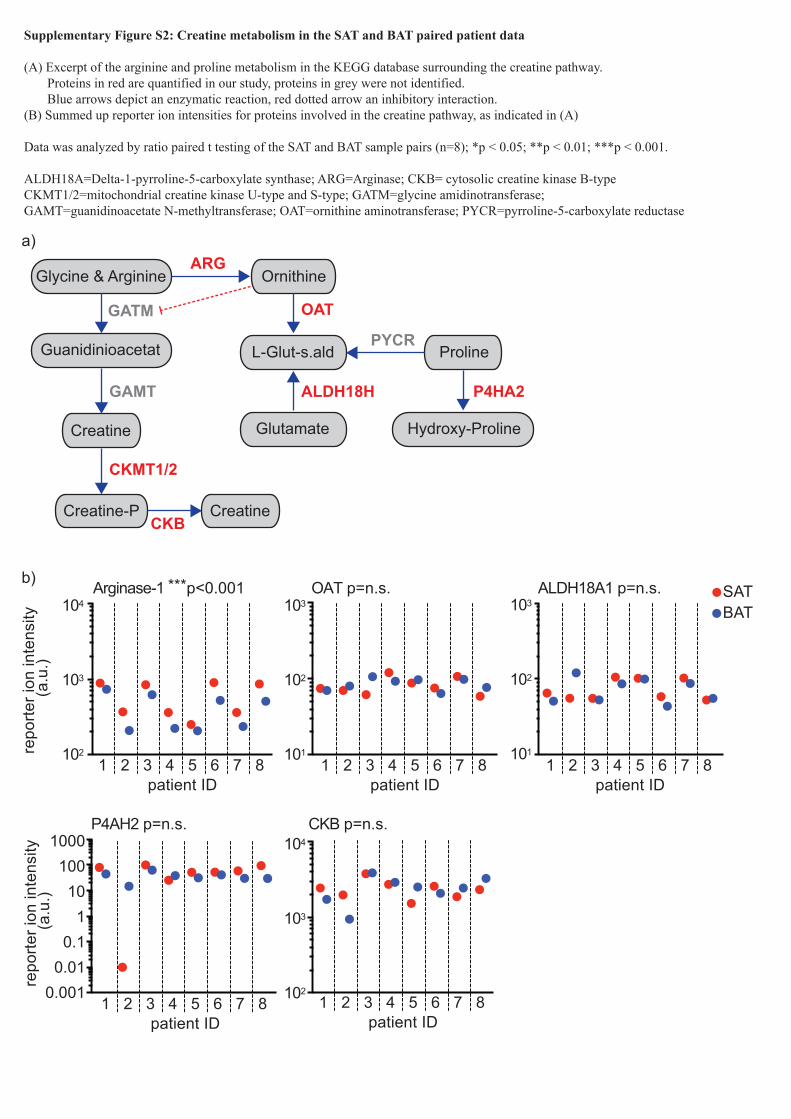
Supplementary Figure S2: Creatine metabolism in the SAT and BAT paired patient data
(A) Excerpt of the arginine and proline metabolism in the KEGG database surrounding the creatine pathway. Proteins in red are quantified in our study, proteins in grey were not identified. Blue arrows depict an enzymatic reaction, red dotted arrow an inhibitory interaction.(B) Summed up reporter ion intensities for proteins involved in the creatine pathway, as indicated in (A)
Data was analyzed by ratio paired t testing of the SAT and BAT sample pairs (n=8); *p < 0.05; **p < 0.01; ***p < 0.001.
ALDH18A=Delta-1-pyrroline-5-carboxylate synthase; ARG=Arginase; CKB= cytosolic creatine kinase B-type CKMT1/2=mitochondrial creatine kinase U-type and S-type; GATM=glycine amidinotransferase; GAMT=guanidinoacetate N-methyltransferase; OAT=ornithine aminotransferase; PYCR=pyrroline-5-carboxylate reductase
a)Patient ID
1 2 3 4 5 6 7 8
- 2 0 5
fold change (log2) BAT/SAT
brown/white
hMADS
UCP1
SATBATbrown
220
215
210
25
20 1 2 3 4 5 6 7 8 1 2
patient ID hMADS
repo
rter i
on in
tens
ity (a
.u.)
b)
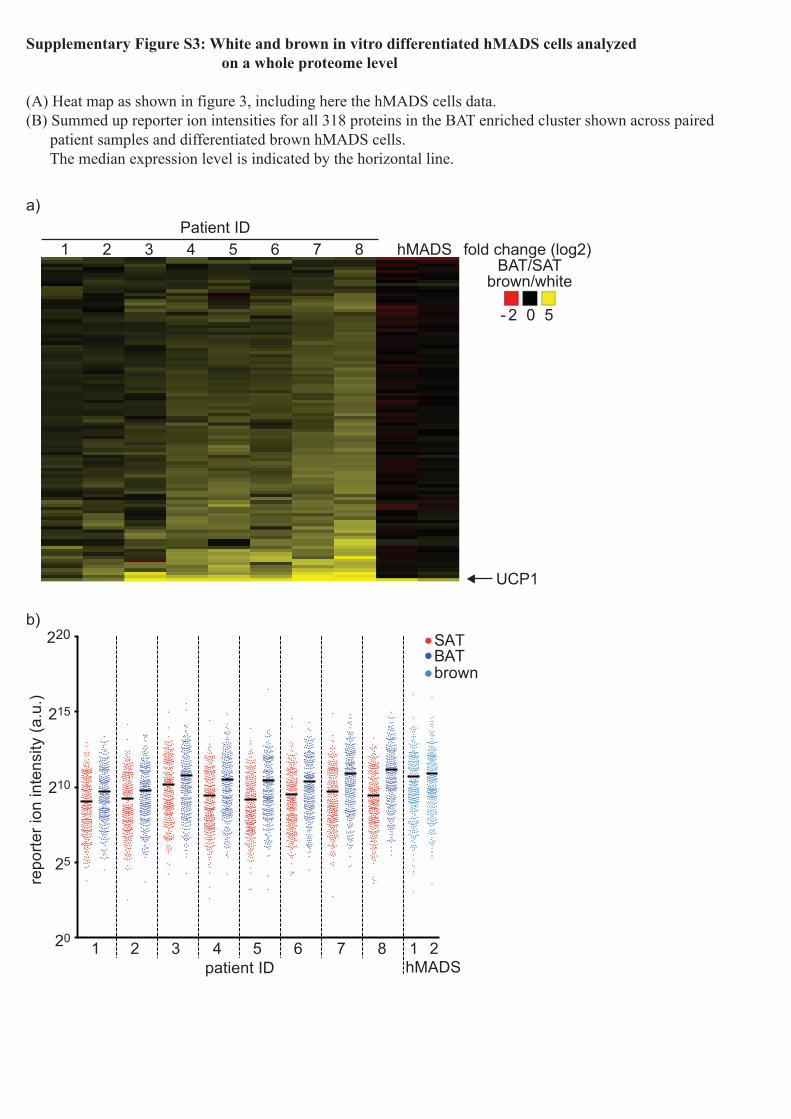
Supplementary Figure S3: White and brown in vitro differentiated hMADS cells analyzed on a whole proteome level
(A) Heat map as shown in figure 3, including here the hMADS cells data.(B) Summed up reporter ion intensities for all 318 proteins in the BAT enriched cluster shown across paired patient samples and differentiated brown hMADS cells. The median expression level is indicated by the horizontal line.
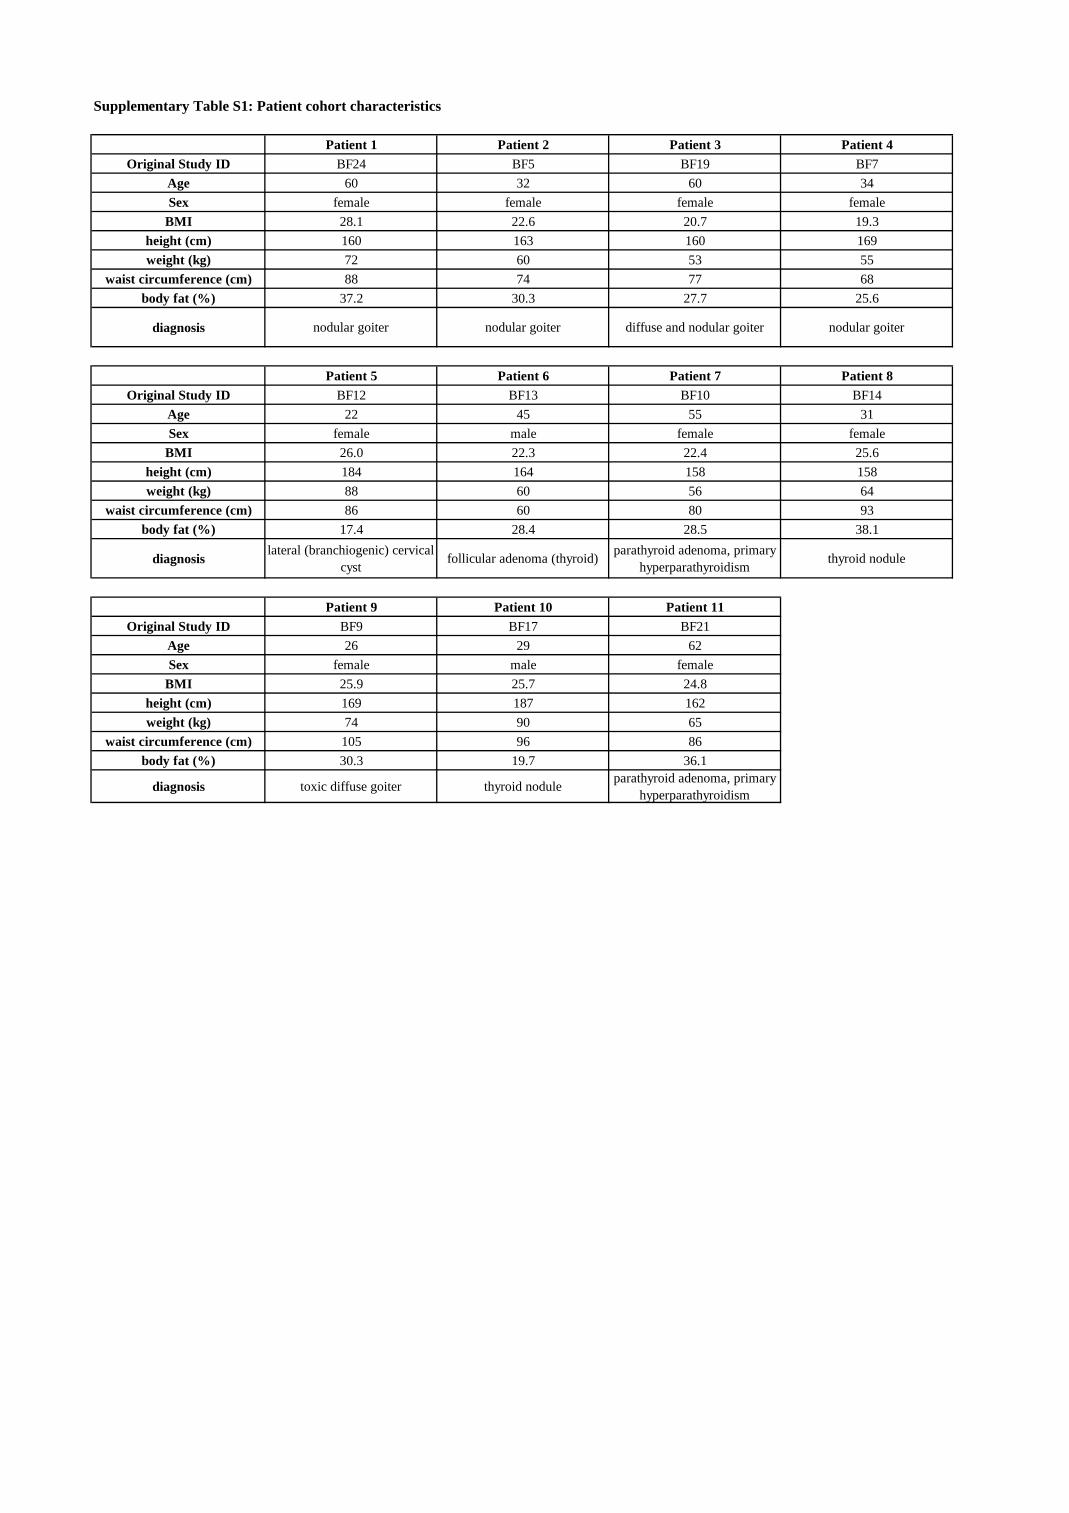
Supplementary Table S1: Patient cohort characteristics
Patient 1 Patient 2 Patient 3 Patient 4Original Study ID BF24 BF5 BF19 BF7
Age 60 32 60 34Sex female female female female
BMI 28.1 22.6 20.7 19.3height (cm) 160 163 160 169weight (kg) 72 60 53 55
waist circumference (cm) 88 74 77 68body fat (%) 37.2 30.3 27.7 25.6
diagnosis nodular goiter nodular goiter diffuse and nodular goiter nodular goiter
Patient 5 Patient 6 Patient 7 Patient 8Original Study ID BF12 BF13 BF10 BF14
Age 22 45 55 31Sex female male female female
BMI 26.0 22.3 22.4 25.6height (cm) 184 164 158 158weight (kg) 88 60 56 64
waist circumference (cm) 86 60 80 93body fat (%) 17.4 28.4 28.5 38.1
diagnosis lateral (branchiogenic) cervical cyst follicular adenoma (thyroid) parathyroid adenoma, primary
hyperparathyroidism thyroid nodule
Patient 9 Patient 10 Patient 11Original Study ID BF9 BF17 BF21
Age 26 29 62Sex female male female
BMI 25.9 25.7 24.8height (cm) 169 187 162weight (kg) 74 90 65
waist circumference (cm) 105 96 86body fat (%) 30.3 19.7 36.1
diagnosis toxic diffuse goiter thyroid nodule parathyroid adenoma, primary hyperparathyroidism

Supplementary Table S2: Results of the proteomic study Identifications: Listed are all proteins identified with high confidence
Quantification: Listed are all proteins consistently quantified with the summed up TMT reporter ion intensities reported
HumanBAT enriched cluster: Listed are all proteins in the human BAT enriched cluster
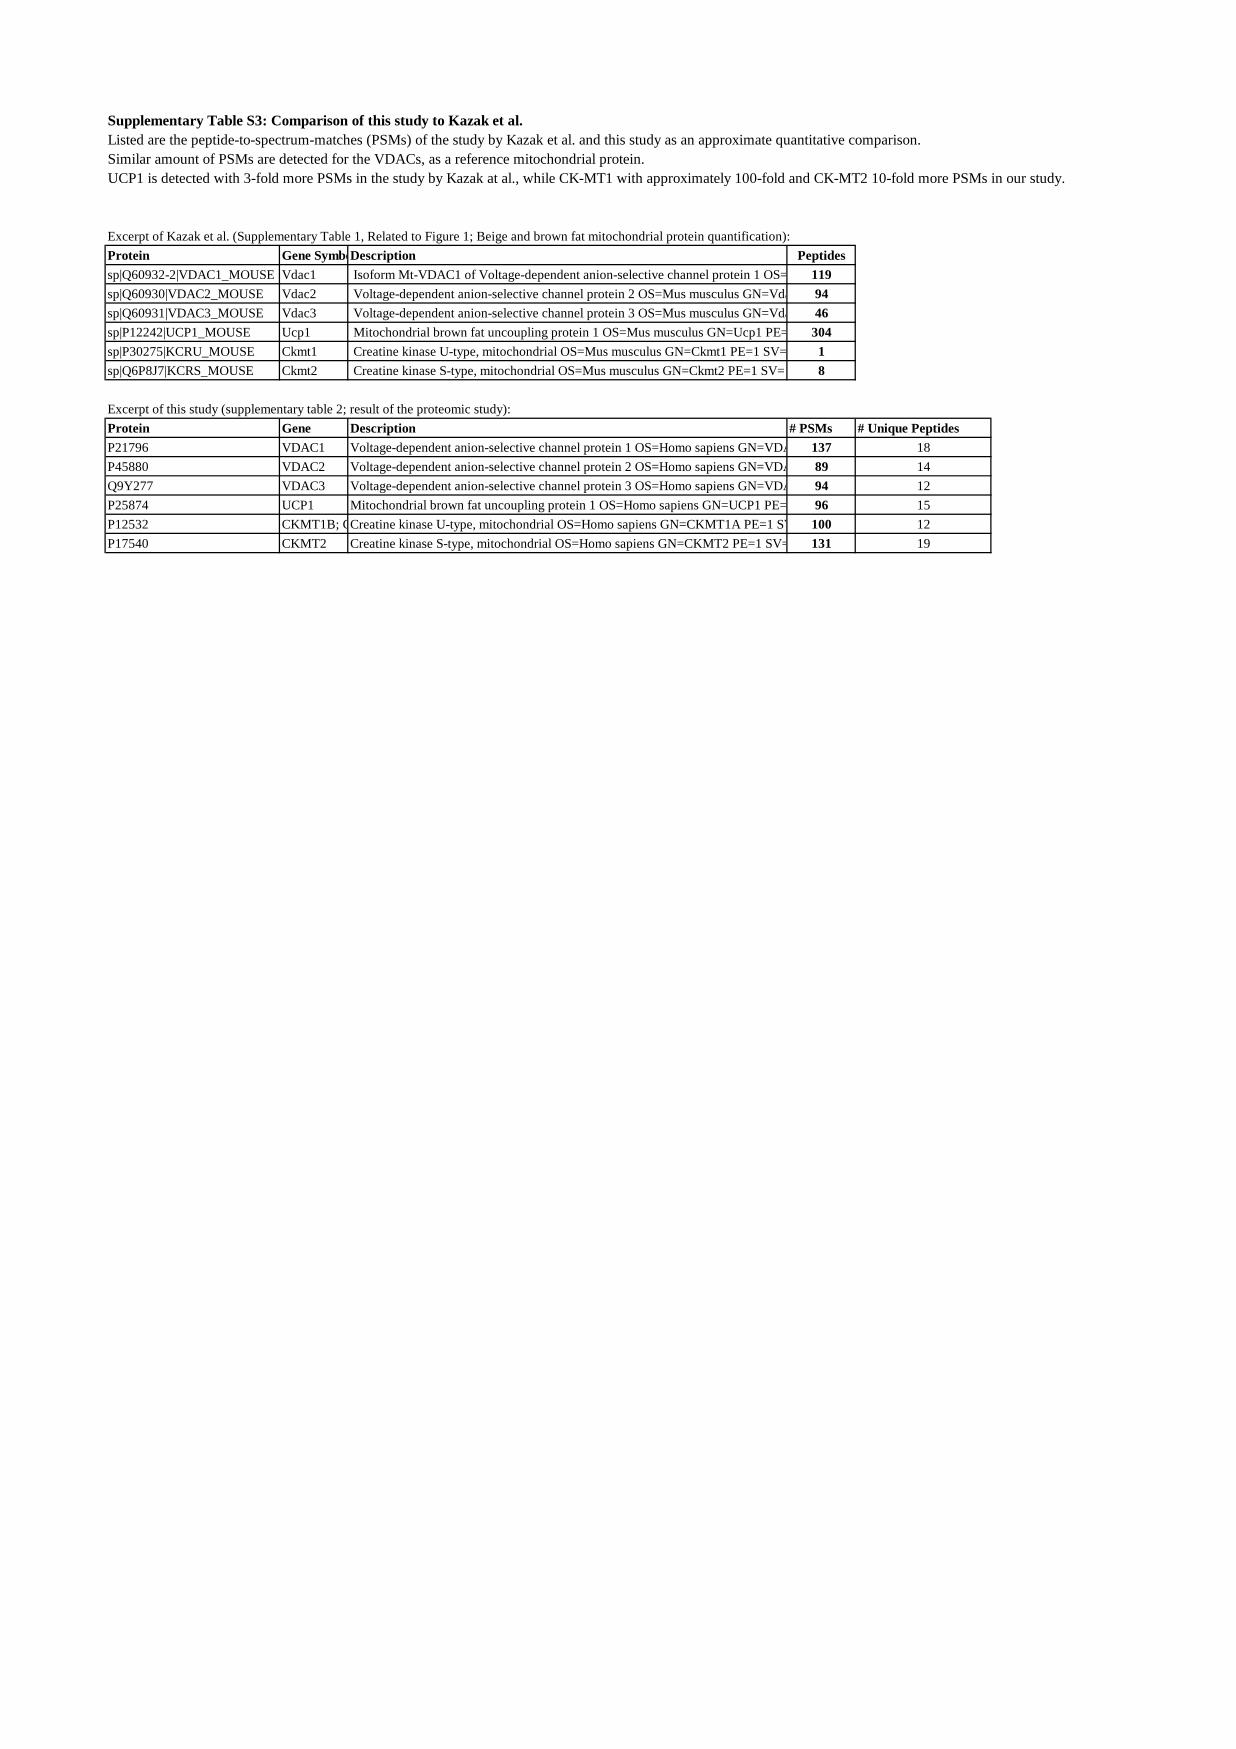
Supplementary Table S3: Comparison of this study to Kazak et al.Listed are the peptide-to-spectrum-matches (PSMs) of the study by Kazak et al. and this study as an approximate quantitative comparison.Similar amount of PSMs are detected for the VDACs, as a reference mitochondrial protein.UCP1 is detected with 3-fold more PSMs in the study by Kazak at al., while CK-MT1 with approximately 100-fold and CK-MT2 10-fold more PSMs in our study.
Excerpt of Kazak et al. (Supplementary Table 1, Related to Figure 1; Beige and brown fat mitochondrial protein quantification):Protein Gene SymboDescription Peptidessp|Q60932-2|VDAC1_MOUSE Vdac1 Isoform Mt-VDAC1 of Voltage-dependent anion-selective channel protein 1 OS= 119sp|Q60930|VDAC2_MOUSE Vdac2 Voltage-dependent anion-selective channel protein 2 OS=Mus musculus GN=Vda 94sp|Q60931|VDAC3_MOUSE Vdac3 Voltage-dependent anion-selective channel protein 3 OS=Mus musculus GN=Vda 46sp|P12242|UCP1_MOUSE Ucp1 Mitochondrial brown fat uncoupling protein 1 OS=Mus musculus GN=Ucp1 PE= 304sp|P30275|KCRU_MOUSE Ckmt1 Creatine kinase U-type, mitochondrial OS=Mus musculus GN=Ckmt1 PE=1 SV= 1sp|Q6P8J7|KCRS_MOUSE Ckmt2 Creatine kinase S-type, mitochondrial OS=Mus musculus GN=Ckmt2 PE=1 SV= 8
Excerpt of this study (supplementary table 2; result of the proteomic study):Protein Gene Description # PSMs # Unique PeptidesP21796 VDAC1 Voltage-dependent anion-selective channel protein 1 OS=Homo sapiens GN=VDA 137 18P45880 VDAC2 Voltage-dependent anion-selective channel protein 2 OS=Homo sapiens GN=VDA 89 14Q9Y277 VDAC3 Voltage-dependent anion-selective channel protein 3 OS=Homo sapiens GN=VDA 94 12P25874 UCP1 Mitochondrial brown fat uncoupling protein 1 OS=Homo sapiens GN=UCP1 PE= 96 15P12532 CKMT1B; CCreatine kinase U-type, mitochondrial OS=Homo sapiens GN=CKMT1A PE=1 SV 100 12P17540 CKMT2 Creatine kinase S-type, mitochondrial OS=Homo sapiens GN=CKMT2 PE=1 SV= 131 19
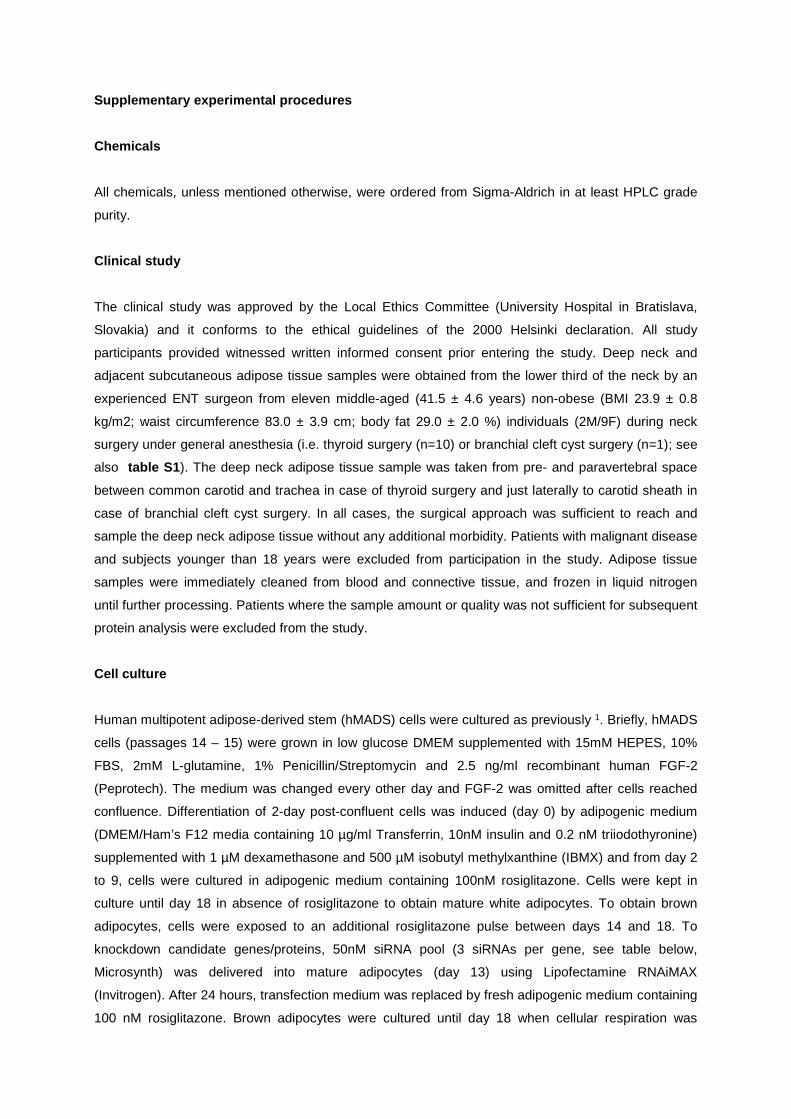
Supplementary experimental procedures Chemicals
All chemicals, unless mentioned otherwise, were ordered from Sigma-Aldrich in at least HPLC grade
purity.
Clinical study
The clinical study was approved by the Local Ethics Committee (University Hospital in Bratislava,
Slovakia) and it conforms to the ethical guidelines of the 2000 Helsinki declaration. All study
participants provided witnessed written informed consent prior entering the study. Deep neck and
adjacent subcutaneous adipose tissue samples were obtained from the lower third of the neck by an
experienced ENT surgeon from eleven middle-aged (41.5 ± 4.6 years) non-obese (BMI 23.9 ± 0.8
kg/m2; waist circumference 83.0 ± 3.9 cm; body fat 29.0 ± 2.0 %) individuals (2M/9F) during neck
surgery under general anesthesia (i.e. thyroid surgery (n=10) or branchial cleft cyst surgery (n=1); see
also table S1). The deep neck adipose tissue sample was taken from pre- and paravertebral space
between common carotid and trachea in case of thyroid surgery and just laterally to carotid sheath in
case of branchial cleft cyst surgery. In all cases, the surgical approach was sufficient to reach and
sample the deep neck adipose tissue without any additional morbidity. Patients with malignant disease
and subjects younger than 18 years were excluded from participation in the study. Adipose tissue
samples were immediately cleaned from blood and connective tissue, and frozen in liquid nitrogen
until further processing. Patients where the sample amount or quality was not sufficient for subsequent
protein analysis were excluded from the study.
Cell culture
Human multipotent adipose-derived stem (hMADS) cells were cultured as previously 1. Briefly, hMADS
cells (passages 14 – 15) were grown in low glucose DMEM supplemented with 15mM HEPES, 10%
FBS, 2mM L-glutamine, 1% Penicillin/Streptomycin and 2.5 ng/ml recombinant human FGF-2
(Peprotech). The medium was changed every other day and FGF-2 was omitted after cells reached
confluence. Differentiation of 2-day post-confluent cells was induced (day 0) by adipogenic medium
(DMEM/Ham’s F12 media containing 10 µg/ml Transferrin, 10nM insulin and 0.2 nM triiodothyronine)
supplemented with 1 µM dexamethasone and 500 µM isobutyl methylxanthine (IBMX) and from day 2
to 9, cells were cultured in adipogenic medium containing 100nM rosiglitazone. Cells were kept in
culture until day 18 in absence of rosiglitazone to obtain mature white adipocytes. To obtain brown
adipocytes, cells were exposed to an additional rosiglitazone pulse between days 14 and 18. To
knockdown candidate genes/proteins, 50nM siRNA pool (3 siRNAs per gene, see table below,
Microsynth) was delivered into mature adipocytes (day 13) using Lipofectamine RNAiMAX
(Invitrogen). After 24 hours, transfection medium was replaced by fresh adipogenic medium containing
100 nM rosiglitazone. Brown adipocytes were cultured until day 18 when cellular respiration was
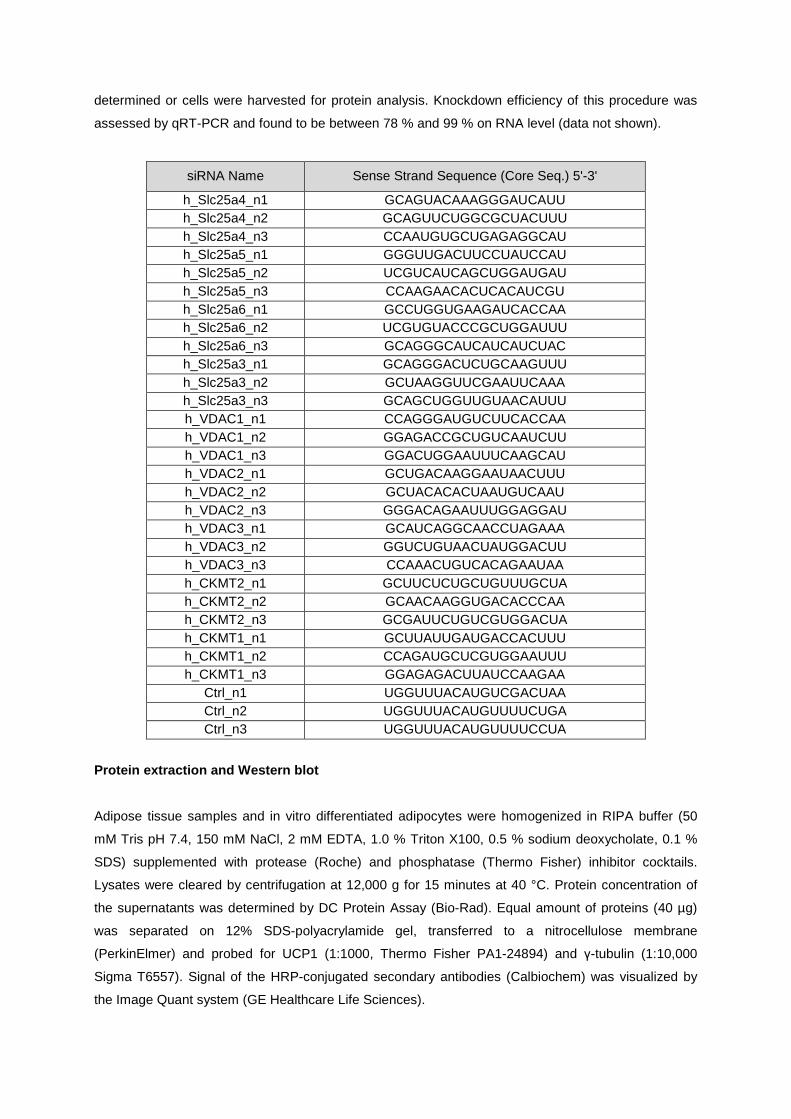
determined or cells were harvested for protein analysis. Knockdown efficiency of this procedure was
assessed by qRT-PCR and found to be between 78 % and 99 % on RNA level (data not shown).
siRNA Name Sense Strand Sequence (Core Seq.) 5'-3'
h_Slc25a4_n1 GCAGUACAAAGGGAUCAUU h_Slc25a4_n2 GCAGUUCUGGCGCUACUUU h_Slc25a4_n3 CCAAUGUGCUGAGAGGCAU h_Slc25a5_n1 GGGUUGACUUCCUAUCCAU h_Slc25a5_n2 UCGUCAUCAGCUGGAUGAU h_Slc25a5_n3 CCAAGAACACUCACAUCGU h_Slc25a6_n1 GCCUGGUGAAGAUCACCAA h_Slc25a6_n2 UCGUGUACCCGCUGGAUUU h_Slc25a6_n3 GCAGGGCAUCAUCAUCUAC h_Slc25a3_n1 GCAGGGACUCUGCAAGUUU h_Slc25a3_n2 GCUAAGGUUCGAAUUCAAA h_Slc25a3_n3 GCAGCUGGUUGUAACAUUU h_VDAC1_n1 CCAGGGAUGUCUUCACCAA h_VDAC1_n2 GGAGACCGCUGUCAAUCUU h_VDAC1_n3 GGACUGGAAUUUCAAGCAU h_VDAC2_n1 GCUGACAAGGAAUAACUUU h_VDAC2_n2 GCUACACACUAAUGUCAAU h_VDAC2_n3 GGGACAGAAUUUGGAGGAU h_VDAC3_n1 GCAUCAGGCAACCUAGAAA h_VDAC3_n2 GGUCUGUAACUAUGGACUU h_VDAC3_n3 CCAAACUGUCACAGAAUAA h_CKMT2_n1 GCUUCUCUGCUGUUUGCUA h_CKMT2_n2 GCAACAAGGUGACACCCAA h_CKMT2_n3 GCGAUUCUGUCGUGGACUA h_CKMT1_n1 GCUUAUUGAUGACCACUUU h_CKMT1_n2 CCAGAUGCUCGUGGAAUUU h_CKMT1_n3 GGAGAGACUUAUCCAAGAA
Ctrl_n1 UGGUUUACAUGUCGACUAA Ctrl_n2 UGGUUUACAUGUUUUCUGA Ctrl_n3 UGGUUUACAUGUUUUCCUA
Protein extraction and Western blot
Adipose tissue samples and in vitro differentiated adipocytes were homogenized in RIPA buffer (50
mM Tris pH 7.4, 150 mM NaCl, 2 mM EDTA, 1.0 % Triton X100, 0.5 % sodium deoxycholate, 0.1 %
SDS) supplemented with protease (Roche) and phosphatase (Thermo Fisher) inhibitor cocktails.
Lysates were cleared by centrifugation at 12,000 g for 15 minutes at 40 °C. Protein concentration of
the supernatants was determined by DC Protein Assay (Bio-Rad). Equal amount of proteins (40 µg)
was separated on 12% SDS-polyacrylamide gel, transferred to a nitrocellulose membrane
(PerkinElmer) and probed for UCP1 (1:1000, Thermo Fisher PA1-24894) and γ-tubulin (1:10,000
Sigma T6557). Signal of the HRP-conjugated secondary antibodies (Calbiochem) was visualized by
the Image Quant system (GE Healthcare Life Sciences).
TMT labeling TMT labeling was performed with the TMT10plex Isobaric Mass Tag Labeling Kit (Thermo Scientific,
Lot number QD212963) according to the manufacturer’s instructions. In detail, 40 µg of each adipose
tissue protein extract were reduced with 10 mM Tris(2-carboxyethyl)phosphine (TCEP) at 55 °C for 60
min. Next, samples were alkylated with 20 mM Iodoacetamide at 24 °C for 30 minutes in the dark,
before being precipitated by chloroform/methanol and washed with ice-cold methanol. Samples were
re-solubilized in 100 mM triethyl ammonium bicarbonate (TEAB, Thermo Scientific), protein
concentrations were determined with the Pierce BCA assay (Thermo Scientific) and protein amounts
between the paired SAT and BAT samples readjusted to equal amounts. Proteins were digested with
sequencing grade Trypsin (Promega) at a ratio of 1:40 (weight/weight) for 16 hours at 37 °C. The TMT
labeling reagents were solubilized in anhydrous acetonitrile and 400 µg added to each patient / cell
line sample according to the scheme in Fig. 1b. The reaction was stopped after 60 minutes at 24 °C
with 5% hydroxylamine (Thermo Scientific) and the sets of samples mixed. The acetonitrile in the
combined samples was removed with a speed-vac vacuum concentrator. The labeling efficiency of this
method was tested beforehand with the TMTzero label reagent (Thermo Scientific) followed by mass
spectrometric analysis and determined to be higher than 98 % (data not shown).
Sample pre-fractionation Sample pre-fractionation was performed with the Pierce High pH Reversed-Phase Peptide
Fractionation Kit (Thermo Scientific) according to the manufacturer’s instructions. In detail, the storage
solution of the C18 columns was removed (5000 x g for 2 min), the columns equilibrated with
anhydrous acetonitrile (AcN) twice (5000 x g for 2 min) and conditioned with 0.1 % triethyamine (TEA;
Thermo Scientific) there times (5000 x g for 2 min). The combined sets of samples were diluted to 300
µl with 0.1 % TEA and loaded on the columns (3000 x g for 2 min). The sample was washed once with
0.1 % TEA and once with 5 % AcN in 0.1 % TEA (3000 x g for 2 min each). Peptides were eluted
stepwise with the following concentrations of AcN in 0.1 % TEA: 10 %, 12.5 %, 15 %, 17.5 %, 20 %,
22.5 %, 25 % and 50 % (300 µl; 3000 x g for 2 min each). All fractions were concentrated to dryness in
a speed-vac vacuum concentrator.
Mass Spectrometric data acquisition Peptides from each fraction were re-solubilized in 0.1% formic acid (FA) in a branson-type sonication-
bath before being subjected to mass spectrometric analysis.
Each sample was separated by reversed-phase chromatography on a high pressure liquid
chromatography (HPLC) column (75-μm inner diameter, New Objective) that was packed in-house
with a 15-cm stationary phase (ReproSil-Pur C18-AQ, 1.9 µm) and connected to a nano-flow HPLC
combined with an autosampler (EASY-nLC 1000; Thermo Scientific). The HPLC was coupled to an
Orbitrap Fusion tribrid mass spectrometer (Thermo Scientific) equipped with a nanoelectrospray ion
source (Thermo Scientific). Buffer A was composed of 0.1 % FA in HPLC-grade water, Buffer B 0.1 %
FA in HPLC-Grade AcN.
Data was acquired with modified settings, termed either TopN or TopSpeed.
TopN: Peptides were eluted in a continuous gradient with a flow rate of 300 nl per minute, starting at 2
% Buffer B, ramping to 8 % in 6 minutes, followed by an increase to 24 % over 64 minutes, followed by
an increase to 28 % over 8 minutes, followed by an increase to 44 % Buffer B in 8 minutes and
washing of the column in 80 % Buffer B. The mass spectrometer was operated in data-dependent
acquisition (DDA) mode, consisting of a MS1 scan with the orbitrap as detector (Resolution: 120000;
Scan range 400 – 1400 m/z; AGC target 2.0e5; maximum injection time: 100 ms). The 8 most intense
precursor ions derived from a survey scan were fragmented via collision-induced-dissociation (CID)
and analyzed as MS2 scan in the ion trap (Collision energy 35 %; AGC target 4.0e3; maximum
injection time 150 ms, Scan Rate: rapid). As described 2 the 10 most intense ions of the MS2 were
fragmented by higher-energy collisional dissociation (HCD) and analyzed in parallel in the orbitrap as
MS3 scan (Resolution: 60000, Collision energy: 55%, AGC target: 5e4, maximum injection time 150
ms), to quantify the TMT reporter ions. The orbitrap and ion trap detectors operated in parallel.
TopSpeed: Peptides were eluted in a continuous gradient with a flow rate of 300 nl per minute, starting
at 2 % Buffer B, ramping to 8 % in 6 minutes, followed by an increase to 24 % over 64 minutes,
followed by an increase to 28 % over 8 minutes, followed by an increase to 44 % Buffer B in 8 minutes
and washing of the column in 80 % Buffer B. The mass spectrometer was operated in DDA mode,
consisting of a MS1 scan with the orbitrap as detector (Resolution: 120000; Scan range 400 – 1400
m/z; AGC target 2.0e5; maximum injection time: 100 ms). The most intense precursor ions were
fragmented via CID and analyzed as MS2 scan in the ion trap (Collision energy 35 %; AGC target
1.0e4; maximum injection time 50 ms, Scan rate: turbo). As described 2 the 10 most intense ions of
the MS2 were fragmented by HCD and analyzed in parallel in the orbitrap as MS3 scan (Resolution:
60000, Collision energy: 55 %, AGC target: 1e5, maximum injection time 50 ms), to quantify the TMT
reporter ions. The orbitrap and ion trap detectors operated in parallel, the number of ions fragmented
for MS2 and MS3 analyses was automatically optimized for a 3 second work-cycle.
Mass spectrometric data analysis The acquired raw data was analyzed with Proteome Discoverer 2.1 (Thermo Scientific) en bloc. For
the identification of the MS2 spectra, Sequest HT was utilized, with a 10 ppm precursor mass
tolerance, 0.8 Da as fragment mass tolerance and as database, the Swissprot part of Uniprot for the
species human was used (version 2016_01; 20145 entries). As dynamic modifications, oxidation
(DeltaMass="15.99492") for all methionine residues was set and acetylation (DeltaMass="42.01057")
for all protein N-termini. As static modifications were treated, the TMT-label (DeltaMass="229.16293")
at the peptide N-terminus and all lysine residius and carbamidomethylation (DeltaMass="57.02146") at
all cysteine residues. The fasle-dicovery-rate (FDR) for the peptide and consecutive protein
assignments were performed by the included Percolator software package, based on a decoy
database search and a strict cut-off of a 0.01 % FDR was applied on the protein level.
Reporter ion quantification was performed in the MS3 channel with a 20 ppm mass tolerance and
corrected for the isotopic impurities provided for TMT lot QD212963. For the area calculations, the top
3 peptides were used and maximum fold change was set to 1000. No minimum vales were imputed.
For the individual proteins, only unique and razor peptides were used for quantification. Overall the
quantification was normalized by the total peptide amount in each channel. The data was enriched by
multiple annotations, including gene ontology (GO) terms directly by Proteome Discoverer 2.1.
The data was filtered to contain only proteins with a FDR < 0.01 and being the “Master” or “Master-
candidate” proteins in their respective protein group. The dataset was exported to Spotfire 3.2.2
(Tipco) for further processing.
For the quantification, the normalized intensities on the protein level were averaged between the
technical replicates. A protein was only deemed as consistently and reproducibly quantified, if a
quantification value was obtained in both technical replicates in more than half of the individual
samples.
Cellular respiration
For measurement of cellular respiration, hMADS cells were differentiated and re-plated on collagen-
coated 96-well Seahorse cell culture microplates at a density of 10.000 cells per well. On the day of
experiment, adipogenic medium was replaced with unbuffered XF Assay Medium (pH 7.4, Seahorse
Bioscience) supplemented with 25 mM glucose (Sigma), 2 mM sodium pyruvate (Invitrogen) and 2 mM
GlutaMax (Invitrogen). The oxygen consumption rate (OCR) was measured using the Extracellular flux
analyzer XF96 (Seahorse Bioscience). Test compounds were sequentially injected to obtain following
concentrations: 1 µg/ml Oligomycin, 0.5 mM cAMP, 3 µM Rotenone with 2 µg/ml Antimycin A. To
study the role of ATP/ADP translocase, 50 µM Bongkrekic acid was injected. OCR levels (pmol/min)
were normalized to protein amount per well (µg protein) for AUC analysis. The data was analyzed with
Prism 6 (GraphPad), including area under the curve calculation.
Statistical Methods
Unsupervised k-means clustering was performed in Spotfire 3.2.2 (Tipco) on the protein level
quantification patient data, with correlation similarity as distance measure and 9 clusters as target.
Line similarity analysis was performed in Spotfire 3.2.2 (Tipco) based on UCP1 expression inside the
BAT enriched cluster, with correlation similarity as distance measure, to obtain a ranking of target
proteins. Ratio paired t-test statistics and coefficients of variation were calculated in Prism 6
(GraphPad). Pathway and gene-set enrichments were calculated by Enrichr 4. As graphical
representations of the data, the heat maps were generated with Spotfire 3.2.2 (Tipco), all other graphs
with Prism 6 (GraphPad).
References for supplementary experimental procedures
1 Elabd, C. et al. Human multipotent adipose-derived stem cells differentiate into functional
brown adipocytes. Stem Cells 27, 2753-2760, doi:10.1002/stem.200 (2009).
2 McAlister, G. C. et al. MultiNotch MS3 enables accurate, sensitive, and multiplexed detection
of differential expression across cancer cell line proteomes. Anal Chem 86, 7150-7158,
doi:10.1021/ac502040v (2014).
3 Vizcaino, J. A. et al. ProteomeXchange provides globally coordinated proteomics data
submission and dissemination. Nat Biotechnol 32, 223-226, doi:10.1038/nbt.2839 (2014).
4 Chen, E. Y. et al. Enrichr: interactive and collaborative HTML5 gene list enrichment analysis
tool. BMC Bioinformatics 14, 128, doi:10.1186/1471-2105-14-128 (2013).