proteomic profiling by antibody micro-array kent j. johnson m.d. roscoe l. warner ph.d
Post on 19-Dec-2015
218 views
TRANSCRIPT
Proteomic Profiling by Proteomic Profiling by Antibody Micro-ArrayAntibody Micro-Array
Kent J. Johnson M.D.
Roscoe L. Warner Ph.D.

Piezorray Non-Contact PrinterPiezorray Non-Contact Printer
2
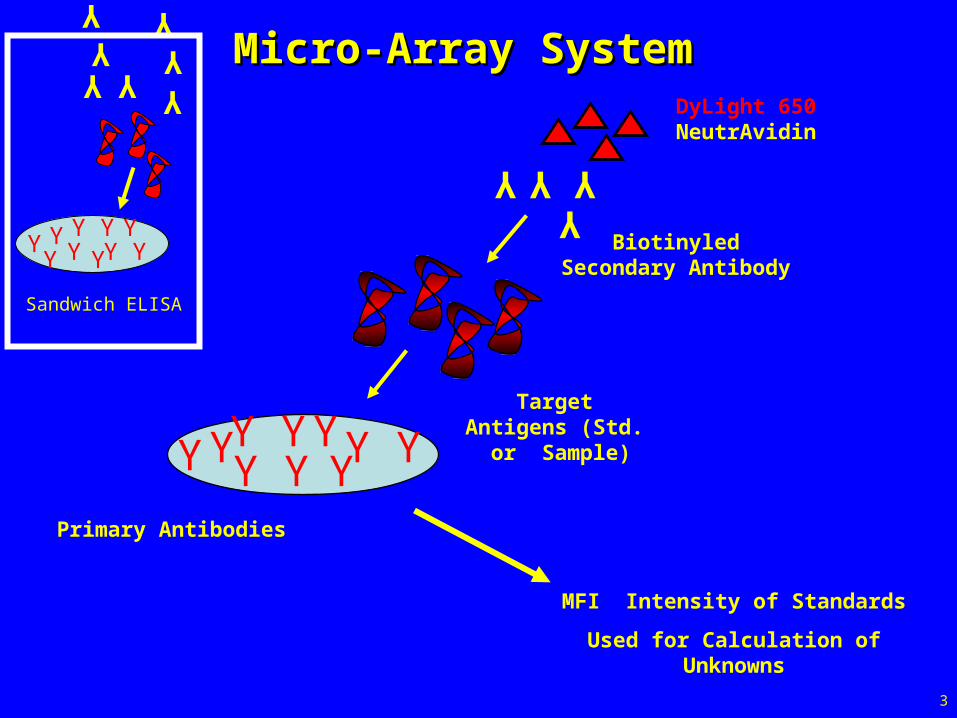
Micro-Array SystemMicro-Array System
Y YY Y Y YY
DyLight 650 NeutrAvidin
Target Antigens (Std. or Sample)
MFI Intensity of Standards
Used for Calculation of Unknowns
YYY Y
Y YY
Y YY YY Y
Y
Sandwich ELISA
Y Y YY
BiotinyledSecondary Antibody
Primary Antibodies
Y Y Y
Y YY
3
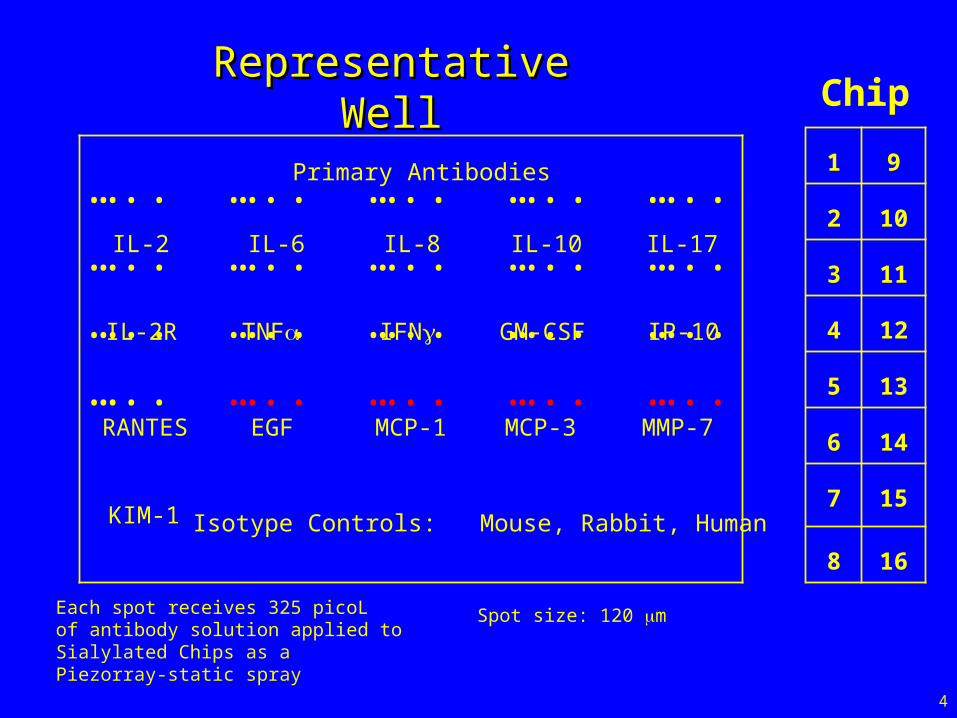
Representative WellRepresentative Well
….. ….. ….. ….. …..
….. ….. ….. ….. …..
….. ….. ….. ….. …..
….. ….. ….. ….. …..Isotype Controls: Mouse, Rabbit, Human
Primary Antibodies
IL-2 IL-6 IL-17
IFN IP-10TNF
IL-8
GM-CSFIL-2R
IL-10
RANTES EGF MCP-1 MCP-3 MMP-7
KIM-1
1 9
2 10
3 11
4 12
5 13
6 14
7 15
8 16
Chip
4
Each spot receives 325 picoL of antibody solution applied to Sialylated Chips as a Piezorray-static spray
Spot size: 120 m
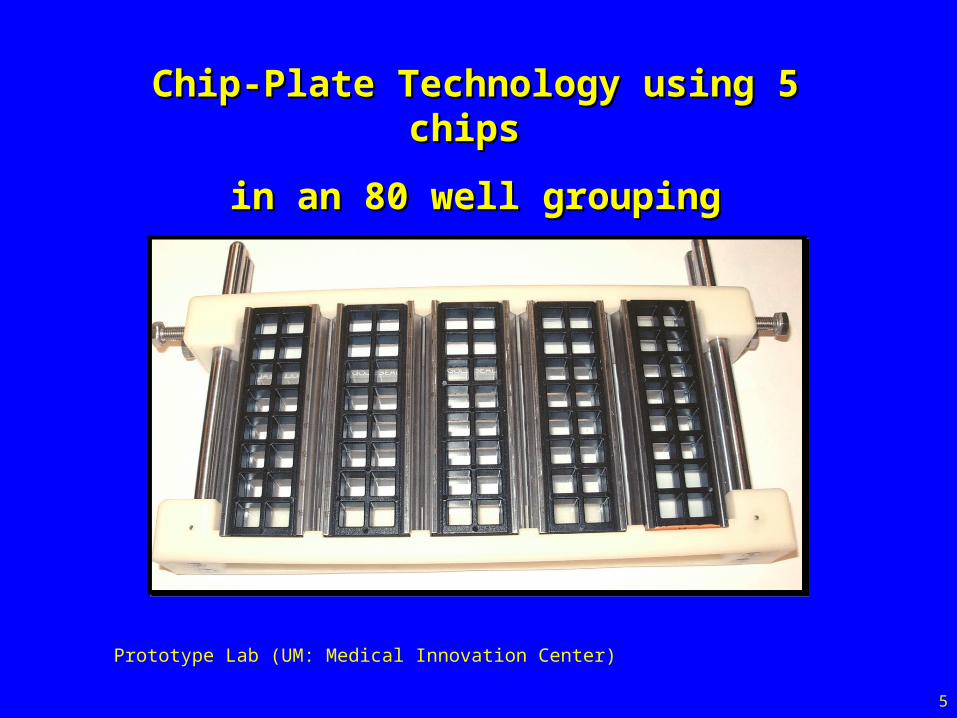
Chip-Plate Technology using 5 chips Chip-Plate Technology using 5 chips
in an 80 well groupingin an 80 well grouping
Prototype Lab (UM: Medical Innovation Center)
5

1 9 17 25 33 41 49 57 65
2 10 18 26 34 42 50 58 66
3 11 19 27 35 43 51 59 67
4 12 20 28 36 44 52 60 68
5 13 21 29 37 45 53 61 69
6 14 22 30 38 46 54 62 70
7 15 23 31 39 47 55 63 Ctrl.
8 16 24 32Zero pg/ml 40 48 56 64 Ctrl.
Chip-1 Chip-2 Chip-3 Chip-4 Chip-5
Sta
nd
ard
Cu
rve
6

Cross-Reactivity Testing
DyLight 650 NeutrAvidin
Biotinylated Secondary Antibody
MFI Intensity of DyLight 550 and DyLight 650
Specific AntigenY
Y Y
YYYYY YYYYY YYYYYYYYYY YYYYY YYYYY YYYYY YYYYY YYYYYYYYYY YYYYY YYYYYYYYYY YYYYY YYYYYYYYYY YYYYY YYYYY
YYY
YY
YY
Second SeriesSecond Series First SeriesFirst Series
Biotinylated Secondary Antibody
DyLight 550 NeutrAvidin
7
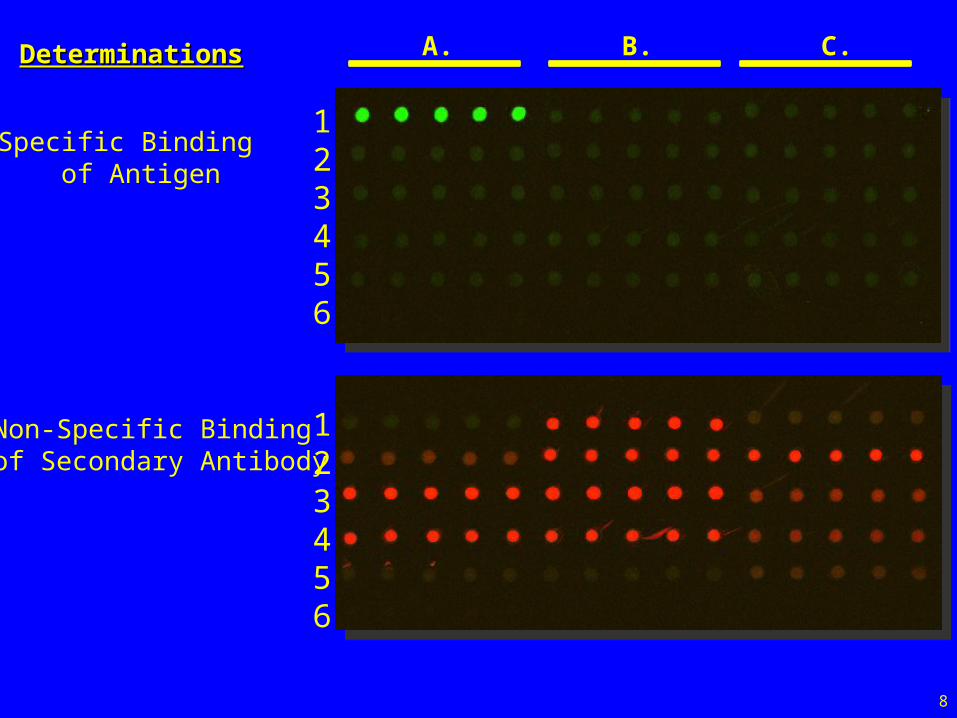
123456
123456
Specific Binding of Antigen
Non-Specific Bindingof Secondary Antibody
A. B. C.DeterminationsDeterminations
8
Standards used as Log4 dilution of master mix plus a zero value.
Standard Curve generated for each antigen and equation of the line determined.
Antigen concentration of samples calculated from equation of the line.
9
Development of Standard Curve Development of Standard Curve and Linear Rangeand Linear Range

10

Detection Range 1.2 - 10,000 pg/mL
Regression 0.95 – 0.99
Recovery 86% - 108%
Intra-Assay Multiple Printings 6%
Inter-Assay Multiple Printings 10%
Human Micro-Array Chip System
11
Performance of Micro-Array Methodology
Advantages of Custom Antibody Micro-ArrayAdvantages of Custom Antibody Micro-Array
1. Easily modified to accommodate unique target antigens.
2. Ability to custom develop chips for desired species, limited only by availability of purified antigen and antibodies.
3. Quantifiable approach to high throughput analysis of multiple antigens using small sample size.
4. Only One U.S. company to date makes Antibody Arrays.
5. Comparable technologies include ELISA, Bead-based assays,
12
Micro-Array Findings
13

Rat Micro-Array 45 AntibodiesProtein Range (pg/ml) Curve fit r2
Agrin 38.8 - 2,000 0.994
Annexin-V 2.4 - 10,000 0.990
B-NGF 3.9 - 1,000 0.970
B7-1 24.1 - 4,000 0.977
B7-2 51.8 - 2,000 0.973
CINC-1 4.8 - 1,000 0.973
CINC-2 4.8 - 2,000 0.974
CINC-3 73.4 - 2,000 0.970
Clusterin 2.5 - 10,000 0.990
CNTF 23.7 - 2,000 0.999
E-Selectin 6.2 - 2,000 0.980
EGF 3.9 - 1,000 0.960
EphA5 40.2 - 2,000 0.999
Fas 20.7 - 2,000 0.980
FGF-BP 31.5 - 2,000 0.980
Fractalkine 57.7 - 12,500 0.994
GFR-1 44.6 - 1,000 0.981
GM-CSF 46.2 - 1,000 0.999
GRO- 1.2 - 1,000 0.997
-GST 10.0 - 1,000 < 0.95
ICAM-1 64.2 - 5,000 0.999
IFNg 20.4 - 2,500 0.991
Protein Range (pg/ml) Curve fit r2
IL-1 12.6 - 1,000 0.999
IL-1 15.9 - 4,000 0.997
IL-2 26.2 - 4,000 0.992
IL-4 4.6 - 1,000 0.997
IL-6 71.6 - 8,000 0.997
IL-10 73.4 - 4,000 0.988
IL-12 23.4 - 2,000 0.997
IL-13 3.1 - 2,000 0.999
IL-18 7.8 - 2,000 0.990
Jagged-1 12.3 - 4,000 0.997
KIM-1 1.2 - 5,000 0.990
LIX 30.1 - 4,000 0.976
L-Selectin 11.7 - 4,000 0.997
MCP-1 13.1 - 2,000 0.970
Neuropilin-1 28.6 - 2,000 0.986
NGAL 1.0 - 2,000 0.980
Notch-2 14.1 - 2,000 0.993
PAI-1 9.77 - 10,000 0.987
PDGF-AA 63.2 - 2,000 0.991
RANTES 1.0 - 2,500 0.952
STAT-1 78.3 - 5,000 0.982
TNF 49.1 - 4,000 0.983
VEGF 52.7 - 1,000 0.992
14

Rat Models
Dermal ArthusGlucanStreptozotocin Induced DiabetesGentamicinCyclosporin AFenoldopam
15

Gentamicin InjurySerum Protein Levels
Pre-Immune
Gentamicin 80 mg/Kg Gentamicin 100 mg/Kg
Antigen (pg/ml) Mean SD Mean SD Mean SD
IFN 128.64 107.66 46.79* 0.00 46.79* 0.00
IL-1 116.07 33.23 99.46 0.00 99.46 0.00
IL-1 13.21 7.71 15.27 0.27 13.41 7.23
IL-2 1.06 0.00 1.06 0.00 1.06 0.00
IL-4 0.12 0.00 0.12 0.00 0.12 0.00
IL-6 477.52 242.66 1,924.46* 450.22 1,004.80 1,219.82
IL-10 1.26 2.19 0.18 0.02 1.83 2.35
IL-12 1,555.65 335.99 3,200.08* 1,044.83 2,661.43* 374.79
TNF 2.00 0.00 2.00 0.00 2.00 0.00
Neuropilin-1 0.35 0.00 0.55 0.28 10.81* 13.25
EGF 3.99 2.46 6.16 1.69 8.87* 2.50
NGAL 4,000.00 0.00 4,000.00 0.00 2,169.57 2,588.62
PAI-1 3.88 6.32 0.65 0.10 23.68* 26.28
RANTES 1,009.96 239.58 804.28 754.00 3,113.77* 2,667.54
ANNEXIN V 3,613.34 4,737.10 73.76* 71.67 1,628.23 2,267.44
Clusterin 20,000.00 0.00 20,000.00 0.00 20,000.00 0.00KIM-1 146.29 100.62 357.07* 77.89 220.72 15.70
16

Urine Protein Levels
Pre-Immune Gentamicin 80 mg/Kg Gentamicin 100 mg/Kg
Antigen (pg/ml) Mean SD Mean SD Mean SD
IFN 395.48 63.04 2,157.80* 1,708.60 134.87 172.28
IL-1 ND ND ND ND ND ND
IL-1 1.78 1.48 2.95 4.17 1.06 1.50
IL-2 96.01 90.87 1,549.28* 1,947.12 119.55 153.47
IL-4 7.88 6.30 29.63* 39.08 3.82 4.27
IL-6 23.72 0.00 1,447.21* 509.33 ND ND
IL-10 265.84 120.85 1,309.28* 1,392.05 258.60 344.71
IL-12 228.73 152.26 1,239.04* 139.55 636.19* 414.58
TNF 161.36 162.39 637.86* 880.93 14.94 0.00
Neuropilin-1 46.27 38.79 165.31* 220.36 42.53 47.02
EGF 4,000.00 0.00 2,109.60 2,673.43 2,036.86 2,776.31
NGAL 11,105.13 5,439.76 17,618.36* 3,368.15 11,904.37 1,877.06
PAI-1 0.24 0.01 10.64* 5.66 6.99* 6.54
RANTES ND ND ND ND ND ND
ANNEXIN V 3,054.48 873.28 6,766.21* 1,911.34 4,456.25* 1,520.17
Clusterin 703.07 1,570.96 1,231.00* 983.08 939.35 760.30
KIM-1 395.48 544.97 2,157.80* 1,708.60 134.87 172.28
N.D. - Not Detected
Gentamicin Injury
17

Urine Serum
Control CsA 80 mg/Kg Control CsA 80 mg/KgProteins (pg/mL) Mean SD Mean SD Mean SD Mean SD
ICAM-1 1,565 1,649 2,060 2,139 2,121 805 5367 * 3,033
IL-1 4.2 8.6 30.7 61.9 5.3 1.8 21.27 * 12.3
Fas 767 374 508 209 96 42 167 * 38
IL-12 1,336 2,063 832 1,601 1,907 353 928 * 409
Notch-2 0.28 0.34 8.7 8.8 2,466 845 3649 * 470
EGF 1,335 1,030 1,178 908 0.58 0.62 18.3 * 11
Clusterin 169 663 3551 * 1,296 19,880 1,782 17,533 6,042
KIM-1 171 118 592 * 376 93 52 178.9 * 56
*Significantly Different (p < 0.05), Mean +/- SD of Cyclosporin treated rats (n=10) and normal healthy (n=10) control animals .
Cyclosporin A Injury
18

Human Array Findings
19

Human Micro-Array 108 AntibodiesACE Fc γ RIIB/C IL-2 MIF Survivin (IC)
Activin A FGF basic IL-3 MIP-1α TARC
ADAM8 FGF-4 IL-4 MIP-1β TGF-α
Adiponectin FGF-6 IL-5 MIP-1δ TGF-B1
ALCAM Fractalkine IL-6 MIP-3α TGF-B2
BCAM G-CSF IL-6 sR MIP-3β TGF-B3
β-NGF GM-CSF IL-8 MMP-3 TIMP-1
BLC/BCA 1 GRO α IL-10 MMP-9 TIMP-2
Cathepsin S HGF IL-12 p70 MMP-13 TIMP-4
Complement D HSP27 (IC) IL-13 OSM TNF-α
CTGF HSP70 (IC) IL-15 P-Cadherin UPAR
Dectin 1 ICAM-3 IL-18 BPa PDGF-AB VCAM-1
E-Cadherin IFN-γ IP-10 PDGF-BB VEGF
EGF IGF-BP2 Leptin pro-Cathepsin S VEGF-D
Endostatin IGF-BP3 L-Selectin P-Selectin VEGF R2 (IC)
Eotaxin IL-α MCP-1 RANTES PAI-I
Epo R IL-β MCP-2 Resistin IL-18
E-Selectin IL-1 RI MCP-3 sICAM-1 KIM-1
Fas Ligand IL-1 sRII MCP-4 sTNF RI DAF
Fetuin A/AHSG IL-2 R Osteopontin TNF RII Lactoferrin
IL-2 sR Clusterin NGAL Fibronectin Annexin V
Cystatin C Lymphotoxin R Lymphotoxin
20
.
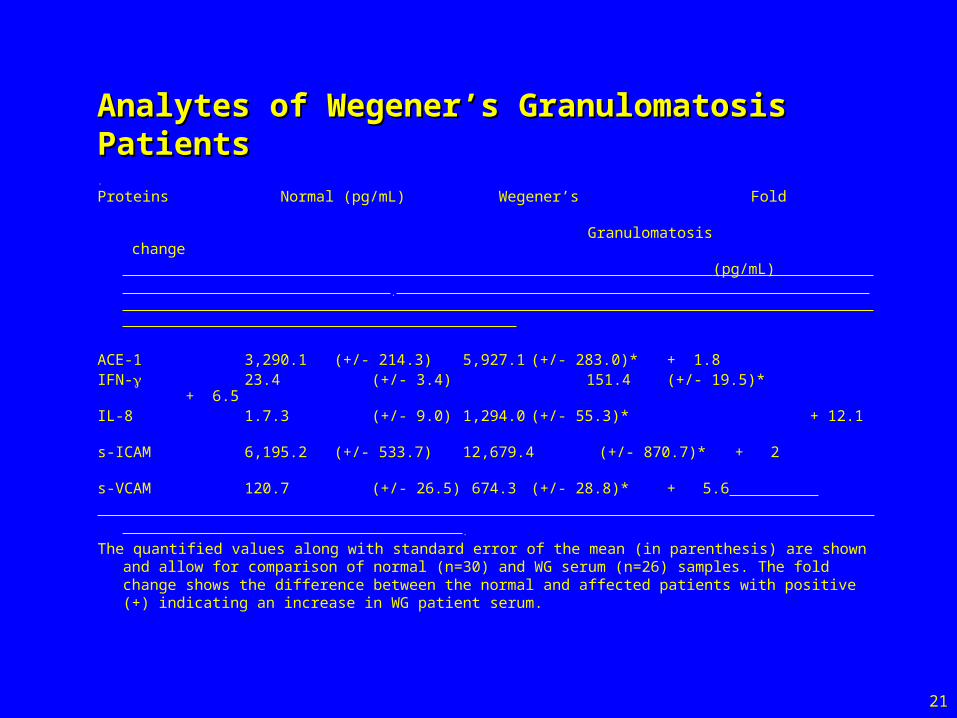
Proteins Normal (pg/mL) Wegener’s Fold Granulomatosis change
(pg/mL) .
ACE-1 3,290.1 (+/- 214.3) 5,927.1 (+/- 283.0)* + 1.8 IFN- 23.4 (+/- 3.4) 151.4 (+/- 19.5)* + 6.5 IL-8 1.7.3 (+/- 9.0) 1,294.0 (+/- 55.3)* + 12.1 s-ICAM 6,195.2 (+/- 533.7) 12,679.4 (+/- 870.7)* + 2 s-VCAM 120.7 (+/- 26.5) 674.3 (+/- 28.8)* + 5.6
.
The quantified values along with standard error of the mean (in parenthesis) are shown and allow for comparison of normal (n=30) and WG serum (n=26) samples. The fold change shows the difference between the normal and affected patients with positive (+) indicating an increase in WG patient serum.
Analytes of Wegener’s Granulomatosis PatientsAnalytes of Wegener’s Granulomatosis Patients
21

RAVE Clinical TrialRAVE Clinical Trial
Rituximab in ANCA-Associated Vasculitis (RAVE) trial
Long-term program to identify markers that are clinically useful in staging vasculitis activity, distinguishing vasculitis from other inflammatory diseases such as infections, and predicting response to treatment and risk of relapse.
22

Of the 186 subjects evaluated at screening,
139 had been diagnosed with GPA and 46 with MPA;
124 were positive for anti-PR3 and 62 for anti-MPO
93 had active glomerulonephritis
90 had a new diagnosis of AAV
96 had established diagnoses and were experiencing relapses.
At screening:
92 patients were receiving glucocorticoids, and
104 were receiving some immune-suppressive drug (glucocorticoids, other drugs, or both).
The 68 healthy controls included 28 males and 40 females, median age 41.
23

Use of Multiple Markers to Better Distinguish Severe or Mild Vasculitis from Remission
Four markers (CXCL13/BCA-1, G-CSF, IL-15, and TIMP-1) were
significantly higher at month 6, after adjustment for multiple comparisons, in
the 25 subjects with active disease than in the 137 subjects in remission,
Five additional markers (IFN, CXCL8/IL-8, sIL-2R, CCL5/RANTES) might
be higher based on unadjusted P values of < 0.05.
Discrimination between mild disease and remission at month 6 was limited,
with all AUC < 0.7
24

Based on logistic regression models with active disease vs. remission as the dichotomous outcome, the set of markers that best distinguished active AAV from remission in the 137 subjects with paired samples was:
ACE (negatively), GM-CSF, MMP-3, TIMP-1, and ESR, with AUC=0.96.
Odds ratios (for active AAV vs. remission in these 137 subjects) associated with 2-fold changes in these markers. When these 5 markers were used to model data limited to month 6, comparing 25 subjects with milder active AAV to 137 in remission, AUC=0.78.
25

Biomarkers In Patients with Biopsy Proven Biomarkers In Patients with Biopsy Proven Rejection of Renal Allografts Rejection of Renal Allografts
26

Our findings demonstrate that the protein signature of healthy subjects is distinctly different from renal transplant patients with good allograft function and no previous history of rejection.
We have identified 10 proteins that can reliably differentiate stable renal transplant recipients from healthy subjects in both the training and validation cohorts.
Cystatin-C, EGF, GM-CSF, IL-1 R1, IL-5, KIM-1, MCP-1, MCP-3, MIF, TIMP-4
In addition, 17 proteins were identified that can differentiate rejecting renal transplant recipients from stable renal transplant patients.
TGF-β2, E-Cadherin, GROα, TGF-β1, IL-6, IL-1 R1, EGF, MIP-3α, TNF-RII, KIM-1, Osteopontin, VEGF-R2, Epo-R, MIF, IL-12p70, MCP-1, GM-CSF
The ultimate goal of the protein array is be to monitor non-invasively, renal transplant patients over time in order to detect subclinical changes before they would be detected by conventional methods, ie., change in serum creatinine levels, with the intent to alter long-term graft outcome.
27

28

Micro-Array Chip and ProPlate MaskMicro-Array Chip and ProPlate MaskTM
29