prototype project assessment and evaluation plan … project assessment and evaluation plan...
TRANSCRIPT

13
Prototype Project Assessment and Evaluation Plan Planning, Research, Monitoring and Assessment
Identification of Effective Restoration and Land Management Measures in the Mill Creek
Watershed
I. Project Summary
A. Funding Program The Project is supported by Proposition 40 as part of the Agricultural Water Quality Grant Program and local and federal matching funds.
B. Project Description
Sediment is one of the pollutants that is impairing aquatic life uses in Mill Creek and all of its tributaries and has been on the 303(d) list since the mid-1980s. Sources of excessive sediment have been attributed to agricultural, urban, and ex-urban land development and management practices. This project will identify and prioritize various categories of alterations to the land and watershed hydrology that contribute most to excessive erosion and sedimentation. It will also identify additional factors contributing to beneficial use impairment, so that the appropriate mix of restoration measures and land use/development practices can be put in place where they achieve the greatest anticipated environmental benefits.
C. Problem Statement: i. Identify or characterize baseline data
Several studies have recently been completed and published that document impairment to aquatic life uses in the Mill Creek Watershed. Excessive sediment is listed as one of the main causes of anadromous fisheries declines and extirpation of Coho salmon throughout the watershed. Sediment is also suspected as a factor that contributed to placing the California freshwater shrimp on the Endangered Species list. Oakwood County is currently preparing a Programmatic Environmental Impact Report and has completed a baseline data report, inventorying biological and cultural resources, geology, hydrology, and current land use. A digitized map of vegetation cover at a 1-m resolution exists for the whole county, including the Mill Creek Watershed. Extensive historical information has been assembled documenting pre-European land cover, land use changes in the past 150 years, and modification to the stream hydrology throughout the watershed.
ii. Identify pollution source categories Agricultural land management practices, and to a lesser extent urban and ex-urban land uses are suspected to be the main sources of excessive sediment.
iii. Identify and describe current restoration activities; Best Management Practices (BMPs); load reduction activities; prevention activities
Oakwood County has had a hillslope protection ordinance in place for several decades that applies to slopes greater than 5%. The ordinance requires review, approval, and implementation of erosion control plans prior to conversions of natural land cover to agricultural uses. Until recently, erosion control measures included large-scale expansion of the drainage network through construction of hillslope drains removing water from fields in accelerated
14
fashion, reducing soil infiltration and causing major alterations in the hydrologic regime of tributaries and the mainstem of Mill Creek.
iv. Describe the manner in which BMPs or Management Measures are proposed to be implemented
N/A v. Summarize how the effectiveness of proposed practices or measures in
preventing or reducing pollution will be determined N/A
vi. Determine “changes in flow pattern” in affected water bodies N/A. While this project will not be able to measure changes in flow pattern until Management Measures are implemented, it is designed to recommend opportunities for restoring flow where current water and land management practices have reduced dry-season base flow below critical threshold levels. vii. Determine economic benefits of implementing project
N/A. Not a requirement of AWQGP.
D. Project Activities or Tasks Task 1: Project Management and Administration Task 2: Develop detailed monitoring and assessment plan, including refinement of existing conceptual models reflecting our current understanding of watershed processes, and stating hypotheses that can be tested via spatial analysis. Task 3: Develop Quality Assurance Project Plan linking project objectives with data quality objectives. Task 4: Compile relevant historical and current datalayers and digitize maps (e.g., Mill Creek drainage network, land cover, documented wetland types and other habitats, floodplain structure); analyze and document change in georeferenced format; identify restoration constraints and opportunities. Task 5: Obtain access permission to candidate field verification sites to spot-check interpretation of aerial photography and LIDAR images. Task 6: Compile existing range of land management practices and document sites or areas of sediment sources, transport, and storage to land and water management practices. Task 7: Compile a menu of alternative management practices and restoration measures tailored to sediment mobilization and storage problems identified in Task 4 and identify suitable monitoring sites where progress toward TMDL targets could best be tracked. Task 8: Prepare final report and submit data to SWAMP database. E. Category of Project Activities or Tasks: All project activities and tasks fall into the Planning, Research, Monitoring and Assessment Category.
II. Project Goals & Desired Outcomes
The goals of this project are: 1) Assess where and what kind of land and water use practices have contributed most to impairment of aquatic live uses. 2) Provide the information necessary to implement a range of restoration measures and land/water management practices that could mimic historic watershed processes (e.g., restoration of storm hydrographs through detention and infiltration basins and rehabilitation of wetlands; establishment of riparian buffer zones and setback levees
15
to allow formation of meanders and important floodplain structural elements) and contribute to the prioritization of site-specific TMDL implementation options.
The desired outcomes of this project are: 1) Identification and mapping of anthropogenic sediment “hot spots” and linkage to current land and water management practices, such as increases in the drainage density, impervious surfaces, and other hydromodifications, as well as ill-timed water diversions, and reduction of flood plain functions. 2) Development of site-specific and watershed-wide restoration and land management options capable of mimicking historic watershed functions and processes and capable of meeting TMDL implementation targets. 3) Identification of appropriate index sites for tracking TMDL implementation progress.
III. Project Performance Measures Tables

Table 1: Example Performance Indicators for Planning, Research, Monitoring, and Assessment Activities in Mill Creek
Restoration Planning Project
Project Goals Baseline
Measurements and
Information
Output Indicators Outcome Indicators Measurement Tools and
Methods
Targets
1. Assess where and
what kind of land and
water use practices
have contributed most
to impairment of
aquatic live uses.
1. Historical
documentation of
landcover and
drainage network
2. LIDAR imagery;
vegetation maps;
3. Current land cover
and uses
4. Historical and
current flow data
1. Digitized maps of
historical and present
channel network and
hydrology
2. Digitized maps of
historical and current
habitat types
1. Site-, reach-, or area-
specific options for
alternative land/water
management practices and
restoration measures.
2. Conceptual restoration
plans
3. Refinements to
conceptual model of
watershed processes and
functions
Documenting Local Landscape Change: the Bay Area Historical Ecology Project. In: Egan, D. and E. Howell, editors, The Historical Ecology Handbook: a Restorationist's Guide to Reference Ecosystems (Island Press, Washington D.C.)
1. Broad acceptance of identified hot
spots based on peer review.
2. Broad acceptance of conceptual
model sediment reduction management
options with identified hot spots based
on peer review
2. Identify range of
restoration measures
and management
practices that could
mimic historic
watershed processes
and contribute to the
prioritization of site-
specific TMDL
implementation
options
1. Erosion control
plans and list of
BMPs currently in
place or considered
for implementation
2. TMDL
implementation
targets
1. Digitized map and
classification of BMPs
and restoration
measures.
2. Digitized maps of
known and potential
salmonid spawning sites
1. Site-, reach-, or area-
specific options for
alternative land/water
management practices and
restoration measures.
2. Conceptual restoration
plans
3. Refinements to
conceptual model of
watershed processes and
functions.
3. TMDL monitoring plan
elements related to
tracking progress toward
targets.
1.
http://www.ctic.purdue.edu/
Core4/CT/Choices/Choices.h
tml
2.
http://www.dfg.ca.gov/nafw
b/manual.html
3.
http://www.waterboards.ca.g
ov/sanfranciscobay/Agenda/
04-16-
03/Stream%20Protection%2
0Circular.pdf
1. Adopted list of restoration and land
/water mgt. options
2. Adopted list of index sites for
TMDL monitoring by WICC TAC

Prototype Project Assessment and Evaluation Plan Education, Outreach, and Capacity-building
Evaluating Alternative Futures in the Mill Creek Watershed
I. Project Summary
A. Funding Program
The Project is supported by Proposition 40 as part of the Nonpoint Source Pollution Control Program and local and federal matching funds.
B. Project Description Oakwood County and the Resource Conservation District are collaborating with USEPA, Office of Research and Development, on developing tools to evaluate “Alternative Futures” (see http://www.epa.gov/ord/scienceforum/PDFs/science/white_d.pdf). The “Alternative Futures” project involves building community capacity in the Mill Creek Watershed, particularly to raise community awareness about environmental issues, with emphasis on nonpoint source pollution in a watershed context, and to involve the watershed community in the planned update of the County’s General Plan with the goal of including appropriate planning elements that enhance in-fill development and reduction of impervious surfaces and drainage density throughout the watershed.
C. Problem Statement:
i. Identify or characterize baseline data The Mill Creek Watershed is experiencing rapid conversion from agricultural and forestry lands to urban and ex-urban development. The opening of a bullet train station in the southern part of the watershed five years ago enabled people that formerly lived closer to employment centers with high housing costs to move into more affordable housing on the urban fringe. The influx of new watershed residents translates into a Mill Creek Watershed population growth rate of 11% a year over the last five years. The project provides an opportunity to educate long-term residents as well as newcomers about non-point source pollution issues, the connection between land development decisions and beneficial use protection, and to involve them in a planned visioning process as part of Oakwood County’s General Plan update. Baseline data exist in the County’s Geographical Information System (GIS) and include digitized data layers of land use change from 1950-2005, urban growth projections, hydrology, wetlands and other sensitive and unique aquatic habitat types, vegetation at a resolution of 1m, and stormdrain infrastructure. The County also recently compiled a biological resource inventory.
ii. Identify one or more sources of pollution Mill Creek is on the Impaired Waters list for sediment, nutrients, and pathogens. Agricultural management practices are implicated as the cause of erosion and sedimentation ; malfunctioning septic taks are suspected as a source of pathogen contamination; and a combination of agriculture and urban land uses are suspected as the sources of nutrients.
18
iii. Identify and describe current restoration activities; Best Management Practices (BMPs); load reduction activities; prevention activities
The County has an existing hillslope protection ordinance in place designed to minimize erosion from slopes greater than 5%. Agricultural landowners have implemented practices that drain runoff into extensive hillslope drainage networks discharging into tributaries of Mill Creek. Portions of the creek have experienced downcutting and bank erosion, and efforts are underway to restore floodplain functions in a four-mile reach in the central part of the watershed. TMDL implementation plans have not yet been developed or implemented for any of the three pollutant categories of concern.
iv. Describe the manner in which BMPs or Management Measure are proposed to be implemented
N/A v. Summarize how the effectiveness of the proposed practices or
measures in preventing or reducing pollution will be determined N/A
vi. Determine, to the extent feasible, changes in flow pattern in affected water bodies
N/A vii. Determine economic benefits of implementing project N/A. Not a requirement of Proposition 40.
D. Project Activities or Tasks
Task 1: Project Management and Administration Task 2: Develop detailed survey and assessment plan, including a training manual. The plan will be comprised of proposed questions and methods for analysis of pre- and post-implementation survey results. Task 3: Develop Quality Assurance Project Plan linking project objectives with data quality objectives. Task 4: Administer pre-project survey representative of Mill Creek Watershed population with a target maximum error rate of +-5%. The opinion poll will be designed to gauge the knowledge of residents about what “a watershed” is, pollution issues (source categories, activities contributing to pollution, understanding of impairment of beneficial uses, and understanding of the connection between land use and impairment). Task 5: Work with Oakwood Community College Board of Trustees to incorporate new classes into Environmental Science Department and assist in development of an endowment for instructor position. Task 6: Develop curriculum for Public Works, Planning, and Building Departments for County and Cities within the Mill Creek watershed related to nonpoint source pollution issues and the role of land use decisions in reducing aquatic life and recreation beneficial use impairment. Task 7: Hold a series of five workshops and participate in key community events (Earth Day; Adopt a Watershed Day; Friday Fairs during the summer; Sustainable Farming fundraising event) to staff

19
watershed awareness and education table, distribute fact sheets, and raise community awareness Task 8: Work with Farm Bureau, Builders Association, and Chamber of Commerce to incorporate appropriately tailored staff and member training events, based on curriculum developed for agency staff and modified for professional association audiences. Task 9: Conduct targeted outreach to environmental reporters of Oakwood Gazette and Hillview Register on Alternative Futures project and relevance to General Plan update. Work with County staff and community groups (e.g. Friends of Mill Creek, Property Rights and No Responsibilities Advocates of Oakwood, Get Government off My Back, SUE FFIRST!, etc.) to generate community awareness of Alternative Futures Project. Task 10: Conduct post-implementation survey of pre-project respondents to gauge increase in watershed awareness.
E. Category of Project Activities or Tasks: All project activities and tasks fall into the Education, Outreach, and Capcity-building Category.
II. Project Goals & Desired Outcomes
The goals of this project are: 1) Increase understanding of Mill Creek Watershed residents about basic
watershed characteristics and processes and the role of nonpoint source pollution in beneficial use impairment
2) Actively engage residents in the “Alternative Futures” visioning process which will inform the update of the County’s General Plan. The desired outcomes of this project are:
4) Increase the number of watershed residents who can adequately describe what a “watershed” is by a minimum of 15% by the end of the project period.
5) Oakwood College adds new, relevant curriculum components. 6) Insure that a watershed stewardship curriculum is adopted by two professional
organizations. 7) Watershed science and planning curriculum is developed and adopted by the
Public Works, Building, and Planning Departments throughout the County for in-house staff training purposes.
8) Broad community attendance at the Alternative Futures kick-off meeting. 9) Broad press coverage of the Alternative Futures Planning effort and outcomes.
III. Project Performance Measures Tables

Table 2: Example PAEP Elements for Education and Outreach Activities for Evaluating Alternative Futures in the Mill Creek
Watershed
Project Goals
Desired Outcomes
Output Indicators
Outcome Indicators
Measurement Tools
and Methods
Targets
1. Educate landowners
and residents about
baseline environmental.
conditions and watershed
processes
1. Increase number of
watershed residents who can
adequately describe what a
“watershed” is.
2. Oakwood College adds
two new, relevant curriculum
components.
3. Watershed stewardship
curriculum is adopted by
professional organizations.
1. No. of residents
attending workshops;
2. No. of meetings held
with College Board of
Trustees for expanding
course offerings;
3. No. of special events
with relevant outreach
material;
4. No. of meetings held
with prof. associations
1. Increase in general watershed
knowledge and environmental
conditions;
2. No. of relevant new college
courses offered.
3. No. of Farm Bureau, Builders’
Council, and other prof.
associations’ relevant training
classes
Opinion/Behavior
Surveys
(e.g.,
http://www.michigan.
gov/deq/0,1607,7-
135-
3313_3682_3714-
75944--,00.html)
1. 15% increase in watershed
residents who can adequately
describe what a “watershed” is.
2. Two new watershed curriculum
components or courses at college.
3. A minimum of two professional
orgs. have adopted and implemented
watershed stewardship curriculum
for in-house training
2. Provide understanding
about land use decisions
and NPS pollution
1. Watershed science and
planning curriculum is
developed and adopted by
the Public Works, Building,
and Planning Departments
throughout the County for
in-house staff training
purposes.
1. No. of residents
attending workshops;
2. No. of meetings held
with College Board of
Trustees for expanding
course offerings;
3. No. of special events
with relevant outreach
material;
4. Course material
developed for County
Public Works and
Planning staff
1. Increase in knowledge about
NPS pollution and land use
decisions;
2. Inclusion of NPS issues in land
use planning and environmental
science college curriculum
3. New training classes
implemented for County Public
Works and Planning staff
Opinion/Behavior
Surveys
1. County staff training curriculum
adopted and implemented.
2. 50% of County staff have
command of relevant NPS/land use
issues after first year of training.
2. Incorporation of NPS issues in
new college watershed curriculum
or courses
3. Involve residents in
“Alternative Futures”
project and General Plan
update
1. Broad community
attendance at the Alternative
Futures kick-off meeting.
2. Broad press coverage of
the Alternative Futures
Planning effort and
outcomes.
1. No. of residents
participating in
“Alternative Futures”
workshops
2. No. of newspaper
articles and other media
coverage about
Alternative Futures
1. Increase in County GIS
analysis and IT capacity
2. Increase in candidates for
political office with good NPS
and watershed understanding
Specified by Grantee 1. 200 or more residents at
“Alternative Futures” kick-off
meeting.
2. Series of three newspaper articles
on AF project.
3. Minimum of one candidate in city
or county elections with good
watershed understanding.

Prototype Project Assessment and Evaluation Plan Habitat Restoration
Eradicating Arundo donax from the Mill Creek Watershed and Establishing a Re-
introduction Prevention Program
I. Project Summary
A. Funding Program The Project is supported by Proposition 40 as part of Integrated Regional Water Management and local and federal matching funds.
B. Project Description
Oakwood County and the Resource Conservation District are collaborating to build on recently completed mapping efforts in the Mill Creek Watershed and implement a full-scale Arundo donax (giant reed) eradication program based on the demonstration project methodology developed under a recently completed CALFED Ecosystem Restoration Program grant.
C. Problem Statement: i. Identify or characterize baseline data Infestation of the invasive giant reed (Arundo donax) has recently been mapped for the entire Mill Creek Watershed. Arundo is native to riparian areas in Asia and was promoted as an erosion control mechanisms in Soil Conservation Service handbooks until late into the last century. The giant reed alters riparian ecosystem functions and habitat values for native species in numerous ways, in addition to presenting a flood and fire management challenge. Although no systematic studies have been undertaken to document its impacts on evapotranspiration, it is also suspected to severely alter the water budget by accelerating transpiration of surface and subsurface water, thereby contributing to the dewatering of streams during periods critical to native fish species and aquatic invertebrates. Once established, giant reed outcompetes existing native riparian vegetation and generates monoculture stands. Mapping results indicate that about 420 acres are infested within the 200 square-mile watershed of Mill Creek. Arundo is known to only reproduce vegetatively, thereby enabling complete eradication in any given area, as long as removal is systematic from the top to the bottom of the watershed so that floods cannot disperse viable rhizomes or canes. The RCD conducted an extensive education and outreach campaign from 2003-05 targeted at affected landowners to facilitate access to infestation sites. An EIR was developed in early 2005, and all required permits are being processed at this time. ii. Identify one or more sources of pollution N/A iii. Identify and describe current restoration activities; Best Management Practices (BMPs); load reduction activities; prevention activities

22
The County Department of Public Works has a removal policy in place, albeit only as part of its ongoing flood management and floodway maintenance program. The Resource Conservation District staff has obtained training in eradication methodology in a neighboring watershed but has heretofore lacked the funds to implement an eradication and re-infestation prevention program. iv. Describe the manner in which BMPs or Management Measures are proposed to be implemented We propose to utilize pond liner material after mechanically removing above-ground biomass to cover cut stands of Arundo and prevent the clones from photosynthesizing. This eradication methodology has proven to be the most cost-effective and least environmentally damaging alternative in the neighboring Russian River watershed. Usually, stands of Arundo are dead within two weeks. Above-ground biomass will be chipped as close to the eradication site as possible and composted on-site. Eradication will begin at the end of the wet season at the end of May in the uppermost reaches of Mill Creek and gradually work downstream toward the tidal marsh complex at the bottom of the watershed. Both the Public Works Department and the RCD will mobilize their existing volunteer crew and the California Conservation Corps to systematically remove canes and place pond liner over the remaining above- and below-ground biomass. We expect to be able to remove all 420 acres within the three-year project period. v. Summarize how the effectiveness of project implementation will be measured We propose to measure effectiveness of the project primarily through comparison of digital maps before eradication with site visits and ground photography at the end of the eradication period throughout the project as identified stands are eliminated. Updates to the digital datalayer housed at the RCD will be made after confirmation of non-viability of treated stands. Table 1 shows the proposed indicators to be used in evaluating effectiveness of the project. vi. Determine, to the extent feasible, changes in flow pattern in affected water bodies N/A vii. Determine economic benefits of implementing project N/A. Not a requirement of IRWMP.
D. Project Activities or Tasks Task 1: Project Management and Administration Task 2: Develop detailed implementation and monitoring plans, outlining treatment locations, anticipated eradication sequence, and post-implementation documentation. Adjust safety procedures and field reconnaissance manual as necessary. Task 3: Contact landowners and obtain permission to implement eradication Task 4: Transport available pond liners from Healdsburg storage location in the Russian River watershed and distribute to Mill Creek staging areas according to implementation plan. Mobilize volunteer and staff. Task 5: Train and mobilize field crews in safety procedures, for cane-cutting, micro-chipping, on-site composting of biomass, and placement of pond liners.

23
Task 6: Conduct post-eradication site visits to document success. Task 7: Prepare re-infestation prevention plan and incorporate plan into Public Works floodway maintenance SOPs. Task 8: Prepare project completion report, including updated maps and updates to methods manual. Submit maps to GeoWBS. E. Category of Project Activities or Tasks: All project activities and tasks fall into the Habitat Restoration Category.
II. Project Goals & Desired Outcomes
The goals of this project are: 1) Eliminate Arundo donax from the Mill Creek Watershed 2.) Adopt a re-infestation prevention plan
The desired outcomes of this project are:
1.) Reduction of giant reed coverage of 420 acres to less than one acre. 2.) Adoption of prevention plan and incorporation of re-infestation prevention plan into Public Works Department Standard Operating Procedures Manuals.
III. Project Performance Measures Table

Table 3: Example PAEP Elements for Habitat Restoration Activities in Mill Creek Arundo donax Eradication Project
Project Goals
Desired Outcomes
Output Indicators
Outcome Indicators
Measurement Tools and
Methods
Targets
1. Eliminate
Arundo donax
from the Mill
Creek Watershed
Reduction of giant reed
coverage of 420 acres to
less than 1
1. No. of landowners
granting access
permission;
2. No. of volunteers
participating in training
and implementation
1. Percent of each
watershed segment with
eradicated stands of
Arundo.
2. Re-establishment of
native riparian vegetation
Russian River Arundo
Eradication Manual
100% eradication in upper
and middle reaches of
watershed; 90% eradication
from lower watershed
2. Prepare a re-
infestation
prevention plan
Adoption of prevention
plan and incorporation
of re-infestation
prevention plan into
Public Works
Department Standard
Operating Procedures
Manuals
1. Finalization of
prevention plan
2. Integration with
existing floodway
maintenance SOPs
1. Adoption of prevention
plan.
2. Broad knowledge of
Public Works supervisors
about SOP updates.
3. Floodway maintenance
schedule based on
watershed reaches
sequenced from upstream
to downstream
Specified by Grantee 100% county staff awareness
of newly adopted SOP.

Prototype Project Assessment and Evaluation Plan Load Reduction
Reducing Pesticide-induced Sediment Toxicity from Stonefruit Orchards in the
Mill Creek Watershed
I. Project Summary
A. Funding Program The Project is supported by Proposition 50 as part of the Agricultural Water Quality Grant Program and local and federal matching funds.
B. Project Description
The middle and lower reaches of Mill Creek and two of its tributaries have been placed on the “impaired waters list” for pesticide toxicity attributable to agricultural land use practices. This project is designed to demonstrate the efficacy of reducing pesticide use by 20% throughout the watershed and restore aquatic life beneficial uses in Mill Creek. It builds on several preceding efforts that assessed beneficial use impairment, developed a detailed conceptual model describing water and sediment transport processes throughout the watershed, as well as pesticide transport and fate. Targets for TMDL implementation have been adopted by USEPA, and implementation plans are currently under development. The project will contribute to fine-tuning several proposed implementation steps and provide “proof-of-concept” documentation for large-scale application of selected Best Management Practices.
C. Problem Statement: i. Identify or characterize baseline data More than 40% of the watershed below river mile 42 is comprised of land cover consisting of stonefruit orchards and associated farm infrastructure (roads, both paved and unpaved, storage buildings, irrigation canals, etc.). The most recent pesticide use statistics show annual application rates of roughly 20,000 lbs of various synthetic pyrethroid compounds, comprising 95% of all pesticides applied. During synoptic sampling of Mill Creek and its two major tributaries draining agricultural land uses, nine out of ten samples exhibited sediment toxicity to bioassay organisms (Hyalella spp.). ii. Identify one or more sources of pollution Stonefruit orchards are suspected to be the main source of pollution. iii. Identify and describe current (if applicable) and proposed restoration activities; Best Management Practices (BMPs); load reduction activities; prevention activities Several landowners with a combined acreage of 1,100 acres are transitioning to organic farming practices and are in their third year of conversion. The UC Cooperative Extension Program has begun to promote its Integrated Pesticide Management training curriculum, and the recent waiver conditions for Waste Discharge Requirements caused 99% of landowners to enroll in continuing education classes

26
pertaining to IPM, and management practices for pesticide impact reduction to receiving waters. iv. Describe the manner in which BMPs or Management Measures are proposed to be implemented This project will be testing the efficacy of three types of Management Measures in reducing sediment toxicity: 1) Enrolling 1,000 additional contiguous stonefruit acres in the “Going Organic” program. 2) Establishing detention ponds collecting orchard runoff at each discharge point into Mill Creek and tributaries that prevent contaminated sediment from being transported into receiving waters. 3) Implementing a combination of Integrated Pest Management practices by 90% of the stonefruit farmers in the Dry Creek watershed (one of the tributaries to Mill Creek), cover crop and buffer strip BMPs according to recent UC Cooperative Extension handbooks. Detention pond engineering designs have already been approved by all necessary local, state, and federal agencies, and 90% of Dry Creek watershed farmers have already signed up for the demonstration program. v. Summarize how the effectiveness of project implementation will be measured We will measure effectiveness of the project by taking an initial sediment sample set (n=30) distributed randomly in the middle and lower reaches of Mill Creek and its two tributaries to assess pre-implementation sediment toxicity. These random samples will be augmented by targeted water samples at the confluence of the ditches draining the largest contiguous parcels enrolled in the “Going Organic” program and the confluence of Dry Creek and ten farm drain outlets. The water samples will receive a pesticide scan and will be analyzed for pyrethroid pesticides. In addition, samples will be taken concurrently with sediment samples according to the recently developed bioassessment methodology for low-gradient streams and analyzed for aquatic macroinvertebrates. The same sampling regime will be followed in Year 3 after implementation of pesticide reduction measures. vi. Determine, to the extent feasible, changes in flow pattern in affected water bodies N/A vii. Determine economic benefits of implementing project N/A. Not a requirement of AWQGP.
D. Project Activities or Tasks
Task 1: Project Management and Administration Task 2: Develop detailed monitoring plan, stating hypotheses to be tested, desired statistical power to be achieved, number of sampling sites required, and appropriate sample timing. Task 3: Develop Quality Assurance Project Plan linking project objectives with data quality objectives. Task 4: Work with UC Cooperative Extension staff to agendize feedback on monitoring plan by landowners and enhance participation in Dry Creek BMP pilot if necessary.
27
Task 5: Obtain access permission to candidate sampling sites (including replacement sites where permission is denied). Task 6: Conduct landowner outreach and use existing education material to enroll additional farmers in “Going Organic” program. Task 6: Implement pre-implementation sampling. Task 7: Work with landowners and UC Cooperative Extension staff to track implementation progress. Task 8: Conduct post-implementation sampling at the end of Year 2 and beginning of Year 3. Task 9: Assess data and write evaluation report. Task 10: Submit data to SWAMP database.
E. Category of Project Activities or Tasks: All project activities and tasks fall into the Load Reduction Category.
II. Project Goals & Desired Outcomes
The goals of this project are: 1) Demonstrate the environmental response to pesticide use reductions of 20%. 2) Contribute to achievement of TMDL target of zero sediment toxicity.
The desired outcomes of this project are:
1) Enrollment of an additional 1,000 contiguous acres in the “Going Organic” Program
2) Enrollment of 90% of Dry Creek farms in BMP testing program. 3) Reduction in pesticide use by 20% 4) Reduction of toxic”hits” between pre-project conditions and project implementation by 75%
5) Increase in benthic macroinvertebrate diversity
III. Project Performance Measures Table

Table 4: Example PAEP Elements for Load Reduction Activities in Reducing Pesticide-induced Sediment Toxicity from
Stonefruit Orchards in the Mill Creek Watershed
Project Goals
Desired Outcomes
Output Indicators
Outcome Indicators
Measurement Tools
and Methods
Targets
1. Demonstrate the
environmental
response to pesticide
use reductions of
20%.
1. Increase in contiguous
acreage in the “Going
Organic” Program.
2. Large-scale enrollment
of Dry Creek farms in
BMP testing program.
3. Pesticide use reduction
4. Reduction of sediment
toxicity
5. Increase in benthic
macroinvertebrate
diversity
1. No. of landowners
granting access
permission;
2. No. of contiguous acres
enrolled in “Going
Organic”
3. Number of Dry Creek
landowners participating
in monitoring plan
workshop
4. Number of Dry Creek
landowners following
implementation schedule
1. Percent reduction of
sediment toxicity hits
2. Percent increase in
aquatic
macroinvertebrate
diversity
3. Percent reduction in
pesticide use
4. Percent reduction in
pyrethroid
concentrations in
orchard drain water
1. Sed. tox. Bioassay
standard procedures;
2. Hayworth, J.D. and
G. Siemering. July
2003. Aquatic Pesticide
Monitoring Program
Phase 2 Monitoring
Plan. San Francisco
Estuary Institute,
Oakland, CA.
3. DFG, Rancho
Cordova, GC-ECD or
GCMS methods.
1. Enrollment of an additional 1,000
contiguous acres in the “Going
Organic” Program.
2. Enrollment of 90% of Dry Creek
farms in BMP testing program.
3. Statistically significant increase in
benthic marcroinvertebrate diversity.
4. Pesticide use reduction of 20%.
2. Contribute to
achievement of
TMDL target of
zero sediment
toxicity
Reduction of sediment
toxicity
1. No. of landowners
granting access
permission;
2. No. of contiguous acres
enrolled in “Going
Organic”
3. Number of Dry Creek
landowners participating
in monitoring plan
workshop.
4. Number of Dry Creek
landowners following
implementation schedule
1. Percent reduction of
sediment toxicity hits
2. Percent increase in
aquatic
macroinvertebrate
diversity
3. Percent reduction in
pyrethroid
concentrations in
orchard drain water
Same as above Reduction of toxic”hits” between pre-
project conditions and project
implementation by 75%.

Project Assessment and Evaluation Plan (PAEP) Outline Water Conservation, Reliability Enhancement, and Recycling
Northern Mill Creek Watershed Irrigation Improvement Project (Project)
I. Project Summary
A. Funding Program This Project is funded by an Agricultural Drainage Management Loan Program (ADMLP) created by the Water Conservation and Water Quality Bond Law of 1986.
B. Project Description
This Project will purchase high efficiency irrigation equipment, and backflush recycling systems, to prevent untreated irrigation wastewater, from polluting waters of the state. The equipment purchased will be leased and operated by the Northern Mill Creek Watershed Irrigation District (the District) to reduce drainage impacts and improve water use efficiency. This Project will conserve water; reduce the discharge of salt, boron, nitrogen, and sediment to Mill Creek; and provide greater drinking water supply reliability.
C. Problem Statement
The northern part of the Mill Creek Watershed has been a farming community since the 1800’s, when early immigrants first settled it. Over the years, the smaller diversified farms turned to larger monoculture businesses with more intensified farming. Salmon have historically used the Northern Mill Creek Watershed as a main conduit for travel to reach their spawning headwater streams. However, increased demand for irrigation water due to larger and more intensive farming has resulted in reduced habitat and warmer stream temperatures for fish. As a result, the salmon population within Mill Creek has been declining. Nitrogen loading from runoff, coupled with sediment runoff that contains phosphorus, has also contributed to algae blooms. And in some areas where the water table is low, nitrogen is able to infiltrate into ground water aquifers, which historically had been used as a main source for most of the community’s drinking water.
i. Identify or characterize baseline data Baseline data includes; District water use records for the past 5 Years; 10 years of Mill Creek flow and temperature data recorded by a USGS gauging station; and the Mill Creek Watershed Protection Group data from two sampling stations in the Northern Mill Creek Watershed for Nitrogen and Salinity, 3 hour average sampling for the past two summers.

30
Habitat surveys for juvenile salmonids have also been conducted the Past 3 summers by the Friends of Fish 4 Mill Creek (FoF4MC). Percent of Dominant Substrate, Pool Tail Embeddedness, Pool Tail Substrate, and Substrate Composition was recorded. Bank erosion was also recorded along a 4-mile stretch of stream within this watershed.
Records of average nitrogen samples taken over 10 years for a well under flood irrigated farmland. Within these 10 years, samples were taken by three previous landowners, with one taking as little as two samples, and one taking as many as 72 samples.
ii. Identify pollution source categories
The northern end of Mill Creek is surrounded by multiple highly intensive agricultural communities. These communities have expanded greatly as a result of a historical farming infrastructure, productive land, large-scale farming investments, and close proximity to distributers in nearby urban cities. As a result of the growth in the agricultural community and change in agricultural management practices, nitrogen, sediment, and salt-loading has increased. Nitrogen infiltration has also become a problem in aquifers over agricultural land with low water tables.
iii. Identify and describe current restoration activities; Best Management Practices (BMP’s); Load reduction activities; Prevention activities
A bank stabilization project was done on a .25 mile stretch of Mill Creek by the Friends of Fish 4 Mill Creek, to help deal with a sliding bank. Also, two of the farmers along Mill Creek are enrolled in the Conservation Reserve Program, and have developed a 250-foot buffer strip along each side of the stream. Although some small, separate projects have occurred, a larger more integrated approach needs to be taken.
iv. Describe the manner in which the proposed best management practices or management measures will be implemented
Loans will be made available to farmers in the District to replace their old irrigation systems with more effective high efficiency irrigation systems and backflush recycling systems. In doing so, farmers in the District will use less water, keep more nutrients on the ground and in the plants, and improve surface and ground water quality. The program will be advertised in monthly news flyers, at regular public meetings, special informational meetings, through an informational email list, by word of mouth during interaction with local farmers, and on the local radio station.
v. Summarize how the effectiveness of proposed practices or measures in preventing or reducing pollution will be determined

31
Amount of total water use by the District will be calculated and compared between years. Pollution reduction will be estimated by using the results from a study at Mill Creek University. The study will be looking at “average” concentrations of nitrogen, sediment, and salt for the various irrigation systems on the market for 4 different crops on local soil environments. Data from the study will be used to estimate the water quality improvement as a result of replacing equipment. Pollutant load reduction will be calculated based on quantity of water applied, type of equipment installed, and crop type. Calculations will be modified to account for change in soil type, as needed. The water quality pollutants will also be measured downstream of project areas over the next 10 years to help determine project success. For at least one site, monitoring of well water will be conducted, using a University lab. Samples have been collected at this location over the past 10 years, as a result of the interest from past owners who had either lived on the land or wanted to pump the water to a nearby track of land for residential use. Another set of samples will be taken 6 months before installation of the equipment and every year following the installation until the end of the Useful Project Life.
vi. Determine “Changes in flow pattern” in affected water bodies
The District plans to conserve 1,580 acre-feet of water in the next two years by replacing its inefficient irrigation systems with more efficient irrigation systems. If this project is shown to be successful, more projects like this may be implemented in the future, allowing for more water savings. The District also plans to completely stop the infiltration of nitrogen to a groundwater aquifer on agricultural land that has a low groundwater table.
vii. Determine economic benefits of implementing project
Although there is a price tag of approximately $1,241/acre for replacement of the old equipment, the price of not replacing such equipment, is likely to create other costs now and in the future. Such costs include, reduced water supply reliability, reduced sport & commercial fishing, reduction in genetic pool & biodiversity on neighboring preservation land, and reduced property values. If these practices are implemented throughout the District, the benefit for replacement will out weigh the costs, through improved quality of life for individuals and the community.
D. The Following Project Activities or Tasks will be Completed to Address the Issues or Problems:

32
Task 1. Administrative Responsibilities. Provide all technical and administrative services needed for Project Completion; monitor, supervise, and review all work performed; and coordinate budgeting and scheduling to assure that the Project is completed within budget, on schedule, and in accordance with approved procedures, applicable laws, and regulations. This includes, but is not limited to:
(A) Establishing the acquisition, administrative and leasing criteria necessary to implement the Project.
(B) Establishing criteria for estimating the improvements in efficiency that will result from irrigation improvements through equipment acquisitions, and for determining whether or not applicants for irrigation improvement leases are credit-worthy.
(C) Ensuring that the growers understand that they may be subject to periodic inspections.
(D) Establishing separate and complete records and files on leases made to growers for irrigation equipment acquired under the terms of this
agreement.
(E) Accounting procedures shall be in accordance with generally accepted accounting principles and practices, consistently applied, and shall provide sufficient and effective accountability and control of all Project funds.
Task 2. Outreach
Conduct continuous outreach to farmers and equipment dealers to encourage participation in the program.
Task 3. Acquire “the Equipment”.
Adopt a formal bid process on each project. Purchase high efficiency irrigation equipment, and backflush recycling systems by awarding subcontract(s) to appropriate organization(s) to perform tasks as outlined in the Agreement, Document steps taken in soliciting and awarding the subcontract, and submit
them to the State Water Board’s Project Representative for review. Task 4. Supervise Construction/Installation
Ensure that equipment acquired under the terms of this agreement is constructed and installed correctly and expeditiously.
Task 5. Lease “the equipment” Lease the equipment and systems (collectively, “the equipment”) to contracted growers.

33
Task 6. Calculate Post Implementation Results Compare the expected or the actual result in efficiency of new systems to baseline data and calculate water conservation and reduction in pollutant load (sediment, salt etc.).
Task 7. Reporting
Expeditiously provide, during implementation and upon completion of the Project and thereafter during the Useful Life of the Project, such reports, data, and information as may be reasonably required by the State Water Board’s Project Representative, including but not limited to material necessary or appropriate for evaluation of the State Water Board’s program or to fulfill any reporting requirements of the state government. Examples of these include: (A) Progress Reports. Submit quarterly progress reports during Project Implementation. The description of activities and accomplishments of each task during the quarter shall contain sufficient detail to provide a basis for payment of invoices and shall be translated into percent of task work completed for the purpose of calculating invoice amounts.
(B) Project Assessment and Evaluation Plan. Shall provide data
consistent with the format, schedule and other guidelines specified and shall be approved by the State Water Board’s Project Representative.
(C) Final Project Summary Report. Submit to the State Water Board’s
Project Representative a copy of a Final Project Summary Report within 60 days following Project Completion.

34
E. Category of Project Activities or Tasks:
Tasks Category
1. Administrative Responsibilities Planning, Research, and Assessment
2.Outreach Education, Outreach, and Capacity-building
3. Acquire "the Equipment" Water Conservation, Reliability Enhancement, and Recycling
4. Supervise Construction/Installation Water Conservation, Reliability Enhancement, and Recycling
5. Lease "the Equipment" Water Conservation, Reliability Enhancement, and Recycling
6. Calculate Post Implementation Results Planning, Research, and Assessment
7. Reporting Planning, Research, and Assessment
II. Project Goals & Desired Outcomes
(Unless otherwise stated, the following goals will be accomplished by the Mill Creek Water District and will occur by project completion.)
The goals of this project are:
1. Conserve water used for irrigation purposes within the District by installing high efficiency irrigation equipment, allowing more water to remain in the stream for aquatic life. 2. Recycle water in the District to allow for more water to remain the stream for aquatic life.
3. Reduce tailwater in the District to protect against public health hazards. 4. Improve the reliability of low groundwater aquifers (that reside under agricultural land) as a source for drinking water purposes.

35
The desired outcomes of this project are:
1. 1,580 acre feet of water that is diverted from irrigation use to remain in Northern Mill Creek for aquatic life. 2. 15,800 acre feet of water that is diverted from irrigation use to remain in Northern Mill Creek for aquatic life by the year 2020.
3. 2º C Colder water in refugia pools to reduce the stress of migrating salmonids by the year 2025.
4. 250 acre-feet of water treated and recycled back onto farmland to remain in Northern Mill Creek for aquatic life.
5. 90% of farms in the District without tailwater to prevent against public health
hazards.
6. Elimination of all Tailwater from the District to protect again public health hazards by 2020. 7. A policy set in place restricting tailwater. 8. Provide for improvement in at least one well, through this project to act as an example for others with low water tables over agricultural land in the District. 9. Three aquifers in the district that meet the drinking water standard within the next 50 years.

36
III. Project Performance Measures Table Table 5
Water Conservation, Supply Reliability Enhancement & Recycling Northern Mill Creek Agricultural Drainage Management Loan (ADMLP) Program
Project Goals
Desired
Outcomes
Output Indicators
Outcome Indicators
Measurement Tools
& Methods
Targets
1. Conserve water used for irrigation purposes within the District by installing high efficiency irrigation equipment, allowing more water to remain in the stream for aquatic life
1. More water in the creek for aquatic life. 2. Colder water in refugia pools to reduce the stress of migrating salmonids.
1. Pages of Water Use Records 2. Number of high efficiency irrigation units installed. 3. Pages of Temperature Data.
1. Number of Acre- feet of water conserved. 2. Number of Acre- feet of water conserved 3. Degree in temperature decrease.
1. Tools- District Water Use Records Methods- Calculate an average year of water use from the stream before equipment installation and after equipment installation.
2. Tools- District Water Use Records Methods- Calculate an average year of water use from the stream before equipment installation and after equipment installation.
3. Tools- Hobo Temperature Autosampler recorded during salmonid migration season by FoF4MC. Methods-Compare average yearly temperature before and after installation of equipment.
1. Conserve 1,580 acre feet of water by project completion. 2. Conserve 15,800 acre feet of water by the year 2020. 3. Decrease in average refugia holding pools temperature by 2º C for by the year 2025.
2. Recycle water in the District to allow for more water to remain the stream for aquatic life.
1. More water in the Creek for aquatic life 2. Colder water in refugia pools to reduce the stress of migrating salmonids.
1. Pages of Water Use Records 2. Number of tailwater recirculation units installed. 3. Pages of Temperature Data.
1. Number of Acre- feet of water recycled 2. Degrees in temperature decrease
1. Tools-Water Use Records from the District Methods Calculate an average year of re-use of water before & after equipment installation
2. Tools-HoboTemperature Autosampler, Methods: FoF4MC record hourly temperature data in holding pools during salmonid migration seasons and compare over time
1. 250 Acre-Feet of water recycled by the end of the Useful Life of the Project. 2. Decrease in average refugia holding pools temperature by 2º C by the year 2025.
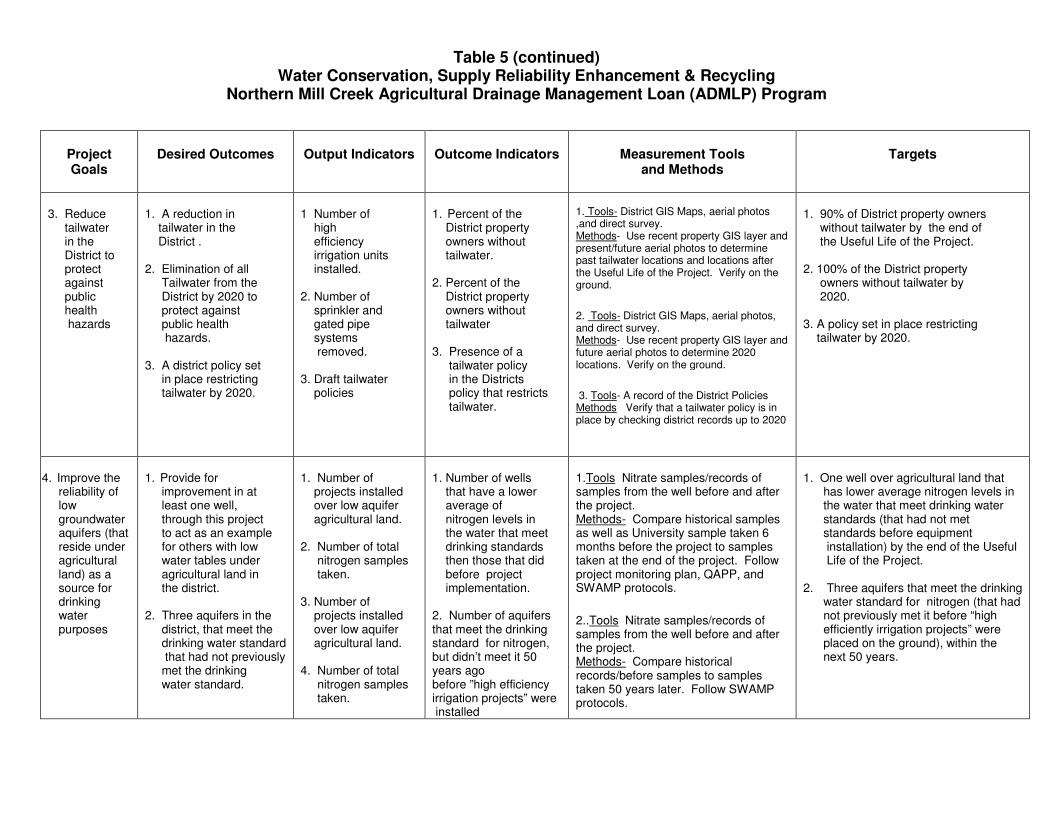
Table 5 (continued) Water Conservation, Supply Reliability Enhancement & Recycling
Northern Mill Creek Agricultural Drainage Management Loan (ADMLP) Program
Project Goals
Desired Outcomes
Output Indicators
Outcome Indicators
Measurement Tools
and Methods
Targets
3. Reduce tailwater in the District to protect against public health hazards
1. A reduction in tailwater in the District . 2. Elimination of all Tailwater from the District by 2020 to protect against public health hazards. 3. A district policy set in place restricting tailwater by 2020.
1 Number of high efficiency irrigation units installed. 2. Number of sprinkler and gated pipe systems removed. 3. Draft tailwater policies
1. Percent of the District property owners without tailwater. 2. Percent of the District property owners without tailwater 3. Presence of a tailwater policy in the Districts policy that restricts tailwater.
1. Tools- District GIS Maps, aerial photos ,and direct survey. Methods- Use recent property GIS layer and present/future aerial photos to determine past tailwater locations and locations after the Useful Life of the Project. Verify on the ground.
2. Tools- District GIS Maps, aerial photos, and direct survey. Methods- Use recent property GIS layer and future aerial photos to determine 2020 locations. Verify on the ground.
3. Tools- A record of the District Policies Methods Verify that a tailwater policy is in place by checking district records up to 2020
1. 90% of District property owners without tailwater by the end of the Useful Life of the Project. 2. 100% of the District property owners without tailwater by 2020. 3. A policy set in place restricting tailwater by 2020.
4. Improve the reliability of low groundwater aquifers (that reside under agricultural land) as a source for drinking water purposes
1. Provide for improvement in at least one well, through this project to act as an example for others with low water tables under agricultural land in the district. 2. Three aquifers in the district, that meet the drinking water standard that had not previously met the drinking water standard.
1. Number of projects installed over low aquifer agricultural land. 2. Number of total nitrogen samples taken. 3. Number of projects installed over low aquifer agricultural land. 4. Number of total nitrogen samples taken.
1. Number of wells that have a lower average of nitrogen levels in the water that meet drinking standards then those that did before project implementation. 2. Number of aquifers that meet the drinking standard for nitrogen, but didn’t meet it 50 years ago before ”high efficiency irrigation projects” were installed
1.Tools Nitrate samples/records of samples from the well before and after the project. Methods- Compare historical samples as well as University sample taken 6 months before the project to samples taken at the end of the project. Follow project monitoring plan, QAPP, and SWAMP protocols.
2..Tools Nitrate samples/records of samples from the well before and after the project. Methods- Compare historical records/before samples to samples taken 50 years later. Follow SWAMP protocols.
1. One well over agricultural land that has lower average nitrogen levels in the water that meet drinking water standards (that had not met standards before equipment installation) by the end of the Useful Life of the Project. 2. Three aquifers that meet the drinking water standard for nitrogen (that had not previously met it before “high efficiently irrigation projects” were placed on the ground), within the next 50 years.

Project Assessment and Evaluation Plan (PAEP) Outline Flood Attenuation and Floodplain Protection
Mill Creek Wetland Restoration
I. Project Summary
A. Funding Program: This Project is funded by Proposition 50 Coastal Nonpoint Source Program (CNPS).
B. Project Description: The City of Millstone (the City) will purchase the remaining center acre of a 124 piece of land along the mainsteam of Mill Creek, which drains to the Ocean. This tributary is the main channel that salmon and steelhead enter when returning to the Northern and Southern tributaries during fall runs. Through this project, the City will restore the entire 124 acre track to its original condition, to provide flood attenuation, floodplain protection, and restore salmonid habitat.
C. Problem Statement: At the base of the Mill Creek watershed, Millstone, a medium sized port town, was established in the 1800’s. Shippers found it an easy access point from which to sell and buy goods. Many fishermen also called Millstone home, and made a living catching various fish around the port. Salmon have historically used the Mill Creek watershed as a main conduit for travel to reach their spawning headwaters above Northern and Southern Mill Creek. Since the 1800’s, Millstone has grown from a medium sized port town to a large industrial city. As a result of this urbanization, the historic estuary that once was home to many birds and wildlife and offered flood protection, has diminished to half its historic size. The berms that protect this now booming metropolis are growing old. The fishing is not what it used to be, and the birds and wildlife numbers are dwindling, as a result of lack of habitat.
The City has recently come to the conclusion that with the decline in the fisheries industry, tourism, and threat of failing levees, this growth is not sustainable and is now working to acquire land in the floodplain. This project is part of the City's overall plan to provide flood protection, preserve open space, and restore fisheries habitat. i. Identify or characterize baseline data Baseline data includes county aerial photos taken every 5 years over the past 50 yrs., GIS digitized wetland areas from 1996, 1900’s fish processing numbers, Department of Fish and Game last 20 years spawning surveys, and 10 years of water quality data from USGS stations upstream and downstream of the site.

39
ii. Identify pollution source categories Wetland restoration will provide flood protection and habitat, as well as reduce other pollution sources upstream. This pollution includes, urban runoff from pesticides, fertilizers, and heavy metals from water recycling, along with nitrogen & sediment from the Northern Mill Creek Watershed. iii. Identify and describe current restoration activities; Best Management Practices (BMP’s); Load reduction activities; Prevention activities
The city has required all property within 2 miles of the designated estuary property, be rezoned as the property becomes available for sale. A conservation fund has been set up, from which various sources contribute. Among these sources are CEQA mitigation funds from past projects. This fund has been used to purchase back the sold land for fair market value once it became available. The same fund will be used to purchase the remaining piece of land.
iv. Describe the manner in which the proposed best management practices or management measures will be implemented
The 1 acre section of land will be purchased at appraised value. The project will then research the best design for the 124 acres to provide the most effective habitat, water quality, flood protection, and flood attenuation. The plans will be drawn up and the best plan will be chosen. Construction will then occur. The old building wreckage, concrete bases, old drainage pipes, and remaining warehouse will be removed. Berms will be placed on the border of the east side of the 124 acre property using material from the berms on the west side. Native seed from surrounding wetlands will be brought in to speed the restoration process.
v. Summarize how the effectiveness of proposed practices or measures in preventing or reducing pollution will be determined Water quality is monitored from a USGS station upstream and downstream of the site. Data will be compared before and after the project. The restoration itself will be monitored over the next 10 years. Soils, hydrology, and plants will be surveyed to make sure the ecosystem comes back. Wetland health will be monitored and rated. Flood protection will be estimated by determining storage through post- construction surveys and measurement of stage levels. A model will be used to determine yearly flood storage and storm protection.
vi. Determine “Changes in flow pattern” in affected water bodies The USGS Stations will monitor flow readings before and after wetland creation. Precipitation, high water tides, and water storage will all be
determined through modeling before the wetland is created. The wetland will then be created. Surveying be performed to compare the estimated model with the actual numbers.
vii. Determine economic benefits of implementing project Economic benefits include flood protection, flood attenuation, fisheries enhancement, and tourism investment. Millstone tourism business has

40
always been a prominent part of the city, with historic downtown shops, famous breweries, and candy production plant; 15% of the economy is generated by tourism dollars. However, with the new demand for ecotourism, new ecotour businesses are drawing even more people to the town with tours of the Millstone estuary, nature walks, canoe trips, kayaking, whale watching, and private charters for salmon fishing. Adding to the estuary will help this new tourism to continue to grow, and may reach upwards of 20% of the cities economy.
D. The Following Project Activities or Tasks will be Completed to Address the Issues or Problems:
Task 1. Project Management and Administration. Provide all technical and administrative services as needed for Project Completion; monitor, supervise,
and review all work performed; and coordinate budgeting and scheduling to ensure the Project is completed within budget, on schedule, and in accordance with approved procedures, applicable laws, and regulations.
Task 2. Purchase the Land
Have the land appraised and purchase the land for fair market value.
Task 3. Complete all CEQA and Permitting Obtain all required permits from the designated agencies. Task 4. Design the Wetland Using a modeling program, past construction maps, and surrounding environmental details, design a wetland area that will provide the most water quality, habitat, flood attenuation, and floodplain protection benefits, at a reasonable cost.
Task 5. Construction Remove all old building wreckage, concrete bases and the remaining warehouse from the land. Regrade the land, using the design plans. Dredge fill material from on site, including the current berm, to build the new berm.
Task 6. Post Construction Surveying Verify post-construction elevations match the design and pre-construction model.
Task 7. Reseed and Replant with Native vegetation Use surrounding native plant material to accelerate the restoration process through reseeding and transplanting. Task 8. Monitoring, (Survey the Wetland & Water Quality) Survey the wetland each year during the dry and wet season. Monitor the wetland health by characterizing soils, hydrology, and plants. Monitor water storage and water quality.

41
Task 9. Calibrate the model with real time data Compare the real wetland data with the modeling data. Calibrate the model to the wetland. Using real time data, predict future wetland health and estimate load reductions, habitat benefit, floodplain protection, and flood attenuation over the next 40 years.
Task 10. Reporting Expeditiously provide, during implementation or upon
completion of the Project and thereafter during the Useful Life of the Project, such reports, data, and information as may be reasonably required by the State Water Board’s Project Representative, including but not limited to material necessary or appropriate for evaluation of the State Water Board’s program or to fulfill any reporting requirements of the state government. Examples of these include: (A) Progress Reports Submit quarterly progress reports during Project Implementation. The description of activities and accomplishments of each task during the quarter shall contain sufficient detail to provide a basis for payment of invoices and shall be translated into percent of task work completed for the purpose of calculating invoice amounts. (B) Project Assessment and Evaluation Plan. Shall provide data consistent with the format, schedule and other guidelines specified and shall be approved by the State Water Board’s Project Representative. (C) Final Project Summary Report. Submit to the State Water Board’s
Project Representative a copy of a Final Project Summary Report within 60 days following Project Completion.

42
E. Category of Project Activities or Tasks:
Tasks Category
1. Project Management & Administration Planning, Research, and Assessment
2. Purchase the Land Flood Attenuation and Floodplain Protection
3. Complete All CEQA & Permitting Planning, Research, and Assessment
4. Design the Wetland Planning, Research, and Assessment
5. Construction (Building Removal, Land Grading & Berm) Flood Attenuation and Floodplain Protection
6. Post Construction Surveying Planning, Research, and Assessment
7. Reseed & Replant with Native vegetation Habitat Restoration
8. Monitoring (Survey the Wetland & Water Quality) Planning, Research, and Assessment
9. Calibrate the Model with Real Time Data Planning, Research, and Assessment
10. Reporting Planning, Research, and Assessment
II. Project Goals & Desired Outcomes (Goals are to occur by the end of the project and be performed by Millstone (the City) unless stated otherwise.)
The goals of this project:
1. Purchase the remaining acre of floodplain land from Pacific Packaging with Conservation Fund money within the first six months of the project to be used for floodplain protection. 2. Construct a wetland that reflects the best representation of the design specifications to provide for flood plain protection and flood attenuation. 3. Construct a 124 acre wetland that provides 186 acre feet of protection against flooding for flood attenuation. 4. Provide 390 acre-feet of water storage in one continuous corridor of wetland habitat in the event of a flood for flood attenuation. 5. Produce a wetland with stable native vegetation within 20 years of planting that provides a breaker which on average slows the velocity of water by 3% in winter storm surges for floodplain protection. The desired outcomes of this project are:
1. The last needed acre of the 124 acres of land under the ownership of the City by the first six months to be used for floodplain protection
2. A wetland on the ground that reflects the best representation of the design specifications in order to provide the best flood plain protection and flood attenuation.

43
3. A wetland that provides 186 acre-feet of protection against flooding.
4. A flood catchment area that is large enough to hold 390 acre-ft of water storage in the event of a flood.
5. A wetland with stable native vegetation within the 20 years of planting that provides a breaker, which on average slows the velocity of water in winter storm surges by 3%.

44
III. Project Performance Measures Tables Table 5
Flood Attenuation and Floodplain Protection Mill Creek Wetland Restoration
Project Goals
Desired
Outcomes
Output Indicators
Outcome Indicators
Measurement Tools
and Methods
Targets
1. Purchase the remaining acre of floodplain land from Pacific Packaging with Conservation Fund money within the first six months to be used for flood protection.
1. The acre of land under the ownership of the City by the first six months to be used for floodplain protection.
1. Escrow Paper Work 2. Records of funds transferred from the Conservation Fund to Pacific Packaging. 3. Property appraisals.
1. The Deed to the land with the City’s signature
1. Calendar & Deed- Has the deed been signed 6 months after contract approval? Yes-met goal, No-didn’t
1. A Deed signed over to the City
6 months after contract signature.
2. Construct a wetland that reflects the best representation of the ideal design specifications to provide for the best flood plain protection and flood attenuation
1. A wetland that reflects the best representation of the design specifications (see planning table for goals of ideal design specifications) in order to provide the best flood plain protection and flood attenuation.
1. Check forms/notes from 3 horticulturalists. 1. List of horticulturalists that reviewed the wetlands. 2. Check forms/notes from 3 hydrologists. 2. List of hydrologists that reviewed the wetlands. 3. Check forms/notes from 3 soil scientists. 3. List of soil scientists that reviewed the wetlands.
1. Number of wetlands that incorporate the plants as specified in the PDS, as seen by 3 project horticulturalists. 2. Number of wetlands that incorporate the hydrology as specified in the HDS, as seen by 3 project hydrologists. 3. Number of wetlands that incorporate the soil as specified in the SDS, as seen by 3 project soil scientists.
1. Tools: Plant Design Specs. (PDS) Method: Use the PDS to compare to the finished project to see if the finished project represents the PDS. 2. Tools: Hydrology Design Specs. (HDS) Method: Use the HDS to compare to the finished project to see if the finished project represents the HDS. 3. Tools: Soil Design Specs. (SDS) Method: Use the SDS to compare to the finished project to see if the finished project represents the SDS.
1. A wetland that incorporates the plants as specified in the plants design specifications, as seen by 3 project horticulturalists. 2. A wetland that incorporates the hydrology as specified in the hydrology design specifications as seen by 3 project hydrologists. 3. A wetland that incorporates the soils as specified in the soil design specifications as seen by 3 project soil scientists.

45
Table 5 (Continued) Flood Attenuation and Floodplain Protection
Mill Creek Wetland Restoration
Project Goals
Desired
Outcomes
Output Indicators
Outcome Indicators
Measurement Tools
and Methods
Targets
3. Construct a 124 acre wetland that provides 186 acre- feet of protection against flooding for flood attenuation
1. A wetland that provides 186 acre-feet of protection against flooding.
1. Number of transects taken. 1. Average depths of water across each transect.
1. Number of acre-feet of protection against flooding for flood attenuation.
1. Tools:-Wetland 3-D (Model) Method: Transects will be taken after the grading. A 3-D model will be built using the dimensions of the wetland project and the flow data. The acre-feet storage will be determined
1. 124 acre wetland that
provides 186 acre-feet of protection against flooding for flood attenuation
4. Provide 390 acre- feet of water storage area in one continuous corridor of wetland habitat in the event of a flood for flood attenuation. .
1. A flood catchment area that is large enough to hold 390 acre-ft of water storage in the event of a flood.
1. Pages of past depth and flow records 2. Wetland area that links to the new wetland. .
1. 390 Acre-Feet of water storage area in one continuous wetland habitat corridor.
1. Tools: GIS Aerial Photos Past Depth and Flow Records of Historic Wetlands, and New Estimates of the constructed wetland.
Method: Map the wetland habitat in the City using GIS to determine what areas are continuous. Using past historic wetland records determine the storage within the historic wetlands that link to the new wetland and add the new numbers determined from the constructed wetland.
1. Provide 390 acre-feet of water storage area in one continuous corridor of wetland habitat in the event of a flood for flood attenuation.
46
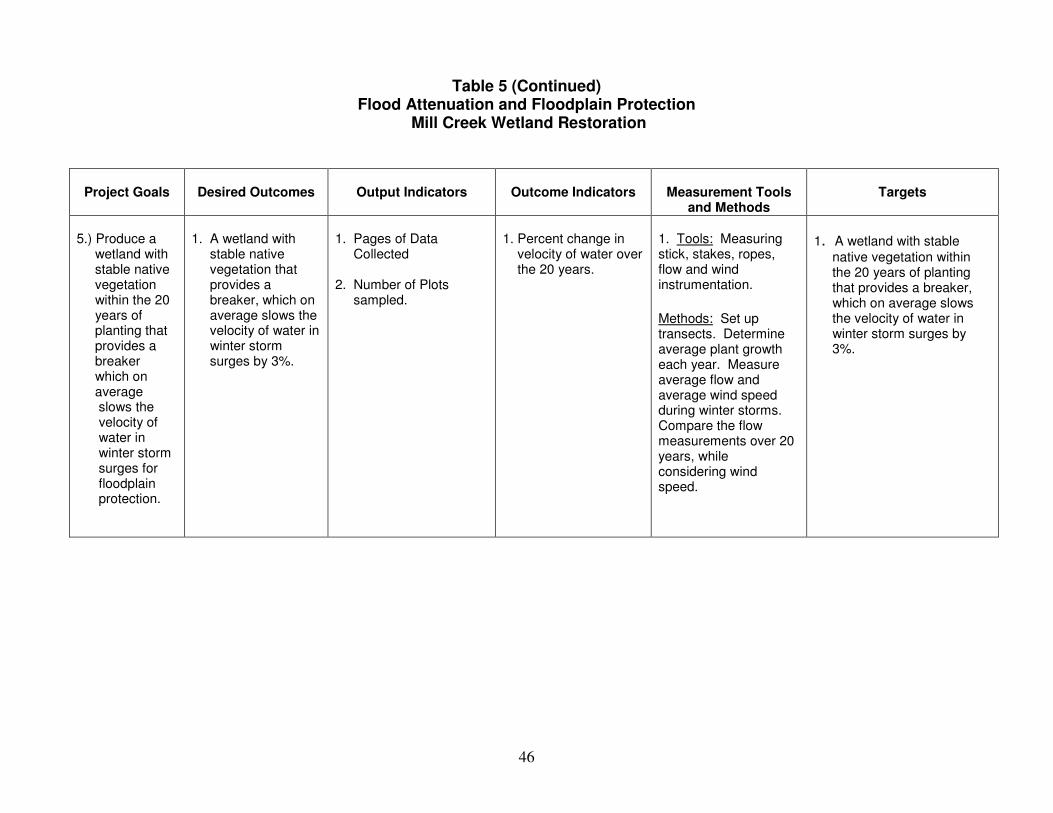
Table 5 (Continued) Flood Attenuation and Floodplain Protection
Mill Creek Wetland Restoration
Project Goals
Desired Outcomes
Output Indicators
Outcome Indicators
Measurement Tools and Methods
Targets
5.) Produce a wetland with stable native vegetation within the 20 years of planting that provides a breaker which on average slows the velocity of water in winter storm surges for floodplain protection.
1. A wetland with stable native vegetation that provides a breaker, which on average slows the velocity of water in winter storm surges by 3%.
1. Pages of Data Collected 2. Number of Plots sampled.
1. Percent change in velocity of water over the 20 years.
1. Tools: Measuring stick, stakes, ropes, flow and wind instrumentation.
Methods: Set up transects. Determine average plant growth each year. Measure average flow and average wind speed during winter storms. Compare the flow measurements over 20 years, while considering wind speed.
1. A wetland with stable
native vegetation within the 20 years of planting that provides a breaker, which on average slows the velocity of water in winter storm surges by 3%.