provenance: information for shared understanding · 2012-03-08 · provenance: information for...
TRANSCRIPT
17th ICCRTS
“Operationalizing C2 Agility”
Provenance: Information for Shared Understanding
Topics:
Primary: Data, Information, and Knowledge
Secondary: Architectures, Technologies, and Tools
Tertiary: Collaboration, Shared Awareness, and Decision Making
Names of Authors
M. David Allen The MITRE Corporation
7515 Colshire Drive
McLean, VA 22102
804-288-0355
Dr. Adriane Chapman The MITRE Corporation
7515 Colshire Drive
McLean, VA 22102
703-983-7140
Dr. Barbara Blaustein The MITRE Corporation
7515 Colshire Drive
McLean, VA 22102
703-983-5881
Point of Contact
M. David Allen The MITRE Corporation
7515 Colshire Drive
McLean, VA 22102
804-288-0355
Provenance: Information for Shared Understanding
M. David Allen, Adriane Chapman, Barbara Blaustein
The MITRE Corporation
{dmallen, achapman, bblaustein} @ mitre.org
Abstract– Agile command and control (C2) systems allow users to draw upon diverse resources to solve complex
problems. This paper describes data provenance technology being developed to support shared understanding of information
and to better equip users to assess the suitability of shared information. We describe a provenance system, PLUS, and show
how it can be used to assist in assessing trust and system quality. In addition, we describe novel and minimally invasive
approaches to capture provenance automatically within distributed, heterogeneous C2 systems, and we compare the
engineering costs and benefits of these approaches.
Index terms—provenance, trust, lineage, pedigree, agile systems, capture
I. INTRODUCTION
Threats to national security typically morph over time, and take unanticipated forms. The practice of information
technology continually seeks to provide flexible systems that permit adaptation to issues that cannot be foreseen. Trends
in the way that command and control (C2) systems are built to provide this flexibility mean increasing reliance on
networked services and on information of all sorts, including open source, received via the Internet and from multi-
national coalitions. Government mandates to increase information sharing are also widening the technical scope of C2
information systems, by requiring their interaction with other systems outside of their natural user scope. Command and
control systems must be agile enough to face these new, complex, and changing situations [21]. As stated in The Agility
Advantage [1] (p. 335),
“By their very nature, complex endeavors require information and expertise that is widely dispersed. As a result,
organic information is insufficient and information sharing is needed to construct an accurate picture of what is
occurring. In complex endeavors it is not sufficient for just one person (the head of an organization) to have the
answer. Rather the development of an adequate level of shared understanding is a prerequisite for a coherent
and effective response.” (emphasis added)
This paper describes technology being developed to support shared understanding of information and to better equip
users to assess the suitability of shared information.
Provenance1 is “information that helps determine the derivation history of a data product...[It includes] the ancestral
data product(s) from which this data product evolved, and the process of transformation of these ancestral data product(s)”
[19]; it is, the family tree of data creation and manipulation. Data provenance enhances the utility of information by
adding context. First, provenance information helps users to make trust decisions about data, by providing them the
information they need to assess how much to trust data from unfamiliar sources. Second, provenance helps users
understand the impact of erroneous data or defective processes. Finally, provenance information provides essential records
for forensic investigations that seek to link available data, processing chains, and outcomes. Provenance is typically
captured by observing a system as it is running and reporting the information to a provenance manager. We call the
software which captures provenance a provenance reporter.
As a simple running example, we will examine airborne surveillance reports used by analysts and automated processes
to locate high value targets. These collaborations require the participation, services, and data of multiple military and
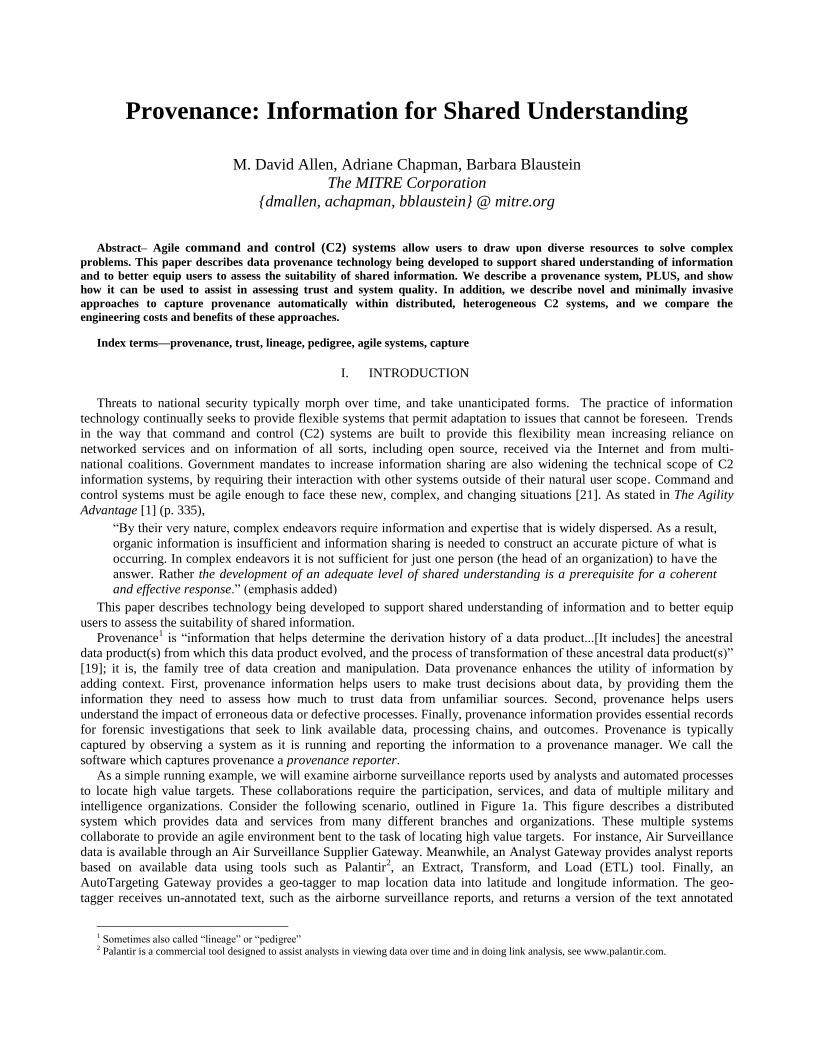
intelligence organizations. Consider the following scenario, outlined in Figure 1a. This figure describes a distributed
system which provides data and services from many different branches and organizations. These multiple systems
collaborate to provide an agile environment bent to the task of locating high value targets. For instance, Air Surveillance
data is available through an Air Surveillance Supplier Gateway. Meanwhile, an Analyst Gateway provides analyst reports
based on available data using tools such as Palantir2, an Extract, Transform, and Load (ETL) tool. Finally, an
AutoTargeting Gateway provides a geo-tagger to map location data into latitude and longitude information. The geo-
tagger receives un-annotated text, such as the airborne surveillance reports, and returns a version of the text annotated
1 Sometimes also called “lineage” or “pedigree” 2 Palantir is a commercial tool designed to assist analysts in viewing data over time and in doing link analysis, see www.palantir.com.
with latitude and longitude coordinates for each place name. Suppose that a Target Acquisition Officer, wishing to
identify the value of certain target locations, queries the distributed system for information about people likely to be at
certain locations. To answer these queries, the system draws upon multiple different services and data sources and
identifies people of interest likely to be at a certain location. Figure 1b and Figure 1c record two different ways this search
could proceed. If the search proceeds as shown in Figure 1b, it produces two results: a geo-tagged airborne surveillance
report and a Palantir model file generated by an analyst. If the search proceeds as in Figure 1c, the same two results are
returned. However, the quality of the returned results shown in Figure 1b and Figure 1c are distinctly different: different
numbers of sources were used in each case (one and two air surveillance files respectively). Figures 1b and 1c are
screenshots from our provenance tool, modified to use generic names of tools and people, to protect sensitive information.
Without these provenance graphs, the officer would not know how the search was accomplished and would not be able to
assess the quality of the results. These two provenance graphs demonstrate that the analyst cannot determine whether the
reports independently corroborate one another without provenance information, and consequently the analyst cannot
determine the reliability and actionability of the information.
The provenance graph can inform a user of the exact data sources and processing steps which produce each piece of
information, improving the user’s ability to assess the accuracy and reliability of the information. The basic graphs show
names and connections only, but actual provenance systems will typically store many additional details about the
processes and data in question, in some cases including technical details of settings used to generate that information. If a
problem is detected in the tools used by the distributed system, such as a mismatch in the coordinate systems used by two
geo-taggers which results in inaccurate latitude and longitude information, the system can trace through the provenance
graph to identify all of the affected customers and targets. Similarly, if future investigation shows that the system was
corrupted or attacked and therefore produced bad data, subsequent users of that data can be informed by tracing forward
through the graph to discover downstream users of that data.
In order to help understand the family tree of data, the provenance system must include certain basic information: what,
when, who, where, how, why. In general, the basic information captured for each provenance item is: what the data or
service was, a timestamp (when), who ran it, where it was executed, any parameters used (how), and where its inputs came
Distributed
system
Air Data Supplier Gateway
Auto TargetterGateway
Analyst Gateway
Target Acquisition
Service
ETL Tool
Palantir
Analyst
Geo-Tagger
Air Sur-veillance
Data
a) System components b) Provenance graph 1 c) Provenance graph 2
Target Acquisition
Officer
Figure 1. Multi-organizational collaboration to locate a target. a) The participants provide data and services in the distributed system.
Together, these different capabilities are used in a specific workflow. b) A sample provenance graph. The ovals represent data (files or
database entries), while rectangles denote processes (i.e. an execution of a software tool). c) A second sample provenance graph
showing the same use of tools, but with two Air Surveillance Reports providing the raw data instead of only one.
from and outputs went to (why). Additional information, in the form of annotations, can also be stored with the basic
provenance information—for example, a given user’s assessment of the quality of a particular data source. The
fundamental principle is that the basic provenance information is an historical record of what actually happened
and, as such, must be captured as processes are executed and as data is modified within each organization. Note
that this is qualitatively different from the prescriptive notions of workflows or business processes, which describe what
was supposed to have happened. Workflows or business processes may contain conditional statements (if this condition,
then this execution path) or loops describing their logic; provenance has neither conditionals nor loops. It is a directed
acyclic graph that could be described as the execution history of a workflow.
The remainder of this paper is organized as follows. Section II describes the PLUS prototype provenance manager. We
then show how PLUS supports the agile environment application needs described above: trust assessment, and taint
analysis (both in Section III). The only way these new capabilities can be provided to a user is to install provenance
reporters in the distributed system. In Section IV, we discuss capture techniques based on different engineering
approaches. In Sections V and VI, we provide experimental evidence of the developmental cost of capturing provenance,
and guidance on where to install provenance reporters within the system. We discuss related work and conclude in
Sections VII and VIII respectively.
II. PLUS
PLUS [8] is a provenance manager developed at The MITRE Corporation to address the following previously unmet
requirements shared by most of our U.S. government customers:
“Open world” collection in distributed, heterogeneous environments [2] which enables the use of provenance in real-
world government systems;
Flexible annotation management over provenance, which enables a number of important analysis applications,
including the “taint analysis” application in Section III;
Attribute-based access controls which enable flexible sharing of provenance across different classes of users with
different privilege levels [20], and;
Security techniques which enable the provision of informative provenance even when the sensitivity of certain nodes
or edges precludes sharing the entire graph [6].
Once provenance information is captured as discussed in Section IV, it must be stored for later use. PLUS can be run
as a stand-alone manager with a centralized repository or as a set of provenance managers and repositories distributed
across organizations [3]. PLUS uses a MySQL database for provenance storage, and it models provenance similar to the
emerging Open Provenance Model standard [18]. A provenance graph is a directed acyclic graph (DAG), , containing a set of nodes, , and a set of edges, . Each node has a set of features describing the process or data it
represents, e.g., timestamp, description, etc. Edges in the graph denote relationships, such as usedBy, generated,
inputTo, etc., between nodes in the graph. A provenance graph may include disconnected sub-graphs.
A data node can represent any object the user wishes to register, for example, strings, files, XML messages, relational
data items of arbitrary granularity, etc. The data itself is not stored in the PLUS system for security and archiving reasons;
such storage is best delegated to an underlying system or historical database. However, the provenance capture
mechanisms can provide any additional “breadcrumbs,” such as access method and identifier, to allow users to access the
underlying information. In addition to basic provenance data, users may annotate any node in a provenance graph with
additional metadata.
III. ASSESSING TRUST IN INFORMATION
Even when collaborating C2 partners have a clear picture of the overall set of services and data available, they may
only understand the details of services and data in their local systems. For example, consider the collaborative effort in
Figure 1a to identify high value targets. An analyst may understand the minutiae of link analysis, but have no idea of
which software services or data sources were used to perform geo-tagging. Some users may give greater credibility to
some services above others, or they may be wary of using information based on open source data. In a distributed system
other users with different missions will invariably have different perspectives and criteria. Additionally, as seen in Figure
1b and Figure 1c, the possible variations in combinations of data and service can lead to less trustworthy information, i.e.
that supported by less data, or using poor services, etc.
Provenance gives participants greater information about actions that occurred outside their purviews. Using this
information, users can more easily assess whether information meets their specific mission criteria. The provenance that
PLUS captures is immutable; it is a record of past events. This basic premise matches other relevant work (see Section VII
for a discussion of related work. However, in exploring our customers’ requirements, it quickly became clear that many of
them needed a flexible facility for adding annotations to provenance information. For example, a user may want to enter
an opinion about his confidence in a particular piece of information or to note special circumstances that surrounded a
certain process execution. These additional annotations (not strictly provenance information) are mutable, since any of
these assessments might change. In this way, provenance elements can become much like products on Amazon; subject to
their own individual set of reviews by their users. And again as with Amazon, the basic information about the resource
(i.e. a list of book authors) does not change, and cannot be modified by users.
Flexible annotations are essential in multi-organizational information sharing because users of the data from another
organization may have no knowledge of how it was generated, and whether it can truly be used for her purposes. In such
cases, provenance, together with user assessments of confidence and social networks of trusted colleagues, can do a great
deal to increase trust that information is suitable for the intended purpose. It is critical to note though that these decisions
are made by users in context; provenance provides the necessary information to support the decision, but does not
automate trust decisions.
In addition, provenance provides additional functionality that can help alert users to potentially harmful data. In a
widespread collaborative enterprise, if a problem with a dataset or service is detected, the process of identifying other
users of that dataset is often either impossible or at least arduous. Building a “taint analysis” application over provenance
can help inform all users of potentially bad information.
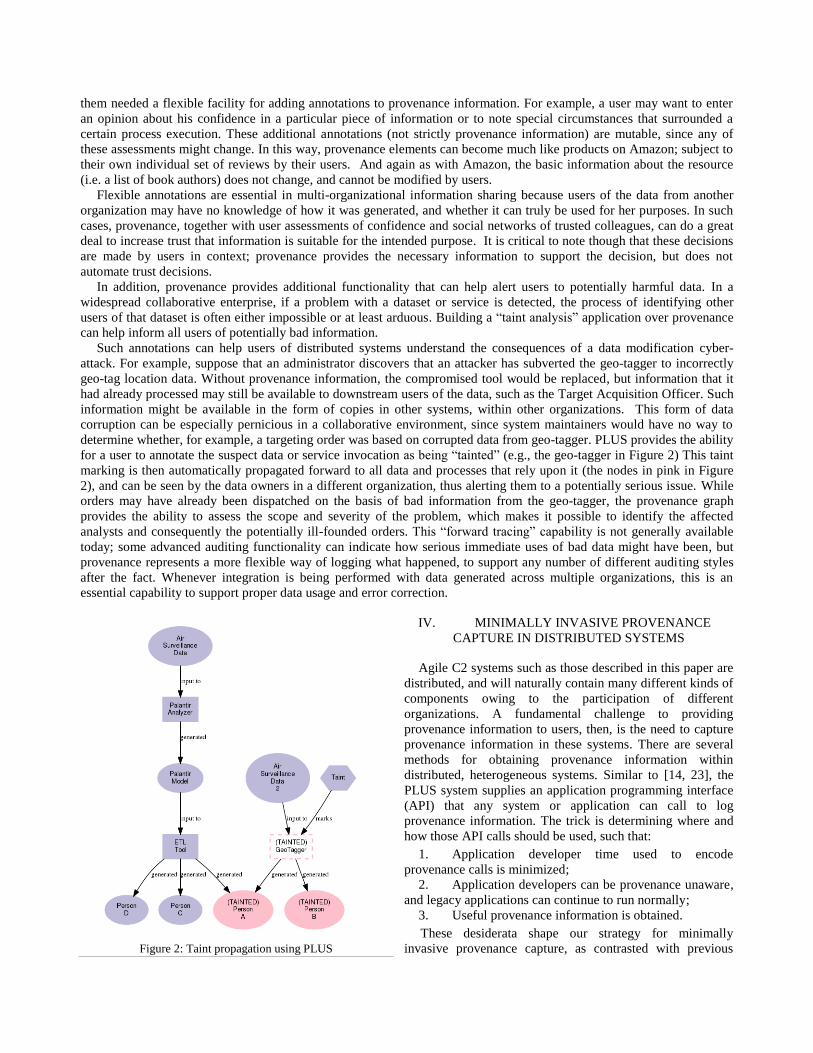
Such annotations can help users of distributed systems understand the consequences of a data modification cyber-
attack. For example, suppose that an administrator discovers that an attacker has subverted the geo-tagger to incorrectly
geo-tag location data. Without provenance information, the compromised tool would be replaced, but information that it
had already processed may still be available to downstream users of the data, such as the Target Acquisition Officer. Such
information might be available in the form of copies in other systems, within other organizations. This form of data
corruption can be especially pernicious in a collaborative environment, since system maintainers would have no way to
determine whether, for example, a targeting order was based on corrupted data from geo-tagger. PLUS provides the ability
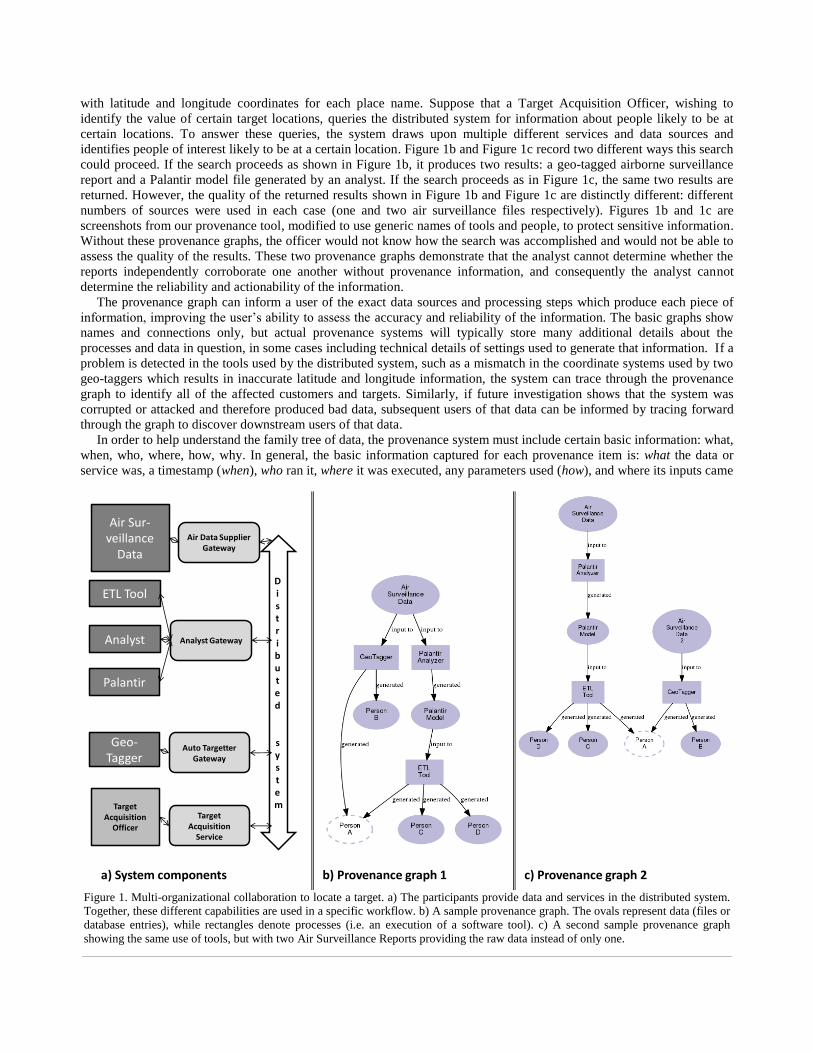
for a user to annotate the suspect data or service invocation as being “tainted” (e.g., the geo-tagger in Figure 2) This taint
marking is then automatically propagated forward to all data and processes that rely upon it (the nodes in pink in Figure
2), and can be seen by the data owners in a different organization, thus alerting them to a potentially serious issue. While
orders may have already been dispatched on the basis of bad information from the geo-tagger, the provenance graph
provides the ability to assess the scope and severity of the problem, which makes it possible to identify the affected
analysts and consequently the potentially ill-founded orders. This “forward tracing” capability is not generally available
today; some advanced auditing functionality can indicate how serious immediate uses of bad data might have been, but
provenance represents a more flexible way of logging what happened, to support any number of different auditing styles
after the fact. Whenever integration is being performed with data generated across multiple organizations, this is an
essential capability to support proper data usage and error correction.
IV. MINIMALLY INVASIVE PROVENANCE
CAPTURE IN DISTRIBUTED SYSTEMS
Agile C2 systems such as those described in this paper are
distributed, and will naturally contain many different kinds of
components owing to the participation of different
organizations. A fundamental challenge to providing
provenance information to users, then, is the need to capture
provenance information in these systems. There are several
methods for obtaining provenance information within
distributed, heterogeneous systems. Similar to [14, 23], the
PLUS system supplies an application programming interface
(API) that any system or application can call to log
provenance information. The trick is determining where and
how those API calls should be used, such that:
1. Application developer time used to encode
provenance calls is minimized;
2. Application developers can be provenance unaware,
and legacy applications can continue to run normally;
3. Useful provenance information is obtained.
These desiderata shape our strategy for minimally
invasive provenance capture, as contrasted with previous
Figure 2: Taint propagation using PLUS
provenance systems which require custom application revisions. Our first technique for “minimally invasive” provenance
capture is to insert provenance reporters into system coordination points, such as an enterprise service bus (ESB).
However, depending on the users of the system and on the intended uses of the resulting provenance information, this
method may not yield complete coverage and may miss some desired content. In the following subsections, we discuss
three other methods, Single Application Modification, Owning the System, and Wrapping/Scraping Legacy Systems, that
can be used to augment the capture via the system coordination backbone(s).
A. Insertion in a System Coordination Backbone
Distributed systems require coordination backbones to perform the command and control functions of the systems
themselves, including the following duties:
1. Collect/route messages, and handle component interactions; and
2. Provide a mechanism to enable actors to use remote data and processes.
Even in very loosely coupled systems, there are standard mechanisms for passing messages, accessing data, running
services, etc. Our first minimally invasive provenance capture technique focuses on these system coordination backbones.
An ESB is often used as a point of coordination for applications from many different organizations. We have modified
Mule3, a popular open source ESB, to automatically capture and report provenance for all messages passed through the
ESB, as well as to provide some introspection into the processes being executed [2]. Our Mule-based provenance collector
is the first provenance capture facility of which we are aware to collect provenance in heterogeneous multi-organizational
environments. This capture technique scales effectively and does not noticeably affect the underlying systems [8], but it
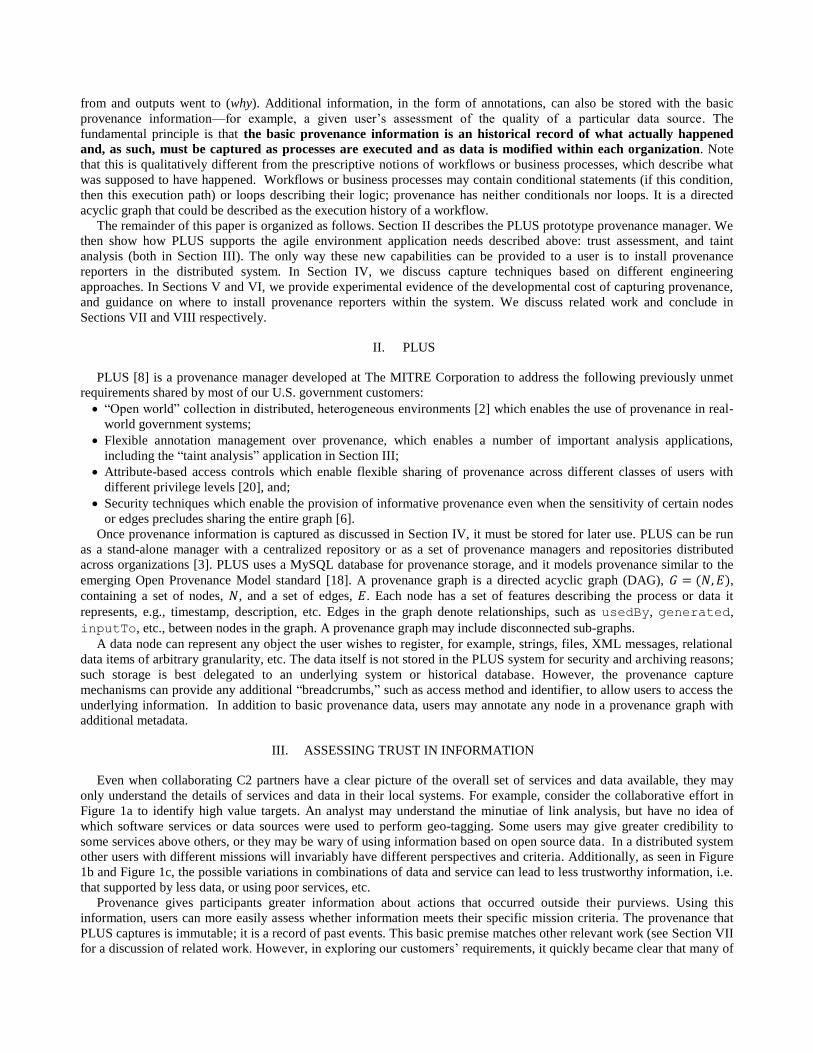
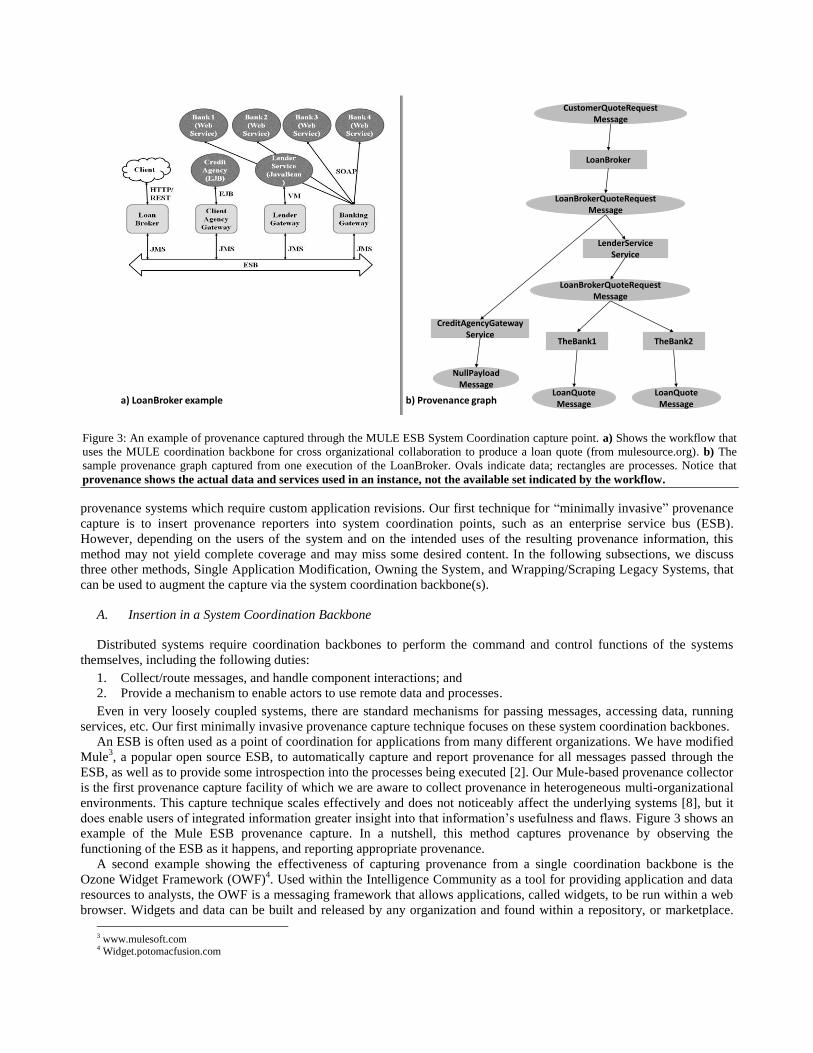
does enable users of integrated information greater insight into that information’s usefulness and flaws. Figure 3 shows an
example of the Mule ESB provenance capture. In a nutshell, this method captures provenance by observing the
functioning of the ESB as it happens, and reporting appropriate provenance.
A second example showing the effectiveness of capturing provenance from a single coordination backbone is the
Ozone Widget Framework (OWF)4. Used within the Intelligence Community as a tool for providing application and data
resources to analysts, the OWF is a messaging framework that allows applications, called widgets, to be run within a web
browser. Widgets and data can be built and released by any organization and found within a repository, or marketplace.
3 www.mulesoft.com 4 Widget.potomacfusion.com
CustomerQuoteRequestMessage
LoanBrokerQuoteRequestMessage
NullPayloadMessage
LoanBrokerQuoteRequestMessage
LoanQuoteMessage
LoanQuoteMessage
TheBank2TheBank1
LenderServiceService
CreditAgencyGatewayService
LoanBroker
a) LoanBroker example b) Provenance graph
Figure 3: An example of provenance captured through the MULE ESB System Coordination capture point. a) Shows the workflow that
uses the MULE coordination backbone for cross organizational collaboration to produce a loan quote (from mulesource.org). b) The
sample provenance graph captured from one execution of the LoanBroker. Ovals indicate data; rectangles are processes. Notice that
provenance shows the actual data and services used in an instance, not the available set indicated by the workflow.
The OWF provenance collector thus allows provenance to be captured about interactions that take place across
organizations. However, OWF also highlights a challenge for provenance capture: finding the appropriate points at which
to insert provenance collection calls. While OWF is a government off-the-shelf (GOTS) tool, with a recommended API,
its underlying use of web technology means that there are multiple possible methods for a widget developer to access data
or processes. For instance, there are multiple ways that a widget can access data from a repository. The chief three ways
are:
1. Using a JavaScript library (Dojo) to channel all data requests. This is the method followed by most widget
developers;
2. Writing JQuery within the widget to directly query a repository for the data;
3. Writing custom JavaScript to call directly to a specific repository.
These are merely the top three routes widget developers use to access data from repositories within the framework,
although there are other less popular methods. In the case of OWF, tapping into the Dojo channels captures the largest
percentage of data accesses. However, some information may be missing from the provenance store because of the use of
other data access methods. We believe that some provenance is better than none, and other provenance capture points can
be added through time. Even if robust provenance capture required implementing all three methods of capture, it is worth
noting that those three methods would scale to dozens or hundreds of different applications on top of OWF; contrast this
with the scalability of attempting to capture provenance on a per-application basis.
A final example of a very simple system backbone is insertion into a Hypertext Transfer Protocol (HTTP) web proxy.
For their protection, organizations often funnel all requests from their organization through a web proxy. The proxy
essentially sees all data requests being sent from within the organization to the internet, as well as the response.
Additionally, SOAP (Simple Object Access Protocol) and other web service interactions typically run over HTTP. Thus,
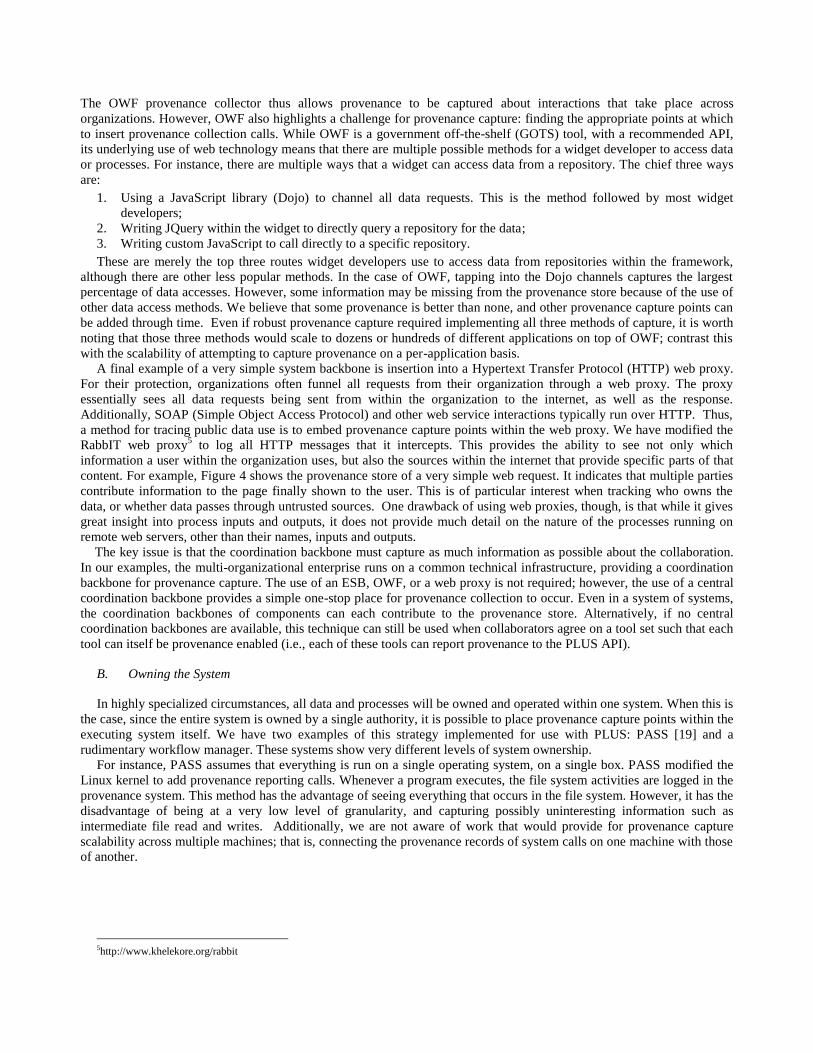
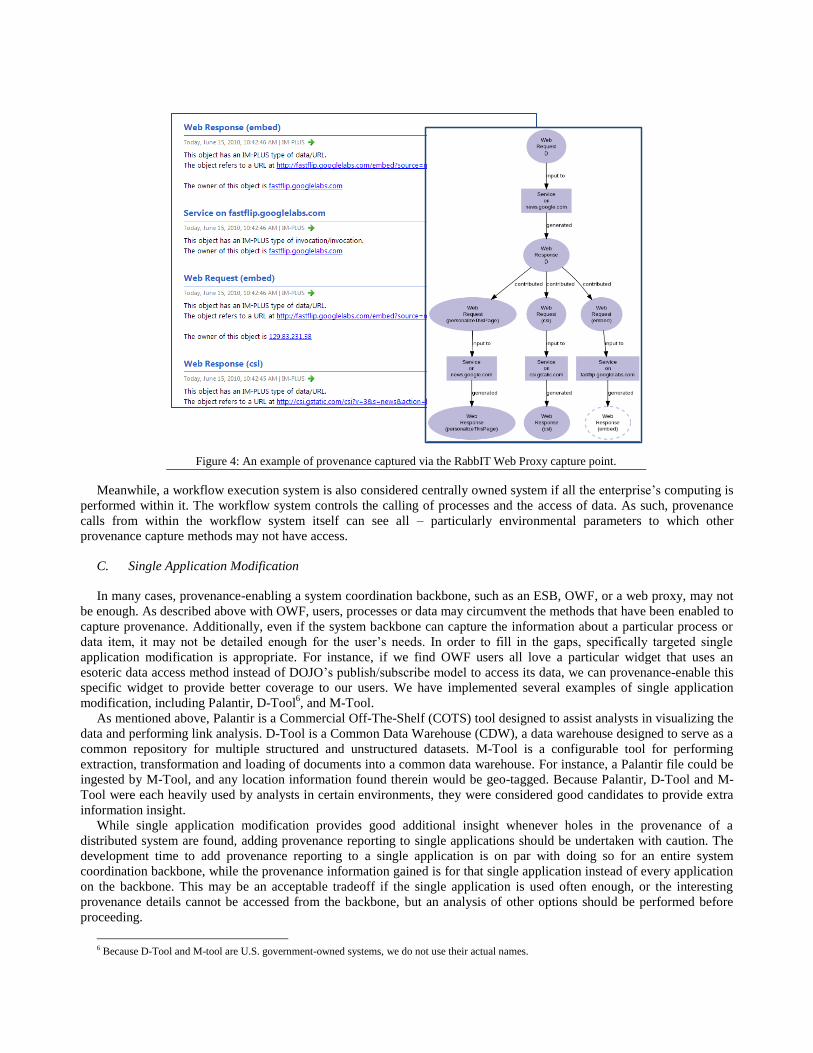
a method for tracing public data use is to embed provenance capture points within the web proxy. We have modified the
RabbIT web proxy5 to log all HTTP messages that it intercepts. This provides the ability to see not only which
information a user within the organization uses, but also the sources within the internet that provide specific parts of that
content. For example, Figure 4 shows the provenance store of a very simple web request. It indicates that multiple parties
contribute information to the page finally shown to the user. This is of particular interest when tracking who owns the
data, or whether data passes through untrusted sources. One drawback of using web proxies, though, is that while it gives
great insight into process inputs and outputs, it does not provide much detail on the nature of the processes running on
remote web servers, other than their names, inputs and outputs.
The key issue is that the coordination backbone must capture as much information as possible about the collaboration.
In our examples, the multi-organizational enterprise runs on a common technical infrastructure, providing a coordination
backbone for provenance capture. The use of an ESB, OWF, or a web proxy is not required; however, the use of a central
coordination backbone provides a simple one-stop place for provenance collection to occur. Even in a system of systems,
the coordination backbones of components can each contribute to the provenance store. Alternatively, if no central
coordination backbones are available, this technique can still be used when collaborators agree on a tool set such that each
tool can itself be provenance enabled (i.e., each of these tools can report provenance to the PLUS API).
B. Owning the System
In highly specialized circumstances, all data and processes will be owned and operated within one system. When this is
the case, since the entire system is owned by a single authority, it is possible to place provenance capture points within the
executing system itself. We have two examples of this strategy implemented for use with PLUS: PASS [19] and a
rudimentary workflow manager. These systems show very different levels of system ownership.
For instance, PASS assumes that everything is run on a single operating system, on a single box. PASS modified the
Linux kernel to add provenance reporting calls. Whenever a program executes, the file system activities are logged in the
provenance system. This method has the advantage of seeing everything that occurs in the file system. However, it has the
disadvantage of being at a very low level of granularity, and capturing possibly uninteresting information such as
intermediate file read and writes. Additionally, we are not aware of work that would provide for provenance capture
scalability across multiple machines; that is, connecting the provenance records of system calls on one machine with those
of another.
5http://www.khelekore.org/rabbit
Meanwhile, a workflow execution system is also considered centrally owned system if all the enterprise’s computing is
performed within it. The workflow system controls the calling of processes and the access of data. As such, provenance
calls from within the workflow system itself can see all – particularly environmental parameters to which other
provenance capture methods may not have access.
C. Single Application Modification
In many cases, provenance-enabling a system coordination backbone, such as an ESB, OWF, or a web proxy, may not
be enough. As described above with OWF, users, processes or data may circumvent the methods that have been enabled to
capture provenance. Additionally, even if the system backbone can capture the information about a particular process or
data item, it may not be detailed enough for the user’s needs. In order to fill in the gaps, specifically targeted single
application modification is appropriate. For instance, if we find OWF users all love a particular widget that uses an
esoteric data access method instead of DOJO’s publish/subscribe model to access its data, we can provenance-enable this
specific widget to provide better coverage to our users. We have implemented several examples of single application
modification, including Palantir, D-Tool6, and M-Tool.
As mentioned above, Palantir is a Commercial Off-The-Shelf (COTS) tool designed to assist analysts in visualizing the
data and performing link analysis. D-Tool is a Common Data Warehouse (CDW), a data warehouse designed to serve as a
common repository for multiple structured and unstructured datasets. M-Tool is a configurable tool for performing
extraction, transformation and loading of documents into a common data warehouse. For instance, a Palantir file could be
ingested by M-Tool, and any location information found therein would be geo-tagged. Because Palantir, D-Tool and M-
Tool were each heavily used by analysts in certain environments, they were considered good candidates to provide extra
information insight.
While single application modification provides good additional insight whenever holes in the provenance of a
distributed system are found, adding provenance reporting to single applications should be undertaken with caution. The
development time to add provenance reporting to a single application is on par with doing so for an entire system
coordination backbone, while the provenance information gained is for that single application instead of every application
on the backbone. This may be an acceptable tradeoff if the single application is used often enough, or the interesting
provenance details cannot be accessed from the backbone, but an analysis of other options should be performed before
proceeding.
6 Because D-Tool and M-tool are U.S. government-owned systems, we do not use their actual names.
Figure 4: An example of provenance captured via the RabbIT Web Proxy capture point.
D. Legacy System Capture
Finally, as with adding provenance reporting to a single application, there are instances when the provenance obtained
through a system’s coordination backbone has holes, or is lacking information of interest. In the previous subsection, we
discussed adding provenance reporting to single applications, however not all applications can be modified in this way. In
every example above, an API or source code was available for the application. In many instances, particularly well-
established legacy applications, this is not the case. These applications are often central to an organization’s work, and
much information flows through them, but they were created so long ago that no open API or code base exists. For these
systems, we have two potential solutions for provenance capture: wrapping the application, or scraping the logs of the
application.
In the first case, a simple wrapper is placed around the legacy application. The wrapper merely passes all inputs
directly to the legacy application, and routes all outputs back out. However, while doing this message passing, calls are
made to the provenance system, thus capturing the provenance of what was being sent to and returned from the legacy
system. The interface to the legacy application remains the same for any caller, but its functionality is augmented by the
provenance wrapper which puts itself in the middle to observe the legacy application’s usage patterns.
In the second example, the log file of the legacy application can be scraped, and any interesting information placed
within the provenance system. This typically involves parsing log files generated by tools, or monitoring facilities of an
operating system. We have a working example of both these strategies using STrace7. STrace is a UNIX tool that traces
system-level calls. When a program is executed through STrace, a user can write an output file of system calls. In other
words, STrace is effectively a wrapper for the shell script, allowing it to run unimpeded, but watching what occurs. The
output file from STrace can then be scraped to populate a provenance store. System calls (such as open(), read(), and
close()) become processes, while their inputs and outputs are data sent to and from those processes. While most legacy
solutions will involve one or the other strategy, not both, our work with STrace uses both methods effectively.
V. EXPERIMENTAL RESULTS
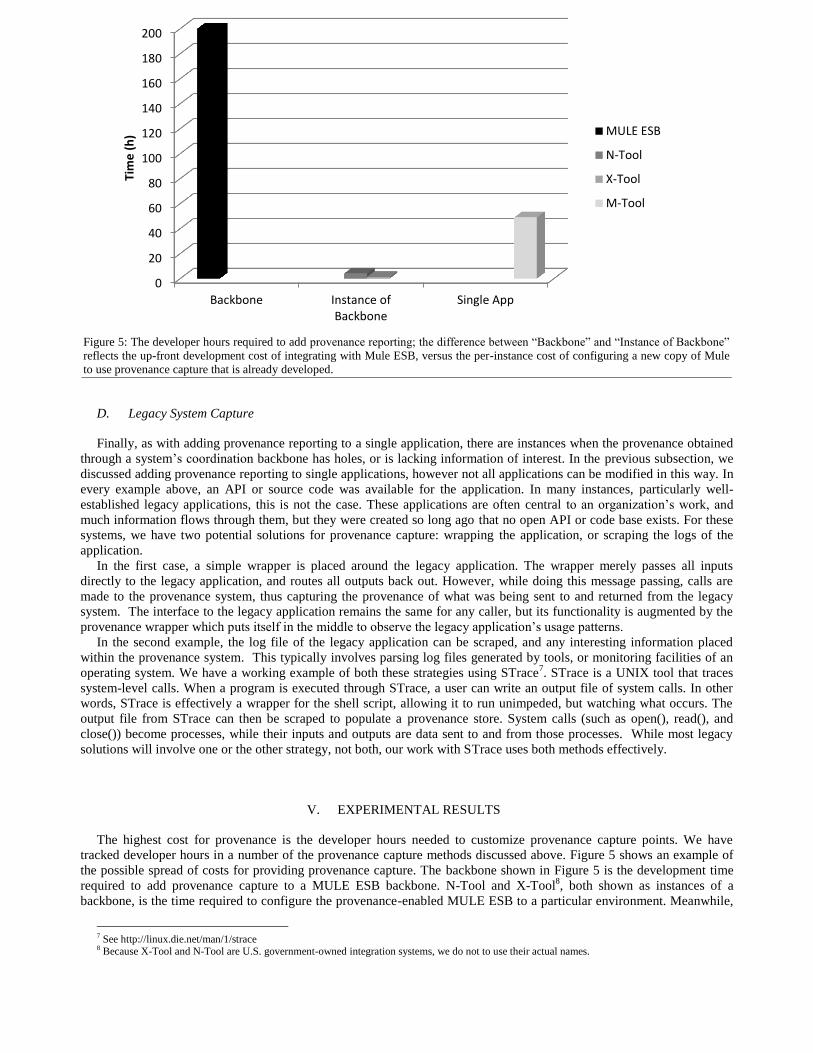
The highest cost for provenance is the developer hours needed to customize provenance capture points. We have
tracked developer hours in a number of the provenance capture methods discussed above. Figure 5 shows an example of
the possible spread of costs for providing provenance capture. The backbone shown in Figure 5 is the development time
required to add provenance capture to a MULE ESB backbone. N-Tool and X-Tool8, both shown as instances of a
backbone, is the time required to configure the provenance-enabled MULE ESB to a particular environment. Meanwhile,
7 See http://linux.die.net/man/1/strace 8 Because X-Tool and N-Tool are U.S. government-owned integration systems, we do not to use their actual names.
Figure 5: The developer hours required to add provenance reporting; the difference between “Backbone” and “Instance of Backbone”
reflects the up-front development cost of integrating with Mule ESB, versus the per-instance cost of configuring a new copy of Mule
to use provenance capture that is already developed.
0
20
40
60
80
100
120
140
160
180
200
Backbone Instance ofBackbone
Single App
Tim
e (
h) MULE ESB
N-Tool
X-Tool
M-Tool
the Single Application category shows how long it took to add provenance capture to M-Tool. In other words, while it
took longer to add provenance capture to the backbone, configuring subsequent instances of that backbone in new
environments were trivial. Furthermore, adding provenance capture to the coordination backbone provides provenance for
the many applications running over the backbone, instead of just the one application singly modified.
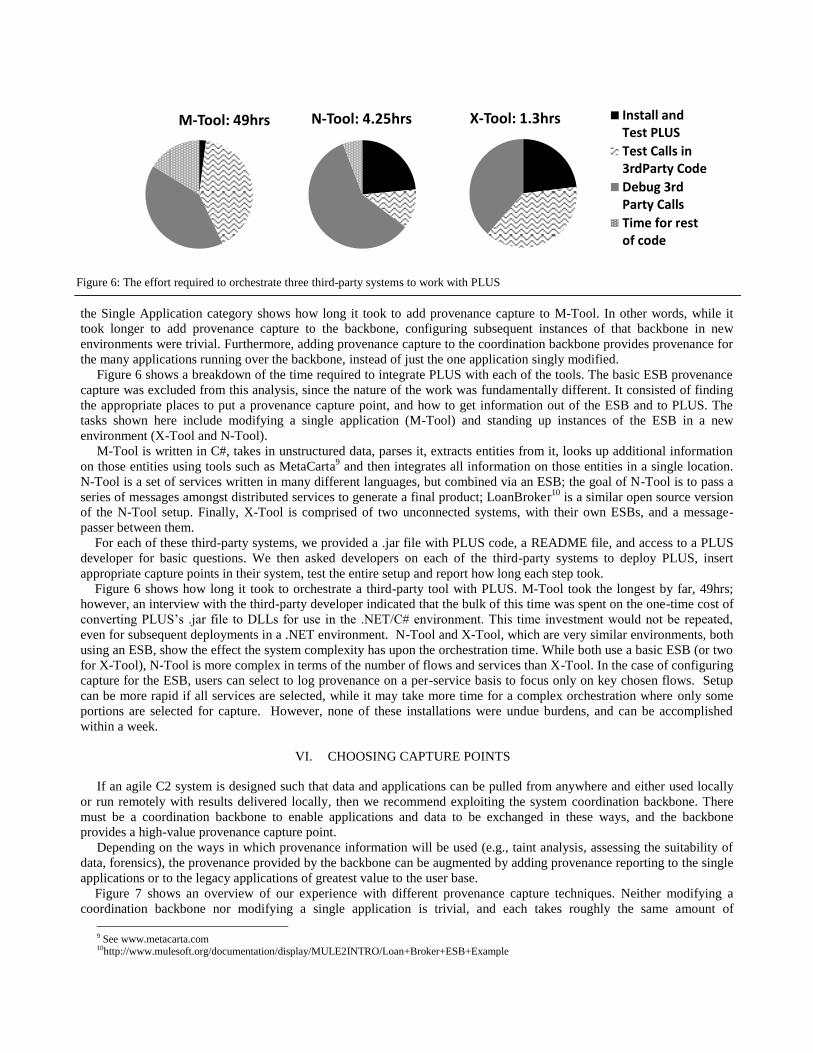
Figure 6 shows a breakdown of the time required to integrate PLUS with each of the tools. The basic ESB provenance
capture was excluded from this analysis, since the nature of the work was fundamentally different. It consisted of finding
the appropriate places to put a provenance capture point, and how to get information out of the ESB and to PLUS. The
tasks shown here include modifying a single application (M-Tool) and standing up instances of the ESB in a new
environment (X-Tool and N-Tool).
M-Tool is written in C#, takes in unstructured data, parses it, extracts entities from it, looks up additional information
on those entities using tools such as MetaCarta9 and then integrates all information on those entities in a single location.
N-Tool is a set of services written in many different languages, but combined via an ESB; the goal of N-Tool is to pass a
series of messages amongst distributed services to generate a final product; LoanBroker10
is a similar open source version
of the N-Tool setup. Finally, X-Tool is comprised of two unconnected systems, with their own ESBs, and a message-
passer between them.
For each of these third-party systems, we provided a .jar file with PLUS code, a README file, and access to a PLUS
developer for basic questions. We then asked developers on each of the third-party systems to deploy PLUS, insert
appropriate capture points in their system, test the entire setup and report how long each step took.
Figure 6 shows how long it took to orchestrate a third-party tool with PLUS. M-Tool took the longest by far, 49hrs;
however, an interview with the third-party developer indicated that the bulk of this time was spent on the one-time cost of
converting PLUS’s .jar file to DLLs for use in the .NET/C# environment. This time investment would not be repeated,
even for subsequent deployments in a .NET environment. N-Tool and X-Tool, which are very similar environments, both
using an ESB, show the effect the system complexity has upon the orchestration time. While both use a basic ESB (or two
for X-Tool), N-Tool is more complex in terms of the number of flows and services than X-Tool. In the case of configuring
capture for the ESB, users can select to log provenance on a per-service basis to focus only on key chosen flows. Setup
can be more rapid if all services are selected, while it may take more time for a complex orchestration where only some
portions are selected for capture. However, none of these installations were undue burdens, and can be accomplished
within a week.
VI. CHOOSING CAPTURE POINTS
If an agile C2 system is designed such that data and applications can be pulled from anywhere and either used locally
or run remotely with results delivered locally, then we recommend exploiting the system coordination backbone. There
must be a coordination backbone to enable applications and data to be exchanged in these ways, and the backbone
provides a high-value provenance capture point.
Depending on the ways in which provenance information will be used (e.g., taint analysis, assessing the suitability of
data, forensics), the provenance provided by the backbone can be augmented by adding provenance reporting to the single
applications or to the legacy applications of greatest value to the user base.
Figure 7 shows an overview of our experience with different provenance capture techniques. Neither modifying a
coordination backbone nor modifying a single application is trivial, and each takes roughly the same amount of
9 See www.metacarta.com 10http://www.mulesoft.org/documentation/display/MULE2INTRO/Loan+Broker+ESB+Example
M-Tool: 49hrs
Install and Test PLUS
Test Calls in 3rdPartyCode
Debug 3rd Party Calls
Time for rest of code
N-Tool: 4.25hrs
Install and Test PLUS
Test Calls in 3rdPartyCode
Debug 3rd Party Calls
Time for rest of code
X-Tool: 1.3hrs Install andTest PLUS
Test Calls in3rdParty Code
Debug 3rdParty Calls
Time for restof code
Figure 6: The effort required to orchestrate three third-party systems to work with PLUS
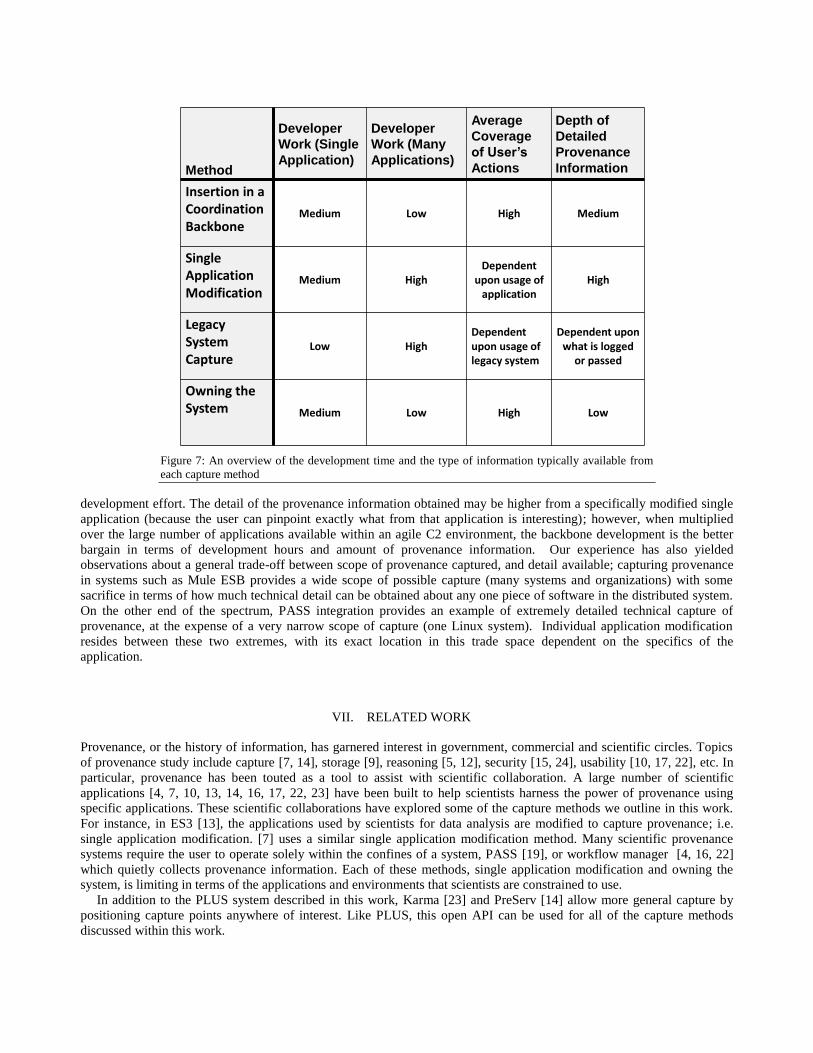
development effort. The detail of the provenance information obtained may be higher from a specifically modified single
application (because the user can pinpoint exactly what from that application is interesting); however, when multiplied
over the large number of applications available within an agile C2 environment, the backbone development is the better
bargain in terms of development hours and amount of provenance information. Our experience has also yielded
observations about a general trade-off between scope of provenance captured, and detail available; capturing provenance
in systems such as Mule ESB provides a wide scope of possible capture (many systems and organizations) with some
sacrifice in terms of how much technical detail can be obtained about any one piece of software in the distributed system.
On the other end of the spectrum, PASS integration provides an example of extremely detailed technical capture of
provenance, at the expense of a very narrow scope of capture (one Linux system). Individual application modification
resides between these two extremes, with its exact location in this trade space dependent on the specifics of the
application.
VII. RELATED WORK
Provenance, or the history of information, has garnered interest in government, commercial and scientific circles. Topics
of provenance study include capture [7, 14], storage [9], reasoning [5, 12], security [15, 24], usability [10, 17, 22], etc. In
particular, provenance has been touted as a tool to assist with scientific collaboration. A large number of scientific
applications [4, 7, 10, 13, 14, 16, 17, 22, 23] have been built to help scientists harness the power of provenance using
specific applications. These scientific collaborations have explored some of the capture methods we outline in this work.
For instance, in ES3 [13], the applications used by scientists for data analysis are modified to capture provenance; i.e.
single application modification. [7] uses a similar single application modification method. Many scientific provenance
systems require the user to operate solely within the confines of a system, PASS [19], or workflow manager [4, 16, 22]
which quietly collects provenance information. Each of these methods, single application modification and owning the
system, is limiting in terms of the applications and environments that scientists are constrained to use.
In addition to the PLUS system described in this work, Karma [23] and PreServ [14] allow more general capture by
positioning capture points anywhere of interest. Like PLUS, this open API can be used for all of the capture methods
discussed within this work.
Method
Developer
Work (Single
Application)
Developer
Work (Many
Applications)
Average
Coverage
of User’s
Actions
Depth of
Detailed
Provenance
Information
Insertion in a Coordination Backbone
Medium Low High Medium
Single Application Modification
Medium HighDependent
upon usage of application
High
Legacy System Capture
Low HighDependent upon usage of legacy system
Dependent upon what is logged
or passed
Owning the System Medium Low High Low
Figure 7: An overview of the development time and the type of information typically available from
each capture method
[11] describes provenance-based techniques for assessing data trustworthiness using data and path similarity. The work
does not address provenance collection and could leverage PLUS’s “open world” collection techniques. In addition, their
trust assessment framework could be implemented on top of the PLUS annotation facility.
VIII. CONCLUSIONS
In this work, we describe how provenance contributes to the “shared understanding” needed for the “coherent and
effective response” [1] required of an operational agile C2 system. Provenance adds value in large-scale, multi-
organizational environments by helping users assess the suitability of unfamiliar data and by allowing users to manage the
downstream consequences of faulty data or process executions. We showcase PLUS, a working provenance system with
robust capture, storage and administrative capabilities. We discuss novel, minimally invasive provenance capture
strategies in distributed, heterogeneous systems, describe examples that we have implemented, and provide engineering
guidance for determining where to insert provenance capture points.
We have begun to consider how provenance capture and querying would operate across multiple security enclaves, but
more work needs to be done in this area. We also hope to investigate in more detail the ways in which data quality
annotations can be combined with basic provenance information to give users more nuanced understanding.
We would like to thank our colleagues Jared Mowery and Maggie Lonergan for their help with some of the systems
and integration software described in this paper.
BIBLIOGRAPHY
[1] D. S. Alberts, "The Agility Advantage: A Survival Guide for Complex Enterprises and Endeavors," DoD Command and
Control Research Program, 2011.
[2] M. D. Allen, A. Chapman, B. Blaustein, and L. Seligman, "Provenance Capture in the Wild," International Provenance and
Annotation Workshop (IPAW), 2010.
[3] M. D. Allen, A. Chapman, B. Blaustein, and L. Seligman, "Getting It Together: Enabling Multi-organization Provenance
Exchange," TaPP, 2011.
[4] I. Altintas, O. Barney, and E. Jaeger-Frank, "Provenance Collection Support in the Kepler Scientific Workflow System,"
IPAW, pp. 118-132, 2006.
[5] O. Benjelloun, A. D. Sarma, A. Halevy, and J. Widom, "ULDBs: Databases with Uncertainty and Lineage," VLDB Seoul,
Korea, pp. 953-964, 2006.
[6] B. Blaustein, A. Chapman, L. Seligman, M. D. Allen, and A. Rosenthal, "Surrogate Parenthood: Protected and Informative
Graphs," PVLDB, 2010.
[7] P. Buneman, A. Chapman, and J. Cheney, "Provenance Management in Curated Databases," ACM SIGMOD, pp. 539-550,
2006.
[8] A. Chapman, M. D. Allen, B. Blaustein, and L. Seligman, "PLUS: A Provenance Manager for Integrated Information," IEEE
International Conference on Information Reuse and Integration (IRI ‘11), 2011.
[9] A. Chapman, H. V. Jagadish, and P. Ramanan, "Efficient Provenance Storage," SIGMOD, pp. 993-1006, 2008.
[10] S. Cohen-Boulakia, O. Biton, S. Cohen, and S. Davidson, "Addressing the provenance challenge using ZOOM," Concurrency
and Computation: Practice and Experience, vol. 20, pp. 497-506, 2008.
[11] C. Dai, D. Lin, E. Bertino, and M. Kantarcioglu, "An Approach to Evaluate Data Trustworthiness Based on Data
Provenance," Secure Data Management Workshop at VLDB, 2008.
[12] J. N. Foster, T. J. Green, and V. Tannen, "Annotated XML: Queries and Provenance," PODS, pp. 271-280, 2008.
[13] J. Frew, D. Metzger, and P. Slaughter, "Automatic capture and reconstruction of computational provenance," Concurr.
Comput. : Pract. Exper., vol. 20, pp. 485-496, 2008.
[14] P. Groth, S. Miles, and L. Moreau, "PReServ: Provenance Recording for Services," UK OST e-Science second AHM, 2005.
[15] R. Hasan, R. Sion, and M. Winslett, "The Case of the Fake Picasso: Preventing History Forgery with Secure Provenance," in
FAST. San Francisco, 2009, pp. 1-14.
[16] P. Missier, K. Belhajjame, J. Zhao, and C. Goble, "Data lineage model for Taverna workflows with lightweight anotation
requirements," in IPAW, 2008.
[17] P. Missier, S. M. Embury, M. Greenwood, A. Preece, and B. Jin, "Managing information quality in e-science: the qurator
workbench," SIGMOD, pp. 1150-1152, 2007.
[18] L. Moreau, J. Freire, J. Futrelle, R. McGrath, J. Myers, and P. Paulson, "The Open Provenance Model," University of
Southampton 2007.
[19] K.-K. Muniswamy-Reddy, D. A. Holland, U. Braun, and M. I. Seltzer, "Provenance-Aware Storage Systems," USENIX, pp.
43-56, 2006.
[20] A. Rosenthal, L. Seligman, A. Chapman, and B. Blaustein, "Scalable Access Controls for Lineage," First Workshop on
Theory and Practice of Provenance Systems (TaPP), 2009.
[21] J. D. Savage, "Composable Capability on Demand (CCOD®): A New Paradigm for the Design, Acquisition and Employment
of IT-Based C2," ICCRTS, 2010.
[22] C. E. Scheidegger, H. T. Vo, D. Koop, J. Freire, and C. Silva, "Querying and Re-Using Workflows with VisTrails,"
SIGMOD, 2008.
[23] Y. Simmhan, B. Plale, and D. Gannon, "Karma2: Provenance Management for Data Driven Workflows," Journal of Web
Services Research, vol. 5, 2008.
[24] J. Zhang, A. Chapman, and K. LeFevre, "Fine-Grained Tamper-Evident Data Pedigree," University of Michigan Technical
Report, 2009.