providing a comprehensive, up-to-date indication of key ... complete audit - 2017-09... ·...
TRANSCRIPT
National Energy Emissions Audit September 2017
Providing a comprehensive, up-to-date indication of key greenhouse gas and
energy trends in Australia
Hugh Saddler | Author
2
ABOUT THE AUSTRALIA INSTITUTE
The Australia Institute is an independent public policy think tank based in Canberra. It
is funded by donations from philanthropic trusts and individuals and commissioned
research. We barrack for ideas, not political parties or candidates. Since its launch in
1994, the Institute has carried out highly influential research on a broad range of
economic, social and environmental issues.
OUR PHILOSOPHY
As we begin the 21st century, new dilemmas confront our society and our planet.
Unprecedented levels of consumption co-exist with extreme poverty. Through new
technology we are more connected than we have ever been, yet civic engagement is
declining. Environmental neglect continues despite heightened ecological awareness.
A better balance is urgently needed.
The Australia Institute’s directors, staff and supporters represent a broad range of
views and priorities. What unites us is a belief that through a combination of research
and creativity we can promote new solutions and ways of thinking.
OUR PURPOSE – ‘RESEARCH THAT MATTERS’
The Institute publishes research that contributes to a more just, sustainable and
peaceful society. Our goal is to gather, interpret and communicate evidence in order to
both diagnose the problems we face and propose new solutions to tackle them.
The Institute is wholly independent and not affiliated with any other organisation.
Donations to its Research Fund are tax deductible. Anyone wishing to donate can do so
via the website at https://www.tai.org.au or by calling the Institute on 02 6130 0530.
Our secure and user-friendly website allows donors to make either one-off or regular
monthly donations.
Level 1, Endeavour House, 1 Franklin St
Canberra, ACT 2601
Tel: (02) 61300530
Email: [email protected]
Website: www.tai.org.au

National Energy Emissions Audit, September 2017 3
Key points
+ Australia’s energy emissions keep going up
Australia’s annual energy combustion emissions increased between March and June
2017, to the highest level seen for the past six years. Australia’s total energy
combustion emissions have now reached a record level, higher than the previous peak
seen in 2009.
+ Australia stands almost alone among developed countries in failing to reduce its
energy combustion emissions
Australia is the only member of the UNFCCC Annex 1 group of developed countries,
apart from Turkey, in which energy combustion emissions in 2017 are the highest since
1990, the first year of the UNFCCC.
+ Petroleum consumption is the main driver of emission increases
A large increase in consumption of petroleum fuels, particularly diesel, was the main
cause of the increase. Electricity generation emissions went down between March and
June, while natural gas emissions showed only a slight increase.
+ Diesel is the largest source of emissions from use of petroleum fuels
Diesel consumption accounts for 55% of all emissions from consumption of petroleum
fuels within Australia, and just under 20% of all energy combustion emissions. Use of
diesel has consistently been growing much faster than consumption of all other
petroleum fuels. Just over half of national diesel consumption is used for road
transport. The remainder for a variety of economic activities including mining,
agriculture, rail transport and construction. Both road transport and other uses of
diesel contributed to the increase in consumption.
+ Emissions from consumption of petrol also increased
Consumption of petrol, used overwhelmingly for road transport, also increased
between March and June 2017. This was the first sustained increase in consumption
of, and emissions from, petrol for over six years.
+ No indication of when or if growth in petroleum emissions will stop
Australia has no policies likely to slow the growth in emissions from petroleum fuels in
the immediate, or indeed medium, let alone long term future. That means that
decisive reduction in emissions from electricity generation, much larger than the
“proportionate” 25 to 30 per cent figure, will be needed if Australia is to comply with
its Paris Agreement obligation.
4
+ Urgent action is needed to introduce strong motor vehicle fuel efficiency standards
Australia is also a stand-out in its failure to introduce strong motor vehicle fuel
efficiency standards. Rectifying this deficiency should be a top priority, because it
takes some years for new standards to work their way through the whole motor
vehicle fleet.
+ Road transport policy failure as dire as energy policy failure
The data on transport energy consumption in this September 2017 Emissions Audit
lead to an inescapable conclusion: the absence of any serious policy measures to curb
the growth in energy consumed by road transport is a failure almost as great as the
failure in electricity industry policy.
National Energy Emissions Audit, September 2017 5
Introduction
Welcome to the September 2017 issue of The Australia Institute’s National Energy Emissions
Audit (the Emissions Audit). The Emissions Audit tracks Australia’s emissions of greenhouse
gases from the combustion of fossil fuels – this issue contains data up to the end of June 2017.
The Emissions Audit will therefore give readers the most up to date possible advice on how
Australia is tracking towards meeting its emissions reduction commitment under the Paris
Agreement.
Fossil fuel combustion accounts for the majority of Australia’s emissions – 71% in Australia’s
most recent National Greenhouse Gas Inventory, which was for the year 2014-15. Fossil fuel
combustion emissions also account for most of the year on year change in Australia’s
emissions. Over the last few years the change is an increase.
The National Energy Emissions Audit is published on a quarterly basis, in September,
December, March and June each year, with data to the end of the preceding quarter. Each
month the Electricity Update of the Emissions Audit is produced, reporting on changes to
emissions from electricity generation in the National Electricity Market (NEM), and including
commentary on other issues relating to the extraordinarily dramatic changes happening in
Australia’s electricity supply system.
All emissions data are reported as annual moving averages. This approach removes the impact
on the reported data of seasonal changes, which particularly influence electricity and gas
consumption. Annualised data will show a month on month increase if the most recent
monthly quantity is greater than the quantity in the corresponding month one year previously.
Most data are presented in the form of time series graphs, starting in June 2011, i.e. with the
year ending June 2011.
6
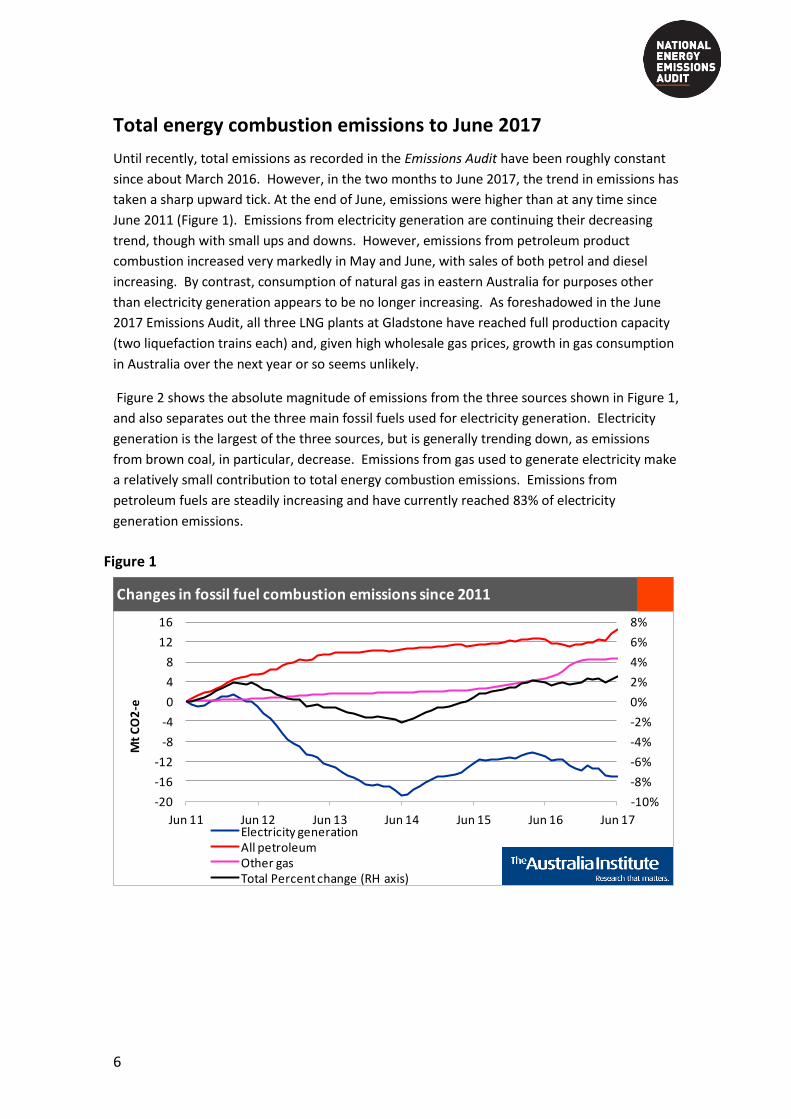
Total energy combustion emissions to June 2017
Until recently, total emissions as recorded in the Emissions Audit have been roughly constant
since about March 2016. However, in the two months to June 2017, the trend in emissions has
taken a sharp upward tick. At the end of June, emissions were higher than at any time since
June 2011 (Figure 1). Emissions from electricity generation are continuing their decreasing
trend, though with small ups and downs. However, emissions from petroleum product
combustion increased very markedly in May and June, with sales of both petrol and diesel
increasing. By contrast, consumption of natural gas in eastern Australia for purposes other
than electricity generation appears to be no longer increasing. As foreshadowed in the June
2017 Emissions Audit, all three LNG plants at Gladstone have reached full production capacity
(two liquefaction trains each) and, given high wholesale gas prices, growth in gas consumption
in Australia over the next year or so seems unlikely.
Figure 2 shows the absolute magnitude of emissions from the three sources shown in Figure 1,
and also separates out the three main fossil fuels used for electricity generation. Electricity
generation is the largest of the three sources, but is generally trending down, as emissions
from brown coal, in particular, decrease. Emissions from gas used to generate electricity make
a relatively small contribution to total energy combustion emissions. Emissions from
petroleum fuels are steadily increasing and have currently reached 83% of electricity
generation emissions.
Figure 1
-10%
-8%
-6%
-4%
-2%
0%
2%
4%
6%
8%
-20
-16
-12
-8
-4
0
4
8
12
16
Jun 11 Jun 12 Jun 13 Jun 14 Jun 15 Jun 16 Jun 17
Mt
CO
2-e
Electricity generationAll petroleumOther gasTotal Percent change (RH axis)
Changes in fossil fuel combustion emissions since 2011

National Energy Emissions Audit, September 2017 7
Figure 2
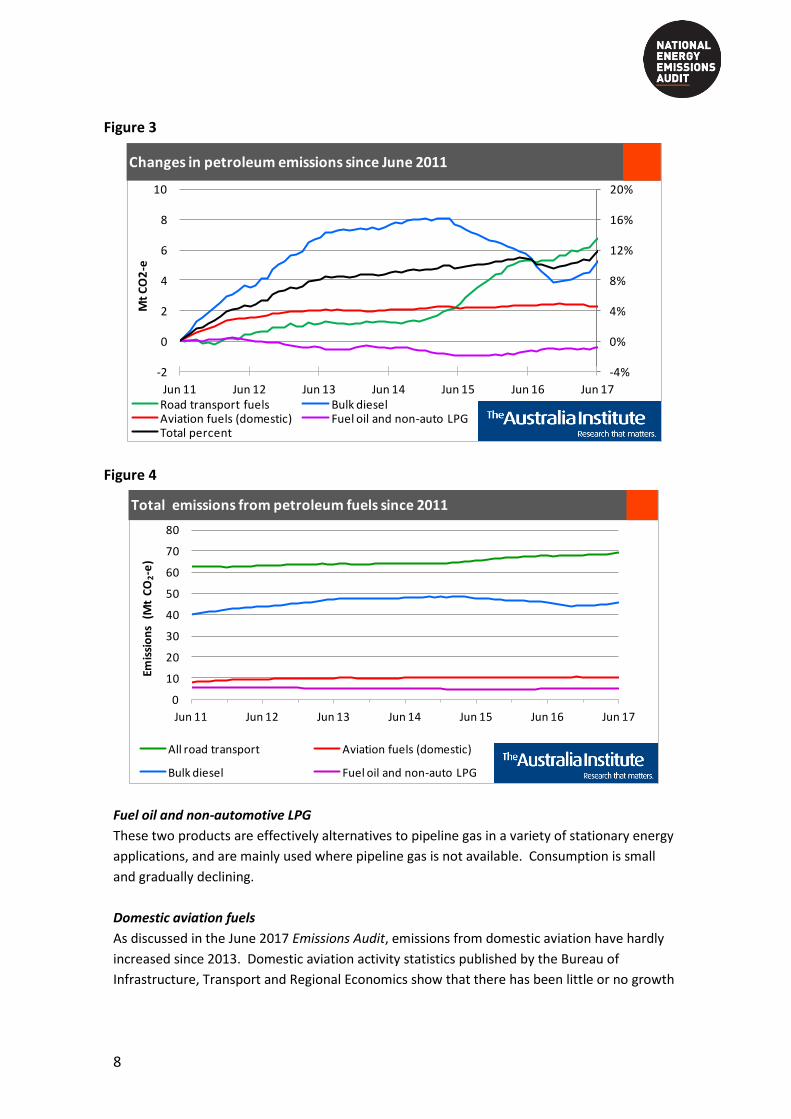
Petroleum emissions
Figures 3 and 4 show, respectively, changes in emissions, and changes in total emissions since
2011 from the four main groups of petroleum products: road transport fuel, bulk diesel,
aviation fuels, fuel oil and non-auto LPG.
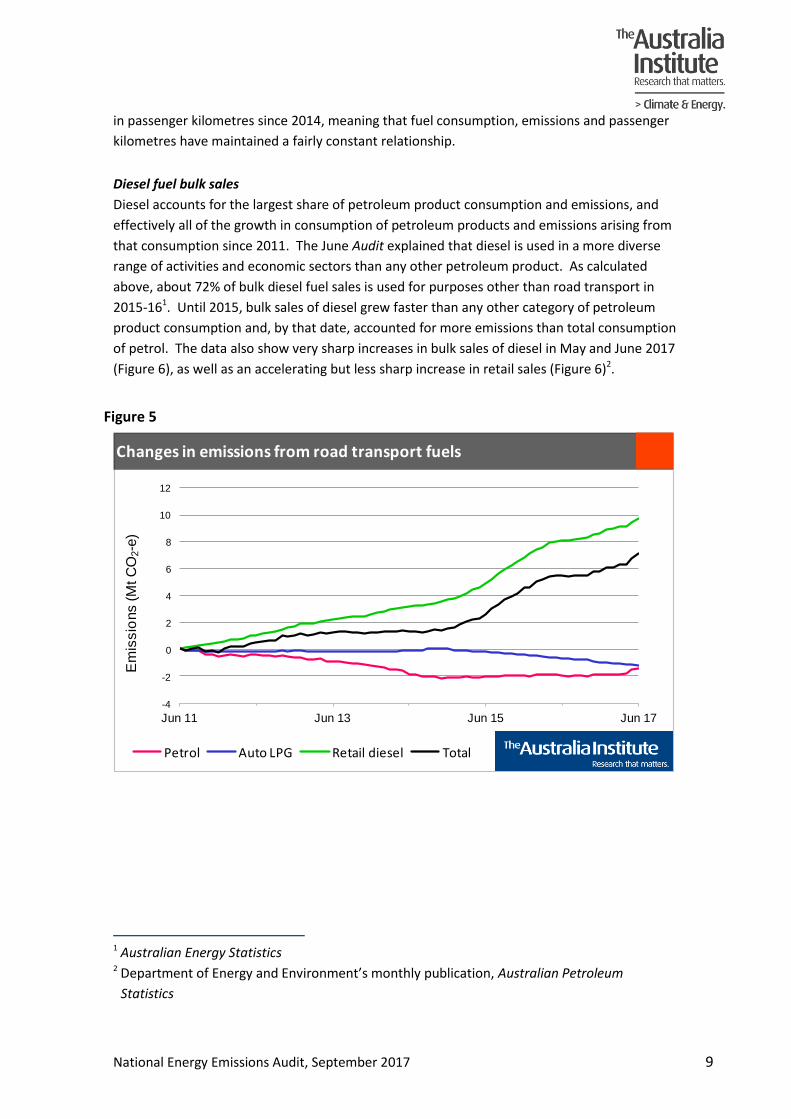
Road transport fuels
The Emissions Audit defines road transport fuels as being the sum of petrol, automotive LPG
and retail sales of diesel. The data show that the rate of growth in consumption of road
transport fuels is accelerating. Prior to this year total consumption of petrol had been falling
until 2014 (the decline started in 2008 according to Australian Energy Statistics), followed by
several years of static consumption, as Figure 5 shows. The Emissions Audit has consistently
interpreted this growth as reflecting the widespread uptake in Australia of diesel engine cars,
following behind the strong trend in Europe. Now, it appears, not only is road transport diesel
consumption continuing to grow strongly, but growth in consumption of petrol has resumed.
What’s more, these data understate the volume of road transport fuel consumption. About
28% of bulk sales of diesel are also used for road transport, based on a comparison of these
data for the year ending June 2016 with the most recent official national energy consumption
data in Australian Energy Statistics, published in early September 2017. This is in no way
surprising; all bus fleet operators and many road freight transport operators refuel their
vehicles from bulk supplies delivered to their fleet depots.
020406080
100120140160180200
Jun 11 Jun 12 Jun 13 Jun 14 Jun 15 Jun 16 Jun 17
Mt
CO
2-e
Black Coal for electricity Brown Coal for electricityGas for electricity Other gasPetroleum Total NEM electricity generation
Annualised emissions totals since 2011, by fuel
8
Figure 3
Figure 4
Fuel oil and non-automotive LPG
These two products are effectively alternatives to pipeline gas in a variety of stationary energy
applications, and are mainly used where pipeline gas is not available. Consumption is small
and gradually declining.
Domestic aviation fuels
As discussed in the June 2017 Emissions Audit, emissions from domestic aviation have hardly
increased since 2013. Domestic aviation activity statistics published by the Bureau of
Infrastructure, Transport and Regional Economics show that there has been little or no growth
-4%
0%
4%
8%
12%
16%
20%
-2
0
2
4
6
8
10
Jun 11 Jun 12 Jun 13 Jun 14 Jun 15 Jun 16 Jun 17
Mt
CO
2-e
Road transport fuels Bulk dieselAviation fuels (domestic) Fuel oil and non-auto LPGTotal percent
Changes in petroleum emissions since June 2011
0
10
20
30
40
50
60
70
80
Jun 11 Jun 12 Jun 13 Jun 14 Jun 15 Jun 16 Jun 17
Emis
sio
ns
(M
t C
O2-e
)
All road transport Aviation fuels (domestic)
Bulk diesel Fuel oil and non-auto LPG
Total emissions from petroleum fuels since 2011
National Energy Emissions Audit, September 2017 9
in passenger kilometres since 2014, meaning that fuel consumption, emissions and passenger
kilometres have maintained a fairly constant relationship.
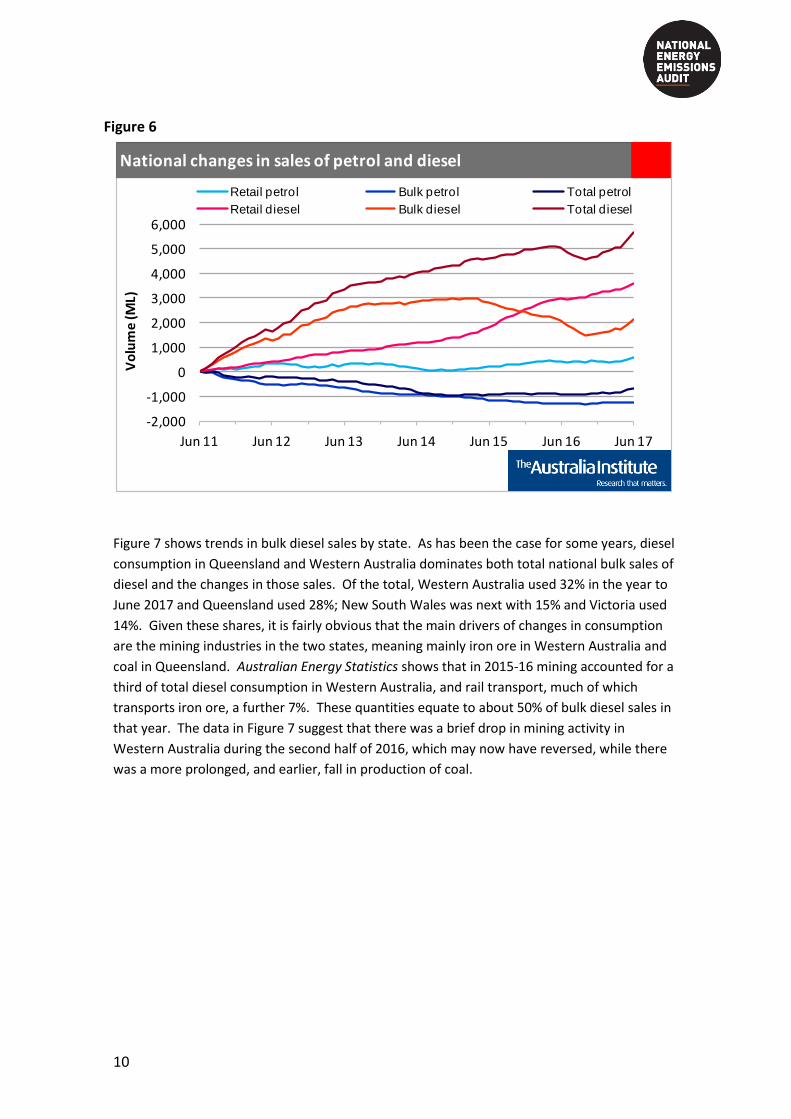
Diesel fuel bulk sales
Diesel accounts for the largest share of petroleum product consumption and emissions, and
effectively all of the growth in consumption of petroleum products and emissions arising from
that consumption since 2011. The June Audit explained that diesel is used in a more diverse
range of activities and economic sectors than any other petroleum product. As calculated
above, about 72% of bulk diesel fuel sales is used for purposes other than road transport in
2015-161. Until 2015, bulk sales of diesel grew faster than any other category of petroleum
product consumption and, by that date, accounted for more emissions than total consumption
of petrol. The data also show very sharp increases in bulk sales of diesel in May and June 2017
(Figure 6), as well as an accelerating but less sharp increase in retail sales (Figure 6)2.
Figure 5
1 Australian Energy Statistics
2 Department of Energy and Environment’s monthly publication, Australian Petroleum
Statistics
-4
-2
0
2
4
6
8
10
12
Jun 11 Jun 13 Jun 15 Jun 17
Em
issio
ns (M
t C
O2-e
)
Petrol Auto LPG Retail diesel Total
Changes in emissions from road transport fuels
10
Figure 6
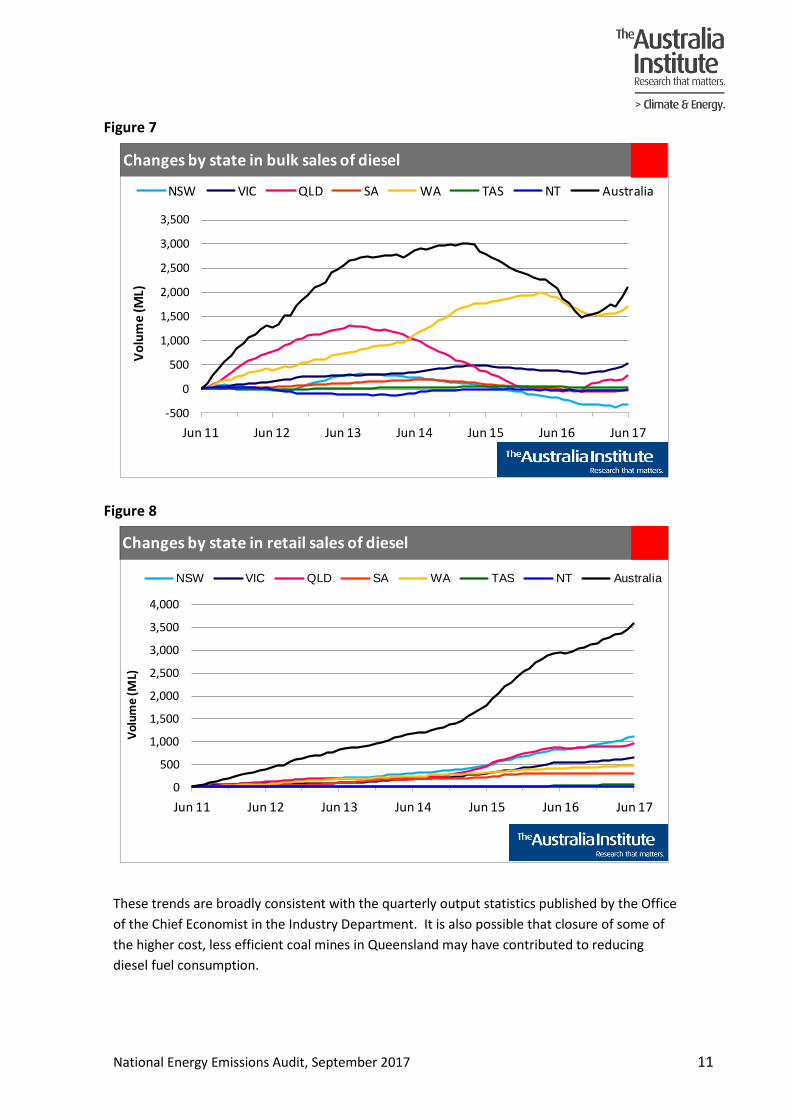
Figure 7 shows trends in bulk diesel sales by state. As has been the case for some years, diesel
consumption in Queensland and Western Australia dominates both total national bulk sales of
diesel and the changes in those sales. Of the total, Western Australia used 32% in the year to
June 2017 and Queensland used 28%; New South Wales was next with 15% and Victoria used
14%. Given these shares, it is fairly obvious that the main drivers of changes in consumption
are the mining industries in the two states, meaning mainly iron ore in Western Australia and
coal in Queensland. Australian Energy Statistics shows that in 2015-16 mining accounted for a
third of total diesel consumption in Western Australia, and rail transport, much of which
transports iron ore, a further 7%. These quantities equate to about 50% of bulk diesel sales in
that year. The data in Figure 7 suggest that there was a brief drop in mining activity in
Western Australia during the second half of 2016, which may now have reversed, while there
was a more prolonged, and earlier, fall in production of coal.
-2,000
-1,000
0
1,000
2,000
3,000
4,000
5,000
6,000
Jun 11 Jun 12 Jun 13 Jun 14 Jun 15 Jun 16 Jun 17
Vo
lum
e (M
L)
Retail petrol Bulk petrol Total petrol
Retail diesel Bulk diesel Total diesel
National changes in sales of petrol and diesel
l
National Energy Emissions Audit, September 2017 11
Figure 7
Figure 8
These trends are broadly consistent with the quarterly output statistics published by the Office
of the Chief Economist in the Industry Department. It is also possible that closure of some of
the higher cost, less efficient coal mines in Queensland may have contributed to reducing
diesel fuel consumption.
-500
0
500
1,000
1,500
2,000
2,500
3,000
3,500
Jun 11 Jun 12 Jun 13 Jun 14 Jun 15 Jun 16 Jun 17
Vo
lum
e (M
L)
NSW VIC QLD SA WA TAS NT Australia
Changes by state in bulk sales of diesel
l
0
500
1,000
1,500
2,000
2,500
3,000
3,500
4,000
Jun 11 Jun 12 Jun 13 Jun 14 Jun 15 Jun 16 Jun 17
Vo
lum
e (M
L)
NSW VIC QLD SA WA TAS NT Australia
Changes by state in retail sales of diesel
l
12
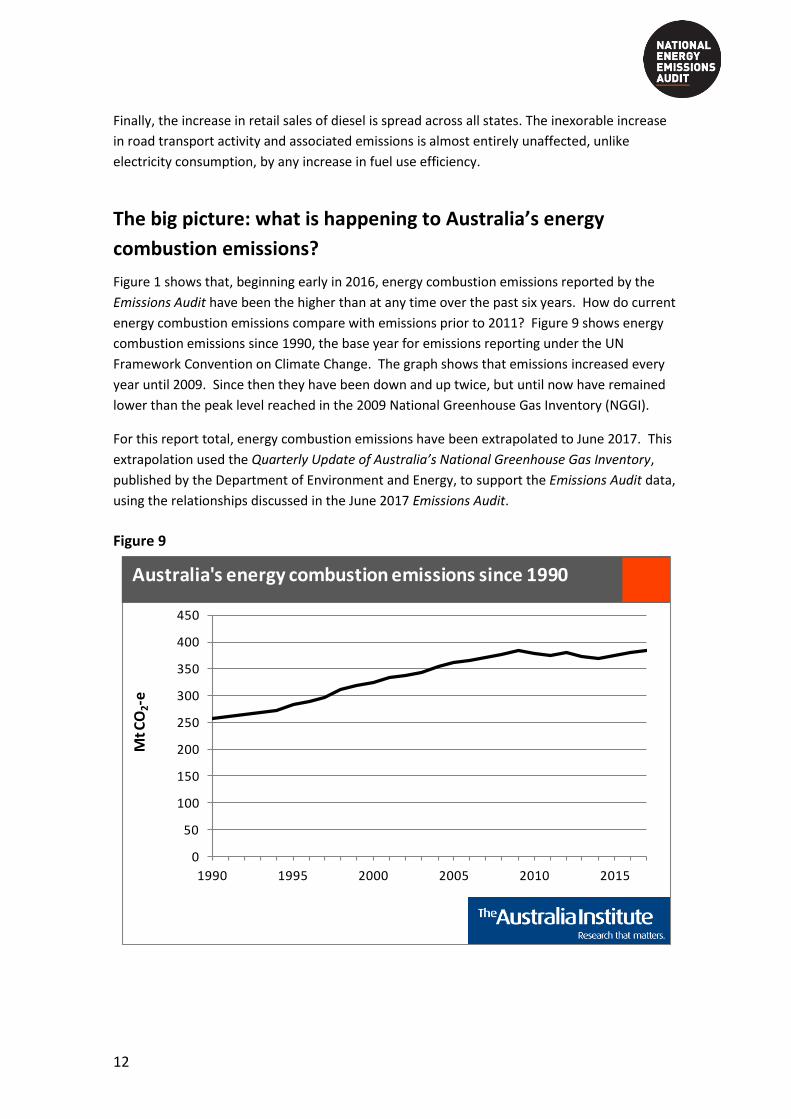
Finally, the increase in retail sales of diesel is spread across all states. The inexorable increase
in road transport activity and associated emissions is almost entirely unaffected, unlike
electricity consumption, by any increase in fuel use efficiency.
The big picture: what is happening to Australia’s energy
combustion emissions?
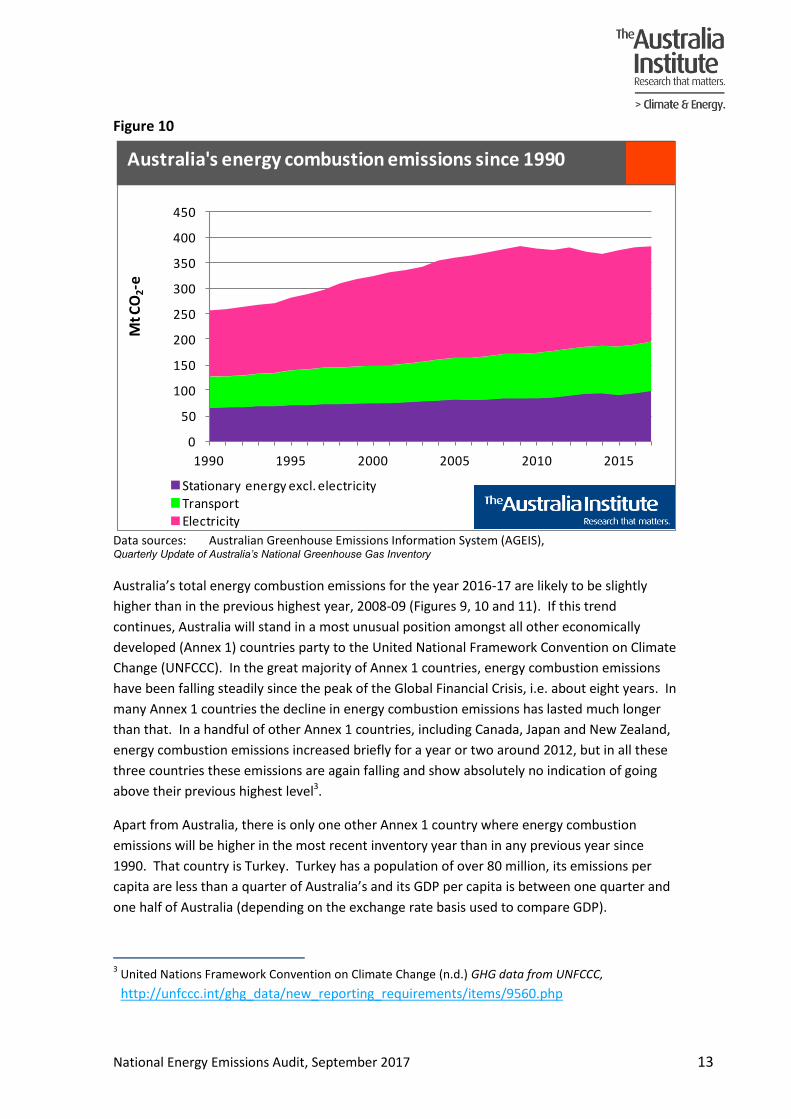
Figure 1 shows that, beginning early in 2016, energy combustion emissions reported by the
Emissions Audit have been the higher than at any time over the past six years. How do current
energy combustion emissions compare with emissions prior to 2011? Figure 9 shows energy
combustion emissions since 1990, the base year for emissions reporting under the UN
Framework Convention on Climate Change. The graph shows that emissions increased every
year until 2009. Since then they have been down and up twice, but until now have remained
lower than the peak level reached in the 2009 National Greenhouse Gas Inventory (NGGI).
For this report total, energy combustion emissions have been extrapolated to June 2017. This
extrapolation used the Quarterly Update of Australia’s National Greenhouse Gas Inventory,
published by the Department of Environment and Energy, to support the Emissions Audit data,
using the relationships discussed in the June 2017 Emissions Audit.
Figure 9
0
50
100
150
200
250
300
350
400
450
1990 1995 2000 2005 2010 2015
Mt C
O2-e
ElectricityAustralia's energy combustion emissions since 1990
National Energy Emissions Audit, September 2017 13
Figure 10
Data sources: Australian Greenhouse Emissions Information System (AGEIS), Quarterly Update of Australia’s National Greenhouse Gas Inventory
Australia’s total energy combustion emissions for the year 2016-17 are likely to be slightly
higher than in the previous highest year, 2008-09 (Figures 9, 10 and 11). If this trend
continues, Australia will stand in a most unusual position amongst all other economically
developed (Annex 1) countries party to the United National Framework Convention on Climate
Change (UNFCCC). In the great majority of Annex 1 countries, energy combustion emissions
have been falling steadily since the peak of the Global Financial Crisis, i.e. about eight years. In
many Annex 1 countries the decline in energy combustion emissions has lasted much longer
than that. In a handful of other Annex 1 countries, including Canada, Japan and New Zealand,
energy combustion emissions increased briefly for a year or two around 2012, but in all these
three countries these emissions are again falling and show absolutely no indication of going
above their previous highest level3.
Apart from Australia, there is only one other Annex 1 country where energy combustion
emissions will be higher in the most recent inventory year than in any previous year since
1990. That country is Turkey. Turkey has a population of over 80 million, its emissions per
capita are less than a quarter of Australia’s and its GDP per capita is between one quarter and
one half of Australia (depending on the exchange rate basis used to compare GDP).
3 United Nations Framework Convention on Climate Change (n.d.) GHG data from UNFCCC,
http://unfccc.int/ghg_data/new_reporting_requirements/items/9560.php
0
50
100
150
200
250
300
350
400
450
1990 1995 2000 2005 2010 2015
Mt C
O2-e
Stationary energy excl. electricity
TransportElectricity
Australia's energy combustion emissions since 1990

14
What is more, so far as Australia is concerned, as recently as June 2017 it seemed as if
Australia’s consumption of petroleum products, and associated emissions, may have been
starting to level out. Even so, it was concluded that Australia is absolutely not on track to
achieve its Paris Agreement emissions reduction target. Now that appears that petroleum
emissions may have resumed their steady increase, and could well keep increasing until the
end of 2017 or into 2018, the prospects are even worse.
Electricity generation is the only one of Australia’s top four sources of greenhouse gas
emissions which has ever recorded falling emissions for more than two successive years
(Figures 10 and 11). By contrast, both transport and other stationary combustion demonstrate
an almost inexorable upward trend. Emissions from all other sources have been remarkably
constant ever since 1990.
Figure 11
The June 2017 Emissions Audit reached the “inescapable conclusion…that much, if not most, of
the required emissions reduction must come from electricity generation”, which remains true.
The data on transport energy consumption in this September 2017 Emissions Audit lead to a
second inescapable conclusion: that the absence of any serious policy measures to curb the
growth in energy consumed by road transport is a failure almost as great as the failure in
electricity industry policy.
Nearly forty years ago, the then Fraser government tried to reduce growth in road transport
fuel consumption, in response to the sudden oil price increases and supply disruptions
associated with so-called oil shocks of the 1970s. The voluntary programs introduced achieved
0
50
100
150
200
250
1990 1995 2000 2005 2010 2015
Mt C
O2-e
All other sources excl. LULUCFStationary energy excl. electricityTransportElectricity
Australia's four major emission sources since 1990
National Energy Emissions Audit, September 2017 15
nothing. Ever since then, the perceived need to protect the domestic motor vehicle
manufacturing industry, reliant on large, fuel hungry cars acted as a political block to energy
policies to mandate increases in motor vehicle fuel efficiency. That obstacle is now gone.
Action to decisively increase the efficiency of Australia’s motor vehicle fleet is now urgent.
16
Appendix: Notes on methodology
The quarterly NEEA Report (“the Audit”) reports greenhouse gas emissions arising from the
use of fossil fuels to provide useful energy. The format in which data are presented in the
Audit is determined by the data sources available. This means that the Audit has three major
components: electricity generation, consumption of petroleum products and consumption of
gas for purposes other than electricity generation.
For electricity generation, the data are those presented monthly in the NEEA Electricity
Update. This means that they include all emissions from electricity generators supplying
electricity within the National Electricity Market (NEM). The Audit does not include emissions
arising from off-grid generation located in the five eastern states. It also excludes all emissions
from electricity generation, both grid and off-grid, in Western Australia and the Northern
Territory.
For emissions from consumption of petroleum products, the key data source is the monthly
government publication, Australian Petroleum Statistics. The specific figures used are monthly
sales of petroleum products, published in Tables 3A and 3B. This means that the emissions
cover the whole of Australia, not just the eastern states. The emissions calculated are adjusted
to net out emissions arising from the small quantities of diesel used at power stations
supplying the NEM. It is important to note that earlier this year the Department of
Environment and Energy applied a rigorous quality audit and upgrade process to Australian
Petroleum Statistics. The outcome was changes to some previously published, i e. “historic”,
data and a new starting date of July 2010 for the improved data series. This new starting date
is one reason that many graphs start with annual emissions for the year to June 2011.
The estimates of emissions from natural gas are, like electricity emissions, confined to the
eastern states. Two separate sources are used. For the period to June 2016, annual gas
consumption data by industry and state (Table f) of Australian Energy Statistics is used to
provide total gas consumption, net of gas used to generate electricity, in the five eastern
states. Linear interpolation is used to estimate moving annual gas consumption for each
intermediate month. From July 2016 onward the source data are constructed from the
pipeline gas flow data published in the weekly Gas Market Report of the Australian Energy
Regulator (AER). The NEEA estimates of emissions from gas used for electricity generation in
the NEM are subtracted from these totals. The Gas Market Report explains that some gas
consumption may not show up in its reported pipeline flow data, i.e. that these data may
somewhat underestimate total gas consumption. Comparison with the Australian Energy
Statistics data confirms that to be the case, which is why the latter data have been used for all
periods up to June 2016.
All data are reported as annual moving averages. This approach removes the impact of
seasonal changes on the reported data. Annualised data reported in the quarterly NEEA
Report (“the Audit”) will show a month on month increase if the most recent monthly quantity
is greater than the quantity in the corresponding month one year previously. Most data are
presented in the form of time series graphs, starting in June 2011, i.e. with the year ending
National Energy Emissions Audit, September 2017 17
June 2011. Some graphs start in June 2008. These starting dates have been chosen to
highlight important trends, while enhancing presentational clarity.