province of burgos, spain - espon.eu · pdf filethe capital of the province is the city of...
TRANSCRIPT

Territories and low-carbon economy
Province of Burgos, Spain
Applied Research
Case Study Report
Version 03/05/2017

This applied research activity is conducted within the framework of the ESPON 2020 Cooperation
Programme, partly financed by the European Regional Development Fund.
The ESPON EGTC is the Single Beneficiary of the ESPON 2020 Cooperation Programme. The
Single Operation within the programme is implemented by the ESPON EGTC and co-financed by
the European Regional Development Fund, the EU Member States and the Partner States,
Iceland, Liechtenstein, Norway and Switzerland.
This delivery does not necessarily reflect the opinion of the members of the ESPON 2020
Monitoring Committee.
Authors
Burgos Provincial Energy Agency, AGENBUR (Spain)
Advisory Group
Project Support Team: Domenico Gaudioso, ISPRA – Institute for Environmental Protection and
Research (Italy), Anneloes Van Noordt, Spatial Development Department Flanders
(Belgium)
ESPON EGTC: Michaela Gensheimer (Senior Project Expert, Cluster Coordinator for Project
Development and Coordination), Laurent Frideres (HoU E&O), Ilona Raugze (Director), Piera
Petruzzi (Senior Project Expert, Communication and Capitalisation), Caroline Clause (Senior
Office Administrator, Financial Officer)
Information on ESPON and its projects can be found on www.espon.eu.
The web site provides the possibility to download and examine the most recent documents
produced by finalised and ongoing ESPON projects.
This delivery exists only in an electronic version.
© ESPON, 2017
Printing, reproduction or quotation is authorised provided the source is acknowledged and a copy
is forwarded to the ESPON EGTC in Luxembourg.
Contact: [email protected]

Territories and low-carbon economy
Regional Case Study: Province of Burgos, Spain

ESPON 2020 I
Table of contents
List of Figures ............................................................................................................................ II
List of Tables ............................................................................................................................. II
1 General description of the region ...................................................................................... 1
1.1 Location of region and characteristic ........................................................................ 1
1.2 Socio-demographic structure and development ....................................................... 5
1.3 Settlement type and building stock ........................................................................... 7
1.4 Transport system and modal split ............................................................................. 7
1.5 Regional economic structure and development ........................................................ 9
2 Energy strategy, energy consumption and regional renewable energies ....................... 11
2.1 Regional highlights and challenges ........................................................................ 11
2.2 Energy strategy of the region .................................................................................. 12
2.3 Regional and local energy infrastructure ................................................................ 13
2.4 Patterns of energy consumption ............................................................................. 13
2.5 Regional potential of renewable energy .................................................................. 16
2.6 Use of renewable energy in the region ................................................................... 16
3 Governance and important regional policies ................................................................... 17
3.1 Regional governance system .................................................................................. 17
3.2 Involvement of private sector partners .................................................................... 18
3.3 Regional policies ..................................................................................................... 22
3.4 Membership in low carbon programs and initiatives ............................................... 24
4 National and European policy background, complementarity ......................................... 25
4.1 Relevant national low carbon policies, interrelation with regional policy ................ 25
4.2 Complementarity of regional, national and EU low carbon policies ........................ 26
5 The role of cohesion policy for regional low carbon development .................................. 30
6 Good practices and successful approaches ................................................................... 31
References .............................................................................................................................. 33
List of interviewed persons ...................................................................................................... 34
Annex: PRIAP project, expected achievements per municipality ............................................ 35
ESPON 2020 II
List of Figures
Figure 1.1: Map and location of the province of Burgos ............................................................ 1
Figure 1.2: Population development (2000-2016) ..................................................................... 6
Figure 1.3: Map of train infrastructures in Spain, remarking Burgos Province .......................... 9
Figure 1.4: GDP evolution in Burgos Province (2000-2013) ................................................... 10
Figure 2.1: Final energy consumption (2014) .......................................................................... 11
Figure 2.2: Most probable biomass business developing areas and their hotspots ............... 16
Figure 3.1: PEPUR1520’s aspects .......................................................................................... 23
Figure 3.2: PEBUR1520’s axes of work .................................................................................. 23
List of Tables
Table 1.1: Municipalities and inhabitants in Burgos Province (2015)........................................ 1
Table 1.2: Demographic structure ............................................................................................. 6
Table 1.3: Demographic structure by sex .................................................................................. 6
Table 1.4: Demographic structure by age ................................................................................. 6
Table 1.5: Type of buildings in Burgos Province ....................................................................... 7
Table 1.6: Age of buildings ........................................................................................................ 7
Table 1.7: Dominating heat systems ......................................................................................... 7
Table 1.8: Vehicles/Inhabitants ................................................................................................. 8
Table 1.9: Total vehicles ............................................................................................................ 8
Table 1.10: Total driver census ................................................................................................. 8
Table 1.11: Energy consumption in transport sector ................................................................. 9
Table 1.12: GDP per sectors (2015)........................................................................................ 10
Table 1.13: Unemployment in Burgos ..................................................................................... 10
Table 1.14: Regional economic profile(employment) (2009-2015) ......................................... 10
Table 2.1: Resume of energy balance: TOTAL ....................................................................... 14
Table 2.2: Resume energy balance: per capita ....................................................................... 15

ESPON 2020 1
1 General description of the region
1.1 Location of region and characteristic
Burgos Provincial Energy Agency (AGENBUR) is a SAVE Energy Agency created and ruled
by Burgos Provincial Government in order to promote renewable energies and energy effi-
ciency in the province of Burgos.
Burgos is a province of northern Spain, in the north-eastern part of the region of “Castilla y
León”. “Castilla y León” has 2,553,000 inhabitants (2014 data) with an area of 94,223 km2.
“Castilla y León” is formed by 9 provinces, being Burgos the second in size.
The capital of the province is the city of Burgos, the home of the only cathedral in Spain which
has been individually awarded the World Heritage designation by the UNESCO.
The province of Burgos has an area of 14,300 km2 and a population of 364,002 inhabitants
(2015 data). It has three main cities (Burgos, Aranda de Duero and Miranda de Ebro) and a
large number of villages, (371 municipalities which sums 1,273 small towns).
This is the main characteristic of our province, it has the population too disseminated in a
large number of small towns.
Figure 1.1: Map and location of the province of Burgos
Table 1.1: Municipalities and inhabitants in Burgos Province (2015)
Municipality Population
Abajas 29
Adrada de Haza 221
Aguas Cándidas 58
Aguilar de Bureba 68
Albillos 221
Alcocero de Mola 33
Municipality Population
Alfoz de Bricia 74
Alfoz de Quintanadueñas 2,019
Alfoz de Santa Gadea 105
Altable 51
Altos, Los 190
Ameyugo 103
SPAIN: 42.264.382 inhabitants
CASTILLA Y LEÓN: 2.472.052 inhabitants
BURGOS PROVINCE: 364.002 inhabitants
SMALL TOWNS IN PROVINCE OF BURGOS: 121.246 inhabitants

ESPON 2020 2
Municipality Population
Anguix 134
Aranda de Duero 32,880
Arandilla 172
Arauzo de Miel 350
Arauzo de Salce 60
Arauzo de Torre 78
Arcos 1,566
Arenillas de Riopisuerga 179
Arija 146
Arlanzón 429
Arraya de Oca 45
Atapuerca 187
Ausines, Los 126
Avellanosa de Muñó 115
Bahabón de Esgueva 89
Balbases, Los 323
Baños de Valdearados 361
Bañuelos de Bureba 37
Barbadillo de Herreros 116
Barbadillo del Mercado 129
Barbadillo del Pez 77
Barrio de Muñó 32
Barrios de Bureba, Los 199
Barrios de Colina 52
Basconcillos del Tozo 291
Bascuñana 35
Belbimbre 69
Belorado 1,969
Berberana 74
Berlangas de Roa 185
Berzosa de Bureba 32
Bozoó 105
Brazacorta 73
Briviesca 7,129
Bugedo 175
Buniel 516
Burgos 177,100
Busto de Bureba 164
Cabañes de Esgueva 180
Cabezón de la Sierra 66
Caleruega 470
Campillo de Aranda 178
Campolara 74
Canicosa de la Sierra 514
Cantabrana 31
Carazo 34
Carcedo de Bureba 50
Carcedo de Burgos 388
Cardeñadijo 1,295
Cardeñajimeno 1,019
Municipality Population
Cardeñuela Riopico 127
Carrias 23
Cascajares de Bureba 36
Cascajares de la Sierra 39
Castellanos de Castro 48
Castil de Peones 37
Castildelgado 43
Castrillo de la Reina 209
Castrillo de la Vega 636
Castrillo de Riopisuerga 61
Castrillo del Val 839
Castrillo Matajudíos 58
Castrojeriz 845
Cavia 247
Cayuela 180
Cebrecos 47
Celada del Camino 97
Cerezo de Río Tirón 598
Cerratón de Juarros 55
Ciadoncha 81
Cillaperlata 37
Cilleruelo de Abajo 237
Cilleruelo de Arriba 59
Ciruelos de Cervera 111
Cogollos 451
Condado de Treviño 1,362
Contreras 82
Coruña del Conde 124
Covarrubias 585
Cubillo del Campo 100
Cubo de Bureba 103
Cueva de Roa, La 99
Cuevas de San Clemente 49
Encío 46
Espinosa de Cervera 100
Espinosa de los Monteros 1,788
Espinosa del Camino 44
Estépar 664
Fontioso 54
Frandovínez 99
Fresneda de la Sierra Tirón 123
Fresneña 87
Fresnillo de las Dueñas 636
Fresno de Río Tirón 195
Fresno de Rodilla 49
Frías 265
Fuentebureba 54
Fuentecén 222
Fuentelcésped 213
Fuentelisendo 96

ESPON 2020 3
Municipality Population
Fuentemolinos 97
Fuentenebro 139
Fuentespina 769
Galbarros 29
Gallega, La 54
Grijalba 104
Grisaleña 39
Gumiel de Izán 577
Gumiel de Mercado 344
Hacinas 166
Haza 26
Hontanas 67
Hontangas 106
Hontoria de la Cantera 157
Hontoria de Valdearados 201
Hontoria del Pinar 707
Hormazas, Las 106
Hornillos del Camino 56
Horra, La 366
Hortigüela 103
Hoyales de Roa 211
Huérmeces 131
Huerta de Arriba 128
Huerta de Rey 1,007
Humada 130
Hurones 73
Ibeas de Juarros 1,400
Ibrillos 55
Iglesiarrubia 44
Iglesias 140
Isar 331
Itero del Castillo 84
Jaramillo de la Fuente 52
Jaramillo Quemado 5
Junta de Traslaloma 136
Junta de Villalba de Losa 89
Jurisdicción de Lara 47
Jurisdicción de San Zadornil 51
Lerma 2,703
Llano de Bureba 63
Madrigal del Monte 169
Madrigalejo del Monte 181
Mahamud 123
Mambrilla de Castrejón 100
Mambrillas de Lara 48
Mamolar 31
Manciles 19
Mazuela 63
Mecerreyes 259
Medina de Pomar 5,983
Municipality Population
Melgar de Fernamental 1,744
Merindad de Cuesta-Urria 366
Merindad de Montija 803
Merindad de Río Ubierna 1,456
Merindad de Sotoscueva 436
Merindad de Valdeporres 440
Merindad de Valdivielso 400
Milagros 460
Miranda de Ebro 36,173
Miraveche 79
Modúbar de la Emparedada 597
Monasterio de la Sierra 48
Monasterio de Rodilla 181
Moncalvillo 86
Monterrubio de la Demanda 64
Montorio 162
Moradillo de Roa 192
Nava de Roa 221
Navas de Bureba 35
Nebreda 70
Neila 173
Olmedillo de Roa 199
Olmillos de Muñó 38
Oña 1,088
Oquillas 59
Orbaneja Riopico 243
Padilla de Abajo 89
Padilla de Arriba 78
Padrones de Bureba 52
Palacios de la Sierra 744
Palacios de Riopisuerga 28
Palazuelos de la Sierra 79
Palazuelos de Muñó 54
Pampliega 332
Pancorbo 453
Pardilla 126
Partido de la Sierra en Tobalina 84
Pedrosa de Duero 455
Pedrosa de Río Úrbel 249
Pedrosa del Páramo 103
Pedrosa del Príncipe 175
Peñaranda de Duero 552
Peral de Arlanza 163
Piérnigas 40
Pineda de la Sierra 101
Pineda Trasmonte 126
Pinilla de los Barruecos 111
Pinilla de los Moros 42
Pinilla Trasmonte 176
Poza de la Sal 337

ESPON 2020 4
Municipality Population
Prádanos de Bureba 58
Pradoluengo 1,282
Presencio 195
Puebla de Arganzón, La 519
Puentedura 129
Quemada 259
Quintana del Pidio 164
Quintanabureba 30
Quintanaélez 52
Quintanaortuño 281
Quintanapalla 110
Quintanar de la Sierra 1,845
Quintanavides 96
Quintanilla de la Mata 130
Quintanilla del Agua y Tordueles 419
Quintanilla del Coco 61
Quintanilla San García 88
Quintanilla Vivar 766
Quintanillas, Las 391
Rabanera del Pinar 121
Rábanos 96
Rabé de las Calzadas 228
Rebolledo de la Torre 122
Redecilla del Camino 136
Redecilla del Campo 71
Regumiel de la Sierra 367
Reinoso 11
Retuerta 65
Revilla del Campo 96
Revilla Vallejera 115
Revilla y Ahedo, La 114
Revillarruz 512
Rezmondo 15
Riocavado de la Sierra 59
Roa 2,373
Rojas 72
Royuela de Río Franco 212
Rubena 176
Rublacedo de Abajo 37
Rucandio 77
Salas de Bureba 133
Salas de los Infantes 2,091
Saldaña de Burgos 203
Salinillas de Bureba 48
San Adrián de Juarros 93
San Juan del Monte 139
San Mamés de Burgos 286
San Martín de Rubiales 142
San Millán de Lara 78
San Vicente del Valle 29
Municipality Population
Santa Cecilia 105
Santa Cruz de la Salceda 152
Santa Cruz del Valle Urbión 103
Santa Gadea del Cid 155
Santa Inés 155
Santa María del Campo 595
Santa María del Invierno 63
Santa María del Mercadillo 114
Santa María Rivarredonda 94
Santa Olalla de Bureba 33
Santibáñez de Esgueva 99
Santibáñez del Val 50
Santo Domingo de Silos 287
Sargentes de la Lora 129
Sarracín 246
Sasamón 1,073
Sequera de Haza, La 34
Solarana 93
Sordillos 24
Sotillo de la Ribera 520
Sotragero 286
Sotresgudo 482
Susinos del Páramo 103
Tamarón 38
Tardajos 803
Tejada 28
Terradillos de Esgueva 86
Tinieblas de la Sierra 37
Tobar 27
Tordómar 343
Torrecilla del Monte 69
Torregalindo 136
Torrelara 37
Torrepadre 78
Torresandino 691
Tórtoles de Esgueva 498
Tosantos 56
Trespaderne 877
Tubilla del Agua 154
Tubilla del Lago 150
Úrbel del Castillo 79
Vadocondes 382
Valdeande 100
Valdezate 140
Valdorros 332
Vallarta de Bureba 45
Valle de las Navas 533
Valle de Losa 538
Valle de Manzanedo 132
Valle de Mena 3,826

ESPON 2020 5
Municipality Population
Valle de Oca 159
Valle de Santibáñez 505
Valle de Sedano 472
Valle de Tobalina 1,026
Valle de Valdebezana 506
Valle de Valdelaguna 213
Valle de Valdelucio 309
Valle de Zamanzas 68
Vallejera 42
Valles de Palenzuela 89
Valluércanes 77
Valmala 28
Vid de Bureba, La 20
Vid y Barrios, La 274
Vileña 29
Villadiego 1,593
Villaescusa de Roa 113
Villaescusa la Sombría 69
Villaespasa 26
Villafranca Montes de Oca 129
Villafruela 209
Villagalijo 66
Villagonzalo Pedernales 1,774
Villahoz 320
Villalba de Duero 683
Villalbilla de Burgos 1,279
Villalbilla de Gumiel 93
Villaldemiro 68
Villalmanzo 450
Villamayor de los Montes 202
Municipality Population
Villamayor de Treviño 76
Villambistia 46
Villamedianilla 12
Villamiel de la Sierra 40
Villangómez 239
Villanueva de Argaño 106
Villanueva de Carazo 32
Villanueva de Gumiel 284
Villanueva de Teba 48
Villaquirán de la Puebla 47
Villaquirán de los Infantes 146
Villarcayo de Merindad de Cas-tilla la Vieja
4,372
Villariezo 612
Villasandino 192
Villasur de Herreros 265
Villatuelda 43
Villaverde del Monte 134
Villaverde-Mogina 86
Villayerno Morquillas 207
Villazopeque 57
Villegas 90
Villoruebo 85
Viloria de Rioja 39
Vilviestre del Pinar 616
Vizcaínos 49
Zael 115
Zarzosa de Río Pisuerga 31
Zazuar 242
Zuñeda 57
1.2 Socio-demographic structure and development
As we have explained in the before chapter Burgos Province has a very large number of mu-
nicipalities and small towns. The 48.5% of the population live in Burgos capital, 33.33% live in
rural areas, distributed in 1,273 small towns and the rest in two second main towns, “Aranda
de Duero” and “Miranda de Ebro”.
The 75% of the population of the province of Burgos is placed in only 7 municipalities.
The population density in the rural areas of the province is about 9 inh./km2
The population in the whole province of Burgos has increased during the last five years. In
spite of this fact, there are several rural areas of the province having reduced their population.

ESPON 2020 6
Table 1.2: Demographic structure
Population distribution by size of municipalities (2015)
Inhabitants from – to Number of municipalities
Inhabitants from – to Number of municipalities
0-100 154 801-1000 6
101-200 92 1,001-2,000 16
201-300 30 2,001-5,000 7
301-500 35 5,000-10,000 2
501-800 26 10,000-200,000 3
Table 1.3: Demographic structure by sex
Population distribution by inhabitants sex (2015)
Female Male
181,860 182,142
Table 1.4: Demographic structure by age
Population distribution by age (2015)
Age Inhabitants Age Inhabitants
From 0 to 4 years old 15,368 From 45 to 49 years old 28,728
From 5 to 9 years old 16,648 From 50 to 54 years old 28,415
From 10 to 14 years old 15,723 From 55 to 59 years old 26,168
From 15 to 19 years old 15,002 From 60 to 64 years old 22,170
From 20 to 24 years old 16,523 From 65 to 69 years old 20,072
From 25 to 29 years old 19,022 From 70 to 74 years old 16,782
From 30 to 34 years old 22,567 From 75 to 79 years old 13,888
From 35 to 39 years old 27,949 From 80 to 84 years old 14,689
From 40 to 44 years old 28,371 More than 85 years old 15,917
Figure 1.2: Population development (2000-2016)
330.000
335.000
340.000
345.000
350.000
355.000
360.000
365.000
370.000
375.000
380.000
PO
PU
LATI
ON
- Y
EAR
1
99
1
PO
PU
LATI
ON
- Y
EAR
1
99
2
PO
PU
LATI
ON
- Y
EAR
1
99
3
PO
PU
LATI
ON
- Y
EAR
1
99
4
PO
PU
LATI
ON
- Y
EAR
1
99
5
PO
PU
LATI
ON
- Y
EAR
1
99
6
PO
PU
LATI
ON
- Y
EAR
1
99
8
PO
PU
LATI
ON
- Y
EAR
1
99
9
PO
PU
LATI
ON
- Y
EAR
2
00
0
PO
PU
LATI
ON
- Y
EAR
2
00
1
PO
PU
LATI
ON
- Y
EAR
2
00
2
PO
PU
LATI
ON
- Y
EAR
2
00
3
PO
PU
LATI
ON
- Y
EAR
2
00
4
PO
PU
LATI
ON
- Y
EAR
2
00
5
PO
PU
LATI
ON
- Y
EAR
2
00
6
PO
PU
LATI
ON
- Y
EAR
2
00
7
PO
PU
LATI
ON
- Y
EAR
2
00
8
PO
PU
LATI
ON
- Y
EAR
2
00
9
PO
PU
LATI
ON
- Y
EAR
2
01
0
PO
PU
LATI
ON
- Y
EAR
2
01
1
PO
PU
LATI
ON
- Y
EAR
2
01
2
PO
PU
LATI
ON
- Y
EAR
2
01
3
PO
PU
LATI
ON
- Y
EAR
2
01
4
PO
PU
LATI
ON
- Y
EAR
2
01
5

ESPON 2020 7
1.3 Settlement type and building stock
Collecting all the information from our buildings we can resume the next figures:
Final energy demand in the consumption unit (MWh/yr): 133,799 MWh/yr
Primary energy supplied by the all thermal sub-installations in the consumption units
(MWh/yr): 232,863 MWh/yr
The main information is collected in the next tables:
Table 1.5: Type of buildings in Burgos Province
Type of building Total
Single family 82,134
Multi-storey 7,503
Multi-storey with business premises 8,387
Commercial building 6,331
Building accommodations 453
Convents, prisons and head quarters 122
Schools 199
Hospitals 31
Other properties 107,046
Dilapidated buildings 1,886
Table 1.6: Age of buildings
Year Total
Before 1990 unknown
1991 979
1992 1,081
1993 919
1994 903
1995 1,026
1996 993
Year Total
1997 1,125
1998 1,137
1999 1,218
2000 1,540
2001 2,217
2002 1,456
2003 1,123
Year Total
2004 523
2005 374
2006 266
2007 154
2008 241
2009 245
After 2010 488
Table 1.7: Dominating heat systems
Type of system Number of buildings Percentage
Butane 9,016 4.25%
Propane 30,288 14.27%
Piped natural gas 77,960 36.74%
Fuel 93,096 43.87%
Solar thermal 150 0.07%
Geothermal 25 0.01%
Biomass 1,520 0.72%
Other (heat pumps, carbon, electricity, ...) 151 0.07%
1.4 Transport system and modal split
The province of Burgos is an important logistical point in Spain. The province doesn’t have
enough kilometers of dual carriage road or highways. On these grounds, the number of kilo-
meters of roads per 1,000 inhabitants is extremely low.

ESPON 2020 8
Our transport system is based in the use of private cars. It is so difficult to organize efficiently
mobility in a province of 371 municipalities; being the 75% of the total population concentrated
into only 7 municipalities and the average population density being 9 inhabitants/km2.
This excessive reliance on private transport implies higher costs. The “transport on demand”
is introduced and underused in several rural areas of the province. In small villages, the atti-
tude of underusing available resources damages the future maintenance of public lines, de-
clared unfeasible if there is a total lack of critical mass. The main figures are:
Table 1.8: Vehicles/Inhabitants
Vehicles Nº/1,000 inhabitants (2011)
Type of vehicle Nº/1,000 inhabitants in target territory
Cars 485
Motorcycles and mopeds 36
Trucks and vans 101
Buses 1
Other vehicles 40
Table 1.9: Total vehicles
VEHICLES (2011)
Province Cars (nº) Motorcycles and mopeds (nº)
Trucks and vans (nº)
Buses (nº) Other vehicles (nº)
Province of Burgos 182,496 13,668 38,054 503 15,139
Table 1.10: Total driver census
Drivers census, nº (2011)
Nº in target territory
Males 131,796
Women 80,188
Total 211,984
The province of Burgos does not have high speed infrastructures. In spite of this, the commu-
nication by rail is very important for the connectivity of the territory. The province is – via rail –
communicated with different regions at regional, national and European level.
The province of Burgos has one airport (closed to the capital city). The airport had permanent
national flights and international ones only seasonally until 2015 and now it has only operative
use of loads.

ESPON 2020 9
Figure 1.3: Map of train infrastructures in Spain, remarking Burgos Province
Concerning to the use of energy in mobility we have the next figures:
Table 1.11: Energy consumption in transport sector
Final energy consumption in transport sector (in equivalent tonnes of oil). (2011)
Petroleum products 1,101,512
Renewable energies (biofuels) 59,890
Electricity 12,918
Total final energy consumption in transport 452,813
Total final energy consumption (overall) 1,174,320
% total energy consumption in transport/total energy consumption 38.56%
% petroleum products/total consumption in transport 93.8%
% renewable energies/total consumption in transport 5.1%
1.5 Regional economic structure and development
Basing on Regional Accounting of Spain the gross domestic product at market prices (GDP
APM) in Burgos rose in the year 2013 to € 9,220,573 thousand, representing 17.69% of GDP
“Castilla y León” and 0.89% of GDP; over the previous year.
The provincial economy is based on the services sector. This sector contributes with 56.43%
to Value Gross added (GVA).
Although the GVA of Services in Burgos in 2013 decreased compared to the previous year,
its importance in provincial economy has increased 1.17 percentage points.
Regarding to the employment in Burgos Province we can see the most important figures in
Table 1.13 and Table 1.14, but probably the main characteristic is the increase of the unem-
ployment as a result of the economic crisis in Spain.

ESPON 2020 10
Figure 1.4: GDP evolution in Burgos Province (2000-2013)
Table 1.12: GDP per sectors (2015)
Economic sectors Burgos (miles €) Castilla y Leon (miles €) Spain (miles €)
Agriculture 413,318 2,446,839 26,560,000
Industry 2,809,354 10,169,745 161,040,000
Construction 444,426 2,857,070 52,452,000
Services 4,789,975 32,089,072 701,241,000
Total 8,416,073 47,562,726 941,293,000
Table 1.13: Unemployment in Burgos
2006 2007 2008 2009 2010 2011 2012 2013 2014 2015
12,404 12,197 14,812 22,495 25,421 26,278 30,663 32,540 30,326 27,383
Table 1.14: Regional economic profile(employment) (2009-2015)
2009 2015 change
Total General 113,518 105,090 -8,428
A Agriculture, forestry and fishing 10,766 8,259
B Quarrying 625 443 -182
C Manufacturing 30,737 28,661 -2,076
D Electricity, gas, steam and air conditioning supply 593 558 -35
E Water supply, residues and decontamination 1,009 1,031 22
F Construction 14,939 9,021 -5,918
G Wholesale and retail trade and repair of vehicles 22,014 20,536 -1,478
H Transportation and storage 6,856 6,484 -372
I Accommodation and food service activities 9,865 10,284 419
J Information and communication 1,097 1,036 -61
K Financial and insurance activities 3,214 2,407 -807
L Real estate activities 425 554 129
M Professional, scientific and technical activities 5,076 4,738 -338
N Administrative and support service activities 8,093 8,363 270
O Public administration and defence 6,681 5,785 -896
P Education 6,251 7,973 1,722
Q Human health and social work activities 13,388 14,120 732
R Arts, entertainment and recreation 1,467 1,620 153
S Other service activities 4,078 3,779 -299
T Activities of households as employers 2,018 3,286 1,268
U Activities of extraterritorial organisations and bodies 0 0 0
0
2000000
4000000
6000000
8000000
10000000
12000000
2000 2001 2002 2003 2004 2005 2006 2007 2008 2009 2010 2011 2012 2013
GV
A (
mile
s €
)

ESPON 2020 11
2 Energy strategy, energy consumption and regional renewable energies
2.1 Regional highlights and challenges
Nowadays, Burgos is the province with the maximum consumption of energy in the region.
Figure 2.1: Final energy consumption (2014)
Due to the increasing energy needs, the external energy dependence in the UE and the envi-
ronmental commitments of public bodies, Burgos Province Government promoted the crea-
tion of this Agency in 2003. The purpose of this initiative was to establish a new culture in
energy consumption, saving and promotion of RES.
Currently four people are working in Burgos Provincial Energy Agency to fulfill the following
objectives:
Increase of the public awareness about the energy sources shortage and their rational
and compatible with economical and environmental issues use.
Promotion of Renewable Energies.
Development of saving energy policies and promotion of the rational use of energy.
The main activities and services of Burgos Provincial Energy Agency are:
Execution of structural actions aimed at the sustainable development of the Province
(evaluation and analysis of the Province energy structure, assessment of the potential
renewable sources, study of the availability of biomass in the province of Burgos,
searching of investors in renewable energy sector, etc.)
Training, diffusion and promotion activities: informative campaigns, good practices
manuals, mass media, conferences, courses, workshops, spreading of the regulation
and technological innovations in the fields of energy and environment, etc.
Technical advising in RES and RUE technologies.
Information to the public sector, companies and citizens in general about financing pro-
grams, economical incentives and subventions.
Institutional support in order to work as the intermediaries between public organizations
and the energy market actors and develop national and international contacts to promote
the exchanges of information and energy technology.

ESPON 2020 12
Development of European projects in different sectors (RES, energy efficiency, trans-
port, biofuels, biomass, etc) and under different European Programmes.
Since 2003 Burgos province has got next achieves:
Data collection of: potencial of biomass in the province, energy companies working in
this field, energy balance and observatory of the renewables energies.
Renewable installations property of Burgos Provincial Goverment: six solar thermal in-
stallations (1,728 MWh/year) and two photovoltaic installations (30 kW and 21 kW)
Measures of efficiency energy in properties of Burgos Provincial Goverment: energy sav-
ings achieved (479,552 kWh)
35 infodays about different items of energy with more than 1500 people reached.
2 exhibitions, 2 trade fairs and 6 attendance at Expobiomasa fair as exhibitor, total
amount 114,920 people reached..
Different works with more than 3,500 students
9 European projects with an amount budget of € 1,318,885.
Energy efficiency measures in municipalities achieving energy savings of more than 45M
kWh with a budget of € 7,852,440.11.
2.2 Energy strategy of the region
Being conscious of the importance of implementing politics about sustainable development,
Burgos Provincial Government developed in 2010 the Strategic Plan Burgos Rural. This plan
covers not only energy field but also an integral plan to achieve an integral and sustainable
province.
Within this global Plan there is a chapter dedicated only to energy, named “Energy, the way
for a sustainable development”.
Main objectives of this chapter are:
(1) To develop concrete measures to optimize energy consumptions to get a more competi-
tive province.
(2) To develop energy potential in renewable energy specially in biomass.
These objectives will be developed across two strategic lines: working with public sector and
private sector.
Referring to public sector, Burgos Provincial Government has developed an ambitious plan.
This plan is about to substitute street lighting in all the municipalities by LED street lighting. In
the chapter 6 of this report we will give more details about it.
On the other hand, in private sector, Burgos Provincial Government works on generating a
network of companies committed to energy savings. Moreover, it develops a programme to
make energy audits in companies with a very high level of energy saving potential.
This programme counts with a budget of € 11 million.
ESPON 2020 13
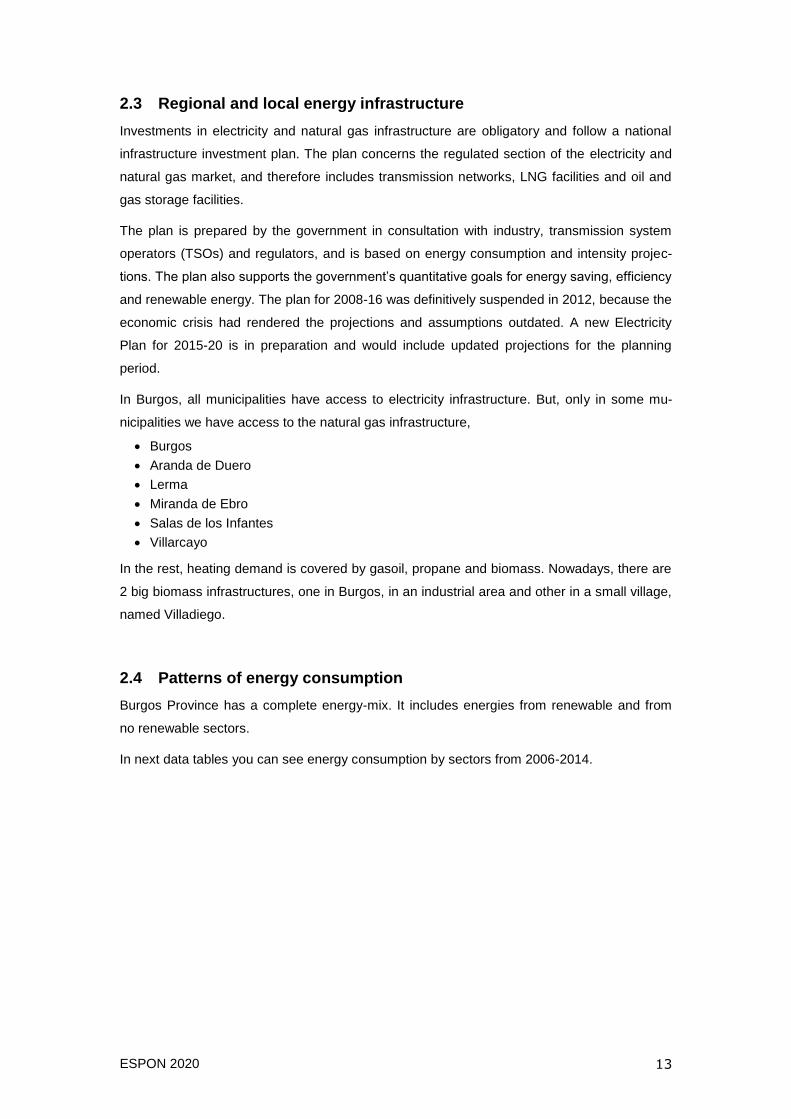
2.3 Regional and local energy infrastructure
Investments in electricity and natural gas infrastructure are obligatory and follow a national
infrastructure investment plan. The plan concerns the regulated section of the electricity and
natural gas market, and therefore includes transmission networks, LNG facilities and oil and
gas storage facilities.
The plan is prepared by the government in consultation with industry, transmission system
operators (TSOs) and regulators, and is based on energy consumption and intensity projec-
tions. The plan also supports the government’s quantitative goals for energy saving, efficiency
and renewable energy. The plan for 2008-16 was definitively suspended in 2012, because the
economic crisis had rendered the projections and assumptions outdated. A new Electricity
Plan for 2015-20 is in preparation and would include updated projections for the planning
period.
In Burgos, all municipalities have access to electricity infrastructure. But, only in some mu-
nicipalities we have access to the natural gas infrastructure,
Burgos
Aranda de Duero
Lerma
Miranda de Ebro
Salas de los Infantes
Villarcayo
In the rest, heating demand is covered by gasoil, propane and biomass. Nowadays, there are
2 big biomass infrastructures, one in Burgos, in an industrial area and other in a small village,
named Villadiego.
2.4 Patterns of energy consumption
Burgos Province has a complete energy-mix. It includes energies from renewable and from
no renewable sectors.
In next data tables you can see energy consumption by sectors from 2006-2014.

ESPON 2020 14
Table 2.1: Resume of energy balance: TOTAL
** (Unit TOE) 2006 2007 2008 2009 2010 2011 2012 2013 2014
Oil
Primary 5,397.00 5,529.00 6,482.00 9,381.00 4,682.00 7,329.00 7,084.00 4,996.00 5,109.00
Importation 695,023.00 710,957.00 653,955.00 655,762.00 663,599.00 619,039.00 591,034.00 484,647.88 473,120.00
Final use 692,226.00 707,698.00 655,887.00 646,241.00 660,157.00 609,694.00 573,511.00 470,124.88 465,233.82
Cogeneration 8,194.00 8,788.00 4,550.00 9,521.00 8,124.00 16,674.00 17,523.00 14,523.00 12,995.18
Gas
Importation 555,160.00 610,956.00 583,059.00 555,350.00 588,030.00 552,748.00 551,679.00 510,203.17 424,284.87
Cogeneration 215,060.00 374,152.00 270,987.00 337,581.00 344,716.00 313,691.00 187,680.00 152,423.14 116,695.16
Final use 340,100.00 236,804.00 312,072.00 217,769.00 243,314.00 239,056.00 363,999.00 357,780.03 307,589.71
Electrical energy produced by cogeneration 80,758.00 90,632.00 96,653.00 67,697.00 67,832.00 77,329.00 85,684.00 74,144.99 55,081.04
Nuclear 3,842,320.00 3,482,287.00 4,020,950.00 3,579,849.00 329,996.53 322,288.00 333,653.00 0.00 0.00
Hydraulic 801,802.00 1,063,656.00 69,302.00 86,428.00 9,877.44 6,328.00 5,866.00 6,849.21 7,768.00
Wind power 1,291,988.00 1,567,867.00 1,577,960.00 2,506,129.00 237,184.22 268,644.00 340,569.00 386,596.66 363,934.00
Solar photovoltaic power 2,204.00 3,324.00 13,300.00 28,652.00 2,567.44 3,058.00 3,469.00 3,794.84 3,917.00
Electrical energy produced 591,453.00 616,791.00 585,263.00 600,989.00 647,408.00 677,646.00 769,245.00 471,385.69 430,700.04
Final use 182,427.00 194,853.00 265,566.00 187,033.00 208,016.00 250,935.00 333,331.00 300,857.08 299,905.00
Exportation 409,026.00 421,938.00 319,697.00 413,956.00 439,392.00 426,711.00 435,914.00 170,528.61 130,795.04
Final consumption 1,214,753.00 1,276,703.00 1,192,440.00 1,170,855.00 1,212,889.00 1,174,320.00 1,270,841.00 1,128,761.99 1,072,727.00
Consumption
Service + household + primary sector 331,222.00 356,633.70 328,234.00 310,279.00 335,685.00
industry 387,469.00 419,644.30 390,101.00 391,253.00 400,056.00
transport 496,061.00 500,425.00 474,105.00 469,323.00 477,148.00
Services + primary + industry 591,902.00 678,383.00 591,400.17 508,274.71
Households 129,605.00 127,854.00 127,843.13 113,520.09
Transport 452,813.00 464,604.00 406,325.00 416,039.00

ESPON 2020 15
Table 2.2: Resume energy balance: per capita
2006 2007 2008 2009 2010 2011 2012 2013 2014
Inhabitants 363,874 365,972 373,672 375,563 374,826 375,657 374,970 371,248 366,900
Oil
Primary 0.01 0.02 0.02 0.02 0.01 0.02 0.02 0.01 0.01
Importation 1.91 1.94 1.75 1.75 1.77 1.65 1.58 1.31 1.29
Final use 1.90 1.93 1.76 1.72 1.76 1.62 1.53 1.27 1.27
Cogeneration 0.02 0.02 0.01 0.03 0.02 0.04 0.05 0.04 0.04
Gas - - - - - - - - -
Importation 1.53 1.67 1.56 1.48 1.57 1.47 1.47 1.37 1.16
Cogeneration 0.59 1.02 0.73 0.90 0.92 0.84 0.50 0.41 0.32
Final use 0.93 0.65 0.84 0.58 0.65 0.64 0.97 0.96 0.84
Electrical energy produced by cogeneration 0.22 0.25 0.26 0.18 0.18 0.21 0.23 0.20 0.15
Nuclear 10.56 9.52 10.76 9.53 0.88 0.86 0.89 - -
Hydraulic 2.20 2.91 0.19 0.23 0.03 0.02 0.02 0.02 0.02
Wind power 3.55 4.28 4.22 6.67 0.63 0.72 0.91 1.04 0.99
Solar photovoltaic power 0.01 0.01 0.04 0.08 0.01 0.01 0.01 0.01 0.01
Electrical energy produced 1.63 1.69 1.57 1.60 1.73 1.80 2.05 1.27 1.17
Final use 0.50 0.53 0.71 0.50 0.55 0.67 0.89 0.81 0.82
Exportation 1.12 1.15 0.86 1.10 1.17 1.14 1.16 0.46 0.36
Final consumption 3.34 3.49 3.19 3.12 3.24 3.13 3.39 3.04 2.92
Consumption - - - - - - - - -
Service + household + primary sector 0.91 0.97 0.88 0.83 0.90 - - - -
Industry 1.06 1.15 1.04 1.04 1.07 - - - -
Transport 1.36 1.37 1.27 1.25 1.27 - - - -
Services + primary + industry 1.58 1.81 1.59 1.39
Households 0.35 0.34 0.34 0.31
Transport 1.21 1.24 1.09 1.13

ESPON 2020 16
2.5 Regional potential of renewable energy
As you can see in the last chapter in the energy balances our province has potential in differ-
ent renewable energies.
One of the main potential in our province is use of biomass. In that case we have a special
study in which we have next conclusions.
The present study provides data on the annual use of the different pine and hardwood prod-
ucts, taking into account the physical and legal accessibility, as well as the silvicultural models
applied in the forest masses. With this information, the analysis of different market niches is
facilitated considering only the forest products most appropriate for the business to be studied.
The supply of forest use only usable for energy use, discards the biomass of crushing of spe-
cies and thick branches, since they are currently used by the board industry.
Burgos is the second province of Castilla y León that offers a greater supply of forest biomass
for energy uses.
Considering the data obtained in analyzes of forest
biomass availability, the cost study carried out and the
spatial distribution of the areas with the highest
amounts of available biomass at the lowest prices, the
areas with the highest probability of developing bio-
mass business with their corresponding hotspots are:
Zona Urbión: Quintanar de la Sierra
Sierra de la Demanda area: Villasur de Herreros
East Zone of Las Merindades: Valley of Losa
West Zone of the Merindades: Valley of Sedano
Burgos Area Center: Nebreda
The potential of the forest resource in the province of
Burgos, depending on its final energy use, is 570,669
MWh in electrical applications, or 2,054,409 MWht in
thermal applications.
2.6 Use of renewable energy in the region
In chapter 2.4 you can see inputs from renewable energies. As you can observe there are
production from all renewable energies and it increases year by year. This reflects the impor-
tance of our local policies in the evolution of renewable energies.
Figure 2.2: Most probable biomass business developing areas and their hotspots

ESPON 2020 17
3 Governance and important regional policies
3.1 Regional governance system
Spain’s Ministry of Industry, Energy and Tourism leads energy policy formulation. Within the
ministry, the responsible body is the State Secretariat for Energy whose main responsibilities
include:
Issuing regulations concerning energy and mining matters.
Legislation on the tariff structure, prices of energy products, and levies and tolls.
Legislation to save energy, promote renewable energy and support new energy and min-
ing technologies.
Legislation and, if needed, adoption of measures to ensure energy supply.
The autonomous regions have legal competences related to energy, primarily in authorizing
power plants of less than 50 megawatts (MW), that is most renewable energy facilities, and
distribution networks of electricity and natural gas. They are also strongly involved in design-
ing and implementing climate change, energy efficiency and renewable energy policies at the
regional level.
But, in province level, Burgos has not any legal competences in energy. Main activity is to
promote installations with exemplary character. Local authorities of Municipalities manage
and coordinate public services for citizens. They only have capacity to approve municipal
regulations in order with national level.
In Burgos province, Municipalities need to be actively involved in the development of Local
Energy Action Plans, contributing to reach the targets set by the European Union, 20% reduc-
tion in greenhouse gas emissions, 20% of energy savings compared to projections, and a
share of 20% of renewable energies by 2020.
There are other target groups and key actor with some influence in Burgos Province. The
main paper of these groups is to develop exemplary actions in coordination with local institu-
tions. Some of these groups are: development Agencies and Centres, business associations,
SMEs and citizens.
These groups can support the introduction of good energy management practices, advocate
the concept of sustainability. They operate impartially on both energy demand and supply
issues. They reflect local situations, economic and social circumstances and the geographical
size of the relevant local area. So, they are keys in the dissemination of the energy projects
and they have a role of promotion energy savings. Furthermore, along the time they receive a
continuous feedback about the different implemented projects.
ESPON 2020 18
3.2 Involvement of private sector partners
Private sector in Burgos province are aware of the importance of invest in systems relation
with energy saving. But the economic crisis backed away these actions.
Burgos Provincial Energy Agency has participated in some European projects which treat to
involucrate private sectors and to overcome those barriers generated by economic crisis.
The projects are:
1. PROBIO – PROBIO Project (Intelligent Energy Programme 2005) was coordinated by Bur-
gos Provincial Energy Agency and focused on encouraging the integration between produc-
tion and consumption in the biodiesel supply chain in European countries. Different local part-
ners (mainly energy agencies, local administrations and universities) of the provinces of Bur-
gos, Ávila and Huelva (Spain) and the regions of Pomurje (Slovenia) and Abruzzo (Italy) were
developing the Project. The promotion of the biodiesel supply chain in these areas was being
achieved by means of a three-pronged strategy, based on the development of concrete new
market initiatives on the local level, promotion/dissemination and training actions.
Although there were several initiatives to establish biodiesel plants in the participating prov-
inces, it was important to face the weaknesses of the biodiesel of supply chain. The main
barriers this project focuses on were the lack of knowledge and information among farmers
(which means a lack of raw material supply for biodiesel plants) and the lack of general public
awareness about biodiesel use in transport sector.
The main goals of the project were achieved carried out different activities and tasks which
follow these lines of work:
Improvement of raw material supply availability to the biodiesel plants (studies about en-
ergy crops in participant regions and promotion of these studies between farmers, pro-
motion of waste-oil recycling between citizens, etc.)
Supporting training initiatives for farmers (theory and practice courses)
New market initiatives concerning biodiesel use (commercial agreements among the lo-
cal actors of the biodiesel supply chain: public administrations, producers, distributors
and potential consumers)
Specific legal measures to facilitate the introduction of biodiesel in local markets (tax
cuts, motions, local ordinances, etc.)
Promotion of the final use of biodiesel among general public and specific sectors related
to transport (exhibitions, promotional material, points card systems, etc.)
The expected result was a sensible increase of the energy crops, as well as and an increase
in the consumption of biodiesel up to a 4-5% in 2010.
2. RESINBUIL – RESINBUIL Project (Intelligent Energy Programme 2004) was coordinated
by Burgos Provincial Energy Agency and focuses on encouraging the introduction of small
scale renewable energies in building sector. Energy agencies, universities and installers from
the provinces of Burgos (Spain), Trapani (Italy, Harghita (Romania) and Pomurje (Slovenia)
carried out diverse activities within the project from January 2006 to February 2008. The pro-
ject achieved really good results by means of the implementation of three-pronged strategy

ESPON 2020 19
based on training, promotion and developing of new market and legislative initiatives in the
participating regions.
The participating Agencies worked during the first semester of the project, showing an insight
into the rate of use of the small scale RES appliances in the participating regions, along with
the study of the barriers stopping a higher rate of use of these appliances. During the second
semester of the project, RESINBUIL Consortium established a strategy based on the results
obtained in both studies. Partners elaborated drafts in order to update and/or modify legal
ordinances in their regions. Partners held meetings with City Councils representatives and
key actors involved in order to enact the new ordinances with good results despite of the
slowness of Public Administration to enact new regulations. Commercial agreements for the
favourable purchase and/or instalment of RES in buildings were created and Agencies acted
like intermediaries between banks and installers.
The promotion of RES in buildings started by means of the creation of the RESINBUIL Web
site. Other promotional actions were launched such as the publication of semester bulletins
and info-booklets, conferences and congress appearances and a four-month awareness
campaign in mass media in Pomurje, Harghita and Burgos. It is remarkable, the creation of
permanent small RES applications exhibits, with more than 2,000 visitors. Other successful
action carried out within the project RESINBUIL was the Workshops celebrated in Pomurje,
Harghita and Burgos, which had a high participation and very good quality of speakers.
Regarding to the training initiatives, the University of Burgos carried out a MA attendance
course about RES appliances in buildings in 2006, the full duration of the course was nine
months and it was a successful experience. Using approximately the same contents, the Uni-
versity of Burgos carried out an online course, which was developed without problems in the
participating countries. There were 31 students registered in the online course.
3. BIOBUSINESS – BIOBUSINESS Project (Intelligent Energy Programme 2005 is a project
coordinated by CEEI – Burgos (Spain), in which Burgos Provincial Energy Agency partici-
pated as partner in the province of Burgos. The consortium is formed by Business Incubator
Centres and Energy and Development Agencies from Finland, Germany, Slovenia, Hungary
and Spain.
The main objectives of the project, which started on December 2006 and its duration is 30
months, are:
Promotion of entrepreneurship in biomass related sector, covering the whole chain.
Promotion of SMEs development by fostering biomass related activities among existing
biomass companies from other different sectors.
New market and business opportunities in biomass chain.
Establishment of the adequate legislative framework and corresponding instruments (or-
dinances, tax cuts...) for biomass initiatives.
Promotion of technology transfer opportunities in biomass related sector.
Economical development, employment and environmental benefits for the communities.

ESPON 2020 20
4. MOBI-NET – Mobi-NET Project “Mobility Centres Network” (Intelligent Energy 2005), de-
veloped under the Intelligent Energy funding programme since January 2007, aims to create
a European Network of know-how on sustainable mobility. The project is based on the setting
up of “Mobility Centres” with the objectives of approaching the public by establishing publicly
accessible Info Points and addressing Companies (industries and services), schools and
other local actors with activities and mobility management services offered by the Info Points.
Mobi-NET works on a local and on an international level, so to ensure coordinated planning of
common local actions, customized local implementation and collect and analyze (at interna-
tional level) the outcomes of the action implementation, to feed re-engineering of the same.
The different partners of the project (mainly energy and development agencies and local ad-
ministrations) have created different mobility centres in the cities of Biella (Italy), Evora (Por-
tugal), Eskilstuna (Sweden), Thessalonica (Greece), Mieres (Spain), Aranda de Duero
(Spain) and Miranda de Ebro (Spain). Burgos Provincial Energy Agency is in charge of the
mobility centres of Aranda de Duero and Miranda de Ebro, running the Info Point offices in
these two cities and working with the local actors in the development of activities to promote
sustainable mobility at local level.
The project is expected to achieve different positive results in the participant cities: an effec-
tive involvement of the local actors, local mobility plans approved, implementation of the ac-
tions resulting from these mobility plans, an increase in the number of people with durable
changes in their “mobility behavior”, the development of Info Points as local mobility informa-
tion offices, and a decrease in local mobility problems in general (emissions, noises, traffic
jams, etc).
5. HYDROSOLAR 21 – Burgos Provincial Energy Agency participates in Hydro Solar 21 Pro-
ject, which is the only project in the Spanish region of Castilla y León that was approved by
the European Commission under the “LIFE-Environment 2004” funding programme.
The main objective of this demonstrative project is to achieve buildings energy self-supplying
with environmental criteria. In this sense, the different partners of the project are refurbishing
in Burgos a demonstrative building in which the project incorporates an adsorption-solar so-
lar-cooling system and an automatic electric lighting system based on the combustion of wind
and photovoltaically-generated hydrogen in a fuel cell. The development of this integrated
system will obtain a zero-emissions renewable energy supply system for buildings.
Burgos Provincial Energy Agency is in charge of the promotion and dissemination activities of
the Project and the obtaining of the different legal licenses and authorisations. The project,
which started in December 2005, is coordinated by Burgos Strategic Plan Association and the
rest of the partners are Burgos City Council, University of Burgos, Technological Institute of
Castilla y León, the Construction Institute of Castilla y León and the European Business Inno-
vation Centre of Burgos.

ESPON 2020 21
6. FOREST- IEE2010, FOsteRing Efficient long term Supply partnerships. (2010-2012) Bur-
gos Provincial Energy Agency participated as partner in this project. FOREST’s objective is to
work directly with bio-businesses in this supply chain to develop and consolidate long term
supply chain partnerships that will give the end user confidence in the total bio-heat system
and encourage investment from larger non-domestic heat users.
The project was carried out by business support agencies from 7 regions in Austria, Ireland,
Italy, Poland, Spain, Sweden and the United Kingdom. This allows the exchange of experi-
ence from businesses in more developed markets to those in less developed markets. It aims
to work across the whole supply chain covering everything from the supply of the fuel to the
installation and maintenance of the boiler systems. The focus is on non-domestic applications
from 100 kW to 1 MW as well as small to medium scale CHP and district heating up to 10MW.
The biomass fuels covered will be pellet and wood chip from all sources including forestry,
arboricultural arisings, waste wood and energy crops.
The work to develop the supply chains will consist of three main types of activities:
(1) The development of a best practice toolkit focused on supply chain business models. It
will also cover efficient and effective specification and design of bio-heat systems includ-
ing both plant and fuel supply.
(2) Business to Business networking across a wide range of businesses to allow the ex-
change of knowledge between businesses in the supply chain and their clients. This will
facilitate the development of new and more integrated supply chain partnerships.
(3) Building capacity in the supply chain directly through tailored advice to individual busi-
nesses. The aim is to develop new supply chain partnerships, consolidate existing part-
nerships and to improve reliability and confidence across the whole supply chain.
(4) These main tasks will be supported by a comprehensive communication strategy, includ-
ing a project website providing on-line access to all the tools and services developed.
7. POLI-BIOMASS, Sub-project INTERREG IVC, Development of local policies among local
governments that encourage the use of biomass. (2010-2012) Burgos Provincial Energy
Agency has coordinated this project. The main objective of the project is to promote concrete,
measurable and achievable policies across “MICRO-LOCAL ACTION PLANS FOR BIOMASS
IN LOCAL AREAS”. With this objective will be achieved following cross-cutting objectives:
Promote financing lines and subsidies (fees, taxes, ...)
To promote among the local authorities to assess positively the use of biomass in new
tenders
Raising awareness and train local technicians in the field of biomass
Build a network of exemplary municipalities in the use of biomass
These projects generated important energy efficiency awareness among private sector in our
province.

ESPON 2020 22
One common barrier is the fault of investment plans which includes budget for energy effi-
ciency measures. This makes impossible to consider this item as a key for development pri-
vate sector.
Moreover, Regional Energy Agency of Castilla y León (EREN), our supra-regional area, had
different subsidies for private sector. These subsidies focused in implementing energy effi-
ciency measures. Subsidies financed from 30% to 50% of the investment in energy field.
These subsidies lasted from 2006 to 2013, getting more than € 35 million in investments in
private sector in energy efficiency measures. Nowadays there is open a new line of financing
measures in small and medium private enterprises (SMEs). This line counts with a budget of
€ 1 million, and it pretends to generate a movement of € 5 million in investments.
3.3 Regional policies
Our Province has an important and ambitious plan, Strategic Plan Burgos Rural. This plan
used data from the “Rural Development in the EU Statistical and Economic Information Re-
port 2013”. First plan was developed from 2010 to 2015. Nowadays it is running the second
plan, Strategic Plan Burgos Rural 2015-2020, named PEBUR 1520.
This plan is carry out by SODEBUR. SODEBUR is the Society for the Development of the
Province of Burgos (Spain) which works to promote social and economical development of
the Province. SODEBUR is a public company with 100% funding from the Provincial Govern-
ment.
SODEBUR was created aiming to give service to the province and its municipalities. Its main
government body is the General Committee. It is formed by all the elected representatives of
the Province Government. On these grounds, SODEBUR has the possibility of implementing
the different policies approved by its General Committee.
SODEBUR’s Board of Directors is formed by relevant local agents in the main social and
economic areas of the province. This composition provides to the entity a major dynamism
and a better aptitude to mobilize to all provincial implied agents.
Some of implied target groups are:
Burgos’ Chamber of Trade, it reaches out to enterprises at the regional level.
Federation of Burgos’ Business Associations, acts as representatives of their members,
articulate needs & requirements for improved innovation capacity.
University of Burgos, Provide expertise, data information and knowledge on innovation
transfer to the development of different projects.
European Centre of Enterprises and Innovation (CEEI), Provide expertise, data informa-
tion and knowledge on innovation transfer to the development of different projects.
Main financial entities established in the province, they provide feedback and imputs on
the financial support instruments.
Provincial Association of Selfemployees, it reaches out to enterprises at the regional
level.

ESPON 2020 23
This plan PEBUR 1520 is based in two axes:
Sustainability in the territory, looking for the correct balance among economic, social and
environmental aspects.
Active involvement of stakeholders
PEBUR1520 is based on the next four aspects:
Figure 3.1: PEPUR1520’s aspects
This idea is reflected in five axes of work, you can see it in the next figure:
Figure 3.2: PEBUR1520’s axes of work
These five programmes (quality of life, human capital, connectivity, image and economic envi-
ronment) are divided in 25 specific projects. Within the economic environment there is a spe-
cific project dedicated to energy. This project is named “Energy, a key for sustainable devel-
opment”.
Main objectives of this project are:
(1) To develop concrete measures to optimize energy consumptions to get a more competi-
tive province.
(2) To develop energy potential in renewable energy specially in biomass.
These objectives will be developed across two strategic lines: working with public sector and
private sector.
Referring to public sector, Burgos Provincial Government has developed an ambitious plan.
This plan is about to substitute street lighting in all the municipalities by LED street lighting. In
the chapter 6 of this report we will give more details about it.
On the other hand, in private sector, Burgos Provincial Government works on generating a
network of companies committed to energy savings. Moreover, it develops a programme to
make energy audits in companies with a very high level of energy saving potential.
This project counts with a budget of € 11 million.

ESPON 2020 24
Moreover, energy is a transversal objective in the rest of the 24 projects, in all of them there is
a premise in which we try to generate a global awareness about an efficiency use of energy
among the target groups.
Two main barriers to establish concrete and quantificable objectives are:
Burgos Provincial Government has not autonomy for establishing laws.
Burgos Provincial Government has not an specific budget for energy.
For that, AGENBUR and SODEBUR, as important stakeholders, are in charge of developing
PEBUR1520 projects.
3.4 Membership in low carbon programs and initiatives
Analysing last data from 2006 to 2015 there is not any municipality or territories involucrate in
low carbon programs or initiatives.
Main reason is that our municipalities are so small to develop these plans. But, there are a
few of them which had developed some municipal regulations to try to reduce their energy
consumption or to improve the use of renewable energies in last years (2015-2017).
These municipalities are:
Atapuerca, destinated to reduce energy consumption in street lighting and public build-
ings and to boost the use of biomass among citizens.
Rubena, destinated to boost the use of biomass among citizens.
Campolara, destinated to boost the use of biomass among citizens.

ESPON 2020 25
4 National and European policy background, complementarity
4.1 Relevant national low carbon policies, interrelation with regional policy
Spain’s Ministry of Industry, Energy and Tourism leads energy policy formulation. Within the
ministry, the responsible body is the State Secretariat for Energy whose main responsibilities
include:
Issuing regulations concerning energy and mining matters.
Legislation on the tariff structure, prices of energy products, and levies and tolls.
Legislation to save energy, promote renewable energy and support new energy and
mining technologies.
Legislation and, if needed, adoption of measures to ensure energy supply.
The ministry is supported by several bodies in the energy sector, including the following:
The Institute for Energy Diversification and Saving (IDAE) does activities to increase
public knowledge and awareness, provides technical advice, finances projects of tech-
nology innovation with potential for replication. It led in developing the 2004-2012 Energy
Saving and Efficiency Strategy (E4) and the several subsequent National Energy Effi-
ciency Action Plans.
The Strategic Reserves Corporation (CORES) is the stockholding agency in charge of
maintaining stocks of oil products and monitoring industry obligations to hold stocks of oil
products, liquefied petroleum gas and natural gas. CORES also verifies the operators’
obligation to diversify their natural gas supplies.
The Institute for Restructuring and Alternative Development of the Coal Mining Regions
(IRMC) is responsible for specific actions for the coal mining sector, in accordance with
the EU legal framework.
In addition, Spain has the following regulators in the energy sector:
The National Commission of Markets and Competition (CNMC) is an independent or-
ganisation that ensures fair competition and regulates markets and all productive sectors
of the Spanish economy in order to protect consumers. The CNMC was created in 2013
by merging the functions and powers of the Spanish competition authority and sectoral
regulators for electronic communications, audio-visual, electricity and natural gas (previ-
ously the National Energy Commission, CNE), postal, airports and railways. The aim
was to avoid an overlap of competences, to take advantage of the experience and
knowledge acquired in the various regulated sectors and to provide an integrated view of
the regulatory activity.
The CNMC is the national regulatory authority (NRA) for the gas and electricity sectors.
The CNMC is financed from electricity and natural gas tariffs and a levy on the whole-
sale of oil. It co-ordinates the work of the competition authorities of the autonomous re-
gions. It is completely autonomous and fully independent from the government, the
autonomous regions and the market players. In accordance with EU rules on the elec-
tricity and natural gas sectors, the CNMC has the power to approve the methodology
used for calculating the network access tariffs. The government, in turn, sets the tariffs
for network access on the basis of the CNMC methodology. It also approves the CNMC
methodology for calculating the charges of the electricity system and sets the level of
these charges. System charges are used to cover system costs (including the remunera-
tion for renewable generation).

ESPON 2020 26
The Nuclear Safety Council (CSN) is the competent body in matters of nuclear safety
and radiation protection. It is directly accountable to the Spanish Parliament, and for-
mally independent from the Administration.
Other relevant ministries and bodies in the energy sector which co-ordinate policies with the
Ministry of Industry, Energy and Tourism include:
The Ministry of Agriculture, Food and Environment is responsible for several energy–
related policies, such as air pollution and climate change.
The Ministry of Economy and Competitiveness is in charge of Spain’s research and de-
velopment (R&D) policy. It co-ordinates the implementation of the national energy R&D
policy with the Ministry of Industry, Energy and Tourism and the Ministry of Public Works
and Transport.
The Ministry of Public Works and Transport covers the development of transport infra-
structure and is in charge of managing transport demand.
4.2 Complementarity of regional, national and EU low carbon policies
Spanish ratification of the Kyoto Protocol in 2002 implied the commitment of limiting emis-
sions not above 15% regarding 1990’s level, in the period 2008-2012. Since then, Climate
Change policies are extremely important for Spanish Institutions, both for the Action plan of
the Central Government so as for Autonomous Communities (AACC) and Local Entities. To-
day, Climate Change is a key element that involves the different Spanish sectorial policies.
In order to coordinate Climate Change Policies, the Coordination Committee for Climate
Change Policies (CCPCC) was created. This advisory body assures coordination within the
Central Administración, Autonomous Communities and Local Authorities, so as with the Na-
tional Council of Climate (CNC), that is a participation body where besides the Public Admini-
stration, Social Agents, Non Governmental Organizations and Researchers also play a sig-
nificant role. To a lesser extent, the Delegate Government Comission por Climate Change
(CDGCC) and the Interministerial Group for Climate Change, coordination body of Climate
Change Policies within the different Central Government Administration Departments. Fur-
thermore, to guarantee the involvement of Trade and Labour Unions, some Social Dialogue
negotiation Tables have been established in order to elaborate and monitor the National Allo-
cation Plan and the mitigate measures in diffused sectors, relating competitiveness, stability
and social cohesion.
In this framework, some planification instruments have been developed, such as the “Urgent
Measures Plan”, approved in 2007 which includes the “Strategy for Energy Saving and Effi-
ciency in Spain 2008-2012 (PA E4)”, the Strategic Lines against Climate Change, established
by the CDGCC, and the Plans and Strategies set up by the Autonomous Communities.
In this term of office, the Spanish Government has kept going into Climate Change Policies in
depth, setting up the priorities to fulfil the objective of curbing emissions. With this aim was
created, in July 2008, the Delegate Government Commission for Climate Change, chaired by
the Vice-President of the Government and integrated by the Ministries of Foreign Affaires and

ESPON 2020 27
Cooperation, Infrastructures, Education, Health and Social Policies, Industry Tourism and
Trade and the Ministry of Environment, Rural and Marine Affaires, Housing, Science and
innovation. Moreover, the Government Vice-presidencies and the Secretaries of State for the
European Union, Defence, Economy, Treasury and Budgeting, Security, Planification and
Infrastructures, Energy, Territorial Cooperation, Climate Change and Research. The objective
of the Delegate Government Commission is to reinforce the politic action against climate
change through cross cutting measures of the nine ministries involved. Since its first meeting,
they have launched a range of urgent measures in the most relevant sectors regarding the
need to reduce carbon dioxide emissions, identified such as “The Strategic Lines against
Climate Change”, six lines with the aim of being accomplished in two years time since July,
2008. The Strategic Lines affect a wide range of sectors such as transports, waste and ma-
nure management, residential, energy, forestry and innovation. Within this framework, we
could highlight the start up of the “Strategy of Sustainable Mobility”, the “National Integrated
Waste Management Plan (PNIR)”, the “Bio-digestion Plan of Animal Waste”, the “Strategy for
Energy Saving and Efficiency in the Central Administration buildings” or the works to set up
an “Energy Certification System for new and old buildings”.
The Spanish Energy Policy is based on three axes; Security supply, competitiveness and
sustainability. Besides, some plans are being performed with regard to savings and energy
efficiency, renewable energies such as the “Strategy for Energy Savings and Efficiency in
Spain 2004-2020” (PER). Regarding Renewable Energies, Spain has the aim to meet at least
12.1% of the total primary energy demand in 2010. In this context, many efforts have been
made, which sets Spain as a world reference regarding renewable energies. The investment
effort in clean electric generation has been remarkable, both in cogeneration and renewable
energies. The cogeneration installed power capacity has increased from 488 MW in 1991 to
6063 MW in 2007. Furthermore, the investment and support given to renewable sources have
allowed that around 20% of the electricity generated, that is 7% of primary energy, comes
from these renewable sources, which, besides, improves efficiency.
As regards transport, the Strategic Plan for Infrastructure and Transport (PEIT) is being de-
veloped. In this framework, a great investment effort is being made on the railway transport,
which obtains almost 50% of the total investment, with the aim of being the key element of the
merchandise and passengers transport system. In April, 2009, the “Spanish Strategy for Sus-
tainable Mobility, was adopted, setting up the guidelines and measures regarding land use
planning, transport and infrastructures, climate change and reduction of energy dependence,
air quality and noise, security and health and demand management, giving special attention
to fostering alternatives to private vehicles and the use of more efficient and sustainable ways
of transport.
The main measures in the residential, commercial and institutional sectors are related to the
normative preparation and regulation process to obtain more efficiency and energetic savings
in buildings. Among those rules it has to be emphasised those linked with the approval of the
ESPON 2020 28
Technical Code for Building (Real Decreto 314/200), which sets the duty to include energy
efficiency criteria and the use of solar, both thermal and photovoltaic energy in those new
buildings or those which are being restored. Moreover, the new Regulation for Thermal Instal-
lations of Buildings, approved in July, 2007 and the Energetic Certification of Buildings (Real
Decreto 47/2007), with a major target of improving energy efficiency in both, new and existing
houses. In this sense, refurbishment and renovation works aimed to increase insulation, the
use of renewable energy and increase efficiency on hot water systems and boilers, as well as
high energy efficiency new subsidised housing, are prioritised in the implementation of the
Plan. Moreover, in terms of the Housing Plan, the State Housing and Restoring Plan, ap-
proved in December, 2008 includes as one of its main axes, to improve energy efficiency in
both, new and existing houses. In this sense, refurbishment and renovation works aimed to
increase insulation, the use of renewable energy and increase efficiency on hot water sys-
tems and boilers, as well as high energy efficiency new subsidised housing, are prioritised in
the implementation of the Plan.
On other hand, Spain keeps an active policy on forestry, inspired in the basic principle of sus-
tainable forest system. It is framed by the Spanish Forestry Plan, and includes actions to in-
crease carbon dioxide absorption in Spanish Forests, like reforestation, agricultural lands
forestation and Hydrologic-Forest restoration. In terms of Research, Development and Inno-
vation, it is highlighted the Strategic Action of Energy and Climate Change included in the
2008-2011 National Plan for Research, Development and Innovation. This strategy concen-
trates the main environmental objectives and the start up of the Research Institute of Climate
Change in Zaragoza, as the cornerstone of a network of Excellence Centres, with the aim of
fostering the existing Spanish know-how and the promotion within Germany and Denmark of
the International Agency of Renewables Energies (IRENA), which is main objective is to sup-
port, promote and spread the use of renewable energies globally, to adequate the energetic
system to the current challenges raise by climate change.
Many of the Mitigation policies and measures in diffuse sectors named at a state level are
developed by the Autonomous Communities, which adapt the design and the implementation
to the particular circumstances of each region and also may include additional measures. To
be able to carry out these policies and measures, most AACC, have established strategies or
action plans and have set up the necessary structure in their own administration to guarantee
the implementation of these measures. The Autonomous Communities have assumed shared
responsibility for the aim to fulfil national objectives and have set up a commitment to reduce
emissions, most of them keeping national objectives as established in the National Allocation
Plan (2008-2012).
Furthermore, Local Entities are also working to warn about Climate Change and adapt to its
effects. Part of these activities are developed on a network framework, such as the Spanish
Network of Cities for Climate Change (RECC), made up by Local Entities which are integrat-
ing the protection of climate in their municipal policies. This network was created in June,

ESPON 2020 29
2005, as a result of a collaboration agreement between the Spanish Federation of Provinces
and Municipalities and the Ministry of Environment, in order to take advantage from the syn-
ergies and economies of scale due to the common methodologies and experiences.
Included in the cooperation strategy, on the one hand, there have been signed Memoran-
dums of Understanding (MoU) with countries for the promotion of the Clean Development
Mechanism. On the other hand, in order to obtain the necessary allowances on the interna-
tional markets, the Spanish Government has signed various commitments related to Carbon
Funds with different Financial Multilateral Institutions with the aim of acquiring carbon credits
in the international markets coming from projects based in the Clean Development Mecha-
nism (CDM). (Spanish Carbon Fund, Bio-Carbon Fund, Community Developing Fund, from
the World Bank, Latin America Carbon Iniciative from the Andean Development Corporation,
Multilateral Carbon-credit Fund from the European Investment Bank-European Bank for Re-
construction and Development). Moreover, since 2008, Spain takes part in funds addressed
to acquiring post-2012 credits such as the Carbon Partnership Facility (CPF) and the Forest
Carbon Partnership Facility, (FCPF) from the World Bank.
In this field, the Spanish General Administration also promotes the development of Green
Investment Schemes, linked to buying and selling AAUs (Asigned Amount Units), according
to the 17th Article of the Kyoto Protocol.
According to the adaptation measures, the Spanish Climate Change Bureau, trying to compile
and review the studies related to climate changes impacts assessment, has promoted the
carrying the ECCE project (Climate Change Effects in Spain). It was developed by a group of
experts in different ecological systems, and economic and social sectors, whose main conclu-
sions were published in an independent report called “Main conclusions of the Preliminary
General Assessment of the Impacts in Spain due to the Effects of Climate Change”. After the
publications of this report, the National Climate Change Adaptation Plan was set up, as a
general framework for all the climatic evaluations, vulnerability assessment and adaptation
measures in Spain. This plan has been launched with the aim of supporting all those admini-
strations, private or public organizations, interested in evaluating climate change impacts in all
sector and systems of their concern. Not only, providing the necessary knowledge and tools
but promoting participation in all process which may improve as well.
The plan is developed through different work programs which include the main characteristics
of the activities and impact evaluation, vulnerability and adaptation projects. The second Work
Program has recently been approved for a 4 year period. This program follows the detailed
studies already started and will also introduce new evaluation impact, vulnerability and adap-
tation lines to climate change in all those sectors included in the first program (coasts, water,
biodiversity) so as new sectors such as agriculture, tourism, forests and land desertification.
Our region follows the same lines of our country policies, considering biomass and efficient
energy as strategic points.

ESPON 2020 30
5 The role of cohesion policy for regional low carbon development
The ERDF aims to strengthen economic and social cohesion in the European Union by cor-
recting imbalances between its regions.
The ERDF focuses its investments on several key priority areas. This is known as “thematic
concentration”:
Innovation and research;
The digital agenda;
Support for small and medium-sized enterprises (SMEs);
The low-carbon economy.
The ERDF resources allocated to these priorities will depend on the category of region.
In more developed regions, at least 80% of funds must focus on at least two of these
priorities;
In transition regions, this focus is for 60% of the funds;
This is 50% in less developed regions.
Furthermore, some ERDF resources must be channelled specifically towards low-carbon
economy projects:
More developed regions: 20%;
Transition regions: 15%; and
Less developed regions: 12%.
The operative programme (OP) in our región, Castilla y León, is going to invest € 628.8 mil-
lion since 2014 to 2020. The measures are structured in six actions:
Action1: It consists of promoting research, technological development and innovation. It
is endowed with € 183.9 million, 29.3% of the total, and its execution will be carried out
by the ministries of Economy and Finance and Education.
Action 2: It consists in improving the use and quality of ICTs and access to them. Con-
sumes 7.8% of the budget of the OP, € 49.4 million, controlled by the Departments of
Economy and Finance, Health, Development and Environment and Education.
Action 3: Its objective is to improve the competitiveness of small and medium-sized en-
terprises, € 177.9 million of ERDF funds are foreseen, 28.3% of the global figure, it will
be managed by the Ministry of Economy and Finance.
Action 4: It aims to promote the transition to a low carbon economy in all sectors, for
which almost € 59.3 million are contemplated, 9.4%, it will also correspond to the Minis-
try of Economy and Finance.
Action 6: It seeks to protect the environment and promote the efficiency of resources
through a € 154.4 million, 24.6% of the total, to which the Departments of Promotion and
Environment and Culture and Tourism
There is no more other financial means of cohesion in region dedicates to low carbón devel-
opment.

ESPON 2020 31
6 Good practices and successful approaches
Case study 1. PRIAP Project, dealing by The Society for the Development of the
Province of Burgos (SODEBUR)
The Society for the Development of the Province of Burgos (SODEBUR) works to promote
social and economical development in the rural areas of this Spanish province. SODEBUR is
a public company with 100% funding from the Provincial Government.
The organization is structured in four main areas: Investments and Industrial Engineering,
Economical and Social Promotion, Institutional Cooperation and Image and Tourism.
Investments and Industrial Engineering. This department supports to the Provincial Gov-
ernment and all its Town Halls in the development of its installations and industrial pro-
jects.
Economical and Social Promotion. It is in charge of the planning and strategic develop-
ment of the economy and social activities in the province.
In this term, during the year 2015 SODEBUR developed the new strategic plan for the prov-
ince. This plan contains different actions to be implemented from 2015 to 2020 in order to
improve the quality of life of its citizens. There are 25 projects divided in five main axes: im-
age and tourism, economic environment, connectivity, human capital and quality of life.
One of these projects promotes the development of a sustainable territory and the reduction
of energy consumption. Below this programme SODEBUR is developing an ambitious project
called “Integral Renovation of Provincial Street lighting Project”, PRIAP.
PRIAP is going to change the street lighting into LED system in 256 municipalities in our prov-
ince.
PRIAP, will have a duration of 36 months, ending in December 2018 and budget will be up to
€ 9,325,694.94 by the provincial corporation, and € 8,557,500.00 by municipalities, making a
total of € 17,883,194.94.
The project will consist of two phases:
(1) Feasibility studies and projects for the integral renovation of street lighting. This phase
has finished.
(2) Public call for subsidies to municipalities with less than 20,000 inhabitants aimed to per-
formance of street lighting renovations.
The main object is to get a reduction of energy consumption the approximately 53 M kwh
during the ten years expected for the life of the LED technology, and 21 M kg CO2 reduced
during the same 10 years.
For an overview on the expected achievements per municipality see annex.
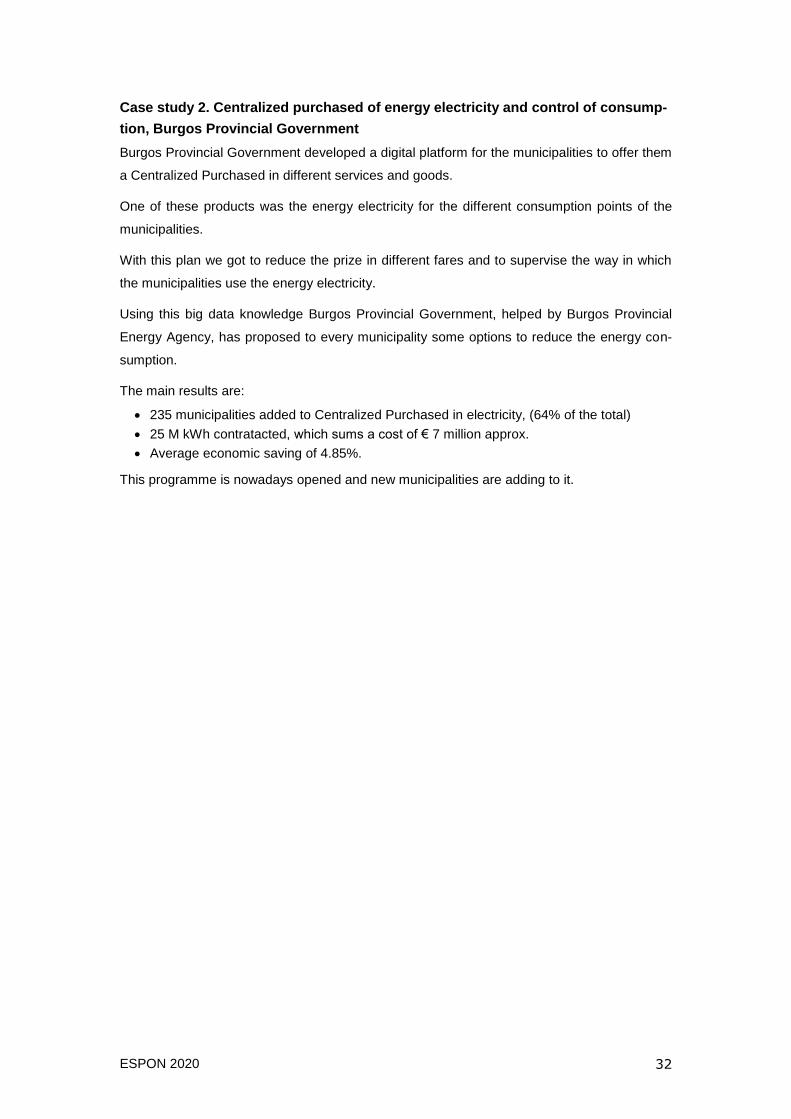
ESPON 2020 32
Case study 2. Centralized purchased of energy electricity and control of consump-
tion, Burgos Provincial Government
Burgos Provincial Government developed a digital platform for the municipalities to offer them
a Centralized Purchased in different services and goods.
One of these products was the energy electricity for the different consumption points of the
municipalities.
With this plan we got to reduce the prize in different fares and to supervise the way in which
the municipalities use the energy electricity.
Using this big data knowledge Burgos Provincial Government, helped by Burgos Provincial
Energy Agency, has proposed to every municipality some options to reduce the energy con-
sumption.
The main results are:
235 municipalities added to Centralized Purchased in electricity, (64% of the total)
25 M kWh contratacted, which sums a cost of € 7 million approx.
Average economic saving of 4.85%.
This programme is nowadays opened and new municipalities are adding to it.

ESPON 2020 33
References
Burgos Provincial Energy Agency, www.agenbur.com
Burgos Provincial Government, http://www.burgos.es/
Regional Energy Agency of Castilla and León, http://www.energia.jcyl.es/
Institute of Energy in Spain, http://www.idae.es/
SODEBUR institution, http://www.sodebur.es/es/burgos/
European Commission, https://ec.europa.eu/commission/index_en
Agency for Innovation, Financing and Internationalization Business (ADE), http://www.ade.jcyl.es/
Spain Discussion Paper from Iñaki Álvarez, Lionel Loubeau and Sandra Ramos.
Orkestra-Basque Institute of Competitiveness. Fundación Deusto, Eloy Àlvarez Pelegry.

ESPON 2020 34
List of interviewed persons
Ricardo Pizarro Villanueva, director of Burgos Provincial Energy Agency and SODEBUR Insti-
tution. Date: December 2016.
Beatriz García Val, technician in SODEBUR Institution. Date: January 2017.
Santiago Diez Castilla, engineer in Energy Agency of Castilla y Leon, EREN. Date: November
2016.
Rafael Ayuste Cupido, responsible of renewable area in Energy Agency of Castilla y León.
Date: January 2017.
Mónica Mediavilla Pascual, technician in juridical assessment to municipalities in Burgos Pro-
vincial Government. Date: February-March 2017.

ESPON 2020 35
Annex: PRIAP project, expected achievements per municipality
Municipality Number of inhabitants
Territorial area Number of lights
Energy sav-ing (kwh)
Total invest-ment (€)
Energy saving per inhabitant
Investment per inhabitant (€)
1 Aguas Cándidas 62 Bureba 78 17,082 32,001.21 275.52 516.15
2 Aguilar de Bureba 72 Bureba 61 13,359 17,897.11 185.54 248.57
3 Alcocero de Mola 45 Bureba 52 11,388 - 253.07 -
4 Alfoz de Quintanadueñas 1,733 Amaya Camino 521 114,099 230,633.83 65.84 133.08
5 Altable 54 Bureba 56 12,264 16,177.03 227.11 299.57
6 Ameyugo 100 Bureba 48 10,512 18,176.20 105.12 181.76
7 Anguix 155 Ribera 100 21,900 8,516.43 141.29 54.94
8 Arandilla 179 Ribera 96 21,024 40,384.11 117.45 225.61
9 Arauzo de Miel 333 Ribera 256 56,064 104,653.93 168.36 314.28
10 Arauzo de Salce 70 Ribera 47 10,293 19,616.83 147.04 280.24
11 Arauzo de Torre 97 Ribera 100 21,900 42,046.71 225.77 433.47
12 Arcos 901 Arlanza 346 75,774 182,668.30 84.10 202.74
13 Arenillas de Rio Pisuerga 188 Amaya Camino - 55,000.00 - 292.55
14 Arlanzón 424 Demanda Pinares 309 67,671 167,285.62 159.60 394.54
15 Atapuerca 209 Demanda Pinares 19 4,161 9,323.27 19.91 44.61
16 Ausines (Los) 144 Arlanza 82 17,958 45,237.82 124.71 314.15
17 Balbases (Los) 357 Amaya Camino - 94,500.00 - 264.71
18 Baños de Valdearados 407 Ribera 234 51,246 65,513.62 125.91 160.97
19 Bañuelos de Bureba 32 Bureba 23 5,037 8,292.96 157.41 259.16
20 Barbadillo del Pez 96 Demanda Pinares 66 14,454 29,481.46 150.56 307.10
21 Barrios de Bureba (Los) 236 Bureba 571 125,049 107,174.54 529.87 454.13
22 Barrios de Colina 68 Demanda Pinares 62 13,578 30,569.10 199.68 449.55
23 Basconcillos del Tozo 341 Amaya Camino 193 42,267 89,193.42 123.95 261.56
24 Bascuñana 50 Bureba 34 7,446 30,094.01 148.92 601.88
25 Belorado 2,190 Bureba 712 155,928 349,139.18 71.20 159.42

ESPON 2020 36
Municipality Number of inhabitants
Territorial area Number of lights
Energy sav-ing (kwh)
Total invest-ment (€)
Energy saving per inhabitant
Investment per inhabitant (€)
26 Berberana 73 Merindades 42 9,198 6,537.33 126.00 89.55
27 Bozoó 110 Bureba 83 18,177 27,163.05 165.25 246.94
28 Brazacorta 78 Ribera 50 10,950 22,354.30 140.38 286.59
29 Briviesca 7,776 Bureba 1,656 362,664 461,290.78 46.64 59.32
30 Bugedo 177 Bureba 141 30,879 41,485.46 174.46 234.38
31 Buniel 394 Arlanza 248 54,312 106,687.14 137.85 270.78
32 Busto de Bureba 201 Bureba 202 44,238 42,707.86 220.09 212.48
33 Cabañes de Esgueva 214 Ribera 65 14,235 30,461.51 66.52 142.34
34 Caleruega 494 Ribera 226 49,494 64,199.53 100.19 129.96
35 Campillo de Aranda 196 Ribera 126 27,594 39,015.72 140.79 199.06
36 Campolara 71 Demanda Pinares 56 12,264 34,251.64 172.73 482.42
37 Canicosa de la Sierra 587 Demanda Pinares 236 51,684 100,885.69 88.05 171.87
38 Cantabrana 32 Bureba 38 8,322 16,429.91 260.06 513.43
39 Carcedo de Burgos 291 Arlanza 501 109,719 221,884.17 377.04 762.49
40 Cardeñadijo 1,027 Arlanza 493 107,967 225,922.21 105.13 219.98
41 Cardeñajimeno 851 Arlanza 532 116,508 232,883.00 136.91 273.66
42 Cardeñuela Riopico 127 Arlanza 50 10,950 29,838.76 86.22 234.95
43 Carrias 36 Bureba 15 3,285 5,961.12 91.25 165.59
44 Cascajares de Bureba 45 Bureba 43 9,417 3,074.61 209.27 68.32
45 Castellanos de Castro 56 Amaya Camino - 13,900.00 - 248.21
46 Castildelgado 60 Bureba 51 11,169 22,876.02 186.15 381.27
47 Castrillo de la Vega 674 Ribera 428 93,732 171,966.12 139.07 255.14
48 Cavia 270 Amaya Camino - 80,300.00 - 297.41
49 Cayuela 163 Amaya Camino - 58,300.00 - 357.67
50 Cebrecos 59 Arlanza 33 7,227 16,964.20 122.49 287.53
51 Cerezo de Río Tirón 669 Bureba 215 47,085 90,515.41 70.38 135.30
52 Cerratón de Juarros 62 Bureba 12 2,628 6,831.42 42.39 110.18
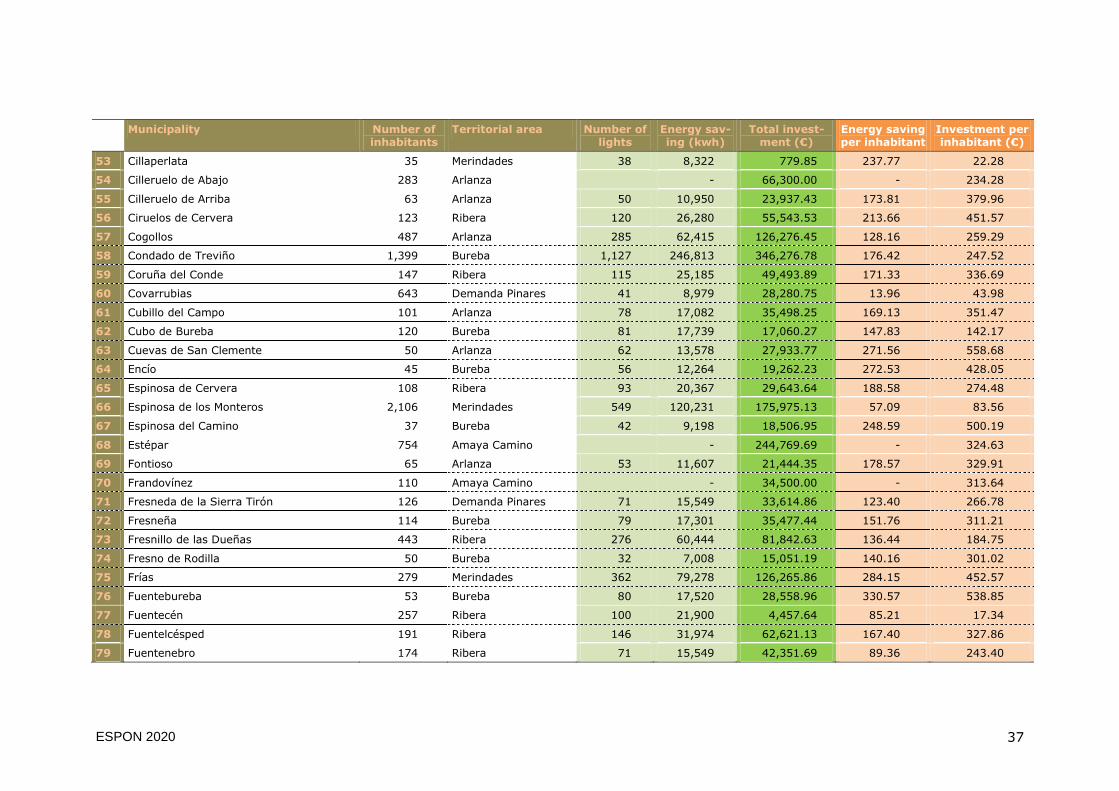
ESPON 2020 37
Municipality Number of inhabitants
Territorial area Number of lights
Energy sav-ing (kwh)
Total invest-ment (€)
Energy saving per inhabitant
Investment per inhabitant (€)
53 Cillaperlata 35 Merindades 38 8,322 779.85 237.77 22.28
54 Cilleruelo de Abajo 283 Arlanza - 66,300.00 - 234.28
55 Cilleruelo de Arriba 63 Arlanza 50 10,950 23,937.43 173.81 379.96
56 Ciruelos de Cervera 123 Ribera 120 26,280 55,543.53 213.66 451.57
57 Cogollos 487 Arlanza 285 62,415 126,276.45 128.16 259.29
58 Condado de Treviño 1,399 Bureba 1,127 246,813 346,276.78 176.42 247.52
59 Coruña del Conde 147 Ribera 115 25,185 49,493.89 171.33 336.69
60 Covarrubias 643 Demanda Pinares 41 8,979 28,280.75 13.96 43.98
61 Cubillo del Campo 101 Arlanza 78 17,082 35,498.25 169.13 351.47
62 Cubo de Bureba 120 Bureba 81 17,739 17,060.27 147.83 142.17
63 Cuevas de San Clemente 50 Arlanza 62 13,578 27,933.77 271.56 558.68
64 Encío 45 Bureba 56 12,264 19,262.23 272.53 428.05
65 Espinosa de Cervera 108 Ribera 93 20,367 29,643.64 188.58 274.48
66 Espinosa de los Monteros 2,106 Merindades 549 120,231 175,975.13 57.09 83.56
67 Espinosa del Camino 37 Bureba 42 9,198 18,506.95 248.59 500.19
68 Estépar 754 Amaya Camino - 244,769.69 - 324.63
69 Fontioso 65 Arlanza 53 11,607 21,444.35 178.57 329.91
70 Frandovínez 110 Amaya Camino - 34,500.00 - 313.64
71 Fresneda de la Sierra Tirón 126 Demanda Pinares 71 15,549 33,614.86 123.40 266.78
72 Fresneña 114 Bureba 79 17,301 35,477.44 151.76 311.21
73 Fresnillo de las Dueñas 443 Ribera 276 60,444 81,842.63 136.44 184.75
74 Fresno de Rodilla 50 Bureba 32 7,008 15,051.19 140.16 301.02
75 Frías 279 Merindades 362 79,278 126,265.86 284.15 452.57
76 Fuentebureba 53 Bureba 80 17,520 28,558.96 330.57 538.85
77 Fuentecén 257 Ribera 100 21,900 4,457.64 85.21 17.34
78 Fuentelcésped 191 Ribera 146 31,974 62,621.13 167.40 327.86
79 Fuentenebro 174 Ribera 71 15,549 42,351.69 89.36 243.40

ESPON 2020 38
Municipality Number of inhabitants
Territorial area Number of lights
Energy sav-ing (kwh)
Total invest-ment (€)
Energy saving per inhabitant
Investment per inhabitant (€)
80 Fuentespina 707 Ribera 359 78,621 155,638.19 111.20 220.14
81 Gallega (La) 75 Demanda Pinares 62 13,578 21,083.71 181.04 281.12
82 Gumiel de Izán 641 Ribera 393 86,067 118,456.57 134.27 184.80
83 Gumiel de Mercado 382 Ribera 151 33,069 56,280.90 86.57 147.33
84 Hontanas 61 Amaya Camino - 30,000.00 - 491.80
85 Hontangas 124 Ribera 63 13,797 29,395.06 111.27 237.06
86 Hontoria de la Cantera 126 Arlanza 104 22,776 47,967.50 180.76 380.69
87 Hontoria de Valdearados 234 Ribera 136 29,784 33,024.72 127.28 141.13
88 Hornillos del Camino 66 Amaya Camino - 12,500.00 - 189.39
89 Horra (La) 396 Ribera 196 42,924 63,361.11 108.39 160.00
90 Hortigüela 117 Demanda Pinares 56 12,264 24,494.13 104.82 209.35
91 Hoyales de Roa 245 Ribera 148 32,412 63,129.78 132.29 257.67
92 Huerta de Arriba 154 Demanda Pinares 102 22,338 44,005.52 145.05 285.75
93 Huerta de Rey 1,136 Ribera 437 95,703 197,997.94 84.25 174.29
94 Humada 158 Amaya Camino 36 7,884 27,934.84 49.90 176.80
95 Ibeas de Juarros 1,323 Demanda Pinares 435 95,265 193,978.68 72.01 146.62
96 Ibrillos 82 Bureba 43 9,417 19,491.84 114.84 237.71
97 Iglesias 144 Amaya Camino - 29,000.00 - 201.39
98 Isar 386 Amaya Camino - 95,141.25 - 246.48
99 Itero del Castillo 104 Amaya Camino - 30,000.00 - 288.46
100 Jaramillo de la Fuente 40 Demanda Pinares 59 12,921 35,619.13 323.03 890.48
101 Junta de Traslaloma 176 Merindades 126 27,594 - 156.78 -
102 Junta de Villalba de Losa 118 Merindades 56 12,264 13,908.02 103.93 117.86
103 Jurisdicción de Lara 53 Demanda Pinares 54 11,826 30,640.73 223.13 578.13
104 Jurisdicción de San Zadornil 102 Merindades 149 32,631 44,920.90 319.91 440.40
105 Lerma 2,808 Arlanza - 192,571.54 - 68.58
106 Llano de Bureba 73 Bureba 44 9,636 17,927.86 132.00 245.59

ESPON 2020 39
Municipality Number of inhabitants
Territorial area Number of lights
Energy sav-ing (kwh)
Total invest-ment (€)
Energy saving per inhabitant
Investment per inhabitant (€)
107 Madrigal del Monte 196 Arlanza 75 16,425 34,481.32 83.80 175.93
108 Madrigalejo del Monte 194 Arlanza 146 31,974 67,060.77 164.81 345.67
109 Mahamud 151 Arlanza - 44,400.00 - 294.04
110 Mambrillas de Lara 60 Demanda Pinares 71 15,549 36,880.73 259.15 614.68
111 Mamolar 52 Demanda Pinares 34 7,446 11,681.19 143.19 224.64
112 Manciles 32 Amaya Camino 16 3,504 11,130.53 109.50 347.83
113 Mazuela 74 Arlanza - - - -
114 Mecerreyes 283 Arlanza 102 22,338 60,494.56 78.93 213.76
115 Medina de Pomar 6,212 Merindades 4,155 909,945 1,214,825.74 146.48 195.56
116 Melgar de Fernamental 1,898 Amaya Camino - 371,504.32 - 195.73
117 Merindad de Cuesta-Urria 463 Merindades 338 74,022 123,273.29 159.87 266.25
118 Merindad de Montija 866 Merindades 585 128,115 193,013.15 147.94 222.88
119 Merindad de Río Ubierna 1,391 Bureba 811 177,609 383,331.29 127.68 275.58
120 Merindad de Sotoscueva 495 Merindades 742 162,498 236,483.58 328.28 477.74
121 Merindad de Valdeporres 472 Merindades 583 127,677 185,552.40 270.50 393.12
122 Merindad de Valdivielso 451 Merindades 407 89,133 146,519.40 197.63 324.88
123 Milagros 498 Ribera 315 68,985 138,259.20 138.52 277.63
124 Miraveche 93 Bureba 115 25,185 29,085.74 270.81 312.75
125 Modúbar de la Emparedada 392 Arlanza 189 41,391 92,734.15 105.59 236.57
126 Monasterio de la Sierra 46 Demanda Pinares 32 7,008 9,516.08 152.35 206.87
127 Monasterio de Rodilla 214 Bureba 37 8,103 21,664.32 37.86 101.24
128 Nebreda 85 Arlanza 59 12,921 35,668.50 152.01 419.63
129 Neila 212 Demanda Pinares 192 42,048 68,795.41 198.34 324.51
130 Olmillos de Muñó 43 Arlanza - 1,416.00 - 32.93
131 Oña 1,301 Merindades 699 153,081 212,759.40 117.66 163.54
132 Oquillas 63 Ribera 47 10,293 15,801.46 163.38 250.82
133 Orbaneja Riopico 168 Arlanza 34 7,446 19,132.25 44.32 113.88

ESPON 2020 40
Municipality Number of inhabitants
Territorial area Number of lights
Energy sav-ing (kwh)
Total invest-ment (€)
Energy saving per inhabitant
Investment per inhabitant (€)
134 Padilla de Abajo 86 Amaya Camino 51 11,169 26,024.00 129.87 302.60
135 Padilla de Arriba 87 Amaya Camino 60 13,140 29,196.83 151.03 335.60
136 Padrones de Bureba 47 Bureba 39 8,541 14,541.47 181.72 309.39
137 Palacios de la Sierra 856 Demanda Pinares 309 67,671 115,284.00 79.05 134.68
138 Palacios de Rio Pisuerga 39 Amaya Camino - 11,181.34 - 286.70
139 Palazuelos de Muñó 64 Arlanza - 13,718.69 - 214.35
140 Pardilla 125 Ribera 88 19,272 32,231.25 154.18 257.85
141 Partido de la Sierra en Tobalina 83 Merindades 93 20,367 1,120.20 245.39 13.50
142 Pedrosa de Río Úrbel 263 Amaya Camino 172 37,668 64,440.18 143.22 245.02
143 Pedrosa del Páramo 89 Amaya Camino 41 8,979 19,253.65 100.89 216.33
144 Piérnigas 43 Bureba 27 5,913 8,366.07 137.51 194.56
145 Pinilla de los Barruecos 113 Demanda Pinares 104 22,776 42,957.24 201.56 380.15
146 Pinilla Trasmonte 201 Ribera 102 22,338 42,359.44 111.13 210.74
147 Poza de la Sal 351 Bureba 318 69,642 31,249.60 198.41 89.03
148 Prádanos de Bureba 48 Bureba 45 9,855 15,405.24 205.31 320.94
149 Pradoluengo 1,503 Demanda Pinares 372 81,468 177,579.91 54.20 118.15
150 Puebla de Arganzón (La) 489 Bureba 244 53,436 60,704.67 109.28 124.14
151 Puentedura 120 Arlanza 91 19,929 44,921.37 166.08 374.34
152 Quemada 260 Ribera 182 39,858 80,556.48 153.30 309.83
153 Quintana del Pidio 183 Ribera 108 23,652 19,305.16 129.25 105.49
154 Quintanabureba 37 Bureba 32 7,008 10,719.93 189.41 289.73
155 Quintanaélez 77 Bureba 82 17,958 28,557.94 233.22 370.88
156 Quintanapalla 122 Bureba 55 12,045 25,076.65 98.73 205.55
157 Quintanar de la Sierra 2,088 Demanda Pinares 737 161,403 346,661.94 77.30 166.03
158 Quintanavides 99 Bureba 70 15,330 30,661.40 154.85 309.71
159 Quintanilla de la Mata 145 Arlanza - 21,800.00 - 150.34
160 Quintanilla del Agua y Tordueles 560 Arlanza 263 57,597 145,007.01 102.85 258.94
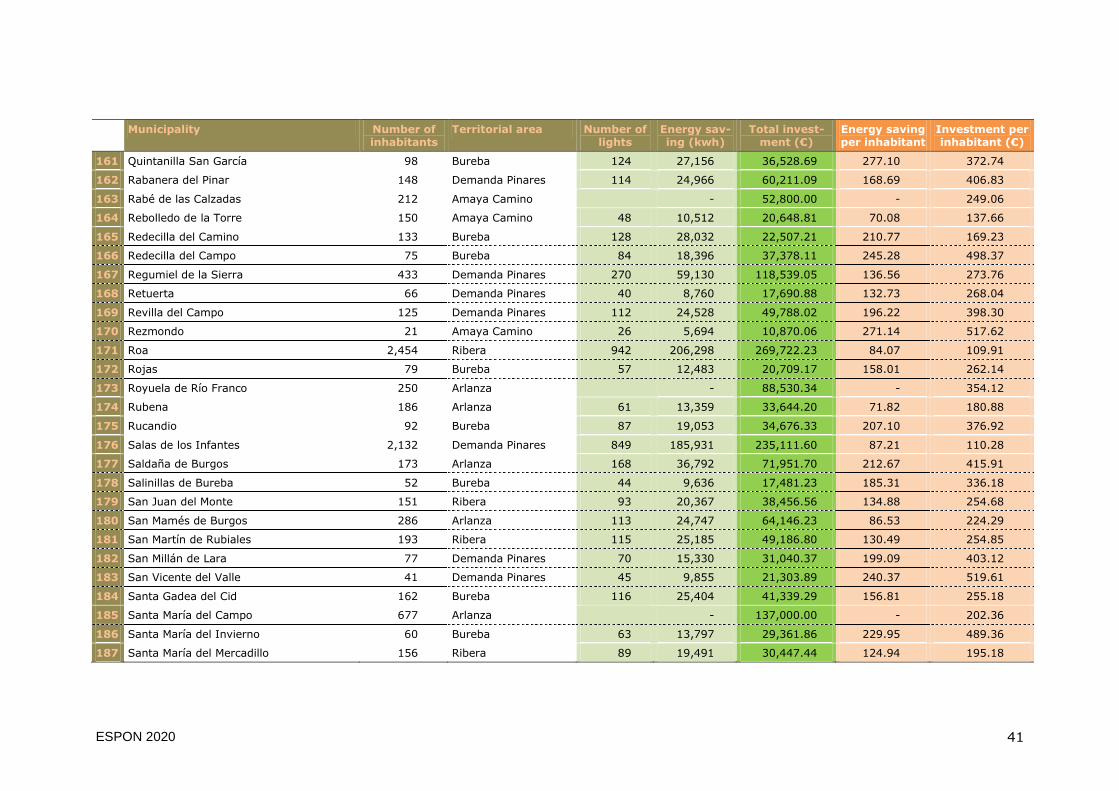
ESPON 2020 41
Municipality Number of inhabitants
Territorial area Number of lights
Energy sav-ing (kwh)
Total invest-ment (€)
Energy saving per inhabitant
Investment per inhabitant (€)
161 Quintanilla San García 98 Bureba 124 27,156 36,528.69 277.10 372.74
162 Rabanera del Pinar 148 Demanda Pinares 114 24,966 60,211.09 168.69 406.83
163 Rabé de las Calzadas 212 Amaya Camino - 52,800.00 - 249.06
164 Rebolledo de la Torre 150 Amaya Camino 48 10,512 20,648.81 70.08 137.66
165 Redecilla del Camino 133 Bureba 128 28,032 22,507.21 210.77 169.23
166 Redecilla del Campo 75 Bureba 84 18,396 37,378.11 245.28 498.37
167 Regumiel de la Sierra 433 Demanda Pinares 270 59,130 118,539.05 136.56 273.76
168 Retuerta 66 Demanda Pinares 40 8,760 17,690.88 132.73 268.04
169 Revilla del Campo 125 Demanda Pinares 112 24,528 49,788.02 196.22 398.30
170 Rezmondo 21 Amaya Camino 26 5,694 10,870.06 271.14 517.62
171 Roa 2,454 Ribera 942 206,298 269,722.23 84.07 109.91
172 Rojas 79 Bureba 57 12,483 20,709.17 158.01 262.14
173 Royuela de Río Franco 250 Arlanza - 88,530.34 - 354.12
174 Rubena 186 Arlanza 61 13,359 33,644.20 71.82 180.88
175 Rucandio 92 Bureba 87 19,053 34,676.33 207.10 376.92
176 Salas de los Infantes 2,132 Demanda Pinares 849 185,931 235,111.60 87.21 110.28
177 Saldaña de Burgos 173 Arlanza 168 36,792 71,951.70 212.67 415.91
178 Salinillas de Bureba 52 Bureba 44 9,636 17,481.23 185.31 336.18
179 San Juan del Monte 151 Ribera 93 20,367 38,456.56 134.88 254.68
180 San Mamés de Burgos 286 Arlanza 113 24,747 64,146.23 86.53 224.29
181 San Martín de Rubiales 193 Ribera 115 25,185 49,186.80 130.49 254.85
182 San Millán de Lara 77 Demanda Pinares 70 15,330 31,040.37 199.09 403.12
183 San Vicente del Valle 41 Demanda Pinares 45 9,855 21,303.89 240.37 519.61
184 Santa Gadea del Cid 162 Bureba 116 25,404 41,339.29 156.81 255.18
185 Santa María del Campo 677 Arlanza - 137,000.00 - 202.36
186 Santa María del Invierno 60 Bureba 63 13,797 29,361.86 229.95 489.36
187 Santa María del Mercadillo 156 Ribera 89 19,491 30,447.44 124.94 195.18

ESPON 2020 42
Municipality Number of inhabitants
Territorial area Number of lights
Energy sav-ing (kwh)
Total invest-ment (€)
Energy saving per inhabitant
Investment per inhabitant (€)
188 Santa María Ribarredonda 118 Bureba 93 20,367 29,942.72 172.60 253.75
189 Santibáñez de Esgueva 128 Ribera 63 13,797 3,831.36 107.79 29.93
190 Santibáñez del Val 67 Arlanza 42 9,198 17,151.87 137.28 256.00
191 Santo Domingo de Silos 311 Demanda Pinares 229 50,151 96,713.18 161.26 310.97
192 Sargentes de la Lora 161 Amaya Camino 43 9,417 19,290.99 58.49 119.82
193 Sasamón 1,248 Amaya Camino 336 73,584 148,002.98 58.96 118.59
194 Solarana 108 Arlanza 45 9,855 - 91.25 -
195 Sotillo de la Ribera 585 Ribera 258 56,502 54,321.20 96.58 92.86
196 Susinos del Páramo 120 Amaya Camino 33 7,227 11,191.22 60.23 93.26
197 Tamarón 47 Amaya Camino - 21,700.00 - 461.70
198 Tardajos 816 Amaya Camino - 103,016.91 - 126.25
199 Tejada 38 Arlanza 28 6,132 13,310.97 161.37 350.29
200 Terradillos de Esgueva 122 Ribera 53 11,607 22,375.08 95.14 183.40
201 Tinieblas de la Sierra 40 Demanda Pinares 41 8,979 18,615.68 224.48 465.39
202 Torrecilla del Monte 77 Arlanza 34 7,446 13,915.73 96.70 180.72
203 Torregalindo 140 Ribera 110 24,090 42,947.74 172.07 306.77
204 Torrelara 24 Demanda Pinares 25 5,475 12,200.19 228.13 508.34
205 Torrepadre 87 Arlanza - 20,163.11 - 231.76
206 Tórtoles de Esgueva 508 Ribera 303 66,357 79,103.41 130.62 155.72
207 Tosantos 54 Bureba 36 7,884 17,627.04 146.00 326.43
208 Tubilla del Lago 139 Ribera 126 27,594 55,986.10 198.52 402.78
209 Vadocondes 426 Ribera 181 39,639 73,764.75 93.05 173.16
210 Valdeande 116 Ribera 102 22,338 25,297.78 192.57 218.08
211 Valdorros 254 Arlanza 334 73,146 124,704.29 287.98 490.96
212 Vallarta de Bureba 54 Bureba 51 11,169 10,903.01 206.83 201.91
213 Valle de las Navas 643 Bureba 472 103,368 216,103.73 160.76 336.09
214 Valle de Losa 629 Merindades 552 120,888 140,243.29 192.19 222.96

ESPON 2020 43
Municipality Number of inhabitants
Territorial area Number of lights
Energy sav-ing (kwh)
Total invest-ment (€)
Energy saving per inhabitant
Investment per inhabitant (€)
215 Valle de Manzanedo 128 Merindades 118 25,842 41,175.33 201.89 321.68
216 Valle de Mena 3,838 Merindades 2,809 615,171 868,615.49 160.28 226.32
217 Valle de Oca 199 Bureba 127 27,813 59,797.72 139.76 300.49
218 Valle de Santibáñez 564 Amaya Camino 71 15,549 38,227.34 27.57 67.78
219 Valle de Sedano 527 Amaya camino 550 120,450 226,865.33 228.56 430.48
220 Valle de Tobalina 1,044 Merindades 1,140 249,660 400,866.38 239.14 383.97
221 Valle de Valdebezana 627 Merindades 599 131,181 211,432.33 209.22 337.21
222 Valle de Valdelaguna 207 Demanda Pinares 189 41,391 77,541.76 199.96 374.60
223 Valle de Valdelucio 352 Amaya Camino 378 82,782 136,995.41 235.18 389.19
224 Valle de Zamanzas 68 Merindades - 30,380.00 - 446.76
225 Vileña 31 Bureba 27 5,913 14,269.34 190.74 460.30
226 Villadiego 1,820 Amaya Camino 1,094 239,586 524,494.51 131.64 288.18
227 Villaescusa la Sombría 73 Bureba 61 13,359 37,594.10 183.00 514.99
228 Villaespasa 19 Demanda Pinares 48 10,512 23,110.64 553.26 1,216.35
229 Villafranca Montes de Oca 136 Demanda Pinares 122 26,718 57,611.73 196.46 423.62
230 Villagalijo 78 Demanda Pinares 34 7,446 18,224.91 95.46 233.65
231 Villagonzalo Pedernales 1,425 Arlanza 907 198,633 389,999.94 139.39 273.68
232 Villahoz 380 Arlanza - 133,000.00 - 350.00
233 Villalba de Duero 678 Ribera 189 41,391 14,330.30 61.05 21.14
234 Villalbilla de Burgos 879 Arlanza 235 51,465 124,336.88 58.55 141.45
235 Villalbilla de Gumiel 108 Ribera 89 19,491 33,466.95 180.47 309.88
236 Villaldemiro 71 Amaya Camino - 22,600.00 - 318.31
237 Villalmanzo 454 Arlanza 236 51,684 105,033.32 113.84 231.35
238 Villambistia 51 Bureba 60 13,140 25,291.42 257.65 495.91
239 Villamedianilla 19 Amaya Camino - 12,000.00 - 631.58
240 Villamiel de la Sierra 37 Demanda Pinares 42 9,198 3,025.00 248.59 81.76
241 Villangómez 281 Arlanza - 52,500.00 - 186.83

ESPON 2020 44
Municipality Number of inhabitants
Territorial area Number of lights
Energy sav-ing (kwh)
Total invest-ment (€)
Energy saving per inhabitant
Investment per inhabitant (€)
242 Villanueva de Carazo 31 Demanda Pinares 22 4,818 9,483.31 155.42 305.91
243 Villanueva de Gumiel 284 Ribera 145 31,755 62,549.50 111.81 220.24
244 Villanueva de Teba 50 Bureba 53 11,607 17,988.53 232.14 359.77
245 Villaquirán de la Puebla 52 Amaya Camino - 12,200.00 - 234.62
246 Villaquirán de los Infantes 168 Amaya Camino - 62,803.19 - 373.83
247 Villarcayo de Merindad de Castilla la Vieja 4,765 Merindades 1,972 431,868 753,293.30 90.63 158.09
248 Villariezo 507 Arlanza 308 67,452 151,292.73 133.04 298.41
249 Villasandino 229 Amaya CAMINO - 38,400.00 - 167.69
250 Villasur de Herreros 307 Demanda pinares 168 36,792 57,976.91 119.84 188.85
251 Villaverde del Monte 169 Arlanza - 33,300.00 - 197.04
252 Villaverde-Mogina 98 Arlanza - 40,300.00 - 411.22
253 Viloria de Rioja 51 Bureba 32 7,008 14,656.25 137.41 287.38
254 Vilviestre del Pinar 751 Demanda Pinares 341 74,679 128,787.22 99.44 171.49
255 Vizcaínos 49 Demanda Pinares 55 12,045 19,926.28 245.82 406.66
256 Zarzosa de Río Pisuerga 42 Amaya Camino 31 6,789 17,553.01 161.64 417.93
257 Zazuar 257 Ribera 162 35,478 70,420.06 138.05 274.01

ESPON 2020 46
ESPON 2020 – More information
ESPON EGTC 4 rue Erasme, L-1468 Luxembourg - Grand Duchy of Luxembourg Phone: +352 20 600 280 Email: [email protected] www.espon.eu, Twitter, LinkedIn, YouTube
The ESPON EGTC is the Single Beneficiary of the ESPON 2020 Cooperation Programme. The Single Operation within the programme is implemented by the ESPON EGTC and co-financed by the European Regional Development Fund, the EU Member States and the Partner States, Iceland, Liechtenstein, Norway and Switzerland.