provision supply-chain operations reference … proscor whitepaper 2-03.pdfseeing clearly will...
TRANSCRIPT

Seeing Clearly will improve your SCOR
ProVision Supply-Chain Operations Reference Models
26261 Evergreen Road, Suite 200 Southfield, MI 48076 248/356-9775 FAX 248/356-9025 E-mail [email protected] Web site www.proformacorp.com
Supply Chain Operations Model Table of Contents
Copyright 2002 by Proforma Corporation. All rights reserved. TOC
Table of Contents INTRODUCTION ........................................................................................................................1 EXECUTIVE SUMMARY ............................................................................................................3 SUPPLY-CHAIN OPERATIONS FRAMEWORK MODELS........................................................4 SCOR FRAMEWORK (USE CASE) MODEL......................................................................................................... 5 SCOR PROCESS HIERARCHY MODEL .............................................................................................................. 6 SCOR PROCESS ELEMENT (WORKFLOW) MODEL ............................................................................................ 7
Plan Supply Chain Process Category Workflow Model ....................................................................... 8 Activity Definitions ................................................................................................................................ 9 Activities and Best Practices .............................................................................................................. 10 Activities and Metrics.......................................................................................................................... 11 Plan Supply Chain Workflow Model Interpretation............................................................................. 12
Supply Chain Operations Model Introduction
Copyright 2002 by Proforma Corporation. All rights reserved Page 1
Introduction Proforma’s Supply-Chain Operations Reference Model (ProSCOR®) consists of a set of standard business models that provide an end-to-end view of supply-chain management processes. The model is designed as a resource for supply-chain process owners in developing an accurate model of the business activities and information required to provide exceptional service to customers and to improve the efficiency of interactions with suppliers and partners. ProSCOR® represents:
• An enterprise-level business framework for today’s supply-chain processes, based upon SCOR Version 5.0, a hierarchical operations reference model created by the Supply-chain Council.
• An end-to-end business model that is focused on the process types of Plan, Source, Make, Deliver and Return, as well as a common set of definitions.
• A set of over 400 process-specific metrics aligned with 5 performance attributes for process measurement and benchmarking.
• A set of over 300 industry proven best practices that facilitate delivering best in class supply-chain performance.
• A flexible framework of process categories that can be configured to support supply-chain operations strategy.
• A integrated set of process elements that can be extended to support organization-specific processes, systems, and practices.
The Supply-Chain Council has combined the expertise of supply-chain professionals across a broad cross-section of industries to develop best-in-class business practices. Proforma has assembled these best practices in a set of models that can be utilized to redesign business processes, determine associated system and infrastructure requirements, and address those issues identified as critical in today’s supply-chain operations. For example, typical project objectives include:
• Creating an enterprise that can swiftly respond to market changes. Implement inter-organization supply-chain strategies by configuring process categories and extending the definitions for process elements to an implementation level across the organizations involved in the supply of goods and/or services.
• Leveraging supply-chain standards for more effective materials planning forecasts and capacity management. Retain critical strengths while implementing new standardized, cost-effective procurement processes and lowering levels of safety stock inventory.
• Implementing best-in-class improvements by benchmarking supply-chain processes from other organizations. Deliver proven, competitive process improvements through a direct comparison of supply-chain processes using a standardized set of metrics and process element definitions.
• Rethinking Plan, Source, Make, Deliver, and Return strategies in light of e-commerce capabilities. Adapt to new technologies and improve the flow of information among the network partners to reduce cost and create collaborative systems that improve planning and demand forecasting.
Supply Chain Operations Model Introduction
Copyright 2002 by Proforma Corporation. All rights reserved Page 2
This document provides a select sample of the components in the complete supply-chain model. Proforma Corporation offers exceptional value to the organizations through the capture and management of an organization’s supply-chain information in a single repository. ProSCOR® contains over 150 Activity objects that are used to define processes types, process categories and process elements. ProSCOR® also contains 350 Metric and 300 Best Practice objects, along with 28 detailed models. In addition to the standard SCOR information, ProSCOR® provides the following enhancements:
• Additional models that decompose supply-chain processes down to the process element level.
• Dynamic linking of inputs and outputs that span models. • Revisions to eliminate hundreds of discrepancies in model names, linkages and
definitions. • Activities, Metrics and Best Practices objects that can be extending to include critical
information useful in implementing and managing supply-chain processes. • Model documentation that can be printed or represented as a MS Word® document or
HTML pages. • Simulation capabilities to further analyze processes.
The ProSCOR® document is divided into following sections: • Executive Summary - Provides an overview of the Supply-chain Operations Reference
Model (SCOR) as the foundation for Proforma’s ProSCOR® model. It summarizes the benefits of using the ProSCOR® to improve business processes and recommends steps for creating business value using ProSCOR®.
• Supply-Chain Models – Provide examples of ProSCOR® models and related information. The section contains examples of two framework models and one process category model.
Under an agreement with the Supply-Chain Council, Proforma Corporation can provide the ProSCOR® model only to organizations that are current members of the Supply-Chain Council. Information on membership can be found on the Supply-Chain Council’s Web site (http://www.supply-chain.org/)

Supply Chain Operations Model
Copyright 2002 by Proforma Corporation. All rights reserved Page 3
Executive Summary Proforma’s ProSCOR® model is based upon the structure and format of the Supply-chain Operations Reference (SCOR) model. SCOR is a hierarchical model that links process elements, performance metrics, and best practices. The SCOR model can be used as a pattern or framework for the design of supply-chain business processes. SCOR was developed by the Supply-Chain Council, a global, not-for-profit trade association with over 700 company members. The ProSCOR® model is used in conjunction with Proforma Corporation’s industry-leading process modeling toolset ProVision Workbench to provide a robust environment for managing supply-chain information. SCOR is organized around 5 primary process types: Plan, Source, Make, Deliver, and Return. It contains process types, process categories and process elements defined by over 150 ProVision Activity objects. The ProSCOR® model also identifies process inputs, outputs, best practices, and performance metrics in the areas of reliability, responsiveness, flexibility, costs, and asset management. In short, ProSCOR® contains all of the information from SCOR in more robust, extendable and manageable format. ProSCOR® provides a facility to easily enable an organization to extend and customize the SCOR model components and add levels of detail to reflect unique systems and processes. Employing ProSCOR® provides an effective platform for the following efforts:
• Implementing strategies through the use of supply-chain configuration models. • Integrating industry-proven best practices into an organization’s processes. • Managing supply-chain processes by leverage information gathered from metrics. • Creating ‘best-in-class’ processes by benchmarking other organizations.
The recommended steps for creating value and improving your organization through the use of the ProSCOR® are:
1. Model the current state of your supply-chain processes by configuring activities at process category level to represent current supply-chains, decomposing activities at process element level to describe organization specific business practices and establishing a performance baseline using SCOR metrics.
2. Conduct a benchmarking study to set “best-in-class” performance targets and to document business practices that deliver “best-in-class” performance.
3. Model the desired ‘improved’ state of your supply-chain processes using the information gathered from the benchmarking study and SCOR model best practices.
4. Implement the supply-chain process design using the information contained in the new model.
5. Manage the supply-chain process using the metrics, actual performance and performance targets contained in the model.

Supply Chain Operations Model
Copyright 2002 by Proforma Corporation. All rights reserved Page 4
Supply-chain Operations Framework Models Framework models define the supply-chain process boundaries and establish the breadth of the supply-chain model. The framework models serve as a navigational tool and starting point to access all lower-level workflow models. The models presented in this section are SCOR Framework Model and the SCOR Process Hierarchy Model. Although not shown for Supply-chain Operations Framework models, all ProSCOR® models have a textual interpretation that complements the graphical representation of the model by providing additional detailed information. The framework within which business process analysis and improvement takes place is communicated in the context of:
• The processes involved in the scope of the supply-chain
• The hierarchy of Activities that decompose the supply-chain processes

Supply Chain Operations Model
Copyright 2002 by Proforma Corporation. All rights reserved Page 5
SCOR Framework (Use Case) Model The SCOR Framework Model depicts the supply-chain from a strategic perspective. It profiles the enterprise-wide business scope, it establishes the process boundaries, and it portrays the interrelationship of activities within the SCOR structure. This end-to-end business process model includes the primary activities by which business partners provide exceptional service to their customers, and it serves as a navigational tool and starting point to access all lower-level workflow models.
D DeliverM Make
SR Source Return
S Source
SR1 Source Return Defective Product
SR2 Source Return MRO Product
SR3 Source Return Excess Product
P Plan
P5 Plan Return
P1 Plan Supply Chain
P3 Plan Make P4 Plan Deliver
S3 Source Engineer-to-Order Product
M1 Make-to-Stock
M2 Make-to-Order
M3 Engineer-to-Order
D1 Deliver Stocked Product
D2 Deliver Make-to-Order Product
D3 Deliver Engineer-to-Order Product
S1 Source Stocked Product
S2 Source Make-to-Order Product
P2 Plan Source
DR Deliver Return
DR1 Deliver Return Defective Product
DR2 Deliver Return MRO Product
DR3 Deliver Return Excess Product
E Enable
ED Enable DELIVEREM Enable MAKE ER Enable RETURNES Enable SOURCEEP Enable PLAN
Supply Chain Operations Model
Copyright 2002 by Proforma Corporation. All rights reserved Page 6
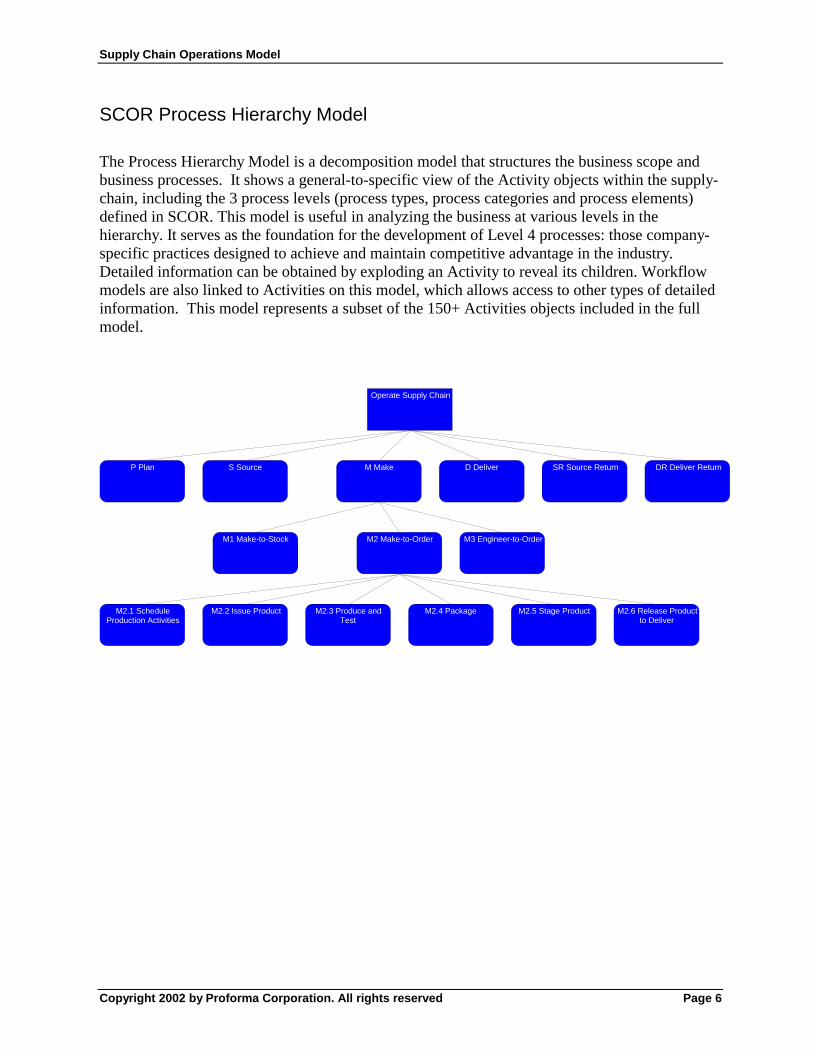
SCOR Process Hierarchy Model
The Process Hierarchy Model is a decomposition model that structures the business scope and business processes. It shows a general-to-specific view of the Activity objects within the supply-chain, including the 3 process levels (process types, process categories and process elements) defined in SCOR. This model is useful in analyzing the business at various levels in the hierarchy. It serves as the foundation for the development of Level 4 processes: those company-specific practices designed to achieve and maintain competitive advantage in the industry. Detailed information can be obtained by exploding an Activity to reveal its children. Workflow models are also linked to Activities on this model, which allows access to other types of detailed information. This model represents a subset of the 150+ Activities objects included in the full model.
Operate Supply Chain
D Deliver DR Deliver ReturnM MakeP Plan S Source SR Source Return
M1 Make-to-Stock M2 Make-to-Order M3 Engineer-to-Order
M2.3 Produce andTest
M2.1 ScheduleProduction Activities
M2.2 Issue Product M2.4 Package M2.5 Stage Product M2.6 Release Productto Deliver
Supply Chain Operations Model
Copyright 2002 by Proforma Corporation. All rights reserved Page 7
SCOR Process Element (Workflow) Model A workflow model is a visual representation of a business process in terms of its component Activities, and the flow of work amongst those activities. As with all ProVision models, the workflow model is more than just a drawing; it is composed of distinct objects that are capable of linking to other objects and storing significant amount of additional information. Workflow models are used in reviewing as-is processes, modeling new processes, or re-thinking current business processes. The model illustrates the interactions between the supply-chain organization and its customers and suppliers. The arrows identify deliverables produced by the activities. The workflow model in this section presents a high-level view of the Plan Supply Chain business process. A section of the workflow model has been highlighted to illustrate the details surrounding each activity and deliverable. A narrative interpretation is provided that further defines the activities, metrics, best practices, and deliverables produced by the highlighted activity. The interpretation includes process element descriptions, information inputs and outputs, and the process performance metrics and best practices associated with the activity.

Supply Chain Operations Model
Copyright 2002 by Proforma Corporation. All rights reserved Page 8
Plan Supply Chain Process Category Workflow Model This process category involves the development and establishment of courses of action over specified time periods that represent a projected appropriation of supply chain resources to meet supply chain requirements. Company
Customer
Cus
tom
er R
equi
rem
ents
Inve
ntor
y
Supply ChainRequirements
Supply ChainResources
"Balanced Supply ChainResources &
Requirements"
Supply Chain Plans
Supply Chain Plans
Supply Chain Plans
Supply Chain Plans
Revised Aggregate Forecast and Projections
Planning Data
Revised Business Assum
ptions
Supply Chain Perform
ance Improvem
ent Plan
Planning Decision Policies
Inventory Strategy
Order Backlog
Order Backlog
Shipments
Shipments
Sour
cing
Pla
n
Prod
uctio
n Pl
an
Del
iver
y Pl
an
Plan
ning
Dat
a
Proj
ecte
d In
tern
al a
nd E
xter
nal C
apac
ity
Proj
ecte
d In
tern
al a
nd E
xter
nal C
apac
ity
Rev
ised
Cap
ital P
lan
Rev
ised
Cap
ital P
lan
Out
sour
ce P
lan
Out
sour
ce P
lan
Reg
ulat
ory
Req
uire
men
ts
Mak
e/Bu
y D
ecis
ion
P1.1 Identify, Prioritize,and Aggregate SupplyChain Requirements
P1.2 Identify, Assess, And AggregateSupply Chain Resources
P1.3 Balance SupplyChain Resourceswith Supply Chain
Requirements
P1.4Establish
Supply ChainPlans
C CC
to P2.1 Identify, Prioritize, andAggregate Product
to P3.1 Identify, Prioritize, andAggregate Production
to P4.1 Identify, Prioritize, andAggregate Delivery
from EP.9 Align Supply ChainUnit Plan with Financial Plan in
from EP.3 Manage PLAN DataCollection in Workflow Modeler:
from EP.9 Align Supply ChainUnit Plan with Financial Plan in
from EP.4 Manage IntegratedSupply Chain Inventory in
from EP.2 ManagePerformance of Supply Chain
from EP.1 Manage BusinessRules for PLAN Processes in
from D1.3 Reserve Inventory &Determine Delivery Date in
from D1.10 Load Vehicle,Generate Ship Documents,
from D1.3 Reserve Inventory &Determine Delivery Date in
from D1.10 Load Vehicle,Generate Ship Documents,
from P2.4 Establish SourcingPlans in Workflow Modeler: P2
from P3.4 Establish ProductionPlans in Workflow Modeler: P3
from P4.4 Establish DeliveryPlans in Workflow Modeler:
from EP.3 Manage PLAN DataCollection in Workflow
from EP.5 Manage IntegratedSupply Chain Capital Assets
from EP.6 Manage IntegratedSupply Chain Transportation
from EP.5 Manage IntegratedSupply Chain Capital Assets
from EP.6 Manage IntegratedSupply Chain Transportation
from EP.5 Manage IntegratedSupply Chain Capital Assets
from EP.6 Manage IntegratedSupply Chain Transportation
from EP.8 Manage PLANRegulatory Requirements and
from EP.5 Manage IntegratedSupply Chain Capital Assets
Many activities in workflow models are dynamically linked through lines that represent activity inputs and outputs. In ProVision these lines are called workflows. Workflows linkages between activities on different models are maintained through the use of red triangles called bridges. Each bridge consists of a pair of triangles with one bridge triangle in each of the linked models. Bridges are aware of the information they relay as well as their connections. Any change of activity connection or information on a workflow made in one model is automatically reflected in the other model.
"Balanced Supply ChainResources &
Requirements"
Supply Chain Perform
ance Improvem
ent Plan
Planning Decision Policies
Inventory Strategy
P1.3 Balance SupplyChain Resourceswith Supply Chain
Requirements
from EP.4 Manage IntegratedSupply Chain Inventory in
from EP.2 ManagePerformance of Supply Chain
from EP.1 Manage BusinessRules for PLAN Processes in
Supply Chain Operations Model
Copyright 2002 by Proforma Corporation. All rights reserved Page 9
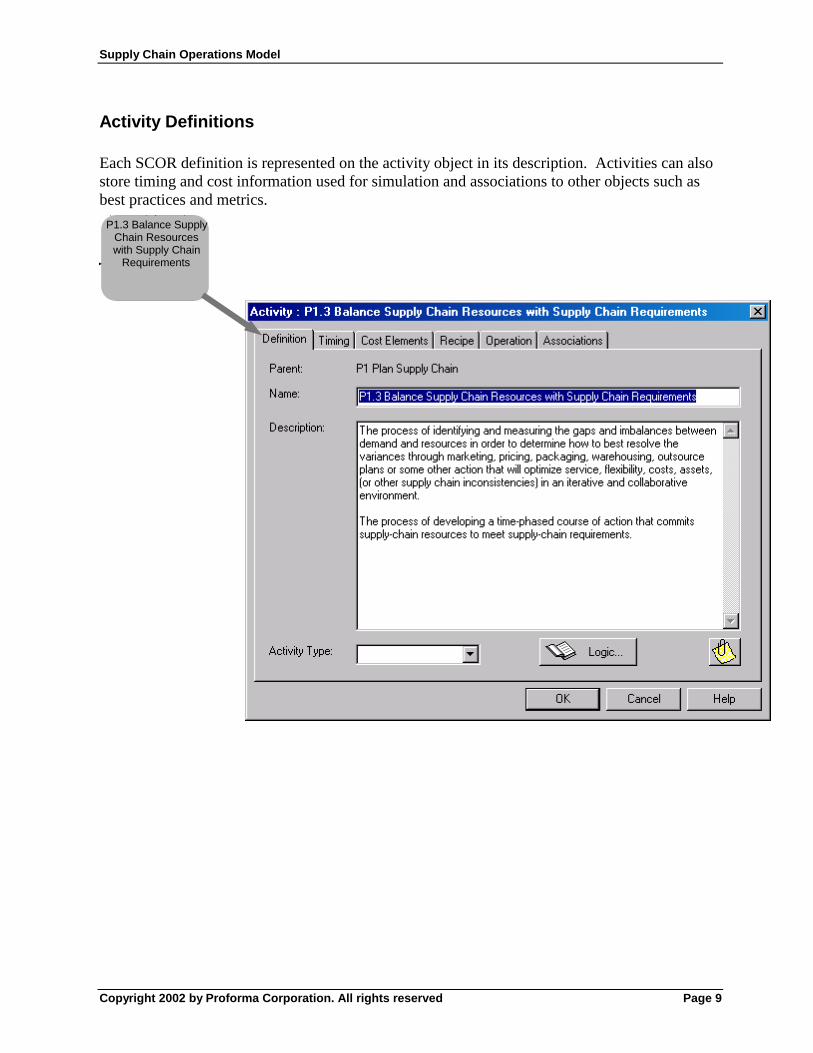
Activity Definitions Each SCOR definition is represented on the activity object in its description. Activities can also store timing and cost information used for simulation and associations to other objects such as best practices and metrics.
n
P1.3 Balance SupplyChain Resourceswith Supply Chain
Requirements
Supply Chain Operations Model
Copyright 2002 by Proforma Corporation. All rights reserved Page 10
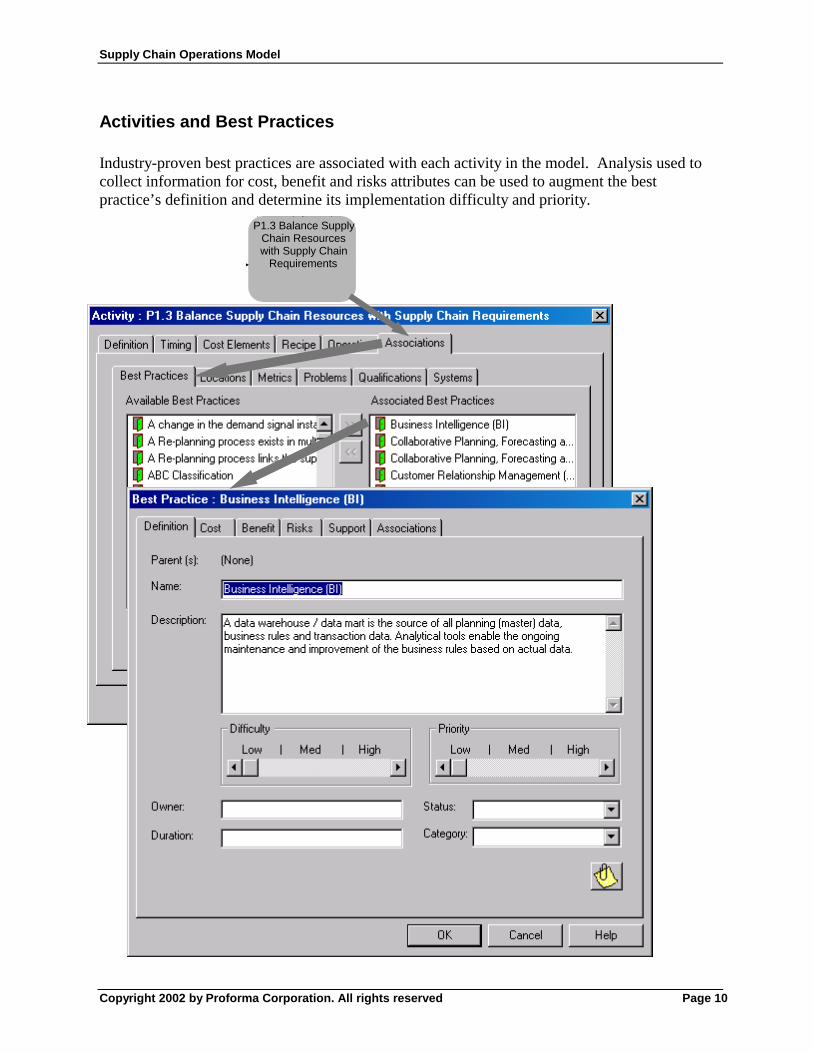
Activities and Best Practices Industry-proven best practices are associated with each activity in the model. Analysis used to collect information for cost, benefit and risks attributes can be used to augment the best practice’s definition and determine its implementation difficulty and priority.
n
P1.3 Balance SupplyChain Resourceswith Supply Chain
Requirements
Supply Chain Operations Model
Copyright 2002 by Proforma Corporation. All rights reserved Page 11
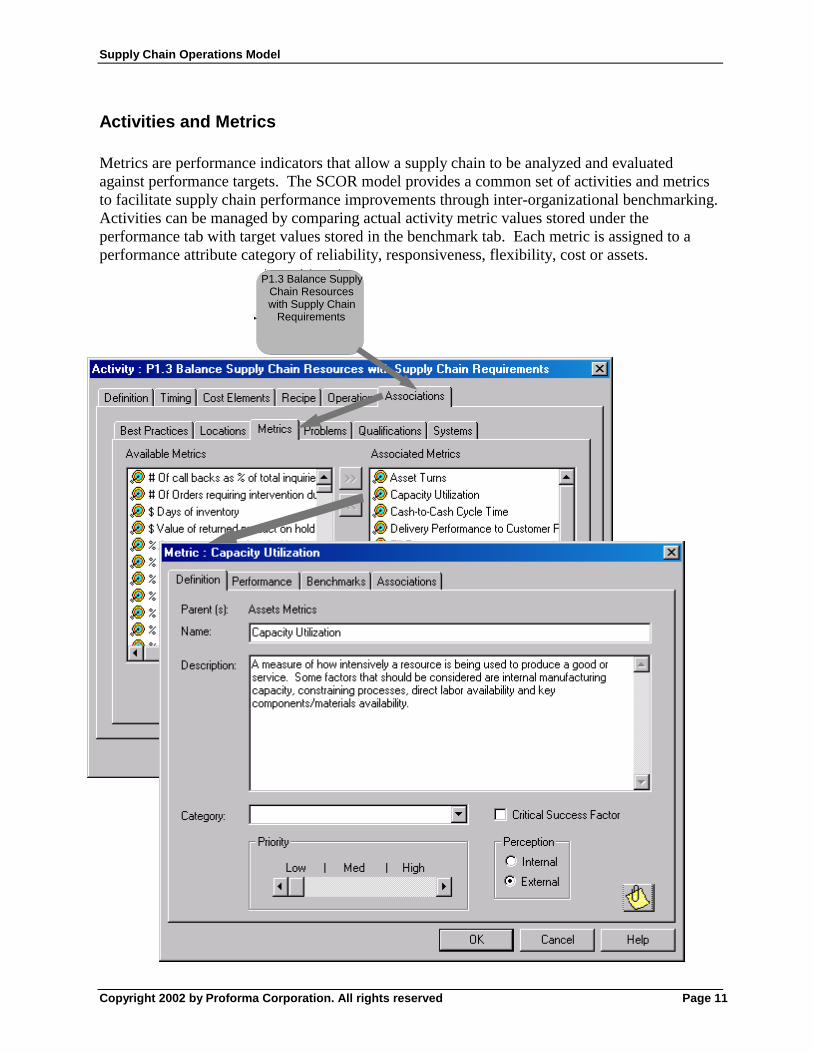
Activities and Metrics Metrics are performance indicators that allow a supply chain to be analyzed and evaluated against performance targets. The SCOR model provides a common set of activities and metrics to facilitate supply chain performance improvements through inter-organizational benchmarking. Activities can be managed by comparing actual activity metric values stored under the performance tab with target values stored in the benchmark tab. Each metric is assigned to a performance attribute category of reliability, responsiveness, flexibility, cost or assets.
n
P1.3 Balance SupplyChain Resourceswith Supply Chain
Requirements

Supply Chain Operations Model
Copyright 2002 by Proforma Corporation. All rights reserved Page 12
Plan Supply Chain Workflow Model Interpretation Each model in ProVision can provide a detailed textual interpretation of the information contained within it. For a workflow model, each interpretation can include activity definitions and associated metrics and best practices. Interpretations can also include initiating events, and a description of the inputs to and outputs from the activity. Workflow interpretations provide both macro or model level interpretation and detailed or activity level interpretations. An interpretation can be printed or used to produce HTML and MS Word® based documentation. Model Level Interpretation Example P1 Plan Supply Chain The development and establishment of courses of action over specified time periods that represent a projected appropriation of supply chain resources to meet supply chain requirements for the longest time fence constraints of supply resources. It is targeted by metrics: - Capacity Utilization
A measure of how intensively a resource is being used to produce a good or service. Some factors that should be considered are internal manufacturing capacity, constraining processes, direct labor availability and key components/materials availability.
- Cash-to-Cash Cycle Time Cash-to-cash cycle time = inventory days of supply + days sales outstanding - average payment period for materials (time it takes for a dollar to flow back into a company after its been spent for raw materials). For services, this represents the time from the point where a company pays for the resources consumed in the performance of a service to the time that the company received payment from the customer for those services.
- Cumulative Source/Make Cycle Time The cumulative external and internal lead-time to build shippable product (if you start with no inventory on-hand, no parts on-order, and no prior forecasts existing with suppliers), in calendar days.
- Delivery Performance to Customer Request Date The percentage of orders that is delivered on the customer's requested date.
- Demand/ Supply Planning Costs Costs associated with forecasting, developing finished goods or end item inventory plans, and coordinating Demand/Supply process across entire supply chain, including all channels. (Not including MIS associated costs.)
- Fill Rate The percentage of ship-from-stock orders shipped within 24 hours of order receipt. For services, this metric is the proportion for services that are filled so that the service is completed within 24 hours
- Forecast Accuracy Forecast accuracy is calculated for products and/or families for markets/distribution channels, in unit measurement.Forecast Accuracy = Forecast Sum - Sum of VarianceForecast SumWhere:Forecast Sum = The sum of the units forecasted to be shipped in each month based upon the forecast generated at the critical time fence.Sum of Variances = The sum of the absolute values, at the forecasted line item level, of the differences between each month's forecast as defined above and actual demand for the same month.
Supply Chain Operations Model
Copyright 2002 by Proforma Corporation. All rights reserved Page 13
- Inventory Days of Supply Total gross value of inventory at standard cost before reserves for excess and obsolescence. Only includes inventory on company books, future liabilities should not be included. Five point annual average of the sum of all gross inventories (raw materials & WIP, plant FG, field FG, field samples, other) ÷ (COGS ÷ 365).
- Re-plan Cycle Time The time between the initial creation of the regenerated forecast and its reflection in the Master Production Schedule of the end-product production facilities.
- Return on Assets A financial measure of the relative income-producing value of an asset. It is calculated as net income divided by total assets.
- Sales Per Employee Total product revenue divided by total number of full-time equivalent employees
Best Practices: - A change in the demand signal instantaneously "reconfigures" the production and supply plans
Event-driven supply chain re-planning - All functions and organizations understand their impact on supply/demand balancing, including sales, marketing, product management, manufacturing, customer, suppliers, materials management, and product development
None Identified - Capability to run "simulated" full-stream supply/demand balancing for "what-if" scenarios
Supply chain modeling and visualization system - On-line visibility of all supply-chain demand requirements and resources, both currently available and committed (pegged)
Enterprise resource planning system Customer relationship management system - Re-balancing of full-stream supply/demand on a daily basis, including Source-Make-Deliver resources and requirements from "customers' customer to suppliers' supplier"
Enterprise-wide planning system customer Relationship Systems - Responsiveness and flexibility are emphasized by developing expertise in making business processes re-programmable, re-configurable and continuously changeable
Integrated process modeling and software reconfiguration tools - Supply chain is designed to have supply flexibility equal to demand volatility
None Identified - Supply/demand process is highly integrated from customer data gathering to order receipt, through production to supplier request
Integrated supply chain planning system with interfaces to all supply/demand data sources through public and private digitally enabled supply networks.
- Tools support balanced decision making (e.g., trade-off between service level and inventory investment)
Supply chain planning optimization system - Tools support balanced decision making (eg, trade-off between service level and inventory investment)
Supply chain planning optimization system It includes four activities: - P1.1 Identify, Prioritize, and Aggregate Supply Chain Requirements
The process of identifying, aggregating, and prioritizing, all sources of demand for the integrated supply chain of a product or service at the appropriate level, horizon and interval.
Supply Chain Operations Model
Copyright 2002 by Proforma Corporation. All rights reserved Page 14
The sales forecast is comprised of the following concepts: sales forecasting level, time horizon, and time interval. The sales forecasting level is the focal point in the corporate hierarchy where the forecast is needed at the most generic level. i.e. Corporate forecast, Divisional forecast, Product Line forecast, SKU, SKU by Location. The sales forecasting time horizon generally coincides with the time frame of the plan for which it was developed i.e. Annual, 1-5 years, 1- 6 months, Daily, Weekly, Monthly. The sales forecasting time interval generally coincides with how often the plan is updated, i.e. Daily, Weekly, Monthly, and Quarterly.
- P1.2 Identify, Assess, And Aggregate Supply Chain Resources The process of identifying, prioritizing, and aggregating, as a whole with constituent parts, all sources of supply that are required and add value in the supply chain of a product or service at the appropriate level, horizon and interval.
- P1.3 Balance Supply Chain Resources with Supply Chain Requirements The process of identifying and measuring the gaps and imbalances between demand and resources in order to determine how to best resolve the variances through marketing, pricing, packaging, warehousing, outsource plans or some other action that will optimize service, flexibility, costs, assets, (or other supply chain inconsistencies) in an iterative and collaborative environment. The process of developing a time-phased course of action that commits supply-chain resources to meet supply-chain requirements.
- P1.4 Establish Supply Chain Plans The establishment and communication of courses of action over the appropriate time-defined (long-term, annual, monthly, weekly) planning horizon and interval, representing a projected appropriation of supply-chain resources to meet supply-chain requirements.
.
.
.

Supply Chain Operations Model
Copyright 2002 by Proforma Corporation. All rights reserved Page 15
Activity Level Interpretation Example
.
.
. P1.3 Balance Supply Chain Resources with Supply Chain Requirements is the responsibility of Company The process of identifying and measuring the gaps and imbalances between demand and resources in order to determine how to best resolve the variances through marketing, pricing, packaging, warehousing, outsource plans or some other action that will optimize service, flexibility, costs, assets, (or other supply chain inconsistencies) in an iterative and collaborative environment. The process of developing a time-phased course of action that commits supply-chain resources to meet supply-chain requirements. It is targeted by metrics: - Asset Turns
Total gross product revenue ÷ Total net assets - Capacity Utilization
A measure of how intensively a resource is being used to produce a good or service. Some factors that should be considered are internal manufacturing capacity, constraining processes, direct labor availability and key components/materials availability.
- Cash-to-Cash Cycle Time
Supply ChainRequirements
Supply ChainResources
"Balanced Supply ChainResources &
Requirements"
Revised Aggregate Forecast and Projections
Planning Data
Revised Business Assum
ptions
Supply Chain Perform
ance Improvem
ent Plan
Planning Decision Policies
Inventory Strategy
Order Backlog
OrderBacklog
Shipments
P1.1 Identify, Prioritize,and Aggregate SupplyChain Requirements
P1.2 Identify, Assess, And AggregateSupply Chain Resources
P1.3 Balance SupplyChain Resourceswith Supply Chain
Requirements
P1.4Establish
Supply ChainPlans
from EP.9 Align Supply ChainUnit Plan with Financial Plan in
N Datakflow
P.9 Align Supply Chainn with Financial Plan in
from EP.4 Manage IntegratedSupply Chain Inventory in
from EP.2 ManagePerformance of Supply Chain
from EP.1 Manage BusinessRules for PLAN Processes in
from D1.3 Reserve Inventory &Determine Delivery Date in
Load Vehicle,p Documents,

Supply Chain Operations Model
Copyright 2002 by Proforma Corporation. All rights reserved Page 16
Cash-to-cash cycle time = inventory days of supply + days sales outstanding - average payment period for materials (time it takes for a dollar to flow back into a company after its been spent for raw materials). For services, this represents the time from the point where a company pays for the resources consumed in the performance of a service to the time that the company received payment from the customer for those services.
- Delivery Performance to Customer Request Date The percentage of orders that is delivered on the customer's requested date.
- Fill Rate The percentage of ship-from-stock orders shipped within 24 hours of order receipt. For services, this metric is the proportion for services that are filled so that the service is completed within 24 hours
- Inventory Days of Supply Total gross value of inventory at standard cost before reserves for excess and obsolescence. Only includes inventory on company books, future liabilities should not be included. Five point annual average of the sum of all gross inventories (raw materials & WIP, plant FG, field FG, field samples, other) ÷ (COGS ÷ 365).
- Order Fulfillment Lead Time The average actual lead times consistently achieved, from Customer Signature/ Authorization to Order Receipt, Order Receipt to Order Entry Complete, Order Entry Complete to Start-Build, Start Build to Order Ready for Shipment, Order Ready for Shipment to Customer Receipt of Order, and Customer Receipt of Order to Installation Complete.
- Perfect Order Fulfillment A "perfect order" is defined as an order that meets all of the following standards:Delivered complete; all items on order are delivered in the quantities requestedDelivered on time to customer's request date, using your customer's definition of on-time delivery Documentation supporting the order including packing slips, bills of lading, invoices, etc., is complete and accuratePerfect condition: Faultlessly installed (as applicable), correct configuration, customer-ready, no damage
- Production Flexibility - Supply Chain Finance Costs
Costs associated with paying invoices, auditing physical counts, performing inventory accounting, and collecting accounts receivable. (Does not include customer invoicing/accounting costs.)
- Supply Chain Response Time - Total Supply Chain Costs
Costs associated with the supply chain including execution, administration, and planning. - Value Added Productivity
Value added per employee is calculated as total product revenue less total material purchases ÷ total employment (in full-time equivalents).
Best Practices: - Business Intelligence (BI)
A data warehouse / data mart is the source of all planning (master) data, business rules and transaction data. Analytical tools enable the ongoing maintenance and improvement of the business rules based on actual data.
- Collaborative Planning, Forecasting and Replenishment (CPFR) Supply chain planning systems and communication technologies as well as newly defined standards that reflect the CPFR model and 'participate' in the entire planning process.
- Collaborative Planning, Forecasting and Replenishment (CPFR) Technologies and Standards Supply chain planning systems and communication technologies as well as newly defined standards that reflect the CPFR model and 'participate' in the entire planning process.
- Customer Relationship Management (CRM) Software that provides customer input and keeps the customer informed about the planning of the production and delivery process by managing all contacts and communication with the customer thorough all channels including internet and traditional sales and customer service channels.

Supply Chain Operations Model
Copyright 2002 by Proforma Corporation. All rights reserved Page 17
- Demand Planning, Demand Flow Leadership Software that provides multiple data models including the business rules and metrics for the entire supply chain planning process. Algorithms use the business rules and metrics as the drivers for the planning engine.
It initiates event: - Balanced Supply Chain Resources & Requirements for Activity: P1.4 Establish Supply Chain Plans
Completed marketing, pricing, packaging, warehousing, outsource plans or some other action that optimize service, flexibility, costs, assets, (or other supply chain inconsistencies).
It accepts: - Supply Chain Requirements from Activity: P1.1 Identify, Prioritize, and Aggregate Supply Chain Requirements - Supply Chain Resources from Activity: P1.2 Identify, Assess, And Aggregate Supply Chain Resources - Inventory Strategy from Activity: EP.4 Manage Integrated Supply Chain Inventory
The total supply chain inventory strategy. Contains the plan for total inventory limits or levels (including Raw Material, Work In Process, Finished and Purchased Finished Goods) including replenishment models, ownership, product mix, and stocking locations, both inter and intra company.
- Planning Decision Policies from Activity: EP.1 Manage Business Rules for PLAN Processes Any company policies that affect how a planning process is defined, approved, and performed.
- Supply Chain Performance Improvement Plan from Activity: EP.2 Manage Performance of Supply Chain
A plan that describes goals and objectives for a supply chain and the steps that will be taken to reach those goals and objectives from the current performance levels.
It delivers: - Workflow to Activity: P1.4 Establish Supply Chain Plans . .