provisional version, not for quotation)€¦ · transactions recorded by buddhist temples between...
TRANSCRIPT

This version: 15/01/2014
1
A First Escape from Poverty in Late Medieval Japan Evidence from Real Wages in Kyoto (1360-1860)
Jean-Pascal Bassinoa, Kyoji Fukaob, and Masanori Takashimac This version: 15/01/2014 (Provisional version, not for quotation) Abstract
How poor was Japan before the Tokugawa period (1603-1868)? European visitors of the 16th century describe the country as one the poorest in Asia, suggesting that living standards of commoners were lower in Japan than in coastal urban areas of India, Southeast Asia, and China, and implicitly lowest than in Europe. This paper offers a first investigation of long-term trends in Japanese living standards from the mid-14th to the mid-19th century using urban daily wages and price data for a number of basic commodities, allowing a comparison with Europe. Urban rice wages were on a steady upward trend, from a low level, between the mid-15th and the mid-16th century. Our tentative interpretation is that this improvement was mostly driven by a rise in labor productivity in agriculture. A drastic decline in the skill premium, from an extremely high level, is observed between the 16th and the 19th century. The skill diffusion initiated a process of Smithian growth and of contraction of income inequalities that accelerated in second half of the Tokugawa period (Saito 2010). This was associated with a fall in rice wages of skilled workers that was largely offset for by changes in relative prices comparable to what has been observed for Europe by Hoffman et al. (2002). Living standards of wage earners in Kyoto, measured using welfare ratios (Allen 2001), remained in the lower range of European cities for skilled workers and were extremely low for unskilled workers. Keywords: welfare ratios, skill premium, relative prices, Smithian growth, Great divergence JEL classification: J31, J42, N37, N95, O33, Y10, Z13 This research has been undertaken as part of the US National Science Foundation (NSF) project “Global Price and Income History, 1200-1950” (Grant #34-3476-00-09-781-7700). Financial support by the NSF and the Global COE Hi-Stat programme (Japanese Ministry of Education) are gratefully acknowledged.
a Institute of East Asian Studies (IAO), Ecole Normale Supérieure (ENS) de Lyon, 15 parvis René Descartes, BP 7000, 69342 Lyon, France. Email: [email protected] b Institute of Economic Research, Hitotsubashi University, Naka 2-1, Kunitachi, 186-8603, Tokyo, Japan. [email protected] c Institute of Economic Research, Hitotsubashi University, Naka 2-1, Kunitachi, 186-8603, Tokyo, Japan. [email protected]
This version: 15/01/2014
2
A First Escape from Poverty in Late Medieval Japan Evidence from Real Wages in Kyoto (1360-1860)
Japan is a country made up of various islands and divided into 66 kingdoms… Some parts of the country are well supplied with rice, the staple diet, and some wheat is also grown; other regions are barren and hilly. On the whole, Japan is one of the poorest and most barren countries in all the Orient. Alessandro Valignano, Historia del Principio y Progresso de la Compania de Jesus en las Indias Orientales, 1542-1564.1
How poor was Japan before the Tokugawa period (1603-1868)? European visitors of the 16th century2 such as Alessandro Valignano describe the country as one the poorest in Asia, suggesting that living standards of commoners were lower in Japan than in coastal urban areas of India, Southeast Asia, and China, and implicitly lower than in Europe. Unfortunately, Jesuit reports do not provide much quantitative evidence and, until recently, the Japanese historiography has paid little attention to issues related to living standards before the 18th century. Information is equally scarce for India or Java before the 17th century3, for China or Korea before the 18th century, and almost inexistent for other Asian countries before the second half of the 19th century.4
This paper offers a first investigation of long-term trends in Japanese living standards from the mid-14th to the mid-19th century using urban daily wages and price data for a number of basic commodities.5 We construct new real wage series covering the second half of the medieval period that conventionally starts for Japan in 1185 with the installation of the political capital in Kamakura, and ends, in 1603, with the establishment of the Tokugawa shogunate in Edo (present day Tokyo). Although the political, religious, and architectural history of medieval Japan has been extensively studied, issues related to economic conditions and living standards remain largely a matter of conjecture. What we know with certainty is that the Japanese managed to keep the Mongols at bay in the 13th century6, and did not suffered from the Black Death of the mid-14th century, avoiding therefore devastating shocks that affected China.
Although Japanese historians have compiled information on thousands of market transactions recorded by Buddhist temples between the 13th and the 17th century, and in merchants’ account books from the 17th to 19th century, most authors remained focused on political or military 1 English translation: Copper (1965, 4). Alessandro Valignano (Chieti, Italy, 1539 - Macao, China, 1606), doctor in law from the University of Padua (Italy), joined the Company of Jesus in 1566, studied philosophy and theology in Rome, and became priest in 1570. In 1573, he was appointed Superior General of Jesuit missions in the East Indies (India, Malacca, China, and Japan) answerable only to Jesuit Superior General in Rome. He visited Japan in 1579-1582, 1590-1592, and 1598-1603 (Braga 1942). 2 Portuguese merchants arrived in 1542 on Tanegashima, a small island off Kyushu. They were followed in 1549 by Jesuits missionaries, including Francis Xavier, one of the founders of the Company of Jesus (Societas Iesu). 3 Broadberry and Gupta (2006) present evidence showing that living standards in the most affluent parts of India were in the lowest range of European levels. 4 This remarks does not applies to the Near East, in particular the Ottoman Empire (Pamuk 2005). 5 We cover the period starting only from circa 1260, as information currently available is too scarce for earlier years, and ending in 1860. From the 1860s, drastic changes in relative prices occurred due to the opening of Japan to international trade. 6 A first time in 1274 when warriors from all over the country repelled the invasion by fighting literally on the beaches of northern Kyushu, and a second time in 1281 when the Mongol fleet was destroyed by divine winds (kamikaze).

This version: 15/01/2014
3
events, institutional change, and demographic patterns. Only a few wage and price series were constructed and even fewer were processed in a systematic manner for analytical purposes.7A prerequisite to the investigation of changes in living standards before 1600 is to compile wages and price data for rice and other items.8
We focus on Kyoto for which the documentation is particularly abundant and that can be regarded as representative of economic activities in Japanese urban areas. Kyoto was one of the largest cities in Asia as well as the seat of the imperial court (until 1868) and of major religious institutions. As such, it had the main concentration of craftsmen, particularly carpenters building temples, imperial palaces, and estates of aristocrats. It was also the main urban market for foodstuffs (rice, other grains, and dried fish in particular), and cottage industry items such as clothes, Japanese paper (washi), and ceramics. Kyoto was the largest Japanese city until the 16th century. It was home to about 100,000 people around 1280 (Farris 2006, 27) and 200,000 in 1450 (ibid 151). For Japan as a whole, urban population accounted for 3 percent of total population around 1280 (Farris 2006; 26, 86, 151), the same percentage in 1450 (Ibid. 98) and 5 percent 1600 (ibid. 245).9 It remained one of the three biggest, along with Edo (Tokyo) and Osaka until the late 19th century. Relying on information previously collected by economic historians, we extend the series as to cover also most of the early modern period corresponding to Tokugawa rule (1603-1868), commonly called Edo period. This allows us to investigate long-term trends in living standards of urban wage earners.
The Japanese historiography has extensively studied changes in economic conditions in the second half of the 18th century and the first half of the 19th century10, but information is limited for the first half of the Edo period. The most commonly accepted wisdom is that economic conditions gradually improved during the Edo period. From the mid-17th century to the mid-19th century, the country experienced a long period of peace11, associated with regional integration, urbanization, and the development of cash crop and handicraft production, particularly from the mid-18th century. The sophistication of market mechanisms and the blossoming of various forms of art in the late Edo period suggest a high level of human capital accumulation and a remarkable quality of life. However, rural areas continued to experience severe famines that were mostly driven by crop failures.12 This indicates that the standard of living of part of the population was only slightly above subsistence level in normal years.
The Euro-Asian comparison of living standards in 18th and 19th century Kyoto, based on the calculation of welfare ratio comparable to those measured by Allen (2001) for European urban workers indicates that, in the period 1740-1850, urban real wages of Japanese unskilled workers
7 In particular, Saito (1978, 2005) has constructed urban and rural real wages series for the late Tokugawa period. 8 Apart from individual initiatives, a number of large-scale research programs resulted in the availability of extensive databases. In particular, researchers of the University of Kyoto (KKB 1962) have been compiled price data for various items for the period 1567-1603; KKB stands here for Kyoto Daigaku Kinsei Bukka Kenkyukai (Japanese denomination of the “research team on pre-modern prices of the University of Kyoto” that authored the collective volume). More recently, researchers of the National Museum of Japanese History (Rekihaku) have collected and made available through the web to the academic community a large volume of price and wage data for Ancient and Medieval Japan collected in various manuscripts. 9 By 1600, Japan was one of the most urbanized countries in the world, with a network of at least 321 cities, of which 202 appeared after 1450; 67 arose as political centers, 51 developed from temples or shrines, 47 were post stations, 26 were ports, and 11 were markets towns (Farris 2006, 245). 10 For instance Nishikawa, Odaka and Saito (1996). 11 More precisely, after the suppression of the Shimabara rebellion of 1636-1637, in southern Kyushu following the implementation of seclusion (sakoku) policy that included the restrictions on foreign trade, except with China, Korea, the Kingdom of the Ryukyu, or via the Dutch traders, and the prohibition of Christianity (seclusion edict of 1635). By contrast, the period between the mid 15th and the late 16th century witnessed political fragmentation associated with warfare among local rulers. The period of Warring Kingdoms (sengoku jidai), the 66 kingdoms mention by Valignano, is conventionally dated from 1467 to 1573 but the political unification was actually completed in 1590. 12 During the last one in 1833-1838 (Tenpo famine), Osaka lost around 11% of its population (Hayami 1986).

This version: 15/01/2014
4
were barely equivalent to the lowest European levels (Bassino and Ma 2005) and comparable to those observed in China (Allen et al. 2011). Skilled workers were better off. Data reported by Saito (1978, 2005) show that Japanese carpenters earned around three times more than unskilled workers in the early 18th century, a skill premium much higher than the European standards of the time.13 If the description of Japan by 16th century Jesuits is accurate, living standards were already low in the pre-modern period. An alternative interpretation would consider that, since the Japanese population doubled during the 17th century and stagnated afterward (Kito 1983, 2000), Japan fell in the late 17th or early 18th century into a Malthusian high level equilibrium trap akin to the one described for early modern China by Elvin (1973). The results presented in this paper, based on prices and wages in and around Kyoto, show a more complex picture of declining skill premium, and, albeit at a low level, overall stability of living standards with some improvements for urban unskilled workers.
In order to investigate long-term trends, we can rely for both prices and wages on market transactions recorded in copper coins (mon) by Buddhist temples between the 13th and the 17th century, and in silver coins or weight (monme) in merchants’ account books from the 17th to 19th century. 14 Whereas the information for the later period can be found fairly easily in various sources in Japanese published since the late 19th century, prices and wages data for the earlier period are mostly available as records on individual transaction. For this study, we relied on databases compiled from archives of Buddhist temples in printed format (e.g. KKB 1962)15 and more recently from the massive electronic database of the National Museum of Japanese History (thereafter Rekihaku16).
In the remainder of the paper, we first look at long-term trends in nominal wages and skill premium; we then, construct rice wages and investigate changes in rice prices and grain wages, along with the volatility of rice prices. Finally, we estimate the price of consumption baskets and real wages for two benchmark periods, circa 1560 and 1850, and compare with European cities. Detailed information on data sources and estimation procedures is provided in an online appendix. Long-term trends in nominal wages and skill premium
Nominal wages series are constructed in two steps: we first document daily wages paid by Buddhist temples to skilled and unskilled workers in Kyoto and neighboring provinces between 1419 and 1592 that have been recorded in cooper coins (and in a few cases, in rice).17 Then, we link to series of nominal wage paid in silver (and in some cases in copper coins) by temples and merchant houses in Osaka and Kyoto, usually including an in-kind component in rice, covering the 1593-1860 period.
For nominal wages of skilled workers, we rely on labor reward received by carpenters for which information is comparatively abundant, and compare with data for other craftsmen. Since all buildings, including temples, imperial palaces, estates of aristocrats, and residential or commercial buildings used by commoners were mostly made of wood (except roofs made of tiles or metal sheets for temples and palaces), they can be regarded as the Japanese counterparts of skilled construction workers (masons) of per-modern Europe and the Near East. It should be stressed that daily nominal wages recorded by Buddhist temples are labor rewards paid to ordinary workers.18 13 1.3 to 1.8 in most European cities in the second half of the 17th century (Van Zanden 2009, Table 1, 127). 14 See online appendix for a more detailed presentation of monetary system. 15 KKB stands here for Kyoto Daigaku Kinsei Bukka Kenkyukai (Japanese denomination of the “research team on early modern prices of the University of Kyoto” that authored the collective volume). 16 Rekihaku is the official acronym of the Japanese name of the National Museum of Japanese History (Rekishi Hakubutsukan). 17 Most payments of labor rewards recorded by Buddhist temples are measured in copper cash though actual payment was perhaps made in some cases in rice owned by the temple. 18 Some craftsmen were part of a sort of aristocracy of quasi-artists. As in early Renaissance Italy, the concept of artist did not exist in pre-modern Japan. A number of craftsmen regarded as particularly skilled and knowledgeable were paid

This version: 15/01/2014
5
The magnitude of the skill premium in Japan can be assessed using information on daily wages paid by the same institutions to different types of unskilled and semiskilled workers, craftsmen’s assistants, service workers, and transporters.
Information on standard wage rates for carpenters recorded in copper coins by various Buddhist temples in the Kinai region between 1419 and 1592 indicates that nominal wages rates were fairly stable at around 100 copper coins per day.19 Individual labor contract reported in the Rekihaku database provides some confirmation but also shows that different skill level existed: the two most common rates were at 110 and 100 copper coins, accounting together for more than half of the observations. A wide dispersion is observed at a lower level, with small clusters at around 10, 20, and 50 copper coins (Figures 1 and 2).20 Combining information presented from these different sources, we can regard standard nominal wages for highly skilled carpenters as 100 to 110 copper coins until around 152521, and around 90 to 110 in the mid and late16th century.22
On the basis of individual contract for other craftsmen and urban service workers before 1600 reported in the Rekihaku database, we can identify different categories of unskilled or semiskilled workers. For craftsmen other than carpenters (around half of observations reported in the Rekihaku database), the two main daily wages clusters are at around 50 and 100 copper coins (see online appendix), which confirm the presence of two main layers. Two other less important clusters are identified at around 30 and 150 copper coins. For service workers the main cluster of data is at 10 copper coins per day (around half of the observations), with two less important clusters at 5 and around 30 (see appendix). 23 Although Rekihaku data for carpenters clearly points unambiguously to daily wages of around 100 copper coins, labor contract for other craftsmen and service workers indicates that three wage layers existed: around 100 copper coins for highly skilled workers (150 for a few specialized trades such as ship carpenters), 10 for unskilled workers, and 50 for wage earners that we could describe as semi-skilled as far as carpenters are concerned (although 50 copper coins was the most common wage rate for a number of craftsmen specialized in other trades); for the sake of clarity, we will use he terms ‘skilled’ and ‘highly skilled’ to describe the workers earning 50 and 100 copper coins.
Even if we overlook ‘highly skilled workers’ and considering only as skilled these workers earning 5 times as much as unskilled workers, the skill premium is much higher than in the western part of the Eurasian continent.24 Data for western and central European cities (Allen 2001, Zanden 2009), and Istanbul (Pamuk 2005) indicates that skilled workers (masons and other construction workers) earned around 100 to 200 percent more than unskilled workers (their helpers) before the at piece rates, and apparently very generously rewarded. We know for instance that a sculptor received in 1238 a piece of land of 0.425 tan (around 400 square meters; presumably urban land in Kyoto) as payment for carving a Buddha statue while another one received 200 koku rice (116 kg rice per koku at that time) in 1496 for a similar accomplishment.18 We also know that a sculptor of Sanskrit letters received 20 mon in 1498 (at that time, worth around 3 kg rice) per letter carved (Rekihaku), which could be regarded roughly as equivalent to a daily wage of 100 copper coins. 19 Endo (1956) and Tanaka (2007); see appendix 4, Table A4-1. 20 Most or these data were recorded by temples situated in the Kinai region, particularly in Yamashiro and Yamato. Information regarding the province is unavailable for some observations, but only for a minority and almost exclusively before 1310. 21 Labor rewards measured by combining cash component in copper coins and an in kind component in rice for 1545, 1566, and 1568 (reported in appendix, Table A3) suggest that total nominal wages in copper coins were around 90 mon, but another observation indicates a much higher level in 1548 (110 mon). 22 Considering the wide fluctuation of rice price, particularly during famines, and the fact that religious institutions owned rice estates, the prevalence of payment in cash indicates that wage earners were not particularly keen to receive payment in kind. 23 A similar result is obtained by processing data on transporters recorded in Rekihaku files, with journey from Harima to Kyoto, presumably shipments to the capital from rice estates owned by the temples recording the transaction. 24 An alternative interpretation would be that the 50 and 10 copper coins wage layers correspond to unskilled male and female workers respectively, which would imply a skill premium for male of 100 percent and an enormous gender gap. However, this is not consistent with information gathered from transporters who were male workers (see appendix)

This version: 15/01/2014
6
Black death but that the gap decline to around 40 to 70 percent in the second half of the 14th century. A 400 percent skill premium is nevertheless plausible in a situation of acute skill shortage; is in the high range of observations for late 19th century Korea (Zanden 2009) and sub-Saharan Africa (Frankema and van Waijenburg 2012).
Figure 1. Nominal wages paid to carpenters in and around Kyoto Source: Rekihaku. Note: 284 observations (20 data points above 150 dropped; total sample size 304)
Figure 2. Histogram of wages paid to carpenters in and around Kyoto in copper coins Source: Rekihaku.
There is surprisingly little information available on nominal wages between the late 16th and the first half of the 18th century.25 Scattered wage data for carpenters and unskilled workers paid in silver and rice that have been converted in rice terms suggest that two layers still existed for carpenters with highly skilled workers ‘shrine carpenters’ earning twice as much as other carpenters (skilled workers). As mentioned above, this semiskilled level is observed in 14th and 15th century Rekihaku data for various craftsmen but not for carpenters, which indicates that a diffusion of skills and a rise in the division of labor occurred from the 16th century. In the first half of the 17th century skilled workers earned only five to six times more than unskilled workers, and semiskilled received between two and half and three times (as opposed to 10 and 5 times earlier). In the first half of the 25 Some in individual data for labor contracts in silver coins in the last years of the 16th century is reported in KKB (1962): data in copper coins has been also compiled by Oyazu (2006). The relatively small number of observation and large dispersion does not allow constructing nominal series.
0 50 100 150copper coins

This version: 15/01/2014
7
18th century, the premium was further reduced to around four for skilled workers and two for semiskilled, with a gap between skilled and semi-skilled stable around two
Information is more abundant from the mid-18th century. Records of standard wages of carpenters and unskilled workers recorded by he house of Mitsui in Kyoto 1741-1762, and from 1791 are reported in (Mitsui Bunko 1952, 1981). No distinction between skilled and semiskilled exists in this data set, which suggest the both categories converge in one.26 The fluctuation of these Kyoto wage series expressed in silver indicates that the biannual measure by the house of Mitsui was in fact a conversion of the combined value in silver of the cash and in-kind rice components. The skill premium can be directly measured, without requiring adjustment for in-kind component. A gradual declining trend is observed from 3.7 on average in 1746-59, to 3.3 in 1791-1817, and 2.8 1821-1860 (Figure 3). A contraction of the skill premium therefore occurred from the mid-16th century at a compound rate of around 4 percent per decade up to 1860 (when the starting point is taken as 10).
Figure 3. Nominal wage of carpenters and unskilled workers in Kyoto, 1740-1860 Source: Mitsui Bunko (1952, 1981) Note: nominal wages in silver monme (3.75 grams); skill premium measured as the ratio of skilled to unskilled wages.
Our interpretation is that the income gap between the medium level of skilled workers and upper level of highly skilled workers and the skilled worker started to decline in the 16th century due to a gradual diffusion of existing techniques to a larger pool of craftsmen, and almost entirely disappeared during the Tokugawa period. The building of castles by local lords during the period of political fragmentation known as period of Warring Kingdoms (sengoku jidai 1467-1573) resulted in a rise in demand for carpenters without implying the sophisticated knowledge required for the construction of temples, favoring therefore semi-skilled workers. The contraction of the skill premium among craftsmen was therefore due initially to a shift in public demand that was previously dominated by massive public works (temples and palaces). But the diffusion of skill during the Tokugawa period also permitted the development of relatively small-scale locally funded religious project, as well as the standardization of techniques employed in the construction of
26 A semi-skilled wage rate is documented for Edo in 1830-1860 (Tokei Shushi 1881), with a gap between skilled and semi-skilled carpenters of a mere 15% of the semi-skilled wage rate (including wage in kind for both).
0
2
4
6
1740 1750 1760 1770 1780 1790 1800 1810 1820 1830 1840 1850 1860
Unskilled wages Skilled wages Skill premium

This version: 15/01/2014
8
dwellings for non-elite urban residents and wealth rural commoners. This change in demand also affected the gap between skilled and unskilled workers. It appears therefore that a process of human capital accumulation by unskilled and semiskilled workers resulted in a drastic contraction of income distribution among wage earners. Rice price series and rice wages
In order to assess to what extent changes in the skill premium were associated to improvement in living standards, we have to construct real wages series. As a first proxy, we calculate rice wages, i.e. daily wages measures in terms of kg of rice, which his implies as a prerequisite is to construct continuous rice price in copper coins for the period 1260-1570, and in silver for the period 1560-1600 that could be linked to existing series in silver for the Tokugawa period. We will also use these series for measuring rice price volatility since this indicator provides information on the exposure to exogenous shocks affecting living standards
Rice is the only commodity for which it is currently possible to construct almost continuous yearly series covering the period 1260-1860, as price data are too fragmentary for other items before the mid-18th century. Rice was, by far, the most important commodity traded in Japan up the 19th century. It was a prestige food in Japan (Onuki-Tierney 1993) until the late 19th century and the main staple food of urbanites and as such the most important cash crop. It was also and a quasi-currency, although the economy was highly monetized. Rice was relatively easy to sell since it was the main consumption expenditure item of most urban households, either as grain or in a processed from, particularly rice wine (sake). In addition, it was used as unit of account for fiscal purposes and, after 1603, the assessment of output value of feudal domains, as well as the measure of stipends received by member of the military samurai caste, turned as a bureaucratic elite.
This version: 15/01/2014
9
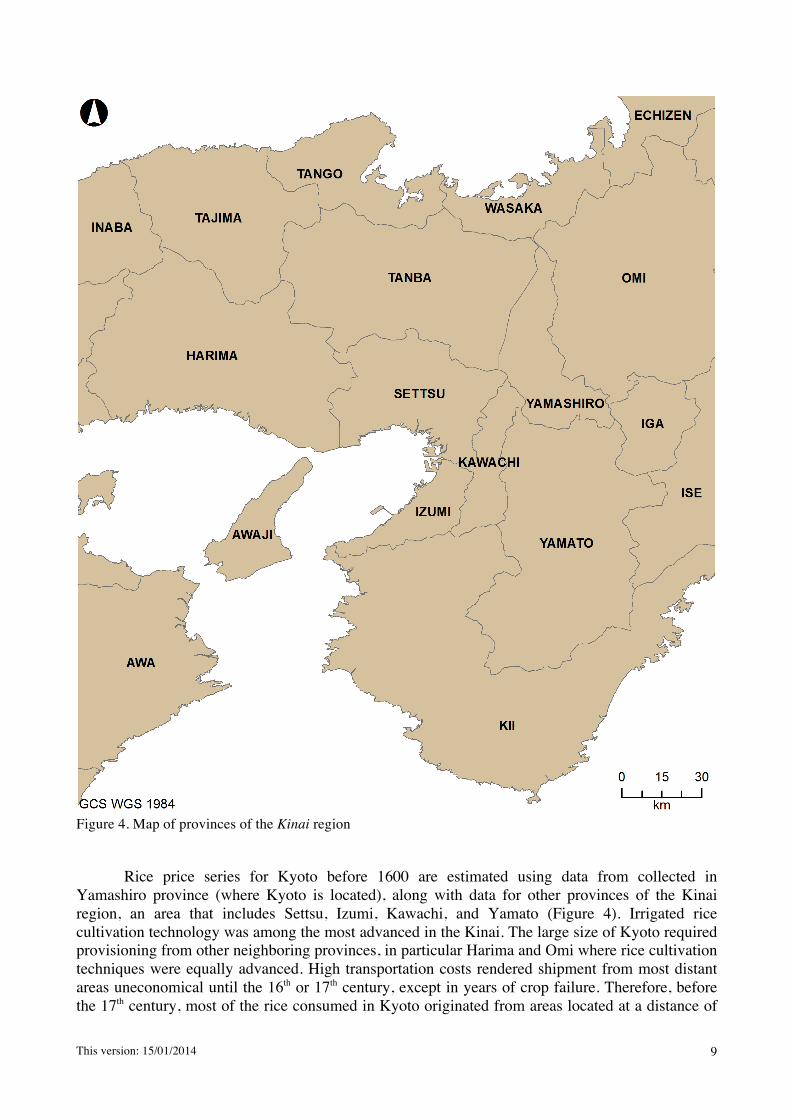
Figure 4. Map of provinces of the Kinai region
Rice price series for Kyoto before 1600 are estimated using data from collected in
Yamashiro province (where Kyoto is located), along with data for other provinces of the Kinai region, an area that includes Settsu, Izumi, Kawachi, and Yamato (Figure 4). Irrigated rice cultivation technology was among the most advanced in the Kinai. The large size of Kyoto required provisioning from other neighboring provinces, in particular Harima and Omi where rice cultivation techniques were equally advanced. High transportation costs rendered shipment from most distant areas uneconomical until the 16th or 17th century, except in years of crop failure. Therefore, before the 17th century, most of the rice consumed in Kyoto originated from areas located at a distance of

This version: 15/01/2014
10
less than 200 km.27 The city experienced recurrent difficulties in food provision due to crop failures caused mostly by drought.28
The construction of rice prices series in copper coins before 1560 can first rely on information recorded by the Toji Buddhist temple, a major religious institution in Kyoto (in Yamashiro province). Two series of unit prices have been constructed by Momose (1959 on the basis of the archives of Toji temple: Fist, a series of rice price delivered to Toji Temple in Kyoto (series labeled Yamashiro) covering most of the period 1365-1544, with some gaps in the early 15th century. The second one is a series of price recorded in Yano sho, a rice estate owned by Toji temple that was located in Harima province29 to that covers most years of the period 1403-1460 (series labeled Harima). Harima province was a major supplier of rice consumed in Kyoto. The Harima series allows filling the gaps and checking the consistency of the data from the Yamashiro series to generate a composite Toji series with rice volumes converted into metric unit, i.e. in copper coins per kg of rice (see appendix for details).
Figure 5. Composite rice price series 1360-1580 in copper coins per sho Note: around 1 kg rice per sho (around 1.2 l per sho)
Rice price in copper coins are also available in the Rekihaku database that contains 1623 observations covering most of the period 1260-1593. The data reported in this source also originated from records of Buddhist temples and are therefore comparable to the Toji series. Rekihaku data are then processed as yearly series and merged with the Toji series in a single yearly rice price series covering the period 1208-1593, albeit with major gaps in the initial and final part of the series. The series is however almost continuous between 1260 and 1570. An inspection of seasonal pattern and regional difference indicates that adjustment of unit prices for month and province in which the transaction took place is not required. Unweight yearly averages based on monthly data are calculated to generate the Rekihaku rice price series. This series is combined with 27 Red beans (azuki) and soybeans were also extensively traded. Other staple grains were cheap substitute that were traded at some distance only in time of famine. The process of regional convergence of rice prices is discussed in the next section. 28 21 years of widespread famine are recorded between 1150 and 1250 (Farris 2006, 59). The frequency of famines is also certainly explained by high transportation costs that hindered the shipment of grain from surplus to deficit regions. 29 The province of Harima corresponds to the southern part of present-day Hyogo prefecture (present-day city of Kobe and surrounding area).
0
10
20
1360 1380 1400 1420 1440 1460 1480 1500 1520 1540 1560
Rekihaku Yamashiro Harima

This version: 15/01/2014
11
Toji series to generate a composite Rekihaku-Toji series (unweighted average of unit price for year in which information is available in both series). The Rekihaku, Yamashiro, and Harima series are presented in figure 4.
Another set of rice price data based on individual transactions recorded by Buddhist temples (KKB 1962), is available for the period 1467-1603, with almost continuous information from the 1560s. But rice prices reported in KKB (1962) are plagued with problems of measurements, in particular the use of low quality copper coins called bitasen. The use of bitasen is not reported in a systematic pattern in the sources. Nominal prices recorded for transaction using low quality coins are up to four or five times higher than in the Rekihaku-Toji series. The KKB dataset is of however useful because it also provides some information on rice prices for 1574-1603 in the newly introduced silver coins, which will allow us to link with series in silver starting in the early 17th century (Figure 6).30 KKB rice price data in silver coins are also processed and combined with other sources to generate a continuous series in grams of silver per kg of rice (see online appendix for a detailed presentation of data sources and estimation procedures). The composite rice price series in silver (gram per kg of rice) can be linked to the price series in copper coins by relying of the exchange rate of the early 17th century, i.e. 50 silver monme for 4000 coins.
Figure 6. Composite rice price series 1600-1860 in gram of pure silver per kg
Spikes related to famines31, but also long swings can be observed in cooper coins rice price series. An upward trend is observed between 1390 and 1430, which is the core of the period described by Farris (2006, 101) as the Muromachi Optimum (1370-1440). Our conjecture is that the rising rice prices during the period 1390-1430 could be due to a monetary phenomenon: an increase in the volume of copper coins circulated (either imported from China or locally produced). However, the historiography is mute on these issues. A long downward price trend is observed between 1430 and 1540. Our interpretation is that it reflected a rise in land and labor productivity 30 Silver monme of 3.75 grams, with silver content of around 3.5 grams. 31 Widespread famines explain the spikes in 1428, 1437, 1460, 1511, 1519, and local ones in1393, 1412, 1423, 1482-83, 1485, 1491, 1526-30, and 1538 (Farris 2006, 106-107, 175-176). Information regarding the years and localization of famines is reported in Kikuchi (1997), Nakajima (1976), and Saito (1966).
0
1
2
3
4
5
6
1600 1620 1640 1660 1680 1700 1720 1740 1760 1780 1800 1820 1840 1860
Retail price per kg (grams of pure silver)

This version: 15/01/2014
12
resulting in an increase of rice and wheat output and therefore of the volume of transaction, whereas the volume of copper coins circulated remained stable. Kito (1996, 2000) estimates that Japan’s total population increased from about 6.8 millions ca. 1150 to 12.2 in 1600, and that demographic growth was particularly strong in the Kinai region during the same period, from around 0.5 to 2.3 millions.32 This implies that Japanese food supply increased more rapidly than population as a result of the diffusion of improvement of irrigation techniques for paddy fields and the diffusion of double cropping (rice in summer and wheat or barley in winter). During the period of downward trend 1430-1560, prices went down by around half. In a simple application of the quantitative theory of money, assuming that the economic structure, along with a stable quantity of money circulated and velocity of circulation remain, the doubling of output is consistent with decline of nominal prices by half.
Regarding the Tokugawa period, the well-known rise of rice price of the early 16th century has been identified as a consequence of the massive increase of silver metal mined in Japan from the late 16th century. It is estimated that Japanese silver accounted for around 30 percent of the world output put in circulation between 1570 and 1700 (Yamamura & Kamiki 1983). The 17th century, that is the first phase of Tokugawa rule, also witnessed a rapid increase in cultivated acreage and a quasi-doubling of total population, to around 30 millions circa 1700 (Kito 1993, 2000). Prices were again on an upward trend between circa 1780 and 1860, a period during which Japanese population and the grain production remained rather stable. This period witnessed however a rapid development of cash crop and handicraft production. The volume of transactions therefore increased steadily in a context of quasi autarky and stable volume of silver and gold currency circulated.
We can also observe, from the period of downward price trend 1430-1540, a long-term decline in rice price volatility, suggesting a lower severity of famines triggered by crop failures. The coefficient of variation (CV) in Rekihaku series (yearly averages) for three 100-year sub-periods: the CV is 0.46, and 0.32 in 1360-1459 and 1460-1559, respectively (observations available for 75 and 61 years, respectively). Similar results are obtained with the Toji series. This is consistent with the fact that Kyoto’s food provision improved gradually from the mid-15th century.33 The levels of rice price volatility measured in the period 1460-1559 (CV of 0.32) can be compared wheat price volatility in Europe. It appears volatility in Kyoto was lower from the mid15th century than wheat price volatility in Europe, an indication of lower exposure of lower income consumer to exogenous shocks in Kyoto than in European cities. 34 This can be regarded as evidence of well functioning markets. The coefficient of variation of rice price further declined much after the installation of the Tokugawa shogunate: 0.35 in 1610-1659, 0.27 in 1660-1709. The situation deteriorated in the period 1710-1759 (CV of 0.43), a period of stagnation of population and rice output associated with severe famines. But rice price volatility declined again during the last century of Tokugawa rule that witnessed the development of cash crop production and handicrafts, to 0.29 in 1760-1809, and 0.26 in 1810-1859, respectively, although spikes associated with famines persisted.35
We can now combine rice prices and nominal wages to generate annual rice wages series, and include also additional information available for the late 16th and early 17th century on wages directly paid in rice. It is well known that grain wages do not indicate a purchasing power or a
32 Unfortunately, available population estimates do not provide any intermediate figure between 1150 and 1600. 33 In time of famine, commoners used to move to the surrounding mountains in search of emergency food. However, during the famine of 1440-42, for the first time in history, migrants moved into Kyoto “begging through the city and assembling in wealthy zen temples“ (Farris 2006, 111). 34 Rice price volatility was low in Japan in comparison with historical references of wheat price volatility in the West from ancient Mesopotamia to the early middle age; in particular, for the period 1460-1559, price volatility was much lower in Kyoto than in Egypt, Syria, Istanbul, and even slightly lower than in Italy (van Leeuwen et al. 2012). 35 In particular the recurrent crop failure in the 1830s (Tenpo famine, named after the imperial era starting in 1830), resulting in a widespread famine culminating in 1837.

This version: 15/01/2014
13
living standard, and may be a poor guide if changes in relative prices of consumer goods occurred. However, due to the change in monetary system in the late 16th century, rice wages are useful for linking with pre-1600 and Tokugawa period series. It should be noted that, up to the mid-16th century, the variation is entirely due to changes in rice prices since nominal wages were stable. Rice wages reached a all time peak of 18 kg around 1540 for highly skilled workers and 9 for semi-skilled (the 100 and 50 copper coins layers, respectively). Rice wages declined slightly in the mid 16th century: around 18 kg and 15 kg for highly skilled workers ca. 1540 and 1560 respectively. Since the skill premium structure remained unchanged until the mid-16th century, this implies that unskilled workers received the equivalent of 1.8, and 1.5 kg in the respective benchmark periods (ca. 1540 and 1560). Grain wages of skilled workers in Kyoto ca. 1560 were comparable to European levels: daily wages were equivalent to 18.5 and 8.5 kg of wheat in London and Florence, respectively. However, unskilled workers in Kyoto received much lower grain wages than for their European counterparts; the averages for the period 1550-1570 were 13 kg and 4.7 kg wheat in London and Florence, respectively.36
In the period 1560-1860, changes in rice wages result from the combined effects of price movements, variations in unskilled nominal wages, and declining skill premium. Information based on wages directly paid in rice indicates that the standard daily wage rate of skilled workers went down to around 12 kg rice in the 1590s. Scattered data suggest around 12 kg for highly skilled carpenters and 8 kg for skilled workers in the 17th century. Information available from Mitsui book accounts for Kyoto indicates nominal wages in silver equivalent to around 7 kg rice in 1746-1759. But labor reward went down afterward, in line with the decline in the skill premium. The daily rate, including in-kind component, was worth 5.5 kg rice in 1792-1817 and 4.05 kg in Kyoto around 1850 (average 1845-1855). In the meantime, rice wage of unskilled workers remain fairly stable over time. Nominal wages were equivalent to 1.8 kg at their apex ca. 1540 and to 1.5 kg ca. 1560. A temporary rebound is observed during the Tokugawa period at around 1.8 kg in 1746-59 in Mitsui account book records in Kyoto. The following decline was more limited than for skilled workers. Unskilled rice wages were at around 1.7 kg in 1792-1855, and 1.5 kg in mid-19th century (1.47 on average 1845-1855). Estimation of real wages based on respectable and bare-bone baskets ca. 1560 and 1850
Due to international and intertemporal differences in relative prices, grain wages provide only a very crude measure of well-being, It is therefore necessary to calculate the price of consumption baskets to assess changes in living standards in Kyoto and to compare with other parts of the world. Since an extremely high skill premium existed in Kyoto until at least the 17th century, it is preferable to use different types of baskets for skilled and unskilled workers. In order to facilitate international comparisons, the consumption expenditures are calculated using basket compositions equivalent to those used in Allen et al. (2011, Table 5), with a ‘bare bones’ basket for unskilled workers and a ‘respectable basket’ for skilled workers. Welfare ratios are calculated for what can be regarded as a representative household with a total consumption equivalent to 3 adults equivalent and a total income assumed equal to 250 daily wages per year. Both baskets used in this study have an average daily content of 1940 kcal and 80 grams of protein.
The choice of the first benchmark year for the calculation of the cost of baskets, ca. 1560, is essentially dictated by the availability of quantitative information; very few price data for non-staple items are available before the mid-16th century, and is also the case from the mid-17th to the mid-18th century. Nevertheless, the period around 1560 also has attractive features: first, it immediately follows the historical apex, in the first half of the 16th century, of rice wage received by
36 Averages 1550-1560 calculated on the basis of underlying data used in Allen (2001).

This version: 15/01/2014
14
skilled and unskilled workers, but is significantly lower37, which means that the calculation does not bias in favor of Japanese living standards; second, it correspond to the period of the first contacts with Europeans, and of the description of Japan by Alessandro Valignano as one of the poorest and most barren countries in all the Orient, which means that this qualitative statement can be checked on the basis of quantitative information. For the second benchmark year, we selected the period around 1850 that has two main advantages: first, it is a period of relative economic, social, and political stability after the miseries of the Tenpo famine (1830-1837), but before the beginning of the opening of Japan to international trade (Ansei treaties of 1858) that resulted in inflationary trends in silver terms, along with drastic changes in relative prices; second, the availability of unit-price data increased markedly after the turn of the 19th century.
The calculation of welfare ratios is presented in table 1 and 2, for skilled and unskilled workers, respectively. The two baskets differ markedly in terms of composition. It should be noted that the respectable basket reflects the consumption of well-to-do households of the 19th century, and of the social elite in the 16th century. In particular, processed food such as soybeans paste and sauce (miso and shoyu), edible oil, and noodles, which were very expensive items ca. 1560, were commonly consumed by Buddhist monks. A similar diet for carpenters, who were involved in construction and repair of religious buildings, is consistent with high rice wages and high skill premium. The basket also includes candles that were luxury items in the 16th century. The basket is also highly respectable as it includes a large quantity of fish, which allows reaching a daily protein content of 80 grams per adult; 26 kg per year is nevertheless plausible since fish was a rather affordable source of protein in well-provisioned urban areas. It is well documented that the diet of commoners was based on rice, vegetables, and fish in the 16th century (Watanabe 1982), and remained so in the 20th century.
The bare-bones basket, by contrast, does not include any rice nor processed food. Small luxuries are restricted to modest quantities of fish and edible oil, and the basket contains neither egg nor alcohol, as in the bare-bones basket used by Allen et al. (2011). The basket includes exclusively staple grains such as barley, millets, and buckwheat that, albeit cheaper than rice, have higher protein content, and a comparatively large quantity of unprocessed soybeans; this allows reaching a protein content of 80 grams. Some salt is included because it reflects a physiological requirement and, also for the sake of consistency, to compensate for the exclusion of soy paste and sauce (in the European basket, a sizable salt content is included in cheese). Since candles were luxury items, it is assumed that oil is used for lighting.
Prices and wages were measured in copper coins ca. 1560 and in silver in 1850. Since there is there is no silver to copper coins exchange rate for 1560, rice is used as a common currency for both benchmarks. Wages in 1560 are calculated as the average for the period 1550-1570 (50 and 10 copper coins for skilled and unskilled workers, respectively). Price data for non–rice items ca. 1560 were computed from individual transactions recorded in copper coins, silver, and rice equivalent in KKB (1962) in the period 1530-1590. All unit-prices were converted in rice terms and average unit-prices were calculated. Overall, unit-prices expressed in rice terms were relatively stable throughout that period. Similarly, average wages and unit-prices for 1845-1855 were used for 1850 (detail information on data sources and calculation procedures in presented in the online appendix).
The results presented in table 1 show that, even with a respectable basket reflecting food consumption patterns of the social elite of the 16th century, the welfare ratio of skilled workers was above unit ca. 1560. This implies than their purchasing power allowed them to provide for the needs of three adults equivalent, i.e. a family. However, an international comparison reveals that their welfare ratio was in the lower range of welfare ratios estimated by Allen (2001) for European cities in the second half of 16th century, and remained so in the mid 19th century (close or slightly above
37 Around 1.5 and 7.5 kg rice for unskilled and skilled workers earning 10 and 50 copper coins, repectively ca. 1560, against 2 and 10 around 1520.

This version: 15/01/2014
15
German cities ca. 1560, lower than in Italy ca. 1850).38 Although rice wages of skilled workers were almost reduced by half between 1560 and 1850, their welfare ratio declined only slightly and remained close to one.
Table 1. Respectable consumption in kg rice in Kyoto circa 1560 and 1850 (per adult per year) Consumption
per year Unit price in kg rice ca. 1560
Expenses in kg rice ca. 1560
Unit price in kg rice ca. 1850
Expenses in kg rice ca. 1850
Rice 80 kg 1.0 80 1 80 Sake 49 l 1.66 81.3 1.13 55.4 Noodles 12 kg 8.0 96.0 1.5 18.0 Fish 26 kg 0.83 21.7 1.16 30.2 Miso paste 20 kg 1.86 37.2 1.04 20.8 Soybeans 36 kg 0.8 28.8 1.26 45.4 Shoyu 3 l 7.8 23.4 0.61 1.8 Eggs 52 units 0.16 8.3 0.16 8.3 Edible oil 5.2 l 13.0 67.6 3.26 17.0 Textile 5 sq. m 4.1 20.5 3.0 15.0 Candles 2.6 kg 30.0 78 8.26 21.5 Soap 2.6 kg 0.5 1.3 0.5 1.3 Burning wood 5 MBTU 0.04 (per kg) 13.0 0.12 (per kg) 38.9 Total in kg rice 557 353 Skilled wages (kg rice per day) 7.5 4.05 Welfare ratio of skilled workers 1.12 0.95 Welfare ratio of unskilled workers 0.22 0.35 Source: see text and appendix.
The measurement of wages and unit-prices for non-rice items in kg of rice allows a direct identification of changes in relative prices for food and non-food processed items relative to rice. The result is a sizable decline in the total price of the respectable basket that is only partly offset by the rising price fish and burning wood, which is consistent with the pressure on natural resources induced by the doubling of Japanese population in the 17th century, that remain at a plateau of around 30 millions up to the second half of the 19th century. By contrast, the price of the bare-bone basket that includes mostly basic foodstuffs remained stable.
The drastic decline, between 1560 and 1850, in the price of superior food items and of non-items consumed almost exclusively by well-to-do households is apparently comparable to the trend identified for Europe by Hoffman et al. (2002). In both Europe and Japan, this decline indicates that the combined effects of technological changes and the division of labor resulted in a Smithian growth that more rapid in the cottage industry than in agriculture, particularly in the food processing and textile industries. However, the changes in relative prices of processed goods only partly offset the drastic fall in absolute level of rice wages received by carpenters, resulting in lower welfare ratios in 1850 than in 1560. Although there is currently no quantitative estimates of the labor force employed in handicraft and cottage industry ca. 1560 and 1850, the rise in the urbanization ratio in the 16th and 17th century implies that a larger number of workers reached the income level of skilled workers. More importantly, the development of rural cottage industry in the second half of the
38 With a welfare ratio twice as high, i.e. 2.24 ca. 1560, highly skilled workers earning in Kyoto 100 copper were much better off; their living standard was in the highest range of European level of the time, close to the top, Antwerp with 2.26 on average for 1550-1599 (Allen 2001). But this was the standard wage of European skilled workers who earned only around twice as much as unskilled workers in their respective European cities.

This version: 15/01/2014
16
Tokugawa period allowed rural households to supplement their agricultural income with non-agricultural revenues undertaken as secondary occupation (Smith 1973, Saito 2005).
Table 2. Bare bone consumption in kg rice in Kyoto circa 1560 and 1850 (per adult per year) Consumption
per year Unit price in kg rice ca. 1560
Expenses in kg rice ca. 1560
Unit price in kg rice ca. 1850
Expenses in kg rice ca. 1850
Non rice staples 148 kg 0.44 68.2 0.5 77.5 Fish 3 kg 0.83 2.5 1.46 3.5 Soybeans 24 kg 0.8 23.2 1.26 36.5 Salt 1 kg 1.18 1.2 0.4 0.2 Edible oil 3 l 13.0 39.0 3.26 9.8 Textile 3 sq. m 4.1 12.3 3.0 9.0 Lamp oil 1.3 kg 13.0 16.9 3.26 4.2 Soap 1.3 kg 0.5 0.7 0.5 0.7 Burning wood 3 MBTU 0.04 (per kg) 7.8 0.12 (per kg) 23.3 Total in kg rice 172 165
Unskilled wages (kg rice per day) 1.5 1.47
Welfare ratio of unskilled workers 0.73 0.74 Source: same as Table 2.
In the meantime, the quasi-stagnation of both rice wages for unskilled workers and bare-bones basket prices resulted in welfare ratios almost identical in 1560 and 1850, well below one and much lower than welfare ratios calculated for European cities (Allen 2001) using a basket comparable to the respectable basket presented in Table 1 instead of the one used in table 2. Even if we consider the possibility that some undocumented in-kind component existed in addition to the 10 copper coins daily wage received by unskilled workers ca. 1560 (this was not the case in 1850), the welfare ratio would be at best close to unit with a daily allowance equivalent to half a kg rice per day worked, and only with a bare bone basket.
The implication is that unskilled workers who were either permanent urban resident unable to support a family or, more plausibly, rural residents working temporarily in urban areas in order to obtain cash income supplementing the revenues from agricultural activities. It should be noted that the decline in the relative prices of processed items between 1560 and 1850 also benefited unskilled workers to some extent. With a welfare ratio of 0.35 in 1850, measured using the respectable basket against 0.22 in 1560 (Table 1), the revenue of an unskilled workers became sufficient to support one adult consuming superior goods, or to allow a partial substitution, with small quantities of processed foodstuffs or a larger quantity of textile, in the case of rural resident who joined temporarily the urban labor market.
Although very few non-rice price data are available before 1550, we could consider some implications of these findings for the period 1360-1560. The welfare ratios of the mid-16th century presented in tables 1 and 2 were calculated with rice wages of around 7.5 kg per day for skilled workers (15 for highly skilled workers), and 1.5 kg rice for unskilled workers. Rekihaku price data for staples suggest a stability of non-rice grain prices relative to rice in the 15th century and early 16th century. This implies that the welfare ratio of unskilled workers measured using subsistence baskets was below 0.5 in the early 15th century when 10 copper coins were worth only 1 kg and was close to unit in the early 16th century when the same nominal wage was worth 1.8 kg rice.
Similarly, the welfare ratio of skilled workers was well below unit in the early 15th century when daily rice wages were at around 5 kg for skilled workers (and 10 for highly skilled workers). Although prices for food and non-food processed goods are almost inexistent before 1550, it could be argued that unit-price relative to rice were probably higher for these items in the early 15th century, which implies that welfare ratios calculated using a respectable baskets were probably

This version: 15/01/2014
17
below unit for skilled workers earning 50 copper coins. From this viewpoint, the period of rising rice wages between the early 15th and mid-16th century resulted in a first escape from poverty, albeit admittedly a limited one since their living standards remained low by the European standards of the time. Conclusion
This paper offers a first investigation of long-term trends in Japanese living standards from the mid-14th to the mid-19th century using urban daily wages and price data for a number of basic commodities, allowing a comparison with Europe. The result indicates that, as far as urban wage earners are concerned, pre-Tokugawa Japan was indeed poor and barren in comparison to Europe around 1560 as suggested by Alessandro Valignano’s description. Welfare ratios of skilled workers were in the lower range of European levels in 1560, and well below the level of their European counterparts for unskilled workers.
Nevertheless, these living standards reflect significant improvements in comparison with the early 15th century. Urban rice wages were on a steady upward trend between the early 15th and the mid-16th century, a consequence of declining rice prices in a context of stable nominal wages, and this was associated with a drastic reduction in price volatility. It is notable that these changes did not occurred during the period that has been described by Farris as Muromachi optimum, but afterward, during the Warring Kingdoms period, in a context of political fragmentation.
Our interpretation is that the improvement in living standards observed between the early 15th and the mid-16th century has been mostly driven by the rise in land and labor productivity in agriculture resulting from initiatives by local lords to improve irrigation and drainage as a way to permit the diffusion of double cropping, and ultimately to increase the volume of taxable surplus. A rise in agricultural output more rapid than population growth lifted unskilled workers above subsistence level and allowed skilled workers to consume food and non-food items requiring extensive processing. During that period, both groups experienced therefore an escape from poverty, absolute and relative, respectively.
From an initial situation of extremely large difference in nominal wages, the skill premium declined by half between the 16th and the 19th century. The fall in rice wages of skilled workers was largely offset for by changes in relative prices. Living standards of skilled workers in Kyoto remained in the lower range of European cities ca. 1850, but the declining price of processed food and non-food items relative to rice and other staples made small luxuries such as sake, shoyu, and miso paste affordable to a larger share of the population, while creating new opportunities for rural households to expand their activities in cottage industry (Smith 1973, Saito 2010). The skill diffusion of the 16th and 17th century therefore initiated a process that led to the Smithian growth and a contraction of income inequalities that accelerated in second half of the Tokugawa period

This version: 15/01/2014
18
References Allen, Robert C. The Great Divergence in European Wages and Prices from the Middle Ages to the First
World War. Explorations in Economic History, 38, (2001), 411-447 Allen, Robert, Bassino, Jean-Pascal. Ma, Debin, Moll-Murata, Christine, and van Zanden, Jan Luiten
(2011). Wages, Prices, and Living Standards in China, Japan, and Europe, 1738-1925. Economic History Review.
Bassino, Jean-Pascal and Debin Ma. Japanese unskilled wages in international perspective 1741-1913, Research in Economic History, (2005), 229-248.
Boserup, Esther, The Conditions of Agricultural Growth: The Economics of Agrarian Change under Population Pressure, London, 1965.
Boxer, Charles R. The Christian Century in Japan, Berkeley: University of California Press, 1951. Braga, Jose Maria. The Panegyric of Alexander Valignano, S.J, in Monumenta Nipponica, 5(2), 1942, 523-
535. Broadberry, S. and Gupta, B. “The Early Modern Great Divergence: Wages, Prices and Economic
Development in Europe and Asia, 1500-1800”, Economic History Review, 59, 2-31, 2006. Cooper, Michael. They Came to Japan. Berkeley: University of California Press, 1965. Currency Museum (Institute for Monetary and Economic Studies of Bank of Japan). ed., Umi wo koeta
chusei no okane [The medieval currency that crossed the sea]. Tokyo: Currency Museum, 2009. Elvin, Mark. The Pattern of the Chinese Past. Stanford: Stanford University Press, 1973. Endo, Motoo. Shokunin no rekishi [History of craftsmanship]. Tokyo: Shibundo, 1956. Epstein, S.R. Freedom and Growth: the Rise of States and Markets in Europe, 1300-1750. London,
Routledge, 2000. Farris, William W. Diseases of the premodern Period in Japan, 500-1600, in K. Kiple, ed., The Cambridge
history and geography of human disease. Cambridge: Cambridge University Press, 1993, 376-385. Farris, William W. Japan’s medieval Population; Famine, Fertility, and Warfare in a Transformation Age.
Honolulu: Hawai’i University Press, 2006. Farris William W. Japan to 1600; a social and economic history. Honolulu: Hawai’i University Press, 2009. Frankema, Ewout and Van Waijenburg, Marlous. Structural impediments to African growth? New evidence
from real wages in British Africa, 1880-1965. Journal of Economic History, 2012, 72(4) 895-926. Hayami, A. Population changes. In Jansen, M., Rozman, G. (eds), Japan in Transition. Princeton, Princeton
University Press, 1986, 380-397. Hoffman, Philip T., Jacks, David S., Levin, patricia A., Lindert, Peter H., Real inequality in Europe since
1500. Journal of Economic History, 62(2), 322-355. Hogetsu, Keigo. Chusei Ryosei shi no Kenkyu [Studies on metrological history in the medieval Japan].
Tokyo: Yoshikawa Kobunkan, 1961. Hori, Kyotsu. The economic and political effects of the Mongol wars, in Medieval Japan: essays in
institutional history, edited by John W. Hall & Jeffrey P. Mass. New Haven: Yale University Press, 1974. Hoshino, Takao. Edoki gokaido jinba chinginshi Hoei nekan made [Rates for porters and horses on the five
main roads in Edo period until the Hoei era], Musashi Daigaku Ronshu [Musashi University Review], Festschrift in honor of Professor Saburo Kato, January, 2001, 155-203.
Itani, Tomio and Masami Ogawa. Waga kuni ni okeru akagome saibai no rekishi to saikin no kenkyu josei [History and recent trends of red rice in Japan], Nihon sakumotsu gakkai kiji [Japanese Journal of Crop Science], 73 (2), 2004, 137-147.
Iwahashi, Masaru. Kinsei Nihon bukka shi no kenkyu [Studies on price history in early modern Japan]. Tokyo: Ohara Shinsei Sha, 1981.
Kamiki, Tetsuo. Chusei koki ni okeru bukka hendo [Price fluctuations in the late medieval Japan], Shakai Keizai Shigaku [Socio Economic History], 34(1), 21-38, (Reprint in) Nihon chusei shohin ryutsu shiron [History of commerce in medieval Japan], Tokyo: Yuhikaku, 1969, 218-237.
Kikuchi, I. Kinsei no kikin [Famines in Early Modern Japan]. Tōkyō, Yoshikawa Kobunkan, 1997. Kito, Hiroshi. Jinko kara yomu Nihon no rekishi [Japanese history from a demographic viewpoint]. Tokyo:
Kodansha, 2000. Kito, Hiroshi. Nihon nisen nen no jinko shi [Two thousand years of Japanese population history]. Tokyo:
PHP Paperbacks, 1983.

This version: 15/01/2014
19
Kito, Hiroshi. Meiji izen Nihon no chiiki jinko [Regional population in Japan before Meiji era; an estimation]. Jochi Keizai Ronshu, 41(1.2), 1996, 65-79.
Kuroita, Katsumi eds. Engishiki chu-hen [Procedures of the Engi Era; middle part], Tokyo: Yoshikawa Kobunkan, 1952, 601-602.
Kyoto Daigaku Kinsei Bukka Kenkyukai (KKB). 15-17 seiki ni okeru bukka hendo no kenkyu [Research on the price variations in 15th-17th century], Kyoto: Tokushikai, 1962.
Mitsui Bunko eds. Zoho kaitei kinsei koki ni okeru shuyo bukka no dotai [Trends of Major Prices in Early Modern Japan; revised edition]. Tokyo: Tokyo Daigaku Shuppankai, 1981.
Mitsui Bunko eds. Kinsei koki ni okeru shuyo bukka no dotai [Trends of Major Prices in Early Modern Japan]. Tokyo: Nihon gakujutsu shinkokai, 1952.
Mokyr, Joel, The Lever of Riches: Technological Creativity and Economic Progress. New York, 1990. Momose, Kesao. Muromachi jidai ni okeru beikahyo [Rice price tables for Muromachi period], Shigaku
Zasshi [Journal of Historical Science], 66 (1), 1959, 58-71. Moran, Joseph F. The Japanese and the Jesuits; Alessandro Valignano in sixteenth-century Japan. London:
Routledge, 1993. Nakajima Y. Kikin Nihon Shi [Famines in Japanese History]. Tōkyō, Yuzankaku Shuppan, 1976. Nishikawa, S., Odaka, K. and Saito, O. eds. Nihon keizai no 200 nen [200 years of Japanese economy].
Tokyo: Nihon hyoronsha, 1996. Oishi, Shinzaburo. ed., Jikata hanreiroku [Comprehensive guide to the local officers]. Tokyo: Kondo
shuppansha, 1969. Ohnuki-Tierney, Emiko. Rice as Self; Japanese Identities through Time. Princeton: Princeton University
Press, 1993. Oyaizu, Noburo, Kinsei chingin bukka shi shiryo [Material on early modern prices and wages].. Aichi:
Seikosha, 2006. Özmukur, Süleyman and Pamuk, Sevket. Wages and standard of living in the Ottoman Empire, 1489-1914.
Journal of Economic History, 2002, 62, 2, 293-321. Pamuk, Sevket. Urban wages around the Eastern Mediterranean, 1100-2000. Research in Economic History
(2005), 209-228. Rekihaku (2004). Chudai chusei toshi seikatsushi (bukka) [Ancient and Medieval Urban Life (Prices)].
Database of the National Museum of Japanese History (Rekishi Hakubutsukan). http://www.rekihaku.ac.jp/doc/t-db-index.html.
Saito, Osamu. “The labor market in Tokugawa Japan; wage katsushi (bukka) differential and the real wage level.” Explorations in Economic History, 15 (1978), 84-101.
Saito, Osamu. “Wages, inequality, and pre-industrial growth in Japan, 1727-1894.” In Living standards in the past, new perspectives on well-being in Asia and Europe, edited by Robert Allen, Tommy Bengtsson and Martin Dribe eds.77-97. Oxford: Oxford University Press, 2005.
Saito, Osamu. All poor, but no paupers: a Japanese perspective on the Great Divergence. Leverhulme Lecture, University of Cambridge (February), 2010.
Saito, R. Fukenbetsu Nenbetsu Kisho Saiga Hyo [Annual Prefecture-Level Tables of Climate and Natural Hazards]. Tōkyō, Chijin Shoin, 1966.
Sakurai, Eiji. Nihon chusei no keizai kozo [Economic structure in medieval Japan]. Tokyo: Iwanami Shoten, 1996.
Sakurai, Eij and Nakanishi, Satoshi. eds., Shin taikei Nihonshi 12 Ryutsu keizaishi [New systemic Japanese history vol.12; History of distribution]. Tokyo: Yamakawa Shuppansha, 2002.
Sakuraki Shinichi. Shutsudo zenika kara mita chusei kahei ryutsu, [Circulation of currency in the medieval Japan from the viewpoint of unearthed bronze copper coins]. In Kahei no chiiki shi [Regional History of Currency], edited by Kimio Suzuki, 41-80. Tokyo: Iwanami Shoten, 2007.
Sasaki, Ginya. Chusei shohin ryutsushi no kenkyu [Research on the history of distribution in medieval Japan]. Tokyo: Hosei daigaku shuppankyoku, 1972.
Sawada, Goichi. Nara cho jidai no minsei keizai no suteki kenkyu [Quantitative studies on civil administration and economy in Nara dynasty]. Tokyo: Fuzanbo, 1927.
Smith, T.C., Pre-modern economic growth: Japan and the West, Past and Present, 60, 1973, 127-60. Tanaka, Koji. Kahei ryutsu kara mita 16 seiki no Kyoto [Kyoto in the 16th century from the viewpoint of
money circulation], in Kimio Suzuki ed., Kahei no chiiki shi [Regional History of Currency], 83-124. Tokyo: Iwanami Shoten, 2007, 83-124.

This version: 15/01/2014
20
Valignano, Alessandro. Historia del Principio y Progresso de la Compania de Jesus en las Indias Orientales, 1542-1564 [History of the Beginnings and Progress of the Society of Jesus in the East Indies, 1542-64], 1584 (Reprint edited by Josef Wicki s.i., Rome, 1944).
Van Leeuwen, Bas, Foldvari, Peter, Van Zanden, Jan Luiten. Long-run patterns in market efficiency and the genesis of the market economy; Markets around the Mediterranean from Nebuchadnezzar to Napoleon (580 BC and 1800AD). Paper presented at the World Economic Hustory Congress, Stellenbosch (2012).
Van Zanden, Jan Luiten. The skill premium and the ‘Great Divergence’. European Review of Economic History, 13 (2009), 121-153.
Watanabe, Tadashi. Hoyaku Nippo jisho wo toshite mita Azuchi-Momoyama jidai no shokuseikatsu [Eating habits in the Azuchi-Momoyama period from information reported in the Japanese-Portuguese dictionary], Soai joshi daigaku Soai joshi tanki daigaku kenkyu ronshu, kokubun kaseigakuka hen (1982), vol. 29, 96-87.
Yamamura, Kozo, Kamiki, Tetsuo. 1983. Silver mines and Sung coins: A monetary history of medieval and modern Japan in international perspective. In J. F. Richards ed. , Precious Metals in the Later Medieval and Early Modern Worlds. Durham, NC: Duke University Press (1983), 329-62.