proxy season - fenwick & west llp€¦ · in the 2016 proxy season, ... $235b and $75b,...
TRANSCRIPT

2016 proxy season
Corporate Governance Practices and TrendsA Comparison of Large Public Companies and Silicon Valley Companies

fenwick & west llp fenwick & west llp
contents
Overview 1
Equity Ownership by Executives and Directors 4
Voting Power Ownership by Executives and Directors 6
Board Size and Meeting Frequency 8
Insider Directors 10
Board Leadership 13
Board Diversity 16
Audit Committee Size and Meeting Frequency 23
Compensation Committee Size and Meeting Frequency 25
Nominating Committee Size and Meeting Frequency 27
Other Standing Committees 29
Majority Voting 31
Classified Board 32
Dual-Class Voting Stock Structure 33
Stock Ownership Guidelines 34
Stockholder Proposals 36
Executive Officers 39
Methodology 42
About the Firm 49
About the Author 49

fenwick & west llp fenwick & west llp
Corporate Governance Practices and TrendsA Comparison of Large Public Companies and Silicon Valley Companies
Fenwickfenwick & west llp
2016
pr
oxy
sea
son
Overview
Corporate governance practices vary significantly among public companies. This is a reflection of many
factors, including:
�� Differences in the stage of development of companies, including the relative importance placed on
various values (for example, focus on growth and scaling operations may be given more importance);
�� Differences in the investor base for different types of companies;
�� Differences in expectations of board members and advisors to companies and their boards, which
can vary by size, age of company, stage of development, geography, industry and other factors; and
�� The reality that corporate governance practices that are appropriate for large, long-established public
companies can be meaningfully different from those for newer, smaller companies.
Since the passage of the Sarbanes-Oxley Act of 2002, which signaled the initial wave of corporate governance
reforms among public companies, Fenwick & West has surveyed the corporate governance practices of the
companies included in the Standard & Poor’s 100 Index (S&P 100) and the technology and life sciences
companies included in the Silicon Valley 150 Index (SV 150) each year.
In this report, we present statistical information for a subset of the data we have collected over the years,
updating for the 2016 proxy season. These include size and number of meetings for boards and their primary
committees, the number of insider directors, board leadership makeup, majority voting, board classification
and use of a dual-class voting structure, as well as the frequency and number of stockholder proposals. We
have also included data covering the number of women on boards of directors, stock ownership guidelines
for executive officers and directors and additional information about committees beyond the primary
committees. In each case, we present comparative data for the S&P 100 companies and for the technology
and life sciences companies included in the SV 150, as well as trend information.

Corporate Governance Practices and TrendsA Comparison of Large Public Companies and Silicon Valley Companies 2016 proxy season
2
fenwick & west llp
Governance practices and trends (or perceived trends) among the largest companies are generally presented
as normative for all public companies. Fenwick & West collects information regarding public company
governance practices to enable boards and companies in Silicon Valley to understand the actual corporate
governance practices among their peers and neighbors, and understand how those practices contrast with
practices among large companies nationally.
In the 2016 proxy season, there were approximately 275 public technology and life sciences companies1 in
“Silicon Valley,” of which the SV 150 captures those that are the largest by one measure — revenues.2 The
2016 constituent companies of the SV 150 range from Apple and Alphabet with revenue of approximately
$235B and $75B, respectively, to FibroGen and TubeMogul with revenue of approximately $181M each,
respectively, in each case for the four quarters ended on or about December 31, 2016. Apple went public in
1980, Alphabet (as Google) in 2004, and FibroGen and TubeMogul, each in 2014. Apple and Alphabet’s peers
clearly include companies in the S&P 100, of which they are also constituent members (eight companies
were constituents of both indices for the survey in the 2016 proxy season), where market capitalization
averages approximately $142B.3 FibroGen and TubeMogul’s peers are smaller technology companies that
went public more recently and have market capitalizations well under $1B. In terms of number of employees,
the SV 150 averages 9,535 employees (with a median of 1,803 employees), ranging from Hewlett Packard
Enterprise with 240,000 employees spread around the world in dozens of countries to companies such as
Five Prime Therapeutics with 154 employees all in the United States, as of the end of their respective fiscal
years 2015. The S&P 100 averages approximately 150,000 employees and includes Wal-Mart with 2.3 million
employees in more than two dozen countries at its most recent fiscal year end. Compared to the S&P 100,
SV 150 companies are on average much smaller and younger, have lower revenue and are concentrated in
the technology and life sciences industries. As the graphs on pages 4 through 7 illustrate, SV 150 companies
also tend to have significantly greater ownership by the board and management than S&P 100 companies
(whether measured by equity ownership or voting power).
1 The number fluctuates constantly as some companies complete initial public offerings and others are acquired. As of October 7, 2016, Hoover’s includes 423 public companies in Silicon Valley (defined by the San Jose Mercury News as Alameda, Contra Costa, San Francisco, San Mateo and Santa Clara counties). Of the 423 public companies in Silicon Valley, we consider more than 275 of them technology or life sciences companies based on their “Line of Business” description from Hoover’s as well as their initial sources of funding. The number of Silicon Valley public companies is down from a high of 417 reached in 2000 during the dot-com era. See “Vanishing Public Companies Lead To The Incredible Shrinking Silicon Valley” (SiliconBeat February 17, 2010) and “Outside Silicon Valley, IPO Market Still in Drought” (Seeking Alpha May 14, 2011).
2 See the “Methodology–Group Makeup” section below for a more detailed discussion of the makeup of the SV 150 and the geography of Silicon Valley for its purposes, including footnote 18.
3 The average market capitalization of the SV 150 at the time of announcement of the current index list (see footnote 18) was approximately $19.6B, ranging from Aviat Networks at approximately $45M to Apple at approximately $604.3B with a median of $2.3B. The median revenue of the SV 150 for the four quarters ending on or about December 31, 2015 was approximately $815M. It is also worth noting that this year 30 SV 150 companies are also constituents of the S&P 500.
Overview (continued)
Corporate Governance Practices and TrendsA Comparison of Large Public Companies and Silicon Valley Companies 2016 proxy season
3
fenwick & west llp
While not specifically studied in this report, it is worth noting that the broad range of companies in the SV 150 (whether measured in terms of size, age or revenue) is associated with a corresponding range of governance practices. Comparison of governance practice statistics and trends for the top 154, top 505, middle 506 and bottom 507 companies of the SV 150 (in terms of revenue) bears this out.8 A few examples of such comparisons are included in this report. Additional comparison information of the top 15, top 50, middle 50 and bottom 50 companies of the SV 150 (as well as other data not presented in this report9) may be obtained by consulting your Fenwick & West Securities Partner.
4 The top 15 includes companies, eight of which are included in the S&P 100 (see footnote 28), with revenue of approximately $6.7B or more and market capitalizations averaging $152.3B, ranging from Synnex at approximately $3.7B to Apple at approximately $604.3B at the time of announcement of the current index list (see footnote 18).
5 The top 50 includes companies with revenue of approximately $1.6B or more and market capitalizations averaging $54.4B, ranging from Super Micro at approximately $1.6B to Apple at approximately $604.3B at the time of announcement of the current index list (see footnote 18).
6 The middle 50 includes companies with revenue of at least approximately $400M but less than approximately $1.5B and market capitalizations averaging $3.3B, ranging from Rocket Fuel at approximately $137M to Workday at approximately $3.9B at the time of announcement of the current index list (see footnote 18).
7 The bottom 50 includes companies with revenue of at least approximately $181M but less than $400M and market capitalizations averaging $979M, ranging from Aviat Networks at approximately $45M to Guidance Software at approximately $3.9B at the time of announcement of the current index list (see footnote 18).
8 Contrasting the top 15 or top 20 SV 150 companies (in the latter case, companies with revenue of approximately $5.6B or more and market capitalizations averaging $117.2B at the time of announcement of the current index list) against the remaining SV 150 companies is similarly enlightening (see footnote 18). In 2015, the SV 150 included 22 life sciences companies (broadly defined) and 128 technology companies. There are also some differences between technology and life sciences companies as groups within the SV 150.
9 Such as comparisons of the top 15 or top 20 SV 150 companies against the remaining SV 150 companies, comparisons of technology and life sciences companies as separate groups within the SV 150, or other details related to the topics covered in this report.
Overview (continued)

Corporate Governance Practices and TrendsA Comparison of Large Public Companies and Silicon Valley Companies 2016 proxy season
4
fenwick & west llp
Equity Ownership by Executives and Directors
The distribution of simple equity ownership skews higher among the technology and life sciences companies
in the SV 150 (average 10.3%) than among S&P 100 companies (average 2.8%).
The graphs below show the distribution of the percentage of simple equity ownership of the directors and executive officers of the companies in each of the SV 150 and the S&P 100 for the 2016 proxy season.
executive and director equity ownership — distributions
Overview (continued)
% equity ownership
% of companies
% equity ownership
% of companies
<1% 1- <10% 10- <25% 25- <35% 35- <50%
<1% 1- <10% 10- <25% 25- <35% 35- <50%
50%+
50%+
SV 1502016
S&P 1002016
1.0%1.0%5.0%
21.0%
72.0%
0.7%6.1%6.8%
17.7%
53.7%
15.0%
9thdecile
median
1st decile
9thdecile
median
Corporate Governance Practices and TrendsA Comparison of Large Public Companies and Silicon Valley Companies 2016 proxy season
5
fenwick & west llp
Equity Ownership by Executives and Directors (continued)
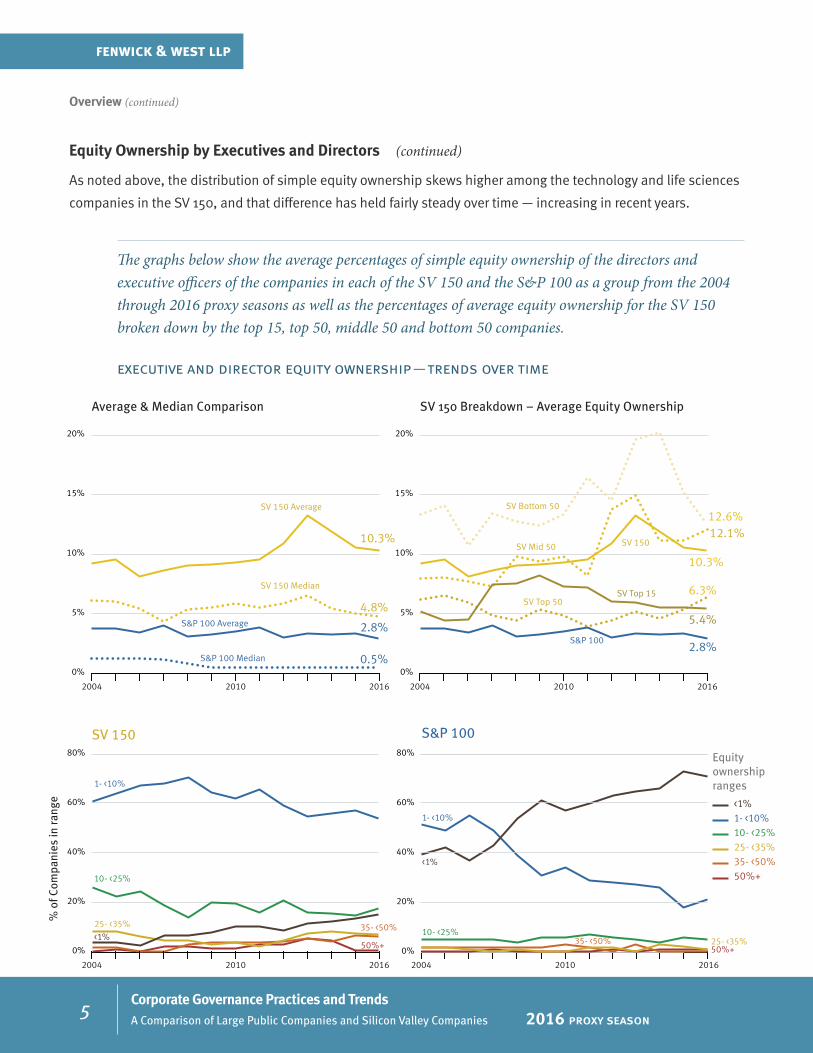
As noted above, the distribution of simple equity ownership skews higher among the technology and life sciences
companies in the SV 150, and that difference has held fairly steady over time — increasing in recent years.
The graphs below show the average percentages of simple equity ownership of the directors and executive officers of the companies in each of the SV 150 and the S&P 100 as a group from the 2004 through 2016 proxy seasons as well as the percentages of average equity ownership for the SV 150 broken down by the top 15, top 50, middle 50 and bottom 50 companies.
executive and director equity ownership — trends over time
Overview (continued)
2004 2010 2016
SV 150 Average SV Bottom 50
SV Mid 50
SV Top 15
SV 150
SV 150 Median
S&P 100 Median
S&P 100 Average
Average & Median Comparison SV 150 Breakdown – Average Equity Ownership
50%+35- <50%25- <35%10- <25%1- <10%<1%
50%+ 50%+
SV 150 S&P 100
10- <25%
10- <25%<1%
1- <10%
1- <10%
25- <35%35- <50%
35- <50%
% o
f Com
pani
es in
rang
e
Equity ownershipranges
<1%
S&P 100
SV Top 50
25- <35%
0%
20%
40%
60%
80%
0%
20%
40%
60%
80%
0%
5%
10%
15%
20%
4.8%
10.3%
0.5%
2.8%
0%
5%
10%
15%
20%
12.6%
10.3%
6.3%
5.4%
12.1%
2.8%
2004 2010 2016 2004 2010 2016
2004 2010 2016

Corporate Governance Practices and TrendsA Comparison of Large Public Companies and Silicon Valley Companies 2016 proxy season
6
fenwick & west llp
Voting Power Ownership by Executives and Directors
The distribution of voting power ownership skews higher among the technology and life sciences companies
in the SV 150 (average 14.2%) than among S&P 100 companies (average 4.8%).
The graphs below show the distribution of the percentage ownership of total voting power of the directors and executive officers of the companies in each of the SV 150 and the S&P 100 for the 2016 proxy season.
executive and director voting ownership — distributions
Overview (continued)
53.7%
% equity ownership
% of companies
% equity ownership
% of companies
<1% 1- <10% 10- <25% 25- <35% 35- <50%
<1% 1- <10% 10- <25% 25- <35% 35- <50%
50%+
50%+
SV 1502016
S&P 1002016
3.0%1.0%
3.0% 3.0%
19.0%
71.0%
8.2%4.8%6.1%
12.9%14.3%
1st decile
9thdecile
median
9thdecile
median

Corporate Governance Practices and TrendsA Comparison of Large Public Companies and Silicon Valley Companies 2016 proxy season
7
fenwick & west llp
Voting Power Ownership by Executives and Directors (continued)
As noted above, the distribution of voting power ownership skews higher among the technology and life sciences
companies in the SV 150, and that difference has held fairly steady over time — increasing in recent years.
The graphs below show the average percentages of ownership of total voting power of the directors and executive officers of the companies in each of the SV 150 and the S&P 100 as a group from the 2004 through 2016 proxy seasons, as well as the percentages of average voting ownership for the SV 150 broken down by the top 15, top 50, middle 50, and bottom 50 companies.
executive and director voting ownership — trends over time
Overview (continued)
SV 150 Average
SV 150 Median
S&P 100 Median
S&P 100 Average
Average & Median Comparison SV 150 Breakdown – Average Voting Ownership
SV 150
% o
f Com
pani
es in
rang
e
SV Bottom 50
SV Mid 50
SV Top 15
SV 150
S&P 100
SV Top 50
50%+
10- <25%
<1%
1- <10%
25- <35%50%+
10- <25%
1- <10%
25- <35%35- <50%
35- <50%
<1%
S&P 100
0%
20%
40%
60%
80%
0%
20%
40%
60%
80%
0%
5%
10%
15%
20%
4.9%
14.2%
0.5%
4.8%
0%
5%
10%
15%
20%
16.7%
12.3%12.2%
14.2%13.7%
4.8%
50%+35- <50%25- <35%10- <25%1- <10%<1%
Votingownershipranges
2004 2010 2016 2004 2010 2016
2004 2010 2016 2004 2010 2016

Corporate Governance Practices and TrendsA Comparison of Large Public Companies and Silicon Valley Companies 2016 proxy season
8
fenwick & west llp
Board Size and Meeting Frequency
The number of directors tends to be substantially lower among the technology and life sciences companies in
the SV 150 (average = 8.2 directors) than among S&P 100 companies (average = 12.4 directors).
The following graphs show the distribution by number of directors among the two groups during the 2016 proxy season, as well as the trend over the period from the 2004 through 2016 proxy seasons (showing both the median number and the cutoffs for the deciles with the most and fewest directors).
size of board of directors — distribution and trends over time
SV 1502016
S&P 1002016
SV 150 S&P 100
Number ofdirectors
median
9th decile
high value
outlier
low value
1st decile
2004 2010 20164
6
8
10
12
14
16
18
20
2004 2016 2010
1st decile
9thdecile
median
1st decile
9thdecile
median
# of directors
% of companies
# of directors
% of companies
8 9 10 11 12 13 14 15 16 17 18 19
14
5.0%7.0%
13.0%
4.0%
26.0%24.0%
14.0%
4.0%2.0% 1.0%
5 6 7 8 9 10 11 12 13
2.0% 0.7%
9.3%
24.7%
18.0%
25.3%
7.3%
4.0%
4
0.7% 1.3%
6.7%

Corporate Governance Practices and TrendsA Comparison of Large Public Companies and Silicon Valley Companies 2016 proxy season
9
fenwick & west llp
The technology and life sciences companies in the SV 150 held board meetings more often in 2016
(average = 8.1 in 2015 compared to 7.8 in 2014), while S&P 100 companies decreased meeting frequency
(average =8.9 in 2015 compared to 9.1 in 2014). Although, SV 150 companies continued to skew noticeably
toward fewer meetings compared to the S&P 100.
The following graphs show the distribution by number of board meetings among the two groups in 2015 as reported during the 2016 proxy season, as well as the trend over the period from 2003 through 2015 (showing both the median number and the cutoffs for the deciles with the most and fewest meetings), as reported in the 2004 through 2016 proxy seasons.
number of board of directors meetings — distribution and trends over time
Board Size and Meeting Frequency (continued)
1.0% 1.0%
SV 1502015
S&P 1002015
2003 2009 2009 2015 0
10
20
30
40
50
2003 2015
SV 150 S&P 100
Number ofmeetings
1st decile
9thdecile
median
1st decile
9thdecile
median
# of meetings
% of companies
2 3 4 5 6 7 8 9 10 11 12 13 14 15 16 17 18 19 20 21
1.0%3.0%3.0%
1.0%1.0%2.0%2.0%
4.0%
9.0%
12.0%13.0%
17.0%16.0%
8.0%
3.0%1.0%
2
1.0%
0.7% 0.7% 0.7%1.4%1.4%0.7% 1.4% 1.4%2.1% 2.1%4.3%4.3% 5.0%
2.1%
12.1%
9.2%
16.3%
24.1%
9.2%
3 4 5 6 7 8 9 10 11 12 13 14 15 16 17 18 19 20 21
# of meetings
% of companies1.0%
29
29
0.7%
36
median
9th decile
high value
outlier
low value
1st decile

Corporate Governance Practices and TrendsA Comparison of Large Public Companies and Silicon Valley Companies 2016 proxy season
10
fenwick & west llp
Insider Directors
Insider directors are more common among members of the boards of the technology and life sciences
companies included in the SV 150 than among board members at S&P 100 companies. While generally their
prevalence has declined over time in both groups, the SV 150 has not reached the level of the S&P 100 at the
start of the period covered by the survey. This is largely a function of the relative size of the boards in the two
groups rather than the absolute number of insider directors per board.
The following graphs show the distribution by number of insider directors among the two groups during the 2016 proxy season. In these graphs, we have shown “insider” status determined in various ways. See the discussion under “Insider / Independent” in the Methodology section at the end of this report for a description of the different methods of determining whether a director is an insider.
insider director — distribution of numbers of insiders
SV 1502016
1 2 3 4 5 6
2%1%1%5%
10%
25%
58%
7% 7%
28%
61%
2%2%
23%
67%
2%4%
22%
71%
1 2 3 4 5
3.4%9.4%
32.9%
55.0%
2.0%
10.7%
35.6%
51.7%
2.0%7.4%
34.9%
55.7%
1.4%6.0%
30.8%
61.7%
# of insiders
% of companies
# of insiders
% of companies
Current Insiders
Simplified Exchange Insiders (3 yr rule)
Stated Applicable Exchange Insiders
“Ever” Insiders
Current Insiders
Simplified Exchange Insiders (3 yr rule)
Stated Applicable Exchange Insiders
“Ever” Insiders
S&P 1002016
1% 1%

Corporate Governance Practices and TrendsA Comparison of Large Public Companies and Silicon Valley Companies 2016 proxy season
11
fenwick & west llp
The following graphs show the distribution by percentage of insider directors among the two groups during the 2016 proxy season. In these graphs, we have shown “insider” status determined in various ways. See the discussion under “Insider / Independent” in the Methodology section at the end of this report for a description of the different methods of determining whether a director is an insider.
insider director — distribution of percentages of insiders
Insider Director (continued)
% of insiders
% of companies
% of insiders
% of companies
Current Insiders
Simplified Exchange Insiders (3 yr rule)
Stated Applicable Exchange Insiders
“Ever” Insiders
Current Insiders
Simplified Exchange Insiders (3 yr rule)
Stated Applicable Exchange Insiders
“Ever” Insiders
1 - <10% 10 - <25% 25 - <35% 35% - <50% 50%+
1 - <10% 10 - <25% 25 - <35% 35% - <50% 50%+
SV 1502016
S&P 1002016
3%3%5%
38%
54%
36%
57%
2%
33%
61%
2%4% 4% 4%
30%
64%
8.7%
22.8%
65.1%
4.0%8.1%
24.8%
63.1%
4.0% 6.0%
22.8%
66.4%
4.7% 5.4%
20.8%
67.1%
6.7%
% of insiders
% of companies
% of insiders
% of companies
Current Insiders
Simplified Exchange Insiders (3 yr rule)
Stated Applicable Exchange Insiders
“Ever” Insiders
Current Insiders
Simplified Exchange Insiders (3 yr rule)
Stated Applicable Exchange Insiders
“Ever” Insiders
1 - <10% 10 - <25% 25 - <35% 35% - <50% 50%+
1 - <10% 10 - <25% 25 - <35% 35% - <50% 50%+
SV 1502016
S&P 1002016
3%3%5%
38%
54%
36%
57%
2%
33%
61%
2%4% 4% 4%
30%
64%
8.7%
22.8%
65.1%
4.0%8.1%
24.8%
63.1%
4.0% 6.0%
22.8%
66.4%
4.7% 5.4%
20.8%
67.1%
6.7%

Corporate Governance Practices and TrendsA Comparison of Large Public Companies and Silicon Valley Companies 2016 proxy season
12
fenwick & west llp
The following graphs show the trend of the average as a percentage of the full board that are insiders for each group. In these graphs, we have shown “insider” status determined in various ways over the period from the 2004 through 2016 proxy seasons.
insider director — trends over time
Insider Directors (continued)
0%
5%
10%
15%
20%
25%
2004 2010 2016
SV 150 S&P 100
% Current Insiders
% Simplified Exchange Insiders (3 yr rule)
% “Ever” Insiders
% Stated Applicable Exchange Insiders
2004 2010 2016

Corporate Governance Practices and TrendsA Comparison of Large Public Companies and Silicon Valley Companies 2016 proxy season
13
fenwick & west llp
Board Leadership
During the period covered by this survey, insider dominance of board leadership started lower and declined
more rapidly among the technology and life sciences companies in the SV 150 than among S&P 100
companies. By the 2011 proxy season, almost half of SV 150 companies did not have a chair who was an
insider (whether measured as a current insider or under the applicable exchange listing standard) — though
that trend has largely stalled since then (52% in the 2016 proxy season, compared to only 18% in the S&P 100
for not having a current insider chair, and 47.3% under the applicable exchange listing standard, compared
to only 14% in the S&P 100). In the 2016 proxy season, combined chair/CEOs existed at about one third of
companies in the SV 150, while combined chair/CEOs exist at about 69% of S&P 100 companies (albeit with
lead directors also present at about 84% of all S&P 100 companies).
These graphs show the percentage of companies during the 2016 proxy season with a board chair, then of those with a chair, the percentage with a separate chair (rather than a combined chair/CEO), and then of those with a separate chair, the percentage with a chair who is not an insider (under the applicable exchange standard). In addition, for each branch, the graphic shows the percentage with some form of lead director (separate from any chair).
board leadership — branching percentages
Chair
CombinedChair/CEO
LD
No LD
No LD
Non-InsiderChair
Insider Chair
100%
58.1% No LD72.2%
7.7%
2.9%
92.3%
LD 27.8%
LeadDirector
97.1%
41.9%
69.0%
S&P 1002016Proxy Season
Chair
SeparateChair
CombinedChair/CEO
Lead Director
No LD
No LD
LD
Non-InsiderChair
Insider Chair
No Chair 4.0%
96.0%
65.3%76.6%
No LeadDirector84.5%
22.7%
24.0%
No LD 16.7%
77.3%
LeadDirector76.0%
83.3%
Lead Director 15.5%
23.4%
34.7%
SV 1502016Proxy Season
SeparateChair31.0%

Corporate Governance Practices and TrendsA Comparison of Large Public Companies and Silicon Valley Companies 2016 proxy season
14
fenwick & west llp
The graphs below track, from the 2004 through 2016 proxy seasons, the percentage of all companies with no chair, a combined chair/CEO, a separate but insider chair and a separate and non-insider chair (under the applicable exchange standard), as well as the percentage of all companies with some form of lead director.
board leadership — trends over time
Board Leadership (continued)
SV 150 S&P 100
0%
25%
50%
75%
100%
2004 2010 2016
Separate Non-Insider Chair
Separate Insider Chair
Combined Chair/CEO
No Chair
Separate Non-Insider Chair
Separate Insider Chair
Combined Chair/CEO
No Chair
% with Lead Director
% with Lead Director
2004 2010 2016
Corporate Governance Practices and TrendsA Comparison of Large Public Companies and Silicon Valley Companies 2016 proxy season
15
fenwick & west llp
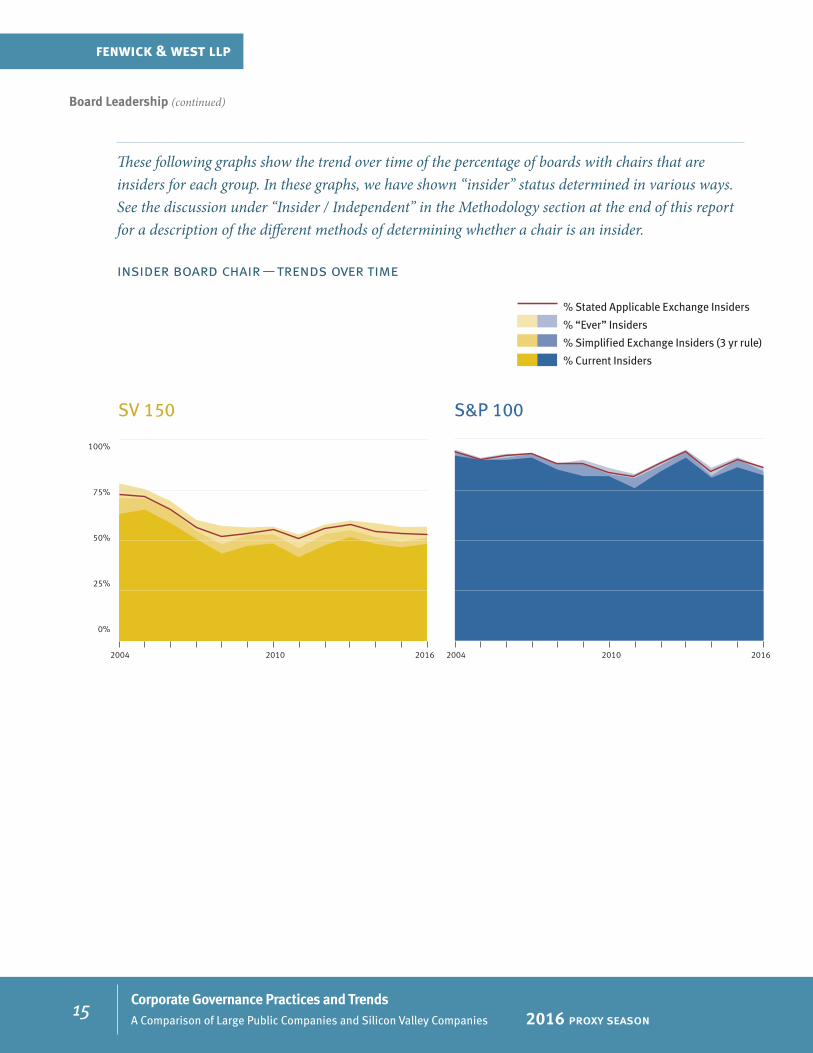
These following graphs show the trend over time of the percentage of boards with chairs that are insiders for each group. In these graphs, we have shown “insider” status determined in various ways. See the discussion under “Insider / Independent” in the Methodology section at the end of this report for a description of the different methods of determining whether a chair is an insider.
insider board chair — trends over time
Board Leadership (continued)
0%
25%
50%
75%
100%
SV 150 S&P 100
2004 2010 2016
% Current Insiders
% Simplified Exchange Insiders (3 yr rule)
% “Ever” Insiders
% Stated Applicable Exchange Insiders
2004 2010 2016
Corporate Governance Practices and TrendsA Comparison of Large Public Companies and Silicon Valley Companies 2016 proxy season
16
fenwick & west llp
Board Diversity10
Under applicable SEC disclosure rules, companies are required to disclose whether they consider diversity
in identifying nominees to the board of directors. However, companies have the flexibility to define diversity
for themselves, and such definitions typically include a wide range of factors, not simply traditional diversity
factors such as gender, race and ethnicity.11 Consequently, it is fairly difficult to measure board diversity in a
systematic way when relying primarily on the information in public filings.12
We have elected to track gender as a measure of board diversity for the technology and life sciences
companies in the SV 150 and S&P 100 companies because gender can be more readily measured in public
filings than other traditional diversity factors.
10 See Gender Diversity in Silicon Valley: A Comparison of Silicon Valley Public Companies and Large Public Companies (2014 Proxy Season) for a substantially more detailed review of gender diversity on the board of directors, as well as among the management teams, of SV 150 and S&P 100 companies. That report, a supplement to this survey that covers data from the 1996 through 2014 proxy seasons and includes a discussion of factors underlying the statistics as well as references to additional materials on the subject, is being published concurrently with this report. To be placed on an email list for future editions of the gender diversity survey when published, visit the fenwick.com/Pages/Subscription-GD-Survey.aspx.
11 See current Item 407(c)(2)(vi) of Regulation S-K (“Describe… whether, and if so how, the nominating committee (or the board) considers diversity in identifying nominees for director. If the nominating committee (or the board) has a policy with regard to the consideration of diversity in identifying director nominees, describe how this policy is implemented, as well as how the nominating committee (or the board) assesses the effectiveness of its policy.”) and SEC Release No. 33-9089 (“We recognize that companies may define diversity in various ways, reflecting different perspectives. For instance, some companies may conceptualize diversity expansively to include differences of viewpoint, professional experience, education, skill and other individual qualities and attributes that contribute to board heterogeneity, while others may focus on diversity concepts such as race, gender and national origin. We believe that for purposes of this disclosure requirement, companies should be allowed to define diversity in ways that they consider appropriate. As a result we have not defined diversity in the amendments.”). Companies typically include factors such as diversity of business experience, viewpoints, personal background (sometimes specifying race and gender) and relevant knowledge, skills or experience in technology, government, finance, accounting, international business, marketing and other areas (if they provide even this level of definition in their disclosures) when describing how their boards consider diversity when making nomination decisions. They do not typically describe how each sitting director or nominee measures against each of those factors (to the extent they enumerate them at all as part of the definition). See also “Corporate Reporting under the U.S. Securities and Exchange Commission’s Diversity Disclosure Rule: A Mixed-Methods Content Analysis” by Aaron A. Dhir (2015), which studied the diversity disclosures of the S&P 100 (as constituted as of December 16, 2010) during the four years subsequent to the enactment of the SEC’s diversity disclosure rule and found that only half of the companies defined diversity to include traditional factors such as gender, race and ethnicity while over 80% used a definition of diversity that referenced a director’s prior professional experience or other nonidentity-based factors. The author notes that to the extent the disclosure rule was intended to produce more diversity on boards along socio-demographic lines, it would be more effective to require companies to include disclosure about identity-based diversity factors such as gender, race and ethnicity rather than allowing companies to define diversity for themselves. In March 2015, a group of public pension funds petitioned the SEC to require detailed disclosure of directors’ gender, race and ethnicity. See “Public Pension Funds Petition SEC for More Disclosure on Board Diversity,” in Bloomberg BNA.
12 However, for a report on traditional diversity factors, see “Missing Pieces: Women and Minorities on Fortune 500 Boards — 2012 Alliance for Board Diversity Census” (August 15, 2013), which “conducted extensive research to confirm the gender, race and ethnicity of directors” and found that white men made up 73.3% of the Fortune 500 board seats in 2012, with white women, minority men and minority women making up 13.4%, 10.1% and 3.2%, respectively.

Corporate Governance Practices and TrendsA Comparison of Large Public Companies and Silicon Valley Companies 2016 proxy season
17
fenwick & west llp
A review of our data suggests that board size may be a significant factor affecting the number of women
directors and to some degree that is a function of the relatively small size of many SV 150 companies.13
For example, while S&P 100 companies tend to have more women directors than SV 150 companies when
measured in absolute numbers (S&P 100 average = 2.9 and SV 150 average = 1.2 women in the 2016 proxy
season), the difference (while significant) is less pronounced when measured as a percentage of the total
number of directors (S&P 100 average = 23.1% of directors and SV 150 average = 14.1% of directors in the
2016 proxy season). In addition, the data for the top 15 of the SV 150 is closer to that of the S&P 100 than to
the SV 150 generally (top 15 average = 2.4 in the 2016 proxy season, up from average = 1.9 in the 2011 proxy
season), despite having a smaller average board size (top 15 of SV 150 average = 10.5; S&P 100 average = 12.4).
When measured as a percentage of the total number of directors, the top 15 of the SV 150 are now very similar
to their S&P 100 peers (top 15 average = 22.2% women directors in the 2016 proxy season; up from average =
16.7% in the 2011 proxy season).14
Further, significantly affecting the average in the SV 150 are the 39 companies without any women directors
(26% of SV 150 companies, down from 82% in 1996 and 52% as recently as 2011), of which 24 are companies
with 7 or fewer total board members (and only 1 of which has more than 9 directors). Overall, 2016 continued
the long-term trend in the SV 150 of increasing numbers of women directors (both in absolute numbers and
as a percentage of board members) and declining numbers of boards without women members. The rate of
increase in women directors for the SV 150 continues to be higher than among S&P 100 companies.
13 While our data focuses on a limited number of public companies in Silicon Valley and large public companies nationally, this observation appears to be true among the largest companies as well. See the Missing Pieces report discussed in footnote 12, which includes data for Fortune 100 and Fortune 500 companies and shows the larger Fortune 100 companies to be more gender diverse, with white men holding 67.9% of Fortune 100 board seats and 73.3% of Fortune 500 board seats in 2012, while white women, minority men and minority women held 15.9%, 12.4% and 3.9% of Fortune 100 seats and 13.4%, 10.1% and 3.2% of Fortune 500 seats, respectively. Fortune 100 companies had a mean board size of 12.1 compared with a mean of 11.0 for Fortune 500 companies. See also “The Gender Diversity Index” by 2020 Women on Boards (2011-2013), which found that the percentage of board seats held by women in the Fortune 501-1000 (14.8% in 2013) was lower than that held in the larger companies of the Fortune 1-500 (18% in 2013). A similar conclusion was reached by the “2015-16 UC Davis Study of California Women Business Leaders — A Census of Women Directors and Highest-Paid Executives,” a review of the 400 largest public companies in California finding (as specifically noted in prior years) that the representation of women on boards of directors is strongly correlated with company size. Overall, the largest companies have more than twice the proportional representation of women on the board as the smallest companies (20.4% versus 8.5%). Similarly, The Boston Club’s “THE PUBLIC SECTOR WEIGHS IN - The 2015 Census of Women Directors and Executive Officers of Massachusetts Public Companies,” a review of the 100 largest public companies in Massachusetts shows that women make up 17.9% of directors at companies with revenue of $5B or more, but only 9.1% of directors at companies with $500M to $999M of revenue). See also “Uneven Progress: Female Directors in the Russell 3000” by Annalisa Barrett of The Corporate Library (2010), which reached a similar conclusion (“gender diversity is much less prevalent in the universe beyond the largest and highest-profile companies” and while the “vast majority (89 percent) of the companies in the S&P 500 have at least one female director,… only 60 percent of companies comprising the Russell 3000 as a whole, and only half of Russell 2000 companies [all smaller companies], have at least one female director”). The “Annual Update of Women Board Directors and Executive Officers in the Regions 2016” by ION reports 68% of companies comprising the Russell 3000 having at least one female director. See also the “Compensation & Governance Outlook 2016” (“[i]n 2012, 79 percent of companies in the S&P 1500 had one or more female board members”). Compare “GMI Ratings’ 2013 Women on Boards Survey” by Kimberly Gladman and Michelle Lamb (April 2013) (“In general, larger companies have more diverse boards: currently 16.9% of S&P 500 directors are women, compared to 13.5% of directors in the S&P Midcap Index and 11.3% in the S&P Smallcaps. The S&P 1500, which is made up of the preceding three indices combined, has 14.0% women on its boards; the Russell 1000 (comprised of the 1000 largest companies in the US) has 14.7%, and the small-cap Russell 2000 has only 10.0%.”).
14 As many companies add board seats, their boards generally expand the mix of skills and experiences that they seek to have represented, often into areas where women are more represented than they are in the mix in effect for smaller boards or companies at earlier stages of development.
Board Diversity (continued)

Corporate Governance Practices and TrendsA Comparison of Large Public Companies and Silicon Valley Companies 2016 proxy season
18
fenwick & west llp
The following graphs show the percentage of companies with at least one woman director and the distributions by number of women directors among the boards of companies in each group during the 2016 proxy season.
women directors — 2016 proxy season distribution
Board Diversity (continued)
0 1 2 3 4 5 6 7
1.0%1.0%
7.0%
27.0%
38.0%
26.0%
Women directors distribution(% of all companies)
# of companies
# of companies with at least 1
woman director
# of women directors
# of companies
# of women directors
Women directors distribution(% of all companies)
0 1 2 3 4 5 6 7
1.0%5.0%
22.0%
31.0%33.0%
8.0%
SV 1502016
# of companies with at least 1
woman director
S&P 1002016
74.0%
100.0%
Corporate Governance Practices and TrendsA Comparison of Large Public Companies and Silicon Valley Companies 2016 proxy season
19
fenwick & west llp
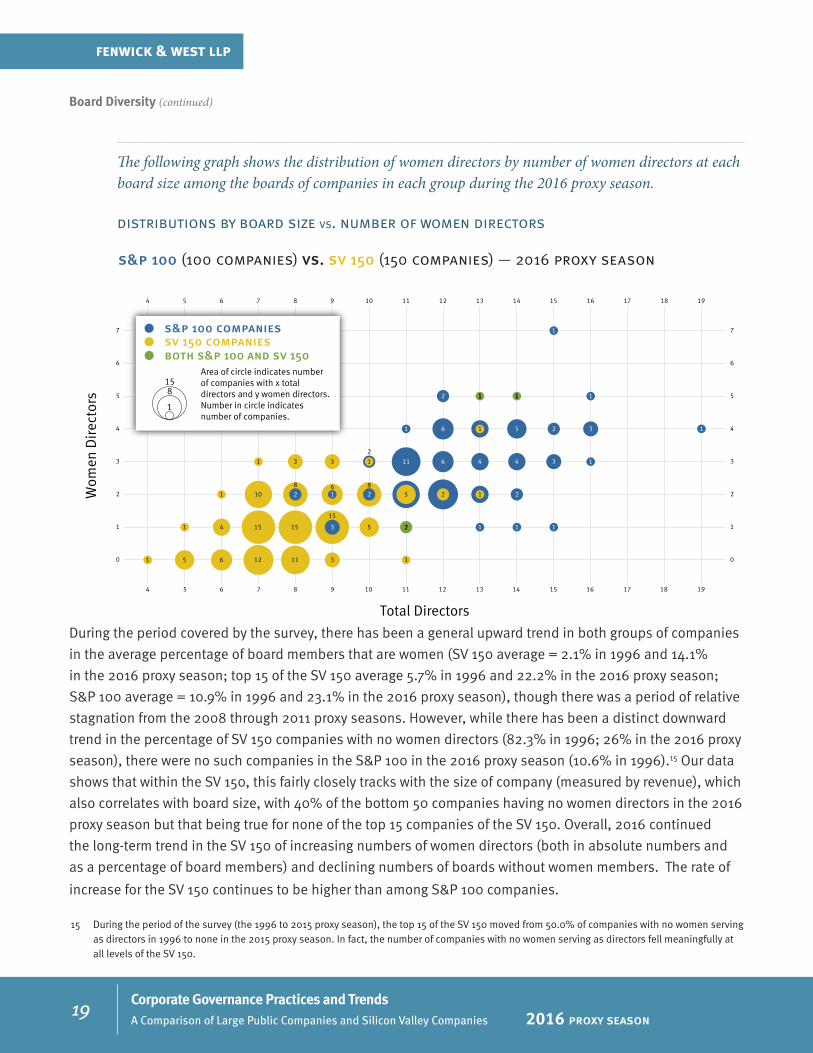
The following graph shows the distribution of women directors by number of women directors at each board size among the boards of companies in each group during the 2016 proxy season.
distributions by board size vs. number of women directors
During the period covered by the survey, there has been a general upward trend in both groups of companies
in the average percentage of board members that are women (SV 150 average = 2.1% in 1996 and 14.1%
in the 2016 proxy season; top 15 of the SV 150 average 5.7% in 1996 and 22.2% in the 2016 proxy season;
S&P 100 average = 10.9% in 1996 and 23.1% in the 2016 proxy season), though there was a period of relative
stagnation from the 2008 through 2011 proxy seasons. However, while there has been a distinct downward
trend in the percentage of SV 150 companies with no women directors (82.3% in 1996; 26% in the 2016 proxy
season), there were no such companies in the S&P 100 in the 2016 proxy season (10.6% in 1996).15 Our data
shows that within the SV 150, this fairly closely tracks with the size of company (measured by revenue), which
also correlates with board size, with 40% of the bottom 50 companies having no women directors in the 2016
proxy season but that being true for none of the top 15 companies of the SV 150. Overall, 2016 continued
the long-term trend in the SV 150 of increasing numbers of women directors (both in absolute numbers and
as a percentage of board members) and declining numbers of boards without women members. The rate of
increase for the SV 150 continues to be higher than among S&P 100 companies.
15 During the period of the survey (the 1996 to 2015 proxy season), the top 15 of the SV 150 moved from 50.0% of companies with no women serving as directors in 1996 to none in the 2015 proxy season. In fact, the number of companies with no women serving as directors fell meaningfully at all levels of the SV 150.
Board Diversity (continued)
4 6 8 10 12 14 16 185 7 9 11 13 15 17 19
4 6 8 10 12 14 16 185 7 9 11 13 15 17 19
0
1
2
3
4
5
6
7
0
1
2
3
4
5
6
7
1 0 0 0 013111265
0 00025
15
151541 3 2 1 1 1
0 0 2 1 2 10 12 4 2125868
101
0000021331
2
11 6 4 4 3 1
1 6 4 5 2 3 11
112 11 1
15 6 7 8
Area of circle indicates number of companies with x total directors and y women directors. Number in circle indicates number of companies.
s&p 100 companiessv 150 companies
158
1
both s&p 100 and sv 150
Total Directors
Wom
en D
irec
tors
s&p 100 (100 companies) vs. sv 150 (150 companies) — 2016 proxy season
distributions by board size vs. number of women directors — 2016 proxy season

Corporate Governance Practices and TrendsA Comparison of Large Public Companies and Silicon Valley Companies 2016 proxy season
20
fenwick & west llp
The following graphs show the average number and the average percentage of women directors for each of the SV 150, the top 15 of the SV 150 and the S&P 100 (and with the SV 150 broken down by the top 50, middle 50 and bottom 50 companies), over the period from the 1996 through 2016 proxy seasons.
average number of women directors — 1996–2016
average percentage of women directors — 1996–2016
Board Diversity (continued)
0.0
0.5
1.0
1.5
2.0
2.5
3.0
1996 2006 20062016
2.4
1.2
2.9
0.0
0.5
1.0
1.5
2.0
2.5
3.0
1996 2016
0.91.0
1.7
average number of women directors — 1996-2016
SV 150
S&P 100
SV Top 50
SV Top 15SV Mid 50
SV Btm 50
SV 150 Breakdown S&P 100 vs. SV Top 15 vs. SV 150
0%
5%
10%
15%
20%
25%
1996 2016
22.2%
14.1%
23.1%
0%
5%
10%
15%
20%
25%
1996 20062006 2016
11.8%12.9%
17.7%
SV 150
S&P 100SV Top 50
SV Top 15
SV Mid 50
SV Btm 50
SV 150 Breakdown S&P 100 vs. SV Top 15 vs. SV 150
0%
5%
10%
15%
20%
25%
1996 2016
22.2%
14.1%
23.1%
0%
5%
10%
15%
20%
25%
1996 20062006 2016
11.8%12.9%
17.7%
SV 150
S&P 100SV Top 50
SV Top 15
SV Mid 50
SV Btm 50
SV 150 Breakdown S&P 100 vs. SV Top 15 vs. SV 150
Corporate Governance Practices and TrendsA Comparison of Large Public Companies and Silicon Valley Companies 2016 proxy season
21
fenwick & west llp
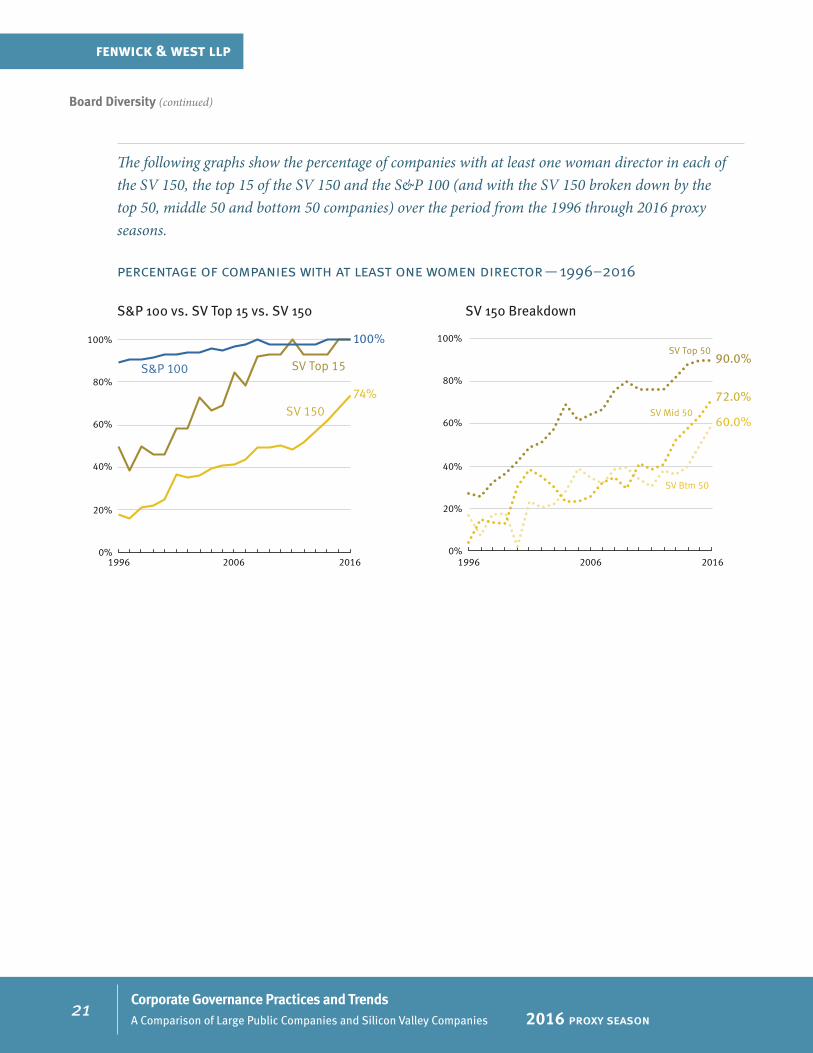
The following graphs show the percentage of companies with at least one woman director in each of the SV 150, the top 15 of the SV 150 and the S&P 100 (and with the SV 150 broken down by the top 50, middle 50 and bottom 50 companies) over the period from the 1996 through 2016 proxy seasons.
percentage of companies with at least one women director — 1996–2016
Board Diversity (continued)
0%
20%
40%
60%
80%
100%
1996 2006 20062016
74%
100%
0%
20%
40%
60%
80%
100%
1996 2016
60.0%
72.0%
90.0%
SV 150
S&P 100
SV Top 50
SV Top 15
SV Mid 50
SV Btm 50
SV 150 Breakdown S&P 100 vs. SV Top 15 vs. SV 150

Corporate Governance Practices and TrendsA Comparison of Large Public Companies and Silicon Valley Companies 2016 proxy season
22
fenwick & west llp
The following graphs show the trend in the distribution by number and percentage of women directors in each group (showing both the median number or percentage and the cutoffs for the deciles with the most women directors) over the period from the 1996 through 2016 proxy seasons.
distribution of number and percentage of women directors — 1996–2016
Board Diversity (continued)
S&P 100
S&P 100
Number ofWomen
Directors
Percent ofWomen
Directors
median
9th decile
high value
outlier
low value
1st decile
Women Directors: Percentages1996-2016
SV 150
SV 150
Number ofWomen
Directors
Percent ofWomen
Directors
Women Directors: Numbers1996-2016
0
1
2
3
4
5
6
7
1996 2016 0
1
2
3
4
5
6
7
1996 2016
0%
10%
20%
30%
40%
50%
60%
70%
1996
2006
2006
2006
2006 2016 0%
10%
20%
30%
40%
50%
60%
70%
1996 2016
median
9th decile
high value
outlier
low value
1st decile
Corporate Governance Practices and TrendsA Comparison of Large Public Companies and Silicon Valley Companies 2016 proxy season
23
fenwick & west llp
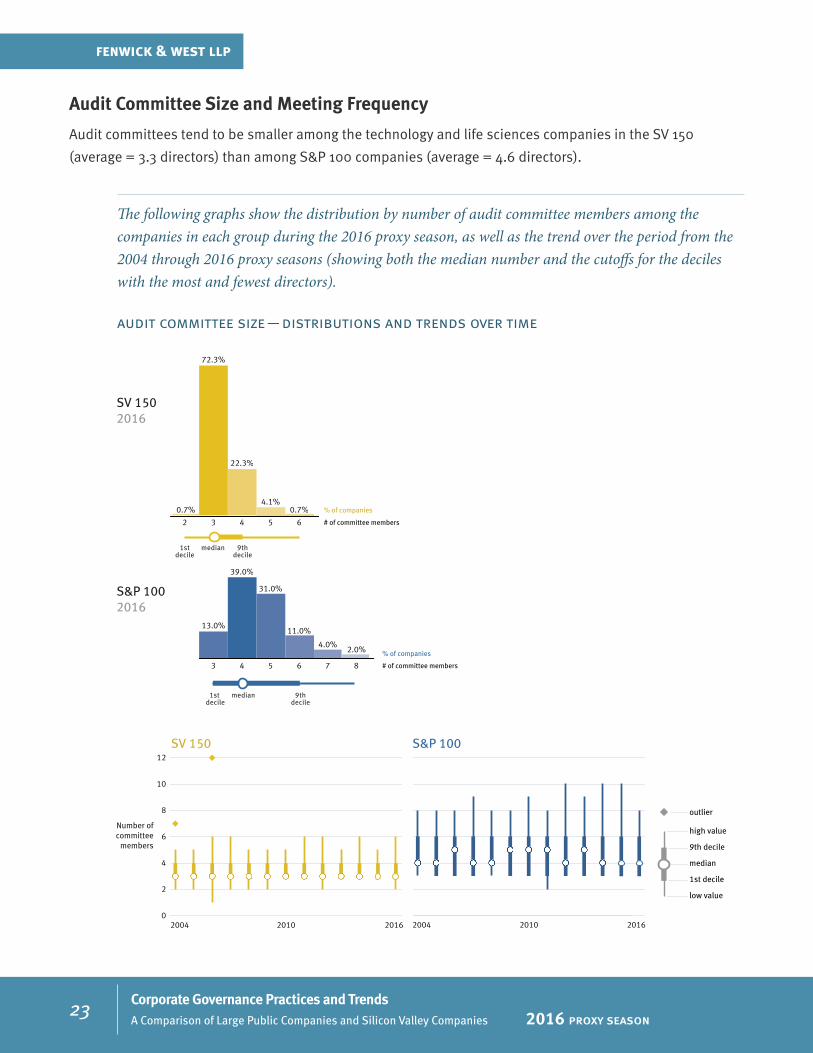
Audit Committee Size and Meeting Frequency
Audit committees tend to be smaller among the technology and life sciences companies in the SV 150
(average = 3.3 directors) than among S&P 100 companies (average = 4.6 directors).
The following graphs show the distribution by number of audit committee members among the companies in each group during the 2016 proxy season, as well as the trend over the period from the 2004 through 2016 proxy seasons (showing both the median number and the cutoffs for the deciles with the most and fewest directors).
audit committee size — distributions and trends over time
SV 1502016
S&P 1002016
SV 150 S&P 100
Number ofcommittee
members
2004 201620100
2
4
6
8
10
12
2004 2010 2016
9thdecile
1stdecile
median
1st decile
9thdecile
median
# of committee members
% of companies
# of committee members
% of companies
3 4 5 6 7 8
2.0%4.0%
11.0%
31.0%
39.0%
13.0%
32 4 5 6
4.1%0.7% 0.7%
22.3%
72.3%
median
9th decile
high value
outlier
low value
1st decile

Corporate Governance Practices and TrendsA Comparison of Large Public Companies and Silicon Valley Companies 2016 proxy season
24
fenwick & west llp
In both groups, after peaking in 2007 largely driven by a surge of internal investigations (such as for stock
option backdating issues), the number of audit committee meetings appears to have stabilized at levels
similar to those found in the first year following the adoption of the Sarbanes-Oxley Act of 2002 (SV 150
average = 8.6 meetings; S&P 100 average = 9.7 meetings).
The following graphs show the distribution by number of audit committee meetings among the members of each group in 2015 as reported during the 2016 proxy season, as well as the trend over the period from 2003 through 2015 (showing both the median number and the cutoffs for the deciles with the most and fewest meetings), as reported in the 2004 through 2016 proxy seasons.
number of audit committee meetings — distributions and trends over time
Audit Committee Size and Meeting Frequency (continued)
median
9th decile
high value
outlier
low value
1st decile
SV 150 S&P 100
Number ofmeetings
2003 20150
10
20
30
40
50
2003 2009 2009 2015
1st decile
9thdecile
median
S&P 1002015
# of meetings
% of companies
4 5 6 7 8 9 10 11 12 13 14 15 16 17 18
1.0%1.0%1.0%
3.0%4.0%4.0%
2.0%
6.0%
11.0%
15.0%15.0%
26.0%
7.0%
1st decile
9thdecile
median
SV 1502015
# of meetings
% of companies
432
3
5 6 7 8 9 10 11 12 13 14 15 16 17 18 19 20 21 22 23 24
0.7%0.7%0.7%0.7%0.7%1.4%0.7%1.4% 2.1%2.1%2.1%
4.3%3.6%
8.6%
18.6%17.9%
8.6%7.1%
9.3%8.6%
1.0%1.0%2.0%

Corporate Governance Practices and TrendsA Comparison of Large Public Companies and Silicon Valley Companies 2016 proxy season
25
fenwick & west llp
Compensation Committee Size and Meeting Frequency
Compensation committees tend to be larger among S&P 100 companies (average = 4.5 directors) than among
the technology and life sciences companies in the SV 150 (average = 3.2 directors).
The following graphs show the distribution by number of compensation committee members among companies in each group during the 2016 proxy season, as well as the trend over the period from the 2004 through 2016 proxy seasons (showing both the median number and the cutoffs for the deciles with the most and fewest directors).
compensation committee size — distributions and trends over time
median
9th decile
high value
low value
1st decile
SV 150 S&P 100
Number ofcommittee
members
2004 20160
2
4
6
8
10
2004 2010 2010 2016
1st decile
9thdecile
median
S&P 1002016
# of committee members
% of companies
2 3 4 5 6
7.0%
7
3.0%
41.0%
34.0%
13.0%
2.0%
9thdecile
median
SV 1502016
# of committee members
% of companies
2 3 4 5
5.4%
6
0.7%
18.9%
66.9%
8.1%

Corporate Governance Practices and TrendsA Comparison of Large Public Companies and Silicon Valley Companies 2016 proxy season
26
fenwick & west llp
In both groups, compensation committees hold more frequent meetings than at the outset of the survey
period, though the trend is particularly pronounced among the SV 150 companies (S&P 100 average = 6.4
meetings; SV 150 average = 6.7 meetings).
The following graphs show the distribution by number of compensation committee meetings among the members of each group in 2015 as reported during the 2016 proxy season, as well as the trend over the period from 2003 through 2015 (showing both the median number and the cutoffs for the deciles with the most and fewest meetings), as reported in the 2004 through 2016 proxy seasons.
number of compensation committee meetings — distributions and trends over time
Compensation Committee Size and Meeting Frequency (continued)
median
9th decile
high value
outlier
low value
1st decile
SV 150 S&P 100
Number ofmeetings
2003 2015200920090
5
10
15
20
25
2003 2015
1st decile
9thdecile
median
SV 1502015
# of meetings
% of companies
2 31 4 5 6 9 10 11 12 13 147 8 15 16
2 3 4 5 6 9 10 11 12 13 147 8 15 16
17
2.6%0.7%
2.6%1.4%
4.3%
7.9%
4.3%
16.5%15.8%
23.0%
0.7%0.7%
12.9%
4.3%
1st decile
9thdecile
median
S&P 1002015
# of meetings
% of companies
0.7% 0.7%
1.0% 1.0%
1.4%
2.0%2.0%4.0%
2.0%
14.0%15.0%
21.0%
25.0%
9.0%
3.0%1.0%

Corporate Governance Practices and TrendsA Comparison of Large Public Companies and Silicon Valley Companies 2016 proxy season
27
fenwick & west llp
Nominating Committee Size and Meeting Frequency
Nominating committees tend to be smaller among the technology and life sciences companies in the SV 150
(average = 3.2 directors) than among S&P 100 companies (average = 4.8 directors).
The following graphs show the distribution by number of nominating committee members among the companies in each group during the 2016 proxy season, as well as the trend over the period from the 2004 through 2016 proxy seasons (showing both the median number and the cutoffs for the deciles with the most and fewest directors).
nominating committee size — distributions and trends over time
median
9th decile
high value
outlier
low value
1st decile
SV 150 S&P 100
Number ofcommittee
members
2004 2016201020100
2
4
6
8
10
12
2004 2016
1st decile
9thdecile
median
S&P 1002016
2 3 4 5 6 7 8 9 10 11 12
1.0%1.0% 1.0% 1.0% 1.0%2.0%
17.0%
27.0%
35.0%
12.0%
2.0%
9thdecile
1stdecile
median
SV 1502016
2 3 4 5 6 7 8 9
1.4% 0.7% 0.7% 0.7%4.1%
17.0%
57.1%
18.4%
# of committee members
% of companies
# of committee members
% of companies

Corporate Governance Practices and TrendsA Comparison of Large Public Companies and Silicon Valley Companies 2016 proxy season
28
fenwick & west llp
In both groups, nominating committees generally hold meetings more frequently over time, though the
trend is somewhat more pronounced among the SV 150 companies (SV 150 average = 3.9 meetings; S&P 100
average = 5.3 meetings).
The following graphs show the distribution by number of nominating committee meetings among the members of each group in 2015 as reported during the 2016 proxy season, as well as the trend over the period from 2003 through 2015 (showing both the median number and the cutoffs for the deciles with the most and fewest meetings), as reported in the 2004 through 2016 proxy seasons.
number of nominating committee meetings — distributions and trends over time
Nominating Committee Size and Meeting Frequency (continued)
SV 150 S&P 100
Number ofmeetings
20030
5
10
15
20
25
2003 201520092009 2015
1st decile
9thdecile
median
S&P 1002015
# of meetings
% of companies
2 93 4 5 6 7 8 10 11
1.0%
10
1.0%
12 19
1.0%1.0%
12.0%
23.0%20.0%
29.0%
4.0%4.0% 4.0%
1st decile
9thdecile
median
SV 1502015
# of meetings
% of companies
0 1 2 3 4 5 6 7 8 9 10 11 12 13 14 15 16
13 14 15 16 17 18
2.2% 0.7% 0.7% 1.5%2.9%5.1%
11.0%
33.1%
14.7%14.0%11.0%
2.2% 0.7%
median
9th decile
high value
outlier
low value
1st decile

Corporate Governance Practices and TrendsA Comparison of Large Public Companies and Silicon Valley Companies 2016 proxy season
29
fenwick & west llp
Other Standing Committees
Standing committees other than the three primary board committees are quite common among S&P 100
companies (84%) and relatively uncommon among the technology and life sciences companies in the SV 150
(26.7%). These committees can serve a wide variety of purposes. Executive, finance and risk management
committees are most common among the S&P 100 — though public policy committees are becoming
increasingly common; with finance, some amalgam of strategy/M&A and technology committees most
common among the SV 150 companies. While our data shows that within the SV 150, the rate of formation
of other standing committees tracks to a degree with the size of company (measured by revenue), with an
approximately 60% rate among the top 15 (somewhat closer to the S&P 100, though still meaningfully lower)
and an approximately 26% and 12% rate among the middle 50 and bottom 50 in the 2016 proxy season,
respectively, there are clearly other factors contributing to their relative infrequency in Silicon Valley.
The following graphs show, over the period from the 2004 through 2016 proxy seasons, the percentage of all companies in each group with at least one standing committee other than the three primary committees, as well as the same information for the SV 150 broken down by the top 15, top 50, middle 50 and bottom 50 companies.
other committees — trends over time
SV 150 Breakdown S&P 100 vs. SV 150
SV Top 15
SV 150
S&P 100
SV Bottom 50
SV Mid 50
SV Top 50
0%
25%
50%
75%
100%
12.0%
42.0%
60.0%
26.0%26.7%
84.0%
SV 150
S&P 100
0%
25%
50%
75%
100%
2004 2010
26.7%
84.0%
2016 2004 2010 2016

Corporate Governance Practices and TrendsA Comparison of Large Public Companies and Silicon Valley Companies 2016 proxy season
30
fenwick & west llp
The following graphs show the distribution by number of standing committees other than the three primary board committees (for those that have any such other committees) among the members of each group as reported during the 2016 proxy season, as well as the trend over the period from the 2004 through 2016 proxy seasons (showing both the median number and the cutoff for the decile with the most such committees).
other committees — distributions and trends over time
Other Standing Committees (continued)
Numberof other
committees
2004 2016 0
1
2
3
4
5
6
2004 2010 20102016
9thdecile
median
1st decile
9thdecile
median
# of committees
% of companies
26.7%
% of companieswith at least 1
other committee
% of companieswith at least 1
other committee
84%
SV 1502016
S&P 1002016
Other committee distribution (% of all companies)
Other committee distribution (% of all companies)
1 2 3 4 5 # of committees
% of companies1.0%5.0%
17.0%
27.0%
34.0%34.0%
1 2
6.7%
20.0%
SV 150 S&P 100
median
9th decile
high value
outlier
low value
1st decile
Numberof other
committees
2004 2016 0
1
2
3
4
5
6
2004 2010 20102016
9thdecile
median
1st decile
9thdecile
median
# of committees
% of companies
26.7%
% of companieswith at least 1
other committee
% of companieswith at least 1
other committee
84%
SV 1502016
S&P 1002016
Other committee distribution (% of all companies)
Other committee distribution (% of all companies)
1 2 3 4 5 # of committees
% of companies1.0%5.0%
17.0%
27.0%
34.0%34.0%
1 2
6.7%
20.0%
SV 150 S&P 100
Corporate Governance Practices and TrendsA Comparison of Large Public Companies and Silicon Valley Companies 2016 proxy season
31
fenwick & west llp
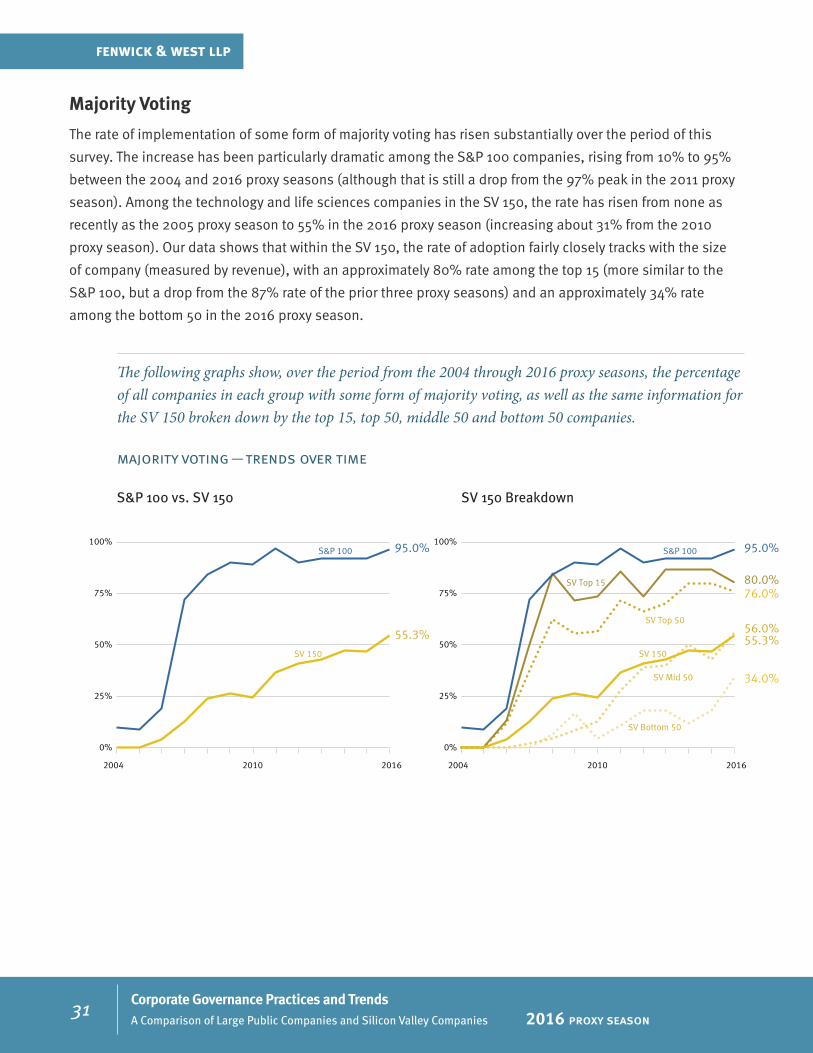
Majority Voting
The rate of implementation of some form of majority voting has risen substantially over the period of this
survey. The increase has been particularly dramatic among the S&P 100 companies, rising from 10% to 95%
between the 2004 and 2016 proxy seasons (although that is still a drop from the 97% peak in the 2011 proxy
season). Among the technology and life sciences companies in the SV 150, the rate has risen from none as
recently as the 2005 proxy season to 55% in the 2016 proxy season (increasing about 31% from the 2010
proxy season). Our data shows that within the SV 150, the rate of adoption fairly closely tracks with the size
of company (measured by revenue), with an approximately 80% rate among the top 15 (more similar to the
S&P 100, but a drop from the 87% rate of the prior three proxy seasons) and an approximately 34% rate
among the bottom 50 in the 2016 proxy season.
The following graphs show, over the period from the 2004 through 2016 proxy seasons, the percentage of all companies in each group with some form of majority voting, as well as the same information for the SV 150 broken down by the top 15, top 50, middle 50 and bottom 50 companies.
majority voting — trends over time
2004 2010 2016
SV 150 Breakdown
SV Top 15
SV 150
S&P 100
SV Bottom 50
SV Mid 50
SV Top 50
S&P 100 vs. SV 150
0%
25%
50%
75%
100%
34.0%
56.0%
76.0%80.0%
55.3%
95.0%
SV 150
S&P 100
0%
25%
50%
75%
100%
55.3%
95.0%
2004 2010 2016

Corporate Governance Practices and TrendsA Comparison of Large Public Companies and Silicon Valley Companies 2016 proxy season
32
fenwick & west llp
Classified Board
Classified boards are now significantly more common among the technology and life sciences companies
in the SV 150 than among the S&P 100 companies, though that has not always been the case. This graph
illustrates that declassifying boards has been a trend among the largest public companies, but not among
Silicon Valley companies. At the beginning of the survey period, both groups had similar rates of classified
boards. But, while the frequency among the S&P 100 declined dramatically during the period of the survey,
the rate has held fairly steady among the technology and life sciences companies in the SV 150. Our data
shows that within the SV 150, the rate among the top 15 companies had fallen in half (to a rate similar to the
S&P 100) in the 2011 proxy season, but had rebounded to 13.3% in the 2012 through 2014 proxy seasons
(tracking a similar slight rebound in the S&P 100)—though it has fallen again since then. Meanwhile the
rate among the bottom 50 companies had actually increased to 70% in the 2016 proxy season. To a major
extent, this reflects the reality that one of the principal reasons for classification, as a takeover defense,
is less compelling for some larger companies due to the sheer size the companies and dispersion of their
stockholdings. The changes in recent years within the SV 150 largely reflect changes in the constituent
companies of the subdivisions of the SV 150.
The following graphs show, over the period from the 2004 through 2016 proxy seasons, the percentage of all companies in each group with a classified board, as well as the same information for the SV 150 broken down by the top 15, top 50, middle 50 and bottom 50 companies.
classified board — trends over time
SV 150 Breakdown
SV Top 15
SV 150
S&P 100
SV Bottom 50
SV Mid 50
SV Top 50
S&P 100 vs. SV 150
0%
20%
40%
60%
80%
70.0%
50.0%
22.0%
6.7%
47.3%
4.0%
SV 150
S&P 100
0%
20%
40%
60%
80%
47.3%
4.0%
2004 2010 2016 2004 2010 2016

Corporate Governance Practices and TrendsA Comparison of Large Public Companies and Silicon Valley Companies 2016 proxy season
33
fenwick & west llp
Dual-Class Voting Stock Structure
Adoption of dual-class voting stock structures has now emerged as a recent clear trend among Silicon
Valley technology companies (though it is still a small percentage of companies). Historically, dual-class
voting stock structures have been significantly more common among S&P 100 companies than among the
technology and life sciences companies in the SV 150 companies, though the frequency in the SV 150 has
surpassed the S&P 100 in recent years. However, in both groups dual-class voting remains a small minority.
Other than the recent overall trend in the SV 150, the variation in the percentage of each group over time is
primarily a function of changes in the constituents of each group. Within the SV 150, our data suggests that
there has been an increasing trend of dual-class voting structures among the mid-to-larger companies, with
little appearance among the smallest companies. That has been a function of companies such as Google,
Facebook, VMware, Workday and Zynga joining the SV 150 with dual-class structures (though during the
period of the survey another large company, Electronic Arts, moved away from a dual-class structure), while
smaller companies with dual-class voting have departed as constituents of the SV 150 (offset by the recent
addition of Box and RingCentral).
The following graphs shows, over the period from the 2004 through 2016 proxy seasons, the percentage of all companies in each group with a dual-class voting stock structure, as well as the same information for the SV 150 broken down by the top 15, top 50, middle 50 and bottom 50 companies.
dual-class structure — trends over time
SV 150 Breakdown S&P 100 vs. SV 150
SV Top 15
SV 150
S&P 100
SV Mid 50
SV Top 50
SV Btm 50
11.3%9.0%
0%
10%
20%
30%
2004 2010
6.0%
14.0%14.0%13.3%
2016
SV 150
S&P 100
11.3%
9.0%
0%
10%
20%
30%
2004 2010 2016

Corporate Governance Practices and TrendsA Comparison of Large Public Companies and Silicon Valley Companies 2016 proxy season
34
fenwick & west llp
Stock Ownership Guidelines
Alignment of executive officer and director economic interests with those of stockholders in the form of
requirements that executive officers and directors hold specified amounts of a company’s stock has been
on the rise during the period of the survey. While generally the prevalence of stock ownership guidelines
has increased over time in both groups, the SV 150 has only recently surpassed the level of the S&P 100 at
the start of the period covered by the survey, particularly with respect to executive officers. Further, our data
shows that within the SV 150, the rate among the top 15 companies has risen to a rate generally comparable
to that of the S&P 100, while the rate among the bottom 50 companies has risen very slowly. Such policies are
still only implemented at about two-thirds of the middle 50 and at a distinct minority of bottom 50 companies
(increasing from none in the 2004 proxy season to 34% in the 2016 proxy season, including an increase of
14% since the 2011 proxy season). We believe these differences are primarily a function of entrepreneurial
ownership and the general culture of equity compensation in Silicon Valley, where insiders generally own
larger stakes in their companies (particularly so with more recently public companies) and boards feel less
need to establish guidelines to encourage alignment of interests (or for stockholder relations).16
The following graph shows the percentage of all companies in each of the S&P 100 and the SV 150 with stock ownership guidelines for executive officers over the survey period, and the coverage of those guidelines for each group in the 2016 proxy season, as well as the percentage of each group with stock ownership guidelines for directors over the same period.
stock ownership guidelines — executive officers and directors
16 For example, our data shows that equity ownership of executive officers and directors among the bottom 50 companies in the SV 150 ranges over time from roughly six to twenty times that of executive officers and directors at S&P 100 companies (also depending on whether you are comparing averages or medians). See the data regarding the actual equity and voting ownership of executive officers and directors for each group on pages 4 through 7.
SV 150 Officers
SV 150 Directors
S&P 100 Directors
S&P 100 Officers
98.9% of guidelines cover all executive officers
80.7% of guidelines cover all executive officers
14.8% cover CEO only
4.5% cover CEO & CFO only
SV 150 2016
S&P 100 2016
80.7%
98.9%
1.1% cover CEO & EVPs only
% of companieswith guidelines
0%
25%
50%
75%
100%
2004 2010 2016
61.1%
95.0%
63.9%
86.0%

Corporate Governance Practices and TrendsA Comparison of Large Public Companies and Silicon Valley Companies 2016 proxy season
35
fenwick & west llp
The following graphs show, over the period from the 2004 through 2016 proxy seasons, the percentage of all companies in each of the S&P 100 and the SV 150 with stock ownership guidelines for executive officers and directors, separately, for the SV 150 broken down by the top 15, top 50, middle 50 and bottom 50 companies.
stock ownership guidelines — executive officers and directors (SV 150 breakdown)
Among the 92 SV 150 companies with stock ownership guidelines, 12 companies specify the requirement
based on a fixed number of shares or a fixed minimum value of shares that must be held, while 80 companies
instead specify the requirement based on a multiple of base salary. Of the companies using a multiple,
five companies specified 1 – 2x, 36 specified 3x, 27 companies specified 4 – 5x and 12 companies specified
6 – 10x of base salary for the CEO.17 In addition, 64 companies specified a grace period of 5 years to reach
the minimum, while the grace period for the remainder ranged from 2 – 4 years (though the disclosure for
16 companies did not specify a grace period in the proxy statement disclosure).18 Twenty companies specify
in their proxy statement disclosure that they require a minimum retention level pending achievement of the
stated target during the grace period, of which seven companies required 100%, six companies required
50% and seven required 25 – 40% (with three requiring no minimum retention, of which one encourages a
minimum level).19 Of those with stock ownership guidelines, 56 companies specify which equity holdings are
counted toward meeting the minimum, of which 20 count unvested RSUs (though only three specify that RSUs
count at 50% per share and three specify that RSUs count in full).20
17 Among the 14 companies in the top 15 of the SV 150 with stock ownership guidelines, four companies specify the requirement based on a fixed number of shares or a fixed minimum value of shares that must be held, while 10 companies instead specify the requirement based on a multiple of salary. Of the companies using a multiple, one company specified 2x, six specified 4 – 5x, one specified 6x and two companies specified 7 – 10x of base salary for the CEO.
18 In the top 15, 11 companies had a 5-year grace period of 5 years to reach the minimum, and two specified 3 – 4 years (with one company not specifying a grace period in the proxy disclosure).
19 In the top 15, two companies specify in their proxy statement disclosure that they require a minimum retention level pending achievement of the stated target during the grace period, with one requiring 50% and one requiring 25%.
20 In the top 15, eight companies specify which equity holdings are counted toward meeting the minimum, of which four count unvested RSUs (though only one specifies that RSUs count at 50% per share, with the others not addressing weighting).
Stock Ownership Guidelines (continued)
SV 150 Breakdown – Executive Officers SV 150 Breakdown – Directors
SV Top 15
S&P 100
SV 150
S&P 100
SV Mid 50
SV Top 50
SV Bottom 50
SV Mid 50
SV Top 50
SV Bottom 50
SV Top 15
0%
25%
50%
75%
100%
2004 2010
34.0%
62.5%
85.7%86.7%
61.1%
95.0%
0%
25%
50%
75%
100%
2016
36.2%
68.8%
85.7%
86.7%
63.9%
86.0%
2004 2010 2016

Corporate Governance Practices and TrendsA Comparison of Large Public Companies and Silicon Valley Companies 2016 proxy season
36
fenwick & west llp
Stockholder Proposals
Stockholder activism, measured in the form of proposals included in the proxy statements of companies, is
substantially lower among the technology and life sciences companies in the SV 150 than among S&P 100
companies. However, our data shows a marked increase in recent years among the technology and life
sciences companies in the top 15 of the SV 150, where 73.3% had at least one stockholder proposal. Five
companies in the SV 150 had four or more proposals during the 2016 proxy season (with an average of
2.2 proposals among those with any), compared to 21 such companies in the S&P 100 (with an average of
2.8 among those with any). Our data reflects a current general downward trend of stockholder activism,
measured in terms of stockholder proposal frequency, particularly in the S&P 100 — although the SV 150,
where there are any proposals, has had an upward trend in number of proposals in recent years. Contested
elections, another form of stockholder activism, were exceedingly rare among both the SV 150 and the
S&P 100, where there were no contested elections in six of the years surveyed among the SV 150 (and one
year each having three and four contested elections, and five years having one or two) and none in six years
among the S&P 100 during the twelve years of the survey (and seven years each having one or two contested
elections). Neither group had a contested director election in the 2016 proxy season.
The following graphs show for each group during the 2016 proxy season the percentage of all companies with at least one stockholder proposal, and the distribution by number of stockholder proposals, included in the company’s proxy statement.
stockholder proposals — distributions
13.3%
% of companieswith at least 1
stockholder proposal
% of companieswith at least 1
stockholder proposal
77%
SV 1502016
S&P 1002016
# of proposals
Proposal distribution(% of all companies)
Proposal distribution (% of all companies)
% of companies
# of proposals
% of companies
1 2 3 4 5 6 7 8 9 1110
5.0%3.0%
1.0%0.0%0.0%1.0%1.0%
10.0%
14.0%
22.0%20.0%
1 2 3 4 5
0.7%1.3% 0.7%1.3%
6
1.3%
8.0%

Corporate Governance Practices and TrendsA Comparison of Large Public Companies and Silicon Valley Companies 2016 proxy season
37
fenwick & west llp
The following graphs show for each group, over the period from the 2004 through 2016 proxy seasons, the percentage of all companies with at least one stockholder proposal included in the company proxy statement and the average and median number of such proposals per company, as well as the percentage of all companies with at least one stockholder proposal and the average number of proposals for the SV 150 broken down by the top 15, top 50, middle 50 and bottom 50 companies.
stockholder proposals — trends over time
Stockholder Proposals (continued)
2004 20162010
2004 20162010
SV 150 Median
S&P 100 Average
Number of Stockholder Proposalsper Company
S&P 100 Median
SV 150 Avg
0
1
2
3
4
5
2.8
2.02.2
1.0
Percentage of Companies with at least one Stockholder Proposal
SV Mid 50
SV Top 15
SV 150
SV 150 Breakdown –at least one Stockholder Proposal
S&P 100
SV Top 50
SV Btm 500%
20%
40%
60%
80%
2.0%6.0%
32.0%
73.3%
13.3%
77.0%
SV Bottom 50
SV Mid 50SV 150
SV 150 Breakdown –Average # of Stockholder Proposals
S&P 100
SV Top 50
0
1
2
3
4
5
1.0
2.2
3.2
2.52.8SV Top 15
SV 150
S&P 100
0%
20%
40%
60%
80%
13.3%
77.0%
2004 20162010
2004 20162010

Corporate Governance Practices and TrendsA Comparison of Large Public Companies and Silicon Valley Companies 2016 proxy season
38
fenwick & west llp
The following graphs show for each group the range, over the period from the 2004 through 2016 proxy seasons, of the number of stockholder proposals included in company proxy statements, showing both the median and the cutoffs for the deciles with the most and fewest proposals (among those that have any such proposals).
stockholder proposals — range trends over time
For a substantially more detailed review of stockholder proposals and other aspects of annual meeting voting
in the SV 150, as well as the Bay Area 25, see the forthcoming Fenwick publication Results of the 2016 Proxy
Season in Silicon Valley: A Comparison of Silicon Valley Public Companies and Other Large Bay Area Public
Companies, anticipated to be released in December 2016. To be placed on an email list for this and future
editions of the Proxy Season Results Survey when published, visit www.fenwick.com/subscribe-proxy.
Stockholder Proposals (continued)
SV 150 S&P 100
Number ofstockholder
proposals
2004 20160
3
6
9
12
15
18
2004 2010 20102016
median
9th decile
high value
outlier
low value
1st decile
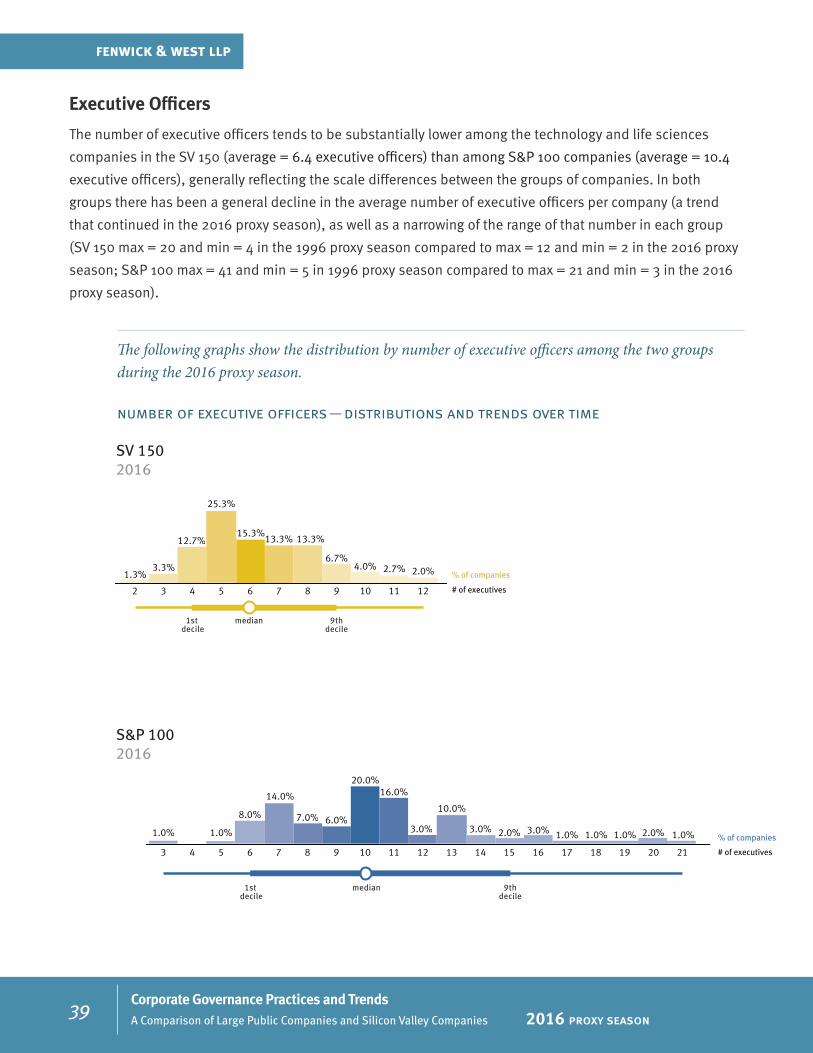
Corporate Governance Practices and TrendsA Comparison of Large Public Companies and Silicon Valley Companies 2016 proxy season
39
fenwick & west llp
Executive Officers
The number of executive officers tends to be substantially lower among the technology and life sciences
companies in the SV 150 (average = 6.4 executive officers) than among S&P 100 companies (average = 10.4
executive officers), generally reflecting the scale differences between the groups of companies. In both
groups there has been a general decline in the average number of executive officers per company (a trend
that continued in the 2016 proxy season), as well as a narrowing of the range of that number in each group
(SV 150 max = 20 and min = 4 in the 1996 proxy season compared to max = 12 and min = 2 in the 2016 proxy
season; S&P 100 max = 41 and min = 5 in 1996 proxy season compared to max = 21 and min = 3 in the 2016
proxy season).
The following graphs show the distribution by number of executive officers among the two groups during the 2016 proxy season.
number of executive officers — distributions and trends over time
1st decile
9thdecile
median
1st decile
9thdecile
median
SV 1502016
S&P 1002016
# of executives
% of companies
# of executives
% of companies
3 4 5 6 7 8 9 10 11 12 13 14 15 16 17 18 19 20 21
2.0%1.0% 1.0% 1.0% 1.0%3.0%2.0%3.0%
10.0%
3.0%
16.0%20.0%
6.0%7.0%
14.0%
8.0%
1.0%1.0%
2 3 4 5 6 7 8 9 10 11 12
2.0%4.0% 2.7%1.3%
6.7%
13.3%13.3%15.3%
25.3%
12.7%
3.3%

Corporate Governance Practices and TrendsA Comparison of Large Public Companies and Silicon Valley Companies 2016 proxy season
40
fenwick & west llp
The following graphs show the average number of executive officers in each group, as well as the same information for the SV 150 broken down by the top 15, top 50, middle 50 and bottom 50 companies, over the period from the 1996 through 2016 proxy seasons.
average number of executive officers — trends over time
Executive Officers (continued)
SV Top 15
SV 150
S&P 100
SV Bottom 50SV Mid 50
SV Top 50
SV 150 Breakdown S&P 100 vs. SV 150
0
3
6
9
12
15
0
3
6
9
12
15
1996 20161996 2006 2006
5.46.4
7.38.1
6.4
10.4
SV 150
S&P 100
2016
6.4
10.4

Corporate Governance Practices and TrendsA Comparison of Large Public Companies and Silicon Valley Companies 2016 proxy season
41
fenwick & west llp
The following graphs show the range of the number of executive officers per company in each group, showing both the median and the cutoffs for the deciles with the most and fewest executive officers, over the period from the 1996 through 2016 proxy seasons.
range of number of executive officers — trends over time
Executive Officers (continued)
SV 150 S&P 100
Number ofexecutives
1996 0
5
10
15
20
25
30
35
40
45
50
55
1996 2006 2006 2016 2016
median
9th decile
high value
outlier
low value
1st decile
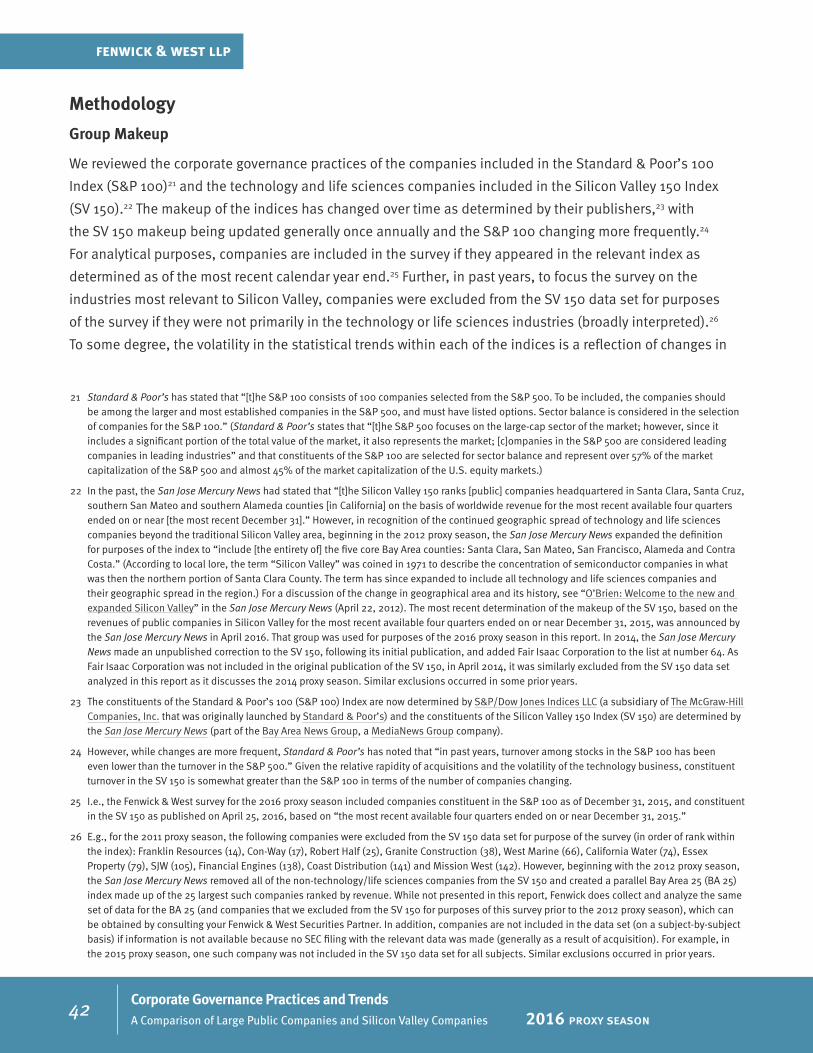
Corporate Governance Practices and TrendsA Comparison of Large Public Companies and Silicon Valley Companies 2016 proxy season
42
fenwick & west llp
Methodology
Group Makeup
We reviewed the corporate governance practices of the companies included in the Standard & Poor’s 100
Index (S&P 100)21 and the technology and life sciences companies included in the Silicon Valley 150 Index
(SV 150).22 The makeup of the indices has changed over time as determined by their publishers,23 with
the SV 150 makeup being updated generally once annually and the S&P 100 changing more frequently.24
For analytical purposes, companies are included in the survey if they appeared in the relevant index as
determined as of the most recent calendar year end.25 Further, in past years, to focus the survey on the
industries most relevant to Silicon Valley, companies were excluded from the SV 150 data set for purposes
of the survey if they were not primarily in the technology or life sciences industries (broadly interpreted).26
To some degree, the volatility in the statistical trends within each of the indices is a reflection of changes in
21 Standard & Poor’s has stated that “[t]he S&P 100 consists of 100 companies selected from the S&P 500. To be included, the companies should be among the larger and most established companies in the S&P 500, and must have listed options. Sector balance is considered in the selection of companies for the S&P 100.” (Standard & Poor’s states that “[t]he S&P 500 focuses on the large-cap sector of the market; however, since it includes a significant portion of the total value of the market, it also represents the market; [c]ompanies in the S&P 500 are considered leading companies in leading industries” and that constituents of the S&P 100 are selected for sector balance and represent over 57% of the market capitalization of the S&P 500 and almost 45% of the market capitalization of the U.S. equity markets.)
22 In the past, the San Jose Mercury News had stated that “[t]he Silicon Valley 150 ranks [public] companies headquartered in Santa Clara, Santa Cruz, southern San Mateo and southern Alameda counties [in California] on the basis of worldwide revenue for the most recent available four quarters ended on or near [the most recent December 31].” However, in recognition of the continued geographic spread of technology and life sciences companies beyond the traditional Silicon Valley area, beginning in the 2012 proxy season, the San Jose Mercury News expanded the definition for purposes of the index to “include [the entirety of] the five core Bay Area counties: Santa Clara, San Mateo, San Francisco, Alameda and Contra Costa.” (According to local lore, the term “Silicon Valley” was coined in 1971 to describe the concentration of semiconductor companies in what was then the northern portion of Santa Clara County. The term has since expanded to include all technology and life sciences companies and their geographic spread in the region.) For a discussion of the change in geographical area and its history, see “O’Brien: Welcome to the new and expanded Silicon Valley” in the San Jose Mercury News (April 22, 2012). The most recent determination of the makeup of the SV 150, based on the revenues of public companies in Silicon Valley for the most recent available four quarters ended on or near December 31, 2015, was announced by the San Jose Mercury News in April 2016. That group was used for purposes of the 2016 proxy season in this report. In 2014, the San Jose Mercury News made an unpublished correction to the SV 150, following its initial publication, and added Fair Isaac Corporation to the list at number 64. As Fair Isaac Corporation was not included in the original publication of the SV 150, in April 2014, it was similarly excluded from the SV 150 data set analyzed in this report as it discusses the 2014 proxy season. Similar exclusions occurred in some prior years.
23 The constituents of the Standard & Poor’s 100 (S&P 100) Index are now determined by S&P/Dow Jones Indices LLC (a subsidiary of The McGraw-Hill Companies, Inc. that was originally launched by Standard & Poor’s) and the constituents of the Silicon Valley 150 Index (SV 150) are determined by the San Jose Mercury News (part of the Bay Area News Group, a MediaNews Group company).
24 However, while changes are more frequent, Standard & Poor’s has noted that “in past years, turnover among stocks in the S&P 100 has been even lower than the turnover in the S&P 500.” Given the relative rapidity of acquisitions and the volatility of the technology business, constituent turnover in the SV 150 is somewhat greater than the S&P 100 in terms of the number of companies changing.
25 I.e., the Fenwick & West survey for the 2016 proxy season included companies constituent in the S&P 100 as of December 31, 2015, and constituent in the SV 150 as published on April 25, 2016, based on “the most recent available four quarters ended on or near December 31, 2015.”
26 E.g., for the 2011 proxy season, the following companies were excluded from the SV 150 data set for purpose of the survey (in order of rank within the index): Franklin Resources (14), Con-Way (17), Robert Half (25), Granite Construction (38), West Marine (66), California Water (74), Essex Property (79), SJW (105), Financial Engines (138), Coast Distribution (141) and Mission West (142). However, beginning with the 2012 proxy season, the San Jose Mercury News removed all of the non-technology/life sciences companies from the SV 150 and created a parallel Bay Area 25 (BA 25) index made up of the 25 largest such companies ranked by revenue. While not presented in this report, Fenwick does collect and analyze the same set of data for the BA 25 (and companies that we excluded from the SV 150 for purposes of this survey prior to the 2012 proxy season), which can be obtained by consulting your Fenwick & West Securities Partner. In addition, companies are not included in the data set (on a subject-by-subject basis) if information is not available because no SEC filing with the relevant data was made (generally as a result of acquisition). For example, in the 2015 proxy season, one such company was not included in the SV 150 data set for all subjects. Similar exclusions occurred in prior years.
Corporate Governance Practices and TrendsA Comparison of Large Public Companies and Silicon Valley Companies 2016 proxy season
43
fenwick & west llp
the constituents of the index over time.27 Finally, some companies are constituents of both indices.28 Those
companies are included in the data sets of both groups for purposes of this survey.
Proxy Season / Proxy Statements
To be included in the data set for a particular “proxy season,” the definitive proxy statement for a company’s
annual meeting generally must have been filed by the company with the Securities and Exchange Commission
(SEC) during the year ended June 30, irrespective of when the annual meeting was actually held.29 In some
instances, a company may not have consistently filed its annual meeting proxy statement on the same side of
the cutoff date each year. In such cases, we have normalized the data by including only one proxy statement
per year for a company (and including a proxy statement in a “proxy season” year even though it was filed
beyond the normal cutoff).30 In some instances, a company may not have filed an annual meeting proxy
statement during a year at all (or held any annual meeting).31 In such instances, data was gleaned for that
company from other SEC filings to the extent available.32
Generally, where a trend graphic identifies a year, it presents information as of the time of the proxy
statement (such as the number of directors or whether the company has majority voting for directors, a
classified board or dual-class stock structure), in which event the data speaks as to circumstances in effect at
the time of the proxy statement (rather than at some particular time during the preceding year or immediately
following the annual meeting) and is presented by “proxy season” (as defined for purposes of the survey).
Generally, any discussion of the data will be by proxy season and will contain a “2016” statistic in the
graphic. However, some information (primarily meeting data) is shown in graphics for the year for which the
data was presented in the relevant proxy statements rather than the year of the proxy statement themselves.
For example, a proxy statement filed in April 2016 included data about the number of board and committee
meetings for 2015. That data would be included in the graphic in the year “2015” statistic (and no “2016”
statistic would be included since the fiscal year for the relevant data is ongoing).
27 Other factors include changes in board membership and turnover in the chief executive officer of constituent companies.
28 For example, for the 2016 proxy season, the following companies were included in each of the S&P 100 and the SV 150 (in order of rank within the SV 150 index): Apple (1), Alphabet (2), Intel (3), Cisco (6), Oracle (7), Gilead (8), Facebook (9), PayPal Holdings (12).
29 I.e., the proxy statements included in the 2016 proxy season survey were generally filed with the SEC from July 1, 2015 through June 30, 2016.
30 E.g., several companies generally filed proxy statements in June each year, but in a particular year filed in July (or later). The data for such a proxy statement was “moved” into the data set for the “proxy season” year before the cutoff.
31 This can occur for a variety of reasons, including among others instances where: (a) a company could fail to timely file its periodic reports due to a pending or potential accounting restatement (such as during the so-called “stock option backdating scandals” that afflicted several Silicon Valley companies), or (b) a company was acquired or had agreed to be acquired (and determined to defer an annual meeting during the pendency of the acquisition).
32 Generally Forms 10-K or S-4 and Schedules 14D-9 or TO as well as proxy statements for mergers (Schedules 14A) when the company is in the process of being acquired. These sources generally provide only a subset of the data available in an annual meeting proxy statement (Schedule 14A). Sometimes these filings were made beyond the standard cutoff for the relevant proxy season for purposes of the survey, but were nonetheless included in the survey data set for that proxy season if they generally presented data for the period that would have been covered by the proxy statement for that company if it had been filed. See footnote 30 and accompanying text.
Methodology (continued)

Corporate Governance Practices and TrendsA Comparison of Large Public Companies and Silicon Valley Companies 2016 proxy season
44
fenwick & west llp
Insider / Independent
There are a variety of meanings that are ascribed to the terms “insider” and “not independent,” which are
colloquially used somewhat interchangeably. We have attempted to cover a variety of these meanings within
the same survey. At the narrowest end of the spectrum, a director is considered an insider if he or she is
currently an officer or otherwise an employee of the company (and not an insider if he or she is not currently
an officer/employee). At the broadest end of the spectrum, some commentators consider a director to be an
insider if he or she has ever been an officer of the company. In between these ends of the spectrum, the stock
exchanges have promulgated rules that define independence as not having been an officer or otherwise an
employee of a company for the last three years, in addition to other specified criteria that vary somewhat by
stock exchange.33
However, companies have not always been required to state with respect to each director whether he or
she meets the applicable stock exchange’s independence criteria (as implemented by that company).34
Consequently, when our survey was initiated, we also utilized a simplified version of the stock exchange
rules, only applying the three-year employment test to the director since that information can be gleaned
from the requisite biographical summary that has long been included in proxy statements.35 This allowed
us to include all companies surveyed in this particular version of “insider” status throughout the period
covered (while not all have been historically included for the applicable stock exchange independence criteria
statistics across the period),36 and we have carried that methodology forward for trend analysis purposes.
Finally, for purposes of the statistics regarding insider board chairs in this report, we have collected
information based on the same four meanings. However, when only presenting one meaning of insider board
33 See, e.g., Section 303A.02 of the New York Stock Exchange (NYSE) Listed Company Manual and Rule 5605(a)(2) of the Nasdaq Stock Market (Nasdaq) Marketplace Rules. They generally provide coverage for compensation from the company to a director above a specified level (other than for board service) [currently each exchange specifies $120,000 during any 12 months within the last three years], certain levels of business relationship between the company on whose board a director serves and a company that employs him or her, and similar employment by, compensation to or business relationships with a director’s immediate family members, among other factors. Further, in implementing these rules, a number of companies have adopted their own independence standards (e.g., to define “material relationships” that will preclude independence under a portion of the NYSE rule).
34 Current Item 407(a) of Regulation S-K requires such disclosure. Prior to its adoption in 2006, companies were merely required to state whether a majority of their directors were independent, and some merely stated that fact rather than identifying their independent or non-independent directors (though for many of those independence could be largely deduced based on the disclosures in the proxy statement regarding independence of members of the primary board committees and director biography – particularly with smaller boards).
35 Accordingly, family member relationships or other indicia of non-independence are not factored in for this purpose.
36 Where a company did not provide enough information to determine the independence of each director (e.g., by affirmative statement or by elimination through biographical and committee membership information), the company was excluded from the data set for calculating the statistics based on the applicable stock exchange criteria.
Methodology (continued)
Corporate Governance Practices and TrendsA Comparison of Large Public Companies and Silicon Valley Companies 2016 proxy season
45
fenwick & west llp
chair, the statistics generally have presented information based on the applicable stock exchange standard
(or simplified three-year employment rule where that is not available).37
Nominating and Governance Committees / Other Standing Committees
Generally, the companies surveyed have a unified committee with responsibility for both nominating and
governance functions. However, a small number of companies have separate committees for nominating
functions and for governance functions.38 For statistical purposes, where separate committees existed, the
data for the nominating committee was included (and data for the governance committee ignored) for the
information presented in this report. Such separate governance committees were also ignored for purposes
of the statistics for “Other Standing Committees” included in this report. Similarly, an exceedingly small
number of companies have had a committee that combined the nominating function with the function of one
of the other primary committees in a single committee.39 In such rare instances, the data for that committee
was included in the data set for each of the primary committees it comprised.40 In addition, some companies
have not formed a nominating committee,41 and instead nomination decisions are made by the independent
directors as a group.42 In such instances, our statistics have treated that group as the nominating committee.
Further, with respect to the statistics regarding “Other Standing Committees” included in this report, we
have disregarded “Stock Option,” “Equity Incentive” and other committees whose sole (or almost exclusive)
function is to approve grants to non-executive employees and consultants of the company.43
Equity / Voting Ownership
The percentage of equity and voting ownership statistics was based on beneficial ownership data presented
in the Security Ownership of Certain Beneficial Owners and Management table,44 as well as other information
regarding voting and conversion rights included elsewhere in proxy statements and other filings with the SEC.
A fair number of companies report aggregate ownership by all executive officers and directors as a group of
37 For purposes of the Lead Director statistics, we have not applied this methodology. Rather, we have included any company as having a Lead Director if the proxy statement identified a specific director as having the title of “Lead Director,” “Lead Independent Director” or “Presiding Director” (or a similar title). Generally all such directors were independent under all of the methods we applied (including the applicable stock exchange independence requirement), though some were not under the “Ever” [a company employee] Rule.
38 While always rare, it has become increasingly less common over time.
39 Such as a unified “Compensation and Corporate Governance Committee” that the proxy statement described as having nominating functions.
40 E.g., data for a unified “Compensation and Corporate Governance Committee” that the proxy statement described as having nominating functions was included in the data for the Compensation Committee and the Nominating Committee with respect to that company.
41 This was considerably more common, particularly in the SV 150, prior to the wave of governance reforms in the wake of the Sarbanes-Oxley Act of 2002.
42 In some instances, particularly before the wave of governance reforms in the wake of the Sarbanes-Oxley Act of 2002, the nominating decisions were made by the board as a whole.
43 These “committees” generally consist of the CEO as the sole member or are made up of members of the company’s management team operating with delegated authority in order to relieve the Board of the burden of routine grants of stock-based compensation. Consequently, they are not really indicative of general board operations.
44 Item 403 of Regulation S-K (required by Item 6(d) of Schedule 14A).
Methodology (continued)

Corporate Governance Practices and TrendsA Comparison of Large Public Companies and Silicon Valley Companies 2016 proxy season
46
fenwick & west llp
“less than 1%” (whether measured as simply equity or voting ownership).45 For purposes of calculating the
average ownership statistics, companies that reported “less than 1%” ownership were treated as having
ownership of 0.5% in the data set.46
Majority Voting
There are a variety of ways to implement majority voting. These range from strict majority voting provisions
in the charter or bylaws that require a majority of “for” votes for a director to be elected (and if less than a
majority, the director simply does not take, or loses, office) to various resignation policies implemented in
corporate governance principles that simply require a director to tender a resignation if less than a majority
of “for” votes are received, which may or may not be accepted by the board or nominating committee (which
retains full discretion in making the decision) — with a range of variations in between (often implemented
in bylaws), generally with contested elections retaining plurality voting. The effectiveness of any of these
(including the charter implementations) are further impacted by state laws that often provide for holding
over of an incumbent even if a majority of “for” votes is not received (to prevent an unnecessary vacancy).
Consequently, rather than attempt to illustrate the trends among the many variations, we have simply
presented data regarding whether the companies surveyed have implemented any form of majority voting
policy for uncontested elections (rather than having simply retained plurality voting for all director elections).
Dual-Class Structure
Generally, where a company has more than one class of stock and those classes have disparate voting rights,
they were included in the data set as having a dual-class structure. However, in some instances companies
may have a class of stock with disparate voting rights, but that class is incredibly small compared to the
overall voting power represented by all voting stock or there are other indicia that the voting rights are not
really effectively disparate.47 In such cases, such companies were not included in the data set as having a
dual-class voting stock structure.
Executive Officer and Director Stock Ownership Guidelines
Generally companies disclose whether they have, and details regarding, any stock ownership requirements
for executive officers and directors in the Compensation Discussion and Analysis (CD&A) sections and
45 SEC regulations permit such reporting. In the 2016 season, this included approximately 71% of S&P 100 companies and 14% of SV 150 companies.
46 Companies that reported an actual numerical ownership percentage that happened to be less than 1% were included in the data set with the numerical ownership percentage reported.
47 E.g., where the company might have a class of preferred stock outstanding in addition to its common stock and each share of preferred stock is entitled to more votes than each share of common stock, but the preferred stock is also convertible to common stock at the same ratio as the ratio of votes per share of preferred to votes per share of common. Some editorial judgment was necessarily applied in drawing such distinctions.
Methodology (continued)
Corporate Governance Practices and TrendsA Comparison of Large Public Companies and Silicon Valley Companies 2016 proxy season
47
fenwick & west llp
Director Compensation sections of their proxy statements.48 However, the SEC only began requiring the CD&A
section to be included in filed proxy statements filed on or after December 15, 2006. Further, SEC rules do
not strictly call for disclosure of director stock ownership requirements. In our experience, companies that
had such executive officer or director ownership guidelines generally have disclosed them for stockholder
relations reasons even in the absence of such requirements. In addition, where a company later disclosed
stock ownership requirements and provided a history of those guidelines that indicated that they were
adopted in prior years, we have retroactively applied that information in our data set (even though those
guidelines were not discussed in the proxy statement covering that prior period).49 Consequently, we
believe that the trend information regarding stock ownership guidelines presented in this report is fairly
representative of company practices in this area.
Executive Officers
SEC regulations define the term “executive officer” as a company’s “president, any vice president of the
[company] in charge of a principal business unit, division or function (such as sales, administration or
finance), any other officer who performs a policy making function, or any other person who performs similar
policy making functions for the [company].”50 A company’s determination of executive officers under this
definition is an inherently factual one, with the focus less on a person’s title and more on their actual duties
or substantive role within the company. The SEC Staff will not provide advice or concurrence regarding a
determination. So companies, with the advice of their counsel, must apply the facts, judicial decisions
and various statements by the SEC Staff when applying the rule.51 We have not tried to second guess these
inherently subjective conclusions, and have simply accepted the executive officer determinations made by
companies and/or their boards as reflected in their SEC filings.52 It is possible that the number of executive
officers is effectively systematically under-reported due to the timing of executive departures.53
48 Among the items that the SEC listed as examples of material elements of the company’s compensation for the named executive officers to be included in CD&A is “the company’s equity or other security ownership requirements or guidelines and any company policies regarding hedging the economic risk of such ownership.” See current Item 402(b)(2)(xiii) of Regulation S-K, which requires such disclosure.
49 This was a fairly rare circumstance.
50 See Rule 3b-7 under the Securities Exchange Act of 1934, as amended. The rule goes on to provide that “[e]xecutive officers of subsidiaries [of a company] may be deemed executive officers of the [parent company] if they perform such policy making functions for the [parent company].”
51 As noted in “Study: Benchmarking the Number of ‘Executive Officers’” by TheCorporateCounsel.net and LogixData, “[i]n particular, determining whether a business unit, division or function is a ‘principal’ one – or whether a person’s sphere of responsibility involves significant policymaking – can be challenging. Internal company politics can play a role too. Sometimes people are deemed to be ‘executive officers’ even though they really do not have important functions or policymaking responsibilities, but are deemed as such because the company doesn’t want to tell them that their stature isn’t equal to others at the same level on the organization chart, etc.” Companies and their advisers often use as a starting point in this analysis an informal rule of thumb that any officer that reports directly to the CEO (or sometimes president) should be presumed to be an executive officer, absent meaningful substantive indicia to the contrary.
52 As a practical matter, the judgment of who is an executive officer is made annually by the board of directors of most companies at the time the board approves the list of executive officers in connection with the filing of their Forms 10-K (or proxy statement).
53 For example, if an executive officer resigns shortly prior to the filing of the company’s proxy statement and the company has not yet hired a replacement (even though it intends to do so – and in fact for most of the years preceding and succeeding the filing in fact has a person filling the position of the departed executive), then that company may list one fewer executive officer in its proxy statement than it generally has in practice.
Methodology (continued)

Corporate Governance Practices and TrendsA Comparison of Large Public Companies and Silicon Valley Companies 2016 proxy season
48
fenwick & west llp
Gender
In almost all cases, the proxy statement or other SEC filings of a company clearly identify the gender of each
of its executive officers and directors.54 In a small number of instances, we resorted to limited supplemental
research (apart from reviewing SEC filings) to identify gender.55 This supplemental research generally took
the form of researching a relevant individual on freely available public sources.56 We accepted the gender
identifications in SEC filings or such supplemental sources at face value.
Outliers
For purposes of the distribution graphs (such as those at the top and bottom of page 9), outliers have been
determined by applying a fence equal to 1.5 times the interdecile range (i.e., the difference between the first
and ninth decile amounts multiplied by 1.5). Any result beyond that fence is shown as an outlier (represented
by a ).
54 I.e., through the use of the prefix “Mr.” or “Ms.” in the individual’s biographical description or elsewhere in the filing(s).
55 Most typically these involved instances in which the prefix “Dr.” was consistently used (and the prefixes “Mr.” or “Ms.” were not).
56 I.e., the bios for such individual on the relevant company’s web page or the web pages for other companies for which the individual serves as an executive officer or director, LinkedIn profiles, biographical profiles prepared by reputable online sources, etc.
Methodology (continued)

Corporate Governance Practices and TrendsA Comparison of Large Public Companies and Silicon Valley Companies 2016 proxy season
49
fenwick & west llp
About the Firm
Fenwick & West provides comprehensive legal services to technology and life sciences clients of national
and international prominence. Fenwick is committed to providing innovative, cost-effective and practical
legal services that focus on global technology industries and issues. We have built internationally recognized
practices in a wide spectrum of corporate, intellectual property, tax and litigation areas. We have also
received praise for our innovative use of technology, our pro bono work and diversity efforts. We differentiate
ourselves by having a deep understanding of our clients’ technologies, industry environments and business
needs. For more information, visit www.fenwick.com.
About the Author
David A. Bell’s practice includes advising start-up companies, venture capital financings,
mergers and acquisitions, initial public offerings and intellectual property licensing, as
well as counseling public companies in corporate, securities, governance and compliance
matters. He represents a wide range of technology companies, from privately held start-ups
to publicly traded corporations.
I thank the myriad associates and other researchers who have participated in the survey data gathering over
the years, as well as the information graphics and design specialists who have assisted in the preparation of
this report.
The views expressed are those of the author and do not necessarily represent the views of any other partner
of Fenwick & West LLP or the firm as a whole, nor do they necessarily represent the views of the firm’s many
clients that are mentioned in this report or are constituents of either the SV 150 or the S&P 100 indices.
For additional information about this report, please contact David A. Bell at Fenwick & West at 650.335.7130 or
To be placed on an email list for future editions of this survey, please visit fenwick.com/subscribe-CG-Survey. The contents of this publication are not intended and cannot be considered as legal advice or opinion. © 2016 Fenwick & West LLP. All Rights Reserved.
