proxy statement for the 201 annual meeting of … · 201 annual meeting of stockholders and 201...
TRANSCRIPT

Proxy Statement for the 201 Annual Meeting of Stockholdersand 201 Annual Report
76
Dear Partner,
After record results in 2015, this past year was an important transformational one for L Brands. Although 2016adjusted EPS declined 6 percent against last year’s record, we continued to see momentum in our PINK and Bath& Body Works businesses, and we accomplished a lot of important and necessary progress at Victoria’s SecretLingerie and Beauty.
Specifically:
• Our PINK business continued its strong performance with low double-digit sales growth over last year.At well over $1,000 in sales per square foot, PINK is our most productive business and continues todeliver significant growth … driven by an exceptionally close connection to the customer, excellentleadership and a focused team, and speed in our supply chain. We continue to invest in square footagegrowth for the PINK business, in order to provide the full assortment in more locations. Theseinvestments continue to drive strong returns.
• At Bath & Body Works, effective leadership and a strong team contributed to the delivery of anotherrecord year on top of last year’s record performance … sales increased 7 percent and operating incomeincreased 6 percent. We ended the year with 240 new concept stores which include the White Barndesign for our home fragrance assortment. While the investment in these stores results in near-termfinancial pressure, they continue to drive significant sales increases and importantly present a new,compelling store design to our customers.
• We made a number of significant strategic changes at Victoria’s Secret to focus the business andstimulate accelerated growth. We reorganized into three separate business units (Victoria’s SecretLingerie, PINK and Victoria’s Secret Beauty) – integrating the direct channel into those businesses –and appointed new leaders in Victoria’s Secret Lingerie and Victoria’s Secret Beauty. We eliminated thenon-core merchandise categories of swim and apparel in order to increase focus and resources forgrowth in our core categories; and we changed how the business connects with customers through moreemphasis on brand-building and loyalty-enhancing marketing. We eliminated an obsolete printcatalogue and brand-eroding promotional offers. These changes were important, necessary and overdue– all critical to continuing to focus on the core and position Victoria’s Secret more effectively forsubstantial future growth … with our priority in North America.
• We are a global business! In 2016, we opened more than 100 new stores outside of North America toend the year with 830 stores in 78 countries. China is a top priority … we acquired 26 stores in Chinafrom our franchise partner. The China market is too big and too important for us not to own it. We builtthe capability and infrastructure to support accelerated future growth in China, launched our onlinebusiness on TMall Global and opened our first two full-assortment Victoria’s Secret stores just afteryear-end … we will have 6 full-assortment stores by the end of this year. I was in China for the openingof these first stores in Shanghai and Chengdu – and was thrilled by the store experience, customerresponse and demand for Victoria’s Secret. Our opportunity for growth in China is very large … we arebuilding the organization needed to support accelerated growth.
• We are committed to returning value to our shareholders through a combination of dividends and sharerepurchase programs. In 2016, we increased our regular annual dividend 20 percent from $2.00 to $2.40per share, paid a $2.00 per share special dividend and repurchased $438 million of our stock.
• Our leadership and global team are exceptional. Talent is key to our success, and I’m confident that wehave one of the best teams in retail – experienced, focused and aligned.
2016 was our second best year ever – and we undertook some tough and important actions. Major change isdifficult – and yet foundationally necessary for renewal and growth. Today it looks like these changes weresound decisions … and I can see the progress and the opportunity of these actions. As I reflect on 2016 and allthat we accomplished, and consider our position today, I am confident and optimistic.
I don’t undertake the challenge of change lightly, but I do it enthusiastically, knowing that fashion is the ultimatechange industry. We have “best brands” … Victoria’s Secret, Bath & Body Works, PINK … world-leading;positively received around the world; with strong, emotional connections to our customers – and we have capableand experienced leadership – strong teams. Foundationally, abundant opportunities for growth. A strong culture,a sense of doing what is right and the determination to excel.
Ch
airman
’sL
etter

The idea of solid, industry-leading performance is simple … but the execution isn’t easy. It IS tried and true: Tobe the best … we must be FOCUSED – on our core, our priorities and executing excellently. We must be FAST– agile, change-eager, quick thinking. And we must be FRUGAL – distorting resources to what gives us thehighest return on investment (both time and money). Deciding what not to do! In a broad sense, we’ve rebootedthe business … and reaffirmed our goals and core values – our culture.
We have great brands … solid leaders and wonderful people … we are determined to achieve the significantgrowth goals we have for our business. We are better positioned than we’ve ever been. We are prepared for thefuture – and confident about tomorrow.
Sincerely,
Leslie H. WexnerChairman and CEO

Notice ofAnnual Meeting of Stockholdersand Proxy StatementMay 18, 2017
Pro
xyS
tatemen
t

Important Notice Regarding the Availability of Proxy Materials for the Stockholder Meeting to BeHeld on May 18, 2017: The proxy statement and annual report to stockholders are available atwww.proxyvote.com.

April 6, 2017
DEAR STOCKHOLDER:
You are cordially invited to attend our 2017 annual meeting of stockholders to be held at 8:30 a.m., EasternTime, on May 18, 2017, at our offices located at Three Limited Parkway, Columbus, Ohio 43230. Our InvestorRelations telephone number is (614) 415-7585 should you require assistance in finding the location of themeeting. The formal Notice of Annual Meeting of Stockholders and proxy statement are attached. If you plan toattend, please bring the Admittance Slip located at the back of this booklet and a picture I.D., and review theattendance information provided. I hope that you will be able to attend and participate in the meeting, at whichtime I will have the opportunity to review the business and operations of our company.
The matters to be acted upon by our stockholders are discussed in the Notice of Annual Meeting ofStockholders. It is important that your shares be represented and voted at the meeting. Accordingly, after readingthe attached proxy statement, would you kindly sign, date and return the enclosed proxy card or vote bytelephone or via the Internet as described on the enclosed proxy card. Your vote is important regardless of thenumber of shares you own.
Sincerely yours,
Leslie H. WexnerChairman of the Board
Pro
xyS
tatemen
t

[THIS PAGE INTENTIONALLY LEFT BLANK]

NOTICE OF ANNUAL MEETING OF STOCKHOLDERS
May 18, 2017
April 6, 2017
TO THE STOCKHOLDERS OF L BRANDS, INC.:
We are pleased to invite you to attend our 2017 annual meeting of stockholders to:
• Elect the four nominees proposed by the Board of Directors as directors to serve for a three-year term.
• Ratify the appointment of our independent registered public accountants.
• Hold an advisory vote to approve named executive officer compensation.
• Hold an advisory vote on the frequency of future advisory votes on named executive officercompensation.
• Vote on the stockholder proposal to change certain voting requirements, if properly presented at themeeting.
• Transact such other business as may properly come before the meeting.
Stockholders of record at the close of business on March 24, 2017 may vote at the meeting. If you plan toattend, please bring the Admittance Slip located at the back of this booklet and a picture I.D., and reviewthe attendance information provided. Your vote is important. Stockholders of record can give proxies bycalling a toll-free telephone number, by using the Internet or by mailing their signed proxy cards. Whether or notyou plan to attend the meeting, please vote by telephone or via the Internet or sign, date and return the enclosedproxy card in the envelope provided. Instructions are included on your proxy card. You may change your vote bysubmitting a later dated proxy (including a proxy via telephone or the Internet) or by attending the meeting andvoting in person.
By Order of the Board of Directors,
Leslie H. WexnerChairman of the Board
Pro
xyS
tatemen
t

PROXY STATEMENT TABLE OF CONTENTS
PAGE
INFORMATION ABOUT THE ANNUAL MEETING AND VOTING . . . . . . . . . . . . . . . . . . . . . . . . . . . 1
PROPOSAL 1: ELECTION OF DIRECTORS . . . . . . . . . . . . . . . . . . . . . . . . . . . . . . . . . . . . . . . . . . . . . . 5
PROPOSAL 2: RATIFICATION OF THE APPOINTMENT OF INDEPENDENT REGISTEREDPUBLIC ACCOUNTANTS . . . . . . . . . . . . . . . . . . . . . . . . . . . . . . . . . . . . . . . . . . . . . . . . 13
PROPOSAL 3: ADVISORY VOTE TO APPROVE NAMED EXECUTIVE OFFICERCOMPENSATION . . . . . . . . . . . . . . . . . . . . . . . . . . . . . . . . . . . . . . . . . . . . . . . . . . . . . . . 14
PROPOSAL 4: ADVISORY VOTE ON THE FREQUENCY OF FUTURE ADVISORY VOTES ONNAMED EXECUTIVE OFFICER COMPENSATION . . . . . . . . . . . . . . . . . . . . . . . . . . . 16
PROPOSAL 5: STOCKHOLDER PROPOSAL TO CHANGE CERTAIN VOTINGREQUIREMENTS . . . . . . . . . . . . . . . . . . . . . . . . . . . . . . . . . . . . . . . . . . . . . . . . . . . . . . . 17
COMPENSATION-RELATED MATTERS . . . . . . . . . . . . . . . . . . . . . . . . . . . . . . . . . . . . . . . . . . . . . . . . . 20
Compensation Discussion and Analysis . . . . . . . . . . . . . . . . . . . . . . . . . . . . . . . . . . . . . . . . . . . . . . . . . 20
2016 Summary Compensation Table . . . . . . . . . . . . . . . . . . . . . . . . . . . . . . . . . . . . . . . . . . . . . . . . . . . 36
Grants of Plan-Based Awards for Fiscal 2016 . . . . . . . . . . . . . . . . . . . . . . . . . . . . . . . . . . . . . . . . . . . . 38
Outstanding Equity Awards at Fiscal Year-End for Fiscal 2016 . . . . . . . . . . . . . . . . . . . . . . . . . . . . . . 40
Option Exercises and Stock Vested Information for Fiscal 2016 . . . . . . . . . . . . . . . . . . . . . . . . . . . . . 43
Retirement and Other Post-Employment Benefits . . . . . . . . . . . . . . . . . . . . . . . . . . . . . . . . . . . . . . . . . 44
Non-qualified Deferred Compensation for Fiscal 2016 . . . . . . . . . . . . . . . . . . . . . . . . . . . . . . . . . . . . . 44
Fiscal 2016 Director Compensation . . . . . . . . . . . . . . . . . . . . . . . . . . . . . . . . . . . . . . . . . . . . . . . . . . . . 49
COMPENSATION COMMITTEE REPORT . . . . . . . . . . . . . . . . . . . . . . . . . . . . . . . . . . . . . . . . . . . . . . . . 50
SECURITY OWNERSHIP OF DIRECTORS AND MANAGEMENT . . . . . . . . . . . . . . . . . . . . . . . . . . . . 51
SECTION 16(A) BENEFICIAL OWNERSHIP REPORTING COMPLIANCE . . . . . . . . . . . . . . . . . . . . . 53
SHARE OWNERSHIP OF PRINCIPAL STOCKHOLDERS . . . . . . . . . . . . . . . . . . . . . . . . . . . . . . . . . . . 54
REPORT OF THE AUDIT COMMITTEE . . . . . . . . . . . . . . . . . . . . . . . . . . . . . . . . . . . . . . . . . . . . . . . . . . 55
INDEPENDENT REGISTERED PUBLIC ACCOUNTANTS . . . . . . . . . . . . . . . . . . . . . . . . . . . . . . . . . . . 56
OTHER MATTERS . . . . . . . . . . . . . . . . . . . . . . . . . . . . . . . . . . . . . . . . . . . . . . . . . . . . . . . . . . . . . . . . . . . . 57
STOCKHOLDER PROPOSALS FOR NEXT YEAR . . . . . . . . . . . . . . . . . . . . . . . . . . . . . . . . . . . . . . . . . . 57
SOLICITATION EXPENSES . . . . . . . . . . . . . . . . . . . . . . . . . . . . . . . . . . . . . . . . . . . . . . . . . . . . . . . . . . . . 57

INFORMATION ABOUT THE ANNUAL MEETING AND VOTING
The Board of Directors (the “Board”) is soliciting your proxy to vote at our 2017 annual meeting ofstockholders (or at any adjournment of the meeting). This proxy statement summarizes the information you needto know to vote at the meeting. In this proxy statement, “we,” “our,” “L Brands” and the “Company” refer toL Brands, Inc.
We began mailing this proxy statement and the enclosed proxy card, or the Notice of Internet Availability ofProxy Materials (the “Notice”), on or about April 7, 2017 to all stockholders entitled to vote. The Company’s2016 Annual Report on Form 10-K, which includes our financial statements, is being sent with this proxystatement and is available in paper copy by request or in electronic form.
Date, Time and Place of Meeting
Date: May 18, 2017
Time: 8:30 a.m., Eastern Time
Place: Three Limited Parkway, Columbus, Ohio 43230
Attending the Meeting
Stockholders who plan to attend the meeting in person must bring photo identification and the AdmittanceSlip located at the back of this booklet. Because of necessary security precautions, bags, purses and briefcasesmay be subject to inspection. To speed the admissions process, stockholders are encouraged to bring onlyessential items. Cameras, camcorders or videotaping equipment are not allowed.
Shares Entitled to Vote
Stockholders entitled to vote are those who owned Company common stock (which we refer to throughoutthis proxy statement as “Common Stock”) at the close of business on the record date, March 24, 2017. As of therecord date, there were 284,809,090 shares of Common Stock outstanding. Each share of Common Stock thatyou own entitles you to one vote.
Voting Your Shares
Whether or not you plan to attend the annual meeting, we urge you to vote. Stockholders of record can giveproxies by calling a toll-free telephone number, by using the Internet or by mailing their signed proxy cards. Thetelephone and Internet voting procedures are designed to authenticate stockholders’ identities, to allowstockholders to give their voting instructions and to confirm that stockholders’ instructions have been recordedproperly. If you are voting by mail, please complete, sign and date the enclosed proxy card and return it promptlyin the envelope provided. If you are voting by telephone or via the Internet, please use the telephone or Internetvoting procedures set forth on the enclosed proxy card. Returning the proxy card or voting via telephone or theInternet will not affect your right to attend the meeting and vote.
The enclosed proxy card indicates the number of shares that you own.
Voting instructions are included on your proxy card. If you properly fill in your proxy card and send it to usor vote via telephone or the Internet in time to vote, one of the individuals named on your proxy card (your“proxy”) will vote your shares as you have directed. If you sign the proxy card or vote via telephone or theInternet but do not make specific choices, your proxy will follow the Board’s recommendations and vote yourshares in the following manner:
• “FOR” the election of the Board’s four nominees for director (as described on pages 5 and 6);
1
Pro
xyS
tatemen
t

• “FOR” the ratification of the appointment of our independent registered public accountants (asdescribed on page 13);
• “FOR” on the advisory vote to approve named executive officer compensation (as described on pages14 and 15);
• “1 Year” on the advisory vote on the frequency of future advisory votes on named executive officercompensation (as described on page 16); and
• “AGAINST” the stockholder proposal (as described on pages 17 to 19).
If any other matter is properly presented at the meeting, your proxy will vote in accordance with his or herbest judgment. At the time this proxy statement went to press, we knew of no other matters to be acted on at themeeting. See “—Vote Necessary to Approve Proposals” for a discussion of the votes required to approve theseitems.
Certain stockholders received a Notice containing instructions on how to access this proxy statement andour 2016 Annual Report on Form 10-K via the Internet. Those stockholders should refer to the Notice forinstructions on how to vote.
Revoking Your Proxy
You may revoke your proxy by:
• submitting a later dated proxy (including a proxy via telephone or the Internet);
• notifying our Secretary at our principal executive offices at Three Limited Parkway, Columbus, Ohio43230, in writing before the meeting that you have revoked your proxy; or
• voting in person at the meeting.
Voting in Person
If you plan to vote in person, a ballot will be available when you arrive. However, if your shares are held inthe name of your broker, bank or other nominee, you must bring an account statement or letter from the nomineeindicating that you were the beneficial owner of the shares at the close of business on March 24, 2017, the recorddate for voting, as well as a proxy, executed in your favor, from the nominee.
Appointing Your Own Proxy
If you want to give your proxy to someone other than the individuals named as proxies on the proxy card,you may cross out the names of those individuals and insert the name of the individual you are authorizing tovote. Either you or that authorized individual must present the proxy card at the meeting.
Quorum Requirement
A quorum of stockholders is necessary to hold a valid meeting. The presence in person or by proxy at themeeting of holders of shares representing at least one-third of the votes of the Common Stock entitled to voteconstitutes a quorum. Abstentions and “broker non-votes” are counted as present for establishing a quorum. Abroker non-vote occurs on an item when a broker is not permitted to vote on that item absent instruction from thebeneficial owner of the shares and no instruction is given.
Vote Necessary to Approve Proposals
• Pursuant to the Company’s Bylaws, each director will be elected by a majority of the votes cast withrespect to such director. A majority of the votes cast means that the number of votes “for” a director’s
2

election must exceed 50% of the votes cast with respect to that director’s election. Any “against” voteswill count as a vote cast, but “abstentions” will not count as a vote cast with respect to that director’selection. Under Delaware law, if the director is not elected at the annual meeting, the director willcontinue to serve on the Board as a “holdover director.” As required by the Company’s Bylaws, eachdirector has submitted an irrevocable letter of resignation as director that becomes effective if he or shedoes not receive a majority of votes cast in an election and the Board accepts the resignation. If adirector is not elected, the Nominating & Governance Committee will consider the director’sresignation and recommend to the Board whether to accept or reject the resignation.
• The ratification of Ernst & Young LLP as our independent registered public accountants requires theaffirmative vote of a majority of the votes present in person or by proxy and voting thereon.
• The advisory vote to approve named executive officer compensation requires the affirmative vote of amajority of the votes present in person or by proxy and voting thereon. While this vote is required bylaw, it will neither be binding on the Company or the Board, nor will it create or imply any change inthe fiduciary or other duties of, or impose any additional fiduciary or other duties on, the Company orthe Board. However, the Compensation Committee will take into account the outcome of the vote whenconsidering future executive compensation decisions.
• With respect to the advisory vote on the frequency of future advisory votes on named executive officercompensation, the voting option, if any, that receives the affirmative vote of a majority of the votespresent in person or by proxy and voting thereon will be the option adopted by the stockholders. Whilethis vote is required by law, it will neither be binding on the Company or the Board, nor will it create orimply any change in the fiduciary or other duties of, or impose any additional fiduciary or other dutieson, the Company or the Board. However, the Compensation Committee and the Nominating &Governance Committee will take into account the outcome of the vote in making a determination onthe frequency of future advisory votes on named executive officer compensation. If none of the threevoting options receives a majority, the Board will consider the voting option that receives the pluralityof votes cast.
• The stockholder proposal requires the affirmative vote of a majority of the votes present in person orby proxy and voting thereon.
Impact of Abstentions and Broker Non-Votes
You may “abstain” from voting for any nominee in the election of directors and on the other proposals.Abstentions with respect to the election of directors and on the other proposals will be excluded entirely from thevote and will have no effect.
In addition, under New York Stock Exchange (“NYSE”) rules, if your broker holds your shares in its name,your broker is permitted to vote your shares on the proposal to ratify Ernst & Young LLP as our independentregistered public accountants, even if it did not receive voting instructions from you. Your broker may not voteyour shares on any of the other matters without specific instruction. A “broker non-vote” occurs when a brokersubmits a proxy but refrains from voting. Shares represented by broker non-votes are counted as present orrepresented for purposes of determining the presence of a quorum but are not counted as otherwise present orrepresented.
Obtaining Additional Copies of the Proxy Materials
We have adopted a procedure called “householding.” Under this procedure, stockholders who share thesame last name and reside at the same mailing address will receive one Notice or one set of proxy materials (ifthey have elected to receive hard copies of the proxy materials), unless one of the stockholders at that address hasnotified us that they wish to receive individual copies. Stockholders who participate in householding continue toreceive separate control numbers for voting. Householding does not in any way affect dividend check mailings.
3
Pro
xyS
tatemen
t

If you hold Common Stock and currently are subject to householding, but prefer to receive separate copiesof proxy materials and other stockholder communications from the Company, or if you are sharing an addresswith another stockholder and would like to consent to householding, you may revoke or grant your consent tohouseholding as appropriate at any time by calling toll-free at 1-866-540-7095 or notifying our Secretary at ourprincipal executive offices at Three Limited Parkway, Columbus, Ohio 43230.
A number of brokerages and other institutional holders of record have implemented householding. If youhold your shares beneficially in street name, please contact your broker or other intermediary holder of record torequest information about householding.
4

PROPOSAL 1: ELECTION OF DIRECTORS
The Board has nominated four directors for election at the annual meeting. If you elect the four nominees,they will hold office for a three-year term expiring at the 2020 annual meeting or until their successors have beenelected. All nominees are currently serving on our Board.
We believe that our Board as a whole possesses the appropriate diversity of experience, qualifications andskills to oversee and address the key issues facing our Company. In addition, we believe that each of ourdirectors possesses key attributes that we seek in a director, including strong and effective decision-making,communication and leadership skills.
Set forth below is additional information about the experience and qualifications of each of the nominees fordirector, as well as each of the current members of the Board, that led the Board to conclude, at the time eachindividual was nominated to serve on the Board, that he or she would provide valuable insight and guidance as amember of the Board.
Your proxy will vote for each of the nominees unless you specify otherwise. If any nominee is unable toserve, your proxy may vote for another nominee proposed by the Board. We do not know of any nominee of theBoard who would be unable to serve as a director if elected.
The Board recommends a vote FOR the election of all of the following nominees of the Board:
Nominees and Directors
Nominees of the Board at the 2017 Annual Meeting
Donna A. James Director since 2003 Age 59
In April 2006, Ms. James established Lardon & Associates LLC, a business and executive advisory servicesfirm, where she is Managing Director. Ms. James served as the President of Nationwide Strategic Investments, adivision of Nationwide Mutual Insurance Company, from 2003 through March 2006. Ms. James served asExecutive Vice President and Chief Administrative Officer of Nationwide Mutual Insurance Company andNationwide Financial Services from 2000 until 2003. Ms. James is a director of Marathon Petroleum Corp., atransportation fuels refiner and Boston Scientific Corporation, a developer, manufacturer and marketer ofmedical devices. Ms. James also served as Chairman of Financial Settlement Services Agency, Inc. from 2005through 2006, as director of CNO Financial Group, Inc., a holding company for a group of insurance companies,from 2007 to 2011, as director of Coca-Cola Enterprises Inc., a nonalcoholic beverages company, from 2005 to2012 and as a director of Time Warner Cable Inc., a provider of video, data and voice services, from 2009 to2016. She currently serves as the Chair of the Audit Committee of Marathon Petroleum Corp. Ms. James’snomination was supported by her executive experience, financial expertise, service on several boards of directorsand experience with respect to corporate diversity and related issues.
Jeffrey H. Miro Director since 2006 Age 74
Mr. Miro has been a senior partner of the Honigman Miller Schwartz and Cohn LLP law firm sinceNovember 2004. He was a partner and Chairman of the law firm of Miro Weiner & Kramer from 1981 untilNovember 2004. He is an Adjunct Professor of Law at The University of Michigan Law School, teaching coursesin taxation and corporate governance. Mr. Miro was a director of M/I Homes, Inc., a national home buildingcompany, until December 2012, and was a director of Sotheby’s Holdings, Inc., an auctioneer of art, jewelry andcollectibles, until May 2006. Mr. Miro’s nomination was supported by his legal expertise, particularly withrespect to corporate governance and real estate matters.
5
Pro
xyS
tatemen
t

Michael G. Morris Director since 2012 Age 70
Mr. Morris served as the Chairman of the Board of American Electric Power Company, Inc., one of thelargest electric utilities in the United States, from 2012 to April 2014. From January 2004 until November 2011,Mr. Morris served as the President, Chief Executive Officer and Chairman of American Electric PowerCompany, Inc. From 1997 until 2003, he served as the Chief Executive Officer of Northeast Utilities, the largestelectric utility in New England. Mr. Morris currently serves as a director of Spectra Energy Corp., one of NorthAmerica’s leading natural gas infrastructure companies, and of The Hartford Financial Services Group, Inc., aninvestment and insurance company, and as the Chairman of the board of directors of Alcoa Corporation, aproducer of bauxite, alumina and aluminum. Mr. Morris served as a director of Alcoa Inc., a producer ofaluminum, from 2008 to 2016, until Alcoa Inc.’s separation into two standalone, publicly-traded companies,Alcoa Corporation and Arconic Inc. Mr. Morris’s nomination was supported by his broad business experienceand management expertise.
Raymond Zimmerman Director since 1984 Age 84
Mr. Zimmerman is the Chief Executive Officer of Service Merchandise LLC, a retail company.Mr. Zimmerman was Chairman of the Board and Chief Executive Officer of 99¢ Stuff, LLC from 1999 to 2003and the Chairman of the Board and Chief Executive Officer of 99¢ Stuff, Inc. from 2003 to 2008.Mr. Zimmerman’s nomination was supported by his financial expertise and broad business experience,particularly in the retail sector.
Directors Whose Terms Continue until the 2018 Annual Meeting
E. Gordon Gee Director since 2012 Age 73
Dr. Gee is currently the President of West Virginia University, a large public research institution. Prior tohis current service at West Virginia University, he led several other major universities, including The Ohio StateUniversity (2007—2013, 1990—1998), Vanderbilt University (2000—2007), Brown University (1998—2000),the University of Colorado (1985—1990), and West Virginia University (1981—1985). Dr. Gee also currentlyserves as a director of the National 4-H Council. He previously served as a director of the Company from 1992 to2008, as a director of Hasbro, Inc., a branded-play company, from 1999 until 2010, and as a director of BobEvans Farms, Inc., an owner and operator of family restaurants, from 2009 until 2014. Dr. Gee’s nomination wassupported by his extensive executive and management experience, as well as his legal expertise and knowledgeof the Company gained through his prior service as a director.
Stephen D. Steinour Director since 2014 Age 58
Mr. Steinour has been the Chairman, President & Chief Executive Officer of Huntington BancsharesIncorporated, a regional bank holding company, since 2009. From 2008 to 2009, Mr. Steinour was a ManagingPartner in CrossHarbor Capital Partners, LLC, a recognized leading manager of alternative investments.Mr. Steinour was with Citizens Financial Group from 1992 to 2008, where he served in various executive roles,including President from 2005 to 2007 and Chief Executive Officer from 2007 to 2008. Mr. Steinour currentlyserves as a director of Exelon Corporation, a utility services holding company. He previously served as a trusteeof Liberty Property Trust, a real estate investment trust, from 2010 to 2014. Mr. Steinour’s nomination wassupported by his executive experience, financial expertise and service on several boards of directors.
Allan R. Tessler Director since 1987 Age 80
Mr. Tessler has been Chairman of the Board and Chief Executive Officer of International Financial Group,Inc., an international merchant banking firm, since 1987 and is the Chairman and Chief Executive Officer ofTeton Financial Services, a financial services company. He previously served as Chairman of the Board of EpochHolding Corporation, an investment management company, from 2004 to 2013 and as Chairman of the Board of
6

J Net Enterprises Inc., a technology holding company, from 2000 to 2004. Mr. Tessler also served as Chairmanof the Board of InterWorld Corporation from 2001 to 2004 and as Chairman of Checker Holdings Corp. IV from1997 to 2009. Mr. Tessler currently serves as Chairman of the Board of Rocky Mountain Bank, a Wyomingbank. He has served as a director of TD Ameritrade Holding Corporation, a securities brokerage company, sinceNovember 2006, as a director of Steel Partners Holdings GP Inc., a general partner of a global diversified holdingcompany, since 2010, as a director of BioCardia, Inc., a clinical-stage regenerative medicine company, since2012 and as a director of Imperva, Inc., a provider of cyber security solutions, since 2015. Mr. Tessler currentlyserves on the Audit Committee of Imperva, Inc. and as Chair of the Audit Committee of BioCardia, Inc.Mr. Tessler’s nomination was supported by his broad business experience and financial expertise, together withhis involvement in various public policy issues.
Abigail S. Wexner Director since 1997 Age 55
Mrs. Wexner is the chairman and CEO of Whitebarn Associates, a private investment company. She serveson the boards of Advanced Drainage Systems, Inc., a manufacturer of high performance thermoplastic corrugatedpipe, The Ohio State University, Nationwide Children’s Hospital, the Columbus Downtown DevelopmentCorporation, the Columbus Partnership, Pelotonia, The Ohio State University Wexner Medical Center, TheWexner Foundation, The Columbus Jewish Federation and the United States Equestrian Team Foundation. She isfounder and chair of the board for The Center for Family Safety and Healing, founding board member and vicechair of the board for KIPP Columbus and a past chair of the Governing Committee of the Columbus Foundation.Mrs. Wexner is the wife of Leslie H. Wexner. Mrs. Wexner’s nomination was supported by her executive andlegal experience, as well as her expertise with respect to a wide range of diversity, philanthropic and publicpolicy issues.
Directors Whose Terms Continue until the 2019 Annual Meeting
Dennis S. Hersch Director since 2006 Age 70
Mr. Hersch is President of N.A. Property, Inc., through which he acts as a business advisor to Mr. andMrs. Wexner, and has done so since February 2008. He also serves as a trustee of several trusts established byMr. and Mrs. Wexner. He was a Managing Director of J.P. Morgan Securities Inc., an investment bank, fromDecember 2005 through January 2008, where he served as the Global Chairman of its Mergers & AcquisitionsDepartment. Mr. Hersch was a partner of Davis Polk & Wardwell LLP, a New York law firm, from 1978 untilDecember 2005. Mr. Hersch served as a director of Clearwire Corporation, a telecommunications company, from2008 until 2013, NBCUniversal Enterprise, Inc., a media related company, from 2013 until 2014, Sprout Foods,Inc., a producer of organic baby food, from 2009 until 2015 and has served as a director of PJT Partners Inc., afinancial advisory firm, since 2015. Mr. Hersch’s nomination was supported by his legal and financial expertise,as well as his considerable experience with corporate governance matters, strategic issues and corporatetransactions.
David T. Kollat Director since 1976 Age 78
Dr. Kollat has been Chairman of 22, Inc., a management consulting firm, since 1987. He has served asdirector of Select Comfort Corporation, a designer, manufacturer and retailer of premium beds and beddingaccessories, since 1994, and Wolverine World Wide, Inc., a global footwear, athletic apparel and accessoriesdesigner, manufacturer and retailer, since 1992. Dr. Kollat also served as director of Big Lots, Inc., a retailer,from 1990 to 2012. In addition to his broad business experience (including service on several boards of directors)and marketing expertise, Dr. Kollat’s nomination was supported by his particular experience in the retail, appareland other related industries, both at the management and board levels.
7
Pro
xyS
tatemen
t
Leslie H. Wexner Director since 1963 Age 79
Mr. Wexner has been Chief Executive Officer of the Company since he founded the Company in 1963, andChairman of the Board for 41 years. Mr. Wexner is the husband of Abigail S. Wexner. Mr. Wexner’s nominationwas supported by his effective leadership of the Company since its inception.
Director Independence
The Board has determined that each of the individuals nominated to serve on the Board, together with eachof the members of the Board who will continue to serve after the 2017 annual meeting of stockholders (except forDennis S. Hersch, Abigail S. Wexner and Leslie H. Wexner), has no material relationship with the Companyother than in his or her capacity as a director of the Company and that each is “independent” in accordance withapplicable NYSE standards. If all director nominees are elected to serve as our directors, independent directorswill constitute more than two-thirds of our Board.
In making these determinations, the Board took into account all factors and circumstances that it consideredrelevant, including, where applicable, the existence of any employment relationship between the director (ornominee) or a member of the director’s (or nominee’s) immediate family and the Company; whether within thepast three years the director (or nominee) has served as an executive officer of the Company; whether the director(or nominee) or a member of the director’s (or nominee’s) immediate family has received, during any twelve-month period within the last three years, direct compensation from the Company in excess of $120,000; whetherthe director (or nominee) or a member of the director’s (or nominee’s) immediate family has been, within the lastthree years, a partner or an employee of the Company’s internal or external auditors; and whether the director (ornominee) or a member of the director’s (or nominee’s) immediate family is employed by an entity that isengaged in business dealings with the Company. The Board has not adopted categorical standards with respect todirector independence. The Board believes that it is more appropriate to make independence determinations on acase-by-case basis in light of all relevant factors.
Board Leadership Structure
Mr. Leslie H. Wexner serves as Chairman of the Board and Chief Executive Officer (“CEO”) of theCompany. Mr. Wexner is the founder of the Company and has served as its Chairman and/or Chief ExecutiveOfficer for over fifty years. Mr. Wexner (through his personal holdings and associated trusts) is also theCompany’s largest stockholder. The Board believes that Mr. Wexner’s experience and expertise in theCompany’s business and operations is unrivaled and that he is uniquely qualified to lead the Company.Accordingly, the Company believes that Mr. Wexner’s service as both Chairman of the Board and ChiefExecutive Officer is a significant benefit to the Company and provides more effective leadership than could beachieved in another leadership structure.
Allan R. Tessler currently serves as the lead independent director. In July 2012, the Board determined thatthe lead independent director should be appointed solely by the independent directors, as they deem appropriate,and Mr. Tessler was subsequently reappointed as the lead independent director by them. As lead independentdirector, Mr. Tessler has the authority to call meetings of the independent directors, at which he serves as thechairman. Mr. Tessler also approves information sent to the Board, including the agenda for Board meetings, andis responsible for approving meeting schedules in order to assure that there is sufficient time for discussion of allagenda items.
The Company believes that the lead independent director structure, including Mr. Tessler’s service as leadindependent director, offers independent oversight of the Company’s management to complement the leadershipthat Mr. Wexner provides to the Board as its Chairman.
8

Risk Oversight; Certain Compensation Matters
The Board, directly and through the Audit Committee and other committees of the Board, takes an activerole in the oversight of the Company’s policies with respect to the assessment and management of enterprise risk.Among other things, the Board has policies in place for identifying the senior executive responsible for key risksas well as the Board committees with oversight responsibility for particular key risks. In a number of cases,oversight is conducted by the full Board.
Among other things, the Company, including the Compensation Committee of the Board, has evaluated theCompany’s compensation structure from the perspective of enterprise risk. The Company, including theCompensation Committee, believes that the Company’s compensation structures are appropriate and do notincentivize inappropriate taking of business risks.
Review of Strategic Plans and Capital Structure
The Board regularly reviews the Company’s strategic plans and capital structure with a view toward long-term value creation. The Board also conducts a strategic planning retreat at least annually with seniormanagement.
Succession Planning
The Board and its Nominating & Governance Committee have developed policies and principles governingsuccession planning with respect to the CEO and senior management.
Information Concerning Board Meeting Attendance
Our Board held 8 meetings in fiscal year 2016. During fiscal year 2016, all of the directors attended 75% ormore of the total number of meetings of the Board and of the committees of the Board on which they served(which were held during the period in which they served).
Committees of the Board
Audit Committee
The Audit Committee of the Board is instrumental in the Board’s fulfillment of its oversight responsibilitiesrelating to (i) the integrity of the Company’s financial statements, (ii) the Company’s compliance with legal andregulatory requirements, (iii) the qualifications, independence and performance of the Company’s independentauditors and (iv) the performance of the Company’s internal audit function. The current members of the AuditCommittee are Ms. James (Chair), Dr. Kollat and Messrs. Tessler and Zimmerman. The Board has determinedthat each of the Audit Committee members meets the independence, expertise and experience standardsestablished by the NYSE and the Securities and Exchange Commission (the “Commission”) for service on theAudit Committee of the Board and for designation as an “audit committee financial expert” within the meaningof the regulations promulgated by the Commission.
The Report of the Audit Committee can be found on page 55 of this proxy statement. The Audit Committeeheld 13 meetings in fiscal year 2016.
Compensation Committee
The Compensation Committee of the Board (i) oversees the Company’s compensation and benefitsphilosophy and policies generally, (ii) evaluates the CEO’s performance and oversees and sets compensation forthe CEO, (iii) oversees the evaluation process and compensation structure for other members of the Company’ssenior management and (iv) fulfills the other responsibilities set forth in its charter. The current members of the
9
Pro
xyS
tatemen
t

Compensation Committee are Dr. Kollat (Chair), Dr. Gee and Messrs. Miro and Morris. The Board hasdetermined that each of the current Compensation Committee members is “independent” in accordance withapplicable NYSE standards.
The Report of the Compensation Committee can be found on page 50 of this proxy statement. TheCompensation Committee held 9 meetings in fiscal year 2016.
Nominating & Governance Committee
The Nominating & Governance Committee actively engages in the ongoing review of the composition ofthe Board and opportunities for Board refreshment. Based on its review, the Nominating & GovernanceCommittee identifies and recommends to the Board candidates who are qualified to serve on the Board and itscommittees. The Nominating & Governance Committee also considers and reviews the qualifications of anyindividual nominated for election to the Board by stockholders. It is responsible for proposing a slate ofcandidates for election as directors at each annual meeting of stockholders. In the past five years, three newdirectors have been appointed to the Board who bring a diversity of skills, attributes and perspectives to theBoard. In addition to periodic Board refreshment, we believe that a variety of director tenures is beneficial toensure Board quality and continuity of experience, as reflected in the current composition of our Board.
The Nominating & Governance Committee develops and recommends to the Board criteria and proceduresfor the selection and evaluation of new individuals to serve as directors and committee members. In assessingdirector nominees, the Nominating & Governance Committee takes into account the qualifications of existingdirectors for continuing service or re-nomination, which may be affected by, among other things, the quality oftheir contributions, their attendance records, changes in their primary employment or other business affiliations,the number of boards of publicly held companies on which they serve or other competing demands on their timeand attention. While the Board has not established any specific minimum qualifications for director nominees, asindicated in the Company’s corporate governance principles, the directors and any potential nominees shouldpossess the integrity, judgment, skills, experience and other characteristics that are deemed necessary or desirablefor the effective performance of the Board’s oversight function. Certain of the skills, qualifications and particularareas of expertise considered with respect to the members of the Board at the time each Director was nominatedare summarized in the director biographies found on pages 5 through 8 of this proxy statement. Although theNominating & Governance Committee does not use formal quantitative or similar criteria with regard to diversityin its selection process, the Company’s corporate governance principles provide that the Board will be composedof members of diverse backgrounds and, accordingly, the Committee considers the diversity of experience,background and expertise of the current directors and areas where new directors might add additionalperspectives, as factors in the selection of Board nominees.
The Nominating & Governance Committee does not have a formal policy on the consideration of directorcandidates recommended by stockholders. The Board believes that it is more appropriate to provide theNominating & Governance Committee flexibility in evaluating stockholder recommendations. In the event that adirector nominee is recommended by a stockholder, the Nominating & Governance Committee will give dueconsideration to the director nominee and will use the same criteria used for evaluating Board director nominees,in addition to considering the information relating to the director nominee provided by the stockholder.
To date, the Company has not engaged third parties to identify or evaluate or assist in identifying potentialdirector nominees, although the Company reserves the right in the future to retain a third-party search firm, ifappropriate.
The Nominating & Governance Committee also develops and recommends to the Board, and regularlyreviews, a set of corporate governance principles for the Company to ensure they reflect evolving best practices,monitors compliance with those principles and stays abreast of developments in the area of corporategovernance. For example, a proxy access bylaw was adopted in November 2016, permitting up to 20
10

stockholders owning 3% or more of the outstanding shares of Common Stock continuously for at least threeyears to nominate the greater of two directors or up to 20% of the Board and include those nominees in our proxymaterials. The Nominating & Governance Committee also reviews and periodically makes recommendations tothe Board regarding the structure, practices, policies and activities of the Board and its committees. Each Boardcommittee’s charter is reviewed at least annually. To ensure that the Board, Board committees and individualdirectors remain effective, the Nominating & Governance Committee oversees a robust annual evaluation of theBoard, each Board committee and each individual director and recommends ways to improve performance. Atleast annually, each of the Audit Committee, the Compensation Committee and the Nominating & GovernanceCommittee evaluates its own performance and reports to the Board on such evaluation. The full Board alsoengages in self-evaluation at least annually. The current members of the Nominating & Governance Committeeare Mr. Tessler (Chair), Ms. James, Dr. Kollat and Mr. Miro. The Board has determined that each of the currentNominating & Governance Committee members is “independent” in accordance with applicable NYSEstandards.
The Nominating & Governance Committee held 4 meetings in fiscal year 2016.
Executive Committee
The Executive Committee of the Board may exercise, to the fullest extent permitted by law, all of thepowers and authority granted to the Board. Among other things, the Executive Committee may declaredividends, authorize the issuance of stock and authorize the seal of the Company to be affixed to papers thatrequire it. The current members of the Executive Committee are Messrs. Wexner (Chair) and Tessler.
Finance Committee
The Finance Committee of the Board periodically reviews the Company’s financial position and financialarrangements with banks and other financial institutions. The Finance Committee also makes recommendationson financial matters that it believes are necessary, advisable or appropriate. The current members of the FinanceCommittee are Mr. Tessler (Chair), Mr. Hersch, Dr. Kollat, Mrs. Wexner and Mr. Zimmerman.
Inclusion Committee
The Inclusion Committee of the Board is instrumental in the Board’s fulfillment of its oversightresponsibilities relating to, among other things, (i) the Company’s commitment to diversity and inclusion and(ii) the performance of the Company’s Office of Inclusion. The current members of the Inclusion Committee areMrs. Wexner (Chair), Dr. Gee and Ms. James.
Meetings of the Company’s Non-Management Directors
The non-management directors of the Board meet in executive session in connection with each regularlyscheduled Board meeting. Mr. Tessler serves as the chair of those meetings, which neither Mr. Wexner norMrs. Wexner attends.
Communications with Stockholders
The Board believes that it is important to understand stockholder perspectives on the Company and fosterlong-term relationships with stockholders and, to that end, we have a policy of robust engagement withstockholders, with continuing outreach to and dialogue with all of our major investors on a range of issues,including corporate governance matters. Such engagements with investors have been highly constructive. Forexample, based on stockholder feedback, we made a number of changes to our compensation program in the pastfew years, as discussed in more detail under “Compensation-Related Matters—Compensation Discussion andAnalysis.” The Board also provides a process for interested parties to send communications to the full Board, the
11
Pro
xyS
tatemen
t

non-management members of the Board, the lead independent director and the members of the Audit Committee.Any director may be contacted by writing to him or her c/o L Brands, Inc., Three Limited Parkway, Columbus,Ohio 43230 or emailing at [email protected]. Any stockholder wishing to contact Audit Committeemembers may send an email to [email protected]. Communications that are not related to a director’sduties and responsibilities as a Board member, a non-management director or an Audit Committee member maybe excluded by the Office of the General Counsel, including, without limitation, solicitations and advertisements;junk mail; product-related communications; job referral materials such as resumes; surveys; and any othermaterial that is determined to be illegal or otherwise inappropriate. The directors to whom such information isaddressed are informed that the information has been removed and that it will be made available to such directorsupon request.
Attendance at Annual Meetings
The Company does not have a formal policy regarding attendance by members of the Board at theCompany’s annual meeting of stockholders. However, it encourages directors to attend and historically nearly allhave done so. All of the then-current Board members attended the 2016 annual meeting. Each director isexpected to dedicate sufficient time, energy and attention to ensure the diligent performance of his or her duties,including by attending meetings of the Board and the committees of which he or she is a member.
Code of Conduct, Related Person Transaction Policy and Associated Matters
The Company has a code of conduct that is applicable to all employees of the Company, including the CEOand Chief Financial Officer, and to members of the Board. Any amendments to the code or any waivers from anyprovisions of the code granted to executive officers or directors will be promptly disclosed to stockholdersthrough posting on the Company’s website at www.lb.com.
Under the Company’s Related Person Transaction Policy (the “Policy”), subject to certain exceptions,directors and executive officers of the Company are required to notify the Company of the existence or potentialexistence of any financial or commercial transaction, agreement or relationship involving the Company in whicha director or executive officer or his or her immediate family members has a direct or indirect material interest.Each such transaction must be approved by the Board or a committee consisting solely of independent directorsafter consideration of all material facts and circumstances.
The Company is engaged in several projects designed to increase our speed and agility in producingproducts that satisfy our customers. In the case of our beauty, personal care and home fragrance businesses, thedevelopment of supplier facilities in close proximity to our headquarters and distribution facilities in central Ohiohas been an integral part of capturing the many business benefits of speed and agility. The New AlbanyCompany, a business beneficially owned by Mr. and Mrs. Wexner, is in the business of developing real estate,including industrial parks, and has sold land (and may in the future sell land) to certain vendors or third partydevelopers in connection with the continuing development of an industrial park focused on the foregoingbusiness categories in New Albany, Ohio. The Audit Committee monitors such vendor and third partytransactions on an ongoing basis to assure that they are in the best interests of the Company and its stockholdersgenerally.
Copies of the Company’s Code of Conduct, Corporate Governance Principles, Policy and Committee Charters
The Company’s code of conduct, corporate governance principles and Policy, as well as the charters of theAudit Committee, Compensation Committee and Nominating & Governance Committee of the Board, areavailable on the Company’s website at www.lb.com. Stockholders may also request a copy of any such documentfrom: L Brands, Inc., Attention: Investor Relations, Three Limited Parkway, Columbus, Ohio 43230.
12

PROPOSAL 2: RATIFICATION OF THE APPOINTMENTOF INDEPENDENT REGISTERED PUBLIC ACCOUNTANTS
The Audit Committee has appointed Ernst & Young LLP to serve as the Company’s independent registeredpublic accountants for the fiscal year ending February 3, 2018. Ernst & Young LLP has been retained as theCompany’s independent registered public accountants continuously since 2003.
The Audit Committee is responsible for the appointment, compensation, retention and oversight of theCompany’s independent registered public accountants. The Audit Committee is responsible for approving thefees associated with the Company’s retention of Ernst & Young LLP. In accordance with Commission rules,Ernst & Young LLP’s lead engagement partner rotates every five years. The Audit Committee is directlyinvolved in the selection of Ernst & Young LLP’s lead engagement partner. In addition, the Audit Committeeevaluates Ernst & Young LLP’s qualifications, performance and independence and presents its conclusions onthese matters to the Board on at least an annual basis, and annually considers whether to continue its engagementof Ernst & Young LLP.
The members of the Audit Committee and the Board believe that the continued retention of Ernst & YoungLLP to serve as the Company’s independent registered public accountants is in the best interests of the Companyand its stockholders. We are asking you to ratify Ernst & Young LLP’s appointment, although your ratification isnot required. A representative of Ernst & Young LLP will be present at the meeting, will have the opportunity tomake a statement and will be available to respond to appropriate questions.
Additional information concerning the Company’s engagement of Ernst & Young LLP is included onpage 56.
The Board recommends a vote FOR the ratification of the appointment of Ernst & Young LLP as theCompany’s independent registered public accountants.
13
Pro
xyS
tatemen
t

PROPOSAL 3: ADVISORY VOTE TO APPROVE NAMED EXECUTIVE OFFICERCOMPENSATION
The Dodd-Frank Wall Street Reform and Consumer Protection Act requires us to provide an advisorystockholder vote to approve the compensation of the Company’s named executive officers (“NEOs”), as suchcompensation is disclosed pursuant to the disclosure rules of the Commission. After the Company’s 2011 annualmeeting, the Board determined to hold this advisory “say-on-pay” vote every year. Accordingly, the Company isproviding its stockholders with the opportunity to cast an advisory vote on the fiscal 2016 compensation of ourNEOs as disclosed in this proxy statement, including the Compensation Discussion and Analysis (the “CD&A”),the compensation tables and other narrative executive compensation disclosures.
Stockholders are being asked to vote on the following resolution:
“RESOLVED, that the stockholders approve the compensation of the Company’s executive officers namedin the 2016 Summary Compensation Table, as disclosed pursuant to Item 402 of Regulation S-K (whichdisclosure includes the Compensation Discussion and Analysis, the compensation tables and other narrativeexecutive compensation disclosures).”
Our compensation program is designed to align NEO compensation with the performance of the company.Following five straight years of record-setting sales and earnings, financial performance for the year did not meetour high expectations and this is reflected in the significant decrease in 2016 compensation for our NEOs. CEOcompensation decreased 46% and compensation for the other NEOs decreased on average approximately 21%.
The Compensation Committee took the following actions:
• No changes were made to Mr. Wexner’s base salary or short term performance-based incentivecompensation target.
• Awarded Mr. Wexner performance-based stock awards with a target value of $9.4 million (45% lowerthan fiscal 2015) based on financial and strategic performance during fiscal 2016, including growth ofthe business in North America and overseas, execution of our fundamental strategy of being fast,focused and frugal and optimization of capital structure.
• As NEO base salaries and short term performance-based incentive compensation targets for fiscal 2016were set in March 2016 based on record-setting fiscal 2015 performance:
• increased the base salary for each of the NEOs other than Mr. Wexner based on our growth andaccomplishments in the last several fiscal years, including record-setting sales and earningsperformance in 2013, 2014 and 2015; and
• increased short term performance-based incentive compensation targets for each of the NEOsother than Mr. Wexner to incent future performance and further leverage their compensation.
• Awarded performance-based Restricted Stock Units (“RSUs”) to NEOs in March 2016 to recognizeour record-setting financial performance in fiscal 2015, as well as to provide significant retentive valueand to incent future performance.
• Set short term incentive compensation operating income goals at a challenging level, requiring 3%growth over record fiscal 2015 results when normalizing for expenses incurred for expansion in Chinaand the new 5th Avenue Victoria’s Secret store.
• Paid short-term incentive compensation below target for Messrs. Wexner, McGuigan, Burgdoerfer andWaters reflecting performance that did not meet our challenging goals.
• Continued to deliver long term equity compensation that is 100% performance-based in a mix of stockoptions and RSUs which must be earned based on achievement of a cumulative, long-term, relativeperformance measure.
14

• Beginning with performance-based RSUs awarded in March 2017, eliminated the provision forperformance-based RSUs in which awards not earned in one period may be earned in subsequentperiods if the cumulative performance metric is achieved.
The Company’s change in stockholder return, including reinvested dividends, is aligned with changes intotal CEO compensation (as disclosed in further detail in the CD&A).
Although the advisory stockholder vote on executive compensation is non-binding, the CompensationCommittee has considered and will continue to consider the outcome of the vote and feedback received fromstockholders when making compensation decisions for NEOs. We have a policy of robust engagement withstockholders, including continuing outreach to and dialogue with all of our major institutional stockholders.Based on feedback from such engagement, as noted above, we eliminated the provision for performance-basedRSUs in which awards not earned in one period may be earned in subsequent periods if the cumulativeperformance metric is achieved. We continued the following compensation practices in accordance with ourcorporate governance principles and/or in response to stockholder and advisory group feedback, including:
• No tax gross-ups for NEOs upon a change in control.
• “No hedging” policy governing stock trading.
• Policy that discourages pledging of Company stock and requires advance approval of our GeneralCounsel.
• No future issuances of “single trigger” equity awards.
• Clawback policy.
• Stock ownership guidelines set at five times base salary for our CEO and three times base salary forother NEOs. Members of our Board must maintain ownership of at least the number of shares ofCommon Stock received as Board compensation over the previous four years.
These changes, along with our historical performance record, were important factors in achieving 89%stockholder support for our 2016 advisory vote on executive compensation. Given this strong level of support,the Compensation Committee has concluded that a large majority of our stockholders support our existingcompensation program.
Please refer to the CD&A for a detailed discussion of the Company’s executive compensation principles andpractices and the fiscal 2016 compensation of our NEOs.
Board Recommendation
Our performance in 2016 is reflected in the compensation for our NEOs, demonstrating ourcommitment to delivering pay for performance. CEO compensation decreased 46% and compensation forthe other NEOs decreased on average approximately 21%. In summary, we see alignment between ourperformance, our stockholders’ interests and our pay.
The Board recommends a vote FOR this proposal.
15
Pro
xyS
tatemen
t

PROPOSAL 4: ADVISORY VOTE ON THE FREQUENCY OF FUTURE ADVISORY VOTESON NAMED EXECUTIVE OFFICER COMPENSATION
The Dodd-Frank Wall Street Reform and Consumer Protection Act requires us to provide an advisorystockholder vote with respect to how often to present the advisory stockholder vote to approve the compensationof the Company’s NEOs (the “say-on-pay vote”), i.e., how often to present a proposal similar to Proposal 3:Advisory Vote to Approve Named Executive Officer Compensation. We must solicit your advisory vote onwhether to have the say-on-pay vote every 1, 2 or 3 years.
Accordingly, the Company is providing its stockholders with the opportunity to cast an advisory vote as tothe appropriate frequency for the say-on-pay vote. Stockholders may vote as to whether the say-on-pay voteshould occur every 1, 2 or 3 years, or may abstain from voting on the matter.
The Company values the opinion of its stockholders and believes that an annual say-on-pay vote will bestreinforce the Company’s desire to communicate with its stockholders. An annual say-on-pay vote will allow theCompany’s stockholders to regularly express a view on the Company’s compensation policies and practices.
Although, as an advisory vote, this proposal is not binding upon the Company or the Board, theCompensation Committee, which is comprised solely of independent directors and is responsible for makingdecisions regarding the amount and form of compensation paid to the Company’s executive officers, and theNominating & Governance Committee, which is comprised solely of independent directors and is responsible forperiodically reviewing the Company’s corporate governance principles, will each carefully consider thestockholder vote on this matter, along with all other expressions of stockholder views received on this matter.
The Board Recommends a Vote of “1 Year” for the Frequency of Future Advisory Say-On-Pay Votes.
16

PROPOSAL 5: STOCKHOLDER PROPOSAL TO CHANGE CERTAIN VOTING REQUIREMENTS
John Chevedden, 2215 Nelson Ave., No. 205 Redondo Beach, CA 90278, owner of 90 shares of CommonStock, has notified the Company that he intends to submit the following proposal at this year’s meeting:
Proposal 5—Simple Majority Vote
RESOLVED, Shareholders request that our board take the steps necessary so that each voting requirement in ourcharter and bylaws that calls for a greater than simple majority vote be eliminated, and replaced by a requirementfor a majority of the votes cast for and against applicable proposals, or a simple majority in compliance withapplicable laws. If necessary this means the closest standard to a majority of the votes cast for and against suchproposals consistent with applicable laws. It is essential that our board take the steps necessary to adopt thisproposal.
We gave 56% voting support to this same shareholder proposal at our 2015 annual meeting. However ourmanagement failed to take the steps necessary to adopt this proposal at our 2016 annual meeting. Plus our 2016annual meeting proxy failed to give any management analysis of any special effort that might be needed to adoptthe management version of this proposal or specify any special effort that management would take to adopt theirproposal on this topic.
Shareowners are willing to pay a premium for shares of companies that have excellent corporate governance.Supermajority voting requirements have been found to be one of 6 entrenching mechanisms that are negativelyrelated to company performance according to “What Matters in Corporate Governance” by Lucien Bebchuk,Alma Cohen and Allen Ferrell of the Harvard Law School. Supermajority requirements are used to blockinitiatives supported by most shareowners but opposed by a status quo management.
This proposal topic won from 74% to 88% support at Weyerhaeuser, Alcoa, Waste Management, GoldmanSachs, FirstEnergy, McGraw-Hill and Macy’s. The proponents of these proposals included Ray T. Cheveddenand William Steiner.
Currently a 1%-minority can frustrate the will of our 74%-shareholder majority. In other words a 1%-minoritycould have the power to prevent shareholders from improving our charter and bylaws.
Thus we are stuck with 3-year terms for directors which makes our directors significantly untouchable toshareholder frustration. Our stock fell from $100 to $65 in the year leading up to the submission of this proposal.Yet most of our directors do not have to worry about reelection at our 2017 annual meeting. This is like anemployee with falling performance getting a job review once in 3-years.
Please vote to enhance shareholder value:
Simple Majority Vote—Proposal 5
Our Response—Statement in Opposition to Stockholder Proposal to Change Certain Voting Requirements
The Board has carefully considered the above proposal and believes that it is not in the best interestsof our stockholders. Consequently, the Board recommends a vote AGAINST the proposal.
The Board has evaluated the Company’s voting requirements on numerous occasions to ensure that theycontinue to be in the best interests of the Company and its stockholders. In this regard, the Board has consistentlydetermined, and continues to believe after careful reconsideration of this issue, that the retention of asupermajority vote standard for certain extraordinary matters is the best way to ensure that the interests of allstockholders are fully protected.
17
Pro
xyS
tatemen
t

Our Supermajority Vote Requirements Apply Only to a Small Number of Fundamental Matters. Under theCompany’s existing governance documents, a simple majority vote requirement already applies to most matterssubmitted for stockholder approval. Our certificate of incorporation only requires the affirmative vote of not lessthan 75% of the outstanding shares entitled to vote for a small number of fundamental matters of corporatestructure and governance, which are as follows: (i) approval of certain business combinations with an individual,entity or group that collectively owns 20% or more of the Company’s voting securities; (ii) approval of certainfundamental transactions, including mergers or a sale of substantially all of the Company’s assets, with anycorporation that, together with its affiliates, owns five percent or more of the Company’s voting securities;(iii) dissolution of the Company; (iv) removal of a director for cause; (v) an alteration, amendment or repeal ofthe Company’s bylaws or any amendment to the Company’s certificate of incorporation that contravenes anyexisting bylaw of the Company; and (vi) an amendment to certain provisions in the Company’s certificate ofincorporation.
Our Supermajority Vote Requirements Serve Important Corporate Governance Objectives. Our Boardbelieves that the requirement of a supermajority vote for a limited number of fundamental matters servesimportant corporate governance objectives. These include:
Ensuring Broad Stockholder Consensus for Key Actions. The Board strongly believes thatextraordinary transactions and fundamental changes to corporate governance should have the support of abroad consensus of the Company’s stockholders rather than just a simple majority. The Board also believesthat the supermajority vote requirements protect stockholders, particularly minority stockholders, from thepotentially self-interested actions of short-term investors. Without these provisions, it would be possible fora group of short-term stockholders to approve an extraordinary transaction that is not in the best interests ofthe Company and opposed by nearly half of the Company’s stockholders. Targeted supermajority voterequirements, limited to a small number of critical matters, preserve and maximize long-term value for allstockholders.
Ensuring that Key Actions Reflect Stockholder Interests. Our Board is subject to fiduciary duties underthe law to act in a manner that it believes to be in the best interests of the Company and its stockholders.Stockholders, on the other hand, do not have the same fiduciary duties. As a result, a group ofstockholders—who may be acting in their own short-term or other interests not shared by stockholdersgenerally—may vote in a manner that is detrimental to large numbers of stockholders. Accordingly, oursupermajority voting standards safeguard the long-term interests of the Company and its stockholders.
Providing Protection Against Certain Takeovers. Our supermajority voting provisions further protectthe Company’s stockholders by encouraging persons or firms making unsolicited takeover proposals tonegotiate directly with the Board, which provides the Board with increased leverage to maximize value forall stockholders. The Company believes that its independent Board is in the best position to evaluateproposed offers, consider alternatives and protect stockholders against potentially coercive or abusive tacticsduring a takeover process and, as appropriate, negotiate the best possible return for all stockholders.Elimination of these supermajority vote provisions would make it more difficult for the Company’sindependent, stockholder-elected Board to preserve and maximize value for all stockholders in the event ofan unsolicited takeover bid.
Corporate Governance Practices. The Board regularly evaluates the Company’s corporate governancepractices and processes with a view toward ensuring that they continue to serve the best interests of the Companyand its stockholders. For example, the Board adopted a proxy access bylaw in November 2016. The Board is alsointensely focused on the relationship between governance and performance and on creating the propergovernance structure in light of the particular circumstances of the Company. In addition, we have a policy ofrobust engagement with stockholders, with continuing outreach to and dialogue with all of our major investors ona range of issues, including corporate governance matters. The Board believes that the Company’s currentcorporate governance principles and practices—of which the supermajority vote requirements are one part—areoptimal for the Company and its stockholders and serve, among other things, to maximize long-term stockholder
18

value, align the interests of the Board and management with those of our stockholders and promote high ethicalconduct among our directors and employees.
Board Recommendation
After careful consideration of this proposal, the Board has determined that retention of the supermajorityvoting requirements remains in the best interests of the Company and its stockholders. The Board believes thatthe substantial benefits of the Company’s supermajority voting requirements do not come at the expense ofprudent corporate governance. To the contrary, the voting requirements serve to protect the interests of allstockholders.
The Board recommends a vote AGAINST the Stockholder Proposal to Change Certain VotingRequirements.
19
Pro
xyS
tatemen
t

COMPENSATION-RELATED MATTERS
Compensation Discussion and Analysis
Executive Summary
Performance Overview
Our compensation program is designed to align NEO compensation with the performance of the Company.Following five straight years of record-setting sales and earnings, financial performance for the year did not meetour high expectations and this is reflected in the significant decrease in 2016 compensation for our NEOs. CEOcompensation decreased 46% and compensation for the other NEOs decreased on average approximately 21%.
Although 2016 adjusted earnings per share declined 6% against last year’s record performance, weaccomplished a lot during the year and are well-positioned for future growth:
• At Bath & Body Works, sales increased 7% and operating income increased 6%. We ended the yearwith 240 new concept stores which include the White Barn design. While the investment in these storesresults in near term financial pressure, they continue to drive significant sales increases and importantlypresent a new, compelling store design to our customers.
• Our PINK business continued its strong performance with low-double-digit sales growth over last year.We continue to invest in square footage growth for the PINK business, in order to provide the fullassortment in more locations. These investments continue to drive strong returns.
• We made a number of important changes to our Victoria’s Secret business to simplify the business andaccelerate growth. Notably, we reorganized the business and integrated the direct channel into threeseparate business units (Lingerie, PINK and Beauty) and appointed new leaders in Lingerie andBeauty; we eliminated the non-core merchandise categories of swim and apparel in order to increasefocus and accelerate growth in our core categories; and we evolved how the business connects withcustomers through more focus on brand-building and loyalty-enhancing marketing rather thantraditional catalogues and offers.
• Outside of North America, we opened more than 100 new stores to end the year with 830 stores in 78countries. In China, we acquired the business from our franchisee to pursue this market as Company-owned, built the capability and infrastructure to support future growth, launched our online business onTMall Global and opened our first two full-assortment Victoria’s Secret stores just after year-end.
We are equipped for success—strong brands which lead their categories and an experienced and talentedleadership team—with significant growth opportunities both in and outside of North America. Although theinvestments we are making in the business as noted above have and will put some pressure on results in the shortterm, we continue to lead the industry on a long term basis:
One Year(Fiscal 2016)
Three Year(Fiscal 2013-2016)
Five Year(Fiscal 2011-2016)
Net Sales$ increase . . . . . . . . . . . . . . . . . . . . . . . . . . . $420 million $1,801 million $2,913 million% increase . . . . . . . . . . . . . . . . . . . . . . . . . . 3% 17% 30%
Adjusted Operating Income1
$ increase/(decrease) . . . . . . . . . . . . . . . . . . ($155 million) $294 million $532 million% increase/(decrease) . . . . . . . . . . . . . . . . . (7%) 17% 35%
Adjusted Earnings per Share1
% increase/(decrease) . . . . . . . . . . . . . . . . . (6)% 23% 48%Total Shareholder Return . . . . . . . . . . . . . . . . . . . (35%) 30% 86%Stock Price
% increase/(decrease) . . . . . . . . . . . . . . . . . (39%) 13% 42%
20

We are committed to returning value to our stockholders through a combination of dividends and sharerepurchase programs. In fiscal 2016, we increased our regular annual dividend 20% from $2.00 to $2.40 pershare and paid a $2.00 per share special dividend.
1 The reconciliation of such measure to the comparable figure determined in accordance with accounting principles generally accepted in theUnited States (“GAAP”) is included on pages 23 to 24 of the Company’s 2016 Annual Report on Form 10-K (the “2016 10-K”).
2016 Compensation Decisions Overview
Fiscal 2016 compensation decision highlights include:
• No changes were made to Mr. Wexner’s base salary or short term performance-based incentivecompensation target;
• Awarded Mr. Wexner performance-based stock awards with a target value of $9.4 million (45% lowerthan fiscal 2015) based on financial and strategic performance during fiscal 2016, including growth ofthe business in North America and overseas, execution of our fundamental strategy of being fast,focused and frugal and optimization of capital structure;
• NEO base salaries and short term performance-based incentive compensation targets for fiscal 2016were set in March 2016 based on record-setting fiscal 2015 performance.
• Increased the base salary for each of the NEOs other than Mr. Wexner based on our growth andaccomplishments in the last several fiscal years, including record-setting sales and earningsperformance in 2013, 2014 and 2015;
• Increased short term performance-based incentive compensation targets for each of the NEOsother than Mr. Wexner to incent future performance and further leverage their compensation;
• Awarded performance-based RSUs to NEOs in March 2016 to recognize our record-setting financialperformance in fiscal 2015, as well as to provide significant retentive value and to incent futureperformance;
• Set short term incentive compensation operating income goals at a challenging level, requiring 3%growth over record fiscal 2015 results when normalizing for expenses incurred for expansion in Chinaand the new 5th Avenue Victoria’s Secret store;
• Paid short-term incentive compensation below target for Messrs. Wexner, McGuigan, Burgdoerfer andWaters reflecting performance that did not meet our challenging goals;
• Continued to deliver long-term equity compensation that is 100% performance-based in a mix of stockoptions and RSUs which must be earned based on achievement of a cumulative, long-term, relativeperformance measure; and
• Beginning with performance-based RSUs awarded in March 2017, eliminated the provision forperformance-based RSUs in which awards not earned in one period may be earned in subsequentperiods if the cumulative performance metric is achieved.
Pay for Performance
Our compensation program requires superior performance for NEOs to earn performance-based incentivesat target. The Company’s change in stockholder return, including reinvested dividends, is aligned with changes intotal CEO compensation (as disclosed in the Summary Compensation Table):
• Over the last five years (since the beginning of fiscal 2012) our shareholder return was 13% on anannualized basis (86% in the aggregate) while our CEO’s compensation was reduced by 5% on anannualized basis; and
• Over the last year, the total shareholder return decreased 35% while total CEO compensation wasreduced by 46%.
21
Pro
xyS
tatemen
t

The following chart illustrates how stockholder return aligns with total CEO compensation:
$10,000
$15,000
$20,000
$25,000
$30,000
$35,000
$100
$150
$200
$250
$300
CEO
Pay
(000
s)
Inde
xed
TSR
5 Year TSR and CEO Pay Comparison
$0
$5,000
$0
$50
CEO Pay Indexed TSR
2012 2013 2014 2015 2016
The effectiveness of our compensation program at delivering pay for performance is further validated by ananalysis conducted by the Compensation Committee’s independent compensation consultant to determine thealignment of pay and performance. The consultant reported to the Compensation Committee that NEOcompensation is aligned with performance and appropriate based on the competitive market, achievement ofperformance goals and total returns delivered to our stockholders.
Stockholder Advisory Vote
In 2016, 89% of our stockholders voted in favor of our executive compensation program. The CompensationCommittee considers this vote and other stockholder/advisory group feedback when making compensationdecisions for NEOs. We have a policy of robust engagement with stockholders, with continuing outreach to anddialogue with all of our major investors on a range of issues, including executive compensation matters. Basedon feedback from such engagement, beginning with performance-based RSUs awarded in March 2017, weeliminated the provision for performance-based RSUs in which awards not earned in one period may be earned insubsequent periods if the cumulative performance metric is achieved.
In addition, we continue the following compensation practices in accordance with our corporate governanceprinciples and/or in response to stockholder and advisory group feedback:
✓ No tax gross-ups for NEOs upon a change in control.
✓ “No hedging” policy governing stock trading.
✓ Adopted a policy that discourages pledging of Company stock and requires advance approval by ourGeneral Counsel. None of our NEOs or Board members has pledged Company stock.
✓ No re-pricing of stock options without stockholder approval.
✓ Double trigger vesting of equity awards upon a change in control.
✓ Clawback policy as described under “—Compensation Governance—Recovery of Compensation.”
✓ Stock ownership guidelines set at five times base salary for our CEO and three times base salary forother NEOs. Members of our Board must maintain ownership of at least the number of shares ofCommon Stock received as Board compensation over the previous four years.
✓ Stock plan that requires a vesting period of at least one year:
✓ Three year minimum vesting period for RSUs that are based on the passage of time; and
22

✓ One year minimum vesting period for stock options and for RSUs that are earned based onperformance.
✓ While these are the minimum requirements under the plan, stock options and performance-basedRSUs awarded to our NEOs generally vest over five years.
Conclusion
While we had segments of our business which continued to perform very well against record performancelast year, the investments that we are making in the business—in real estate and in China—and the strategicchanges at Victoria’s Secret put pressure on 2016 results. However, these strategic changes position us for futureaccelerated growth. Our performance in 2016 is reflected in the compensation for our NEOs. CEO compensationdecreased 46% and compensation for the other NEOs decreased on average approximately 21%. In summary, wesee alignment between our performance, our stockholders’ interests and our pay. Accordingly, we recommendstockholders vote FOR the executive compensation program as outlined in Proposal 3.
Executive Compensation Philosophy
Guiding Principles
The Compensation Committee has built an executive compensation program on clear, purposeful guidingprinciples:
Compensation Component Our Principles
Pay Level • Attract and retain superior leaders in the highly competitivemarket for talent.
• Pay competitively and equitably.
• Recognize depth and scope of accountability and complexityof responsibility.
Pay Mix • Emphasize performance-contingent, long term and equity-based compensation over fixed compensation.
Pay for Performance • Recognize and reward enterprise, brand and individualperformance.
• Align executives’ interests with stockholders’ interests.
• Require executives to own a significant amount of CommonStock.
• Set Spring and Fall goals to reflect the seasonal nature ofour business and incent goal achievement in each season.
• Create long-term stockholder value through regularachievement of short-term goals while pursuing our longer-term strategy of growth in North America and internationallyand increasing operating margins.
• Retain and incent high-performers through long-term equityincentive awards.
23
Pro
xyS
tatemen
t

Connecting Performance and Pay
Our challenging incentive goals require superior performance to achieve target pay. When our NEOs hit andexceed these goals, we compensate them accordingly. Conversely, disappointing results are also reflected inexecutive compensation.
To achieve pay for performance, we employ a pay mix philosophy that places greater emphasis onperformance-based and equity compensation over base salary. In fact, our CEO has received only one increase inbase salary since 2008, including no increase in fiscal 2016. The following charts illustrate our pay mixphilosophy which consists of a lower percentage of base salary compared to performance-based pay at target for2016:
CEO
Long-Term Performance-Based Equity Compensation
Short-Term Performance-Based Incentive Compensation
Base Salary
12%
25%63%
Base Salary
Short-Term Performance-Based Incentive Compensation
Long-Term Performance-Based Equity Compensation
18%
28%54%
Other NEO Average
To assess whether the Company’s compensation program delivers pay for performance as designed, theCompensation Committee’s independent compensation consultant, Willis Towers Watson, analyzed ourperformance-based long term equity and short term cash compensation for our NEOs across four key measures(operating income, earnings per share, total stockholder return and return on invested capital) relative to our peergroup. The analysis shows that both pay and performance are in the top quartile of our peer group.
Based on this analysis, Willis Towers Watson and the Compensation Committee concluded that our NEOcompensation is aligned with performance and appropriate based on the competitive market, achievement ofperformance goals and total returns delivered to our stockholders.
Compensation Comparison
We compare our NEO compensation with publicly available data on executive compensation.
We define our peer group, with the help of Willis Towers Watson, to generally include:
• Specialty and department store retailers;
• Companies with brands that have emotional content;
• Businesses that are generally similar to the Company in total revenue, market capitalization, globallocations, business and/or merchandise focus; and
• Retailers that compete with the Company for executive talent.
24

We review our peer group annually and in 2016 replaced DSW, Inc. and Target Corporation with Bed Bathand Beyond Inc. and Ross Stores, Inc. These changes were made to add companies that more closely align withour size, in terms of revenue and market capitalization while meeting other selection criteria. Following ourreview, our peer group consists of the following companies:
Abercrombie & Fitch Co. The Gap, Inc. Ralph Lauren CorporationAmerican Eagle Outfitters, Inc. J. C. Penney Company, Inc. Ross Stores, Inc.Avon Products, Inc. Kohl’s Corporation Starbucks CorporationBed Bath & Beyond Inc. Macy’s, Inc. The TJX Companies, Inc.Coach, Inc. NIKE, Inc. Williams-Sonoma, Inc.The Estee Lauder Companies Inc. Nordstrom, Inc.
We do not specifically benchmark our NEOs’ compensation against our peer group. Instead, we considerpeer comparisons as one of several factors in applying our pay philosophy and setting the pay of our NEOs. Ourpeer group is used by the Compensation Committee’s independent compensation consultant to analyze theeffectiveness of our compensation program at delivering pay for performance on a relative basis.
Stock Ownership Guidelines
The Compensation Committee encourages NEO Common Stock ownership through stock ownershipguidelines which promote a long term focus, discourage inappropriate risk-taking and align the interests of ourNEOs with those of our stockholders. Stock ownership guidelines can be met through direct or beneficialownership of Common Stock, including Common Stock held under our stock and retirement plans.
Our CEO is required to maintain ownership of Common Stock with a value of five times his base salary. Asthe beneficial owner of 46,747,343 shares (16.36%) of Common Stock, Mr. Wexner’s ownership well exceedsthis minimum requirement.
Other NEOs are required to maintain beneficial ownership of Common Stock with a value of three times hisor her base salary. All of these NEOs have beneficial ownership in excess of this guideline as of the end of fiscal2016.
Members of our Board must maintain ownership of at least the number of shares of Common Stock receivedas Board compensation over the previous four years. All members of our Board are in compliance with thispolicy.
Compensation for NEOs
The Compensation Committee makes all decisions regarding compensation for Mr. Wexner. TheCompensation Committee oversees the evaluation process and compensation structure for the other NEOs andapproves all NEO stock awards.
Target compensation for the NEOs is reviewed annually and is designed to reward historical performance,incent future performance and be competitive with the external market for talent. The following fiscal 2015accomplishments were considered in setting NEO target compensation for 2016:
• Increased sales 6% to $12.2 billion driven by comparable sales increase of 5% and comparable storesales increase of 5%.
• Increased adjusted earnings per share by 14% to $3.991.
• Increased merchandise margin rate.
1 The reconciliation of such measure to the comparable figure determined in accordance with GAAP is included on page 24 of the 201610-K.
25
Pro
xyS
tatemen
t

• Improved operating income rate to a record 18.0% from 17.1%.
• Delivered total shareholder return of 19%.
• Continued international expansion of our brands.
• Returned value to stockholders through regular and special dividends.
When setting target compensation for 2016, factors including the Company’s future challenges and goals,expectations of continued growth and improved margins, potential market challenges and continued internationalexpansion efforts were also considered.
Compensation Components
The three principal elements of our executive compensation programs are base salary, short termperformance-based cash incentive compensation and long term performance-based equity incentivecompensation. Participation in the base salary, short term performance-based cash incentive compensation is thesame for all of our NEOs, including our CEO. The size and grant timing of long-term performance-based equityincentive compensation for our CEO is different from the other NEOs but the key terms of the award are thesame, including vesting and performance requirements. Other elements of compensation that may be paid toNEOs include retirement and other post-employment benefits and perquisites. Our CEO is not eligible for post-employment benefits under a severance or change in control agreement. Additional information about each ofthese compensation components is provided below.
Base Salary
The following factors are considered in determining base salary adjustments:
• Scope and responsibility of the NEO’s position;
• Achievement of seasonal and annual business goals;
• Level of overall compensation paid by competitors for comparable positions;
• Recruitment, retention and development of leadership talent;
• The Company’s challenging expectations for future growth; and
• The appropriate balancing of our NEOs’ base salary against their incentive compensation.
For 2016, Mr. Wexner did not receive an increase to his base salary. The other NEOs received base salaryincreases in recognition of their contributions to the continued success of the Company. Mr. Coe’s increase isbased on his achievement of business goals for Bath & Body Works, recognizes his successful leadership and isintended to be highly competitive with the external market.
2016 BaseSalary ($)
2015 BaseSalary ($)
%Increase
Mr. Wexner . . . . . . . . . . . . . . . . . . . . . . . . . . . . . . . . . . . . . . . . . . 2,000,000 2,000,000 0.0%Mr. McGuigan . . . . . . . . . . . . . . . . . . . . . . . . . . . . . . . . . . . . . . . . 1,300,000 1,250,000 4.0%Mr. Coe . . . . . . . . . . . . . . . . . . . . . . . . . . . . . . . . . . . . . . . . . . . . . 1,100,000 1,000,000 10.0%Mr. Burgdoerfer . . . . . . . . . . . . . . . . . . . . . . . . . . . . . . . . . . . . . . . 900,000 852,800 5.5%Mr. Waters . . . . . . . . . . . . . . . . . . . . . . . . . . . . . . . . . . . . . . . . . . . 900,000 850,000 5.9%
Short Term Performance-Based Cash Incentive Compensation
This program focuses on achievement of six-month goals, reflecting the seasonal nature of our business andthe fact that achievement of our short term goals season after season creates long term value for our stockholders.
26
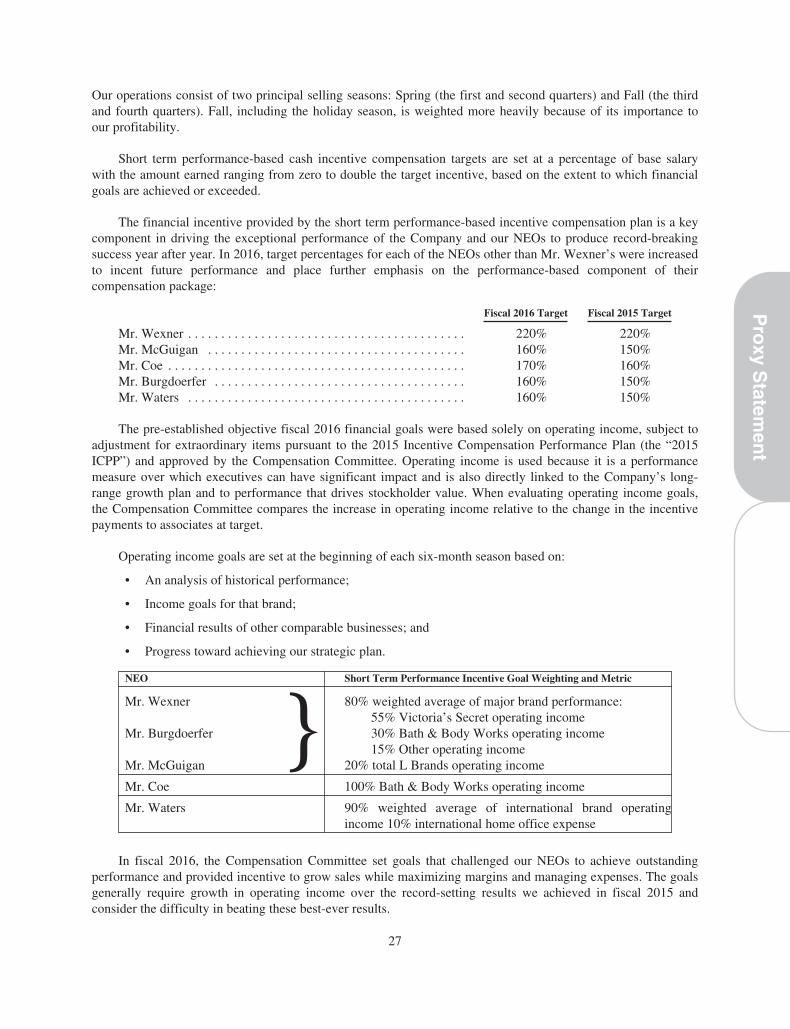
Our operations consist of two principal selling seasons: Spring (the first and second quarters) and Fall (the thirdand fourth quarters). Fall, including the holiday season, is weighted more heavily because of its importance toour profitability.
Short term performance-based cash incentive compensation targets are set at a percentage of base salarywith the amount earned ranging from zero to double the target incentive, based on the extent to which financialgoals are achieved or exceeded.
The financial incentive provided by the short term performance-based incentive compensation plan is a keycomponent in driving the exceptional performance of the Company and our NEOs to produce record-breakingsuccess year after year. In 2016, target percentages for each of the NEOs other than Mr. Wexner’s were increasedto incent future performance and place further emphasis on the performance-based component of theircompensation package:
Fiscal 2016 Target Fiscal 2015 Target
Mr. Wexner . . . . . . . . . . . . . . . . . . . . . . . . . . . . . . . . . . . . . . . . . . 220% 220%Mr. McGuigan . . . . . . . . . . . . . . . . . . . . . . . . . . . . . . . . . . . . . . . 160% 150%Mr. Coe . . . . . . . . . . . . . . . . . . . . . . . . . . . . . . . . . . . . . . . . . . . . . 170% 160%Mr. Burgdoerfer . . . . . . . . . . . . . . . . . . . . . . . . . . . . . . . . . . . . . . 160% 150%Mr. Waters . . . . . . . . . . . . . . . . . . . . . . . . . . . . . . . . . . . . . . . . . . 160% 150%
The pre-established objective fiscal 2016 financial goals were based solely on operating income, subject toadjustment for extraordinary items pursuant to the 2015 Incentive Compensation Performance Plan (the “2015ICPP”) and approved by the Compensation Committee. Operating income is used because it is a performancemeasure over which executives can have significant impact and is also directly linked to the Company’s long-range growth plan and to performance that drives stockholder value. When evaluating operating income goals,the Compensation Committee compares the increase in operating income relative to the change in the incentivepayments to associates at target.
Operating income goals are set at the beginning of each six-month season based on:
• An analysis of historical performance;
• Income goals for that brand;
• Financial results of other comparable businesses; and
• Progress toward achieving our strategic plan.
NEO Short Term Performance Incentive Goal Weighting and Metric
Mr. Wexner } 80% weighted average of major brand performance:55% Victoria’s Secret operating income
Mr. Burgdoerfer 30% Bath & Body Works operating income15% Other operating income
Mr. McGuigan 20% total L Brands operating income
Mr. Coe 100% Bath & Body Works operating income
Mr. Waters 90% weighted average of international brand operatingincome 10% international home office expense
In fiscal 2016, the Compensation Committee set goals that challenged our NEOs to achieve outstandingperformance and provided incentive to grow sales while maximizing margins and managing expenses. The goalsgenerally require growth in operating income over the record-setting results we achieved in fiscal 2015 andconsider the difficulty in beating these best-ever results.
27
Pro
xyS
tatemen
t

Spring and Fall season operating income goals for Victoria’s Secret when compared to actual results forfiscal 2015 are generally flat due to projected expenses associated with the opening of the 5th Avenue store inNew York City. In addition, operating income goals reflect increased expenses related to the opening of stores inChina.
The table below shows the operating income goals required to earn short term performance-based incentivecompensation at target and actual performance by season:
Fiscal 2016 Spring Season Fiscal 2016 Fall Season
Operating IncomeGoal
ActualPerformance1
Operating IncomeGoal
ActualPerformance1
Total L Brands . . . . . . . . . . . . $795 million $780 million $1,410 million $1,271 millionVictoria’s Secret . . . . . . . . . . 618 million 558 million 800 million 656 millionBath & Body Works . . . . . . . 243 million 262 million 653 million 659 millionL Brands International2 . . . . . 9 million 2 million 18 million 13 millionOther2 . . . . . . . . . . . . . . . . . . 76 million 99 million 115 million 135 million
1 Actual performance presents operating income on an adjusted basis which removes certain special items (subject to approval by theCompensation Committee) which are not indicative of Company ongoing operations due to their non-recurring and extraordinary nature.The Company uses adjusted financial information as key performance measures of results for purposes of evaluating performanceinternally, which may not correspond to amounts reported externally.
2 L Brands International and Other include business unit operating income that is an internal performance measure and does not correspondto amounts reported externally.
Performance goals required to earn threshold payout range from approximately 85% to 90% of target andperformance goals required to earn maximum payout range from approximately 110% to 120% of target.Performance below threshold results in no payout and performance between threshold and target and target andmaximum is interpolated to determine payout percentage beginning at 20% at threshold up to 200% at maximum.
Payouts for fiscal 2016 performance are set forth below and in the “Non-Equity Incentive PlanCompensation” column of the 2016 Summary Compensation Table.
Total Fiscal 2016 Incentive Payout
Fiscal 2016 TargetIncentive
Fiscal 2016Spring Incentive
Payout
Fiscal 2016Fall Incentive
PayoutTotal Fiscal 2016
Payout% of Fiscal2016 Target
Mr. Wexner . . . . . . . . . . . $4,400,000 $1,657,920 $ 0* $1,657,920 66%Mr. McGuigan . . . . . . . . . 2,080,000 783,744 597,792 1,381,536 66%Mr. Coe . . . . . . . . . . . . . . 1,870,000 1,249,160 1,254,396 2,503,556 134%Mr. Burgdoerfer . . . . . . . . 1,440,000 542,592 413,856 956,448 66%Mr. Waters . . . . . . . . . . . . 1,440,000 376,704 717,984 1,094,688 76%
* Pursuant to its exercise of negative discretion and with Mr. Wexner’s concurrence, the Compensation Committee determined not to payMr. Wexner’s incentive compensation, which would have been $1,264,560 based on his incentive formula.
Long Term Performance-Based Equity Incentive Compensation
Stock awards are made to our NEOs under the 2015 Stock Options and Performance Incentive Plan (the“2015 Plan”). Our equity-based long term performance-based incentive program rewards past performance andencourages future performance with a challenging performance requirement for our NEOs. In addition, thevesting requirements increase the likelihood that we will be able to retain executives who are critical to oursuccess.
For the NEOs other than Mr. Wexner, individual performance (including contribution to the achievement ofbusiness goals, execution of retail fundamentals and accomplishment of talent and cultural objectives),
28

competitive practice, the Company’s overall budget for equity compensation expense and stockholder dilution,internal equity and retention risk are all considered in determining the size of their fiscal 2016 equity awards. Thesize and timing of Mr. Wexner’s equity award is determined on a different basis, as described in detail below.
Stock Options
Stock options are intended to align executive interests with stockholder interests by creating a direct linkbetween compensation and stockholder return, and to foster retention. Stock options granted to each NEO vestover five years, subject to continued employment. The exercise price is equal to the grant date closing price ofCommon Stock.
Performance-Based RSUs
Performance-based RSUs are intended to:
• Incent achievement of key performance metrics (through the performance requirement);
• Align executive rewards with those realized by stockholders (through the market value of our stock);
• Retain superior executive talent (through the time vesting requirements); and
• Reward exceptional individual performance (through annual determination of the size of the award).
Performance-based RSUs awarded to NEOs other than Mr. Wexner in March 2016 recognize recordfinancial performance in fiscal 2015 and provide significant retentive value for NEOs. Below is a summary of theperformance-based RSU awards and stock options awarded in fiscal 2016:
Value ofPerformance-
Based RSU AwardValue of StockOption Award
Total Fiscal2016 Equity
Award Value
Mr. Wexner . . . . . . . . . . . . . . . . . . . . . . . . . . . . . . . . $7,159,010 $2,231,003 $9,390,013Mr. McGuigan . . . . . . . . . . . . . . . . . . . . . . . . . . . . . . 3,154,443 117,924 3,272,367Mr. Coe . . . . . . . . . . . . . . . . . . . . . . . . . . . . . . . . . . . 2,426,441 90,705 2,517,146Mr. Burgdoerfer . . . . . . . . . . . . . . . . . . . . . . . . . . . . . 2,426,441 90,705 2,517,146Mr. Waters . . . . . . . . . . . . . . . . . . . . . . . . . . . . . . . . . 2,426,441 90,705 2,517,146
Note: While the performance requirement is the same, the amount and timing of Mr. Wexner’s equity award aredetermined on a different basis than that of our other NEOs, as described in detail below.
In order for performance-based RSUs to be earned, the Company’s cumulative adjusted operating income,as a percentage of cumulative sales, must be in the top one-third of the S&P Retailing Index (also determined ona cumulative and adjusted basis) beginning with the fiscal year of the award through the fiscal year immediatelypreceding each vest date.
We use operating income in our short term performance-based cash incentive program and as a componentof our long term performance-based equity incentive program because operating income is an important focus forour NEOs and an appropriate metric for measuring performance. However, while operating income is acomponent of both incentive programs, there are notable differences in the performance metrics used in the twoprograms:
• Operating income is the sole performance metric used for our short term program while the long termprogram is based on a metric that uses both operating income and sales;
• The use of operating income as a percentage of sales for our long term program requires strongperformance in both operating income and sales and measures the efficiency of our sales;
29
Pro
xyS
tatemen
t

• The relative metric of the long term program requires that our performance significantly exceeds thatof companies within our industry for the pre-determined performance goal to be achieved; and
• The cumulative performance metric of the long term program requires sustained performance over thefive-year vesting period reflecting long term performance of the Company.
Performance-based RSUs vest over five years, with 20% vesting on each of the second and thirdanniversaries of the grant date, and 30% on each of the fourth and fifth anniversaries, in each case subject to theperformance measure being satisfied and continued employment. To the extent any tranche of the award that iseligible for performance-based vesting does not vest in any fiscal year, such tranche may vest in future years,subject to satisfaction of the cumulative performance measure. The cumulative performance metric requires anyperformance shortfall in any period to be made up on a cumulative basis in any subsequent periods for anyvesting tranche to be earned. All unvested performance-based RSUs not earned as of the end of the five-yearperformance period will be forfeited. Beginning with performance-based RSUs awarded in fiscal 2017, to theextent the performance metric is not met for any vesting tranche, the shares from such vesting tranche will beforfeited.
Equity awards are effective the later of the date the grant is approved or the date of hire or other relevanteffective date.
Retirement and Other Post-Employment Benefits
Retirement and other post-employment benefits consist of qualified and non-qualified defined contributionretirement plan benefits and termination benefits.
Qualified Defined Contribution Retirement Plan
The qualified plan is available to all associates who meet certain age and service requirements. Associatescan contribute up to the amounts allowable under the Internal Revenue Code of 1986 (the “Code”). TheCompany matches associates’ contributions according to a predetermined formula and contributes additionalamounts based on a percentage of the associates’ eligible annual compensation and years of service. Associates’contributions and Company matching contributions to the qualified plan vest immediately. Additional Companycontributions and the related investment earnings are subject to vesting based on years of service.
Non-Qualified Defined Contribution Supplemental Retirement Plan
The non-qualified plan is available to all associates who meet certain age, service, job level andcompensation requirements. The non-qualified plan is an unfunded plan which provides benefits beyond theCode limits for qualified defined contribution plans. The Company does not set aside assets to fund liabilities ofthe non-qualified plan. Assets that may be used to satisfy such liabilities are general assets of the Company,subject to the claims of the Company’s creditors.
Associates can contribute to the non-qualified plan up to a maximum percentage of eligible compensation.The Company matches associates’ contributions and contributes additional amounts based on a percentage of theassociates’ eligible compensation and years of service.
The plan also permits participating associates to defer additional compensation up to a maximum amountwhich the Company does not match.
Associates’ contributions to the non-qualified plan and the related interest accruals vest immediately.Company contributions and credits to the non-qualified plan and the related interest are subject to vesting basedon years of service.
30

Termination Benefits: Severance and Change in Control Agreements
We have entered into severance and change in control agreements with our NEOs other than Mr. Wexner.See “Retirement and Other Post-Employment Benefits—Estimated Post-Employment Payments and Benefits”for a description of estimated benefits in certain termination situations, including a change in control.
Upon a change in control, awards will only vest if the executive’s employment is terminated by theexecutive for good reason or by the Company other than for cause within 24 months of the change in control.
None of our NEOs is entitled to a tax gross-up upon a change in control.
Perquisites
We provide our NEOs with minimal perquisites that the Compensation Committee has determined arereasonable and in the best interests of the Company and its stockholders. These perquisites include thereimbursement of financial planning costs of up to $9,500. In addition, the Company provides associates at theVice President level and above, including the NEOs, with supplemental disability and life insurance coverage.
CEO Compensation
Overview of CEO Pay
Mr. Wexner is a recognized unique talent: an innovator and leader in the retail industry. His long record ofsuccess in leading the Company is unmatched in scope and duration by any other retailer. In November 2015,Mr. Wexner was recognized by the Harvard Business Review as the best-performing CEO in the world based ontotal shareholder return during his tenure as our founder and CEO. The Compensation Committee has determinedthat his extraordinary contributions as the Company’s CEO deserve to be fully reflected in his compensation andthat Mr. Wexner should be rewarded for his continued ability to drive performance, growth and shareholderreturns, with due consideration to his management of the business for both short term and long term results.
The Company’s performance is reflected in Mr. Wexner’s short term and long term performance-basedincentive compensation for fiscal 2016. The decrease of 46% year over year from fiscal 2015 to 2016 is linked toshort term performance-based incentive compensation that was earned below target and long term performance-based incentive compensation awarded at target level that is 45% below the value awarded for fiscal 2015.
CEO Stock Award Determination Overview
Beginning with fiscal 2010, the Compensation Committee implemented an annual process in whichMr. Wexner’s stock grant would be a “split grant” delivered in two parts—one in the Spring at the same timeother senior executives receive stock grants, and one near the end of the Fall season when Mr. Wexner’s and theCompany’s performance can be substantially determined for the fiscal year. Both the Spring and Fall stockawards are 100% performance contingent, granted as a combination of stock options and performance-basedrestricted stock units.
Spring 2016 Award
The value of the Spring stock award is set below the competitive market to provide a baseline award whileimposing a performance requirement for the award to be earned. The Compensation Committee grantedMr. Wexner a stock award in Spring 2016 with a reported value of $2.7 million.
Fall 2016 Award
As the fiscal year draws to a close, the Compensation Committee assesses both Mr. Wexner’s and theCompany’s performance, and if deemed appropriate, grants Mr. Wexner a performance-based stock award in
31
Pro
xyS
tatemen
t

January. This Fall stock award is intended to recognize financial, strategic and operational performance for thefiscal year and incent future performance. The Fall award is subject to performance in two ways:
1. The Compensation Committee goes through a rigorous quantitative and qualitative evaluation ofhistorical performance to determine the size of the award; and
2. Once granted, RSUs must be earned based on the attainment of a quantitative performance metric andthe value of stock options is contingent on increasing the stock price.
For fiscal 2016, the Compensation Committee set the Fall stock award value range from zero at minimum,to $7.8 million at target and $18.8 million at maximum.
The range was set in recognition of Mr. Wexner’s standing as a top-performing CEO and in consideration ofa benchmark of stock award values for CEOs in our peer group. The Compensation Committee also consideredthe importance of Mr. Wexner’s experience and leadership to the Company’s outstanding performance, includingthe delivery of high total shareholder return, which has increased at a much more rapid rate than hiscompensation.
• The top of the range has been strategically positioned so that if all qualitative, objective and financialperformance targets for the year are exceeded, and if the Company is among the highest performing ofour peer companies, Mr. Wexner’s stock award value would be among the top of our peer group.
• Conversely, if performance is below targeted levels, Mr. Wexner’s stock award value would becorrespondingly lower or there would be no Fall stock award.
In addition to performance against pre-established financial targets, the Compensation Committee considersfactors such as leadership talent development, the identification and development of new business opportunities,and success in fostering a high performance culture, in determining the size of Mr. Wexner’s Fall stock award.Once the size of the grant is determined, the Compensation Committee imposes a performance metric that theCompany must achieve over the vesting period in order for Mr. Wexner to vest in the award.
In January 2017, the Compensation Committee granted Mr. Wexner a fiscal 2016 stock award with areported value of $6.7 million (a decrease of 52% from the award in January 2016) based on the performance ofthe Company.
The Committee considered Mr. Wexner’s role and leadership in the following accomplishments for thecurrent fiscal year:
• Increasing sales 3%;
• Growth of the business in North America through compelling merchandise assortments, marketing andstore and online experiences for our customers;
• Execution of our fundamental strategy of being fast, focused and frugal;
• Expansion of operations outside the United States and Canada including 117 new company-owned andfranchised stores;
• Accomplishment of talent and cultural objectives; and
• Optimization of capital structure, allowing the Company to pay cash out to shareholders, whilemaintaining a strong credit profile among lenders, landlords and suppliers.
In determining the size of the Fall 2016 award, the Committee also considered the following performancethat did not meet our high expectations:
• Decrease in adjusted operating income1 of 7%, adjusted net income1 8% and adjusted earnings pershare1 6%;
1 The reconciliation of such measure to the comparable figure determined in accordance with GAAP is included on pages 23 to 24 of the2016 10-K.
32

• Annualized total shareholder returns of -35%, 9% and 13% over one, three and five years, respectively.
Both the Spring and Fall awards are delivered as a combination of performance-based RSUs and stockoptions. Mr. Wexner’s RSU awards are subject to the same performance and vesting requirement as those of ourother NEOs. The performance-based RSUs and stock options vest over five years, with 20% vesting on each ofthe second and third anniversaries of the grant date, and 30% on each of the fourth and fifth anniversaries.Performance-based RSUs must be earned based on achievement of adjusted operating income, as a percentage ofcumulative sales, in the top one-third of the S&P Retailing Index (also determined on a cumulative and adjustedbasis).
CEO Termination Benefits
Due to his unique role as the founder of the Company, Mr. Wexner is not covered by a severance or changein control agreement. However, consistent with the treatment for all stock plan participants under the terms ofour 2015 Plan and prior plan, all of Mr. Wexner’s unvested stock options and RSUs will vest upon death. Subjectto the achievement of pre-established performance conditions, RSUs will continue to vest upon Mr. Wexner’stotal disability. Upon retirement, RSUs will vest pro-rata based on the fraction of whole months worked from thegrant date over the full vesting period (i.e., one-fifth will vest if twelve full months are completed from the grantdate for a grant that would otherwise vest over five years), subject to achievement of pre-established performanceconditions. In the event of a change in control, unvested RSU awards will vest if Mr. Wexner’s employment isterminated other than for cause within 24 months of the change in control.
CEO Perquisites
The Board of Directors has approved a security program (the “Security Program”) that provides securityservices to Mr. Wexner and his family. The Security Program is required for the benefit of the Company and isappropriate given the risks associated with Mr. Wexner’s position. We periodically hire a third party to reviewour Security Program to verify that a bona fide business oriented security concern exists and that the SecurityProgram costs are reasonable and consistent with these concerns. The Security Program requires Mr. Wexner touse corporate provided aircraft, or private aircraft that is in compliance with the Security Program, whether thepurpose of the travel is business or personal.
The cost of security services which are not business related have been reimbursed to the Company byMr. Wexner. In addition, to the extent that corporate provided aircraft is used by Mr. Wexner or any NEO forpersonal purposes, he has reimbursed the Company based on the greater of the amount established by the InternalRevenue Service (“IRS”) as reasonable for personal use or the aggregate incremental cost associated with thepersonal use of the corporate owned aircraft as determined by an independent, third party aircraft costing service.
Compensation Governance
Compensation Committee
Our executive compensation program is overseen by the Compensation Committee. CompensationCommittee members are appointed by our Board and meet independence and other NYSE requirements.Compensation Committee members are selected based on their knowledge and experience in compensationmatters from both their professional experience and their roles on other boards.
As part of its self-evaluation process, the Compensation Committee considers prevailing best practices andcompliance with the highest governance standards. During fiscal 2016, the Compensation Committee alsocontinued to engage with the full Board to maximize its effectiveness. The role of the Compensation Committeeand information about its meetings are set forth in this proxy statement.
33
Pro
xyS
tatemen
t

The Compensation Committee participated in the preparation of this CD&A and recommended to the Boardthat it be included in this proxy statement.
The Compensation Committee, together with the Company, also evaluates the Company’s compensationstructure from the perspective of enterprise risk. The Compensation Committee believes that the Company’scompensation structures are appropriate and do not incentivize inappropriate taking of business risks.
The Compensation Committee’s charter is available on our website at www.lb.com.
Committee Meetings and Delegation
Company management, including the Chief Operating Officer and the Chief Financial Officer, attendsCompensation Committee meetings along with the Senior Vice President of Total Rewards, who generallyprepares meeting materials, and the Corporate Secretary, who records the minutes of the meeting. Management,including the CEO, does not play a role in recommending CEO compensation. The Compensation Committeeregularly meets in executive session without management present.
The Compensation Committee may delegate its authority to subcommittees or the Chair of theCompensation Committee. In accordance with its charter, the Compensation Committee has delegated to ourChief Operating Officer, or his designee, the authority to make stock awards in accordance with the Company’sstock incentive plan with a value up to $400,000 in any year to any associate who is not a Section 16 officer ofthe Company or a senior leadership team member.
Independent Compensation Consultant
As permitted by its charter, the Compensation Committee retained Willis Towers Watson as its independentexecutive compensation consultant and has the sole authority to retain and terminate any independent executivecompensation consultant.
The Compensation Committee, considering recommendations from our management team, determines thework to be performed by the consultant. The consultant works with management to gather data required inpreparing analyses for Compensation Committee review. Specifically, the services the consultant providesinclude:
• Assisting in evaluation of CEO and other NEO compensation;
• Informing the Compensation Committee of changing market practices;
• Consulting on our executive compensation strategy and program design;
• Analyzing alignment of pay and performance;
• Assisting in the selection of our peer group; and
• Assisting in the preparation and review of this disclosure.
During fiscal 2016, the Company paid $83,811 to Willis Towers Watson for executive compensationconsulting. In addition, during fiscal 2016, the Company paid $85,000 to a separate division of Willis TowersWatson for insurance brokerage and risk consulting services related to our aviation operations and $114,436 forquarterly software usage fees for a call center tracking system.
The Compensation Committee reviews and approves the provision of additional services by Willis TowersWatson to the Company and evaluates the performance and independence of Willis Towers Watson, specificallyconsidering independence factors identified by the Commission. This evaluation includes a review of writtenrepresentations from Willis Towers Watson confirming their independence. Based on its evaluation, the
34

Compensation Committee believes that there are no conflicts of interest that could impair Willis TowersWatson’s ability to provide independent, objective advice to the Compensation Committee regarding executivecompensation matters.
Tax Deductibility
The Compensation Committee seeks to structure tax-efficient executive compensation. The 2015 ICPP andthe 2015 Plan are intended to qualify short term cash incentive payments and long term equity incentivecompensation for tax deductibility under Section 162(m) of the Code. To maintain flexibility in structuringexecutive compensation, the Compensation Committee has not adopted a policy requiring all compensation to betax deductible.
Recovery of Compensation
Under the 2015 ICPP and the 2015 Plan, the Compensation Committee has the power and authority torecover previously awarded bonuses or equity-based compensation or profits if (i) required by applicable lawwith respect to a participant, (ii) a participant engaged in fraudulent conduct or activities (or had knowledge ofsuch conduct or activities) relating to the Company or (iii) a participant should have had knowledge of suchconduct or activities based on his or her position, duties or responsibilities.
Tally Sheets
To assess the reasonableness of the compensation of our NEOs, the Compensation Committee annuallyreviews a three-year history of all of the components of the NEOs’ compensation, including salary, short termincentive compensation, realized and unrealized gains on stock options and RSUs, the cost to the Company of allperquisites, benefits earned and accrued under the Company’s non-qualified deferred compensation plan andsupplemental executive retirement plan, and potential payouts under several potential severance andchange-in-control scenarios. Based on this review, the Compensation Committee concluded that compensationcomponents individually and in aggregate are reasonable, encourage retention, incent performance and are in thebest interests of the Company and its stockholders.
Conclusion
In summary, in 2016 we made significant strategic changes at Victoria’s Secret and invested in realestate and infrastructure for future growth, particularly at Bath & Body Works and in China. While theseinvestments did and will continue to put pressure on our short term results, they position us for futureaccelerated growth. Our performance in 2016 is reflected in the significant decrease in 2016 compensationfor our NEOs. CEO compensation decreased 46% and compensation for the other NEOs decreased onaverage approximately 21% demonstrating our commitment to delivering pay for performance.
The effectiveness of our compensation program at providing pay for performance over time is furthervalidated by our financial performance over the last five years relative to the changes in CEO pay. Since2011, the average annual increase in adjusted sales, operating income, earnings per share and totalshareholder return exceeds the average increase in CEO compensation over the same time period. Ourcompensation program is aligned with our performance over time, providing incentives that are in the bestinterest of our stockholders.
Based on the above, we recommend stockholders vote FOR the executive compensation program.
35
Pro
xyS
tatemen
t

2016 Summary Compensation Table
The following table sets forth information concerning total compensation earned by or paid to our CEO,Chief Financial Officer and our three other most highly compensated NEOs during the fiscal year endedJanuary 28, 2017.
Name andPrincipal Position Year
Salary($)
Bonus($)(1)
StockAwards($)(2)(3)
OptionAwards($)(2)(3)
Non-EquityIncentive
PlanCompen-
sation ($)(4)
Changein
PensionValueandNon-
qualifiedDeferredCompen-
sationEarnings
($)(5)
All OtherCompen-
sation($)(6)
Total ($)(1)(2)(3)(4)(5)(6)
Leslie H. Wexner . . . . . . . . . . . . . . 2016 $2,000,000 $0 $ 7,159,010 $2,231,003 $1,657,920 $553,781 $1,172,130 $14,773,844Chairman of the Board, CEO 2015 1,985,385 0 13,005,048 3,998,333 6,749,600 498,794 930,940 27,168,100
2014 1,924,000 0 11,174,435 3,410,577 6,342,273 448,922 793,829 24,094,036
Charles C. McGuigan . . . . . . . . . . . 2016 1,290,385 0 3,154,443 117,924 1,381,536 95,421 530,468 6,570,177Chief Operating Officer,CEO/President, Mast Global
2015 1,197,788 0 4,060,166 254,325 2,876,250 79,210 391,404 8,859,1432014 978,500 0 2,259,482 261,901 2,257,869 66,695 315,018 6,139,465
Nicholas P. M. Coe . . . . . . . . . . . . 2016 1,080,769 0 2,426,441 90,705 2,503,556 32,365 560,907 6,694,743CEO/President, Bath & BodyWorks
2015 985,577 0 3,178,121 203,455 3,200,000 19,137 346,684 7,932,9742014 925,000 0 2,075,856 247,587 2,373,735 10,815 274,511 5,907,504
Stuart B. Burgdoerfer . . . . . . . . . . . 2016 890,923 0 2,426,441 90,705 956,448 60,403 388,959 4,813,879Executive Vice President,Chief Financial Officer
2015 847,262 0 2,710,253 173,503 1,962,293 49,375 309,802 6,052,4882014 824,000 0 1,849,186 220,550 1,833,458 40,300 262,535 5,030,029
Martin P. Waters . . . . . . . . . . . . . . 2016 890,385 0 2,426,441 90,705 1,094,688 32,295 294,972 4,829,486President L BrandsInternational
(1) Performance-based incentive compensation bonuses are disclosed in this table under the Non-EquityIncentive Plan Compensation column. None of our NEOs received a nonperformance-based award in fiscal2016.
(2) The value of stock and option awards reflects the aggregate grant date fair value, excluding estimatedforfeitures, computed in accordance with Accounting Standards Codification (“ASC”) Topic 718Compensation—Stock Compensation, for each award. Stock options are valued using the Black-Scholesoption pricing model. See Note 20 to the Company’s financial statements filed in the 2016 10-K for therelated assumptions for stock options granted during fiscal 2016, 2015 and 2014 and for a discussion of ourassumptions in determining the aggregate grant date fair value of these awards. Awards vest over time and,therefore, are not realizable on an annual basis, nor is the ultimate value determinable without reference tofuture performance.
(3) Stock and option awards were granted to each NEO under the Company’s 2011 Stock Option andPerformance Incentive Plan (the “2011 Plan”) and the 2015 Plan. Awards are long term compensation andgenerally vest over five years and are not realizable on an annual basis.
36

(4) Represents the aggregate of the non-equity performance-based incentive compensation for the applicablefiscal Spring and Fall selling seasons. Incentive compensation targets are set based on a percentage of basesalary and are paid seasonally based on the achievement of operating income results. The following tableillustrates the amount of the compensation which is paid in cash and voluntarily deferred:
Paid inCash
($)
DeferredCash
($)Total
($)
Mr. Wexner . . . . . . . . . . . . . . . . . . . . . . . . . . . . . . . . . . . . . . . $1,608,182 $49,738 $1,657,920(a)Mr. McGuigan . . . . . . . . . . . . . . . . . . . . . . . . . . . . . . . . . . . . . 1,340,540 40,996 1,381,536Mr. Coe . . . . . . . . . . . . . . . . . . . . . . . . . . . . . . . . . . . . . . . . . . . 2,427,011 76,545 2,503,556Mr. Burgdoerfer . . . . . . . . . . . . . . . . . . . . . . . . . . . . . . . . . . . . 923,970 32,478 956,448Mr. Waters . . . . . . . . . . . . . . . . . . . . . . . . . . . . . . . . . . . . . . . . 1,058,870 35,818 1,094,688
(a) Amount reflects Mr. Wexner’s incentive compensation payment for the Spring season only. Pursuant toits exercise of negative discretion and with Mr. Wexner’s concurrence, the Compensation Committeedetermined not to pay Mr. Wexner’s Fall incentive compensation, which would have been $1,264,560based on his incentive formula.
(5) The Company does not sponsor a defined benefit retirement plan (tax-qualified or non-qualified). For fiscal2015, the amounts shown represent the amount by which earnings on each NEO’s non-qualified planbalance exceed 120% of the applicable federal long term rate.
(6) The following table details all other compensation paid to each NEO during our last fiscal year:
Financialplanningservicesprovided
toexecutive
($)
Cashpayout offractionalshares dueto specialdividend
stockaward
adjustment($)
IncrementalCompany
cost toprovide
supplementallife and
disabilityinsurancecoverage
($)
Companycontributions tothe executive’squalified andnon-qualified
retirement planaccount
($)Total
($)
Mr. Wexner . . . . . . . . . . . . $ 0 $608 $1,558 $1,169,964 $1,172,130Mr. McGuigan . . . . . . . . . . 930 774 1,995 526,769 530,468Mr. Coe . . . . . . . . . . . . . . . 0 308 2,120 558,479 560,907Mr. Burgdoerfer . . . . . . . . . 9,500 575 2,120 376,764 388,959Mr. Waters . . . . . . . . . . . . . 2,900 404 2,120 289,548 294,972
37
Pro
xyS
tatemen
t

Grants of Plan-Based Awards for Fiscal 2016
The following table provides information relating to plan-based awards and opportunities granted to theNEOs during the fiscal year ended January 28, 2017.
NameGrantDate
Estimated Future Payouts UnderNon-Equity Incentive Plan
Awards(1)
Estimated Future PayoutsUnder Equity Incentive Plan
Awards(2)
AllOtherStock
Awards:Number
ofShares of
Stockor Units
(#)(3)
AllOtherOption
Awards:Number ofSecurities
UnderlyingOptions
(#)(4)
Exerciseor BasePrice ofOptionAwards($/Sh)
GrantDate FairValue of
Stock andOptionAwards
($)(5)Threshold
($)Target
($)Maximum
($)Threshold
(#)Target
(#)Maximum
(#)
Leslie H. Wexner . . . . . . . 3/31/2016 27,332 $87.81 $ 585,9983/31/2016 27,332 2,117,6831/25/2017 94,584 61.85 1,645,0051/25/2017 94,584 5,041,327
$880,000 $4,400,000 $8,800,000Charles C. McGuigan . . . . 3/31/2016 11,104 87.81 117,924
3/31/2016 29,609 2,294,1053/31/2016 11,104 860,338
416,000 2,080,000 4,160,000Nicholas P. M. Coe . . . . . 3/31/2016 8,541 87.81 90,705
3/31/2016 22,776 1,764,6843/31/2016 8,541 661,757
374,000 1,870,000 3,740,000Stuart B. Burgdoerfer . . . . 3/31/2016 8,541 87.81 90,705
3/31/2016 22,776 1,764,6843/31/2016 8,541 661,757
288,000 1,440,000 2,880,000Martin P. Waters . . . . . . . 3/31/2016 8,541 87.81 90,705
3/31/2016 22,776 1,764,6843/31/2016 8,541 661,757
288,000 1,440,000 2,880,000
(1) Non-Equity Incentive Plan Awards represent the Threshold, Target and Maximum opportunities under the2015 ICPP for the 2016 Spring and Fall seasons. The actual amount earned under this plan is disclosed inthe 2016 Summary Compensation Table in the “Non-Equity Incentive Plan Compensation” column.
(2) Equity Incentive Plan Awards represent the Target payment of performance-based RSUs for fiscal 2016. Noamount is disclosed for Threshold and Maximum since the number of performance-based RSUs earned doesnot fluctuate based on performance. Units are earned at target, or not at all.
Stock Awards granted on March 31, 2016 are subject to the Company’s achievement of operating income asa percentage of sales ranking in the top one third of the S&P Retailing Index in each of fiscal 2016, 2017,2018, 2019 and 2020, determined on a cumulative basis. Stock Awards granted to Mr. Wexner onJanuary 25, 2017 are subject to the Company’s achievement of operating income as a percentage of salesranking in the top one third of the S&P Retailing Index in each of fiscal 2017, 2018, 2019, 2020 and 2021,determined on a cumulative basis. If the performance condition is met, the RSUs will vest 20% on thesecond and third anniversaries of the grant date and 30% on the fourth and fifth anniversaries of the grantdate, subject to continued employment.
(3) Stock Awards were granted pursuant to the Company’s 2015 Plan.
In each case, the vesting of these awards is subject to continued employment.
Dividends are not paid or accrued on stock awards or stock units until such shares vest.
(4) Option Awards were granted pursuant to the Company’s 2015 Plan. Option grant dates were established onthe date the grants were approved by the Compensation Committee and the exercise price is the closingprice of Common Stock on the grant date.
38

Option Awards vest 20% on the second and third anniversaries of the grant date and 30% on the fourth andfifth anniversaries of the grant date.
In each case, the vesting of these awards is subject to continued employment.
(5) The value of stock and option awards reflects the grant date fair value under ASC Topic 718Compensation—Stock Compensation for each award. Options are valued using the Black-Scholes optionpricing model with the following weighted average assumptions as set forth in the Company’s financialstatements filed in the 2016 10-K: dividend yield of 3.3%, volatility of 25%, risk free interest rate of 1.1%and expected life of 4.1 years. RSUs are valued based on the fair market value of a share of Common Stockon the date of grant, adjusted for anticipated dividend yields.
39
Pro
xyS
tatemen
t

Outstanding Equity Awards at Fiscal Year-End for Fiscal 2016
The following table provides information relating to outstanding equity awards granted to the NEOs as offiscal year end, January 28, 2017.
Option Awards Restricted Stock Awards
NameGrantDate
Number ofSecurities
UnderlyingUnexercised
OptionsExercisable
(#)
Number ofSecurities
UnderlyingUnexercised
OptionsUnexercisable
(#)
EquityIncentive
PlanAwards:
Number ofSecurities
UnderlyingUnexercisedUnearnedOptions
(#)
OptionExercise
Price($)
OptionExpiration
DateGrantDate
Numberof Sharesor Unitsof Stock
ThatHaveNot
Vested(#)
MarketValue of
Shares orUnits of
Stock ThatHave Not
Vested($)(25)
EquityIncentive
PlanAwards:Number
ofUnearned
Shares,Units orOtherRightsThat
Have NotVested
(#)
EquityIncentive
PlanAwards:Market
or PayoutValue of
UnearnedShares,Units orOtherRightsThat
Have NotVested($)(25)
Leslie H.Wexner . . . . . . . . 3/30/2007 150,783 0 0 18.41 3/30/2017
3/31/2008 238,951 0 0 12.08 3/31/20183/31/2009 384,567 0 0 6.14 3/31/20193/31/2010 127,639 0 0 18.09 3/31/20201/27/2011 305,224 0 0 23.64 1/27/20213/31/2011 87,361 0 0 26.43 3/31/20211/26/2012 202,039 0 0 35.71 1/26/20223/30/2012 38,898 16,674(1) 0 41.54 3/30/20221/31/2013 64,622 96,937(2) 0 45.03 1/31/20233/29/2013 22,049 33,080(3) 0 41.88 3/29/20231/30/2014 24,836 99,355(4) 0 49.38 1/30/20243/31/2014 8,514 34,071(5) 0 54.21 3/31/20241/28/2015 24,905 99,634(6) 0 81.11 1/28/20254/2/2015 0 26,325(7) 0 91.17 4/2/2025
1/27/2016 0 130,841(8) 0 91.71 1/27/20263/31/2016 0 27,332(9) 0 87.81 3/31/20261/25/2017 0 94,584(10) 0 61.85 1/27/2027
1/26/2012 0 0 60,612(11) 3,576,7143/30/2012 0 0 16,672(12) 983,8151/31/2013 0 0 96,936(13) 5,720,1933/29/2013 0 0 33,078(14) 1,951,9331/30/2014 0 0 99,355(15) 5,862,9393/31/2014 0 0 34,071(16) 2,010,5301/28/2015 0 0 124,539(17) 7,349,0464/2/2015 0 0 26,325(18) 1,553,438
1/27/2016 0 0 130,841(19) 7,720,9273/31/2016 0 0 27,332(20) 1,612,8611/25/2017 0 0 94,584(21) 5,581,402
Charles C.McGuigan . . . . . 3/31/2011 22,991 0 0 26.43 3/31/2021
3/30/2012 10,289 10,291(1) 0 41.54 3/30/20223/29/2013 7,007 21,030(3) 0 41.88 3/29/20233/31/2014 5,411 21,660(5) 0 54.21 3/31/20244/2/2015 0 20,566(7) 0 91.17 4/2/2025
3/31/2016 0 11,104(9) 0 87.81 3/31/20263/30/2012 0 0 34,299(12) 2,023,9843/29/2013 0 0 49,067(14) 2,895,4443/10/2014 474(22) 27,971 0 03/31/2014 0 0 36,101(16) 2,130,3208/29/2014 696(23) 41,071 0 03/9/2015 1,057(24) 62,374 0 04/2/2015 0 0 47,988(18) 2,831,772
3/31/2016 40,713(20) 2,402,474
40

Option Awards Restricted Stock Awards
NameGrantDate
Number ofSecurities
UnderlyingUnexercised
OptionsExercisable
(#)
Number ofSecurities
UnderlyingUnexercised
OptionsUnexercisable
(#)
EquityIncentive
PlanAwards:
Number ofSecurities
UnderlyingUnexercisedUnearnedOptions
(#)
OptionExercise
Price($)
OptionExpiration
DateGrantDate
Numberof Sharesor Unitsof Stock
ThatHaveNot
Vested(#)
MarketValue of
Shares orUnits of
Stock ThatHave Not
Vested($)(25)
EquityIncentive
PlanAwards:Number
ofUnearned
Shares,Units orOtherRightsThat
Have NotVested
(#)
EquityIncentive
PlanAwards:Market
or PayoutValue of
UnearnedShares,Units orOtherRightsThat
Have NotVested($)(25)
Nicholas P. M.Coe . . . . . . . . . . . 3/30/2012 4,467 4,474(1) 0 41.54 3/30/2022
3/29/2013 6,626 19,879(3) 0 41.88 3/29/20233/31/2014 5,116 20,475(5) 0 54.21 3/31/20244/2/2015 0 16,452(7) 0 91.17 4/2/2025
3/31/2016 0 8,541(9) 0 87.81 3/31/20263/30/2012 0 0 16,382(12) 966,7023/29/2013 0 0 86,141(14) 5,083,1803/31/2014 0 0 34,128(16) 2,013,8934/2/2015 0 0 38,390(18) 2,265,394
3/31/2016 0 0 31,317(20) 1,848,016Stuart B.
Burgdoerfer . . . . 3/31/2011 12,773 0 0 26.43 3/31/20213/30/2012 8,664 8,665(1) 0 41.54 3/30/20223/29/2013 5,902 17,709(3) 0 41.88 3/29/20233/31/2014 4,557 18,240(5) 0 54.21 3/31/20244/2/2015 0 14,030(7) 0 91.17 4/2/2025
3/31/2016 0 8,541(9) 0 87.81 3/31/20263/30/2012 0 0 24,552(12) 1,448,8143/29/2013 0 0 17,708(14) 1,044,9493/31/2014 0 0 30,401(16) 1,793,9634/2/2015 0 0 32,738(18) 1,931,869
3/31/2016 0 0 31,317(20) 1,848,016Martin P. Waters . . 3/31/2011 6,149 0 0 26.43 3/31/2021
3/30/2012 18,947 8,127(1) 0 41.54 3/30/20223/29/2013 11,101 16,656(3) 0 41.88 3/29/20233/31/2014 4,286 17,154(5) 0 54.21 3/31/20244/2/2015 0 13,985(7) 0 91.17 4/2/2025
3/31/2016 0 8,541(9) 0 87.81 3/31/20263/30/2012 0 0 23,016(12) 1,358,1743/29/2013 0 0 16,655(14) 982,8123/31/2014 0 0 28,595(16) 1,687,3918/29/2014 424(23) 25,020 0 03/9/2015 599(24) 35,347 0 04/2/2015 0 0 32,631(18) 1,925,555
3/31/2016 0 0 31,317(20) 1,848,016
(1) Options vest 100% on March 30, 2017.
(2) Options vest 50% on January 31, 2017 and 50% on January 31, 2018.
(3) Options vest 50% on March 29, 2017 and 50% on March 29, 2018.
(4) Options vest 25% on January 30, 2017, 37.5% on January 30, 2018 and 37.5% on January 30, 2019.
(5) Options vest 25% on March 31, 2017, 37.5% on March 31, 2018 and 37.5% on March 31, 2019.
(6) Options vest 25% on January 28, 2018, 37.5% on January 28, 2019 and 37.5% on January 28, 2020.
(7) Options vest 20% on April 2, 2017, 20% on April 2, 2018, 30% on April 2, 2019 and 30% on April 2, 2020.
41
Pro
xyS
tatemen
t

(8) Options vest 20% on January 27, 2018, 20% on January 27, 2019, 30% on January 27, 2020 and 30% onJanuary 27, 2021.
(9) Options vest 20% on March 31, 2018, 20% on March 31, 2019, 30% on March 31, 2020 and 30% onMarch 31, 2021.
(10) Options vest 20% on January 25, 2019, 20% on January 25, 2020, 30% on January 25, 2021 and 30% onJanuary 25, 2022.
(11) Shares vested 100% on January 26, 2017, subject to achievement of a performance condition.
(12) Shares vest 100% on March 30, 2017 subject to achievement of a performance condition.
(13) 50% vested on January 31, 2017, subject to achievement of a performance condition. Remaining shares veston January 31, 2018, also subject to achievement of a performance condition.
(14) Subject to achievement of a performance condition, shares vest 50% on March 29, 2017 and 50% onMarch 29, 2018.
(15) 25% vested on January 30, 2017, subject to achievement of a performance condition. Remaining shares vest37.5% on January 30, 2018 and 37.5% on January 30, 2019, also subject to achievement of a performancecondition.
(16) Subject to achievement of a performance condition, shares vest 25% on March 31, 2017, 37.5% onMarch 31, 2018 and 37.5% on March 31, 2019.
(17) 20% vested on January 28, 2017, subject to achievement of a performance condition. Remaining shares vest20% on January 28, 2018, 30% on January 28, 2019 and 30% on January 28, 2020, also subject toachievement of a performance condition.
(18) Subject to achievement of a performance condition, shares vest 20% on April 2, 2017, 20% on April 2,2018, 30% on April 2, 2019 and 30% on April 2, 2020.
(19) Subject to achievement of a performance condition, shares vest 20% on January 27, 2018, 20% onJanuary 27, 2019, 30% on January 27, 2020 and 30% on January 27, 2021.
(20) Subject to achievement of a performance condition, shares vest 20% on March 31, 2018, 20% on March 31,2019, 30% on March 31, 2020 and 30% on March 31, 2021.
(21) Subject to achievement of a performance condition, shares vest 20% on January 25, 2019, 20% onJanuary 25, 2020, 30% on January 25, 2021 and 30% on January 25, 2022.
(22) Shares vest 100% on March 10, 2017.
(23) Shares vest 100% on August 29, 2017.
(24) Shares vest 100% on March 9, 2018.
(25) Market value based on the $59.01 fair market value of a share of Common Stock on the last trading day ofthe fiscal year (January 27, 2017).
42

Option Exercises and Stock Vested Information for Fiscal 2016
The following table provides information relating to Option Awards exercised and RSU Awards vestedduring the fiscal year ended January 28, 2017.
Option Awards Restricted Stock Awards
Name
Number ofShares
Acquired onExercise (#)
ValueRealized on
Exercise ($)(1)
Number ofShares
Acquired onVesting (#)
ValueRealized on
Vesting ($)(2)
Leslie H. Wexner . . . . . . . . . . . . . . . . . . . . . . . . . . . . . . . . 116,802 $8,303,933 153,975 $9,820,526Charles C. McGuigan . . . . . . . . . . . . . . . . . . . . . . . . . . . . . 0 0 83,285 5,872,219Nicholas P. M. Coe . . . . . . . . . . . . . . . . . . . . . . . . . . . . . . . 12,573 547,211 62,954 4,050,205Stuart B. Burgdoerfer . . . . . . . . . . . . . . . . . . . . . . . . . . . . . 0 0 50,820 3,548,163Martin P. Waters . . . . . . . . . . . . . . . . . . . . . . . . . . . . . . . . . 0 0 35,712 2,277,711
(1) Option Award Value Realized is calculated based on the difference between (a) the sale price and the optionexercise price for shares that were sold upon exercise and (b) the closing price on the day prior to the date ofexercise and the option exercise price for shares that were held upon exercise.
(2) Restricted Stock Award Value Realized is calculated based on the closing stock price on the date the RSUsvested.
43
Pro
xyS
tatemen
t

Retirement and Other Post-Employment Benefits
Non-qualified Deferred Compensation for Fiscal 2016(1)
Name
ExecutiveContributionsin Last Fiscal
Year ($)(2)
RegistrantContributionsin Last Fiscal
Year ($)(3)
AggregateEarnings inLast FiscalYear ($)(4)
AggregateWithdrawals/Distributions
($)(5)
AggregateBalance atLast Fiscal
YearEnd($)(6)
Leslie H. Wexner . . . . . . . . . . . . . . . . . . . $228,983 $1,153,504 $1,409,372 $0 $29,498,967Charles C. McGuigan . . . . . . . . . . . . . . . . 108,361 499,708 242,847 0 5,205,329Nicholas P. M. Coe . . . . . . . . . . . . . . . . . . 119,317 531,419 82,370 0 1,914,266Stuart B. Burgdoerfer . . . . . . . . . . . . . . . . 71,926 349,704 153,725 0 3,306,568Martin P. Waters . . . . . . . . . . . . . . . . . . . . 49,340 265,138 171,351 0 3,082,414
(1) Amounts disclosed include non-qualified cash deferrals, Company matching contributions, retirementcredits and earnings under the Company’s Supplemental Retirement Plan (a non-qualified definedcontribution plan) and stock deferrals and related reinvested dividend earnings under the Company’samended and restated 1993 Stock Option and Performance Incentive Plan (the “1993 Plan”), 2011 Plan and2015 Plan. Executive Contributions and related matching Registrant Contributions represent 2016 calendaryear deferrals and matches on incentive compensation payments earned based on performance for the Fall2015 season, which was paid in March 2016, and for the Spring 2016 season, which was paid in August2016.
(2) All of the contributions are reported in the 2016 Summary Compensation Table under the “Salary” and/or“Non-Equity Incentive Plan Compensation” columns.
(3) Reflects the Company’s 200% match of associate contributions of up to 3% of base salary and bonus abovethe IRS qualified plan maximum compensation limit and the Company’s retirement contribution of 6% forless than five years of service or 8% for five or more years of service of compensation above the IRSqualified plan maximum compensation limit. Associates become fully vested in these contributions after sixyears of service. These contributions are also included under the “All Other Compensation” column of the2016 Summary Compensation Table.
(4) Non-qualified deferred cash compensation balances earn a fixed rate of interest determined prior to thebeginning of each year. The portion of the earnings on deferred cash compensation that exceeds 120% of theapplicable federal long term rate in the amount of $553,781, $95,421, $32,365, $60,403 and $32,295 forMessrs. Wexner, McGuigan, Coe, Burgdoerfer and Waters, respectively; is disclosed in the “Change inPension Value and Non-qualified Deferred Compensation Earnings” column of the 2016 SummaryCompensation Table.
Amount includes dividends earned on deferred stock and RSU balances in the amount of $89,162 forMr. Waters. Dividends are reinvested into additional stock units based on the closing market price ofCommon Stock on the dividend payment date.
(5) Participants may elect to receive the funds in a lump sum or in up to ten annual installments followingtermination of employment, but generally may not make withdrawals during their employment. Deferralsunder the Supplemental Retirement Plan, the 1993 Plan, the 2011 Plan and the 2015 Plan are unfunded.
(6) Balance includes the value of deferred stock and RSUs at calendar year-end in the amount of $1,280,652 forMr. Waters. Value is calculated based on a stock price of $59.01 per share of Common Stock on January 27,2017.
Estimated Post-Employment Payments and Benefits
We have entered into certain agreements with our NEOs that will require us to provide compensation in theevent of a termination of employment, including a termination following a change in control of our Company.
44

Mr. Wexner is not covered by such an agreement but is entitled to certain termination compensation under theterms of our benefit and stock plans.
The following tables set forth the expected benefits to be received by each of the other NEOs in the event ofhis termination resulting from various scenarios, assuming a termination date of January 28, 2017 and a stockprice of $59.01, the price of our Common Stock on January 27, 2017. Each scenario relates to the singletermination event described and amounts are not cumulative in situations where multiple scenarios may apply.
Assumptions and explanations of the numbers set forth in the tables below are set forth in additional textfollowing the tables.(1)
Leslie H. Wexner
Involuntary w/out Cause orVoluntary w/Good Reason
Involuntaryw/out Cause
followingChange in
Control($)
Death($)
Disability($)
VoluntaryResignation/Retirement
($)
w/outRelease
($)
& SignedRelease
($)
Base Salary . . . . . . . . . . . . . . . . $ 0 $ 0 $ 0 $ 0 $ 0 $ 0Bonus(2) . . . . . . . . . . . . . . . . . . 0 0 0 0 0 0Gain of Accelerated Stock
Options(3) . . . . . . . . . . . . . . . 0 0 3,333,252 3,333,252 3,333,252 0Value of Pro-rated or
Accelerated RSUs(3) . . . . . . . 13,102,049 13,102,049 38,877,440 38,877,440 38,877,440 13,102,049Benefits and Perquisites(4) . . . . 117,000 117,000 117,000 2,117,000 842,000 117,000Tax Gross-Up . . . . . . . . . . . . . . . N/A N/A N/A N/A N/A N/A
Total . . . . . . . . . . . . . . . . . . . . . . $13,219,049 $13,219,049 $42,327,692 $44,327,692 $43,052,692 $13,219,049
Charles C. McGuigan
Involuntary w/out Cause orVoluntary w/Good Reason
Involuntaryw/out Cause
followingChange in
Control($)
Death($)
Disability($)
VoluntaryResignation/Retirement
($)
w/outRelease
($)
& SignedRelease
($)
Base Salary . . . . . . . . . . . . . . . . . . $1,300,000 $ 2,600,000 $ 2,600,000 $ 0 $ 0 $ 0Bonus(2) . . . . . . . . . . . . . . . . . . . . 0 1,950,000 4,257,786 0 0 0Gain of Accelerated Stock
Options(3) . . . . . . . . . . . . . . . . . 0 0 643,888 643,888 643,888 0Value of Pro-rated or Accelerated
RSUs(3) . . . . . . . . . . . . . . . . . . . 5,755,894 5,755,894 12,415,409 12,415,409 12,415,409 5,755,894Benefits and Perquisites(4) . . . . . . 67,195 72,825 72,825 2,055,935 608,750 55,935Tax Gross-Up . . . . . . . . . . . . . . . . . N/A N/A N/A N/A N/A N/A
Total . . . . . . . . . . . . . . . . . . . . . . . . $7,123,089 $10,378,719 $19,989,908 $15,115,232 $13,668,047 $5,811,829
45
Pro
xyS
tatemen
t

Nicholas P. M. Coe
Involuntary w/out Cause orVoluntary w/Good Reason
Involuntaryw/out Cause
followingChange in
Control($)
Death($)
Disability($)
VoluntaryResignation/Retirement
($)
w/outRelease
($)
& SignedRelease
($)
Base Salary . . . . . . . . . . . . . . . . . . . . $1,100,000 $2,200,000 $ 2,200,000 $ 0 $ 0 $ 0Bonus(2) . . . . . . . . . . . . . . . . . . . . . . 0 1,870,000 5,703,556 0 0 0Gain of Accelerated Stock
Options(3) . . . . . . . . . . . . . . . . . . . 0 0 516,886 516,886 516,886 0Value of Pro-rated or Accelerated
RSUs(3) . . . . . . . . . . . . . . . . . . . . 0 5,722,200 12,177,186 12,177,186 12,177,186 0Benefits and Perquisites(4) . . . . . . . . 14,720 128,173 128,173 2,106,094 609,774 0Tax Gross-Up . . . . . . . . . . . . . . . . . . N/A N/A N/A N/A N/A N/A
Total . . . . . . . . . . . . . . . . . . . . . . . . . $1,114,720 $9,920,373 $20,725,801 $14,800,166 $13,303,846 $ 0
Stuart B. Burgdoerfer
Involuntary w/out Cause orVoluntary w/Good Reason
Involuntaryw/out Cause
followingChange in
Control($)
Death($)
Disability($)
VoluntaryResignation/Retirement
($)(5)
w/outRelease
($)
& SignedRelease
($)
Base Salary . . . . . . . . . . . . . . . . . . . . . $900,000 $1,800,000 $ 1,800,000 $ 0 $ 0 $ 0Bonus(2) . . . . . . . . . . . . . . . . . . . . . . . 0 1,440,000 2,918,741 0 0 0Gain of Accelerated Stock
Options(3) . . . . . . . . . . . . . . . . . . . . 0 0 542,194 542,194 542,194 0Value of Pro-rated or Accelerated
RSUs(3) . . . . . . . . . . . . . . . . . . . . . . 0 3,555,293 8,067,611 8,067,611 8,067,611 0Benefits and Perquisites(4) . . . . . . . . . 14,595 59,051 59,051 1,837,159 490,808 0Tax Gross-Up . . . . . . . . . . . . . . . . . . . N/A N/A N/A N/A N/A N/A
Total . . . . . . . . . . . . . . . . . . . . . . . . . . . $914,595 $6,854,344 $13,387,597 $10,446,964 $9,100,613 $ 0
Martin P. Waters
Involuntary w/out Cause orVoluntary w/Good Reason
Involuntaryw/out Cause
followingChange in
Control($)
Death($)
Disability($)
VoluntaryResignation/Retirement
($)(5)
w/outRelease
($)
& SignedRelease
($)
Base Salary . . . . . . . . . . . . . . . . . . . . . $ 0 $ 900,000 $ 1,800,000 $ 0 $ 0 $ 0Bonus(2) . . . . . . . . . . . . . . . . . . . . . . . 0 1,440,000 1,440,000 0 0 0Gain of Accelerated Stock
Options(3) . . . . . . . . . . . . . . . . . . . . 0 0 509,550 509,550 509,550 0Value of Pro-rated or Accelerated
RSUs(3) . . . . . . . . . . . . . . . . . . . . . . 0 3,435,798 7,862,315 7,862,315 7,862,315 0Benefits and Perquisites(4) . . . . . . . . . 0 75,807 75,807 1,861,212 511,212 0Tax Gross-Up . . . . . . . . . . . . . . . . . . . N/A N/A N/A N/A N/A N/A
Total . . . . . . . . . . . . . . . . . . . . . . . . . . . $ 0 $5,851,605 $11,687,672 $10,233,077 $8,883,077 $ 0
46

(1) Assumes a termination date of January 28, 2017.
(2) Bonus amounts assumed at target. Under “Involuntary w/out Cause or Voluntary w/Good Reason”termination scenarios, actual bonus payments would be equal to the bonus payment the NEO would havereceived if he or she had remained employed with the Company for a period of one year after thetermination date of January 28, 2017. Under an “Involuntary w/out Cause following Change in Control”termination scenario, bonus payments for Messrs. McGuigan, Coe and Burgdoerfer will be equal to the sumof the last four seasonal bonus payments received and for Mr. Waters will be the same as the “Involuntaryw/out Cause or Voluntary w/Good Reason” termination scenario.
(3) Reflects the value of unvested RSUs and stock options that, subject to achievement of pre-establishedperformance conditions, would become vested based on the $59.01 fair market value of a share of CommonStock on the last trading day of the fiscal year (January 27, 2017).
(4) Estimates for benefits and perquisites include the pro rata value of retirement plan contributions on earningsaccrued up to the termination date and the continuation of medical, dental and other insurance benefits.Under the “Death” and “Disability” scenarios, includes proceeds from life and disability insurance policiesand the value of unvested retirement plan balances that would become vested.
(5) Messrs. Coe, Burgdoerfer and Waters have not met the age and/or service requirement to qualify for pro rataRSU vesting and retirement plan contributions under the retirement provisions of the 2011 Plan, the 2015Plan and the qualified and non-qualified retirement plans.
Assumptions and Explanations of Numbers in Tables
The Compensation Committee retains discretion to provide, and in the past has provided, additional benefitsto NEOs upon termination or resignation if it determines the circumstances so warrant.
The tables do not include the payment of the aggregate balance of the NEO’s non-qualified deferredcompensation that is disclosed in the Non-qualified Deferred Compensation for Fiscal 2016 table above.
Confidentiality, Non-Competition and Non-Solicitation Agreements
As a condition to each NEO’s entitlement to receive certain severance payments and equity vestingacceleration upon certain termination scenarios, the NEO is required to execute a release of claims against us andshall be bound by the terms of certain restrictive covenants, including non-competition and non-solicitationagreements which prohibit the NEO from soliciting or diverting any current or potential employee, customer, orsupplier or competing with any of our businesses in which he or she has been employed for a period of one yearfrom the date of termination.
Termination Provisions—Definitions of Cause and Good Reason
The employment agreements for all NEOs other than Mr. Wexner, who does not have an employmentagreement, contain customary definitions of cause and good reason. “Cause” generally means that the NEO(1) willfully failed to perform his or her duties with the Company (other than a failure resulting from the NEO’sincapacity due to physical or mental illness); (2) has plead “guilty” or “no contest” to or has been convicted of anact which is defined as a felony under federal or state law; or (3) engaged in willful misconduct in bad faithwhich could reasonably be expected to materially harm the Company’s business or its reputation.
“Good Reason” generally means (1) the failure to continue by the NEO in a capacity originallycontemplated in the NEO’s employment agreement; (2) the assignment to the NEO of any duties materiallyinconsistent with the NEO’s position, duties, authority, responsibilities or reporting requirements, as set out in hisor her employment agreement; (3) a reduction in or a material delay in payment of the NEO’s total cash
47
Pro
xyS
tatemen
t

compensation and benefits from those required to be provided; (4) the requirement that the NEO be based outsideof the United States, other than for travel that is reasonably required to carry out the NEO’s duties; or (5) thefailure by the Company to obtain the assumption in writing of its obligation to perform the employmentagreement by a successor.
Payments Upon a Termination in Connection with a Change in Control
A Change in Control of the Company will be deemed to have occurred upon the first to occur of any of thefollowing events:
a) any person, together with all affiliates, becomes a beneficial owner of securities representing 33% ormore of the combined voting power of the voting stock then outstanding;
b) during any period of 24 consecutive months, individuals who at the beginning of such period constitutethe Board cease for any reason to constitute a majority of directors then constituting the Board;
c) a reorganization, merger or consolidation of the Company is consummated, unless more than 50% ofthe outstanding shares of Common Stock are beneficially owned by individuals and entities who ownedCommon Stock just prior to such reorganization, merger or consolidation; or
d) the consummation of a complete liquidation or dissolution of the Company.
No Tax Gross-up
In the event of a termination following a Change in Control, none of our NEOs is entitled to reimbursementor gross-up for any excise taxes that may be imposed under Section 280G of the Code.
48

Fiscal 2016 Director Compensation
The following table sets forth compensation earned by the individuals who served as directors of theCompany during fiscal 2016(1).
Name
Fees Earned orPaid in Cash
($)(2)
StockAwards
($)(3) Total ($)
E. Gordon Gee . . . . . . . . . . . . . . . . . . . . . . . . . . . . . . . . . . . . . . . . . . . . . . . $134,400 $134,437 $268,837Dennis S. Hersch . . . . . . . . . . . . . . . . . . . . . . . . . . . . . . . . . . . . . . . . . . . . . 121,900 121,968 243,868Donna A. James . . . . . . . . . . . . . . . . . . . . . . . . . . . . . . . . . . . . . . . . . . . . . . 164,400 144,447 308,847David T. Kollat . . . . . . . . . . . . . . . . . . . . . . . . . . . . . . . . . . . . . . . . . . . . . . . 171,900 156,916 328,816William R. Loomis, Jr(4). . . . . . . . . . . . . . . . . . . . . . . . . . . . . . . . . . . . . . . . 30,475 0 30,475Jeffrey H. Miro . . . . . . . . . . . . . . . . . . . . . . . . . . . . . . . . . . . . . . . . . . . . . . . 134,400 134,437 268,837Michael G. Morris . . . . . . . . . . . . . . . . . . . . . . . . . . . . . . . . . . . . . . . . . . . . 124,400 124,427 248,827Stephen D. Steinour . . . . . . . . . . . . . . . . . . . . . . . . . . . . . . . . . . . . . . . . . . . 111,900 111,958 223,858Allan R. Tessler . . . . . . . . . . . . . . . . . . . . . . . . . . . . . . . . . . . . . . . . . . . . . . 194,400 169,473 363,873Abigail S. Wexner . . . . . . . . . . . . . . . . . . . . . . . . . . . . . . . . . . . . . . . . . . . . 141,900 131,978 273,878Raymond Zimmerman . . . . . . . . . . . . . . . . . . . . . . . . . . . . . . . . . . . . . . . . . 134,400 134,437 268,837
(1) Directors who are also associates receive no additional compensation for their service as directors. Ourcurrent Board’s compensation plan does not provide for stock option awards, non-equity incentive plancompensation, pension or non-qualified deferred compensation. At the end of four years of membership onthe Board, each member must maintain ownership of Common Stock equal to the amount of Common Stockreceived as director compensation over the four-year period.
(2) Directors receive an annual cash retainer of $111,900; directors receive an additional annual cash retainer of$12,500 for membership on the Audit and Compensation Committees and $10,000 for all other committeememberships; the Audit Committee Chair receives an additional $20,000; the Compensation CommitteeChair and the Nominating & Governance Committee Chair each receives an additional $15,000; and othercommittee chairs receive $10,000; and the lead independent director receives an additional cash retainer of$15,000.
(3) Directors receive an annual stock retainer worth $111,900; directors receive an additional annual stock grantworth $12,500 for membership on the Audit and Compensation Committees and worth $10,000 for othercommittee memberships; and the lead independent director receives an additional stock retainer of $15,000.Stock retainers were granted under the 2015 Plan. The number of shares issued is calculated based on thefair market value of Common Stock on the date the shares were issued. The value of stock awards reflectsthe aggregate grant date fair value, excluding estimated forfeitures, computed in accordance with ASCTopic 718 Compensation—Stock Compensation, for each award. See Note 20 to the Company’s financialstatements filed in the 2016 10-K for a discussion of our assumptions in determining the aggregate grantdate fair value of these awards.
(4) Mr. Loomis retired from the Board effective May 19, 2016.
49
Pro
xyS
tatemen
t

COMPENSATION COMMITTEE REPORT
The Compensation Committee of the Board is composed of four directors who are independent, as definedunder the NYSE listing standards. Additionally, each member of the Compensation Committee is an “outsidedirector” within the meaning of Section 162(m) of the Code and a “non-employee director” within the meaningof Section 16b-3 under the Securities Exchange Act of 1934. The Compensation Committee reviews the CD&Aon behalf of the Board.
The Compensation Committee has reviewed and discussed the CD&A with management, and based on thereview and discussions, the Compensation Committee recommended to the Board that the CD&A be included inthe Company’s annual report on Form 10-K for the year ended January 28, 2017 and the Company’s proxystatement.
Compensation Committee
David T. Kollat, ChairE. Gordon GeeJeffrey H. MiroMichael G. Morris
50

SECURITY OWNERSHIP OF DIRECTORS AND MANAGEMENT
The following table shows certain information about the securities ownership of all directors (and nominees)of the Company, the executive officers of the Company named in the “2016 Summary Compensation Table”above and all directors and executive officers of the Company as a group.
Name of Beneficial Owner
Number of Shares of CommonStock Beneficially
Owned(a)(b) Percent of Class
Stuart B. Burgdoerfer . . . . . . . . . . . . . . . . . . . . . . . . . . . . . . . . . . . . . 116,905(c) *Nicholas P. M. Coe . . . . . . . . . . . . . . . . . . . . . . . . . . . . . . . . . . . . . . . 26,148(c) *E. Gordon Gee . . . . . . . . . . . . . . . . . . . . . . . . . . . . . . . . . . . . . . . . . . . 10,265(d) *Dennis S. Hersch . . . . . . . . . . . . . . . . . . . . . . . . . . . . . . . . . . . . . . . . . 9,198,602(d)(f) 3.22%Donna A. James . . . . . . . . . . . . . . . . . . . . . . . . . . . . . . . . . . . . . . . . . . 45,883(d) *David T. Kollat . . . . . . . . . . . . . . . . . . . . . . . . . . . . . . . . . . . . . . . . . . 119,136 *Charles C. McGuigan . . . . . . . . . . . . . . . . . . . . . . . . . . . . . . . . . . . . . 87,820(c)(h) *Jeffrey H. Miro . . . . . . . . . . . . . . . . . . . . . . . . . . . . . . . . . . . . . . . . . . 109,977(d) *Michael G. Morris . . . . . . . . . . . . . . . . . . . . . . . . . . . . . . . . . . . . . . . . 15,652(d) *Stephen D. Steinour . . . . . . . . . . . . . . . . . . . . . . . . . . . . . . . . . . . . . . . 11,667(d) *Allan R. Tessler . . . . . . . . . . . . . . . . . . . . . . . . . . . . . . . . . . . . . . . . . . 82,543 *Martin P. Waters . . . . . . . . . . . . . . . . . . . . . . . . . . . . . . . . . . . . . . . . . 83,638(c)(e) *Abigail S. Wexner . . . . . . . . . . . . . . . . . . . . . . . . . . . . . . . . . . . . . . . . 12,906,423(g) 4.52%Leslie H. Wexner . . . . . . . . . . . . . . . . . . . . . . . . . . . . . . . . . . . . . . . . . 46,747,343(c)(h)(i) 16.36%Raymond Zimmerman . . . . . . . . . . . . . . . . . . . . . . . . . . . . . . . . . . . . . 133,193(d)(j) *All directors and executive officers as a group . . . . . . . . . . . . . . . . . . 47,668,319(c)-(j) 16.68%
* Less than 1%
(a) Unless otherwise indicated, each named person has voting and investment power over the listed shares andsuch voting and investment power is exercised solely by the named person or shared with a spouse. None ofthe listed shares have been pledged as security or otherwise deposited as collateral.
(b) Reflects beneficial ownership of shares of Common Stock, and shares outstanding, as of January 28, 2017.
(c) Includes the following number of shares issuable within 60 days of January 28, 2017, upon the exercise orvesting of outstanding stock awards: Mr. Burgdoerfer, 40,750; Mr. Coe, 26,148; Mr. McGuigan, 56,686;Mr. Waters, 48,811; Mr. Wexner, 1,770,234; and all directors and executive officers as a group, 1,942,629.
(d) Includes the following number of deferred stock units credited to directors’ accounts under the 2003 StockAward and Deferred Compensation Plan for Non-Associate Directors that could be convertible intoCommon Stock within 60 days after termination from the Board: Dr. Gee, 9,309; Mr. Hersch, 78,149;Ms. James, 31,875; Mr. Miro, 89,438; Mr. Morris, 5,542; Mr. Steinour, 1,667; Mr. Zimmerman, 96,388; andall directors as a group, 312,368. Mr. Morris has elected to receive pay-out of his deferred stock units overthree years, and his total represents 1/3 of the units which he would be owed upon his termination from theBoard. Mr. Steinour has elected to receive pay-out of his deferred stock units over five years, and his totalrepresents 1/5 of the units which he would be owed upon his termination from the Board.
(e) Includes the following number of deferred stock units credited to executives’ accounts under the Company’sStock Option and Performance Incentive Plan that could be convertible into Common Stock within 60 daysafter termination of employment with the Company: Mr. Waters, 21,702; and all executives as a group,21,702.
(f) Includes 127,567 shares held by The Linden East Trust, for which Mr. Hersch is trustee and shares votingand investment power with Mr. Wexner and Mrs. Wexner, and 8,992,886 shares held by The Linden WestTrust, for which Mr. Hersch is trustee and shares voting and investment power with Mr. Wexner.
51
Pro
xyS
tatemen
t

(g) Excludes 33,840,920 shares beneficially owned by Mr. Wexner as to which Mrs. Wexner disclaimsbeneficial ownership. Includes 127,567 shares held by The Linden East Trust, as to which Mrs. Wexnershares voting and investment power with Mr. Hersch; 1,441,741 shares held by The Wexner FamilyCharitable Fund; and 191,515 shares held by The Beech Trust, in each case, as to which Mrs. Wexner sharesvoting and investment power with Mr. Wexner. Includes 11,145,600 shares directly owned by Mrs. Wexner.
(h) Includes the following number of shares held in the Savings and Retirement Plan (as of January 28, 2017),over which Messrs. McGuigan and Wexner have investment but not voting power: Mr. McGuigan, 4,265;and Mr. Wexner, 1,875,951.
(i) Includes 127,567 shares held by The Linden East Trust, 8,992,886 shares held by The Linden West Trust,1,441,741 shares held by The Wexner Family Charitable Fund; and 191,515 shares held by The BeechTrust. Mr. Wexner shares voting and investment power with Mrs. Wexner with respect to shares held byThe Linden East Trust, The Wexner Family Charitable Fund and The Beech Trust, and shares voting andinvestment power with Mr. Hersch with respect to shares held by The Linden East Trust and The LindenWest Trust. Includes 4,892,608 shares held by the Wexner Personal Holdings Corporation, of whichMr. Wexner is the sole stockholder, director and officer. Includes 11,145,600 shares directly owned byMrs. Wexner, as to which Mr. Wexner may be deemed to share voting and investment power. Includes16,309,241 shares directly owned by Mr. Wexner.
(j) Includes 3,050 shares which are Mr. Zimmerman’s pro rata share of 9,152 shares owned by a corporation ofwhich Mr. Zimmerman is president and a 33% stockholder.
52

SECTION 16(A) BENEFICIAL OWNERSHIP REPORTING COMPLIANCE
The Company’s executive officers and directors, and persons who own more than 10% of a registered classof the Company’s equity securities, must file reports of ownership and changes in ownership of the Company’sequity securities with the Commission. Copies of those reports must also be furnished to the Company. Basedsolely on a review of the copies of reports furnished to the Company and written representations of theCompany’s executive officers and directors that no other reports were required, we believe that during fiscal2016 our executive officers, directors and greater than 10% beneficial owners complied with these filingrequirements, other than Mr. Tessler who was late in filing one Form 4 reporting one transaction that occurred infiscal 2015 due to inadvertent administrative error.
53
Pro
xyS
tatemen
t

SHARE OWNERSHIP OF PRINCIPAL STOCKHOLDERS
The following table sets forth the names of all persons who, as of the dates indicated below, were known bythe Company to be the beneficial owners (as defined in the rules of the Commission) of more than 5% of theshares of Common Stock.
Name and Address of Beneficial Owner
AmountBeneficially
Owned
Percentof
Class
Leslie H. Wexner(1) . . . . . . . . . . . . . . . . . . . . . . . . . . . . . . . . . . . . . . . . . . . . . . . . . . . . . . . . 46,747,343 16.36%Three Limited ParkwayP.O. Box 16000Columbus, OH 43216
PRIMECAP Management Company(2) . . . . . . . . . . . . . . . . . . . . . . . . . . . . . . . . . . . . . . . . . 16,197,331 5.66%177 E. Colorado Blvd., 11th FloorPasadena, CA 91105
The Vanguard Group(3) . . . . . . . . . . . . . . . . . . . . . . . . . . . . . . . . . . . . . . . . . . . . . . . . . . . . . 15,742,928 5.50%100 Vanguard Blvd.Malvern, PA 19355
FMR LLC(4) . . . . . . . . . . . . . . . . . . . . . . . . . . . . . . . . . . . . . . . . . . . . . . . . . . . . . . . . . . . . . . 15,036,030 5.26%245 Summer StreetBoston, MA 02210
BlackRock, Inc.(5) . . . . . . . . . . . . . . . . . . . . . . . . . . . . . . . . . . . . . . . . . . . . . . . . . . . . . . . . . 14,630,170 5.10%55 East 52nd StreetNew York, NY 10055
(1) As of January 28, 2017. For a description of Mr. Wexner’s beneficial ownership, see “Security Ownershipof Directors and Management” on pages 51 and 52.
(2) As of December 31, 2016, based solely on information set forth in the Schedule 13G/A filed February 9,2017 by PRIMECAP Management Company. PRIMECAP Management Company has sole dispositivepower over 16,197,331 shares and sole voting power over 4,148,397 shares.
(3) As of December 31, 2016, based solely on information set forth in the Schedule 13G/A filed February 10,2017 by The Vanguard Group. The Vanguard Group has sole dispositive power over 15,326,998 shares andsole voting power over 378,629 shares, and has shared dispositive power over 415,930 shares and sharedvoting power over 47,922 shares.
(4) Based solely on information set forth in the Schedule 13G/A filed February 14, 2017 by FMR LLC. FMRLLC has sole dispositive power over 15,036,030 shares and sole voting power over 1,292,293 shares andAbigail P. Johnson has sole dispositive power over 15,448,861 shares. Abigail P. Johnson is a Director, theChairman and the Chief Executive Officer of FMR LLC. Members of the Johnson family, including AbigailP. Johnson, are the predominant owners, directly or through trusts, of Series B voting common shares ofFMR LLC, representing 49% of the voting power of FMR LLC. The Johnson family group and all otherSeries B shareholders have entered into a shareholders’ voting agreement under which all Series B votingcommon shares will be voted in accordance with the majority vote of Series B voting common shares.Accordingly, through their ownership of voting common shares and the execution of the shareholders’voting agreement, members of the Johnson family may be deemed, under the Investment Company Act of1940, to form a controlling group with respect to FMR LLC.
(5) As of December 31, 2016, based solely on information set forth in the Schedule 13G filed January 30, 2017by BlackRock, Inc. BlackRock, Inc. has sole dispositive power over 14,616,984 shares and sole votingpower over 12,593,696 shares, and has shared dispositive power over 13,186 shares and shared votingpower over 13,186 shares.
54
REPORT OF THE AUDIT COMMITTEE
As provided in our written charter, the Audit Committee is instrumental in the Board’s fulfillment of itsoversight responsibilities relating to (i) the integrity of the Company’s financial statements, (ii) the Company’scompliance with legal and regulatory requirements, (iii) the qualifications, independence and performance of theCompany’s independent auditors and (iv) the performance of the Company’s internal audit function.
It is not the duty of the Audit Committee to plan or conduct audits or to determine that the Company’sfinancial statements are complete and accurate and are in accordance with generally accepted accountingprinciples. This is the responsibility of management and the independent auditors. Furthermore, while we areresponsible for reviewing the Company’s policies and practices with respect to risk assessment and management,it is the responsibility of the CEO and senior management to determine the appropriate level of the Company’sexposure to risk.
We have reviewed and discussed L Brands’ audited financial statements as of and for the year endedJanuary 28, 2017 and met with both management and our independent auditors to discuss the financialstatements. Management has represented to us that the financial statements were prepared in accordance withgenerally accepted accounting principles. We have reviewed with the internal auditors and independent auditorsthe overall scope and plans for their respective audits. We also met with the internal auditors and independentauditors, with and without management present, to discuss the results of their examinations and their evaluationsof the Company’s internal controls.
We have also discussed with the independent auditors all matters required to be discussed with auditcommittees under applicable auditing and regulatory standards. The Company’s independent auditors alsoprovided to us the written disclosures and the letter required by applicable requirements of the Public CompanyAccounting Oversight Board regarding the independent auditor’s communications with the audit committeeconcerning independence, and we discussed with the independent auditors their independence from theCompany. We considered whether the provision of non-audit services by the independent auditors to theCompany is compatible with maintaining their independence.
Based on the reviews and discussions summarized in this Report, and subject to the limitations on our roleand responsibilities, certain of which are referred to above and in the Audit Committee charter, we recommendedto the Board that L Brands’ audited financial statements be included in our annual report on Form 10-K for theyear ended January 28, 2017 for filing with the Commission.
We have appointed Ernst & Young LLP as L Brands’ independent registered public accountants.
Audit Committee
Donna A. James, ChairDavid T. KollatAllan R. TesslerRaymond Zimmerman
55
Pro
xyS
tatemen
t

INDEPENDENT REGISTERED PUBLIC ACCOUNTANTS
During our 2016 fiscal year, Ernst & Young LLP served as the Company’s independent registered publicaccountants and in that capacity rendered an opinion on our consolidated financial statements as of and for thefiscal year ended January 28, 2017. The Audit Committee has selected Ernst & Young LLP as the Company’sindependent registered public accountants for the current fiscal year.
Audit Fees
The aggregate audit fees payable to Ernst & Young LLP for the fiscal years ended 2016 and 2015 wereapproximately $4,694,000 and $4,243,000, respectively. These amounts include fees for professional servicesrendered by Ernst & Young LLP in connection with the audit of our consolidated financial statements andreviews of our unaudited consolidated interim financial statements as well as fees for services that generally onlythe independent auditor can reasonably be expected to provide, including comfort letters and consultationregarding financial accounting and/or reporting standards. These amounts also include fees for services renderedin connection with the audit of our internal control over financial reporting and fees for services rendered inconnection with statutory audits of our international subsidiaries’ financial statements.
Audit Related Fees
The aggregate fees for assurance and related services rendered by Ernst & Young LLP that were reasonablyrelated to the audit of our consolidated financial statements for the fiscal years ended 2016 and 2015 wereapproximately $204,000 and $258,000, respectively. The fees under this category are for assurance and relatedservices that are traditionally performed by the independent auditor and include audits of employee benefit plans,agreed upon procedures and other attest engagements.
Tax Fees
The aggregate fees for tax services rendered by Ernst & Young LLP for the fiscal years ended 2016 and2015 were approximately $131,000 and $110,000, respectively. Tax fees include tax compliance and advisoryservices.
All Other Fees
The aggregate fees for all other services rendered by Ernst & Young LLP for the fiscal years ended 2016and 2015 were approximately $0 and $369,000, respectively. The fees under this category that were paid in thefiscal year ended 2015 were for compliance-related advisory services.
Pre-approval Policies and Procedures
The Audit Committee pre-approves all audit and non-audit services to be provided by Ernst & Young LLPin a given fiscal year.
56

OTHER MATTERS
The Board knows of no other matters to be brought before the annual meeting. However, if other mattersshould come before the meeting, each of the persons named as a proxy intends to vote in accordance with his orher judgment on such matters.
STOCKHOLDER PROPOSALS FOR NEXT YEAR
Stockholder Proposals Pursuant to Rule 14a-8
Proposals submitted for inclusion in the proxy statement for the 2018 annual meeting must be received bythe Secretary of the Company at our principal executive offices on or before December 8, 2017.
Stockholder Director Nominations for Inclusion in 2018 Proxy Statement
Written notice of stockholder nominations of persons for election as a director at the 2018 annual meetingthat are to be included in our proxy statement for the 2018 annual meeting pursuant to the proxy accessprovisions in Section 2.05 of our Bylaws must be received by the Secretary of the Company at our principalexecutive offices no earlier than November 8, 2017 and no later than December 8, 2017. The notice must containthe information required by our Bylaws.
Other Stockholder Proposals
If a stockholder intends to present a proposal or nominate a person for election as a director at the 2018annual meeting other than as described above, the stockholder must comply with the requirements set forth inSection 2.04 of our Bylaws. The Bylaws require, among other things, that the Secretary receive written notice ofthe intent to present a proposal or nomination no earlier than February 17, 2018 and no later than March 19,2018. The notice must contain the information required by our Bylaws.
SOLICITATION EXPENSES
We are soliciting this proxy on behalf of our Board and will bear the solicitation expenses. Our directors oremployees may solicit proxies by telephone, facsimile and personal solicitation, in addition to the use of the mail.We will, upon request, reimburse banks, brokerage houses and other institutions, nominees, and fiduciaries fortheir expenses in forwarding proxy materials to beneficial owners.
By Order of the Board of Directors,
Leslie H. WexnerChairman of the Board
57
Pro
xyS
tatemen
t

[THIS PAGE INTENTIONALLY LEFT BLANK]

UNITED STATESSECURITIES AND EXCHANGE COMMISSION
Washington, D. C. 20549
FORM 10-K(Mark One)
È ANNUAL REPORT PURSUANT TO SECTION 13 OR 15(d) OF THE SECURITIESEXCHANGE ACT OF 1934
For the fiscal year ended January 28, 2017OR
‘ TRANSITION REPORT PURSUANT TO SECTION 13 OR 15(d) OF THE SECURITIESEXCHANGE ACT OF 1934 [NO FEE REQUIRED]
For the transition period from toCommission file number 1-8344
L BRANDS, INC.(Exact name of registrant as specified in its charter)
Delaware(State or other jurisdiction
of incorporation or organization)31-1029810
(I.R.S. Employer Identification No.)
Three Limited Parkway,Columbus, Ohio
(Address of principal executive offices)43230
(Zip Code)Registrant’s telephone number, including area code (614) 415-7000
Securities registered pursuant to Section 12(b) of the Act:Title of each class Name of each exchange on which registered
Common Stock, $.50 Par Value The New York Stock ExchangeSecurities registered pursuant to Section 12(g) of the Act: None.
Indicate by check mark if the registrant is a well-known seasoned issuer, as defined in Rule 405 of the SecuritiesAct. Yes È No ‘
Indicate by check mark if the registrant is not required to file reports pursuant to Section 13 or Section 15(d) of theAct. Yes ‘ No È
Indicate by check mark whether the registrant (1) has filed all reports required to be filed by Section 13 or 15(d) of theSecurities Exchange Act of 1934 during the preceding 12 months (or for such shorter period that the registrant was required tofile such reports), and (2) has been subject to such filing requirements for the past 90 days. Yes È No ‘
Indicate by check mark whether the registrant has submitted electronically and posted on its corporate Website, if any, everyInteractive Data File required to be submitted and posted pursuant to Rule 405 of Regulation S-T during the preceding 12months (or for such shorter period that the registrant was required to submit and post such files). Yes È No ‘
Indicate by check mark if disclosure of delinquent filers pursuant to Item 405 of Regulation S-K is not contained herein, andwill not be contained, to the best of registrant’s knowledge, in definitive proxy or information statements incorporated byreference in Part III of this Form 10-K or any amendment to this Form 10-K. È
Indicate by check mark whether the registrant is a large accelerated filer, an accelerated filer, or a non-accelerated filer. Seedefinition of “accelerated filer and large accelerated filer” in Rule 12b-2 of the Exchange Act.Large accelerated filer È Accelerated filer ‘ Non-accelerated filer ‘
Indicate by check mark whether the registrant is a shell company (as defined in Rule 12b-2 of the ExchangeAct). Yes ‘ No È
The aggregate market value of the registrant’s Common Stock held by non-affiliates of the registrant as of the last businessday of the registrant’s most recently completed second fiscal quarter was: $17,899,799,054.Number of shares outstanding of the registrant’s Common Stock as of March 10, 2017: 285,048,417.
DOCUMENTS INCORPORATED BY REFERENCEPortions of the Registrant’s Proxy Statement for the Registrant’s 2017 Annual Meeting of Stockholders to be held onMay 18, 2017, are incorporated by reference into Part II and Part III.
Fo
rm10-K

Table of Contents
Page No.
Part I
Item 1. Business . . . . . . . . . . . . . . . . . . . . . . . . . . . . . . . . . . . . . . . . . . . . . . . . . . . . . . . . . . . . . . . . . . 1Item 1A. Risk Factors . . . . . . . . . . . . . . . . . . . . . . . . . . . . . . . . . . . . . . . . . . . . . . . . . . . . . . . . . . . . . . . 6Item 1B. Unresolved Staff Comments . . . . . . . . . . . . . . . . . . . . . . . . . . . . . . . . . . . . . . . . . . . . . . . . . . . 17Item 2. Properties . . . . . . . . . . . . . . . . . . . . . . . . . . . . . . . . . . . . . . . . . . . . . . . . . . . . . . . . . . . . . . . . . 17Item 3. Legal Proceedings . . . . . . . . . . . . . . . . . . . . . . . . . . . . . . . . . . . . . . . . . . . . . . . . . . . . . . . . . . . 18Item 4. Mine Safety Disclosures . . . . . . . . . . . . . . . . . . . . . . . . . . . . . . . . . . . . . . . . . . . . . . . . . . . . . . 18
Part II
Item 5. Market for the Registrant’s Common Equity, Related Stockholder Matters and IssuerPurchases of Equity Securities . . . . . . . . . . . . . . . . . . . . . . . . . . . . . . . . . . . . . . . . . . . . . . . . . 19
Item 6. Selected Financial Data . . . . . . . . . . . . . . . . . . . . . . . . . . . . . . . . . . . . . . . . . . . . . . . . . . . . . . . 21Item 7. Management’s Discussion and Analysis of Financial Condition and Results of
Operations . . . . . . . . . . . . . . . . . . . . . . . . . . . . . . . . . . . . . . . . . . . . . . . . . . . . . . . . . . . . . . . . . 23Item 7A. Quantitative and Qualitative Disclosures About Market Risk . . . . . . . . . . . . . . . . . . . . . . . . . 56Item 8. Financial Statements and Supplementary Data . . . . . . . . . . . . . . . . . . . . . . . . . . . . . . . . . . . . 58Item 9. Changes in and Disagreements with Accountants on Accounting and Financial
Disclosure . . . . . . . . . . . . . . . . . . . . . . . . . . . . . . . . . . . . . . . . . . . . . . . . . . . . . . . . . . . . . . . . . 104Item 9A. Controls and Procedures . . . . . . . . . . . . . . . . . . . . . . . . . . . . . . . . . . . . . . . . . . . . . . . . . . . . . . 104Item 9B. Other Information . . . . . . . . . . . . . . . . . . . . . . . . . . . . . . . . . . . . . . . . . . . . . . . . . . . . . . . . . . . 104
Part III
Item 10. Directors, Executive Officers and Corporate Governance . . . . . . . . . . . . . . . . . . . . . . . . . . . . 105Item 11. Executive Compensation . . . . . . . . . . . . . . . . . . . . . . . . . . . . . . . . . . . . . . . . . . . . . . . . . . . . . 105Item 12. Security Ownership of Certain Beneficial Owners and Management and Related
Stockholder Matters . . . . . . . . . . . . . . . . . . . . . . . . . . . . . . . . . . . . . . . . . . . . . . . . . . . . . . . . . 105Item 13. Certain Relationships and Related Transactions, and Director Independence . . . . . . . . . . . . . 106Item 14. Principal Accountant Fees and Services . . . . . . . . . . . . . . . . . . . . . . . . . . . . . . . . . . . . . . . . . . 106
Part IV
Item 15. Exhibits, Financial Statement Schedules . . . . . . . . . . . . . . . . . . . . . . . . . . . . . . . . . . . . . . . . . 107Item 16. Form 10-K Summary . . . . . . . . . . . . . . . . . . . . . . . . . . . . . . . . . . . . . . . . . . . . . . . . . . . . . . . . 112
Signatures . . . . . . . . . . . . . . . . . . . . . . . . . . . . . . . . . . . . . . . . . . . . . . . . . . . . . . . . . . . . . . . . . 113

PART I
ITEM 1. BUSINESS.
General
L Brands, Inc. (“we” or “the Company”) operates in the highly competitive specialty retail business. Founded in1963 in Columbus, Ohio, we have evolved from an apparel-based specialty retailer to a segment leader focusedon women’s intimate and other apparel, personal care, beauty and home fragrance categories. We sell ourmerchandise through company-owned specialty retail stores in the United States (“U.S.”), Canada, UnitedKingdom (“U.K.”) and Greater China (China and Hong Kong), which are primarily mall-based; throughwebsites; and through international franchise, license and wholesale partners (collectively, “partners”).
Victoria’s Secret
Victoria’s Secret, including PINK, the iconic women’s intimate brand featuring celebrated supermodels and aworld-famous fashion show, is a specialty retailer of women’s intimate and other apparel with fashion-inspiredcollections and prestige fragrances. We sell our Victoria’s Secret products at more than 1,200 Victoria’s Secretand PINK stores in the U.S., Canada, U.K. and Greater China, and online at www.VictoriasSecret.com.Additionally, Victoria’s Secret and PINK have more than 410 stores in more than 70 other countries operatingunder franchise, license and wholesale arrangements.
Bath & Body Works
Bath & Body Works is one of the leading specialty retailers of personal care, home fragrance products, soaps andsanitizers. We sell our Bath & Body Works products at more than 1,600 Bath & Body Works stores in the U.S.and Canada and online at www.BathandBodyWorks.com. Additionally, Bath & Body Works has 159 stores in30 other countries operating under franchise, license and wholesale arrangements.
Other Brands
La Senza is a specialty retailer of women’s intimate apparel. We sell our La Senza products at more than 120 LaSenza stores in Canada, and online at www.LaSenza.com. In 2016, we opened our first 4 La Senza stores in theU.S. Additionally, La Senza has more than 200 stores in 24 other countries operating under franchise and licensearrangements.
Henri Bendel sells handbags, jewelry and other accessory products through our New York flagship and 28 otherstores, as well as online at www.HenriBendel.com.
Acquisition
In the first quarter of 2016, we reacquired the franchise rights to operate Victoria’s Secret Beauty andAccessories stores in Greater China, including 26 stores already open at the time of acquisition. For additionalinformation, see Note 4 to the Consolidated Financial Statements included in Item 8. Financial Statements andSupplementary Data.
Divestiture
In the first quarter of 2015, we divested our remaining ownership interest in our third-party apparel sourcingbusiness. For additional information, see Note 9 to the Consolidated Financial Statements included in Item 8.Financial Statements and Supplementary Data.
1
Fo
rm10-K

Fiscal Year
Our fiscal year ends on the Saturday nearest to January 31. As used herein, “2016,” “2015,” “2014” and “2013”refer to the 52-week periods ending January 28, 2017, January 30, 2016, January 31, 2015 and February 1, 2014,respectively. “2012” refers to the 53-week period ending February 2, 2013.
Real Estate
Company-owned Retail Stores
Our company-owned retail stores are located in shopping malls, lifestyle centers and street locations in the U.S.,Canada, U.K. and Greater China. As a result of our strong brands and established retail presence, we have beenable to lease high-traffic locations in most retail centers in which we operate. Substantially all of our storesgenerated positive cash flow in 2016.
The following table provides the number of our company-owned retail stores in operation for each brand as ofJanuary 28, 2017 and January 30, 2016.
January 28,2017
January 30,2016
Victoria’s Secret U.S. . . . . . . . . . . . . . . . . . . . . . . . . . . . . . . . . . . . . . . . . . . . . . . . . . . . . . 1,131 1,118Victoria’s Secret Canada . . . . . . . . . . . . . . . . . . . . . . . . . . . . . . . . . . . . . . . . . . . . . . . . . . 46 46Bath & Body Works U.S. . . . . . . . . . . . . . . . . . . . . . . . . . . . . . . . . . . . . . . . . . . . . . . . . . . 1,591 1,574Bath & Body Works Canada . . . . . . . . . . . . . . . . . . . . . . . . . . . . . . . . . . . . . . . . . . . . . . . . 102 98Victoria’s Secret U.K. . . . . . . . . . . . . . . . . . . . . . . . . . . . . . . . . . . . . . . . . . . . . . . . . . . . . . 18 14Victoria’s Secret Beauty and Accessories . . . . . . . . . . . . . . . . . . . . . . . . . . . . . . . . . . . . . 31 —La Senza U.S. . . . . . . . . . . . . . . . . . . . . . . . . . . . . . . . . . . . . . . . . . . . . . . . . . . . . . . . . . . . 4 —La Senza Canada . . . . . . . . . . . . . . . . . . . . . . . . . . . . . . . . . . . . . . . . . . . . . . . . . . . . . . . . . 122 126Henri Bendel . . . . . . . . . . . . . . . . . . . . . . . . . . . . . . . . . . . . . . . . . . . . . . . . . . . . . . . . . . . . 29 29
Total . . . . . . . . . . . . . . . . . . . . . . . . . . . . . . . . . . . . . . . . . . . . . . . . . . . . . . . . . . . . . . . . . . 3,074 3,005
The following table provides the changes in the number of our company-owned retail stores operated for the pastfive fiscal years:
Beginningof Year Opened Closed Acquired (a) End of Year
2016 . . . . . . . . . . . . . . . . . . . . . . . . . . . . . . . . . . . . . . . . . . . 3,005 72 (29) 26 3,0742015 . . . . . . . . . . . . . . . . . . . . . . . . . . . . . . . . . . . . . . . . . . . 2,969 72 (36) — 3,0052014 . . . . . . . . . . . . . . . . . . . . . . . . . . . . . . . . . . . . . . . . . . . 2,923 81 (35) — 2,9692013 . . . . . . . . . . . . . . . . . . . . . . . . . . . . . . . . . . . . . . . . . . . 2,876 81 (34) — 2,9232012 . . . . . . . . . . . . . . . . . . . . . . . . . . . . . . . . . . . . . . . . . . . 2,941 48 (113) — 2,876
(a) Relates to the acquisition of Victoria’s Secret Beauty and Accessories franchise stores in Greater China. Foradditional information see Note 4 to the Consolidated Financial Statements included in Item 8. FinancialStatements and Supplementary Data.
Franchise, License and Wholesale Arrangements
In addition to our company-owned stores, our products are sold at hundreds of partner locations in over75 countries. Under these arrangements, third parties operate stores that sell our products under our brand names.Revenue recognized under franchise and license arrangements generally consists of royalties earned andrecognized upon sale of merchandise by franchise and license partners to retail customers. Revenue is generallyrecognized under wholesale arrangements at the time the title passes to the partner. We continue to increase thenumber of locations under these types of arrangements as part of our international expansion.
2

The following table provides the number of our international stores operated by our partners for each business asof January 28, 2017 and January 30, 2016.
January 28,2017
January 30,2016
Victoria’s Secret Beauty and Accessories . . . . . . . . . . . . . . . . . . . . . . . . . . . . . . . . . . . . . 391 373Victoria’s Secret . . . . . . . . . . . . . . . . . . . . . . . . . . . . . . . . . . . . . . . . . . . . . . . . . . . . . . . . . 28 19Bath & Body Works . . . . . . . . . . . . . . . . . . . . . . . . . . . . . . . . . . . . . . . . . . . . . . . . . . . . . . 159 125La Senza . . . . . . . . . . . . . . . . . . . . . . . . . . . . . . . . . . . . . . . . . . . . . . . . . . . . . . . . . . . . . . . 203 221
Total . . . . . . . . . . . . . . . . . . . . . . . . . . . . . . . . . . . . . . . . . . . . . . . . . . . . . . . . . . . . . . . . . . 781 738
Our Strengths
We believe the following competitive strengths contribute to our leading market position, differentiate us fromour competitors and will drive future growth:
Industry Leading Brands
We have developed and operate brands that have come to represent an aspirational lifestyle. Our brands allow usto target markets across the economic spectrum, across demographics and across the world. We believe that ourthree flagship brands, Victoria’s Secret, PINK and Bath & Body Works, are highly recognizable which providesus with a competitive advantage.
• At Victoria’s Secret, we market glamorous and sexy product lines to our customers. While bras and pantiesare the core of what we do, this brand also gives our customers choices in beauty products, fragrances,loungewear, athletic attire and personal care accessories.
• At PINK, we market products to the college-aged woman. While bras and panties are the core of what wedo, this brand also gives our customers choices in apparel, loungewear, athletic attire, personal careaccessories and swim.
• Bath & Body Works caters to our customers’ entire well-being, providing shower gels and lotions,aromatherapy, home fragrance, soaps and sanitizers and personal care accessories.
In-Store Experience and Store Operations
We view our customers’ in-store experience as an important vehicle for communicating the image of each brand.We utilize visual presentation of merchandise, in-store marketing, music and our sales associates to reinforce theimage represented by the brands.
Our in-store marketing is designed to convey the principal elements and personality of each brand. The storedesign, furniture, fixtures and music are all carefully planned and coordinated to create a unique shoppingexperience. Every brand displays merchandise uniformly to ensure a consistent store experience, regardless oflocation. Store managers receive detailed plans designating fixture and merchandise placement to ensurecoordinated execution of the company-wide merchandising strategy.
Our sales associates and managers are a central element in creating the atmosphere of the stores by providing ahigh level of customer service.
Product Development, Sourcing and Logistics
We believe a large part of our success comes from frequent and innovative product launches, which include bralaunches at Victoria’s Secret, PINK and La Senza and new fragrance launches at Bath & Body Works. Our
3
Fo
rm10-K

merchant, design and sourcing teams have a long history of bringing innovative products to our customers.Additionally, we believe that our sourcing function (Mast Global) has a long and deep presence in the keysourcing markets including those in the U.S. and Asia, which helps us partner with the best manufacturers to gethigh-quality products quickly.
Experienced and Committed Management Team
We were founded in 1963 and have been led since inception by Leslie H. Wexner. Our senior management teamhas a wealth of retail and business experience at L Brands, Inc. and other companies such as Nike, Coach, TheGap, The Home Depot, Land’s End, Levi Strauss, Boots and Yum Brands. We believe that we have one of themost experienced management teams in retail.
Additional Information
Merchandise Suppliers
During 2016, we purchased merchandise from approximately 360 suppliers located throughout the world. Nosupplier provided 10% or more of our merchandise purchases.
Distribution and Merchandise Inventory
Most of our merchandise is shipped to our distribution centers in the Columbus, Ohio area. We use a variety ofshipping terms that result in the transfer of title of the merchandise at either the point of origin or point ofdestination.
Our policy is to maintain sufficient quantities of inventories on hand in our retail stores and distribution centersto enable us to offer customers an appropriate selection of current merchandise. We emphasize rapid turnoverand take markdowns as required to keep merchandise fresh and current.
Information Systems
Our management information systems consist of a full range of retail, financial and merchandising systems. Thesystems include applications related to point-of-sale, e-commerce, merchandising, planning, sourcing, logistics,inventory management, data security and support systems including human resources and finance.
Seasonal Business
Our operations are seasonal in nature and consist of two principal selling seasons: Spring (the first and secondquarters) and Fall (the third and fourth quarters). The fourth quarter, including the holiday season, accounted forapproximately one-third of our net sales for 2016, 2015 and 2014 and is typically our most profitable quarter.Accordingly, cash requirements are highest in the third quarter as our inventories build in advance of the holidayseason.
Working Capital
We fund our business operations through a combination of available cash and cash equivalents and cash flowsgenerated from operations. In addition, our credit facilities are available for additional working capital needs andinvestment opportunities.
Regulation
We and our products are subject to regulation by various federal, state, local and foreign regulatory authorities.We are subject to a variety of customs regulations and international trade arrangements.
4

Trademarks and Patents
Our trademarks and patents, which constitute our primary intellectual property, have been registered or are thesubject of pending applications in the United States Patent and Trademark Office and with the registries of manyforeign countries and/or are protected by common law. We believe our products are identified by our intellectualproperty and, thus, our intellectual property is of significant value. Accordingly, we intend to maintain ourintellectual property and related registrations and vigorously protect our intellectual property assets againstinfringement.
Segment Information
We have three reportable segments: Victoria’s Secret, Bath & Body Works and Victoria’s Secret and Bath &Body Works International. For additional information, including the financial results of our reportable segments,see Note 21 to the Consolidated Financial Statements included in Item 8. Financial Statements andSupplementary Data.
Other Information
For additional information about our business, including our net sales and profits for the last three years andselling square footage, see Item 7. Management’s Discussion and Analysis of Financial Condition and Results ofOperations.
Competition
The sale of women’s intimate and other apparel, personal care and beauty products and accessories through retailstores is a highly competitive business with numerous competitors, including individual and chain specialtystores, department stores and discount retailers. Brand image, marketing, design, price, service, assortment andquality are the principal competitive factors in retail store sales. Our online businesses compete with numerousonline merchandisers. Image presentation, fulfillment and the factors affecting retail store sales discussed aboveare the principal competitive factors in online sales.
Associate Relations
As of January 28, 2017, we employed approximately 93,600 associates; 69,000 of whom were part-time. Inaddition, temporary associates are hired during peak periods, such as the holiday season.
Executive Officers of Registrant
Set forth below is certain information regarding our executive officers.
Leslie H. Wexner, 79, has been our Chief Executive Officer since our founding in 1963 and Chairman of theBoard of Directors since 1975.
Stuart B. Burgdoerfer, 53, has been our Executive Vice President and Chief Financial Officer since April 2007.
Nicholas P. M. Coe, 54, has been our Chief Executive Officer and President of Bath & Body Works since August2011.
Charles C. McGuigan, 60, has been our Chief Operating Officer since May 2012 and our Chief Executive Officerand President of Mast Global since February 2011.
Martin P. Waters, 51, has been our Chief Executive Officer and President of L Brands International sinceNovember 2009.
5
Fo
rm10-K

Available Information
We are subject to the reporting requirements of the Exchange Act and its rules and regulations. The ExchangeAct requires us to file reports, proxy statements and other information with the U.S. Securities and ExchangeCommission (“SEC”). Copies of these reports, proxy statements and other information can be read and copied at:
SEC Public Reference Room100 F Street NEWashington, D.C. 20549
Information on the operation of the Public Reference Room may be obtained by calling the SEC at 1-800-SEC-0330.The SEC maintains a website that contains reports, proxy statements and other information regarding issuers that fileelectronically with the SEC. These materials may be obtained electronically by accessing the SEC’s website atwww.sec.gov. Our annual reports on Form 10-K, quarterly reports on Form 10-Q, current reports on Form 8-K andamendments to these reports filed or furnished pursuant to Section 13(a) or 15(d) of the Exchange Act are available,free of charge, on our website at www.lb.com.
Copies of any of the above-referenced documents will also be made available, free of charge, upon writtenrequest to:
L Brands, Inc.Investor Relations DepartmentThree Limited ParkwayColumbus, Ohio 43230
ITEM 1A.RISK FACTORS.
We caution that any forward-looking statements (as such term is defined in the Private Securities LitigationReform Act of 1995) contained in this report or made by our company or our management involve risks anduncertainties and are subject to change based on various factors, many of which are beyond our control.Accordingly, our future performance and financial results may differ materially from those expressed or impliedin any such forward-looking statements. Words such as “estimate,” “project,” “plan,” “believe,” “expect,”“anticipate,” “intend,” “planned,” “potential” and any similar expressions may identify forward-lookingstatements. Risks associated with the following factors, among others, in some cases have affected and in thefuture could affect our financial performance and actual results and could cause actual results to differ materiallyfrom those expressed or implied in any forward-looking statements included in this report or otherwise made byour company or our management:
• general economic conditions, consumer confidence, consumer spending patterns and market disruptionsincluding severe weather conditions, natural disasters, health hazards, terrorist activities, financial crises,political crises or other major events, or the prospect of these events;
• the seasonality of our business;
• the dependence on mall traffic and the availability of suitable store locations on appropriate terms;
• our ability to grow through new store openings and existing store remodels and expansions;
• our ability to successfully expand internationally and related risks;
• our independent franchise, license and wholesale partners;
• our direct channel businesses;
• our ability to protect our reputation and our brand images;
• our ability to attract customers with marketing, advertising and promotional programs;
6
• our ability to protect our trade names, trademarks and patents;
• the highly competitive nature of the retail industry and the segments in which we operate;
• consumer acceptance of our products and our ability to manage the life cycle of our brands, keep up withfashion trends, develop new merchandise and launch new product lines successfully;
• our ability to source, distribute and sell goods and materials on a global basis, including risks related to:
• political instability, significant health hazards, environmental hazards or natural disasters;
• duties, taxes and other charges;
• legal and regulatory matters;
• volatility in currency exchange rates;
• local business practices and political issues;
• potential delays or disruptions in shipping and transportation and related pricing impacts;
• disruption due to labor disputes; and
• changing expectations regarding product safety due to new legislation;
• our geographic concentration of supplier and distribution facilities in central Ohio;
• fluctuations in foreign currency exchange rates;
• stock price volatility;
• our ability to pay dividends and related effects;
• our ability to maintain our credit rating;
• our ability to service or refinance our debt;
• our ability to retain key personnel;
• our ability to attract, develop and retain qualified associates and manage labor-related costs;
• the ability of our manufacturers to deliver products in a timely manner, meet quality standards and complywith applicable laws and regulations;
• fluctuations in product input costs;
• our ability to adequately protect our assets from loss and theft;
• fluctuations in energy costs;
• increases in the costs of mailing, paper and printing;
• claims arising from our self-insurance;
• our ability to implement and maintain information technology systems and to protect associated data;
• our ability to maintain the security of customer, associate, supplier or company information;
• our ability to comply with regulatory requirements;
• legal and compliance matters; and
• tax, trade and other regulatory matters.
We are not under any obligation and do not intend to make publicly available any update or other revisions toany of the forward-looking statements contained in this report to reflect circumstances existing after the date ofthis report or to reflect the occurrence of future events even if experience or future events make it clear that anyexpected results expressed or implied by those forward-looking statements will not be realized.
7
Fo
rm10-K

The following discussion of risk factors contains “forward-looking statements.” These risk factors may beimportant to understanding any statement in this Form 10-K, other filings or in any other discussions of ourbusiness. The following information should be read in conjunction with Item 7. Management’s Discussion andAnalysis of Financial Condition and Results of Operation and Item 8. Financial Statements and SupplementaryData.
In addition to the other information set forth in this report, the reader should carefully consider the followingfactors which could materially affect our business, financial condition or future results. The risks describedbelow are not our only risks. Additional risks and uncertainties not currently known or that are currently deemedto be immaterial may also adversely affect our business, operating results and/or financial condition in a materialway.
Our net sales, profit results and cash flows are sensitive to, and may be affected by, general economicconditions, consumer confidence, spending patterns, weather or other market disruptions.
Our net sales, profit, cash flows and future growth may be affected by negative local, regional, national orinternational political or economic trends or developments that reduce the consumers’ ability or willingness tospend, including the effects of national and international security concerns such as war, terrorism or the threatthereof. In addition, market disruptions due to severe weather conditions, natural disasters, health hazards orother major events or the prospect of these events could also impact consumer spending and confidence levels.Purchases of women’s intimate and other apparel, beauty and personal care products and accessories oftendecline during periods when economic or market conditions are unsettled or weak. In such circumstances, wemay increase the number of promotional sales, which could have a material adverse effect on our results ofoperations, financial condition and cash flows.
The decision by the U.K. to leave the European Union (“Brexit”) has increased the uncertainty in the economicand political environment in Europe. In particular, our business in the United Kingdom may be adverselyimpacted by fluctuations in currency exchange rates, changes in trade policies, or changes in labor, immigration,tax or other laws.
Extreme weather conditions in the areas in which our stores are located, particularly in markets where we havemultiple stores, could adversely affect our business. For example, heavy snowfall, rainfall or other extremeweather conditions over a prolonged period might make it difficult for our customers to travel to our stores andthereby reduce our sales and profitability.
Our net sales, operating income, cash and inventory levels fluctuate on a seasonal basis.
We experience major seasonal fluctuations in our net sales and operating income, with a significant portion ofour operating income typically realized during the fourth quarter holiday season. Any decrease in sales ormargins during this period could have a material adverse effect on our results of operations, financial conditionand cash flows.
Seasonal fluctuations also affect our cash and inventory levels, since we usually order merchandise in advance ofpeak selling periods and sometimes before new fashion trends are confirmed by customer purchases. We mustcarry a significant amount of inventory, especially before the holiday season selling period. If we are notsuccessful in selling inventory, we may have to sell the inventory at significantly reduced prices or may not beable to sell the inventory at all, which could have a material adverse effect on our results of operations, financialcondition and cash flows.
Our net sales depend on a volume of traffic to our stores and the availability of suitable lease space.
Most of our stores are located in retail shopping areas including malls and other types of retail centers. Sales atthese stores are derived, in part, from the volume of traffic in those retail areas. Our stores benefit from theability of the retail center and other attractions in an area, including “destination” retail stores, to generate
8

consumer traffic in the vicinity of our stores. Sales volume and retail traffic may be adversely affected by factorsthat we cannot control, such as economic downturns or changes in consumer demographics in a particular area,competition from internet and other retailers and other retail areas where we do not have stores, the closing ordecline in popularity of other stores in the shopping areas where our stores are located and the deterioration in thefinancial condition of the operators of the shopping areas or developers in which our stores are located.
Part of our future growth is significantly dependent on our ability to operate stores in desirable locations withcapital investment and lease costs providing the opportunity to earn a reasonable return. We cannot be sure as towhen or whether such desirable locations will become available at reasonable costs. Some of our store locations,such as our Victoria’s Secret flagship stores, require significant upfront capital investment and have materiallease commitments. Additionally, we are dependent upon the suitability of the lease spaces that we currently use.The leases that we enter into are generally noncancellable leases with initial terms of ten years. If we determinethat it is no longer economical to operate a store and decide to close it, we may remain obligated under theapplicable lease for, among other things, payment of the base rent for the balance of the lease term.
These risks could have a material adverse effect on our ability to grow and our results of operations, financialcondition and cash flows.
Our ability to grow depends in part on new store openings and existing store remodels and expansions.
Our continued growth and success will depend in part on our ability to open and operate new stores and expandand remodel existing stores on a timely and profitable basis. Accomplishing our new and existing storeexpansion goals will depend upon a number of factors, including the ability to partner with developers andlandlords to obtain suitable sites for new and expanded stores at acceptable costs, the hiring and training ofqualified personnel and the integration of new stores into existing operations. There can be no assurance we willbe able to achieve our store expansion goals, manage our growth effectively, successfully integrate the plannednew stores into our operations or operate our new, remodeled and expanded stores profitably. These risks couldhave a material adverse effect on our ability to grow and results of operations, financial condition and cash flows.
Our plans for international expansion include risks that could impact our results and reputation.
We intend to further expand into international markets, including mainland China and other internationalmarkets, through partner arrangements and/or company-owned stores. The risks associated with our expansioninto international markets include difficulties in attracting customers due to a lack of customer familiarity withour brands, our lack of familiarity with local customer preferences and seasonal differences in the market.Further, entry into other markets may bring us into competition with new competitors or with existingcompetitors with an established market presence. Other risks include general economic conditions in specificcountries or markets, volatility in the geopolitical landscape, restrictions on the repatriation of funds heldinternationally, disruptions or delays in shipments, changes in diplomatic and trade relationships, politicalinstability and foreign governmental regulation. Such expansions will also have upfront investment costs thatmay not be accompanied by sufficient revenues to achieve typical or expected operational and financialperformance.
We also have risks related to identifying suitable partners. In addition, certain aspects of these arrangements arenot directly within our control, such as the ability of these third parties to meet their projections regarding storeopenings and sales and their compliance with federal and local law. We cannot ensure the profitability or successof our expansion into international markets.
Further, our results of operations and financial condition may be adversely affected by fluctuations in currencyexchange rates. See “Fluctuations in foreign currency exchange rates could adversely impact our financialcondition and results of operations” below.
These risks could have a material adverse effect on our results of operations, financial condition and cash flows.
9
Fo
rm10-K

Our licensees, franchisees and wholesalers could take actions that could harm our business or brandimages.
We have global representation through independently owned stores operated by our partners. Although we havecriteria to evaluate and select prospective partners, the level of control we can exercise over our partners islimited, and the quality and success of their operations may be diminished by any number of factors beyond ourcontrol. For example, our partners may not have the business acumen or financial resources necessary tosuccessfully operate stores in a manner consistent with our standards and may not hire and train qualified storemanagers and other personnel. Our brand image and reputation may suffer materially, and our sales could declineif our partners do not operate successfully. These risks could have an adverse effect on our results of operations,financial condition and cash flows.
Our direct channel businesses include risks that could have an effect on our results.
Our direct operations are subject to numerous risks that could have a material adverse effect on our results. Risksinclude, but are not limited to, the difficulty in recreating the in-store experience through our directchannels; domestic or international resellers purchasing merchandise and reselling it outside our control; ourability to anticipate and implement innovations in technology and logistics in order to appeal to existing andpotential customers who increasingly rely on multiple channels to meet their shopping needs; the failure of andrisks related to the systems that operate our web infrastructure, websites and the related support systems,including computer viruses, theft of customer information, privacy concerns, telecommunication failures andelectronic break-ins and similar disruptions; and risks related to the fulfillment of direct-to-consumer orders suchas not adequately predicting customer demand.
Our failure to maintain efficient and uninterrupted order-taking and fulfillment operations could also have amaterial adverse effect on our results. The satisfaction of our online customers depends on their timely receipt ofmerchandise. If we encounter difficulties with the distribution facilities, or if the facilities were to shut down forany reason, including as a result of fire or other natural disaster or work stoppage, we could face shortages ofinventory; incur significantly higher costs and longer lead times associated with distributing our products to ourcustomers; and cause customer dissatisfaction.
Any of these issues could have a material adverse effect on our operations, financial condition and cash flows.
Our ability to protect our reputation could have a material effect on our brand images.
Our ability to maintain our reputation is critical to our brand images. Our reputation could be jeopardized if wefail to maintain high standards for merchandise quality and integrity. Any negative publicity, includinginformation publicized through traditional or social media platforms and similar venues such as blogs, websitesand other forums, may affect our reputation and brand and, consequently, reduce demand for our merchandise,even if such publicity is unverified or inaccurate.
Failure to comply with ethical, social, product, labor and environmental standards, or related politicalconsiderations, could also jeopardize our reputation and potentially lead to various adverse consumer actions,including boycotts. Failure to comply with local laws and regulations, to maintain an effective system of internalcontrols, to maintain the security of customer, associate, supplier or company information or to provide accurateand timely financial statement information could also hurt our reputation. Damage to our reputation or loss ofconsumer confidence for any of these or other reasons could have a material adverse effect on our results ofoperations, financial condition and cash flows, as well as require additional resources to rebuild our reputation.
If our marketing, advertising and promotional programs are unsuccessful, or if our competitors are moreeffective with their programs than we are, our revenue or results of operations may be adversely affected.
Customer traffic and demand for our merchandise is influenced by our advertising, marketing and promotionalactivities, the name recognition and reputation of our brands and the location of and service offered in our stores.
10

Although we use marketing, advertising and promotional programs to attract customers through various mediaincluding television, social media, database marketing and print, some of our competitors may expend more fortheir programs than we do, or use different approaches than we do, which may provide them with a competitiveadvantage. Our programs may not be effective or could require increased expenditures, which could have amaterial adverse effect on our revenue and results of operations.
Our ability to adequately protect our trade names, trademarks and patents could have an impact on ourbrand images and ability to penetrate new markets.
We believe that our trade names, trademarks and patents are important assets and an essential element of ourstrategy. We have obtained or applied for federal registration of these trade names, trademarks and patents and haveapplied for or obtained registrations in many foreign countries. There can be no assurance that we will obtain suchregistrations or that the registrations we obtain will prevent the imitation of our products or infringement of ourintellectual property rights by others. In particular, the laws of certain foreign countries may not protect proprietaryrights to the same extent as the laws of the U.S. If any third party copies our products or our stores in a manner thatprojects lesser quality or carries a negative connotation, it could have a material adverse effect on our brand imageand reputation as well as our results of operations, financial condition and cash flows.
Our ability to compete favorably in our highly competitive segment of the retail industry could impact ourresults.
The sale of women’s intimate and other apparel, personal care products and accessories is highly competitive.We compete for sales with a broad range of other retailers, including individual and chain specialty stores,department stores and discount retailers. In addition to the traditional store-based retailers, we also compete withdirect marketers or retailers that sell similar lines of merchandise and who target customers through onlinechannels. Brand image, marketing, design, price, service, assortment, quality, image presentation and fulfillmentare all competitive factors in both the store-based and online channels.
Some of our competitors may have greater financial, marketing and other resources available. In many cases, ourcompetitors sell their products in stores that are located in the same shopping malls and centers as our stores. Inaddition to competing for sales, we compete for favorable site locations and lease terms in shopping malls andcenters.
Increased competition could result in price reductions, increased marketing expenditures and loss of marketshare, any of which could have a material adverse effect on our results of operations, financial condition and cashflows.
Our ability to manage the life cycle of our brands and to remain current with fashion trends and launchnew product lines successfully could impact the image and relevance of our brands.
Our success depends in part on management’s ability to effectively manage the life cycle of our brands and toanticipate and respond to changing fashion preferences and consumer demands and to translate market trendsinto appropriate, saleable product offerings in advance of the actual time of sale to the customer. Customerdemands and fashion trends change rapidly. If we are unable to successfully anticipate, identify or react tochanging styles or trends or we misjudge the market for our products or any new product lines, our sales will belower, potentially resulting in significant amounts of unsold finished goods inventory. In response, we may beforced to increase our marketing promotions or price markdowns. These risks could have a material adverseeffect on our brand image and reputation as well as our results of operations, financial condition and cash flows.
We may be impacted by our ability to adequately source, distribute and sell merchandise and othermaterials on a global basis.
We source merchandise and other materials directly in international markets and in our domestic market. Wedistribute merchandise and other materials globally to our partners in international locations and to our stores.
11
Fo
rm10-K

Many of our imports and exports are subject to a variety of customs regulations and international tradearrangements, including existing or potential duties, tariffs or safeguard quotas. We compete with othercompanies for production facilities.
We also face a variety of other risks generally associated with doing business on a global basis. For example:
• political instability, significant health hazards, environmental hazards or natural disasters which couldnegatively affect international economies, financial markets and business activity;
• imposition of new or retaliatory trade duties, sanctions or taxes and other charges on imports or exports;
• evolving, new or complex legal and regulatory matters;
• volatility in currency exchange rates;
• local business practice and political issues (including issues relating to compliance with domestic orinternational labor standards) which may result in adverse publicity or threatened or actual adverseconsumer actions, including boycotts;
• potential delays or disruptions in shipping and transportation and related pricing impacts;
• disruption due to labor disputes; and
• changing expectations regarding product safety due to new legislation or other factors.
We also rely upon third-party transportation providers for substantially all of our product shipments, includingshipments to and from our distribution centers, to our stores and to our customers. Our utilization of thesedelivery services for shipments is subject to risks, including increases in fuel prices, which would increase ourshipping costs, and associate strikes and inclement weather, which may impact our transportation providers’ability to provide delivery services that adequately meet our shipping needs.
Our future performance will depend upon these and the other factors listed above which are beyond our controland could have a material adverse effect on our results of operations, financial condition and cash flows.
We rely on a number of supplier and distribution facilities located in the same vicinity, making ourbusiness susceptible to local and regional disruptions or adverse conditions.
To achieve the necessary speed and agility in producing our beauty, personal care and home fragrance products,we rely heavily on supplier and distribution facilities in close proximity to our headquarters in central Ohio. As aresult of geographic concentration of the supplier and distribution facilities that we rely upon, our operations aresusceptible to local and regional factors, such as accidents, system failures, economic and weather conditions,natural disasters, demographic and population changes, and other unforeseen events and circumstances. Anysignificant interruption in the operations of these facilities could lead to inventory issues or increased costs,which could have a material adverse effect on our results of operations, financial condition and cash flows.
Fluctuations in foreign currency exchange rates could impact our financial condition and results ofoperations.
We are exposed to foreign currency exchange rate risk with respect to our sales, profits, assets and liabilitiesdenominated in currencies other than the U.S. dollar. In addition, our royalty arrangements are calculated basedon sales in local currency and, as such, we are exposed to foreign currency exchange rate fluctuations. Althoughwe use foreign currency forward contracts to hedge certain foreign currency risks, these measures may notsucceed in offsetting all of the short-term negative impact of foreign currency rate movements on our businessand results of operations. Hedging would generally not be effective in offsetting the long-term impact ofsustained shifts in foreign exchange rates on our business results. As a result, the fluctuation in the value of theU.S. dollar against other currencies could have a material adverse effect on our results of operations, financialcondition and cash flows.
12

Our stock price may be volatile.
Our stock price may fluctuate substantially as a result of variations in our actual or projected performance or thefinancial performance of other companies in the retail industry. Any guidance that we provide is based on goalsthat we believe are reasonably attainable at the time guidance is given. If, or when, we announce actual resultsthat differ from those that have been predicted by us, outside investment analysts or others, our stock price couldbe adversely affected. Investors who rely on these predictions when making investment decisions with respect toour securities do so at their own risk.
In addition, the stock market may experience price and volume fluctuations that are unrelated or disproportionateto operating performance.
If we are unable to pay quarterly dividends at intended levels, our reputation and stock price may beharmed.
Our dividend program requires the use of a portion of our cash flow. Our ability to pay dividends will depend onour ability to generate sufficient cash flows from operations in the future. This ability may be subject to certaineconomic, financial, competitive and other factors that are beyond our control. Our Board of Directors may, at itsdiscretion, decrease the level of dividends or entirely discontinue the payment of dividends at any time. Anyfailure to pay dividends after we have announced our intention to do so may negatively impact our reputation,investor confidence in us and our stock price.
Our ability to maintain our credit rating could affect our ability to access capital and could increase ourinterest expense.
The credit rating agencies periodically review our capital structure and the quality and stability of our earnings. Adeterioration in our capital structure or the quality and stability of our earnings could result in a downgrade of ourcredit rating. Any negative ratings actions could constrain the capital available to our company or our industryand could limit our access to funding for our operations. We are dependent upon our ability to access capital atrates and on terms we determine to be attractive. If our ability to access capital becomes constrained, our interestcosts will likely increase, which could have a material adverse effect on our results of operations, financialcondition and cash flows. Additionally, changes to our credit rating could affect our future interest costs.
We may be impacted by our ability to service or refinance our debt.
We currently have substantial indebtedness. Some of our debt agreements contain covenants which requiremaintenance of certain financial ratios and also, under certain conditions, restrict our ability to pay dividends,repurchase common shares and make other restricted payments as defined in those agreements. Our cash flowfrom operations provides the primary source of funds for our debt service payments. If our cash flow fromoperations declines, we may be unable to service or refinance our current debt.
We may be impacted by our ability to recruit, train and retain key personnel.
We believe we have benefited substantially from the leadership and experience of our senior executives,including Leslie H. Wexner, Chairman of the Board of Directors and Chief Executive Officer. The loss of theservices of any of these individuals could have a material adverse effect on our business. Competition for keypersonnel in the retail industry is intense, and our future success will also depend on our ability to recruit, trainand retain other qualified key personnel.
We may be impacted by our ability to attract, develop and retain qualified associates and manage labor-related costs.
We believe our competitive advantage is providing a positive, engaging and satisfying experience for eachindividual customer, which requires us to have highly trained and engaged associates. Our success depends in
13
Fo
rm10-K

part upon our ability to attract, develop and retain a sufficient number of qualified associates, including storepersonnel and talented merchants. The turnover rate in the retail industry is generally high, and qualifiedindividuals of the requisite caliber and number needed to fill these positions may be in short supply in someareas. Competition for such qualified individuals or changes in labor and healthcare laws could require us toincur higher labor costs. Our inability to recruit a sufficient number of qualified individuals in the future maydelay planned openings of new stores or affect the speed with which we expand. Delayed store openings,significant increases in associate turnover rates or significant increases in labor-related costs could have amaterial adverse effect on our results of operations, financial condition and cash flows.
We may be impacted by our manufacturers’ ability to manufacture and deliver products in a timelymanner, meet quality standards and comply with applicable laws and regulations.
We purchase products from third-party manufacturers. Factors outside our control, such as manufacturing orshipping delays or quality problems, could disrupt merchandise deliveries and result in lost sales, cancellationcharges or excessive markdowns.
In addition, quality problems could result in a product liability judgment or a widespread product recall that maynegatively impact our sales and profitability for a period of time depending on product availability, competitionreaction and consumer attitudes. Even if the product liability claim is unsuccessful or is not fully pursued, thenegative publicity surrounding any assertions could adversely impact our reputation with existing and potentialcustomers and our brand image.
Our business could also suffer if our third-party manufacturers fail to comply with applicable laws andregulations. While our internal and vendor operating guidelines promote ethical business practices and ourassociates periodically visit and monitor the operations of our third-party manufacturers, we do not control thesemanufacturers or their practices. The violation of labor, environmental or other laws by a third-partymanufacturer used by us, or the divergence of a third-party manufacturer’s or partner’s labor or environmentalpractices from those generally accepted as ethical or appropriate, could interrupt or otherwise disrupt theshipment of finished products to us or damage our reputation.
These risks could have a material adverse effect on our results of operations, financial condition and cash flows.
Our results may be affected by fluctuations in product input costs.
Product input costs, including manufacturing, freight, labor and raw materials, fluctuate. These fluctuations mayresult in an increase in our production costs. We may not be able to, or may elect not to, pass these increases onto our customers which may adversely impact our profit margins. These risks could have a material adverseeffect on our results of operations, financial condition and cash flows.
Our ability to adequately protect our assets from loss and theft.
Our assets are subject to loss, including those caused by illegal or unethical conduct by associates, customers,vendors or unaffiliated third parties. We have experienced events such as inventory shrinkage in the past, and wecannot assure that incidences of loss and theft will decrease in the future or that the measures we are taking willeffectively reduce these losses. Higher rates of loss or increased security costs to combat theft could have amaterial adverse effect on our results of operations, financial condition and cash flows.
Our results may be affected by fluctuations in energy costs.
Energy costs have fluctuated dramatically in the past. These fluctuations may result in an increase in ourtransportation costs for distribution, utility costs for our retail stores and costs to purchase products from ourmanufacturers. A continual rise in energy costs could adversely affect consumer spending and demand for ourproducts and increase our operating costs, both of which could have a material adverse effect on our results ofoperations, financial condition and cash flows.
14

We may be impacted by increases in costs of mailing, paper and printing.
Postal rate increases and paper and printing costs will affect the cost of our order fulfillment and promotionalmailings. We rely on discounts from the basic postal rate structure, such as discounts for bulk mailings andsorting. Future paper and postal rate increases could adversely impact our earnings if we are unable to recoverthese costs or if we are unable to implement more efficient printing, mailing, delivery and order fulfillmentsystems. These risks could have a material adverse effect on our results of operations, financial condition andcash flows.
We self-insure certain risks and may be impacted by unfavorable claims experience.
We are self-insured for various types of insurable risks including associate medical benefits, workers’compensation, property, general liability and automobile up to certain stop-loss limits. Claims are difficult topredict and may be volatile. Any adverse claims experience could have a material adverse effect on our results ofoperations, financial condition and cash flows.
We significantly rely on our ability to implement and sustain information technology systems and toprotect associated data.
Our success depends, in part, on the secure and uninterrupted performance of our information technologysystems. Our information technology systems, as well as those of our service providers, are vulnerable to damagefrom a variety of sources, including telecommunication failures, malicious human acts and natural disasters.Moreover, despite network security measures, some of our servers and those of our service providers arepotentially vulnerable to physical or electronic break-ins, computer viruses and similar disruptive problems.Additionally, these types of problems could result in a breach of confidential customer, merchandise, financial orother important information which could result in damage to our reputation and/or litigation. The increased useof smartphones, tablets and other mobile devices may also heighten these and other operational risks. Despite theprecautions we have taken, unanticipated problems may nevertheless cause failures in our informationtechnology systems. Sustained or repeated system disruptions that interrupt our ability to process orders anddeliver products to the stores, impact our consumers’ ability to access our websites in a timely manner or exposeconfidential customer, merchandise, financial or other important information could have a material adverse effecton our results of operations, financial condition and cash flows.
In addition, from time to time, we make modifications and upgrades to the information technology systems forpoint-of-sale, e-commerce, merchandising, planning, sourcing, logistics, inventory management and supportsystems including human resources and finance. Modifications involve replacing legacy systems with successorsystems, making changes to legacy systems or acquiring new systems with new functionality. We are aware ofinherent risks associated with replacing these systems, including not accurately capturing data and systemdisruptions. Information technology system disruptions, if not anticipated and appropriately mitigated, couldhave a material adverse effect on our operations, financial condition and cash flows.
Our ability to maintain the security of customer, associate, supplier or company information could have animpact on our reputation and our results.
Information systems are susceptible to an increasing threat of continually evolving cybersecurity risks. Anysignificant compromise or breach of our data security could significantly damage our reputation with ourcustomers, associates, investors and other third parties; cause the disclosure of confidential customer, associate,supplier or company information; cause our customers to stop shopping with us; and result in significant legal,regulatory and financial liabilities and lost revenues. While we have implemented systems and processes toprotect against unauthorized access to our information systems and prevent data loss, there is no guarantee thatthese procedures are adequate to safeguard against all data security breaches. In addition to our own networksand databases, we use third-party service providers to store, process and transmit certain of this information onour behalf. Although we contractually require these service providers to implement and use reasonable securitymeasures, we cannot control third parties and cannot guarantee that a security breach will not occur in their
15
Fo
rm10-K

systems. We have confidential security measures in place to protect our physical facilities and informationtechnology systems from attacks. Despite these measures, we may be vulnerable to targeted or random securitybreaches, acts of vandalism, computer viruses, misplaced or lost data, programming and/or human errors orsimilar events.
The regulatory environment related to information security, data collection and privacy is increasingly rigorous,with new and constantly changing requirements applicable to our business, and compliance with thoserequirements could result in additional costs, such as costs related to organizational changes, implementingadditional protection technologies, training associates and engaging consultants. Additionally, we could incurlost revenues and face increased litigation as a result of any potential cybersecurity breach.
These risks could have a material adverse effect on our results of operations, financial condition and cash flows.
We may be impacted by our ability to comply with regulatory requirements.
We are subject to numerous regulatory requirements. Our policies, procedures and internal controls are designedto comply with all applicable foreign and domestic laws and regulations, including those required by theSarbanes-Oxley Act of 2002, the U.S. Foreign Corrupt Practices Act, the U.K. Bribery Act, the SEC and the NewYork Stock Exchange (the “NYSE”), among others. Although we have put in place policies and proceduresaimed at ensuring legal and regulatory compliance, our associates, subcontractors, vendors, licensees, franchiseesand suppliers could take actions that violate these laws and regulations. Any violations of such laws orregulations could have an adverse effect on our reputation, market price of our common stock, results ofoperations, financial condition and cash flows.
It can be difficult to comply with sometimes conflicting regulations in local, national or foreign jurisdictions aswell as new or changing regulations. Also, changes in such laws could make operating our business moreexpensive or require us to change the way we do business. For example, changes in product safety or otherconsumer protection laws could lead to increased costs for certain merchandise, or additional labor costsassociated with readying merchandise for sale. It may be difficult for us to oversee regulatory changes impactingour business and our responses to changes in the law could be costly and may negatively impact our operations.
We may be adversely impacted by certain compliance or legal matters.
We, along with third parties we do business with, are subject to complex compliance and litigation risks. Actionsfiled against us from time to time include commercial, tort, intellectual property, customer, employment, wageand hour, data privacy, securities, anti-corruption and other claims, including purported class action lawsuits. Thecost of defending against these types of claims against us or the ultimate resolution of such claims, whether bysettlement or adverse court decision, may harm our business. Further, potential claimants may be encouraged tobring suits based on a settlement from us or adverse court decisions against us. We cannot currently assess thelikely outcome of such suits, but if the outcome were negative, it could have a material adverse effect on ourreputation, results of operations, financial condition and cash flows.
In addition, we may be impacted by litigation trends, including class action lawsuits involving consumers andshareholders, that could have a material adverse effect on our reputation, market price of our common stock,results of operations, financial condition and cash flows.
We may be impacted by changes in taxation, trade and other regulatory requirements.
We are subject to income tax in local, national and international jurisdictions. In addition, our products aresubject to import and excise duties and/or sales or value-added taxes in many jurisdictions. We are also subject tothe examination of our tax returns and other tax matters by the Internal Revenue Service and other tax authoritiesand governmental bodies. We regularly assess the likelihood of an adverse outcome resulting from these
16

examinations to determine the adequacy of our provision for taxes. There can be no assurance as to the outcomeof these examinations. Fluctuations in tax rates and duties, changes in tax legislation or regulation or adverseoutcomes of these examinations could have a material adverse effect on our results of operations, financialcondition and cash flows.
There is increased uncertainty with respect to tax policy and trade relations between the U.S. and other countries.Major developments in tax policy or trade relations, such as the disallowance of tax deductions for importedmerchandise or the imposition of unilateral tariffs on imported products, could have a material adverse effect onour results of operations, financial condition and cash flows.
ITEM 1B. UNRESOLVED STAFF COMMENTS.
None.
ITEM 2. PROPERTIES.
The following table provides the location, use and size of our distribution, corporate and product developmentfacilities as of January 28, 2017:
Location Use
ApproximateSquareFootage
Columbus, Ohio area . . . . . . . . . . . . . . . . . Corporate, distribution and shipping 6,938,000New York . . . . . . . . . . . . . . . . . . . . . . . . . . Office, sourcing and product development/design 580,000Kettering, Ohio . . . . . . . . . . . . . . . . . . . . . . Call center 94,000Montreal, Quebec, Canada . . . . . . . . . . . . . Office 60,000Hong Kong . . . . . . . . . . . . . . . . . . . . . . . . . Office and sourcing 60,000Mainland China . . . . . . . . . . . . . . . . . . . . . . Office 27,000Various international locations . . . . . . . . . . Office and sourcing 128,000
United States
Our business for the Victoria’s Secret, Bath & Body Works and Victoria’s Secret and Bath & Body WorksInternational segments is principally conducted from office, distribution and shipping facilities located in theColumbus, Ohio area. Additional facilities are located in New York, New York and Kettering, Ohio.
Our distribution and shipping facilities consist of eight buildings located in the Columbus, Ohio area. Thesebuildings, including attached office space, comprise approximately 6.9 million square feet.
As of January 28, 2017, we operate 2,755 retail stores located in leased facilities, primarily in malls and shoppingcenters, throughout the U.S. A substantial portion of these lease commitments consists of store leases generallywith an initial term of 10 years. The store leases expire at various dates between 2017 and 2031.
Typically, when space is leased for a retail store in a mall or shopping center, we supply all improvements,including interior walls, floors, ceilings, fixtures and decorations. The cost of improvements varies widely,depending on the design, size and location of the store. In certain cases, the landlord of the property may providean allowance to fund all or a portion of the cost of improvements, serving as a lease incentive. Rental terms fornew locations usually include a fixed minimum rent plus a percentage of sales in excess of a specified amount.We usually pay certain operating costs such as common area maintenance, utilities, insurance and taxes. Foradditional information, see Note 16 to the Consolidated Financial Statements included in Item 8. FinancialStatements and Supplementary Data.
17
Fo
rm10-K

International
Canada
We lease an office in the Montreal, Quebec area.
As of January 28, 2017, we operate 270 retail stores located in leased facilities, primarily in malls and shoppingcenters, throughout the Canadian provinces. A substantial portion of these lease commitments consists of storeleases generally with an initial term of 5 years. The store leases expire on various dates between 2017 and 2030.
United Kingdom
As of January 28, 2017, we operate 18 retail stores in leased facilities in the U.K. These lease commitmentsconsist of store leases with initial terms ranging from 10 to 35 years expiring on various dates between 2021 and2045.
Greater China
We lease offices in Shanghai, Shenzhen and Hong Kong within Greater China.
As of January 28, 2017, we operate 31 retail stores in leased facilities in the Greater China area. These leasecommitments consist of store leases with initial terms ranging from 3 to 5 years expiring on various datesbetween 2017 and 2021.
Other International
As of January 28, 2017, we also have global representation through stores operated by our partners:
• 391 Victoria’s Secret Beauty and Accessories stores in more than 70 countries;
• 203 La Senza stores in 24 countries;
• 159 Bath & Body Works stores in 30 countries;
• 23 Victoria’s Secret stores in 12 countries; and
• 5 PINK stores in 3 countries.
We also operate sourcing-related office facilities in various international locations.
ITEM 3. LEGAL PROCEEDINGS.
We are a defendant in a variety of lawsuits arising in the ordinary course of business. Actions filed against ourCompany from time to time include commercial, tort, intellectual property, customer, employment, data privacy,securities and other claims, including purported class action lawsuits. Although it is not possible to predict withcertainty the eventual outcome of any litigation, in the opinion of management, our current legal proceedings arenot expected to have a material adverse effect on our results of operations, financial condition and cash flows.
ITEM 4. MINE SAFETY DISCLOSURES.
Not applicable.
18

PART II
ITEM 5. MARKET FOR REGISTRANT’S COMMON EQUITY, RELATED STOCKHOLDERMATTERS AND ISSUER PURCHASES OF EQUITY SECURITIES.
Our common stock (“LB”) is traded on the NYSE. As of January 28, 2017, there were approximately 36,000shareholders of record. However, including active associates who participate in our stock purchase plan,associates who own shares through our sponsored retirement plans and others holding shares in broker accountsunder street names, we estimate the shareholder base to be approximately 198,000.
The following table provides our quarterly market prices and cash dividends per share for 2016 and 2015:
Market Price Cash Dividendper ShareHigh Low
2016Fourth quarter . . . . . . . . . . . . . . . . . . . . . . . . . . . . . . . . . . . . . . . . . . . . . . . . . . . $ 75.50 $58.75 $0.60Third quarter . . . . . . . . . . . . . . . . . . . . . . . . . . . . . . . . . . . . . . . . . . . . . . . . . . . . 79.67 69.33 0.60Second quarter . . . . . . . . . . . . . . . . . . . . . . . . . . . . . . . . . . . . . . . . . . . . . . . . . . . 80.20 60.00 0.60First quarter . . . . . . . . . . . . . . . . . . . . . . . . . . . . . . . . . . . . . . . . . . . . . . . . . . . . . 97.35 75.91 2.60(a)
2015Fourth quarter . . . . . . . . . . . . . . . . . . . . . . . . . . . . . . . . . . . . . . . . . . . . . . . . . . . $101.11 $88.66 $0.50Third quarter . . . . . . . . . . . . . . . . . . . . . . . . . . . . . . . . . . . . . . . . . . . . . . . . . . . . 97.93 75.11 0.50Second quarter . . . . . . . . . . . . . . . . . . . . . . . . . . . . . . . . . . . . . . . . . . . . . . . . . . . 92.13 80.42 0.50First quarter . . . . . . . . . . . . . . . . . . . . . . . . . . . . . . . . . . . . . . . . . . . . . . . . . . . . . 95.78 82.38 2.50(b)
(a) In February 2016, our Board of Directors declared an increase in our quarterly common stock dividend from$0.50 to $0.60 per share and a special dividend of $2 per share. Both dividends were distributed on March 4,2016 to shareholders of record at the close of business on February 19, 2016.
(b) In February 2015, our Board of Directors declared an increase in our quarterly common stock dividend from$0.34 to $0.50 per share and a special dividend of $2 per share. Both dividends were distributed on March 6,2015 to shareholders of record at the close of business on February 20, 2015.
In February 2017, our Board of Directors declared our first quarter of 2017 common stock dividend of $0.60 pershare. This dividend was distributed on March 3, 2017 to shareholders of record at the close of business onFebruary 17, 2017.
19
Fo
rm10-K

The following graph shows the changes, over the past five-year period, in the value of $100 invested in ourcommon stock, the Standard & Poor’s 500 Composite Stock Price Index and the Standard & Poor’s 500 RetailComposite Index.
COMPARISON OF FIVE YEAR CUMULATIVE TOTAL RETURN (a) (b) (c) (d) (e)AMONG L BRANDS, INC., THE S&P 500 INDEX AND THE S&P RETAIL COMPOSITE INDEX
Comparison of Cumulative Five Year Total Return
01/28/171/30/161/31/151/28/12 2/01/142/02/13
100
150
50
350
300
200
250DOLLARS
L Brands, Inc. S&P 500 RetailingS&P 500 Index
(a) This table represents $100 invested in stock or in index at the closing price on January 28, 2012, including reinvestment of dividends.(b) The January 28, 2017 cumulative total return includes the $2 special dividend in March 2016.(c) The January 30, 2016 cumulative total return includes the $2 special dividend in March 2015.(d) The January 31, 2015 cumulative total return includes the $1 special dividend in March 2014.(e) The February 2, 2013 cumulative total return includes the $1 and $3 special dividends in September 2012 and December 2012,
respectively.
The following table provides our repurchases of our common stock during the fourth quarter of 2016:
Period
TotalNumber of Shares
Purchased (a)
Average PricePaid per Share
(b)
Total Numberof Shares
Purchased asPart of Publicly
AnnouncedPrograms (c)
MaximumDollar Value of Shares
that MayYet be Purchased
Under the Programs (c)
(in thousands) (in thousands)November 2016 . . . . . . . . . . . . . . . . . . . . . . . . 178 $66.67 165 $79,139December 2016 . . . . . . . . . . . . . . . . . . . . . . . . 21 69.90 14 78,146January 2017 . . . . . . . . . . . . . . . . . . . . . . . . . . 273 61.16 270 61,636
Total . . . . . . . . . . . . . . . . . . . . . . . . . . . . . . . . . 472 63.63 449
(a) The total number of shares repurchased includes shares repurchased as part of publicly announced programs, with the remainder relatingto shares repurchased in connection with tax payments due upon vesting of employee restricted stock awards and the use of our stock topay the exercise price on employee stock options.
(b) The average price paid per share includes any broker commissions.(c) For additional share repurchase program information, see Note 19 to the Consolidated Financial Statements included in Item 8. Financial
Statements and Supplementary Data.
20

ITEM 6. SELECTED FINANCIAL DATA.
Fiscal Year Ended
January 28,2017
January 30,2016
January 31,2015
February 1,2014
February 2,2013(a)
(in millions)
Summary of Operations
Net Sales . . . . . . . . . . . . . . . . . . . . . . . . . . . . . . . . . $12,574 $12,154 $11,454 $10,773 $10,459Gross Profit . . . . . . . . . . . . . . . . . . . . . . . . . . . . . . . 5,125 5,204 4,808 4,429 4,386Operating Income (b) . . . . . . . . . . . . . . . . . . . . . . . 2,003 2,192 1,953 1,743 1,573Net Income (c) . . . . . . . . . . . . . . . . . . . . . . . . . . . . 1,158 1,253 1,042 903 753
(as a percentage of net sales)
Gross Profit . . . . . . . . . . . . . . . . . . . . . . . . . . . . . . . 40.8% 42.8% 42.0% 41.1% 41.9%Operating Income . . . . . . . . . . . . . . . . . . . . . . . . . . 15.9% 18.0% 17.1% 16.2% 15.0%Net Income . . . . . . . . . . . . . . . . . . . . . . . . . . . . . . . 9.2% 10.3% 9.1% 8.4% 7.2%
Per Share Results
Net Income Per Basic Share . . . . . . . . . . . . . . . . . . $ 4.04 $ 4.30 $ 3.57 $ 3.12 $ 2.60Net Income Per Diluted Share . . . . . . . . . . . . . . . . $ 3.98 $ 4.22 $ 3.50 $ 3.05 $ 2.54Dividends Per Share . . . . . . . . . . . . . . . . . . . . . . . . $ 4.40 $ 4.00 $ 2.36 $ 1.20 $ 5.00Weighted Average Diluted Shares Outstanding
(in millions) . . . . . . . . . . . . . . . . . . . . . . . . . . . . 291 297 298 296 297
Other Financial Information (in millions)
Cash and Cash Equivalents . . . . . . . . . . . . . . . . . . $ 1,934 $ 2,548 $ 1,681 $ 1,519 $ 773Total Assets . . . . . . . . . . . . . . . . . . . . . . . . . . . . . . 8,170 8,493 7,476 7,127 5,946Working Capital . . . . . . . . . . . . . . . . . . . . . . . . . . . 1,451 2,281 1,520 1,296 638Net Cash Provided by Operating Activities . . . . . . 1,890 1,869 1,786 1,248 1,351Capital Expenditures . . . . . . . . . . . . . . . . . . . . . . . 990 727 715 691 588Long-term Debt . . . . . . . . . . . . . . . . . . . . . . . . . . . 5,700 5,715 4,722 4,711 4,425Other Long-term Liabilities . . . . . . . . . . . . . . . . . . 831 904 820 770 818Shareholders’ Equity (Deficit) . . . . . . . . . . . . . . . . (729) (259) 18 (370) (1,015)
Comparable Sales Increase (d) . . . . . . . . . . . . . . . . 2% 5% 4% 1% 6%Comparable Store Sales Increase (d) . . . . . . . . . . . 1% 5% 4% 2% 6%Return on Average Assets . . . . . . . . . . . . . . . . . . . 14% 16% 14% 14% 13%Current Ratio . . . . . . . . . . . . . . . . . . . . . . . . . . . . . 1.7 2.2 1.9 1.7 1.4
Stores and Associates at End of Year
Number of Stores (e) . . . . . . . . . . . . . . . . . . . . . . . 3,074 3,005 2,969 2,923 2,876Selling Square Feet (in thousands) (e) . . . . . . . . . . 12,395 11,902 11,536 11,169 10,849Number of Associates . . . . . . . . . . . . . . . . . . . . . . 93,600 87,900 80,100 94,600 99,400
(a) The fiscal year ended February 2, 2013 (“2012”) represents a 53-week fiscal year.
(b) Operating income includes the effect of the following items:
(i) In 2016, a $35 million charge related to announced actions at Victoria’s Secret, including severancecharges, fabric cancellations and the write-off of catalogue paper.
(ii) In 2012, a $93 million impairment charge related to goodwill and other intangible assets for our LaSenza business; a $27 million impairment charge related to long-lived stores assets for our HenriBendel business; and $14 million of expense associated with a store closure initiative at La Senza.
21
Fo
rm10-K

(c) In addition to the items previously discussed in (b), net income includes the effect of the following items:
(i) In 2016, a $70 million gain related to a $124 million cash distribution from Easton Town Center, LLC,a $42 million tax benefit related to the favorable resolution of a discrete income tax matter, partiallyoffset by a $22 million loss associated with the early extinguishment of our 2017 Notes.
(ii) In 2015, a $69 million gain related to the divestiture of our remaining ownership interest in our third-party apparel sourcing business.
(iii) In 2012, a $13 million gain related to $13 million in cash distributions from certain of our investmentsin Easton, an approximately 1,300 acre planned community in Columbus, Ohio that integrates office,hotel, retail, residential and recreational space.
For additional information on 2016 items, see the Notes to the Consolidated Financial Statements includedin Item 8. Financial Statements and Supplementary Data.
The effect of the items described in (b) and (c) above increased (decreased) earnings per share by $0.23 in2016, $0.23 in 2015 and $(0.38) in 2012.
(d) The percentage change in comparable sales represents direct and comparable store sales. The percentagechange in comparable store sales represents the change in sales at comparable stores only and excludes thechange in sales from our direct channels. A store is typically included in the calculation of comparable saleswhen it has been open or owned 12 months or more and it has not had a change in selling square footage of20% or more. Additionally, stores of a given brand are excluded if total selling square footage for the brandin the mall changes by 20% or more through the opening or closing of a second store. The percentagechange in comparable sales are calculated on a comparable calendar period. Therefore, the percentagechange in comparable sales for 2016, 2015, 2014 and 2013 were calculated on a 52 to 52 week basis and thepercentage change in comparable sales for 2012 was calculated on a 53 to 53 week basis. Comparable salesattributable to our international stores are calculated on a constant currency basis.
(e) Number of stores and selling square feet excludes independently owned Victoria’s Secret Beauty andAccessories, Victoria’s Secret, PINK, Bath & Body Works and La Senza stores operated by our partners.
22

ITEM 7. MANAGEMENT’S DISCUSSION AND ANALYSIS OF FINANCIAL CONDITION ANDRESULTS OF OPERATIONS.
The following discussion and analysis of financial condition and results of operations are based upon ourConsolidated Financial Statements, which have been prepared in accordance with accounting principles generallyaccepted in the United States of America (“GAAP”) as codified in the Accounting Standards Codification(“ASC”). The following information should be read in conjunction with our financial statements and the relatednotes included in Item 8. Financial Statements and Supplementary Data.
Our operating results are generally impacted by economic changes and, therefore, we monitor the retailenvironment using, among other things, certain key industry performance indicators including competitorperformance and mall traffic data. These can provide insight into consumer spending patterns and shoppingbehavior in the current retail environment and assist us in assessing our performance as well as the potentialimpact of industry trends on our future operating results. Additionally, we evaluate a number of key performanceindicators including comparable sales, gross profit, operating income and other performance metrics such as salesper average selling square foot and inventory per selling square foot in assessing our performance.
Executive Overview
We have a multi-year goal to grow our business and increase operating margins for our brands by focusing onthese key business priorities:
• Grow our business in North America;
• Extend our core brands internationally; and
• Focus on the fundamentals of our business including managing inventory, expenses and capital withdiscipline.
We also continue to focus on:
• Attracting and retaining top talent;
• Maintaining a strong cash and liquidity position while optimizing our capital structure; and
• Returning value to our shareholders.
The following is a discussion of certain of our key business priorities:
Grow our business in North America
Our first focus is on the substantial growth opportunity in North America.
In 2016, we announced strategic decisions within Victoria’s Secret to evolve the business with the changing retailenvironment. To better focus our resources on core merchandise categories, we decided to eliminate non-corecategories including swim in our lingerie business, and apparel items that were offered in our direct channel butnot in stores. The elimination of these categories will more closely align the stores and direct channels, and willenable us to increase our focus on our core categories where we have bigger growth opportunities. Additionally,we substantially reduced direct mail couponing and eliminated our catalogue circulation, instead focusing onbrand building and loyalty-enhancing marketing. In 2017, we plan to increase our square footage at Victoria’sSecret North America by about 1% through remodels of existing stores and the opening of approximately 3 netnew Victoria’s Secret stores. In our direct channel, we have the infrastructure in place to support growth. Webelieve our direct channel is an important form of brand advertising given the ubiquitous nature of the internetand our large customer file.
The core of Bath & Body Works is its personal care, home fragrance products, soaps and sanitizers whichtogether make up the majority of sales and profits for the business. We see clear opportunities for substantial
23
Fo
rm10-K

growth in these categories by focusing on product newness and innovation and expanding into under-penetratedmarket and price segments. We also have an opportunity to expand by creating a Bath & Body Works and WhiteBarn shop-in-shop at many of our store locations. In 2017, we plan to increase our square footage at Bath &Body Works North America by about 4% through remodels of existing stores and the opening of approximately25 net new Bath & Body Works stores. Additionally, www.BathandBodyWorks.com continues to exhibitsignificant year-over-year growth.
Extend our core brands internationally
We believe there is substantial opportunity for international growth. We have separate, dedicated teams that havetaken a methodical, “test and learn” approach to expansion. We began our international expansion with theacquisition of La Senza at the beginning of 2007, and in 2016 we’ve continued to expand our presence outside ofNorth America by opening company-owned stores, as well as increasing the number of stores operated by ourinternational partners.
In 2016, we accomplished the following:
• Victoria’s Secret International Stores—We have made significant progress in expanding Victoria’s Secretinternationally, in particular in Greater China. We have established a regional office with a managementteam with experience in growing global brands in the region. In fiscal 2017, we plan to open six Victoria’sSecret full-assortment stores in Greater China, with two of them having opened in February 2017. In theU.K., we opened three company-owned Victoria’s Secret full-assortment stores and one PINK store,bringing the total to 18. In 2017, we plan to open two additional Victoria’s Secret full-assortment stores andone PINK store in the U.K. We also plan to open our first Victoria’s Secret full-assortment store in Irelandin 2017. Finally, our partners opened seven Victoria’s Secret full-assortment stores and two PINK stores in2016 with notable openings in Russia, Mexico and Singapore, bringing the total to 28. Our partners plan toopen an additional 10 to 15 Victoria’s Secret full-assortment stores and one PINK store in 2017.
• Victoria’s Secret Beauty and Accessories Stores—We acquired 26 Victoria’s Secret Beauty and Accessoriesstores from our partner in Greater China, while opening five net new stores in the region during the year.Our partners opened 44 net new Victoria’s Secret Beauty and Accessories stores, bringing the total to 391.These stores are located in local markets, airports and tourist destinations, and are focused on Victoria’sSecret branded beauty and accessory products. Our partners plan to open an additional 45 to 60 Victoria’sSecret Beauty and Accessories stores in 2017.
• Bath & Body Works International Stores—Our partners opened 34 net new Bath & Body Works stores in2016, bringing the total in the Middle East, Latin America, Southeast Asia and Europe to 159. Our partnersplan to open 45 to 55 additional stores in 2017.
Focus on the fundamentals of our business
We are focused on the fundamentals of our business which include our customers, core merchandise categories,inventory management, speed and agility, and store selling and execution. In terms of speed and agility, we arefocused on inventory discipline through lead-time reductions and in-season agility to increase sales and reducepromotional activity. Finally, we continue to optimize our store selling and execution by concentrating on abetter store experience and developing and retaining talented, trained and productive store associates.
2016 Overview
Our net sales increased $420 million to $12.574 billion driven by a comparable sales increase of 2%. Ouroperating income decreased $189 million to $2.003 billion and our operating income rate decreased to 15.9%from 18.0% driven by a decline in all segments.
For additional information related to our 2016 financial performance, see “Results of Operations – 2016Compared to 2015.”
24

We accomplished the following in 2016:
• Continued to expand company-owned Victoria’s Secret and PINK stores in the U.S., Canada, and U.K. andcompany-owned Bath & Body Works stores in the U.S. and Canada;
• Continued to grow our direct businesses, increasing sales by 6%;
• Continued to expand Bath & Body Works and Victoria’s Secret stores and Victoria’s Secret Beauty andAccessories stores with partners throughout the world;
• Made a number of important changes to our Victoria’s Secret business to simplify the business andaccelerate growth. Notably, we reorganized the business and integrated the direct channel into three separatebusiness units (Lingerie, PINK and Beauty), eliminated the non-core merchandise categories of swim andapparel in order to increase focus and accelerate growth in our core categories, and we evolved how thebusiness connects with customers through more focus on brand-building and loyalty-enhancing marketingrather than traditional catalogues and offers;
• Moved from a franchise operating model to a wholly-owned model in Greater China by reacquiringfranchise rights from one of our partners which included 26 existing Victoria’s Secret Beauty andAccessories stores, launched our online business in Greater China on Tmall Global, and built the capabilityand infrastructure to support future growth; and
• Our capital expenditures of $990 million included $772 million for opening new stores and remodeling andimproving existing stores. Remaining capital expenditures were primarily related to spending on technologyand infrastructure to support growth.
We also are committed to returning value to our shareholders through a combination of dividends and sharerepurchase programs. During 2016, we paid $1.268 billion in regular and special dividends and repurchased $438million of our common stock. We use cash flow generated from operating and financing activities to fund ourdividends and share repurchase programs. Since 2000, we have returned approximately $19 billion toshareholders through share repurchases and dividends.
Adjusted Financial Information
In addition to our results provided in accordance with GAAP above and throughout this Form 10-K, providedbelow are non-GAAP measurements which present operating income, net income and earnings per sharein 2016 and 2015 on an adjusted basis, which remove certain special items. We believe that these special itemsare not indicative of our ongoing operations due to their size and nature. We use adjusted financial information askey performance measures of results of operations for the purpose of evaluating performance internally. Thesenon-GAAP measurements are not intended to replace the presentation of our financial results in accordance withGAAP. Instead, we believe that the presentation of adjusted financial information provides additionalinformation to investors to facilitate the comparison of past and present operations. Further, our definition ofadjusted financial information may differ from similarly titled measures used by other companies. The tablebelow reconciles the GAAP financial measures to the non-GAAP financial measures.
(in millions, except per share amounts) 2016 2015 2014
Detail of Special Items included in Operating Income—Income (Expense)Victoria’s Secret Restructuring (a) . . . . . . . . . . . . . . . . . . . . . . . . . . . . . . . . . . . . . . . . . $ (35) $ — $ —
Total Special Items included in Operating Income . . . . . . . . . . . . . . . . . . . . . . . . . . . . $ (35) $ — $ —
Detail of Special Items included in Other Income—Income (Loss)Loss on Extinguishment of Debt (b) . . . . . . . . . . . . . . . . . . . . . . . . . . . . . . . . . . . . . . . $ (36) $ — $ —Gain on Distribution from Easton Town Center, LLC (c) . . . . . . . . . . . . . . . . . . . . . . . 108 — —Gain on Divestiture of Third-party Apparel Sourcing Business (d) . . . . . . . . . . . . . . . — 78 —
Total Special Items included in Other Income . . . . . . . . . . . . . . . . . . . . . . . . . . . . . . . . $ 72 $ 78 $ —
25
Fo
rm10-K

(in millions, except per share amounts) 2016 2015 2014
Detail of Special Items included in Provision for Income Taxes—Benefit (Provision)Tax Benefit from the Settlement of a Discrete Tax Matter (e) . . . . . . . . . . . . . . . . . . . $ 42 $ — $ —Tax Effect of Special Items included in Operating Income and Other Income . . . . . . . (11) (9) —
Total Special Items included in Provision for Income Taxes . . . . . . . . . . . . . . . . . . . . $ 30 $ (9) $ —
Reconciliation of Reported Operating Income to Adjusted Operating IncomeReported Operating Income . . . . . . . . . . . . . . . . . . . . . . . . . . . . . . . . . . . . . . . . . . . . . . $2,003 $2,192 $1,953Special Items included in Operating Income . . . . . . . . . . . . . . . . . . . . . . . . . . . . . . . . . 35 — —
Adjusted Operating Income . . . . . . . . . . . . . . . . . . . . . . . . . . . . . . . . . . . . . . . . . . . . . . $2,037 $2,192 $1,953
Reconciliation of Reported Net Income to Adjusted Net IncomeReported Net Income . . . . . . . . . . . . . . . . . . . . . . . . . . . . . . . . . . . . . . . . . . . . . . . . . . . $1,158 $1,253 $1,042Special Items included in Net Income . . . . . . . . . . . . . . . . . . . . . . . . . . . . . . . . . . . . . . (68) (69) —
Adjusted Net Income . . . . . . . . . . . . . . . . . . . . . . . . . . . . . . . . . . . . . . . . . . . . . . . . . . . $1,090 $1,184 $1,042
Reconciliation of Reported Earnings Per Diluted Share to Adjusted Earnings PerDiluted Share
Reported Earnings Per Diluted Share . . . . . . . . . . . . . . . . . . . . . . . . . . . . . . . . . . . . . . . $ 3.98 $ 4.22 $ 3.50Special Items included in Earnings Per Diluted Share . . . . . . . . . . . . . . . . . . . . . . . . . . (0.23) (0.23) —
Adjusted Earnings Per Diluted Share . . . . . . . . . . . . . . . . . . . . . . . . . . . . . . . . . . . . . . . $ 3.74 $ 3.99 $ 3.50
(a) In the first quarter of 2016, strategic actions within the Victoria’s Secret segment were taken, designed tofocus the brand on its core merchandise categories and streamline operations. As a result of these actions,we recorded charges related to severance and related costs, fabric cancellations and catalogue paper write-offs. For additional information see Note 5, “Restructuring Activities” included in Item 8. FinancialStatements and Supplementary Data.
(b) In the second quarter of 2016, we repurchased our $700 million 6.90% Senior Unsecured Notes due July2017 resulting in a pre-tax loss on extinguishment of $36 million (after-tax loss of $22 million). Foradditional information see Note 12, “Long-term Debt” included in Item 8. Financial Statements andSupplementary Data.
(c) In the second quarter of 2016, we received a $124 million cash distribution from Easton Town Center, LLCresulting in a pre-tax gain of $108 million (after-tax gain of $70 million). For additional information seeNote 9, “Equity Investments and Other” included in Item 8. Financial Statements and Supplementary Data.
(d) In the first quarter of 2015, we divested our remaining ownership interest in our third-party apparel sourcingbusiness. We received cash proceeds of $85 million and recognized a pre-tax gain of $78 million (after-taxgain of $69 million). For additional information see Note 9, “Equity Investments and Other” included inItem 8. Financial Statements and Supplementary Data.
(e) In the fourth quarter of 2016, we recorded a $42 million tax benefit related to the favorable resolution of adiscrete income tax matter. For additional information see Note 11, “Income Taxes” included in Item 8.Financial Statements and Supplementary Data.
2017 Outlook
The global retail sector and our business continue to face an uncertain environment and, as a result, we continueto take a conservative stance with respect to the financial management of our business. We will continue tomanage our business carefully, and we will focus on the execution of the retail fundamentals.
At the same time, we are aggressively focusing on bringing compelling merchandise assortments and marketing,store and online experiences to our customers. We will look for, and capitalize on, those opportunities availableto us. We believe that our brands, which lead their categories and offer high emotional content to customers ataccessible prices, are well positioned heading into 2017.
26
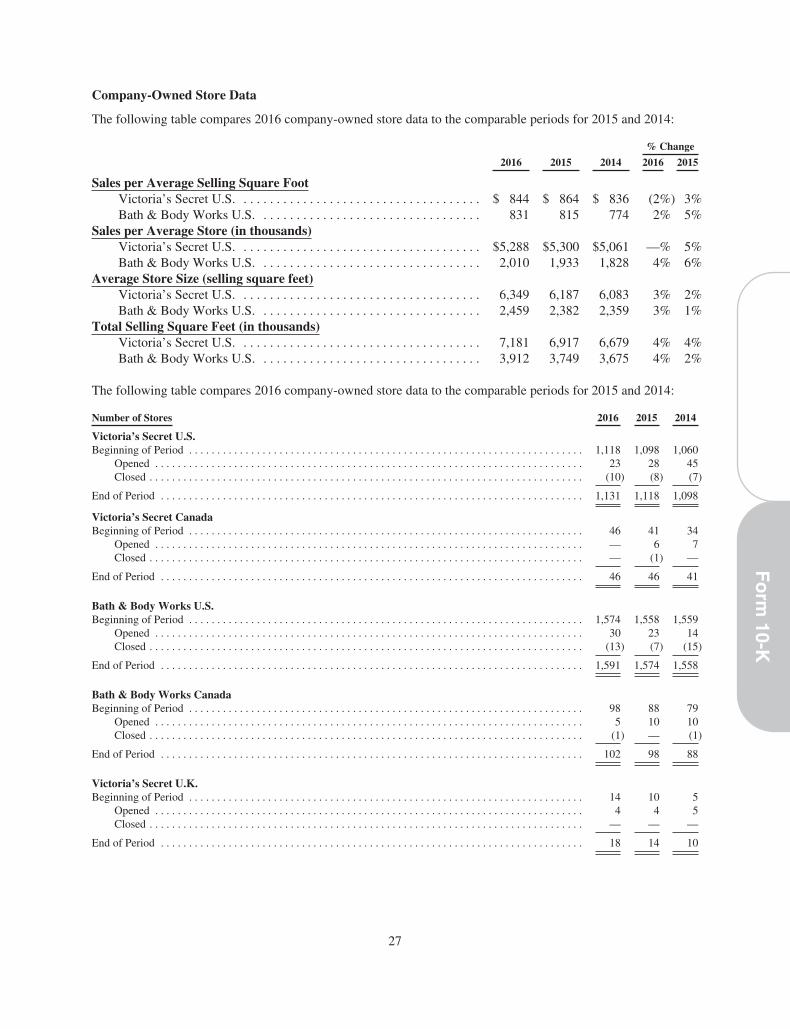
Company-Owned Store Data
The following table compares 2016 company-owned store data to the comparable periods for 2015 and 2014:
% Change
2016 2015 2014 2016 2015
Sales per Average Selling Square FootVictoria’s Secret U.S. . . . . . . . . . . . . . . . . . . . . . . . . . . . . . . . . . . . . $ 844 $ 864 $ 836 (2%) 3%Bath & Body Works U.S. . . . . . . . . . . . . . . . . . . . . . . . . . . . . . . . . . 831 815 774 2% 5%
Sales per Average Store (in thousands)Victoria’s Secret U.S. . . . . . . . . . . . . . . . . . . . . . . . . . . . . . . . . . . . . $5,288 $5,300 $5,061 —% 5%Bath & Body Works U.S. . . . . . . . . . . . . . . . . . . . . . . . . . . . . . . . . . 2,010 1,933 1,828 4% 6%
Average Store Size (selling square feet)Victoria’s Secret U.S. . . . . . . . . . . . . . . . . . . . . . . . . . . . . . . . . . . . . 6,349 6,187 6,083 3% 2%Bath & Body Works U.S. . . . . . . . . . . . . . . . . . . . . . . . . . . . . . . . . . 2,459 2,382 2,359 3% 1%
Total Selling Square Feet (in thousands)Victoria’s Secret U.S. . . . . . . . . . . . . . . . . . . . . . . . . . . . . . . . . . . . . 7,181 6,917 6,679 4% 4%Bath & Body Works U.S. . . . . . . . . . . . . . . . . . . . . . . . . . . . . . . . . . 3,912 3,749 3,675 4% 2%
The following table compares 2016 company-owned store data to the comparable periods for 2015 and 2014:
Number of Stores 2016 2015 2014
Victoria’s Secret U.S.Beginning of Period . . . . . . . . . . . . . . . . . . . . . . . . . . . . . . . . . . . . . . . . . . . . . . . . . . . . . . . . . . . . . . . . . . . . . . 1,118 1,098 1,060
Opened . . . . . . . . . . . . . . . . . . . . . . . . . . . . . . . . . . . . . . . . . . . . . . . . . . . . . . . . . . . . . . . . . . . . . . . . . . . . 23 28 45Closed . . . . . . . . . . . . . . . . . . . . . . . . . . . . . . . . . . . . . . . . . . . . . . . . . . . . . . . . . . . . . . . . . . . . . . . . . . . . . (10) (8) (7)
End of Period . . . . . . . . . . . . . . . . . . . . . . . . . . . . . . . . . . . . . . . . . . . . . . . . . . . . . . . . . . . . . . . . . . . . . . . . . . . 1,131 1,118 1,098
Victoria’s Secret CanadaBeginning of Period . . . . . . . . . . . . . . . . . . . . . . . . . . . . . . . . . . . . . . . . . . . . . . . . . . . . . . . . . . . . . . . . . . . . . . 46 41 34
Opened . . . . . . . . . . . . . . . . . . . . . . . . . . . . . . . . . . . . . . . . . . . . . . . . . . . . . . . . . . . . . . . . . . . . . . . . . . . . — 6 7Closed . . . . . . . . . . . . . . . . . . . . . . . . . . . . . . . . . . . . . . . . . . . . . . . . . . . . . . . . . . . . . . . . . . . . . . . . . . . . . — (1) —
End of Period . . . . . . . . . . . . . . . . . . . . . . . . . . . . . . . . . . . . . . . . . . . . . . . . . . . . . . . . . . . . . . . . . . . . . . . . . . . 46 46 41
Bath & Body Works U.S.Beginning of Period . . . . . . . . . . . . . . . . . . . . . . . . . . . . . . . . . . . . . . . . . . . . . . . . . . . . . . . . . . . . . . . . . . . . . . 1,574 1,558 1,559
Opened . . . . . . . . . . . . . . . . . . . . . . . . . . . . . . . . . . . . . . . . . . . . . . . . . . . . . . . . . . . . . . . . . . . . . . . . . . . . 30 23 14Closed . . . . . . . . . . . . . . . . . . . . . . . . . . . . . . . . . . . . . . . . . . . . . . . . . . . . . . . . . . . . . . . . . . . . . . . . . . . . . (13) (7) (15)
End of Period . . . . . . . . . . . . . . . . . . . . . . . . . . . . . . . . . . . . . . . . . . . . . . . . . . . . . . . . . . . . . . . . . . . . . . . . . . . 1,591 1,574 1,558
Bath & Body Works CanadaBeginning of Period . . . . . . . . . . . . . . . . . . . . . . . . . . . . . . . . . . . . . . . . . . . . . . . . . . . . . . . . . . . . . . . . . . . . . . 98 88 79
Opened . . . . . . . . . . . . . . . . . . . . . . . . . . . . . . . . . . . . . . . . . . . . . . . . . . . . . . . . . . . . . . . . . . . . . . . . . . . . 5 10 10Closed . . . . . . . . . . . . . . . . . . . . . . . . . . . . . . . . . . . . . . . . . . . . . . . . . . . . . . . . . . . . . . . . . . . . . . . . . . . . . (1) — (1)
End of Period . . . . . . . . . . . . . . . . . . . . . . . . . . . . . . . . . . . . . . . . . . . . . . . . . . . . . . . . . . . . . . . . . . . . . . . . . . . 102 98 88
Victoria’s Secret U.K.Beginning of Period . . . . . . . . . . . . . . . . . . . . . . . . . . . . . . . . . . . . . . . . . . . . . . . . . . . . . . . . . . . . . . . . . . . . . . 14 10 5
Opened . . . . . . . . . . . . . . . . . . . . . . . . . . . . . . . . . . . . . . . . . . . . . . . . . . . . . . . . . . . . . . . . . . . . . . . . . . . . 4 4 5Closed . . . . . . . . . . . . . . . . . . . . . . . . . . . . . . . . . . . . . . . . . . . . . . . . . . . . . . . . . . . . . . . . . . . . . . . . . . . . . — — —
End of Period . . . . . . . . . . . . . . . . . . . . . . . . . . . . . . . . . . . . . . . . . . . . . . . . . . . . . . . . . . . . . . . . . . . . . . . . . . . 18 14 10
27
Fo
rm10-K

Number of Stores 2016 2015 2014
Victoria’s Secret Beauty and AccessoriesBeginning of Period . . . . . . . . . . . . . . . . . . . . . . . . . . . . . . . . . . . . . . . . . . . . . . . . . . . . . . . . . . . . . . . . . . . . . . — — —
Acquired (a) . . . . . . . . . . . . . . . . . . . . . . . . . . . . . . . . . . . . . . . . . . . . . . . . . . . . . . . . . . . . . . . . . . . . . . . . 26 — —Opened . . . . . . . . . . . . . . . . . . . . . . . . . . . . . . . . . . . . . . . . . . . . . . . . . . . . . . . . . . . . . . . . . . . . . . . . . . . . 6 — —Closed . . . . . . . . . . . . . . . . . . . . . . . . . . . . . . . . . . . . . . . . . . . . . . . . . . . . . . . . . . . . . . . . . . . . . . . . . . . . . (1) — —
End of Period . . . . . . . . . . . . . . . . . . . . . . . . . . . . . . . . . . . . . . . . . . . . . . . . . . . . . . . . . . . . . . . . . . . . . . . . . . . 31 — —
La Senza U.S.Beginning of Period . . . . . . . . . . . . . . . . . . . . . . . . . . . . . . . . . . . . . . . . . . . . . . . . . . . . . . . . . . . . . . . . . . . . . . — — —
Opened . . . . . . . . . . . . . . . . . . . . . . . . . . . . . . . . . . . . . . . . . . . . . . . . . . . . . . . . . . . . . . . . . . . . . . . . . . . . 4 — —Closed . . . . . . . . . . . . . . . . . . . . . . . . . . . . . . . . . . . . . . . . . . . . . . . . . . . . . . . . . . . . . . . . . . . . . . . . . . . . . — — —
End of Period . . . . . . . . . . . . . . . . . . . . . . . . . . . . . . . . . . . . . . . . . . . . . . . . . . . . . . . . . . . . . . . . . . . . . . . . . . . 4 — —
La Senza CanadaBeginning of Period . . . . . . . . . . . . . . . . . . . . . . . . . . . . . . . . . . . . . . . . . . . . . . . . . . . . . . . . . . . . . . . . . . . . . . 126 145 157
Opened . . . . . . . . . . . . . . . . . . . . . . . . . . . . . . . . . . . . . . . . . . . . . . . . . . . . . . . . . . . . . . . . . . . . . . . . . . . . — 1 —Closed . . . . . . . . . . . . . . . . . . . . . . . . . . . . . . . . . . . . . . . . . . . . . . . . . . . . . . . . . . . . . . . . . . . . . . . . . . . . . (4) (20) (12)
End of Period . . . . . . . . . . . . . . . . . . . . . . . . . . . . . . . . . . . . . . . . . . . . . . . . . . . . . . . . . . . . . . . . . . . . . . . . . . . 122 126 145
Henri BendelBeginning of Period . . . . . . . . . . . . . . . . . . . . . . . . . . . . . . . . . . . . . . . . . . . . . . . . . . . . . . . . . . . . . . . . . . . . . . 29 29 29
Opened . . . . . . . . . . . . . . . . . . . . . . . . . . . . . . . . . . . . . . . . . . . . . . . . . . . . . . . . . . . . . . . . . . . . . . . . . . . . — — —Closed . . . . . . . . . . . . . . . . . . . . . . . . . . . . . . . . . . . . . . . . . . . . . . . . . . . . . . . . . . . . . . . . . . . . . . . . . . . . . — — —
End of Period . . . . . . . . . . . . . . . . . . . . . . . . . . . . . . . . . . . . . . . . . . . . . . . . . . . . . . . . . . . . . . . . . . . . . . . . . . . 29 29 29
TotalBeginning of Period . . . . . . . . . . . . . . . . . . . . . . . . . . . . . . . . . . . . . . . . . . . . . . . . . . . . . . . . . . . . . . . . . . . . . . 3,005 2,969 2,923
Acquired (a) . . . . . . . . . . . . . . . . . . . . . . . . . . . . . . . . . . . . . . . . . . . . . . . . . . . . . . . . . . . . . . . . . . . . . . . . 26 — —Opened . . . . . . . . . . . . . . . . . . . . . . . . . . . . . . . . . . . . . . . . . . . . . . . . . . . . . . . . . . . . . . . . . . . . . . . . . . . . 72 72 81Closed . . . . . . . . . . . . . . . . . . . . . . . . . . . . . . . . . . . . . . . . . . . . . . . . . . . . . . . . . . . . . . . . . . . . . . . . . . . . . (29) (36) (35)
End of Period . . . . . . . . . . . . . . . . . . . . . . . . . . . . . . . . . . . . . . . . . . . . . . . . . . . . . . . . . . . . . . . . . . . . . . . . . . . 3,074 3,005 2,969
(a) Relates to the acquisition of Victoria’s Secret Beauty and Accessories franchise stores in Greater China. For additionalinformation see Note 4, “Acquisition” included in Item 8. Financial Statements and Supplementary Data.
28

Noncompany-Owned Store Data
The following table compares the 2016 noncompany-owned store data to the comparable periods for 2015 and2014:
Number of Stores 2016 2015 2014
Victoria’s Secret Beauty & AccessoriesBeginning of Period . . . . . . . . . . . . . . . . . . . . . . . . . . . . . . . . . . . . . . . . . . . . . . . . . . . . . . . . . . . . . . . . . . . . . 373 290 198
Opened . . . . . . . . . . . . . . . . . . . . . . . . . . . . . . . . . . . . . . . . . . . . . . . . . . . . . . . . . . . . . . . . . . . . . . . . . . . 56 88 99Closed . . . . . . . . . . . . . . . . . . . . . . . . . . . . . . . . . . . . . . . . . . . . . . . . . . . . . . . . . . . . . . . . . . . . . . . . . . . (12) (5) (7)Transferred (a) . . . . . . . . . . . . . . . . . . . . . . . . . . . . . . . . . . . . . . . . . . . . . . . . . . . . . . . . . . . . . . . . . . . . . (26) — —
End of Period . . . . . . . . . . . . . . . . . . . . . . . . . . . . . . . . . . . . . . . . . . . . . . . . . . . . . . . . . . . . . . . . . . . . . . . . . . 391 373 290
Victoria’s SecretBeginning of Period . . . . . . . . . . . . . . . . . . . . . . . . . . . . . . . . . . . . . . . . . . . . . . . . . . . . . . . . . . . . . . . . . . . . . 19 14 4
Opened . . . . . . . . . . . . . . . . . . . . . . . . . . . . . . . . . . . . . . . . . . . . . . . . . . . . . . . . . . . . . . . . . . . . . . . . . . . 9 5 10Closed . . . . . . . . . . . . . . . . . . . . . . . . . . . . . . . . . . . . . . . . . . . . . . . . . . . . . . . . . . . . . . . . . . . . . . . . . . . — — —
End of Period . . . . . . . . . . . . . . . . . . . . . . . . . . . . . . . . . . . . . . . . . . . . . . . . . . . . . . . . . . . . . . . . . . . . . . . . . . 28 19 14
Bath & Body WorksBeginning of Period . . . . . . . . . . . . . . . . . . . . . . . . . . . . . . . . . . . . . . . . . . . . . . . . . . . . . . . . . . . . . . . . . . . . . 125 80 55
Opened . . . . . . . . . . . . . . . . . . . . . . . . . . . . . . . . . . . . . . . . . . . . . . . . . . . . . . . . . . . . . . . . . . . . . . . . . . . 36 47 26Closed . . . . . . . . . . . . . . . . . . . . . . . . . . . . . . . . . . . . . . . . . . . . . . . . . . . . . . . . . . . . . . . . . . . . . . . . . . . (2) (2) (1)
End of Period . . . . . . . . . . . . . . . . . . . . . . . . . . . . . . . . . . . . . . . . . . . . . . . . . . . . . . . . . . . . . . . . . . . . . . . . . . 159 125 80
La SenzaBeginning of Period . . . . . . . . . . . . . . . . . . . . . . . . . . . . . . . . . . . . . . . . . . . . . . . . . . . . . . . . . . . . . . . . . . . . . 221 266 331
Opened . . . . . . . . . . . . . . . . . . . . . . . . . . . . . . . . . . . . . . . . . . . . . . . . . . . . . . . . . . . . . . . . . . . . . . . . . . . 6 5 6Closed . . . . . . . . . . . . . . . . . . . . . . . . . . . . . . . . . . . . . . . . . . . . . . . . . . . . . . . . . . . . . . . . . . . . . . . . . . . (24) (50) (71)
End of Period . . . . . . . . . . . . . . . . . . . . . . . . . . . . . . . . . . . . . . . . . . . . . . . . . . . . . . . . . . . . . . . . . . . . . . . . . . 203 221 266
TotalBeginning of Period . . . . . . . . . . . . . . . . . . . . . . . . . . . . . . . . . . . . . . . . . . . . . . . . . . . . . . . . . . . . . . . . . . . . . 738 650 588
Opened . . . . . . . . . . . . . . . . . . . . . . . . . . . . . . . . . . . . . . . . . . . . . . . . . . . . . . . . . . . . . . . . . . . . . . . . . . . 107 145 141Closed . . . . . . . . . . . . . . . . . . . . . . . . . . . . . . . . . . . . . . . . . . . . . . . . . . . . . . . . . . . . . . . . . . . . . . . . . . . (38) (57) (79)Transferred (a) . . . . . . . . . . . . . . . . . . . . . . . . . . . . . . . . . . . . . . . . . . . . . . . . . . . . . . . . . . . . . . . . . . . . . (26) — —
End of Period . . . . . . . . . . . . . . . . . . . . . . . . . . . . . . . . . . . . . . . . . . . . . . . . . . . . . . . . . . . . . . . . . . . . . . . . . . 781 738 650
(a) Relates to the acquisition of Victoria’s Secret Beauty and Accessories franchise stores in Greater China. For additionalinformation see Note 4, “Acquisition” included in Item 8. Financial Statements and Supplementary Data.
29
Fo
rm10-K

Results of Operations—2016 Compared to 2015
Operating Income
The following table provides our segment operating income (loss) and operating income rates (expressed as apercentage of net sales) for 2016 in comparison to 2015:
Operating Income Rate
2016 2015 2016 2015
(in millions)
Victoria’s Secret . . . . . . . . . . . . . . . . . . . . . . . . . . . . . . . . . . . . . . . . . . . $1,173 $1,391 15.1% 18.1%Bath & Body Works . . . . . . . . . . . . . . . . . . . . . . . . . . . . . . . . . . . . . . . . 907 858 23.6% 23.9%Victoria’s Secret and Bath & Body Works International . . . . . . . . . . . . 40 88 9.4% 22.8%Other (a) . . . . . . . . . . . . . . . . . . . . . . . . . . . . . . . . . . . . . . . . . . . . . . . . . (117) (145) (22.6)% (28.5)%
Total Operating Income . . . . . . . . . . . . . . . . . . . . . . . . . . . . . . . . . . . . . $2,003 $2,192 15.9% 18.0%
(a) Includes Mast Global, La Senza, Henri Bendel and Corporate.
For 2016, operating income decreased $189 million to $2.003 billion, and the operating income rate decreased to15.9% from 18.0%. The drivers of the operating income results are discussed in the following sections.
Net Sales
The following table provides net sales for 2016 in comparison to 2015:
2016 2015 % Change
(in millions)
Victoria’s Secret Stores (a) . . . . . . . . . . . . . . . . . . . . . . . . . . . . . . . . . . . . . . . . . . . $ 6,199 $ 6,112 1%Victoria’s Secret Direct . . . . . . . . . . . . . . . . . . . . . . . . . . . . . . . . . . . . . . . . . . . . . 1,582 1,560 1%
Total Victoria’s Secret . . . . . . . . . . . . . . . . . . . . . . . . . . . . . . . . . . . . . . . . . . 7,781 7,672 1%Bath & Body Works Stores (a) . . . . . . . . . . . . . . . . . . . . . . . . . . . . . . . . . . . . . . . . 3,400 3,225 5%Bath & Body Works Direct . . . . . . . . . . . . . . . . . . . . . . . . . . . . . . . . . . . . . . . . . . 452 362 25%
Total Bath & Body Works . . . . . . . . . . . . . . . . . . . . . . . . . . . . . . . . . . . . . . . 3,852 3,587 7%Victoria’s Secret and Bath & Body Works International . . . . . . . . . . . . . . . . . . . . 423 385 10%Other (b) . . . . . . . . . . . . . . . . . . . . . . . . . . . . . . . . . . . . . . . . . . . . . . . . . . . . . . . . . 518 510 2%
Total Net Sales . . . . . . . . . . . . . . . . . . . . . . . . . . . . . . . . . . . . . . . . . . . . . . . . $12,574 $12,154 3%
(a) Includes company-owned stores in the U.S. and Canada.(b) Includes Mast Global, La Senza, Henri Bendel and Corporate.
30
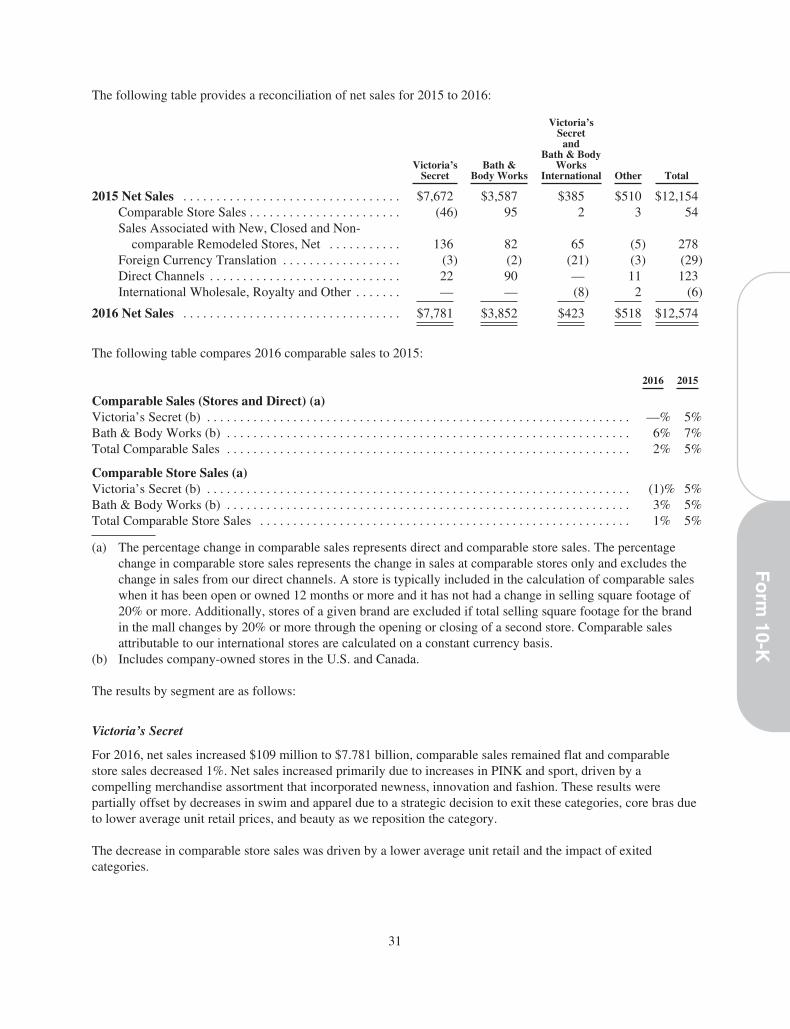
The following table provides a reconciliation of net sales for 2015 to 2016:
Victoria’sSecret
Bath &Body Works
Victoria’sSecret
andBath & Body
WorksInternational Other Total
2015 Net Sales . . . . . . . . . . . . . . . . . . . . . . . . . . . . . . . . . $7,672 $3,587 $385 $510 $12,154Comparable Store Sales . . . . . . . . . . . . . . . . . . . . . . . (46) 95 2 3 54Sales Associated with New, Closed and Non-
comparable Remodeled Stores, Net . . . . . . . . . . . 136 82 65 (5) 278Foreign Currency Translation . . . . . . . . . . . . . . . . . . (3) (2) (21) (3) (29)Direct Channels . . . . . . . . . . . . . . . . . . . . . . . . . . . . . 22 90 — 11 123International Wholesale, Royalty and Other . . . . . . . — — (8) 2 (6)
2016 Net Sales . . . . . . . . . . . . . . . . . . . . . . . . . . . . . . . . . $7,781 $3,852 $423 $518 $12,574
The following table compares 2016 comparable sales to 2015:
2016 2015
Comparable Sales (Stores and Direct) (a)Victoria’s Secret (b) . . . . . . . . . . . . . . . . . . . . . . . . . . . . . . . . . . . . . . . . . . . . . . . . . . . . . . . . . . . . . . . . —% 5%Bath & Body Works (b) . . . . . . . . . . . . . . . . . . . . . . . . . . . . . . . . . . . . . . . . . . . . . . . . . . . . . . . . . . . . . 6% 7%Total Comparable Sales . . . . . . . . . . . . . . . . . . . . . . . . . . . . . . . . . . . . . . . . . . . . . . . . . . . . . . . . . . . . . 2% 5%
Comparable Store Sales (a)Victoria’s Secret (b) . . . . . . . . . . . . . . . . . . . . . . . . . . . . . . . . . . . . . . . . . . . . . . . . . . . . . . . . . . . . . . . . (1)% 5%Bath & Body Works (b) . . . . . . . . . . . . . . . . . . . . . . . . . . . . . . . . . . . . . . . . . . . . . . . . . . . . . . . . . . . . . 3% 5%Total Comparable Store Sales . . . . . . . . . . . . . . . . . . . . . . . . . . . . . . . . . . . . . . . . . . . . . . . . . . . . . . . . 1% 5%
(a) The percentage change in comparable sales represents direct and comparable store sales. The percentagechange in comparable store sales represents the change in sales at comparable stores only and excludes thechange in sales from our direct channels. A store is typically included in the calculation of comparable saleswhen it has been open or owned 12 months or more and it has not had a change in selling square footage of20% or more. Additionally, stores of a given brand are excluded if total selling square footage for the brandin the mall changes by 20% or more through the opening or closing of a second store. Comparable salesattributable to our international stores are calculated on a constant currency basis.
(b) Includes company-owned stores in the U.S. and Canada.
The results by segment are as follows:
Victoria’s Secret
For 2016, net sales increased $109 million to $7.781 billion, comparable sales remained flat and comparablestore sales decreased 1%. Net sales increased primarily due to increases in PINK and sport, driven by acompelling merchandise assortment that incorporated newness, innovation and fashion. These results werepartially offset by decreases in swim and apparel due to a strategic decision to exit these categories, core bras dueto lower average unit retail prices, and beauty as we reposition the category.
The decrease in comparable store sales was driven by a lower average unit retail and the impact of exitedcategories.
31
Fo
rm10-K

Bath & Body Works
For 2016, net sales increased $265 million to $3.852 billion, comparable sales increased 6% and comparablestore sales increased 3%. Net sales increased in most categories, including home fragrance and SignatureCollection, which incorporated newness, innovation, and fashion.
The increase in comparable store sales was primarily driven by a higher average unit retail.
Victoria’s Secret and Bath & Body Works International
For 2016, net sales increased $38 million to $423 million primarily related to newly acquired Victoria’s SecretBeauty and Accessories stores in Greater China, company-owned Victoria’s Secret stores in the U.K., andadditional stores opened by our partners. These results were partially offset by softness in the Victoria’s SecretBeauty and Accessories business and the negative impacts of foreign currency.
Other
For 2016, net sales increased $8 million to $518 million primarily due to increases in our La Senza and HenriBendel direct channels, partially offset by store closures and the negative impacts of foreign currency atLa Senza.
Gross Profit
For 2016, our gross profit decreased $79 million to $5.125 billion, and our gross profit rate (expressed as apercentage of net sales) decreased to 40.8% from 42.8% primarily as a result of:
Victoria’s Secret
For 2016, the gross profit decrease was primarily driven by a decline in merchandise margin due to clearanceactivity on non-go forward merchandise categories, promotions and pricing to drive trial in beauty and other keycategories and fabric cancellations related to restructuring activities. Offsetting the merchandise margin decline,buying and occupancy expenses decreased primarily driven by a decrease in catalogue costs and other costreductions from strategic actions taken in the first quarter, partially offset by an increase in occupancy expensesdue to investments in store real estate.
The gross profit rate decrease was driven primarily by increases in the promotional and clearance activitydescribed above, the expenses related to the restructuring activities and investments in store real estate, partiallyoffset by lower buying and occupancy expenses due to decreased catalogue costs.
Bath & Body Works
For 2016, the gross profit increase was primarily driven by higher merchandise margin dollars related to theincrease in net sales. The increase in merchandise margin was partially offset by higher occupancy expenses dueto investments in store real estate.
The gross profit rate decrease was driven by an increase in occupancy expenses primarily due to investments instore real estate.
Victoria’s Secret and Bath & Body Works International
For 2016, the gross profit decrease was primarily due to higher occupancy expenses driven by investments instore real estate in Greater China and the U.K., lower merchandise margin dollars at Victoria’s Secret Beauty andAccessories due to business performance, and the negative impacts of foreign currency. These decreases werepartially offset by increased merchandise margin dollars generated from higher net sales.
32

The gross profit rate decrease was driven by higher occupancy expenses due to investments in store real estate, adecrease in merchandise margin rate at Victoria’s Secret Beauty and Accessories and the negative impacts offoreign currency.
General, Administrative and Store Operating Expenses
For 2016, our general, administrative and store operating expenses increased $110 million to $3.122 billionprimarily driven by increased store selling expenses related to higher sales volume and investments in selling toimprove the customer experience, increased marketing to drive traffic, severance charges related to the Victoria’sSecret restructuring activities, and corporate expenses in Greater China, partially offset by lower incentivecompensation expense.
Other Income and Expenses
Interest Expense
The following table provides the average daily borrowings and average borrowing rates for 2016 and 2015:
2016 2015
Average daily borrowings (in millions) . . . . . . . . . . . . . . . . . . . . . . . . . . . . . . . . . . . . . . . . . . . . $5,827 $5,005Average borrowing rate (in percentages) . . . . . . . . . . . . . . . . . . . . . . . . . . . . . . . . . . . . . . . . . . . 6.8% 6.7%
For 2016, our interest expense increased $60 million to $394 million primarily due to an increase in averageborrowings related to the October 2015 $1 billion issuance of our 2035 Notes, as well as an increase in theaverage borrowing rate.
Other Income
For 2016, our other income increased $11 million to $87 million primarily driven by a distribution received fromEaston Town Center, LLC resulting in a gain of $108 million, partially offset by a $36 million loss onextinguishment of the 2017 Notes. In 2015, we recognized a gain of $78 million due to the divestiture of ourremaining ownership interest in the third-party apparel sourcing business.
Provision for Income Taxes
For 2016, our effective tax rate decreased to 31.7% from 35.2%. The 2016 rate was lower than our combinedestimated federal and state statutory rate primarily due to the resolution of certain tax matters. The 2015 rate waslower than our combined estimated federal and state statutory rate primarily due to foreign earnings taxed at arate lower than our combined estimated federal and state statutory rate.
33
Fo
rm10-K

Results of Operations—Fourth Quarter of 2016 Compared to Fourth Quarter of 2015
Operating Income
The following table provides our segment operating income (loss) and operating income rates (expressed as apercentage of net sales) for the fourth quarter of 2016 in comparison to the fourth quarter of 2015:
Fourth Quarter Operating Income Rate
2016 2015 2016 2015
(in millions)Victoria’s Secret . . . . . . . . . . . . . . . . . . . . . . . . . . . . . . . . . . . . . . . . $494 $ 594 19.1% 22.7%Bath & Body Works . . . . . . . . . . . . . . . . . . . . . . . . . . . . . . . . . . . . . 502 487 31.0% 32.1%Victoria’s Secret and Bath & Body Works International . . . . . . . . . 10 28 8.3% 25.0%Other (a) . . . . . . . . . . . . . . . . . . . . . . . . . . . . . . . . . . . . . . . . . . . . . . . (18) (31) (11.7)% (20.7)%
Total Operating Income . . . . . . . . . . . . . . . . . . . . . . . . . . . . . . . . . . . $988 $1,078 22.0% 24.5%
(a) Includes Mast Global, La Senza, Henri Bendel and Corporate.
For the fourth quarter of 2016, operating income decreased $90 million to $988 million, and the operatingincome rate decreased to 22.0% from 24.5%. The drivers of the operating income results are discussed in thefollowing sections.
Net Sales
The following table provides net sales for the fourth quarter of 2016 in comparison to the fourth quarter of 2015:
Fourth Quarter 2016 2015 % Change
(in millions)
Victoria’s Secret Stores (a) . . . . . . . . . . . . . . . . . . . . . . . . . . . . . . . . . . . . . . . . . . . . . $2,063 $2,047 1%Victoria’s Secret Direct . . . . . . . . . . . . . . . . . . . . . . . . . . . . . . . . . . . . . . . . . . . . . . . 526 567 (7%)
Total Victoria’s Secret . . . . . . . . . . . . . . . . . . . . . . . . . . . . . . . . . . . . . . . . . . . . 2,589 2,614 (1%)Bath & Body Works Stores (a) . . . . . . . . . . . . . . . . . . . . . . . . . . . . . . . . . . . . . . . . . . 1,422 1,362 4%Bath & Body Works Direct . . . . . . . . . . . . . . . . . . . . . . . . . . . . . . . . . . . . . . . . . . . . 198 158 25%
Total Bath & Body Works . . . . . . . . . . . . . . . . . . . . . . . . . . . . . . . . . . . . . . . . . 1,620 1,520 7%Victoria’s Secret and Bath & Body Works International . . . . . . . . . . . . . . . . . . . . . . 124 112 10%Other (b) . . . . . . . . . . . . . . . . . . . . . . . . . . . . . . . . . . . . . . . . . . . . . . . . . . . . . . . . . . . 156 149 5%
Total Net Sales . . . . . . . . . . . . . . . . . . . . . . . . . . . . . . . . . . . . . . . . . . . . . . . . . . $4,489 $4,395 2%
(a) Includes company-owned stores in the U.S. and Canada.(b) Includes Mast Global, La Senza, Henri Bendel and Corporate.
34

The following table provides a reconciliation of net sales for the fourth quarter of 2016 to the fourth quarter of2015:
Fourth QuarterVictoria’s
SecretBath & Body
Works
Victoria’sSecret
andBath & Body
WorksInternational Other Total
(in millions)
2015 Net Sales . . . . . . . . . . . . . . . . . . . . . . . . . . . . . . . . . . $2,614 $1,520 $112 $149 $4,395Comparable Store Sales . . . . . . . . . . . . . . . . . . . . . . . (38) 25 — (1) (14)Sales Associated with New, Closed and Non-
comparable Remodeled Stores, Net . . . . . . . . . . . . 52 33 25 — 110Foreign Currency Translation . . . . . . . . . . . . . . . . . . . 2 2 (9) 1 (4)Direct Channels . . . . . . . . . . . . . . . . . . . . . . . . . . . . . (41) 40 — 4 3International, Wholesale, Royalty and Other . . . . . . . — — (4) 3 (1)
2016 Net Sales . . . . . . . . . . . . . . . . . . . . . . . . . . . . . . . . . . $2,589 $1,620 $124 $156 $4,489
The following table compares fourth quarter of 2016 comparable sales to fourth quarter of 2015:
Fourth Quarter 2016 2015
Comparable Sales (Stores and Direct) (a)Victoria’s Secret (b) . . . . . . . . . . . . . . . . . . . . . . . . . . . . . . . . . . . . . . . . . . . . . . . . . . . . . . . . . . . . . . . . (3)% 7%Bath & Body Works (b) . . . . . . . . . . . . . . . . . . . . . . . . . . . . . . . . . . . . . . . . . . . . . . . . . . . . . . . . . . . . . 5% 7%Total Comparable Sales . . . . . . . . . . . . . . . . . . . . . . . . . . . . . . . . . . . . . . . . . . . . . . . . . . . . . . . . . . . . . —% 8%Comparable Store Sales (a)Victoria’s Secret (b) . . . . . . . . . . . . . . . . . . . . . . . . . . . . . . . . . . . . . . . . . . . . . . . . . . . . . . . . . . . . . . . . (2)% 5%Bath & Body Works (b) . . . . . . . . . . . . . . . . . . . . . . . . . . . . . . . . . . . . . . . . . . . . . . . . . . . . . . . . . . . . . 2% 6%Total Comparable Store Sales . . . . . . . . . . . . . . . . . . . . . . . . . . . . . . . . . . . . . . . . . . . . . . . . . . . . . . . . —% 6%
(a) The percentage change in comparable sales represents direct and comparable store sales. The percentagechange in comparable store sales represents the change in sales at comparable stores only and excludes thechange in sales from our direct channels. A store is typically included in the calculation of comparable saleswhen it has been open or owned 12 months or more and it has not had a change in selling square footage of20% or more. Additionally, stores of a given brand are excluded if total selling square footage for the brandin the mall changes by 20% or more through the opening or closing of a second store. Comparable salesattributable to our international stores are calculated on a constant currency basis.
(b) Includes company-owned stores in the U.S. and Canada.
The results by segment are as follows:
Victoria’s Secret
For the fourth quarter of 2016, net sales decreased $25 million to $2.589 billion, comparable sales decreased 3%and comparable store sales decreased 2%. Net sales decreased primarily driven by a decline in total core bra salesdue to lower average unit retail prices and decreases in swim and apparel due to a strategic decision to exit thesecategories. These results were partially offset by increases in PINK, sport and beauty driven by compellingmerchandise assortment that incorporated newness, innovation and fashion.
The decrease in comparable store sales was driven by a lower average unit retail and the impact of exitedcategories.
35
Fo
rm10-K

Bath & Body Works
For the fourth quarter of 2016, net sales increased $100 million to $1.620 billion, comparable sales increased 5%and comparable store sales increased 2%. Net sales increased in most categories, including home fragrance andSignature Collection, which incorporated newness, innovation, and fashion.
The increase in comparable store sales was primarily driven by a higher average unit retail.
Victoria’s Secret and Bath & Body Works International
For the fourth quarter of 2016, net sales increased $12 million to $124 million, primarily related to newlyacquired Victoria’s Secret Beauty and Accessories stores in Greater China, company-owned Victoria’s Secretstores in the U.K., and additional stores opened by our partners. These results were partially offset by softness inthe Victoria’s Secret Beauty and Accessories business and the negative impacts of foreign currency at Victoria’sSecret U.K.
Other
For the fourth quarter of 2016, net sales increased $7 million to $156 million primarily due to increases in our LaSenza and Henri Bendel direct channels, partially offset by store closures at La Senza.
Gross Profit
For the fourth quarter of 2016, our gross profit decreased $58 million to $1.944 billion, and our gross profit rate(expressed as a percentage of net sales) decreased to 43.3% from 45.6% primarily as a result of:
Victoria’s Secret
For the fourth quarter of 2016, the gross profit decrease was driven by a decline in merchandise margin primarilydue to promotional events to drive traffic and proactively manage inventory, and a decline in beauty as wereposition the category. Buying and occupancy expenses decreased primarily driven by a decrease in cataloguecosts and other cost reductions from strategic actions taken in the first quarter, partially offset by an increase inoccupancy expenses due to investments in store real estate.
The gross profit rate decrease was driven primarily by increases in the promotional and clearance activitydescribed above, partially offset by lower buying and occupancy expenses due to decreased catalogue costs.
Bath & Body Works
For the fourth quarter of 2016, the gross profit increase was driven by higher merchandise margin dollarsprimarily related to the increase in net sales. The increase in merchandise margin was partially offset by anincrease in occupancy expenses due to investments in store real estate.
The gross profit rate decrease was driven by an increase in occupancy expenses primarily due to investments instore real estate.
Victoria’s Secret and Bath & Body Works International
For the fourth quarter of 2016, the gross profit decrease was driven by higher occupancy expenses due toinvestments in store real estate in Greater China and the U.K., softness in the Victoria’s Secret Beauty andAccessories business, and the negative impacts of foreign currency on merchandise margin at Victoria’s Secret U.K.These decreases were partially offset by increased merchandise margin dollars generated from higher net sales.
36

The gross profit rate decrease was driven by an increase in occupancy expenses due to investments in store realestate, a decrease in the merchandise margin rate at Victoria’s Secret Beauty and Accessories and the negativeimpacts of foreign currency at Victoria’s Secret U.K.
General, Administrative and Store Operating Expenses
For the fourth quarter of 2016, our general, administrative and store operating expenses increased $32 million to$956 million primarily driven by increased store selling expenses related to higher sales volume and investmentsin selling to improve the customer experience, increased marketing to drive traffic and corporate expenses inGreater China, partially offset by lower incentive compensation expense.
The general, administrative and store operating expense rate increased to 21.3% from 21.0% due to store selling,marketing and our investment in China, partially offset by a reduction in incentive compensation expense.
Other Income and Expense
Interest Expense
The following table provides the average daily borrowings and average borrowing rates for the fourth quarter of2016 and 2015:
Fourth Quarter 2016 2015
Average daily borrowings (in millions) . . . . . . . . . . . . . . . . . . . . . . . . . . . . . . . . . . . . . . . . . . . . $5,779 $5,756Average borrowing rate (in percentages) . . . . . . . . . . . . . . . . . . . . . . . . . . . . . . . . . . . . . . . . . . . 6.9% 6.8%
For the fourth quarter of 2016, our interest expense increased $1 million to $98 million primarily due to anincrease in the average borrowing rate.
Provision for Income Taxes
For the fourth quarter of 2016, our effective tax rate decreased to 29.2% from 35.2%. The 2016 rate was lowerthan our combined estimated federal and state statutory rate primarily due to the resolution of certain tax matters.The 2015 rate was lower than our combined estimated federal and state statutory rate primarily due to foreignearnings taxed at a rate lower than our combined estimated federal and state statutory rate.
Results of Operations—2015 Compared to 2014
Operating Income
The following table provides our segment operating income (loss) and operating income rates (expressed as apercentage of net sales) for 2015 in comparison to 2014:
Operating Income Rate
2015 2014 2015 2014
(in millions)
Victoria’s Secret . . . . . . . . . . . . . . . . . . . . . . . . . . . . . . . . . . . . . . . . . $1,391 $1,271 18.1% 17.6%Bath & Body Works . . . . . . . . . . . . . . . . . . . . . . . . . . . . . . . . . . . . . . 858 737 23.9% 22.0%Victoria’s Secret and Bath & Body Works International . . . . . . . . . . 88 78 22.8% 23.2%Other (a) . . . . . . . . . . . . . . . . . . . . . . . . . . . . . . . . . . . . . . . . . . . . . . . (145) (133) (28.5)% (23.8)%
Total Operating Income . . . . . . . . . . . . . . . . . . . . . . . . . . . . . . . . . . . $2,192 $1,953 18.0% 17.1%
(a) Includes Mast Global, La Senza, Henri Bendel and Corporate.
For 2015, operating income increased $239 million to $2.192 billion, and the operating income rate increased to18.0% from 17.1%. The drivers of the operating income results are discussed in the following sections.
37
Fo
rm10-K

Net Sales
The following table provides net sales for 2015 in comparison to 2014:
2015 2014 % Change
(in millions)
Victoria’s Secret Stores (a) . . . . . . . . . . . . . . . . . . . . . . . . . . . . . . . . . . . . . . . . . . . $ 6,112 $ 5,700 7%Victoria’s Secret Direct . . . . . . . . . . . . . . . . . . . . . . . . . . . . . . . . . . . . . . . . . . . . . 1,560 1,507 3%
Total Victoria’s Secret . . . . . . . . . . . . . . . . . . . . . . . . . . . . . . . . . . . . . . . . . . 7,672 7,207 6%Bath & Body Works Stores (a) . . . . . . . . . . . . . . . . . . . . . . . . . . . . . . . . . . . . . . . . 3,225 3,048 6%Bath & Body Works Direct . . . . . . . . . . . . . . . . . . . . . . . . . . . . . . . . . . . . . . . . . . 362 302 20%
Total Bath & Body Works . . . . . . . . . . . . . . . . . . . . . . . . . . . . . . . . . . . . . . . 3,587 3,350 7%Victoria’s Secret and Bath & Body Works International . . . . . . . . . . . . . . . . . . . . 385 336 15%Other (b) . . . . . . . . . . . . . . . . . . . . . . . . . . . . . . . . . . . . . . . . . . . . . . . . . . . . . . . . . 510 561 (9%)
Total Net Sales . . . . . . . . . . . . . . . . . . . . . . . . . . . . . . . . . . . . . . . . . . . . . . . . $12,154 $11,454 6%
(a) Includes company-owned stores in the U.S. and Canada.(b) Includes Mast Global, La Senza, Henri Bendel and Corporate.
The following table provides a reconciliation of net sales for 2014 to 2015:
Victoria’sSecret
Bath &Body Works
Victoria’sSecret
andBath & Body
WorksInternational Other Total
2014 Net Sales . . . . . . . . . . . . . . . . . . . . . . . . . . . . . . . . . $7,207 $3,350 $336 $561 $11,454Comparable Store Sales . . . . . . . . . . . . . . . . . . . . . . . 256 156 8 11 431Sales Associated with New, Closed and Non-
comparable Remodeled Stores, Net . . . . . . . . . . . 190 50 25 (20) 245Foreign Currency Translation . . . . . . . . . . . . . . . . . . (34) (29) (9) (34) (106)Direct Channels . . . . . . . . . . . . . . . . . . . . . . . . . . . . . 53 60 — 12 125International Wholesale, Royalty and Other . . . . . . . — — 25 (20) 5
2015 Net Sales . . . . . . . . . . . . . . . . . . . . . . . . . . . . . . . . . $7,672 $3,587 $385 $510 $12,154
The following table compares 2015 comparable sales to 2014:
2015 2014
Comparable Sales (Stores and Direct) (a)Victoria’s Secret (b) . . . . . . . . . . . . . . . . . . . . . . . . . . . . . . . . . . . . . . . . . . . . . . . . . . . . . . . . . . . . . . . . 5% 2%Bath & Body Works (b) . . . . . . . . . . . . . . . . . . . . . . . . . . . . . . . . . . . . . . . . . . . . . . . . . . . . . . . . . . . . . 7% 7%Total Comparable Sales . . . . . . . . . . . . . . . . . . . . . . . . . . . . . . . . . . . . . . . . . . . . . . . . . . . . . . . . . . . . . 5% 4%Comparable Store Sales (a)Victoria’s Secret (b) . . . . . . . . . . . . . . . . . . . . . . . . . . . . . . . . . . . . . . . . . . . . . . . . . . . . . . . . . . . . . . . . 5% 3%Bath & Body Works (b) . . . . . . . . . . . . . . . . . . . . . . . . . . . . . . . . . . . . . . . . . . . . . . . . . . . . . . . . . . . . . 5% 6%Total Comparable Store Sales . . . . . . . . . . . . . . . . . . . . . . . . . . . . . . . . . . . . . . . . . . . . . . . . . . . . . . . . 5% 4%
(a) The percentage change in comparable sales represents direct and comparable store sales. The percentagechange in comparable store sales represents the change in sales at comparable stores only and excludes thechange in sales from our direct channels. A store is typically included in the calculation of comparable saleswhen it has been open or owned 12 months or more and it has not had a change in selling square footage of20% or more. Additionally, stores of a given brand are excluded if total selling square footage for the brand
38

in the mall changes by 20% or more through the opening or closing of a second store. Comparable salesattributable to our international stores are calculated on a constant currency basis.
(b) Includes company-owned stores in the U.S. and Canada.
The results by segment are as follows:
Victoria’s Secret
For 2015, net sales increased $465 million to $7.672 billion, comparable sales increased 5% and comparablestore sales increased 5%. The net sales result was primarily driven by:
• At Victoria’s Secret Stores, net sales increased 7% due to the performance in PINK, core lingerie and sportdriven by a compelling merchandise assortment that incorporated newness, innovation and fashion, as wellas in-store execution. These results were partially offset by a decrease in beauty driven by the repositioningof this category and the exit of make-up.
• At Victoria’s Secret Direct, net sales increased 3% due to the performance in PINK, core lingerie and sportdriven by a compelling merchandise assortment that incorporated newness, innovation and fashion. Theresults were partially offset by a decrease in non go-forward apparel.
The increase in comparable store sales was driven by higher average dollar sales and an increase in totaltransactions.
Bath & Body Works
For 2015, net sales increased $237 million to $3.587 billion, comparable sales increased 7% and comparablestore sales increased 5%. At both Bath & Body Works Stores and Bath & Body Works Direct, net sales increasedacross most categories including home fragrance, Signature Collection and soaps and sanitizers, which allincorporated newness and innovation.
The increase in comparable store sales was driven by higher average dollar sales and an increase in totaltransactions.
Victoria’s Secret and Bath & Body Works International
For 2015, net sales increased $49 million to $385 million primarily related to company-owned Victoria’s Secretstores in the U.K. and additional stores opened by our partners. These results were partially offset by the negativeimpacts of foreign currency at Victoria’s Secret Beauty and Accessories and Victoria’s Secret U.K.
Other
For 2015, net sales decreased $51 million to $510 million primarily related to a decrease in net sales at La Senzadue to store closures and the negative impacts of foreign currency.
Gross Profit
For 2015, our gross profit increased $396 million to $5.204 billion, and our gross profit rate (expressed as apercentage of net sales) increased to 42.8% from 42.0% primarily as a result of:
Victoria’s Secret
For 2015, gross profit increased primarily driven by:
• At Victoria’s Secret Stores, gross profit increased due to higher merchandise margin dollars as a result ofthe increase in net sales. The increase in merchandise margin dollars was partially offset by higher buying
39
Fo
rm10-K

and occupancy expenses due to an increase in occupancy expense driven by higher net sales andinvestments in store real estate.
• At Victoria’s Secret Direct, gross profit increased due to higher merchandise margin dollars as a result ofthe increase in net sales. The increase in merchandise margin was partially offset by higher buying andoccupancy expenses driven by investments in our online customer shopping experience.
The gross profit rate increase was primarily driven by an increase in the merchandise margin rate at Victoria’sSecret Direct due to increased sales in our core categories.
Bath & Body Works
For 2015, gross profit increased primarily driven by:
• At Bath & Body Works Stores, gross profit increased due to higher merchandise margin dollars related tothe increase in net sales. The increase in merchandise margin dollars was partially offset by higher buyingand occupancy expenses due to an increase in occupancy expense driven by higher net sales andinvestments in store real estate.
• At Bath & Body Works Direct, gross profit increased due to higher merchandise margin dollars as a resultof the increase in net sales. The increase in merchandise margin was partially offset by higher buying andoccupancy expenses due to an increase in fulfillment costs as a result of the increase in net sales.
The gross profit rate increase was primarily driven by an increase in the merchandise margin rate due tofavorable product pricing.
Victoria’s Secret and Bath & Body Works International
For 2015, gross profit increased due to higher merchandise margin dollars as a result of the increase in net salesdue to the opening of new stores.
The gross profit rate decrease was primarily driven by a decrease in the merchandise margin rate due to thenegative impacts of foreign currency.
General, Administrative and Store Operating Expenses
For 2015, our general, administrative and store operating expenses increased $157 million to $3.012 billionprimarily driven by an increase in store selling expenses related to higher sales volumes and investments in storeselling to improve the customer experience.
The general, administrative and store operating expense rate decreased to 24.8% from 24.9% primarily due toleverage associated with higher net sales.
Other Income and Expenses
Interest Expense
The following table provides the average daily borrowings and average borrowing rates for 2015 and 2014:
2015 2014
Average daily borrowings (in millions) . . . . . . . . . . . . . . . . . . . . . . . . . . . . . . . . . . . . . . . . . . . . $5,005 $4,910Average borrowing rate (in percentages) . . . . . . . . . . . . . . . . . . . . . . . . . . . . . . . . . . . . . . . . . . . 6.7% 6.6%
For 2015, our interest expense increased $10 million to $334 million primarily due to an increase in averageborrowings related to the October 2015 $1 billion issuance of our 2035 Notes.
40
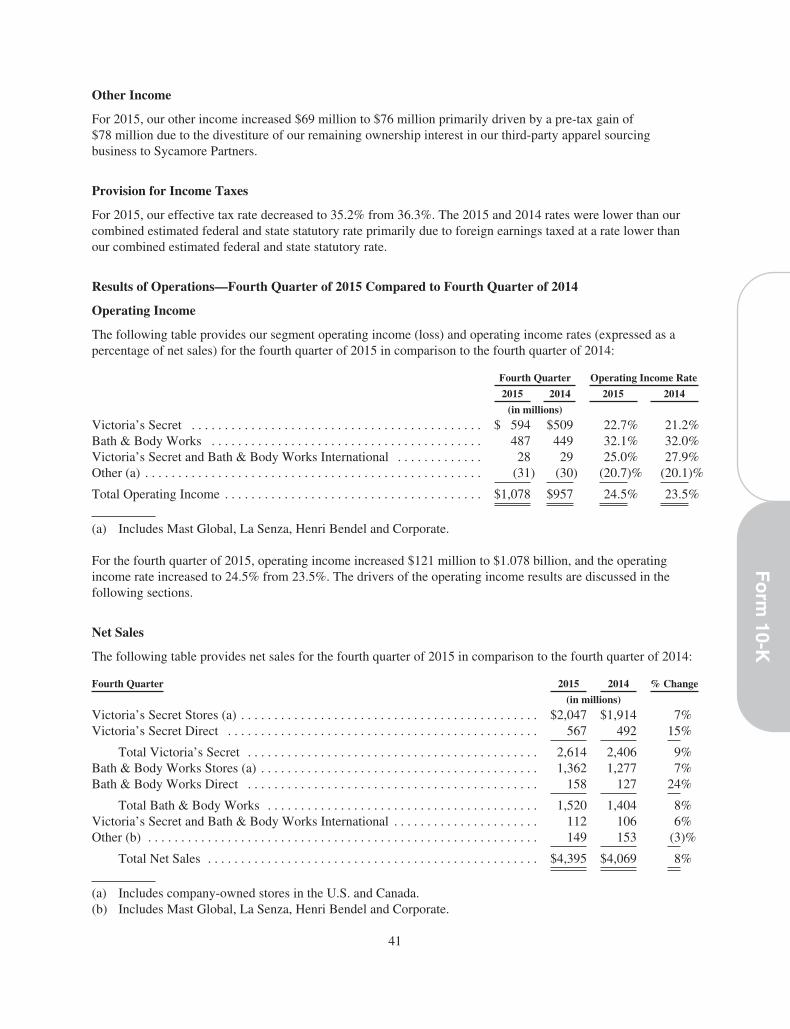
Other Income
For 2015, our other income increased $69 million to $76 million primarily driven by a pre-tax gain of$78 million due to the divestiture of our remaining ownership interest in our third-party apparel sourcingbusiness to Sycamore Partners.
Provision for Income Taxes
For 2015, our effective tax rate decreased to 35.2% from 36.3%. The 2015 and 2014 rates were lower than ourcombined estimated federal and state statutory rate primarily due to foreign earnings taxed at a rate lower thanour combined estimated federal and state statutory rate.
Results of Operations—Fourth Quarter of 2015 Compared to Fourth Quarter of 2014
Operating Income
The following table provides our segment operating income (loss) and operating income rates (expressed as apercentage of net sales) for the fourth quarter of 2015 in comparison to the fourth quarter of 2014:
Fourth Quarter Operating Income Rate
2015 2014 2015 2014
(in millions)
Victoria’s Secret . . . . . . . . . . . . . . . . . . . . . . . . . . . . . . . . . . . . . . . . . . . . $ 594 $509 22.7% 21.2%Bath & Body Works . . . . . . . . . . . . . . . . . . . . . . . . . . . . . . . . . . . . . . . . . 487 449 32.1% 32.0%Victoria’s Secret and Bath & Body Works International . . . . . . . . . . . . . 28 29 25.0% 27.9%Other (a) . . . . . . . . . . . . . . . . . . . . . . . . . . . . . . . . . . . . . . . . . . . . . . . . . . . (31) (30) (20.7)% (20.1)%
Total Operating Income . . . . . . . . . . . . . . . . . . . . . . . . . . . . . . . . . . . . . . . $1,078 $957 24.5% 23.5%
(a) Includes Mast Global, La Senza, Henri Bendel and Corporate.
For the fourth quarter of 2015, operating income increased $121 million to $1.078 billion, and the operatingincome rate increased to 24.5% from 23.5%. The drivers of the operating income results are discussed in thefollowing sections.
Net Sales
The following table provides net sales for the fourth quarter of 2015 in comparison to the fourth quarter of 2014:
Fourth Quarter 2015 2014 % Change
(in millions)
Victoria’s Secret Stores (a) . . . . . . . . . . . . . . . . . . . . . . . . . . . . . . . . . . . . . . . . . . . . . $2,047 $1,914 7%Victoria’s Secret Direct . . . . . . . . . . . . . . . . . . . . . . . . . . . . . . . . . . . . . . . . . . . . . . . 567 492 15%
Total Victoria’s Secret . . . . . . . . . . . . . . . . . . . . . . . . . . . . . . . . . . . . . . . . . . . . 2,614 2,406 9%Bath & Body Works Stores (a) . . . . . . . . . . . . . . . . . . . . . . . . . . . . . . . . . . . . . . . . . . 1,362 1,277 7%Bath & Body Works Direct . . . . . . . . . . . . . . . . . . . . . . . . . . . . . . . . . . . . . . . . . . . . 158 127 24%
Total Bath & Body Works . . . . . . . . . . . . . . . . . . . . . . . . . . . . . . . . . . . . . . . . . 1,520 1,404 8%Victoria’s Secret and Bath & Body Works International . . . . . . . . . . . . . . . . . . . . . . 112 106 6%Other (b) . . . . . . . . . . . . . . . . . . . . . . . . . . . . . . . . . . . . . . . . . . . . . . . . . . . . . . . . . . . 149 153 (3)%
Total Net Sales . . . . . . . . . . . . . . . . . . . . . . . . . . . . . . . . . . . . . . . . . . . . . . . . . . $4,395 $4,069 8%
(a) Includes company-owned stores in the U.S. and Canada.(b) Includes Mast Global, La Senza, Henri Bendel and Corporate.
41
Fo
rm10-K

The following table provides a reconciliation of net sales for the fourth quarter of 2014 to the fourth quarter of 2015:
Fourth QuarterVictoria’s
SecretBath & Body
Works
Victoria’sSecret
andBath & Body
WorksInternational Other Total
(in millions)
2014 Net Sales . . . . . . . . . . . . . . . . . . . . . . . . . . . . . . . . . . $2,406 $1,404 $106 $153 $4,069Comparable Store Sales . . . . . . . . . . . . . . . . . . . . . . . 92 71 2 5 170Sales Associated with New, Closed and Non-
comparable Remodeled Stores, Net . . . . . . . . . . . . 52 27 8 (3) 84Foreign Currency Translation . . . . . . . . . . . . . . . . . . . (11) (13) (2) (10) (36)Direct Channels . . . . . . . . . . . . . . . . . . . . . . . . . . . . . 75 31 — 5 111International, Wholesale, Royalty and Other . . . . . . . — — (2) (1) (3)
2015 Net Sales . . . . . . . . . . . . . . . . . . . . . . . . . . . . . . . . . . $2,614 $1,520 $112 $149 $4,395
The following table compares fourth quarter of 2015 comparable sales to fourth quarter of 2014:
Fourth Quarter 2015 2014
Comparable Sales (Stores and Direct) (a)Victoria’s Secret (b) . . . . . . . . . . . . . . . . . . . . . . . . . . . . . . . . . . . . . . . . . . . . . . . . . . . . . . . . . . . . . . 7% 2%Bath & Body Works (b) . . . . . . . . . . . . . . . . . . . . . . . . . . . . . . . . . . . . . . . . . . . . . . . . . . . . . . . . . . . 7% 9%Total Comparable Sales . . . . . . . . . . . . . . . . . . . . . . . . . . . . . . . . . . . . . . . . . . . . . . . . . . . . . . . . . . . 8% 5%
Comparable Store Sales (a)Victoria’s Secret (b) . . . . . . . . . . . . . . . . . . . . . . . . . . . . . . . . . . . . . . . . . . . . . . . . . . . . . . . . . . . . . . 5% 4%Bath & Body Works (b) . . . . . . . . . . . . . . . . . . . . . . . . . . . . . . . . . . . . . . . . . . . . . . . . . . . . . . . . . . . 6% 8%Total Comparable Store Sales . . . . . . . . . . . . . . . . . . . . . . . . . . . . . . . . . . . . . . . . . . . . . . . . . . . . . . 6% 6%
(a) The percentage change in comparable sales represents direct and comparable store sales. The percentagechange in comparable store sales represents the change in sales at comparable stores only and excludes thechange in sales from our direct channels. A store is typically included in the calculation of comparable saleswhen it has been open or owned 12 months or more and it has not had a change in selling square footage of20% or more. Additionally, stores of a given brand are excluded if total selling square footage for the brandin the mall changes by 20% or more through the opening or closing of a second store. Comparable salesattributable to our international stores are calculated on a constant currency basis.
(b) Includes company-owned stores in the U.S. and Canada.
The results by segment are as follows:
Victoria’s Secret
For the fourth quarter of 2015, net sales increased $208 million to $2.614 billion, comparable sales increased 7%and comparable store sales increased 5%. The net sales result was primarily driven by:
• At Victoria’s Secret Stores, net sales increased 7% due to the performance in PINK, core lingerie and sleepdriven by a compelling merchandise assortment that incorporated newness, innovation and fashion, as wellas in-store execution. These results were partially offset by a decrease in beauty driven by the repositioningof this category.
• At Victoria’s Secret Direct, net sales increased 15% due to the performance in PINK, core lingerie, sport andsleep driven by a compelling merchandise assortment that incorporated newness, innovation and fashion.
The increase in comparable store sales was driven by higher average dollar sales.
42

Bath & Body Works
For the fourth quarter of 2015, net sales increased $116 million to $1.520 billion, comparable sales increased 7%and comparable store sales increased 6%. At both Bath & Body Works Stores and Bath & Body Works Direct,net sales increased across most categories including home fragrance, Signature Collection and soaps andsanitizers.
The increase in comparable store sales was driven by higher average dollar sales and an increase in totaltransactions.
Victoria’s Secret and Bath & Body Works International
For the fourth quarter of 2015, net sales increased $6 million to $112 million primarily related to company-owned Victoria’s Secret stores in the U.K. and additional stores opened in other parts of the world by ourpartners. These results were partially offset by a decrease in net sales at our Victoria’s Secret Beauty andAccessories business due to the negative impacts of foreign currency, repositioning of the beauty category and ageneral decline in travel retail and tourism.
Other
For the fourth quarter of 2015, net sales decreased $4 million to $149 million primarily related to a decrease innet sales at La Senza due to store closures and the negative impacts of foreign currency.
Gross Profit
For the fourth quarter of 2015, our gross profit increased $167 million to $2.002 billion, and our gross profit rate(expressed as a percentage of net sales) increased to 45.6% from 45.1% primarily as a result of:
Victoria’s Secret
For the fourth quarter of 2015, gross profit increased primarily driven by:
• At Victoria’s Secret Stores, gross profit increased due to higher merchandise margin dollars as a result ofthe increase in net sales. The increase in merchandise margin dollars was partially offset by higher buyingand occupancy expenses due to an increase in occupancy expense driven by investments in store real estate.
• At Victoria’s Secret Direct, gross profit increased due to higher merchandise margin dollars as a result ofthe increase in net sales in our core categories as well as a decrease in buying and occupancy expenses dueto a decrease in catalogue costs.
The gross profit rate increase was primarily driven by an increase in the merchandise margin rate at Victoria’sSecret Direct due to increased sales in our core categories and a decrease in the buying and occupancy expenserate due to the leverage associated with the decrease in catalogue costs.
Bath & Body Works
For the fourth quarter of 2015, gross profit increased primarily driven by:
• At Bath & Body Works Stores, gross profit increased due to higher merchandise margin dollars related tothe increase in net sales. The increase in merchandise margin dollars was partially offset by higher buyingand occupancy expenses due to an increase in occupancy expense driven by higher net sales andinvestments in store real estate.
• At Bath & Body Works Direct, gross profit increased due to higher merchandise margin dollars as a resultof the increase in net sales. The increase in merchandise margin was partially offset by higher buying andoccupancy expenses due to an increase in fulfillment costs as a result of the increase in net sales.
43
Fo
rm10-K

The gross profit rate increase was primarily driven by an increase in the merchandise margin rate due tofavorable product pricing, partially offset by an increase in the buying and occupancy expense rate due todeleverage associated with the increase in occupancy expense mentioned above.
Victoria’s Secret and Bath & Body Works International
For the fourth quarter of 2015, gross profit decreased due to a decrease in the merchandise margin dollars atVictoria’s Secret Beauty and Accessories due to the negative impacts of foreign currency, repositioning of thebeauty category and a general decline in travel retail and tourism.
The gross profit rate decrease was primarily driven by a decrease in the merchandise margin rate due to thenegative impacts of foreign currency at Victoria’s Secret Beauty and Accessories.
General, Administrative and Store Operating Expenses
For the fourth quarter of 2015, our general, administrative and store operating expenses increased $46 million to$924 million primarily driven by an increase in store selling expenses related to higher sales volumes andinvestments in store selling to improve the customer experience.
The general, administrative and store operating expense rate decreased to 21.0% from 21.6% primarily due toleverage associated with higher net sales.
Other Income and Expense
Interest Expense
The following table provides the average daily borrowings and average borrowing rates for the fourth quarter of2015 and 2014:
Fourth Quarter 2015 2014
Average daily borrowings (in millions) . . . . . . . . . . . . . . . . . . . . . . . . . . . . . . . . . . . . . . . . . . . . $5,756 $4,750Average borrowing rate (in percentages) . . . . . . . . . . . . . . . . . . . . . . . . . . . . . . . . . . . . . . . . . . . 6.8% 6.6%
For the fourth quarter of 2015, our interest expense increased $19 million to $97 million primarily due to anincrease in average borrowings related to the October 2015 $1 billion issuance of our 2035 Notes, as well as anincrease in the average borrowing rate.
Provision for Income Taxes
For the fourth quarter of 2015, our effective tax rate decreased to 35.2% from 35.8%. The 2015 and 2014 rateswere lower than our combined estimated federal and state statutory rate primarily due to foreign earnings taxed ata rate lower than our combined estimated federal and state statutory rate.
FINANCIAL CONDITION
Liquidity and Capital Resources
Liquidity, or access to cash, is an important factor in determining our financial stability. We are committed tomaintaining adequate liquidity. Cash generated from our operating activities provides the primary resources tosupport current operations, growth initiatives, seasonal funding requirements and capital expenditures. Our cashprovided from operations is impacted by our net income and working capital changes. Our net income isimpacted by, among other things, sales volume, seasonal sales patterns, success of new product introductions,profit margins and income taxes. Historically, sales are higher during the fourth quarter of the fiscal year due toseasonal and holiday-related sales patterns. Generally, our need for working capital peaks during the summer andfall months as inventory builds in anticipation of the holiday period.
44

We believe in returning value to our shareholders through a combination of dividends and share repurchaseprograms. During 2016, we have paid $1.268 billion in regular and special dividends and repurchased $438million of our common stock. We use cash flow generated from operating and financing activities to fund ourdividends and share repurchase programs.
Our total cash and cash equivalents held by foreign subsidiaries were $371 million as of January 28, 2017. Undercurrent tax laws and regulations, if cash and cash equivalents held outside the U.S. are repatriated to the U.S., incertain circumstances we may be subject to additional income taxes.
The following table provides our debt balance, net of debt issuance costs and unamortized discounts, as ofJanuary 28, 2017 and January 30, 2016:
January 28,2017
January 30,2016
(in millions)
Senior Unsecured Debt with Subsidiary Guarantee$1 billion, 6.875% Fixed Interest Rate Notes due November 2035 (“2035 Notes”) . . . . . $ 989 $ 988$1 billion, 5.625% Fixed Interest Rate Notes due February 2022 (“2022 Notes”) . . . . . . 992 991$1 billion, 6.625% Fixed Interest Rate Notes due April 2021 (“2021 Notes”) . . . . . . . . . 992 990$700 million, 6.75% Fixed Interest Rate Notes due July 2036 (“2036 Notes”) . . . . . . . . . 692 —$500 million, 5.625% Fixed Interest Rate Notes due October 2023 (“2023 Notes”) . . . . . 497 496$500 million, 8.50% Fixed Interest Rate Notes due June 2019 (“2019 Notes”) (a) . . . . . . 496 499$400 million, 7.00% Fixed Interest Rate Notes due May 2020 (“2020 Notes”) . . . . . . . . 397 396
Total Senior Unsecured Debt with Subsidiary Guarantee . . . . . . . . . . . . . . . . . . . . . . . . . $5,055 $4,360
Senior Unsecured Debt$350 million, 6.95% Fixed Interest Rate Debentures due March 2033 (“2033 Notes”) . . $ 348 $ 348$300 million, 7.60% Fixed Interest Rate Notes due July 2037 (“2037 Notes”) . . . . . . . . . 297 297$700 million, 6.90% Fixed Interest Rate Notes due July 2017 (“2017 Notes”) (b) . . . . . . — 709Foreign Facilities . . . . . . . . . . . . . . . . . . . . . . . . . . . . . . . . . . . . . . . . . . . . . . . . . . . . . . . . 36 7
Total Senior Unsecured Debt . . . . . . . . . . . . . . . . . . . . . . . . . . . . . . . . . . . . . . . . . . . . . . . $ 681 $1,361Total . . . . . . . . . . . . . . . . . . . . . . . . . . . . . . . . . . . . . . . . . . . . . . . . . . . . . . . . . . . . . . . . . . $5,736 $5,721Current Portion of Long-term Debt . . . . . . . . . . . . . . . . . . . . . . . . . . . . . . . . . . . . . . . . . . (36) (6)
Total Long-term Debt, Net of Current Portion . . . . . . . . . . . . . . . . . . . . . . . . . . . . . . . . . . $5,700 $5,715
(a) The balances include a fair value interest rate hedge adjustment which increased the debt balance by$2 million as of January 28, 2017 and $8 million as of January 30, 2016.
(b) The balance includes a fair value interest rate hedge adjustment which increased the debt balance by$10 million as of January 30, 2016.
Issuance of Notes
In June 2016, we issued $700 million of 6.75% notes due in July 2036. The obligation to pay principal andinterest on these notes is jointly and severally guaranteed on a full and unconditional basis by certain of our100% owned subsidiaries (the “Guarantors”). The proceeds from the issuance were $692 million, which were netof issuance costs of $8 million. These issuance costs are being amortized through the maturity date of July 2036and are included within Long-term Debt on the January 28, 2017 Consolidated Balance Sheet.
In October 2015, we issued $1 billion of 6.875% notes due in November 2035. The obligation to pay principaland interest on these notes is jointly and severally guaranteed on a full and unconditional basis by ourGuarantors. The proceeds from the issuance were $988 million, which were net of issuance costs of $12 million.These issuance costs are being amortized through the maturity date of November 2035 and are included withinLong-term Debt on the Consolidated Balance Sheets.
45
Fo
rm10-K

Repurchase of Notes
In July 2016, we used the proceeds from the 2036 Notes to repurchase the $700 million 2017 Notes for$742 million. The pre-tax loss on extinguishment of this debt was $36 million (after-tax net loss of $22 million),which is net of gains of $7 million related to terminated interest rate swaps associated with the 2017 Notes. Thisloss is included in Other Income in the 2016 Consolidated Statement of Income.
Debt Facilities
We maintain a secured revolving credit facility (“Revolving Facility”). The Revolving Facility has aggregateavailability of $1 billion and expires July 18, 2019. The fees related to committed and unutilized amounts are0.30% per annum, and the fees related to outstanding letters of credit are 1.50% per annum. In addition, theinterest rate on outstanding U.S. dollar borrowings or British pound borrowings is LIBOR plus 1.50% perannum. The interest rate on outstanding Canadian dollar borrowings is CDOR plus 1.50% per annum.
The Revolving Facility contains fixed charge coverage and debt to EBITDA financial covenants. We are requiredto maintain a fixed charge coverage ratio of not less than 1.75 to 1.00 and a consolidated debt to consolidatedEBITDA ratio not exceeding 4.00 to 1.00 for the most recent four-quarter period. In addition, the RevolvingFacility provides that investments and restricted payments may be made, without limitation on amount, if (a) atthe time of and after giving effect to such investment or restricted payment the ratio of consolidated debt toconsolidated EBITDA for the most recent four-quarter period is less than 3.00 to 1.00 and (b) no default or eventof default exists. As of January 28, 2017, we were in compliance with both of our financial covenants and theratio of consolidated debt to consolidated EBITDA was less than 3.00 to 1.00.
As of January 28, 2017, there were no borrowings outstanding under the Revolving Facility.
The Revolving Facility supports our letter of credit program. We had $8 million of outstanding letters of credit asof January 28, 2017 that reduce our remaining availability under our Revolving Facility.
In addition to the Revolving Facility, we maintain various revolving and term loan bank facilities withavailability totaling $100 million to support our foreign operations (“Foreign Facilities”). Current borrowings onthese Foreign Facilities mature between February 8, 2017 and January 24, 2018. The interest rates on outstandingborrowings are based upon the applicable benchmark rate for the currency of each borrowing.
During 2016, we borrowed $35 million and made payments of $6 million under the Foreign Facilities. Themaximum daily amount outstanding at any point in time during 2016 was $36 million.
Interest Rate Swap Arrangements
We have interest rate swap arrangements related to $300 million of the outstanding 2019 Notes that aredesignated as interest rate fair value hedges as of January 28, 2017. The interest rate swap arrangementseffectively convert the fixed interest rate on the related debt to a variable interest rate based on LIBOR plus afixed percentage. The changes in the fair value of the interest rate swaps have an equal and offsetting impact tothe carrying value of the debt on the balance sheet. The differential to be paid or received on the interest rateswap arrangements is accrued and recognized as an adjustment to interest expense.
In the past, we entered into interest rate swap arrangements on the 2017 Notes. In 2016, we terminated ourinterest rate designated fair value hedges in conjunction with the repurchase of the 2017 Notes.
For information related to our interest rate swap arrangements, see Note 13 to the Consolidated FinancialStatements included in Item 8. Financial Statements and Supplemental Data.
46
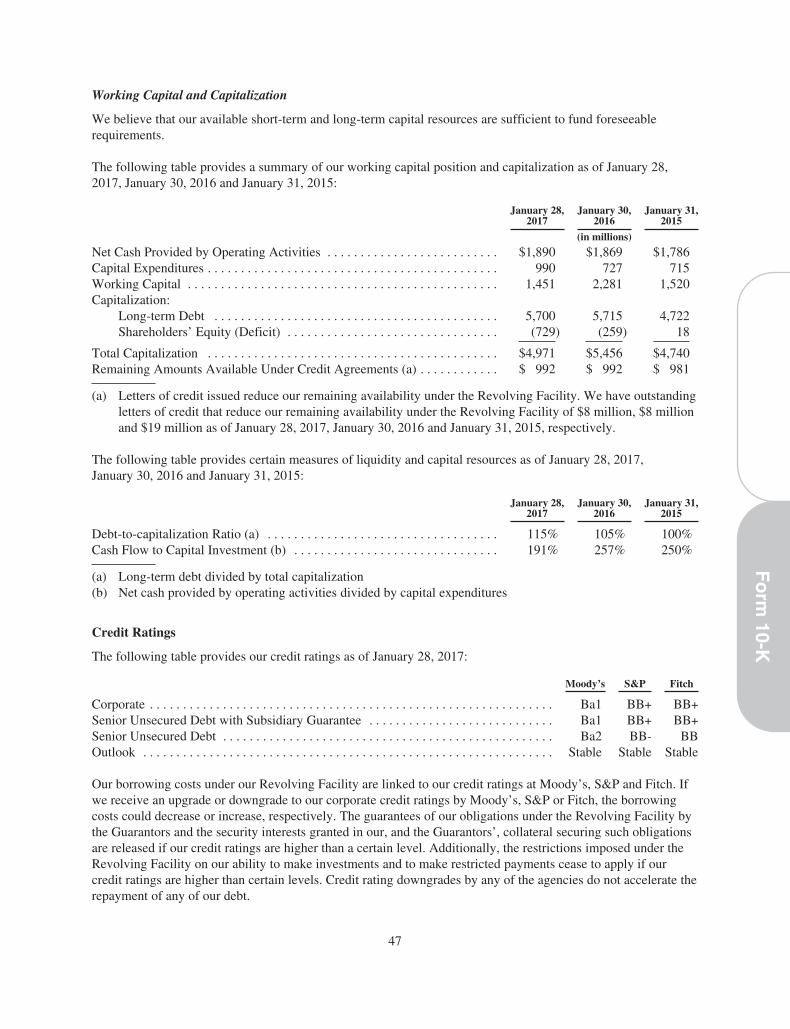
Working Capital and Capitalization
We believe that our available short-term and long-term capital resources are sufficient to fund foreseeablerequirements.
The following table provides a summary of our working capital position and capitalization as of January 28,2017, January 30, 2016 and January 31, 2015:
January 28,2017
January 30,2016
January 31,2015
(in millions)
Net Cash Provided by Operating Activities . . . . . . . . . . . . . . . . . . . . . . . . . . $1,890 $1,869 $1,786Capital Expenditures . . . . . . . . . . . . . . . . . . . . . . . . . . . . . . . . . . . . . . . . . . . . 990 727 715Working Capital . . . . . . . . . . . . . . . . . . . . . . . . . . . . . . . . . . . . . . . . . . . . . . . 1,451 2,281 1,520Capitalization:
Long-term Debt . . . . . . . . . . . . . . . . . . . . . . . . . . . . . . . . . . . . . . . . . . . 5,700 5,715 4,722Shareholders’ Equity (Deficit) . . . . . . . . . . . . . . . . . . . . . . . . . . . . . . . . (729) (259) 18
Total Capitalization . . . . . . . . . . . . . . . . . . . . . . . . . . . . . . . . . . . . . . . . . . . . $4,971 $5,456 $4,740Remaining Amounts Available Under Credit Agreements (a) . . . . . . . . . . . . $ 992 $ 992 $ 981
(a) Letters of credit issued reduce our remaining availability under the Revolving Facility. We have outstandingletters of credit that reduce our remaining availability under the Revolving Facility of $8 million, $8 millionand $19 million as of January 28, 2017, January 30, 2016 and January 31, 2015, respectively.
The following table provides certain measures of liquidity and capital resources as of January 28, 2017,January 30, 2016 and January 31, 2015:
January 28,2017
January 30,2016
January 31,2015
Debt-to-capitalization Ratio (a) . . . . . . . . . . . . . . . . . . . . . . . . . . . . . . . . . . . 115% 105% 100%Cash Flow to Capital Investment (b) . . . . . . . . . . . . . . . . . . . . . . . . . . . . . . . 191% 257% 250%
(a) Long-term debt divided by total capitalization(b) Net cash provided by operating activities divided by capital expenditures
Credit Ratings
The following table provides our credit ratings as of January 28, 2017:
Moody’s S&P Fitch
Corporate . . . . . . . . . . . . . . . . . . . . . . . . . . . . . . . . . . . . . . . . . . . . . . . . . . . . . . . . . . . . . Ba1 BB+ BB+Senior Unsecured Debt with Subsidiary Guarantee . . . . . . . . . . . . . . . . . . . . . . . . . . . . Ba1 BB+ BB+Senior Unsecured Debt . . . . . . . . . . . . . . . . . . . . . . . . . . . . . . . . . . . . . . . . . . . . . . . . . . Ba2 BB- BBOutlook . . . . . . . . . . . . . . . . . . . . . . . . . . . . . . . . . . . . . . . . . . . . . . . . . . . . . . . . . . . . . . Stable Stable Stable
Our borrowing costs under our Revolving Facility are linked to our credit ratings at Moody’s, S&P and Fitch. Ifwe receive an upgrade or downgrade to our corporate credit ratings by Moody’s, S&P or Fitch, the borrowingcosts could decrease or increase, respectively. The guarantees of our obligations under the Revolving Facility bythe Guarantors and the security interests granted in our, and the Guarantors’, collateral securing such obligationsare released if our credit ratings are higher than a certain level. Additionally, the restrictions imposed under theRevolving Facility on our ability to make investments and to make restricted payments cease to apply if ourcredit ratings are higher than certain levels. Credit rating downgrades by any of the agencies do not accelerate therepayment of any of our debt.
47
Fo
rm10-K

Common Stock Share Repurchases
Our Board of Directors will determine share repurchase authorizations giving consideration to our levels of profitand cash flow, capital requirements, current and forecasted liquidity, the restrictions placed upon us by ourborrowing arrangements as well as financial and other conditions existing at the time. We use cash flowgenerated from operating and financing activities to fund our share repurchase programs. The timing and amountof any repurchases will be made at our discretion, taking into account a number of factors, including marketconditions.
Under the authority of our Board of Directors, we repurchased shares of our common stock under the followingrepurchase programs during the fiscal years 2016, 2015 and 2014:
Shares Repurchased Amount Repurchased
Average StockPrice ofShares
Repurchasedwithin
ProgramRepurchase Program Amount Authorized 2016 2015 2014 2016 2015 2014
(in millions) (in thousands) (in millions)
February 2016 . . . . . . . . . . . . . . $500 5,719 NA NA $438 NA NA $76.63June 2015 . . . . . . . . . . . . . . . . . . 250 NA 2,680 NA NA $233 NA $87.06February 2015 . . . . . . . . . . . . . . 250 NA 2,788 NA NA 250 NA $89.45November 2012 . . . . . . . . . . . . . 250 NA NA 1,317 NA NA $ 84 $54.02
Total . . . . . . . . . . . . . . . . . . . . . 5,719 5,468 1,317 $438 $483 $ 84
In February 2016, our Board of Directors approved a $500 million share repurchase program, which included the$17 million remaining under the June 2015 repurchase program.
In June 2015, our Board of Directors approved a $250 million share repurchase program, which included the$0.6 million remaining under the February 2015 repurchase program.
In February 2015, our Board of Directors approved a $250 million share repurchase program, which included the$91 million remaining under the November 2012 repurchase program.
There were $3 million of share repurchases reflected in Accounts Payable on the January 28, 2017 ConsolidatedBalance Sheet. There were no share repurchases reflected in Accounts Payable on the January 30, 2016Consolidated Balance Sheet.
Subsequent to January 28, 2017, our Board of Directors approved a new $250 million share repurchase program,which included the $59 million remaining under the February 2016 repurchase program. We repurchased anadditional 0.9 million shares of common stock for $49 million subsequent to January 28, 2017.
Dividend Policy and Procedures
Our Board of Directors will determine future dividends after giving consideration to the our levels of profit andcash flow, capital requirements, current and forecasted liquidity, the restrictions placed upon us by our borrowingarrangements as well as financial and other conditions existing at the time. We use cash flow generated fromoperating activities to fund our ordinary dividends and a combination of cash flow generated from operatingactivities and financing activities to fund our special dividends.
48

Under the authority and declaration of our Board of Directors, we paid the following dividends during the fiscalyears 2016, 2015 and 2014:
OrdinaryDividends
SpecialDividends
TotalDividends Total Paid
(per share) (in millions)
2016Fourth Quarter . . . . . . . . . . . . . . . . . . . . . . . . . . . . . . . . . . . . . . . . . . $0.60 $ — $0.60 $ 172Third Quarter . . . . . . . . . . . . . . . . . . . . . . . . . . . . . . . . . . . . . . . . . . . 0.60 — 0.60 173Second Quarter . . . . . . . . . . . . . . . . . . . . . . . . . . . . . . . . . . . . . . . . . 0.60 — 0.60 173First Quarter . . . . . . . . . . . . . . . . . . . . . . . . . . . . . . . . . . . . . . . . . . . . 0.60 2.00 2.60 750
2016 Total . . . . . . . . . . . . . . . . . . . . . . . . . . . . . . . . . . . . . . . . . . . . . $2.40 $2.00 $4.40 $1,268
2015Fourth Quarter . . . . . . . . . . . . . . . . . . . . . . . . . . . . . . . . . . . . . . . . . . $0.50 $ — $0.50 $ 145Third Quarter . . . . . . . . . . . . . . . . . . . . . . . . . . . . . . . . . . . . . . . . . . . 0.50 — 0.50 146Second Quarter . . . . . . . . . . . . . . . . . . . . . . . . . . . . . . . . . . . . . . . . . 0.50 — 0.50 146First Quarter . . . . . . . . . . . . . . . . . . . . . . . . . . . . . . . . . . . . . . . . . . . . 0.50 2.00 2.50 734
2015 Total . . . . . . . . . . . . . . . . . . . . . . . . . . . . . . . . . . . . . . . . . . . . . $2.00 $2.00 $4.00 $1,171
2014Fourth Quarter . . . . . . . . . . . . . . . . . . . . . . . . . . . . . . . . . . . . . . . . . . $0.34 $ — $0.34 $ 100Third Quarter . . . . . . . . . . . . . . . . . . . . . . . . . . . . . . . . . . . . . . . . . . . 0.34 — 0.34 100Second Quarter . . . . . . . . . . . . . . . . . . . . . . . . . . . . . . . . . . . . . . . . . 0.34 — 0.34 99First Quarter . . . . . . . . . . . . . . . . . . . . . . . . . . . . . . . . . . . . . . . . . . . . 0.34 1.00 1.34 392
2014 Total . . . . . . . . . . . . . . . . . . . . . . . . . . . . . . . . . . . . . . . . . . . . . $1.36 $1.00 $2.36 $ 691
Subsequent to January 28, 2017, our Board of Directors declared the first quarter of 2017 ordinary dividend of$0.60 per share.
Cash Flow
The following table provides a summary of our cash flow activity for the fiscal years ended January 28,2017, January 30, 2016 and January 31, 2015:
2016 2015 2014
(in millions)
Cash and Cash Equivalents, Beginning of Year . . . . . . . . . . . . . . . . . . . . . . . . . . . . . . $ 2,548 $1,681 $1,519
Net Cash Flows Provided by Operating Activities . . . . . . . . . . . . . . . . . . . . . . . . . . . . 1,890 1,869 1,786Net Cash Flows Used for Investing Activities . . . . . . . . . . . . . . . . . . . . . . . . . . . . . . . (833) (443) (699)Net Cash Flows Used for Financing Activities . . . . . . . . . . . . . . . . . . . . . . . . . . . . . . (1,665) (558) (919)Effect of Exchange Rate Changes on Cash . . . . . . . . . . . . . . . . . . . . . . . . . . . . . . . . . . (6) (1) (6)
Net Increase (Decrease) in Cash and Cash Equivalents . . . . . . . . . . . . . . . . . . . . . . . . (614) 867 162
Cash and Cash Equivalents, End of Year . . . . . . . . . . . . . . . . . . . . . . . . . . . . . . . . . . . $ 1,934 $2,548 $1,681
Operating Activities
Net cash provided by operating activities in 2016 was $1.890 billion, including net income of $1.158 billion. Netincome included depreciation and amortization of $518 million, a decrease in deferred income taxes of$110 million, a gain on distribution from Easton Town Center, LLC of $108 million, share-based compensation
49
Fo
rm10-K

expense of $96 million, excess tax benefits from share-based compensation of $42 million, and loss onextinguishment of debt of $36 million. Other changes in assets and liabilities represent items that had a currentperiod cash flow impact, such as changes in working capital. The most significant item in working capital was anincrease in operating cash flow associated with an increase in income taxes payable of $117 million.
Net cash provided by operating activities in 2015 was $1.869 billion, including net income of $1.253 billion. Netincome included depreciation and amortization of $457 million, share-based compensation expense of $97million, gain on divestiture of the third-party apparel sourcing business of $78 million and excess tax benefitsfrom share-based compensation of $70 million. Other changes in assets and liabilities represent items that had acurrent period cash flow impact, such as changes in working capital. The most significant item in working capitalwas an increase in operating cash flow associated with an increase in income taxes payable of $131 million.
Net cash provided by operating activities in 2014 was $1.786 billion, including net income of $1.042 billion. Netincome included depreciation and amortization of $438 million, share-based compensation expense of $90million and a decrease in deferred income taxes of $50 million. Other changes in assets and liabilities representitems that had a current period cash flow impact, such as changes in working capital. The most significant item inworking capital was an increase in operating cash flow associated with a decrease in inventories of $121 million.
Investing Activities
Net cash used for investing activities in 2016 was $833 million consisting primarily of $990 million of capitalexpenditures and $33 million related to the acquisition of our Victoria’s Secret Beauty and Accessories franchisepartner’s operations and stores in Greater China (net of cash acquired), partially offset by a $108 million returnof capital from Easton Town Center, LLC, proceeds from the sale of assets of $53 million, and proceeds from thesale of marketable securities of $10 million. The capital expenditures included $772 million for opening newstores and remodeling and improving existing stores. Remaining capital expenditures were primarily related tospending on technology and infrastructure to support growth.
Net cash used for investing activities in 2015 was $443 million consisting primarily of $727 million of capitalexpenditures and purchases of marketable securities of $60 million, partially offset by proceeds from the sale ofassets of $196 million, proceeds from the divestiture of the third-party apparel sourcing business for $85 millionand proceeds from the sale of marketable securities of $50 million. The capital expenditures included$555 million for opening new stores and remodeling and improving existing stores. Remaining capitalexpenditures were primarily related to spending on technology and infrastructure to support growth.
Net cash used for investing activities in 2014 was $699 million consisting primarily of $715 million of capitalexpenditures. The capital expenditures included $553 million for opening new stores and remodeling andimproving existing stores. Remaining capital expenditures were primarily related to spending on technology andinfrastructure to support growth.
We anticipate spending approximately $850 million to $900 million for capital expenditures in 2017 with themajority relating to opening new stores and remodeling and improving existing stores. We expect to openapproximately 70 new company-owned stores in 2017, primarily in the U.S.
Financing Activities
Net cash used for financing activities in 2016 was $1.665 billion consisting primarily of quarterly and specialdividend payments totaling $4.40 per share, or $1.268 billion, $742 million to repurchase our 2017 Notes andrepurchases of common stock of $435 million. These were partially offset by the net proceeds of $692 millionfrom the 2036 Notes issuance, excess tax benefits from share-based compensation of $42 million, $29 million netproceeds under our debt facilities and proceeds from the exercise of stock options of $20 million.
50

Net cash used for financing activities in 2015 was $558 million consisting primarily of quarterly and specialdividend payments totaling $4 per share, or $1.171 billion, and repurchases of common stock of $483 million.These were partially offset by the net proceeds of $988 million from the 2035 Notes issuance, excess tax benefitsfrom share-based compensation of $70 million and proceeds from the exercise of stock options of $33 million.
Net cash used for financing activities in 2014 was $919 million consisting primarily of quarterly and specialdividend payments totaling $2.36 per share, or $691 million, the repayment of long-term debt of $213 millionand repurchases of common stock of $87 million. These were partially offset by excess tax benefits from share-based compensation of $43 million and proceeds from the exercise of stock options of $34 million.
Contingent Liabilities and Contractual Obligations
The following table provides our contractual obligations, aggregated by type, including the maturity profile as ofJanuary 28, 2017:
Payments Due by Period
Total
LessThan 1Year
1-3Years
4-5Years
Morethan 5Years Other
(in millions)
Long-term Debt (a) . . . . . . . . . . . . . . . . . . . . . . . . . . . . . . $ 9,855 $ 384 $1,247 $2,009 $6,215 $ —Operating Lease Obligations (b) . . . . . . . . . . . . . . . . . . . . 5,177 707 1,256 1,102 2,112 —Purchase Obligations (c) . . . . . . . . . . . . . . . . . . . . . . . . . . 1,117 1,030 76 8 3 —Other Liabilities (d) . . . . . . . . . . . . . . . . . . . . . . . . . . . . . . 355 21 2 2 — 330
Total . . . . . . . . . . . . . . . . . . . . . . . . . . . . . . . . . . . . . . . . . . $16,504 $2,142 $2,581 $3,121 $8,330 $330
(a) Long-term debt obligations relate to our principal and interest payments for outstanding notes anddebentures. Interest payments have been estimated based on the coupon rate for fixed rate obligations.Interest obligations exclude amounts which have been accrued through January 28, 2017. For additionalinformation, see Note 12 to the Consolidated Financial Statements included in Item 8. Financial Statementsand Supplementary Data.
(b) Operating lease obligations primarily represent minimum payments due under store lease agreements. Foradditional information, see Note 16 to the Consolidated Financial Statements included in Item 8. FinancialStatements and Supplementary Data.
(c) Purchase obligations primarily include purchase orders for merchandise inventory and other agreements topurchase goods or services that are enforceable and legally binding and that specify all significant terms,including: fixed or minimum quantities to be purchased; fixed, minimum or variable price provisions; andthe approximate timing of the transactions.
(d) Other liabilities primarily include future payments relating to our nonqualified supplemental retirement planof $258 million which have been reflected under “Other” as the timing of these future payments is notknown until an associate leaves the Company or otherwise requests an in-service distribution. In addition,Other liabilities also include future estimated payments associated with unrecognized tax benefits. The“Less Than 1 Year” category includes $17 million of these tax items because it is reasonably possible thatthe amounts could change in the next 12 months due to audit settlements or resolution of uncertainties. Theremaining portion totaling $72 million is included in the “Other” category as it is not reasonably possiblethat the amounts could change in the next 12 months. For additional information, see Note 11 to theConsolidated Financial Statements in Item 8. Financial Statements and Supplementary Data.
In connection with the disposition of certain businesses, we have remaining guarantees of approximately$14 million related to lease payments under the current terms of noncancellable leases expiring at various datesthrough 2021. These guarantees include minimum rent and additional payments covering taxes, common areacosts and certain other expenses and relate to leases that commenced prior to the disposition of the businesses. In
51
Fo
rm10-K

certain instances, our guarantee may remain in effect if the term of a lease is extended. We have not recorded aliability with respect to any of these guarantee obligations as of January 28, 2017 or January 30, 2016 as weconcluded that payments under these guarantees were not probable.
In connection with the sale and leaseback under noncancellable operating leases of certain assets, we providedresidual value guarantees to the lessor if the leased assets cannot be sold for an amount in excess of a specifiedminimum value at the conclusion of the lease term. The leases expire in 2021, and the total amount of theguarantees is approximately $133 million. We recorded a liability of $1 million and $3 million related to theseguarantee obligations as of January 28, 2017 and January 30, 2016, respectively, included in Other Long-termLiabilities on the Consolidated Balance Sheets.
Off Balance Sheet Arrangements
We have no off balance sheet arrangements as defined by Regulation 229.303 Item 303 (a) (4).
Recently Issued Accounting Pronouncements
Revenue from Contracts with Customers
In May 2014, the Financial Accounting Standards Board (“FASB”) issued Accounting Standards Update(“ASU”) No. 2014-09, Revenue from Contracts with Customers, which has been further clarified and amended in2015 and 2016. This guidance requires companies to recognize revenue in a manner that depicts the transfer ofpromised goods or services to customers in amounts that reflect the consideration to which a company expects tobe entitled in exchange for those goods or services. The new standard also will result in enhanced disclosuresabout the nature, amount, timing and uncertainty of revenue and cash flows arising from contracts withcustomers. This guidance will be effective beginning in fiscal 2018, with early adoption as of fiscal 2017permitted. The standard allows for either a full retrospective or a modified retrospective transition method.
We continue to evaluate the impacts of this standard. Our most significant changes to current accounting relate tothe points earned under the Victoria’s Secret customer loyalty program and our accounting for sales returns. Thenew standard will require a deferral of revenue associated with loyalty points using a relative fair value approach,and also requires sales returns to be presented on a gross basis with the sales refund liability presented separatelyfrom the return asset. We are continuing to evaluate the further impacts the standard will have on ourConsolidated Statements of Income and Comprehensive Income, Balance Sheets and Statements of Cash Flows.We will adopt the standard in the first quarter of fiscal 2018, and are currently evaluating the transition method.
Leases
In February 2016, the FASB issued ASU No. 2016-02, Leases. This guidance requires companies classified aslessees to put most leases on their balance sheets but recognize expenses on their income statements in a mannersimilar to today’s accounting. The new standard also will result in enhanced quantitative and qualitativedisclosures, including significant judgments made by management, to provide greater insight into the extent ofrevenue and expense recognized and expected to be recognized from existing leases. The standard requiresmodified retrospective adoption and will be effective beginning in fiscal 2019, with early adoption permitted.
We are currently evaluating the impacts that this standard will have on our Consolidated Statements of Incomeand Comprehensive Income, Balance Sheets and Statements of Cash Flows, including period of adoption. Wecurrently expect that most of our operating lease commitments will be subject to the new standard andrecognized as operating lease liabilities and right-of-use assets upon adoption. Thus, we expect adoption willresult in a material increase to the assets and liabilities on our Consolidated Balance Sheet.
52

Simplifying the Presentation of Share-Based Compensation
In March 2016, the FASB issued ASU No. 2016-09, Improvements to Employee Share-Based PaymentAccounting. This guidance requires companies to recognize income tax effects of awards in the income statementwhen the awards vest or are settled. It also will allow an employer to repurchase more of an employee’s sharesthan it can today for tax withholding purposes without triggering liability accounting and to make a policyelection to account for forfeitures as they occur. The standard also will require all tax-related cash flows resultingfrom share-based payments to be reported as operating activities on the statements of cash flows, and any cashpayments made to taxing authorities on an employee’s behalf as financing activities. The standard is effectivebeginning in fiscal 2017.
This standard is expected to result in increased volatility to our income tax expense in future periods dependentupon, among other variables, the price of our common stock and the timing and volume of share-based paymentaward activity, such as employee exercises of stock options and vesting of restricted stock awards. Further, thestandard is expected to impact the operating and financing cash flows on our Consolidated Statements of CashFlows. We do not expect any further material impacts on our Consolidated Statements of Income andComprehensive Income, Balance Sheets and Statements of Cash Flows. We will adopt ASU 2016-09 in the firstquarter of 2017.
Impact of Inflation
While it is difficult to accurately measure the impact of inflation due to the imprecise nature of the estimatesrequired, we believe the effects of inflation, if any, on the results of operations and financial condition have beenminor.
Critical Accounting Policies and Estimates
The preparation of financial statements in conformity with generally accepted accounting principles requiresmanagement to adopt accounting policies related to estimates and assumptions that affect the reported amountsof assets and liabilities at the date of the financial statements and the reported amounts of revenues and expensesduring the reporting period, as well as the related disclosure of contingent assets and liabilities at the date of thefinancial statements. On an ongoing basis, management evaluates its accounting policies, estimates andjudgments, including those related to inventories, long-lived assets, claims and contingencies, income taxes andrevenue recognition. Management bases our estimates and judgments on historical experience and various otherfactors that are believed to be reasonable under the circumstances. Actual results may differ from these estimates.Management has discussed the development and selection of our critical accounting policies and estimates withthe Audit Committee of our Board of Directors and believes the following assumptions and estimates are mostsignificant to reporting our results of operations and financial position.
Inventories
Inventories are principally valued at the lower of cost or market, on a weighted-average cost basis.
We record valuation adjustments to our inventories if the cost of inventory on hand exceeds the amount weexpect to realize from the ultimate sale or disposal of the inventory. These estimates are based on management’sjudgment regarding future demand and market conditions and analysis of historical experience. If actual demandor market conditions are different than those projected by management, future period merchandise margin ratesmay be unfavorably or favorably affected by adjustments to these estimates.
We also record inventory loss adjustments for estimated physical inventory losses that have occurred since thedate of the last physical inventory. These estimates are based on management’s analysis of historical results andoperating trends.
53
Fo
rm10-K

Management believes that the assumptions used in these estimates are reasonable and appropriate. A 10%increase or decrease in the inventory valuation adjustment would have impacted net income by approximately$3 million for 2016. A 10% increase or decrease in the estimated physical inventory loss adjustment would haveimpacted net income by approximately $4 million for 2016.
Valuation of Long-lived Assets
Property and equipment and intangible assets with finite lives are reviewed for impairment whenever events orchanges in circumstances indicate that the carrying amount of the asset may not be recoverable. If the estimatedundiscounted future cash flows related to the asset are less than the carrying value, we recognize a loss equal tothe difference between the carrying value and the estimated fair value, usually determined by the estimateddiscounted future cash flows of the asset. When a decision has been made to dispose of property and equipmentprior to the end of the previously estimated useful life, depreciation estimates are revised to reflect the use of theasset over the shortened estimated useful life.
Goodwill is reviewed for impairment each year in the fourth quarter and may be reviewed more frequently ifcertain events occur or circumstances change. First, we perform a qualitative assessment to determine whether itis more likely than not that each reporting unit’s fair value is less than its carrying value, including goodwill. Ifwe determine that it is more likely than not that the fair value of the reporting unit is less than its carrying value,we then estimate the fair value of all assets and liabilities of that reporting unit, including the implied fair valueof goodwill, through either estimated discounted future cash flows or market-based methodologies. If thecarrying value of goodwill exceeds the implied fair value, we recognize an impairment charge equal to thedifference. Our reporting units are determined in accordance with the provisions of Accounting StandardsCodification (“ASC”) Topic 350, Intangibles—Goodwill and Other. Our reporting units that have goodwill areVictoria’s Secret Stores, Victoria’s Secret Direct, Bath & Body Works Stores and Greater China.
Intangible assets with indefinite lives are reviewed for impairment each year in the fourth quarter and may bereviewed more frequently if certain events occur or circumstances change. We first perform a qualitativeassessment to determine whether it is more likely than not that the indefinite-lived intangible asset is impaired. Ifwe determine that it is more likely than not that the fair value of the asset is less than its carrying amount, weestimate the fair value, usually determined by the estimated discounted future cash flows of the asset, comparethat value with its carrying amount and record an impairment charge, if any.
We estimate the fair value of property and equipment, goodwill and intangible assets in accordance with theprovisions of ASC Topic 820, Fair Value Measurement. If future economic conditions are different than thoseprojected by management, future impairment charges may be required.
Claims and Contingencies
We are subject to various claims and contingencies related to lawsuits, insurance, regulatory and other mattersarising out of the normal course of business. Our determination of the treatment of claims and contingencies inthe Consolidated Financial Statements is based on management’s view of the expected outcome of the applicableclaim or contingency. We consult with legal counsel on matters related to litigation and seek input from bothinternal and external experts with respect to matters in the ordinary course of business. We accrue a liability ifthe likelihood of an adverse outcome is probable and the amount is reasonably estimable. If the likelihood of anadverse outcome is only reasonably possible (as opposed to probable) or if an estimate is not reasonablydeterminable, disclosure of a material claim or contingency is disclosed in the Notes to the ConsolidatedFinancial Statements included in Item 8. Financial Statements and Supplementary Data.
Income Taxes
We account for income taxes under the asset and liability method. Under this method, taxes currently payable orrefundable are accrued, and deferred tax assets and liabilities are recognized for the estimated future tax
54

consequences attributable to differences between the financial statement carrying amounts of existing assets andliabilities and their respective tax bases. Deferred tax assets are also recognized for realizable operating loss andtax credit carryforwards. Deferred tax assets and liabilities are measured using enacted income tax rates in effectfor the year in which those temporary differences are expected to be recovered or settled. The effect on deferredtax assets and liabilities of a change in income tax rates is recognized in our Consolidated Statement of Income inthe period that includes the enactment date. A valuation allowance is recorded to reduce the carrying amounts ofdeferred tax assets if it is more likely than not that such assets will not be realized. U.S. deferred income taxes arenot provided on undistributed income of foreign subsidiaries where such earnings are considered to bepermanently reinvested for the foreseeable future.
Significant judgment is required in determining the provision for income taxes and related accruals, deferred taxassets and liabilities. In determining our provision for income taxes, we consider permanent differences betweenbook and tax income and statutory income tax rates. Our effective income tax rate is affected by items includingchanges in tax law, the tax jurisdiction of new stores or business ventures and the level of earnings.
We follow the authoritative guidance included in ASC Topic 740, Income Taxes, which contains a two-stepapproach to recognizing and measuring uncertain tax positions. The first step is to evaluate the tax position forrecognition by determining if the available evidence indicates it is more likely than not that the position will besustained on audit, including resolution of related appeals or litigation processes, if any. The second step is tomeasure the tax benefit as the largest amount which is more than 50% likely of being realized upon ultimatesettlement. We consider many factors when evaluating and estimating our tax positions and tax benefits, whichmay require periodic adjustments and which may not accurately forecast actual outcomes. Our policy is toinclude interest and penalties related to uncertain tax positions in income tax expense.
Our income tax returns, like those of most companies, are periodically audited by domestic and foreign taxauthorities. These audits include questions regarding our tax filing positions, including the timing and amount ofdeductions and the allocation of income among various tax jurisdictions. At any one time, multiple tax years aresubject to audit by the various tax authorities. A number of years may elapse before a particular matter for whichwe have established an accrual is audited and fully resolved or clarified. We adjust our tax contingencies accrualand income tax provision in the period in which matters are effectively settled with tax authorities at amountsdifferent from our established accrual, when the statute of limitations expires for the relevant taxing authority toexamine the tax position or when more information becomes available.
Although we believe that our estimates are reasonable, actual results could differ from these estimates resultingin a final tax outcome that may be materially different from that which is reflected in our Consolidated FinancialStatements.
Revenue Recognition
Company-owned Stores and Direct Channels
While our recognition of revenue does not involve significant judgment, revenue recognition represents animportant accounting policy for our organization. We recognize revenue upon customer receipt of themerchandise. We also provide a reserve for projected merchandise returns based on prior experience. For directchannel revenues, we estimate shipments that have not been received by the customer based on shipping termsand historical delivery times.
All of our brands sell gift cards with no expiration dates to customers in retail stores, through our direct channelsand through third parties. We do not charge administrative fees on unused gift cards. We recognize revenue fromgift cards when they are redeemed by the customer. In addition, we recognize revenue on unredeemed gift cardswhen we can determine that the likelihood of the gift card being redeemed is remote and there is no legalobligation to remit the unredeemed gift cards to relevant jurisdictions (gift card breakage). We determine the giftcard breakage rate based on historical redemption patterns. Gift card breakage is included in Net Sales in ourConsolidated Statements of Income.
55
Fo
rm10-K

Royalty and Other
We also recognize revenues associated with franchise, license and wholesale arrangements. Revenue recognizedunder franchise and license arrangements generally consists of royalties earned and recognized upon sale ofmerchandise by franchise and license partners to retail customers. Revenue is generally recognized underwholesale and sourcing arrangements at the time the title passes to the partner.
ITEM 7A. QUANTITATIVE AND QUALITATIVE DISCLOSURES ABOUT MARKET RISK.
Market Risk
The market risk inherent in our financial instruments represents the potential loss in fair value, earnings or cashflows arising from adverse changes in foreign currency exchange rates or interest rates. We use derivativefinancial instruments like cross-currency swaps, foreign currency forward contracts and interest rate swaparrangements to manage exposure to market risks. We do not use derivative financial instruments for tradingpurposes.
Foreign Exchange Rate Risk
We have operations in foreign countries which expose us to market risk associated with foreign currencyexchange rate fluctuations. To mitigate the translation risk to our earnings and the fair value of our Canadianoperations associated with fluctuations in the U.S. dollar-Canadian dollar exchange rate, we entered into a cross-currency swap related to a Canadian dollar denominated intercompany loan. This cross-currency swap requiresthe periodic exchange of fixed rate Canadian dollar interest payments for fixed rate U.S. dollar interest paymentsas well as exchange of Canadian dollar and U.S. dollar principal payments upon maturity. The swap arrangementmatures in January 2018 at the same time as the related loan. As a result of the Canadian dollar denominatedintercompany loan and the related cross-currency swap, we do not believe there is any material translation risk toour Canadian net earnings associated with fluctuations in the U.S. dollar-Canadian dollar exchange rate.
In addition, our Canadian dollar, British pound, Chinese yuan and Hong Kong dollar denominated earnings aresubject to exchange rate risk as substantially all of our merchandise sold in Canada, the U.K. and Greater Chinais sourced through U.S. dollar transactions. Although we utilize foreign currency forward contracts to partiallyoffset risks associated with Canadian dollar and British pound denominated earnings, these measures may notsucceed in offsetting all of the short-term impact of foreign currency rate movements and generally may not beeffective in offsetting the long-term impact of sustained shifts in foreign currency rates.
Further, although our royalty arrangements with our international partners are denominated in U.S. dollars, theroyalties we receive in U.S. dollars are calculated based on sales in the local currency. As a result, our royaltiesin these arrangements are exposed to foreign currency exchange rate fluctuations.
Interest Rate Risk
Our investment portfolio primarily consists of interest-bearing instruments that are classified as cash and cashequivalents based on their original maturities. Our investment portfolio is maintained in accordance with ourinvestment policy, which specifies permitted types of investments, specifies credit quality standards and maturityprofiles and limits credit exposure to any single issuer. The primary objective of our investment activities are thepreservation of principal, the maintenance of liquidity and the maximization of interest income while minimizingrisk. Typically, our investment portfolio is primarily comprised of U.S. government obligations, U.S. Treasuryand AAA-rated money market funds, commercial paper and bank deposits. Given the short-term nature andquality of investments in our portfolio, we do not believe there is any material risk to principal associated withincreases or decreases in interest rates.
56

The majority of our long-term debt as of January 28, 2017 has fixed interest rates. We will from time to timeadjust our exposure to interest rate risk by entering into interest rate swap arrangements. As of January 28, 2017,we have interest rate swap arrangements with notional amounts of $300 million related to a portion of our2019 Notes.
The effect of the interest rate swap arrangements is to convert the respective amount of debt from a fixed interestrate to a variable interest rate. The variable interest rate associated with these swap arrangements fluctuates basedon changes in the three-month LIBOR.
For the balance of our long-term debt that is not subject to interest rate swap arrangements, our exposure tointerest rate changes is limited to the fair value of the debt issued, which would not have a material impact on ourearnings or cash flows.
Fair Value of Financial Instruments
As of January 28, 2017, we believe that the carrying values of accounts receivable, accounts payable, accruedexpenses and current debt approximate fair value because of their short maturity.
The following table provides a summary of the principal value and fair value of long-term debt and swaparrangements as of January 28, 2017 and January 30, 2016:
January 28,2017
January 30,2016
(in millions)
Long-term Debt:Principal Value . . . . . . . . . . . . . . . . . . . . . . . . . . . . . . . . . . . . . . . . . . . . . . . . . . . . . . $5,750 $5,750Fair Value, Estimated (a) . . . . . . . . . . . . . . . . . . . . . . . . . . . . . . . . . . . . . . . . . . . . . . 6,030 6,209
Foreign Currency Cash Flow Hedges (b) . . . . . . . . . . . . . . . . . . . . . . . . . . . . . . . . . . . . . . (17) (27)Interest Rate Fair Value Hedges (b) . . . . . . . . . . . . . . . . . . . . . . . . . . . . . . . . . . . . . . . . . . (2) (11)
(a) The estimated fair value is based on reported transaction prices. The estimates presented are not necessarilyindicative of the amounts that we could realize in a current market exchange.
(b) Hedge arrangements are in a net asset position.
Concentration of Credit Risk
We maintain cash and cash equivalents and derivative contracts with various major financial institutions. Wemonitor the relative credit standing of financial institutions with whom we transact and limit the amount of creditexposure with any one entity. Typically, our investment portfolio is primarily comprised of U.S. governmentobligations, U.S. Treasury and AAA-rated money market funds, commercial paper and bank deposits. We alsoperiodically review the relative credit standing of franchise, license and wholesale partners and other entities towhich we grant credit terms in the normal course of business.
57
Fo
rm10-K

ITEM 8. FINANCIAL STATEMENTS AND SUPPLEMENTARY DATA.
L BRANDS, INC.INDEX TO CONSOLIDATED FINANCIAL STATEMENTS
Page No.
Management’s Report on Internal Control Over Financial Reporting . . . . . . . . . . . . . . . . . . . . . . . . . . . . 59Report of Independent Registered Public Accounting Firm on Internal Control Over Financial
Reporting . . . . . . . . . . . . . . . . . . . . . . . . . . . . . . . . . . . . . . . . . . . . . . . . . . . . . . . . . . . . . . . . . . . . . . . . . 60Report of Independent Registered Public Accounting Firm on Consolidated Financial Statements . . . . . 61Consolidated Statements of Income for the Years Ended January 28, 2017, January 30, 2016 and
January 31, 2015 . . . . . . . . . . . . . . . . . . . . . . . . . . . . . . . . . . . . . . . . . . . . . . . . . . . . . . . . . . . . . . . . . . . 62Consolidated Statements of Comprehensive Income for the Years Ended January 28, 2017, January 30,
2016 and January 31, 2015 . . . . . . . . . . . . . . . . . . . . . . . . . . . . . . . . . . . . . . . . . . . . . . . . . . . . . . . . . . . 62Consolidated Balance Sheets as of January 28, 2017 and January 30, 2016 . . . . . . . . . . . . . . . . . . . . . . . 63Consolidated Statements of Total Equity (Deficit) for the Years Ended January 28, 2017, January 30,
2016 and January 31, 2015 . . . . . . . . . . . . . . . . . . . . . . . . . . . . . . . . . . . . . . . . . . . . . . . . . . . . . . . . . . . 64Consolidated Statements of Cash Flows for the Years Ended January 28, 2017, January 30, 2016 and
January 31, 2015 . . . . . . . . . . . . . . . . . . . . . . . . . . . . . . . . . . . . . . . . . . . . . . . . . . . . . . . . . . . . . . . . . . . 65Notes to Consolidated Financial Statements . . . . . . . . . . . . . . . . . . . . . . . . . . . . . . . . . . . . . . . . . . . . . . . . 66
Our fiscal year ends on the Saturday nearest to January 31. Fiscal years are designated in the ConsolidatedFinancial Statements and Notes by the calendar year in which the fiscal year commences. The results for fiscalyears 2016, 2015 and 2014 refer to the 52-week periods ending January 28, 2017, January 30, 2016 andJanuary 31, 2015, respectively.
58
Management’s Report on Internal Control Over Financial Reporting
Management is responsible for establishing and maintaining adequate internal control over financial reporting asdefined in Rules 13a-15(f) and 15d-15(f) under the Securities Exchange Act of 1934. The Company’s internalcontrol system is designed to provide reasonable assurance to the Company’s management and Board ofDirectors regarding the preparation and fair presentation of published financial statements. Because of itsinherent limitations, internal control over financial reporting may not prevent or detect misstatements. Therefore,even those systems determined to be effective can provide only reasonable assurance with respect to financialstatement preparation and presentation. Also, projections of any evaluation of effectiveness to future periods aresubject to the risk that controls may become inadequate because of changes in conditions, or that the degree ofcompliance with the policies or procedures may deteriorate.
Management assessed the effectiveness of the Company’s internal control over financial reporting as ofJanuary 28, 2017. In making this assessment, management used the criteria established in Internal Control-Integrated Framework issued by the Committee of Sponsoring Organizations of the Treadway Commission (2013framework) (the COSO criteria).
Based on our assessment and the COSO criteria, management believes that the Company maintained effectiveinternal control over financial reporting as of January 28, 2017.
The Company’s independent registered public accounting firm, Ernst & Young LLP, has issued an attestationreport on the Company’s internal control over financial reporting. Ernst & Young LLP’s report appears on thefollowing page and expresses an unqualified opinion on the effectiveness of the Company’s internal control overfinancial reporting as of January 28, 2017.
59
Fo
rm10-K

Report of Independent Registered Public Accounting Firm
The Board of Directors and Shareholders of L Brands, Inc.:
We have audited L Brands, Inc.’s internal control over financial reporting as of January 28, 2017, based oncriteria established in Internal Control-Integrated Framework issued by the Committee of SponsoringOrganizations of the Treadway Commission (2013 framework) (the COSO criteria). L Brands, Inc.’smanagement is responsible for maintaining effective internal control over financial reporting, and for itsassessment of the effectiveness of internal control over financial reporting included in the accompanyingManagement’s Report on Internal Control over Financial Reporting. Our responsibility is to express an opinionon the company’s internal control over financial reporting based on our audit.
We conducted our audit in accordance with the standards of the Public Company Accounting Oversight Board(United States). Those standards require that we plan and perform the audit to obtain reasonable assurance aboutwhether effective internal control over financial reporting was maintained in all material respects. Our auditincluded obtaining an understanding of internal control over financial reporting, assessing the risk that a materialweakness exists, testing and evaluating the design and operating effectiveness of internal control based on theassessed risk, and performing such other procedures as we considered necessary in the circumstances. We believethat our audit provides a reasonable basis for our opinion.
A company’s internal control over financial reporting is a process designed to provide reasonable assuranceregarding the reliability of financial reporting and the preparation of financial statements for external purposes inaccordance with generally accepted accounting principles. A company’s internal control over financial reportingincludes those policies and procedures that (1) pertain to the maintenance of records that, in reasonable detail,accurately and fairly reflect the transactions and dispositions of the assets of the company; (2) provide reasonableassurance that transactions are recorded as necessary to permit preparation of financial statements in accordancewith generally accepted accounting principles, and that receipts and expenditures of the company are being madeonly in accordance with authorizations of management and directors of the company; and (3) provide reasonableassurance regarding prevention or timely detection of unauthorized acquisition, use or disposition of thecompany’s assets that could have a material effect on the financial statements.
Because of its inherent limitations, internal control over financial reporting may not prevent or detectmisstatements. Also, projections of any evaluation of effectiveness to future periods are subject to the risk thatcontrols may become inadequate because of changes in conditions, or that the degree of compliance with thepolicies or procedures may deteriorate.
In our opinion, L Brands, Inc. maintained, in all material respects, effective internal control over financialreporting as of January 28, 2017, based on the COSO criteria.
We also have audited, in accordance with the standards of the Public Company Accounting Oversight Board(United States), the Consolidated Balance Sheets of L Brands, Inc. as of January 28, 2017 and January 30, 2016,and the related Consolidated Statements of Income, Comprehensive Income, Total Equity (Deficit), and CashFlows for each of the three years in the period ended January 28, 2017 of L Brands, Inc. and our report datedMarch 17, 2017 expressed an unqualified opinion thereon.
/s/ Ernst & Young LLP
Grandview Heights, OhioMarch 17, 2017
60

Report of Independent Registered Public Accounting Firm on Consolidated Financial Statements
The Board of Directors and Shareholders of L Brands, Inc.:
We have audited the accompanying Consolidated Balance Sheets of L Brands, Inc. as of January 28, 2017 andJanuary 30, 2016 and the related Consolidated Statements of Income, Comprehensive Income, Total Equity(Deficit), and Cash Flows for each of the three years in the period ended January 28, 2017. These financialstatements are the responsibility of the Company’s management. Our responsibility is to express an opinion onthese financial statements based on our audits.
We conducted our audits in accordance with the standards of the Public Company Accounting Oversight Board(United States). Those standards require that we plan and perform the audit to obtain reasonable assurance aboutwhether the financial statements are free of material misstatement. An audit includes examining, on a test basis,evidence supporting the amounts and disclosures in the financial statements. An audit also includes assessing theaccounting principles used and significant estimates made by management, as well as evaluating the overallfinancial statement presentation. We believe that our audits provide a reasonable basis for our opinion.
In our opinion, the financial statements referred to above present fairly, in all material respects, the consolidatedfinancial position of L Brands, Inc. at January 28, 2017 and January 30, 2016 and the consolidated results of theiroperations and their cash flows for each of the three years in the period ended January 28, 2017, in conformitywith U.S. generally accepted accounting principles.
We also have audited, in accordance with the standards of the Public Company Accounting Oversight Board(United States), L Brands, Inc.’s internal control over financial reporting as of January 28, 2017, based on criteriaestablished in Internal Control-Integrated Framework issued by the Committee of Sponsoring Organizations ofthe Treadway Commission (2013 framework) and our report dated March 17, 2017 expressed an unqualifiedopinion thereon.
/s/ Ernst & Young LLP
Grandview Heights, OhioMarch 17, 2017
61
Fo
rm10-K

L BRANDS, INC.
CONSOLIDATED STATEMENTS OF INCOME
(in millions except per share amounts)
2016 2015 2014
Net Sales . . . . . . . . . . . . . . . . . . . . . . . . . . . . . . . . . . . . . . . . . . . . . . . . . . . . . . . . . . $12,574 $12,154 $11,454Costs of Goods Sold, Buying and Occupancy . . . . . . . . . . . . . . . . . . . . . . . . . . . . . (7,449) (6,950) (6,646)
Gross Profit . . . . . . . . . . . . . . . . . . . . . . . . . . . . . . . . . . . . . . . . . . . . . . . . . . . . . . . 5,125 5,204 4,808General, Administrative and Store Operating Expenses . . . . . . . . . . . . . . . . . . . . . (3,122) (3,012) (2,855)
Operating Income . . . . . . . . . . . . . . . . . . . . . . . . . . . . . . . . . . . . . . . . . . . . . . . . . . . 2,003 2,192 1,953Interest Expense . . . . . . . . . . . . . . . . . . . . . . . . . . . . . . . . . . . . . . . . . . . . . . . . . . . . (394) (334) (324)Other Income . . . . . . . . . . . . . . . . . . . . . . . . . . . . . . . . . . . . . . . . . . . . . . . . . . . . . . 87 76 7
Income Before Income Taxes . . . . . . . . . . . . . . . . . . . . . . . . . . . . . . . . . . . . . . . . . 1,696 1,934 1,636Provision for Income Taxes . . . . . . . . . . . . . . . . . . . . . . . . . . . . . . . . . . . . . . . . . . . 538 681 594
Net Income . . . . . . . . . . . . . . . . . . . . . . . . . . . . . . . . . . . . . . . . . . . . . . . . . . . . . . . . $ 1,158 $ 1,253 $ 1,042
Net Income Per Basic Share . . . . . . . . . . . . . . . . . . . . . . . . . . . . . . . . . . . . . . . . . . . $ 4.04 $ 4.30 $ 3.57
Net Income Per Diluted Share . . . . . . . . . . . . . . . . . . . . . . . . . . . . . . . . . . . . . . . . . $ 3.98 $ 4.22 $ 3.50
L BRANDS, INC.
CONSOLIDATED STATEMENTS OF COMPREHENSIVE INCOME
(in millions)
2016 2015 2014
Net Income . . . . . . . . . . . . . . . . . . . . . . . . . . . . . . . . . . . . . . . . . . . . . . . . . . . . . . . . . . . $1,158 $1,253 $1,042Other Comprehensive Income (Loss), Net of Tax:
Foreign Currency Translation . . . . . . . . . . . . . . . . . . . . . . . . . . . . . . . . . . . . . . . . (19) (23) 21Unrealized Gain (Loss) on Cash Flow Hedges . . . . . . . . . . . . . . . . . . . . . . . . . . . (8) 6 34Reclassification of Cash Flow Hedges to Earnings . . . . . . . . . . . . . . . . . . . . . . . . 7 14 (60)Unrealized Gain (Loss) on Marketable Securities . . . . . . . . . . . . . . . . . . . . . . . . . (5) 8 —Reclassification of Gain on Marketable Securities to Earnings . . . . . . . . . . . . . . . (3) — —
Total Other Comprehensive Income (Loss), Net of Tax . . . . . . . . . . . . . . . . . . . . . . . . (28) 5 (5)
Total Comprehensive Income . . . . . . . . . . . . . . . . . . . . . . . . . . . . . . . . . . . . . . . . . . . . $1,130 $1,258 $1,037
The accompanying Notes are an integral part of these Consolidated Financial Statements.
62

L BRANDS, INC.
CONSOLIDATED BALANCE SHEETS
(in millions except par value amounts)
January 28,2017
January 30,2016
ASSETSCurrent Assets:
Cash and Cash Equivalents . . . . . . . . . . . . . . . . . . . . . . . . . . . . . . . . . . . . . . . . . . . . . $ 1,934 $ 2,548Accounts Receivable, Net . . . . . . . . . . . . . . . . . . . . . . . . . . . . . . . . . . . . . . . . . . . . . . 294 261Inventories . . . . . . . . . . . . . . . . . . . . . . . . . . . . . . . . . . . . . . . . . . . . . . . . . . . . . . . . . . 1,096 1,122Other . . . . . . . . . . . . . . . . . . . . . . . . . . . . . . . . . . . . . . . . . . . . . . . . . . . . . . . . . . . . . . 141 225
Total Current Assets . . . . . . . . . . . . . . . . . . . . . . . . . . . . . . . . . . . . . . . . . . . . . . . . . . . . . . 3,465 4,156Property and Equipment, Net . . . . . . . . . . . . . . . . . . . . . . . . . . . . . . . . . . . . . . . . . . . . . . . 2,741 2,330Goodwill . . . . . . . . . . . . . . . . . . . . . . . . . . . . . . . . . . . . . . . . . . . . . . . . . . . . . . . . . . . . . . . 1,348 1,318Trade Names and Other Intangible Assets, Net . . . . . . . . . . . . . . . . . . . . . . . . . . . . . . . . . 411 411Deferred Income Taxes . . . . . . . . . . . . . . . . . . . . . . . . . . . . . . . . . . . . . . . . . . . . . . . . . . . . 19 30Other Assets . . . . . . . . . . . . . . . . . . . . . . . . . . . . . . . . . . . . . . . . . . . . . . . . . . . . . . . . . . . . 186 248
Total Assets . . . . . . . . . . . . . . . . . . . . . . . . . . . . . . . . . . . . . . . . . . . . . . . . . . . . . . . . . . . . . $ 8,170 $ 8,493
LIABILITIES AND EQUITY (DEFICIT)Current Liabilities:
Accounts Payable . . . . . . . . . . . . . . . . . . . . . . . . . . . . . . . . . . . . . . . . . . . . . . . . . . . . $ 683 $ 668Accrued Expenses and Other . . . . . . . . . . . . . . . . . . . . . . . . . . . . . . . . . . . . . . . . . . . 997 977Current Portion of Long-term Debt . . . . . . . . . . . . . . . . . . . . . . . . . . . . . . . . . . . . . . 36 6Income Taxes . . . . . . . . . . . . . . . . . . . . . . . . . . . . . . . . . . . . . . . . . . . . . . . . . . . . . . . 298 224
Total Current Liabilities . . . . . . . . . . . . . . . . . . . . . . . . . . . . . . . . . . . . . . . . . . . . . . . . . . . 2,014 1,875Deferred Income Taxes . . . . . . . . . . . . . . . . . . . . . . . . . . . . . . . . . . . . . . . . . . . . . . . . . . . . 352 257Long-term Debt . . . . . . . . . . . . . . . . . . . . . . . . . . . . . . . . . . . . . . . . . . . . . . . . . . . . . . . . . . 5,700 5,715Other Long-term Liabilities . . . . . . . . . . . . . . . . . . . . . . . . . . . . . . . . . . . . . . . . . . . . . . . . 831 904Shareholders’ Equity (Deficit):
Preferred Stock—$1.00 par value; 10 shares authorized; none issued . . . . . . . . . . . . — —Common Stock—$0.50 par value; 1,000 shares authorized; 315 and 313 shares
issued; 286 and 290 shares outstanding, respectively . . . . . . . . . . . . . . . . . . . . . . . 157 156Paid-in Capital . . . . . . . . . . . . . . . . . . . . . . . . . . . . . . . . . . . . . . . . . . . . . . . . . . . . . . 650 545Accumulated Other Comprehensive Income . . . . . . . . . . . . . . . . . . . . . . . . . . . . . . . 12 40Retained Earnings . . . . . . . . . . . . . . . . . . . . . . . . . . . . . . . . . . . . . . . . . . . . . . . . . . . . 205 315Less: Treasury Stock, at Average Cost; 29 and 23 shares, respectively . . . . . . . . . . . (1,753) (1,315)
Total L Brands, Inc. Shareholders’ Equity (Deficit) . . . . . . . . . . . . . . . . . . . . . . . . . . . . . (729) (259)
Noncontrolling Interest . . . . . . . . . . . . . . . . . . . . . . . . . . . . . . . . . . . . . . . . . . . . . . . . . . . . 2 1
Total Equity (Deficit) . . . . . . . . . . . . . . . . . . . . . . . . . . . . . . . . . . . . . . . . . . . . . . . . . . . . . (727) (258)
Total Liabilities and Equity (Deficit) . . . . . . . . . . . . . . . . . . . . . . . . . . . . . . . . . . . . . . . . . $ 8,170 $ 8,493
The accompanying Notes are an integral part of these Consolidated Financial Statements.
63
Fo
rm10-K

L BRANDS, INC.
CONSOLIDATED STATEMENTS OF TOTAL EQUITY (DEFICIT)
(in millions except per share amounts)
Common Stock
Paid-InCapital
AccumulatedOther
ComprehensiveIncome
RetainedEarnings
(AccumulatedDeficit)
TreasuryStock, atAverage
CostNoncontrolling
Interest
TotalEquity
(Deficit)Shares
OutstandingPar
Value
Balance, February 1, 2014 . . . . . . . . 291 $154 $302 $ 40 $ (118) $ (748) $ 1 $ (369)Net Income . . . . . . . . . . . . . . . . . . . . . — — — — 1,042 — — 1,042Other Comprehensive Income
(Loss) . . . . . . . . . . . . . . . . . . . . . . . — — — (5) — — — (5)
Total Comprehensive Income . . . . . . . — — — (5) 1,042 — — 1,037Cash Dividends ($2.36 per share) . . . . — — — — (691) — — (691)Repurchase of Common Stock . . . . . . (1) — — — — (84) — (84)Exercise of Stock Options and
Other . . . . . . . . . . . . . . . . . . . . . . . . 2 1 125 — — — — 126
Balance, January 31, 2015 . . . . . . . . 292 $155 $427 $ 35 $ 233 $ (832) $ 1 $ 19Net Income . . . . . . . . . . . . . . . . . . . . . — — — — 1,253 — — 1,253Other Comprehensive Income
(Loss) . . . . . . . . . . . . . . . . . . . . . . . — — — 5 — — — 5
Total Comprehensive Income . . . . . . . — — — 5 1,253 — — 1,258Cash Dividends ($4.00 per share) . . . . — — — — (1,171) — — (1,171)Repurchase of Common Stock . . . . . . (5) — — — — (483) — (483)Exercise of Stock Options and
Other . . . . . . . . . . . . . . . . . . . . . . . . 3 1 118 — — — — 119
Balance, January 30, 2016 . . . . . . . . 290 $156 $545 $ 40 $ 315 $(1,315) $ 1 $ (258)Net Income . . . . . . . . . . . . . . . . . . . . . — — — — 1,158 — — 1,158Other Comprehensive Income
(Loss) . . . . . . . . . . . . . . . . . . . . . . . — — — (28) — — — (28)
Total Comprehensive Income . . . . . . . — — — (28) 1,158 — — 1,130Cash Dividends ($4.40 per share) . . . . — — — — (1,268) — — (1,268)Repurchase of Common Stock . . . . . . (6) — — — — (438) — (438)Exercise of Stock Options and
Other . . . . . . . . . . . . . . . . . . . . . . . . 2 1 105 — — — 1 107
Balance, January 28, 2017 . . . . . . . . 286 $157 $650 $ 12 $ 205 $(1,753) $ 2 $ (727)
The accompanying Notes are an integral part of these Consolidated Financial Statements.
64

L BRANDS, INC.
CONSOLIDATED STATEMENTS OF CASH FLOWS
(in millions)
2016 2015 2014
Operating ActivitiesNet Income . . . . . . . . . . . . . . . . . . . . . . . . . . . . . . . . . . . . . . . . . . . . . . . . . . . . . . . . . . . . . . . . . . . . . . . . . $ 1,158 $ 1,253 $1,042Adjustments to Reconcile Net Income to Net Cash Provided by (Used for) Operating Activities:
Depreciation and Amortization of Long-lived Assets . . . . . . . . . . . . . . . . . . . . . . . . . . . . . . . . . . . . 518 457 438Amortization of Landlord Allowances . . . . . . . . . . . . . . . . . . . . . . . . . . . . . . . . . . . . . . . . . . . . . . . (46) (42) (40)Deferred Income Taxes . . . . . . . . . . . . . . . . . . . . . . . . . . . . . . . . . . . . . . . . . . . . . . . . . . . . . . . . . . . 110 11 50Share-based Compensation Expense . . . . . . . . . . . . . . . . . . . . . . . . . . . . . . . . . . . . . . . . . . . . . . . . . 96 97 90Excess Tax Benefits from Share-based Compensation . . . . . . . . . . . . . . . . . . . . . . . . . . . . . . . . . . . (42) (70) (43)Gain on Distribution from Easton Town Center, LLC . . . . . . . . . . . . . . . . . . . . . . . . . . . . . . . . . . . (108) — —Loss on Extinguishment of Debt . . . . . . . . . . . . . . . . . . . . . . . . . . . . . . . . . . . . . . . . . . . . . . . . . . . . 36 — —Gain on Distribution from Investment . . . . . . . . . . . . . . . . . . . . . . . . . . . . . . . . . . . . . . . . . . . . . . . . (4) — —Gain on Sale of Marketable Securities . . . . . . . . . . . . . . . . . . . . . . . . . . . . . . . . . . . . . . . . . . . . . . . (4) — —Gain on Divestiture of Third-party Apparel Sourcing Business . . . . . . . . . . . . . . . . . . . . . . . . . . . . — (78) —Loss on Sale of Assets, Net . . . . . . . . . . . . . . . . . . . . . . . . . . . . . . . . . . . . . . . . . . . . . . . . . . . . . . . . — 2 —
Changes in Assets and Liabilities, Net of Assets and Liabilities from Acquisition:Accounts Receivable . . . . . . . . . . . . . . . . . . . . . . . . . . . . . . . . . . . . . . . . . . . . . . . . . . . . . . . . . . . . . (44) (10) (9)Inventories . . . . . . . . . . . . . . . . . . . . . . . . . . . . . . . . . . . . . . . . . . . . . . . . . . . . . . . . . . . . . . . . . . . . . 30 (92) 121Accounts Payable, Accrued Expenses and Other . . . . . . . . . . . . . . . . . . . . . . . . . . . . . . . . . . . . . . . (27) 49 90Income Taxes Payable . . . . . . . . . . . . . . . . . . . . . . . . . . . . . . . . . . . . . . . . . . . . . . . . . . . . . . . . . . . . 117 131 (17)Other Assets and Liabilities . . . . . . . . . . . . . . . . . . . . . . . . . . . . . . . . . . . . . . . . . . . . . . . . . . . . . . . . 100 161 64
Net Cash Provided by Operating Activities . . . . . . . . . . . . . . . . . . . . . . . . . . . . . . . . . . . . . . . . . . . . . . . . 1,890 1,869 1,786
Investing ActivitiesCapital Expenditures . . . . . . . . . . . . . . . . . . . . . . . . . . . . . . . . . . . . . . . . . . . . . . . . . . . . . . . . . . . . . . . . . (990) (727) (715)Return of Capital from Easton Town Center, LLC . . . . . . . . . . . . . . . . . . . . . . . . . . . . . . . . . . . . . . . . . . 108 — —Acquisition, Net of Cash Acquired of $1 . . . . . . . . . . . . . . . . . . . . . . . . . . . . . . . . . . . . . . . . . . . . . . . . . (33) — —Proceeds from Sale of Assets . . . . . . . . . . . . . . . . . . . . . . . . . . . . . . . . . . . . . . . . . . . . . . . . . . . . . . . . . . 53 196 —Proceeds from Sale of Marketable Securities . . . . . . . . . . . . . . . . . . . . . . . . . . . . . . . . . . . . . . . . . . . . . . 10 50 —Proceeds from Divestiture of Third-party Apparel Sourcing Business . . . . . . . . . . . . . . . . . . . . . . . . . . . — 85 —Purchases of Marketable Securities . . . . . . . . . . . . . . . . . . . . . . . . . . . . . . . . . . . . . . . . . . . . . . . . . . . . . . — (60) —Other Investing Activities . . . . . . . . . . . . . . . . . . . . . . . . . . . . . . . . . . . . . . . . . . . . . . . . . . . . . . . . . . . . . 19 13 16
Net Cash Used for Investing Activities . . . . . . . . . . . . . . . . . . . . . . . . . . . . . . . . . . . . . . . . . . . . . . . . . . . (833) (443) (699)
Financing ActivitiesProceeds from Issuance of Long-term Debt, Net of Issuance Costs . . . . . . . . . . . . . . . . . . . . . . . . . . . . . 692 988 —Payments of Long-term Debt . . . . . . . . . . . . . . . . . . . . . . . . . . . . . . . . . . . . . . . . . . . . . . . . . . . . . . . . . . (742) — (213)Borrowings from Debt Facilities . . . . . . . . . . . . . . . . . . . . . . . . . . . . . . . . . . . . . . . . . . . . . . . . . . . . . . . . 35 7 5Repayments on Debt Facilities . . . . . . . . . . . . . . . . . . . . . . . . . . . . . . . . . . . . . . . . . . . . . . . . . . . . . . . . . (6) — (5)Dividends Paid . . . . . . . . . . . . . . . . . . . . . . . . . . . . . . . . . . . . . . . . . . . . . . . . . . . . . . . . . . . . . . . . . . . . . . (1,268) (1,171) (691)Repurchases of Common Stock . . . . . . . . . . . . . . . . . . . . . . . . . . . . . . . . . . . . . . . . . . . . . . . . . . . . . . . . . (435) (483) (87)Excess Tax Benefits from Share-based Compensation . . . . . . . . . . . . . . . . . . . . . . . . . . . . . . . . . . . . . . . 42 70 43Proceeds from Exercise of Stock Options . . . . . . . . . . . . . . . . . . . . . . . . . . . . . . . . . . . . . . . . . . . . . . . . . 20 33 35Financing Costs and Other . . . . . . . . . . . . . . . . . . . . . . . . . . . . . . . . . . . . . . . . . . . . . . . . . . . . . . . . . . . . . (3) (2) (6)
Net Cash Used for Financing Activities . . . . . . . . . . . . . . . . . . . . . . . . . . . . . . . . . . . . . . . . . . . . . . . . . . (1,665) (558) (919)
Effects of Exchange Rate Changes on Cash . . . . . . . . . . . . . . . . . . . . . . . . . . . . . . . . . . . . . . . . . . . . . . . (6) (1) (6)Net Increase (Decrease) in Cash and Cash Equivalents . . . . . . . . . . . . . . . . . . . . . . . . . . . . . . . . . . . . . . (614) 867 162Cash and Cash Equivalents, Beginning of Year . . . . . . . . . . . . . . . . . . . . . . . . . . . . . . . . . . . . . . . . . . . . 2,548 1,681 1,519
Cash and Cash Equivalents, End of Year . . . . . . . . . . . . . . . . . . . . . . . . . . . . . . . . . . . . . . . . . . . . . . . . . $ 1,934 $ 2,548 $1,681
The accompanying Notes are an integral part of these Consolidated Financial Statements.
65
Fo
rm10-K

L BRANDS, INC.
NOTES TO CONSOLIDATED FINANCIAL STATEMENTS
1. Description of Business and Summary of Significant Accounting Policies
Description of Business
L Brands, Inc. (“the Company”) operates in the highly competitive specialty retail business. The Company is aspecialty retailer of women’s intimate and other apparel, personal care, beauty and home fragrance categories.The Company sells its merchandise through company-owned specialty retail stores in the U.S., Canada, U.K. andGreater China, which are primarily mall-based, and through its websites and other channels. The Company’sother international operations are primarily through franchise, license and wholesale partners. The Companycurrently operates the following retail brands:
• Victoria’s Secret
• PINK
• Bath & Body Works
• La Senza
• Henri Bendel
Fiscal Year
The Company’s fiscal year ends on the Saturday nearest to January 31. As used herein, “2016”, “2015” and“2014” refer to the 52-week periods ending January 28, 2017, January 30, 2016 and January 31, 2015,respectively.
Basis of Consolidation
The Consolidated Financial Statements include the accounts of the Company and its subsidiaries. All significantintercompany balances and transactions have been eliminated in consolidation.
The Company accounts for investments in unconsolidated entities where it exercises significant influence, butdoes not have control, using the equity method. Under the equity method of accounting, the Company recognizesits share of the investee’s net income or loss. Losses are only recognized to the extent the Company has positivecarrying value related to the investee. Carrying values are only reduced below zero if the Company has anobligation to provide funding to the investee. The Company’s share of net income or loss of unconsolidatedentities from which the Company purchases merchandise or merchandise components is included in Costs ofGoods Sold, Buying and Occupancy on the Consolidated Statements of Income. The Company’s share of netincome or loss of all other unconsolidated entities is included in Other Income on the Consolidated Statements ofIncome. The Company’s equity investments are required to be reviewed for impairment when it is determinedthere may be an other than temporary loss in value.
Cash and Cash Equivalents
Cash and Cash Equivalents include cash on hand, demand deposits with financial institutions and highly liquidinvestments with original maturities of less than 90 days. The Company’s outstanding checks, which totaled $5million as of January 28, 2017 and $30 million as of January 30, 2016, are included in Accounts Payable on theConsolidated Balance Sheets.
Concentration of Credit Risk
The Company maintains cash and cash equivalents and derivative contracts with various major financialinstitutions. The Company monitors the relative credit standing of financial institutions with whom the Company
66

transacts and limits the amount of credit exposure with any one entity. Typically, the Company’s investmentportfolio is primarily comprised of U.S. government obligations, U.S. Treasury and AAA-rated money marketfunds, commercial paper and bank deposits.
The Company also periodically reviews the relative credit standing of franchise, license and wholesale partnersand other entities to which the Company grants credit terms in the normal course of business. The Companyrecords an allowance for uncollectable accounts when it becomes probable that the counterparty will be unable topay.
Marketable Equity Securities
The Company has marketable equity securities which are classified as available-for-sale. The Companydetermines the appropriate classification of investments in equity securities at the acquisition date and re-evaluates the classification at each balance sheet date. This investment is recorded at fair value in other currentassets on the Consolidated Balance Sheets, and unrealized holding gains and losses are recorded, net of tax, as acomponent of accumulated other comprehensive income.
Inventories
Inventories are principally valued at the lower of cost or market, on a weighted-average cost basis.
The Company records valuation adjustments to its inventories if the cost of inventory on hand exceeds theamount it expects to realize from the ultimate sale or disposal of the inventory. These estimates are based onmanagement’s judgment regarding future demand and market conditions and analysis of historical experience.
The Company also records inventory loss adjustments for estimated physical inventory losses that have occurredsince the date of the last physical inventory. These estimates are based on management’s analysis of historicalresults and operating trends.
Advertising Costs
Advertising and catalogue costs are expensed at the time the promotion first appears in media, in the store orwhen the advertising is mailed. Advertising and catalogue costs totaled $325 million for 2016, $414 million for2015 and $436 million for 2014.
Property and Equipment
The Company’s property and equipment are recorded at cost and depreciation/amortization is computed on astraight-line basis using the following depreciable life ranges:
Category of Property and Equipment Depreciable Life Range
Software, including software developed for internal use . . . . . . . . . . . . . . . . . . 3 - 7 yearsStore related assets . . . . . . . . . . . . . . . . . . . . . . . . . . . . . . . . . . . . . . . . . . . . . . . 3 - 10 yearsLeasehold improvements . . . . . . . . . . . . . . . . . . . . . . . . . . . . . . . . . . . . . . . . . . Shorter of lease term or 10 yearsNon-store related building and site improvements . . . . . . . . . . . . . . . . . . . . . . . 10 - 15 yearsOther property and equipment . . . . . . . . . . . . . . . . . . . . . . . . . . . . . . . . . . . . . . 20 yearsBuildings . . . . . . . . . . . . . . . . . . . . . . . . . . . . . . . . . . . . . . . . . . . . . . . . . . . . . . . 30 years
When a decision has been made to dispose of property and equipment prior to the end of the previously estimateduseful life, depreciation estimates are revised to reflect the use of the asset over the shortened estimated usefullife. The Company’s cost of assets sold or retired and the related accumulated depreciation are removed from theaccounts with any resulting gain or loss included in net income. Maintenance and repairs are charged to expenseas incurred. Major renewals and betterments that extend useful lives are capitalized.
67
Fo
rm10-K

Property and equipment are reviewed for impairment whenever events or changes in circumstances indicate thatthe carrying amount of the asset may not be recoverable. If the estimated undiscounted future cash flows relatedto the asset are less than the carrying value, the Company recognizes a loss equal to the difference between thecarrying value and the estimated fair value, usually determined by the estimated discounted future cash flows ofthe asset.
Goodwill and Intangible Assets
The Company has certain intangible assets resulting from business combinations and acquisitions that arerecorded at cost. Intangible assets with finite lives are amortized on a straight-line basis over their respectiveestimated useful lives.
Intangible assets with finite lives are reviewed for impairment whenever events or changes in circumstancesindicate that the carrying amount of the asset may not be recoverable. If the estimated undiscounted future cashflows related to the asset are less than the carrying value, the Company recognizes a loss equal to the differencebetween the carrying value and the estimated fair value, usually determined by the estimated discounted futurecash flows of the asset.
Goodwill is reviewed for impairment each year in the fourth quarter and may be reviewed more frequently ifcertain events occur or circumstances change. First, the Company performs a qualitative assessment to determinewhether it is more likely than not that each reporting unit’s fair value is less than its carrying value, includinggoodwill. If the Company determines that it is more likely than not that the fair value of the reporting unit is lessthan its carrying value, the Company then estimates the fair value of all assets and liabilities of that reportingunit, including the implied fair value of goodwill, through either estimated discounted future cash flows ormarket-based methodologies. If the carrying value of goodwill exceeds the implied fair value, the Companyrecognizes an impairment charge equal to the difference. The Company’s reporting units are determined inaccordance with the provisions of Accounting Standards Codification (“ASC”) Topic 350, Intangibles—Goodwill and Other. The Company’s reporting units that have goodwill are Victoria’s Secret Stores, Victoria’sSecret Direct, Bath & Body Works Stores and Greater China.
Intangible assets with indefinite lives are reviewed for impairment each year in the fourth quarter and may bereviewed more frequently if certain events occur or circumstances change. The Company first performs aqualitative assessment to determine whether it is more likely than not that the indefinite-lived intangible asset isimpaired. If the Company determines that it is more likely than not that the fair value of the asset is less than itscarrying amount, the Company estimates the fair value, usually determined by the estimated discounted futurecash flows of the asset, compare that value with its carrying amount and record an impairment charge, if any.
If future economic conditions are different than those projected by management, future impairment charges maybe required.
Leases and Leasehold Improvements
The Company has leases that contain predetermined fixed escalations of minimum rentals and/or rent abatementssubsequent to taking possession of the leased property. The Company recognizes the related rent expense on astraight-line basis commencing upon the store possession date. The Company records the difference between therecognized rental expense and amounts payable under the leases as deferred lease credits. The Company’sliability for predetermined fixed escalations of minimum rentals and/or rent abatements totaled $191 million asof January 28, 2017 and $150 million as of January 30, 2016. These liabilities are included in Other Long-termLiabilities on the Consolidated Balance Sheets.
The Company receives construction allowances from landlords related to its retail stores. These allowances aregenerally comprised of cash amounts received by the Company from its landlords as part of the negotiated leaseterms. The Company records a receivable and a landlord allowance at the lease commencement date (date of
68

initial possession of the store). The landlord allowance is amortized on a straight-line basis as a reduction of rentexpense over the term of the lease (including the pre-opening build-out period), and the receivable is reduced asamounts are received from the landlord. The Company’s unamortized portion of landlord allowances, whichtotaled $279 million as of January 28, 2017 and $212 million as of January 30, 2016, is included in Other Long-term Liabilities on the Consolidated Balance Sheets.
The Company also has leasehold improvements which are amortized over the shorter of their estimated usefullives or the period from the date the assets are placed in service to the end of the initial lease term. Leaseholdimprovements made after the inception of the initial lease term are depreciated over the shorter of their estimateduseful lives or the remaining lease term, including renewal periods, if reasonably assured.
Foreign Currency Translation
The functional currency of the Company’s foreign operations is generally the applicable local currency. Assetsand liabilities are translated into U.S. dollars using the current exchange rates in effect as of the balance sheetdate, while revenues and expenses are translated at the average exchange rates for the period. The Company’sresulting translation adjustments are recorded as a component of Comprehensive Income in the ConsolidatedStatements of Comprehensive Income and the Consolidated Statements of Total Equity (Deficit).
Derivative Financial Instruments
The Company uses derivative financial instruments to manage exposure to foreign currency exchange rates andinterest rates. The Company does not use derivative instruments for trading purposes. All derivative instrumentsare recorded on the Consolidated Balance Sheets at fair value.
For derivative financial instruments that are designated and qualify as cash flow hedges, the effective portion ofthe gain or loss on the derivative instrument is reported as a component of accumulated other comprehensiveincome (loss) in shareholders’ equity and reclassified into earnings in the same period during which the hedgeditem affects earnings. Gains and losses that are reclassified into earnings are recognized in the same line item onthe Consolidated Statement of Income as the underlying hedged item. Gains and losses on the derivativerepresenting hedge ineffectiveness, if any, are recognized in current earnings.
For derivative financial instruments that are designated and qualify as fair value hedges, the change in the fairvalue of the derivative instrument has an equal and offsetting impact to the carrying value of the liability on thebalance sheet.
For derivative financial instruments that are not designated as hedging instruments, the gain or loss on thederivative instrument is recognized in current earnings in Other Income in the Consolidated Statements ofIncome.
Fair Value
The authoritative guidance included in ASC Topic 820, Fair Value Measurement, defines fair value as theexchange price that would be received for an asset or paid to transfer a liability (an exit price) in the principal ormost advantageous market for the asset or liability in an orderly transaction between market participants. Thisauthoritative guidance further establishes a three-level fair value hierarchy that prioritizes the inputs used tomeasure fair value. This hierarchy requires entities to maximize the use of observable inputs and minimize theuse of unobservable inputs. The three levels of inputs used to measure fair value are as follows:
• Level 1—Quoted market prices in active markets for identical assets or liabilities.
• Level 2—Observable inputs other than quoted market prices included in Level 1, such as quoted pricesof similar assets and liabilities in active markets; quoted prices for identical or similar assets andliabilities in markets that are not active; or other inputs that are observable or can be corroborated byobservable market data.
69
Fo
rm10-K

• Level 3—Unobservable inputs that are supported by little or no market activity and that are significantto the fair value of the assets and liabilities. This includes certain pricing models, discounted cash flowmethodologies and similar techniques that use significant unobservable inputs.
The Company estimates the fair value of financial instruments, property and equipment and goodwill andintangible assets in accordance with the provisions of ASC Topic 820.
Income Taxes
The Company accounts for income taxes under the asset and liability method. Under this method, taxes currentlypayable or refundable are accrued, and deferred tax assets and liabilities are recognized for the estimated futuretax consequences attributable to differences between the financial statement carrying amounts of existing assetsand liabilities and their respective tax bases. Deferred tax assets are also recognized for realizable operating lossand tax credit carryforwards. Deferred tax assets and liabilities are measured using enacted income tax rates ineffect for the year in which those temporary differences are expected to be recovered or settled. The effect ondeferred tax assets and liabilities of a change in income tax rates is recognized in the Company’s ConsolidatedStatement of Income in the period that includes the enactment date. A valuation allowance is recorded to reducethe carrying amounts of deferred tax assets if it is more likely than not that such assets will not be realized. U.S.deferred income taxes are not provided on undistributed income of foreign subsidiaries where such earnings areconsidered to be permanently reinvested for the foreseeable future.
In determining the Company’s provision for income taxes, the Company considers permanent differencesbetween book and tax income and statutory income tax rates. The Company’s effective income tax rate isaffected by items including changes in tax law, the tax jurisdiction of new stores or business ventures and thelevel of earnings.
The Company follows a two-step approach to recognizing and measuring uncertain tax positions. The first step isto evaluate the tax position for recognition by determining if the available evidence indicates it is more likelythan not that the position will be sustained on audit, including resolution of related appeals or litigationprocesses, if any. The second step is to measure the tax benefit as the largest amount which is more than 50%likely of being realized upon ultimate settlement. The Company considers many factors when evaluating andestimating its tax positions and tax benefits, which may require periodic adjustments and which may notaccurately forecast actual outcomes.
The Company’s income tax returns, like those of most companies, are periodically audited by domestic andforeign tax authorities. These audits include questions regarding the Company’s tax filing positions, including thetiming and amount of deductions and the allocation of income among various tax jurisdictions. At any one time,multiple tax years are subject to audit by the various tax authorities. A number of years may elapse before aparticular matter for which the Company has established an accrual is audited and fully resolved or clarified. TheCompany adjusts its tax contingencies accrual and income tax provision in the period in which matters areeffectively settled with tax authorities at amounts different from its established accrual, when the statute oflimitations expires for the relevant taxing authority to examine the tax position or when more informationbecomes available. The Company includes its tax contingencies accrual, including accrued penalties and interest,in Other Long-term Liabilities on the Consolidated Balance Sheets unless the liability is expected to be paidwithin one year. Changes to the tax contingencies accrual, including accrued penalties and interest, are includedin Provision for Income Taxes on the Consolidated Statements of Income.
Self-Insurance
The Company is self-insured for medical, workers’ compensation, property, general liability and automobileliability up to certain stop-loss limits. Such costs are accrued based on known claims and an estimate of incurredbut not reported (“IBNR”) claims. IBNR claims are estimated using historical claim information and actuarialestimates.
70

Noncontrolling Interest
Noncontrolling interest represents the portion of equity interests of consolidated affiliates not owned by theCompany.
Share-based Compensation
The Company recognizes all share-based payments to employees and directors as compensation cost over theservice period based on their estimated fair value on the date of grant.
Compensation cost is recognized over the service period for the fair value of awards that actually vest.Compensation expense for awards without a performance condition is recognized, net of estimated forfeitures,using a single award approach (each award is valued as one grant, irrespective of the number of vestingtranches). Compensation expense for awards with a performance condition is recognized, net of estimatedforfeitures, using a multiple award approach (each vesting tranche is valued as one grant).
Revenue Recognition
The Company recognizes sales upon customer receipt of the merchandise, which for direct channel revenuesreflects an estimate of shipments that have not yet been received by the customer based on shipping terms andhistorical delivery times. The Company’s shipping and handling revenues are included in Net Sales with therelated costs included in Costs of Goods Sold, Buying and Occupancy on the Consolidated Statements ofIncome. The Company also provides a reserve for projected merchandise returns based on prior experience. NetSales exclude sales tax collected from customers.
The Company’s brands sell gift cards with no expiration dates to customers. The Company does not chargeadministrative fees on unused gift cards. The Company recognizes revenue from gift cards when they areredeemed by the customer. In addition, the Company recognizes revenue on unredeemed gift cards when it candetermine that the likelihood of the gift card being redeemed is remote and that there is no legal obligation toremit the unredeemed gift cards to relevant jurisdictions (gift card breakage). The Company determines the giftcard breakage rate based on historical redemption patterns. Gift card breakage is included in Net Sales in theConsolidated Statements of Income.
The Company also recognizes revenues associated with franchise, license and wholesale arrangements. Revenuerecognized under franchise and license arrangements generally consists of royalties earned and recognized uponsale of merchandise by franchise and license partners to retail customers. Revenue is generally recognized underwholesale and sourcing arrangements at the time the title passes to the partner.
Costs of Goods Sold, Buying and Occupancy
The Company’s costs of goods sold include merchandise costs, net of discounts and allowances, freight andinventory shrinkage. The Company’s buying and occupancy expenses primarily include payroll, benefit costs andoperating expenses for its buying departments and distribution network, rent, common area maintenance, realestate taxes, utilities, maintenance, fulfillment expenses and depreciation for the Company’s stores, warehousefacilities and equipment.
General, Administrative and Store Operating Expenses
The Company’s general, administrative and store operating expenses primarily include payroll and benefit costsfor its store-selling and administrative departments (including corporate functions), marketing, advertising andother operating expenses not specifically categorized elsewhere in the Consolidated Statements of Income.
71
Fo
rm10-K

Use of Estimates in the Preparation of Financial Statements
The preparation of financial statements in conformity with U.S. generally accepted accounting principles requiresmanagement to make estimates and assumptions that affect the reported amounts of assets and liabilities at thedate of the financial statements and the reported amounts of revenues and expenses during the reporting period,as well as the related disclosure of contingent assets and liabilities at the date of the financial statements. Actualresults may differ from those estimates, and the Company revises its estimates and assumptions as newinformation becomes available.
2. New Accounting Pronouncements
Revenue from Contracts with Customers
In May 2014, the Financial Accounting Standards Board (“FASB”) issued Accounting Standards Update(“ASU”) No. 2014-09, Revenue from Contracts with Customers, which has been further clarified and amended in2015 and 2016. This guidance requires companies to recognize revenue in a manner that depicts the transfer ofpromised goods or services to customers in amounts that reflect the consideration to which a company expects tobe entitled in exchange for those goods or services. The new standard also will result in enhanced disclosuresabout the nature, amount, timing and uncertainty of revenue and cash flows arising from contracts withcustomers. This guidance will be effective beginning in fiscal 2018, with early adoption as of fiscal 2017permitted. The standard allows for either a full retrospective or a modified retrospective transition method.
The Company continues to evaluate the impacts of this standard. The most significant changes to currentaccounting relate to the points earned under the Victoria’s Secret customer loyalty program and the accountingfor sales returns. The new standard will require a deferral of revenue associated with loyalty points using arelative fair value approach, and also requires sales returns to be presented on a gross basis with the sales refundliability presented separately from the return asset. The Company is continuing to evaluate the further impactsthe standard will have on the Consolidated Statements of Income and Comprehensive Income, Balance Sheetsand Statements of Cash Flows. The Company will adopt the standard in the first quarter of fiscal 2018, and iscurrently evaluating the transition method.
Leases
In February 2016, the FASB issued ASU No. 2016-02, Leases. This guidance requires companies classified aslessees to put most leases on their balance sheets but recognize expenses on their income statements in a mannersimilar to today’s accounting. The new standard also will result in enhanced quantitative and qualitativedisclosures, including significant judgments made by management, to provide greater insight into the extent ofrevenue and expense recognized and expected to be recognized from existing leases. The standard requiresmodified retrospective adoption and will be effective beginning in fiscal 2019, with early adoption permitted.
The Company is currently evaluating the impacts that this standard will have on its Consolidated Statements ofIncome and Comprehensive Income, Balance Sheets and Statements of Cash Flows, including period ofadoption. The Company currently expects that most of its operating lease commitments will be subject to the newstandard and recognized as operating lease liabilities and right-of-use assets upon adoption. Thus, the Companyexpects adoption will result in a material increase to the assets and liabilities on the Consolidated Balance Sheet.
Simplifying the Presentation of Share-Based Compensation
In March 2016, the FASB issued ASU No. 2016-09, Improvements to Employee Share-Based PaymentAccounting. This guidance requires companies to recognize income tax effects of awards in the income statementwhen the awards vest or are settled. It also will allow an employer to repurchase more of an employee’s sharesthan it can today for tax withholding purposes without triggering liability accounting and to make a policyelection to account for forfeitures as they occur. The standard also will require all tax-related cash flows resulting
72

from share-based payments to be reported as operating activities on the statements of cash flows, and any cashpayments made to taxing authorities on an employee’s behalf as financing activities. The standard is effectivebeginning in fiscal 2017.
This standard is expected to result in increased volatility to the income tax expense in future periods dependentupon, among other variables, the price of the Company’s common stock and the timing and volume of share-based payment award activity, such as employee exercises of stock options and vesting of restricted stockawards. Further, the standard is expected to impact the operating and financing cash flows on the ConsolidatedStatements of Cash Flows. The Company does not expect any further material impacts on its ConsolidatedStatements of Income and Comprehensive Income, Balance Sheets and Statements of Cash Flows. The Companywill adopt ASU 2016-09 in the first quarter of 2017.
3. Earnings Per Share
Earnings per basic share is computed based on the weighted-average number of outstanding common shares.Earnings per diluted share include the weighted-average effect of dilutive options and restricted stock on theweighted-average shares outstanding.
The following table provides shares utilized for the calculation of basic and diluted earnings per share for 2016,2015 and 2014:
2016 2015 2014
(in millions)
Weighted-average Common Shares:Issued Shares . . . . . . . . . . . . . . . . . . . . . . . . . . . . . . . . . . . . . . . . . . . . . . . . . . . . . . . . . . . . 314 312 309Treasury Shares . . . . . . . . . . . . . . . . . . . . . . . . . . . . . . . . . . . . . . . . . . . . . . . . . . . . . . . . . . (27) (21) (17)
Basic Shares . . . . . . . . . . . . . . . . . . . . . . . . . . . . . . . . . . . . . . . . . . . . . . . . . . . . . . . . . . . . . . . . 287 291 292Effect of Dilutive Options and Restricted Stock . . . . . . . . . . . . . . . . . . . . . . . . . . . . . . . . . . . . . 4 6 6
Diluted Shares . . . . . . . . . . . . . . . . . . . . . . . . . . . . . . . . . . . . . . . . . . . . . . . . . . . . . . . . . . . . . . 291 297 298
Anti-dilutive Options and Awards (a) . . . . . . . . . . . . . . . . . . . . . . . . . . . . . . . . . . . . . . . . . . . . . 2 1 1
(a) These options and awards were excluded from the calculation of diluted earnings per share because theirinclusion would have been anti-dilutive.
4. Acquisition
On April 18, 2016, the Company completed the acquisition of 100% of the shares of American Beauty Limitedfor a total purchase price of $44 million. This agreement included the reacquisition of the franchise rights fromone of our partners to operate Victoria’s Secret Beauty and Accessories stores in Greater China, including 26stores already open at the time of acquisition. The purchase price included $10 million in forgiveness ofliabilities owed to the Company from the pre-existing relationship. As a result of this acquisition, the Company’sfinancial statements now include the financial results of American Beauty Limited, which are reported as part ofthe Victoria’s Secret and Bath & Body Works International segment.
The total purchase price was allocated to the net tangible and intangible assets acquired based on their estimatedfair value. Such estimated fair values require management to make estimates and judgments, especially withrespect to intangible assets. The allocation of the purchase price to goodwill was complete as of the secondquarter of 2016. Goodwill related to the acquisition is not deductible for tax purposes.
73
Fo
rm10-K

The allocation of the purchase price to the fair value of assets acquired and liabilities assumed is as follows:
(in millions)
Cash and Cash Equivalents . . . . . . . . . . . . . . . . . . . . . . . . . . . . . . . . . . . . . . . . . . . . . . . . . . . . . . . . . . . $ 1Inventories . . . . . . . . . . . . . . . . . . . . . . . . . . . . . . . . . . . . . . . . . . . . . . . . . . . . . . . . . . . . . . . . . . . . . . . 3Property and Equipment . . . . . . . . . . . . . . . . . . . . . . . . . . . . . . . . . . . . . . . . . . . . . . . . . . . . . . . . . . . . . 10Goodwill . . . . . . . . . . . . . . . . . . . . . . . . . . . . . . . . . . . . . . . . . . . . . . . . . . . . . . . . . . . . . . . . . . . . . . . . . 30Other Assets . . . . . . . . . . . . . . . . . . . . . . . . . . . . . . . . . . . . . . . . . . . . . . . . . . . . . . . . . . . . . . . . . . . . . . 3Current Liabilities . . . . . . . . . . . . . . . . . . . . . . . . . . . . . . . . . . . . . . . . . . . . . . . . . . . . . . . . . . . . . . . . . . (3)
Net Assets Acquired . . . . . . . . . . . . . . . . . . . . . . . . . . . . . . . . . . . . . . . . . . . . . . . . . . . . . . . . . . . . $ 44
Forgiveness of Liabilities Owed to the Company . . . . . . . . . . . . . . . . . . . . . . . . . . . . . . . . . . . . . . . . . (10)
Consideration Paid . . . . . . . . . . . . . . . . . . . . . . . . . . . . . . . . . . . . . . . . . . . . . . . . . . . . . . . . . . . . . $ 34
5. Restructuring Activities
During the first quarter of 2016, the Company announced strategic actions within the Victoria’s Secret segmentdesigned to focus the brand on its core merchandise categories and streamline operations. The Companyannounced it will place more focus on brand building and loyalty-enhancing marketing and advertising ratherthan using traditional catalogues and offers. As a result of these actions, the Company recorded charges related tocancellations of fabric commitments for non-go forward merchandise and a reserve against paper that waspreviously intended for future catalogues. These costs, totaling $11 million, including non-cash charges of $10million, are included in Cost of Goods Sold, Buying and Occupancy on the 2016 Consolidated Statement ofIncome. These actions also resulted in the elimination of approximately 200 positions primarily in theCompany’s Ohio and New York home offices. Severance and related costs associated with these eliminations,totaling $24 million, are included in General, Administrative and Store Operating Expenses on the 2016Consolidated Statement of Income. The Company recognized a total pre-tax charge of $35 million for theseitems in the first quarter of 2016. Through the fourth quarter of 2016, the Company made cash payments of $16million and decreased the estimate of expected severance and related costs by $4 million. The remaining balanceof $5 million is included in Accrued Expenses and Other on the January 28, 2017 Consolidated Balance Sheet.
6. Inventories
The following table provides details of inventories as of January 28, 2017 and January 30, 2016:
January 28,2017
January 30,2016
(in millions)
Finished Goods Merchandise . . . . . . . . . . . . . . . . . . . . . . . . . . . . . . . . . . . . . . . . . . . . . . . $ 982 $1,014Raw Materials and Merchandise Components . . . . . . . . . . . . . . . . . . . . . . . . . . . . . . . . . . 114 108
Total Inventories . . . . . . . . . . . . . . . . . . . . . . . . . . . . . . . . . . . . . . . . . . . . . . . . . . . . . . . . $1,096 $1,122
74

7. Property and Equipment, Net
The following table provides details of property and equipment, net as of January 28, 2017 and January 30, 2016:
January 28,2017
January 30,2016
(in millions)
Land and Improvements . . . . . . . . . . . . . . . . . . . . . . . . . . . . . . . . . . . . . . . . . . . . . . . . . . . $ 113 $ 108Buildings and Improvements . . . . . . . . . . . . . . . . . . . . . . . . . . . . . . . . . . . . . . . . . . . . . . . 476 460Furniture, Fixtures, Software and Equipment . . . . . . . . . . . . . . . . . . . . . . . . . . . . . . . . . . . 3,560 3,181Leasehold Improvements . . . . . . . . . . . . . . . . . . . . . . . . . . . . . . . . . . . . . . . . . . . . . . . . . . 2,044 1,809Construction in Progress . . . . . . . . . . . . . . . . . . . . . . . . . . . . . . . . . . . . . . . . . . . . . . . . . . . 89 81
Total . . . . . . . . . . . . . . . . . . . . . . . . . . . . . . . . . . . . . . . . . . . . . . . . . . . . . . . . . . . . . . . . . . 6,282 5,639Accumulated Depreciation and Amortization . . . . . . . . . . . . . . . . . . . . . . . . . . . . . . . . . . (3,541) (3,309)
Property and Equipment, Net . . . . . . . . . . . . . . . . . . . . . . . . . . . . . . . . . . . . . . . . . . . . . $ 2,741 $ 2,330
Depreciation expense was $518 million in 2016, $457 million in 2015 and $438 million in 2014.
In 2016 and 2015, the Company completed sale and leaseback transactions under noncancellable operating leasesof certain assets. The carrying value of assets sold under these arrangements was $51 million and $177 millionfor 2016 and 2015, respectively. Proceeds of $51 million and $178 million are included in Proceeds from Sale ofAssets within the Investing Activities section of the Consolidated Statements of Cash Flows. For additionalinformation, see Note 17, “Commitments and Contingencies.”
8. Goodwill, Trade Names and Other Intangible Assets, Net
Goodwill
The following table provides detail regarding the composition of goodwill for the fiscal years ended January 28,2017 and January 30, 2016:
January 28,2017
January 30,2016
(in millions)
Victoria’s Secret . . . . . . . . . . . . . . . . . . . . . . . . . . . . . . . . . . . . . . . . . . . . . . . . . . . . . . . . . $ 690 $ 690Bath & Body Works . . . . . . . . . . . . . . . . . . . . . . . . . . . . . . . . . . . . . . . . . . . . . . . . . . . . . . 628 628Victoria’s Secret and Bath & Body Works International . . . . . . . . . . . . . . . . . . . . . . . . . . 30 —
Goodwill . . . . . . . . . . . . . . . . . . . . . . . . . . . . . . . . . . . . . . . . . . . . . . . . . . . . . . . . . . . . . . . $1,348 $1,318
In 2016, the Company reacquired from one of its partners the franchise rights to operate Victoria’s Secret Beautyand Accessories stores in Greater China, including 26 stores already open at the time of acquisition. As a resultof the acquisition, the Company recognized $30 million of goodwill within the Victoria’s Secret and Bath &Body Works International reportable segment. For additional information, see Note 4, “Acquisition.”
The Company tests for goodwill impairment at the reporting unit level. The Company’s reporting units withgoodwill balances at January 28, 2017 were Victoria’s Secret Stores, Victoria’s Secret Direct, Bath & BodyWorks Stores and Greater China.
75
Fo
rm10-K

Intangible Assets—Indefinite Lives
Intangible assets with indefinite lives represent the Victoria’s Secret and Bath & Body Works trade names whichare included in Trade Names and Other Intangible Assets, Net on the Consolidated Balance Sheets. Thefollowing table provides additional detail regarding the composition of trade names as of January 28, 2017 andJanuary 30, 2016:
January 28,2017
January 30,2016
(in millions)
Victoria’s Secret . . . . . . . . . . . . . . . . . . . . . . . . . . . . . . . . . . . . . . . . . . . . . . . . . . . . . . . . . $246 $246Bath & Body Works . . . . . . . . . . . . . . . . . . . . . . . . . . . . . . . . . . . . . . . . . . . . . . . . . . . . . . 165 165
Trade Names . . . . . . . . . . . . . . . . . . . . . . . . . . . . . . . . . . . . . . . . . . . . . . . . . . . . . . . . . . . $411 $411
Intangible Assets—Finite Lives
Intangible assets with finite lives represent certain trademarks and customer relationships. These assets werefully amortized in 2013.
9. Equity Investments and Other
Third-party Apparel Sourcing Business
In 2015, the Company divested its remaining ownership interest in its third-party apparel sourcing business. TheCompany received cash proceeds of $85 million and recognized a pre-tax gain of $78 million (after-tax gain of$69 million). The gain is included in Other Income in the 2015 Consolidated Statement of Income and the cashproceeds are included in Proceeds from Divestiture of Third-party Apparel Sourcing Business within theInvesting Activities section of the 2015 Consolidated Statement of Cash Flows.
Easton Investments
The Company has land and other investments in Easton, an approximately 1,300 acre planned community inColumbus, Ohio that integrates office, hotel, retail, residential and recreational space. These investments, totaling$79 million as of January 28, 2017 and $86 million as of January 30, 2016, are recorded in Other Assets on theConsolidated Balance Sheets.
Included in the Company’s Easton investments is an equity interest in Easton Town Center, LLC (“ETC”), anentity that owns and has developed a commercial entertainment and shopping center. The Company’s investmentin ETC is accounted for using the equity method of accounting. The Company has a majority financial interest inETC, but another unaffiliated member manages ETC. Certain significant decisions regarding ETC require theconsent of unaffiliated members in addition to the Company.
In 2016, ETC refinanced its bank loan. In conjunction with the loan refinancing, the Company received a cashdistribution from ETC of $124 million and recognized a pre-tax gain of $108 million (after-tax gain of $70million). The gain is included in Other Income in the 2016 Consolidated Statement of Income and the return ofcapital is included within the Investing Activities section of the 2016 Consolidated Statement of Cash Flows.
Also included in the Company’s Easton investments is an equity interest in Easton Gateway, LLC (“EG”), anentity that owns and has developed a commercial shopping center in the Easton community. The Company’sinvestment in EG is accounted for using the equity method of accounting. The Company has a majority financialinterest in EG, but another unaffiliated member manages EG. Certain significant decisions regarding EG requirethe consent of the unaffiliated member in addition to the Company.
76

10. Accrued Expenses and Other
The following table provides additional information about the composition of accrued expenses and other as ofJanuary 28, 2017 and January 30, 2016:
January 28,2017
January 30,2016
(in millions)
Deferred Revenue, Principally from Gift Card Sales . . . . . . . . . . . . . . . . . . . . . . . . . . . . . $259 $243Compensation, Payroll Taxes and Benefits . . . . . . . . . . . . . . . . . . . . . . . . . . . . . . . . . . . . 191 238Interest . . . . . . . . . . . . . . . . . . . . . . . . . . . . . . . . . . . . . . . . . . . . . . . . . . . . . . . . . . . . . . . . . 99 100Taxes, Other than Income . . . . . . . . . . . . . . . . . . . . . . . . . . . . . . . . . . . . . . . . . . . . . . . . . . 82 76Rent . . . . . . . . . . . . . . . . . . . . . . . . . . . . . . . . . . . . . . . . . . . . . . . . . . . . . . . . . . . . . . . . . . . 48 48Accrued Claims on Self-insured Activities . . . . . . . . . . . . . . . . . . . . . . . . . . . . . . . . . . . . 35 35Returns Reserve . . . . . . . . . . . . . . . . . . . . . . . . . . . . . . . . . . . . . . . . . . . . . . . . . . . . . . . . . 21 27Other . . . . . . . . . . . . . . . . . . . . . . . . . . . . . . . . . . . . . . . . . . . . . . . . . . . . . . . . . . . . . . . . . . 262 210
Total Accrued Expenses and Other . . . . . . . . . . . . . . . . . . . . . . . . . . . . . . . . . . . . . . . . . $997 $977
11. Income Taxes
The following table provides the components of the Company’s provision for income taxes for 2016, 2015 and2014:
2016 2015 2014
(in millions)
Current:U.S. Federal . . . . . . . . . . . . . . . . . . . . . . . . . . . . . . . . . . . . . . . . . . . . . . . . . . . . . . . . . . . $345 $553 $454U.S. State . . . . . . . . . . . . . . . . . . . . . . . . . . . . . . . . . . . . . . . . . . . . . . . . . . . . . . . . . . . . . 62 96 69Non-U.S. . . . . . . . . . . . . . . . . . . . . . . . . . . . . . . . . . . . . . . . . . . . . . . . . . . . . . . . . . . . . . 21 21 21
Total . . . . . . . . . . . . . . . . . . . . . . . . . . . . . . . . . . . . . . . . . . . . . . . . . . . . . . . . . . . . . . . . . . . . 428 670 544
Deferred:U.S. Federal . . . . . . . . . . . . . . . . . . . . . . . . . . . . . . . . . . . . . . . . . . . . . . . . . . . . . . . . . . . 99 17 46U.S. State . . . . . . . . . . . . . . . . . . . . . . . . . . . . . . . . . . . . . . . . . . . . . . . . . . . . . . . . . . . . . 8 6 3Non-U.S. . . . . . . . . . . . . . . . . . . . . . . . . . . . . . . . . . . . . . . . . . . . . . . . . . . . . . . . . . . . . . 3 (12) 1
Total . . . . . . . . . . . . . . . . . . . . . . . . . . . . . . . . . . . . . . . . . . . . . . . . . . . . . . . . . . . . . . . . . . . . 110 11 50
Provision for Income Taxes . . . . . . . . . . . . . . . . . . . . . . . . . . . . . . . . . . . . . . . . . . . . . . . . . $538 $681 $594
The non-U.S. component of pre-tax income, arising principally from overseas operations, was income of$134 million, $267 million and $152 million for 2016, 2015 and 2014, respectively.
The Company’s income taxes payable has been reduced by the excess tax benefits from employee stock planawards. For stock options, the Company receives an excess income tax benefit calculated as the tax effect of thedifference between the fair market value of the stock at the time of grant and exercise. For restricted stock, theCompany receives an excess income tax benefit calculated as the tax effect of the difference between the fairmarket value of the stock at the time of grant and vesting. The Company had net excess tax benefits from equityawards of $42 million, $70 million and $43 million in 2016, 2015 and 2014, respectively, which were reflectedas increases to equity.
77
Fo
rm10-K
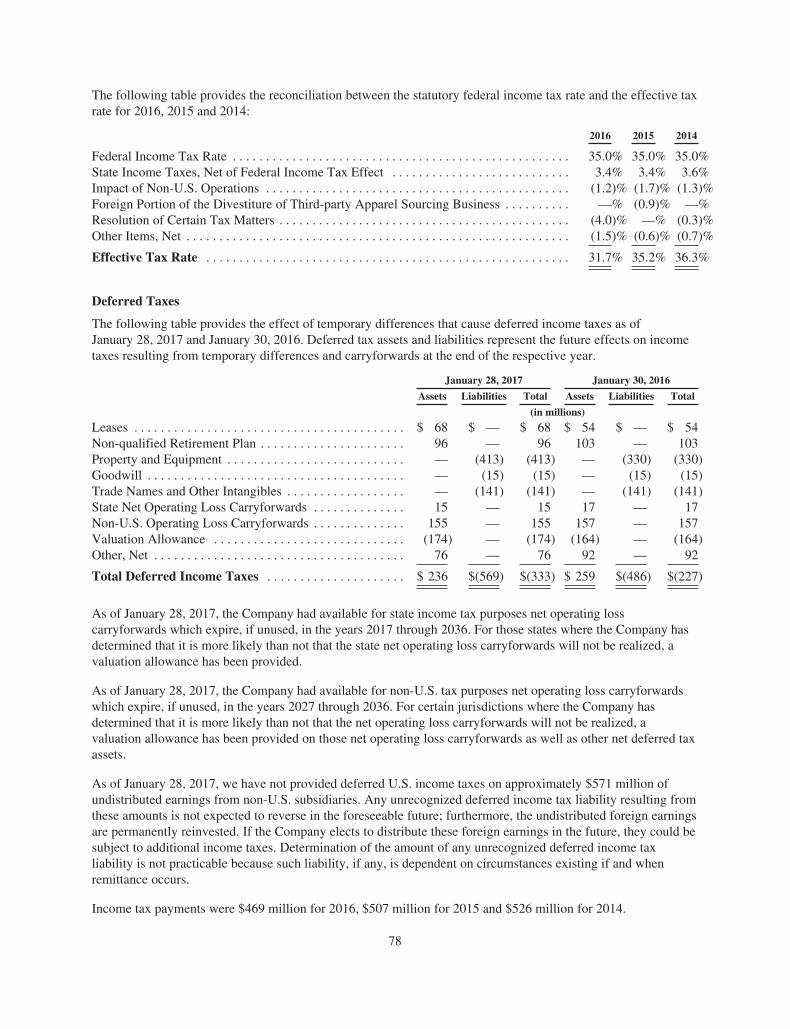
The following table provides the reconciliation between the statutory federal income tax rate and the effective taxrate for 2016, 2015 and 2014:
2016 2015 2014
Federal Income Tax Rate . . . . . . . . . . . . . . . . . . . . . . . . . . . . . . . . . . . . . . . . . . . . . . . . . . . 35.0% 35.0% 35.0%State Income Taxes, Net of Federal Income Tax Effect . . . . . . . . . . . . . . . . . . . . . . . . . . . 3.4% 3.4% 3.6%Impact of Non-U.S. Operations . . . . . . . . . . . . . . . . . . . . . . . . . . . . . . . . . . . . . . . . . . . . . . (1.2)% (1.7)% (1.3)%Foreign Portion of the Divestiture of Third-party Apparel Sourcing Business . . . . . . . . . . —% (0.9)% —%Resolution of Certain Tax Matters . . . . . . . . . . . . . . . . . . . . . . . . . . . . . . . . . . . . . . . . . . . . (4.0)% —% (0.3)%Other Items, Net . . . . . . . . . . . . . . . . . . . . . . . . . . . . . . . . . . . . . . . . . . . . . . . . . . . . . . . . . . (1.5)% (0.6)% (0.7)%
Effective Tax Rate . . . . . . . . . . . . . . . . . . . . . . . . . . . . . . . . . . . . . . . . . . . . . . . . . . . . . . . 31.7% 35.2% 36.3%
Deferred Taxes
The following table provides the effect of temporary differences that cause deferred income taxes as ofJanuary 28, 2017 and January 30, 2016. Deferred tax assets and liabilities represent the future effects on incometaxes resulting from temporary differences and carryforwards at the end of the respective year.
January 28, 2017 January 30, 2016
Assets Liabilities Total Assets Liabilities Total
(in millions)
Leases . . . . . . . . . . . . . . . . . . . . . . . . . . . . . . . . . . . . . . . . . $ 68 $ — $ 68 $ 54 $ — $ 54Non-qualified Retirement Plan . . . . . . . . . . . . . . . . . . . . . . 96 — 96 103 — 103Property and Equipment . . . . . . . . . . . . . . . . . . . . . . . . . . . — (413) (413) — (330) (330)Goodwill . . . . . . . . . . . . . . . . . . . . . . . . . . . . . . . . . . . . . . . — (15) (15) — (15) (15)Trade Names and Other Intangibles . . . . . . . . . . . . . . . . . . — (141) (141) — (141) (141)State Net Operating Loss Carryforwards . . . . . . . . . . . . . . 15 — 15 17 — 17Non-U.S. Operating Loss Carryforwards . . . . . . . . . . . . . . 155 — 155 157 — 157Valuation Allowance . . . . . . . . . . . . . . . . . . . . . . . . . . . . . (174) — (174) (164) — (164)Other, Net . . . . . . . . . . . . . . . . . . . . . . . . . . . . . . . . . . . . . . 76 — 76 92 — 92
Total Deferred Income Taxes . . . . . . . . . . . . . . . . . . . . . $ 236 $(569) $(333) $ 259 $(486) $(227)
As of January 28, 2017, the Company had available for state income tax purposes net operating losscarryforwards which expire, if unused, in the years 2017 through 2036. For those states where the Company hasdetermined that it is more likely than not that the state net operating loss carryforwards will not be realized, avaluation allowance has been provided.
As of January 28, 2017, the Company had available for non-U.S. tax purposes net operating loss carryforwardswhich expire, if unused, in the years 2027 through 2036. For certain jurisdictions where the Company hasdetermined that it is more likely than not that the net operating loss carryforwards will not be realized, avaluation allowance has been provided on those net operating loss carryforwards as well as other net deferred taxassets.
As of January 28, 2017, we have not provided deferred U.S. income taxes on approximately $571 million ofundistributed earnings from non-U.S. subsidiaries. Any unrecognized deferred income tax liability resulting fromthese amounts is not expected to reverse in the foreseeable future; furthermore, the undistributed foreign earningsare permanently reinvested. If the Company elects to distribute these foreign earnings in the future, they could besubject to additional income taxes. Determination of the amount of any unrecognized deferred income taxliability is not practicable because such liability, if any, is dependent on circumstances existing if and whenremittance occurs.
Income tax payments were $469 million for 2016, $507 million for 2015 and $526 million for 2014.
78

Uncertain Tax Positions
The following table summarizes the activity related to the Company’s unrecognized tax benefits for U.S. federal,state & non-U.S. tax jurisdictions for 2016, 2015 and 2014, without interest and penalties:
2016 2015 2014
(in millions)
Gross Unrecognized Tax Benefits, as of the Beginning of the Fiscal Year . . . . . . . . . . . $248 $193 $167Increases in Unrecognized Tax Benefits for Prior Years . . . . . . . . . . . . . . . . . . . . . . . . . . . . 3 8 16Decreases in Unrecognized Tax Benefits for Prior Years . . . . . . . . . . . . . . . . . . . . . . . . . . . (73) (3) (14)Increases in Unrecognized Tax Benefits as a Result of Current Year Activity . . . . . . . . . . . 18 54 36Decreases to Unrecognized Tax Benefits Relating to Settlements with Taxing
Authorities . . . . . . . . . . . . . . . . . . . . . . . . . . . . . . . . . . . . . . . . . . . . . . . . . . . . . . . . . . . . . . (98) — (5)Decreases to Unrecognized Tax Benefits as a Result of a Lapse of the Applicable Statute
of Limitations . . . . . . . . . . . . . . . . . . . . . . . . . . . . . . . . . . . . . . . . . . . . . . . . . . . . . . . . . . . (8) (4) (7)
Gross Unrecognized Tax Benefits, as of the End of the Fiscal Year . . . . . . . . . . . . . . . . $ 90 $248 $193
Of the $90 million, $248 million and $193 million of total unrecognized tax benefits at January 28, 2017,January 30, 2016, and January 31, 2015, respectively, approximately $62 million, $217 million and $170 million,respectively, represent the amount of unrecognized tax benefits that, if recognized, would favorably affect theeffective income tax rate in future periods. These amounts are net of the offsetting tax effects from other taxjurisdictions.
Of the total unrecognized tax benefits, it is reasonably possible that $17 million could change in the next 12months due to audit settlements, expiration of statute of limitations or other resolution of uncertainties. Due tothe uncertain and complex application of tax regulations, it is possible that the ultimate resolution of audits mayresult in amounts which could be different from this estimate. In such case, the Company will record additionaltax expense or tax benefit in the period in which such matters are effectively settled.
The Company recognizes interest and penalties related to unrecognized tax benefits as components of income taxexpense. The Company recognized interest and penalties expense (benefit) of $(3) million, $7 million and $1million in 2016, 2015 and 2014, respectively. The Company has accrued approximately $20 million and $38million for the payment of interest and penalties as of January 28, 2017 and January 30, 2016, respectively.Accrued interest and penalties are included within Other Long-term Liabilities on the Consolidated BalanceSheets.
The Company files U.S. federal income tax returns as well as income tax returns in various states and in non-U.S.jurisdictions. At the end of 2016, the Company was subject to examination by the IRS for 2013 through 2015.The Company is also subject to various U.S. state and local income tax examinations for the years 2009 to 2015.Finally, the Company is subject to multiple non-U.S. tax jurisdiction examinations for the years 2007 to 2015. Insome situations, the Company determines that it does not have a filing requirement in a particular taxjurisdiction. Where no return has been filed, no statute of limitations applies. Accordingly, if a tax jurisdictionreaches a conclusion that a filing requirement does exist, additional years may be reviewed by the tax authority.The Company believes it has appropriately accounted for uncertainties related to this issue.
79
Fo
rm10-K

12. Long-term Debt
The following table provides the Company’s debt balance, net of debt issuance costs and unamortized discounts,as of January 28, 2017 and January 30, 2016:
January 28,2017
January 30,2016
(in millions)
Senior Unsecured Debt with Subsidiary Guarantee$1 billion, 6.875% Fixed Interest Rate Notes due November 2035 (“2035 Notes”) . . . . . $ 989 $ 988$1 billion, 5.625% Fixed Interest Rate Notes due February 2022 (“2022 Notes”) . . . . . . 992 991$1 billion, 6.625% Fixed Interest Rate Notes due April 2021 (“2021 Notes”) . . . . . . . . . 992 990$700 million, 6.75% Fixed Interest Rate Notes due July 2036 (“2036 Notes”) . . . . . . . . . 692 —$500 million, 5.625% Fixed Interest Rate Notes due October 2023 (“2023 Notes”) . . . . . 497 496$500 million, 8.50% Fixed Interest Rate Notes due June 2019 (“2019 Notes”) (a) . . . . . . 496 499$400 million, 7.00% Fixed Interest Rate Notes due May 2020 (“2020 Notes”) . . . . . . . . 397 396
Total Senior Unsecured Debt with Subsidiary Guarantee . . . . . . . . . . . . . . . . . . . . . . . . . $5,055 $4,360
Senior Unsecured Debt$350 million, 6.95% Fixed Interest Rate Debentures due March 2033 (“2033 Notes”) . . $ 348 $ 348$300 million, 7.60% Fixed Interest Rate Notes due July 2037 (“2037 Notes”) . . . . . . . . . 297 297$700 million, 6.90% Fixed Interest Rate Notes due July 2017 (“2017 Notes”) (b) . . . . . . — 709Foreign Facilities . . . . . . . . . . . . . . . . . . . . . . . . . . . . . . . . . . . . . . . . . . . . . . . . . . . . . . . . 36 7
Total Senior Unsecured Debt . . . . . . . . . . . . . . . . . . . . . . . . . . . . . . . . . . . . . . . . . . . . . . . $ 681 $1,361Total . . . . . . . . . . . . . . . . . . . . . . . . . . . . . . . . . . . . . . . . . . . . . . . . . . . . . . . . . . . . . . . . . . $5,736 $5,721Current Portion of Long-term Debt . . . . . . . . . . . . . . . . . . . . . . . . . . . . . . . . . . . . . . . . . . (36) (6)
Total Long-term Debt, Net of Current Portion . . . . . . . . . . . . . . . . . . . . . . . . . . . . . . . . . . $5,700 $5,715
(a) The balances include a fair value interest rate hedge adjustment which increased the debt balance by $2million as of January 28, 2017 and $8 million as of January 30, 2016.
(b) The balance includes a fair value interest rate hedge adjustment which increased the debt balance by $10million as of January 30, 2016.
The following table provides principal payments due on outstanding debt in the next five fiscal years and theremaining years thereafter:
Fiscal Year (in millions)
2017 . . . . . . . . . . . . . . . . . . . . . . . . . . . . . . . . . . . . . . . . . . . . . . . . . . . . . . . . . . . . . . . . . . . . . . . . . . . . . . . $ 362018 . . . . . . . . . . . . . . . . . . . . . . . . . . . . . . . . . . . . . . . . . . . . . . . . . . . . . . . . . . . . . . . . . . . . . . . . . . . . . . . —2019 . . . . . . . . . . . . . . . . . . . . . . . . . . . . . . . . . . . . . . . . . . . . . . . . . . . . . . . . . . . . . . . . . . . . . . . . . . . . . . . 5002020 . . . . . . . . . . . . . . . . . . . . . . . . . . . . . . . . . . . . . . . . . . . . . . . . . . . . . . . . . . . . . . . . . . . . . . . . . . . . . . . 4002021 . . . . . . . . . . . . . . . . . . . . . . . . . . . . . . . . . . . . . . . . . . . . . . . . . . . . . . . . . . . . . . . . . . . . . . . . . . . . . . . 1,000Thereafter . . . . . . . . . . . . . . . . . . . . . . . . . . . . . . . . . . . . . . . . . . . . . . . . . . . . . . . . . . . . . . . . . . . . . . . . . . . $3,850
Cash paid for interest was $387 million in 2016, $317 million in 2015 and $328 million in 2014.
Issuance of Notes
In June 2016, the Company issued $700 million of 6.75% notes due in July 2036. The obligation to pay principaland interest on these notes is jointly and severally guaranteed on a full and unconditional basis by the Guarantors.The proceeds from the issuance were $692 million, which were net of issuance costs of $8 million. Theseissuance costs are being amortized through the maturity date of July 2036 and are included within Long-termDebt on the January 28, 2017 Consolidated Balance Sheet.
80

In October 2015, the Company issued $1 billion of 6.875% notes due in November 2035. The obligation to payprincipal and interest on these notes is jointly and severally guaranteed on a full and unconditional basis by theGuarantors. The proceeds from the issuance were $988 million, which were net of issuance costs of $12 million.These issuance costs are being amortized through the maturity date of November 2035 and are included withinLong-term Debt on the Consolidated Balance Sheets.
Repurchase of Notes
In July 2016, the Company used the proceeds from the 2036 Notes to repurchase the $700 million 2017 Notesfor $742 million. The pre-tax loss on extinguishment of this debt was $36 million (after-tax net loss of $22million), which is net of gains of $7 million related to terminated interest rate swaps associated with the 2017Notes. This loss is included in Other Income in the 2016 Consolidated Statement of Income.
Debt Facilities
The Company maintains a secured revolving credit facility (“Revolving Facility”). The Revolving Facility hasaggregate availability of $1 billion and expires July 18, 2019. The fees related to committed and unutilizedamounts are 0.30% per annum, and the fees related to outstanding letters of credit are 1.50% per annum. Inaddition, the interest rate on outstanding U.S. dollar borrowings or British pound borrowings is LIBOR plus1.50% per annum. The interest rate on outstanding Canadian dollar borrowings is CDOR plus 1.50% per annum.
The Revolving Facility contains fixed charge coverage and debt to EBITDA financial covenants. The Companyis required to maintain a fixed charge coverage ratio of not less than 1.75 to 1.00 and a consolidated debt toconsolidated EBITDA ratio not exceeding 4.00 to 1.00 for the most recent four-quarter period. In addition, theRevolving Facility provides that investments and restricted payments may be made, without limitation onamount, if (a) at the time of and after giving effect to such investment or restricted payment the ratio ofconsolidated debt to consolidated EBITDA for the most recent four-quarter period is less than 3.00 to 1.00 and(b) no default or event of default exists. As of January 28, 2017, the Company was in compliance with both of itsfinancial covenants, and the ratio of consolidated debt to consolidated EBITDA was less than 3.00 to 1.00.
As of January 28, 2017, there were no borrowings outstanding under the Revolving Facility.
The Revolving Facility supports the Company’s letter of credit program. The Company had $8 million ofoutstanding letters of credit as of January 28, 2017 that reduce its remaining availability under the RevolvingFacility.
In addition to the Revolving Facility, the Company maintains various revolving and term loan bank facilitieswith availability totaling $100 million to support its foreign operations. Current borrowings on these ForeignFacilities mature between February 8, 2017 and January 24, 2018. The interest rates on outstanding borrowingsare based upon the applicable benchmark rate for the currency of each borrowing.
During 2016, the Company borrowed $35 million and made payments of $6 million under the Foreign Facilities.The maximum daily amount outstanding at any point in time during 2016 was $36 million.
Interest Rate Swap Arrangements
For information related to the Company’s fair value interest rate swap arrangements, see Note 13, “DerivativeFinancial Instruments.”
81
Fo
rm10-K

13. Derivative Financial Instruments
Foreign Exchange Risk
The Company’s Canadian dollar and British pound denominated earnings are subject to exchange rate risk assubstantially all of its merchandise sold in Canada and the U.K. is sourced through U.S. dollar transactions. As aresult, the Company uses foreign currency forward contracts designated as cash flow hedges to mitigate theforeign currency exposure associated with forecasted U.S. dollar-denominated merchandise purchases. Theseforward contracts currently have a maximum term of 18 months. Amounts are reclassified from accumulatedother comprehensive income (loss) upon sale of the hedged merchandise to the customer. These gains and lossesare recognized in Cost of Goods Sold, Buying and Occupancy on the Consolidated Statements of Income.
The Company has a cross-currency swap related to an intercompany loan of approximately CAD$170million maturing in January 2018 which is designated as a cash flow hedge of foreign currency exchange risk.This cross-currency swap mitigates the exposure to fluctuations in the U.S. dollar-Canadian dollar exchange raterelated to the Company’s Canadian operations. The cross-currency swap requires the periodic exchange of fixed-rate Canadian dollar interest payments for fixed-rate U.S. dollar interest payments as well as exchange ofCanadian dollar and U.S. dollar principal payments upon maturity. Changes in the U.S. dollar-Canadian dollarexchange rate and the related swap settlements result in reclassification of amounts from accumulated othercomprehensive income (loss) to earnings to completely offset foreign currency transaction gains and lossesrecognized on the intercompany loan.
The Company uses foreign currency forward contracts not designated as cash flow hedges to manage the impactof fluctuations in foreign currency exchange rates relative to recognized payable balances denominated in non-functional currencies. The fair value of these non-designated foreign currency forward contracts is not significantas of January 28, 2017.
The following table provides the U.S. dollar notional amount of outstanding foreign currency derivative financialinstruments as of January 28, 2017 and January 30, 2016:
January 28,2017
January 30,2016
(in millions)
Notional Amount . . . . . . . . . . . . . . . . . . . . . . . . . . . . . . . . . . . . . . . . . . . . . . . . . . . . . . . . $360 $147
The following table provides a summary of the fair value and balance sheet classification of outstandingderivative financial instruments designated as foreign currency cash flow hedges as of January 28, 2017 andJanuary 30, 2016:
January 28,2017
January 30,2016
(in millions)
Other Current Assets . . . . . . . . . . . . . . . . . . . . . . . . . . . . . . . . . . . . . . . . . . . . . . . . . . . . . . $18 $—Accrued Expenses and Other . . . . . . . . . . . . . . . . . . . . . . . . . . . . . . . . . . . . . . . . . . . . . . . 1 —Other Long-term Assets . . . . . . . . . . . . . . . . . . . . . . . . . . . . . . . . . . . . . . . . . . . . . . . . . . . — 27
The following table provides a summary of the pre-tax financial statement effect of the gains and losses onderivative financial instruments designated as foreign currency cash flow hedges for 2016 and 2015:
2016 2015
(in millions)
Gain (Loss) Recognized in Accumulated Other Comprehensive Income (Loss) . . . . . . . . . . . . . . . . . $(8) $ 6(Gain) Loss Reclassified from Accumulated Other Comprehensive Income into Cost of Goods Sold,
Buying and Occupancy Expense (a) . . . . . . . . . . . . . . . . . . . . . . . . . . . . . . . . . . . . . . . . . . . . . . . . . . (1) —(Gain) Loss Reclassified from Accumulated Other Comprehensive Income into Other Income (b) . . 8 14
82
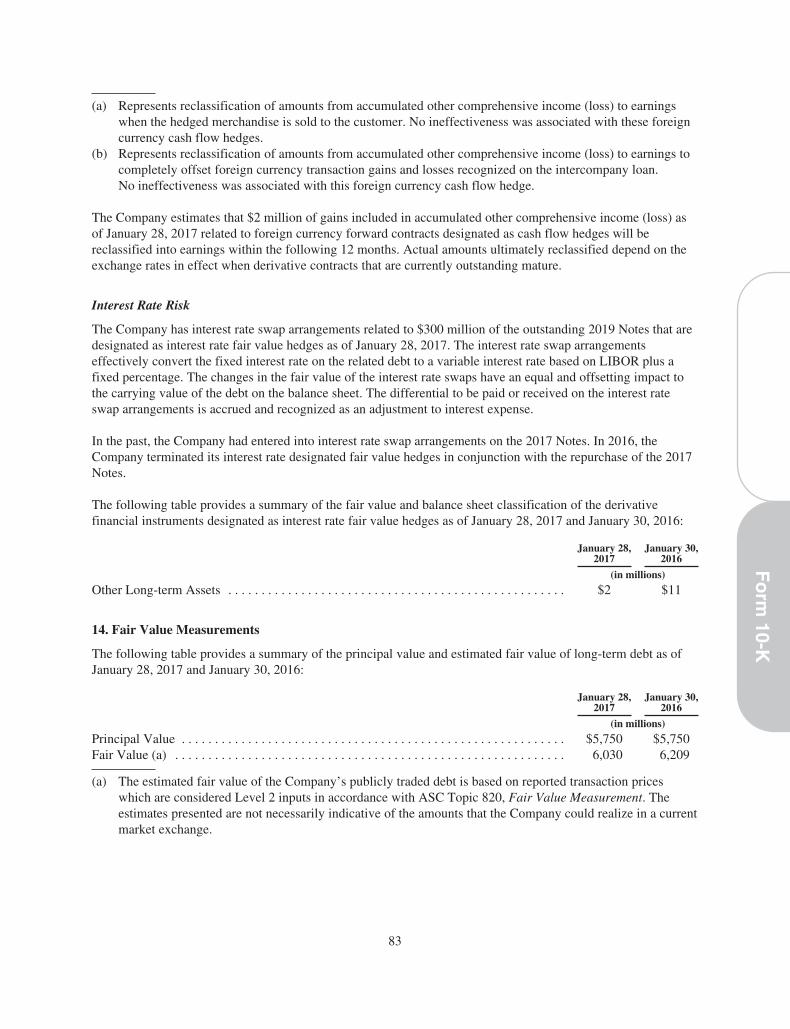
(a) Represents reclassification of amounts from accumulated other comprehensive income (loss) to earningswhen the hedged merchandise is sold to the customer. No ineffectiveness was associated with these foreigncurrency cash flow hedges.
(b) Represents reclassification of amounts from accumulated other comprehensive income (loss) to earnings tocompletely offset foreign currency transaction gains and losses recognized on the intercompany loan.No ineffectiveness was associated with this foreign currency cash flow hedge.
The Company estimates that $2 million of gains included in accumulated other comprehensive income (loss) asof January 28, 2017 related to foreign currency forward contracts designated as cash flow hedges will bereclassified into earnings within the following 12 months. Actual amounts ultimately reclassified depend on theexchange rates in effect when derivative contracts that are currently outstanding mature.
Interest Rate Risk
The Company has interest rate swap arrangements related to $300 million of the outstanding 2019 Notes that aredesignated as interest rate fair value hedges as of January 28, 2017. The interest rate swap arrangementseffectively convert the fixed interest rate on the related debt to a variable interest rate based on LIBOR plus afixed percentage. The changes in the fair value of the interest rate swaps have an equal and offsetting impact tothe carrying value of the debt on the balance sheet. The differential to be paid or received on the interest rateswap arrangements is accrued and recognized as an adjustment to interest expense.
In the past, the Company had entered into interest rate swap arrangements on the 2017 Notes. In 2016, theCompany terminated its interest rate designated fair value hedges in conjunction with the repurchase of the 2017Notes.
The following table provides a summary of the fair value and balance sheet classification of the derivativefinancial instruments designated as interest rate fair value hedges as of January 28, 2017 and January 30, 2016:
January 28,2017
January 30,2016
(in millions)
Other Long-term Assets . . . . . . . . . . . . . . . . . . . . . . . . . . . . . . . . . . . . . . . . . . . . . . . . . . . $2 $11
14. Fair Value Measurements
The following table provides a summary of the principal value and estimated fair value of long-term debt as ofJanuary 28, 2017 and January 30, 2016:
January 28,2017
January 30,2016
(in millions)
Principal Value . . . . . . . . . . . . . . . . . . . . . . . . . . . . . . . . . . . . . . . . . . . . . . . . . . . . . . . . . . $5,750 $5,750Fair Value (a) . . . . . . . . . . . . . . . . . . . . . . . . . . . . . . . . . . . . . . . . . . . . . . . . . . . . . . . . . . . 6,030 6,209
(a) The estimated fair value of the Company’s publicly traded debt is based on reported transaction priceswhich are considered Level 2 inputs in accordance with ASC Topic 820, Fair Value Measurement. Theestimates presented are not necessarily indicative of the amounts that the Company could realize in a currentmarket exchange.
83
Fo
rm10-K

The following table provides a summary of assets and liabilities measured in the consolidated financialstatements at fair value on a recurring basis as of January 28, 2017 and January 30, 2016:
Level 1 Level 2 Level 3 Total
(in millions)
As of January 28, 2017Assets:Cash and Cash Equivalents . . . . . . . . . . . . . . . . . . . . . . . . . . . . . . . . . . . . . . . . $1,934 $— $— $1,934Marketable Securities . . . . . . . . . . . . . . . . . . . . . . . . . . . . . . . . . . . . . . . . . . . . 5 — — 5Interest Rate Fair Value Hedges . . . . . . . . . . . . . . . . . . . . . . . . . . . . . . . . . . . . — 2 — 2Foreign Currency Cash Flow Hedges . . . . . . . . . . . . . . . . . . . . . . . . . . . . . . . . — 18 — 18Liabilities:Foreign Currency Cash Flow Hedges . . . . . . . . . . . . . . . . . . . . . . . . . . . . . . . . — 1 — 1
As of January 30, 2016Assets:Cash and Cash Equivalents . . . . . . . . . . . . . . . . . . . . . . . . . . . . . . . . . . . . . . . . $2,548 $— $— $2,548Marketable Securities . . . . . . . . . . . . . . . . . . . . . . . . . . . . . . . . . . . . . . . . . . . . 22 — — 22Interest Rate Fair Value Hedges . . . . . . . . . . . . . . . . . . . . . . . . . . . . . . . . . . . . — 11 — 11Foreign Currency Cash Flow Hedges . . . . . . . . . . . . . . . . . . . . . . . . . . . . . . . . — 27 — 27
The Company’s Level 1 fair value measurements use unadjusted quoted prices in active markets for identicalassets. In 2015, the Company purchased $10 million of marketable equity securities which were classified asavailable-for-sale as of the end of 2015. In the first quarter of 2016, the Company sold a portion of thisinvestment and received cash proceeds of $10 million and recognized a pre-tax gain of $4 million (after-tax gainof $3 million). The gain is included in Other Income in the 2016 Consolidated Statement of Income, and the cashproceeds are included in Proceeds from Sale of Marketable Securities in the Investing Activities section of the2016 Consolidated Statement of Cash Flows. The Company’s marketable securities are classified as Level 1 fairvalue measurements as they are traded with sufficient frequency and volume to enable the Company to obtainpricing information on an ongoing basis.
The Company’s Level 2 fair value measurements use market approach valuation techniques. The primary inputsto these techniques include benchmark interest rates and foreign currency exchange rates, as applicable to theunderlying instruments.
Management believes that the carrying values of accounts receivable, accounts payable, accrued expenses andcurrent debt approximate fair value because of their short maturity.
15. Comprehensive Income
Comprehensive Income includes gains and losses on derivative instruments, unrealized holding gains and losseson marketable securities classified as available-for-sale and foreign currency translation adjustments. Thecumulative gains and losses on these items are included in Accumulated Other Comprehensive Income in theConsolidated Balance Sheets and Consolidated Statements of Shareholders’ Equity (Deficit).
84

The following table provides the rollforward of accumulated other comprehensive income (loss) for 2016:
Foreign CurrencyTranslation
Cash FlowHedges
MarketableSecurities
AccumulatedOther
ComprehensiveIncome (Loss)
(in millions)
Balance as of January 30, 2016 . . . . . . . . . . . . . . . . . . $ 28 $ 4 $ 8 $ 40Other Comprehensive Income (Loss) Before
Reclassifications . . . . . . . . . . . . . . . . . . . . . . . . . (19) (8) (8) (35)Amounts Reclassified from Accumulated Other
Comprehensive Income (Loss) . . . . . . . . . . . . . . — 7 (4) 3Tax Effect . . . . . . . . . . . . . . . . . . . . . . . . . . . . . . . . — — 4 4
Current-period Other Comprehensive Income (Loss) . . (19) (1) (8) (28)
Balance as of January 28, 2017 . . . . . . . . . . . . . . . . . . $ 9 $ 3 $— $ 12
The following table provides the rollforward of accumulated other comprehensive income (loss) for 2015:
Foreign CurrencyTranslation
Cash FlowHedges
MarketableSecurities
AccumulatedOther
ComprehensiveIncome (Loss)
(in millions)
Balance as of January 31, 2015 . . . . . . . . . . . . . . . . . . $ 51 $(16) $— $35Other Comprehensive Income (Loss) Before
Reclassifications . . . . . . . . . . . . . . . . . . . . . . . . . (23) 6 12 (5)Amounts Reclassified from Accumulated Other
Comprehensive Income (Loss) . . . . . . . . . . . . . . — 14 — 14Tax Effect . . . . . . . . . . . . . . . . . . . . . . . . . . . . . . . . — — (4) (4)
Current-period Other Comprehensive Income (Loss) . . (23) 20 8 5
Balance as of January 30, 2016 . . . . . . . . . . . . . . . . . . $ 28 $ 4 $ 8 $40
The following table provides a summary of the reclassification adjustments out of accumulated othercomprehensive income for 2016:
Details About AccumulatedOther Comprehensive Income (Loss)
Components
Amounts Reclassified fromAccumulated Other
Comprehensive Income (Loss)Location on Consolidated
Statements of Income
2016 2015
(in millions)
(Gain) Loss on Cash Flow Hedges . . . . . . . . . . . . . $ (1) $— Cost of Goods Sold, Buyingand Occupancy
8 14 Other Income— — Provision for Income Taxes
$ 7 $14 Net Income
Sale of Available-for-Sale Securities . . . . . . . . . . . . $ (4) $— Other Income1 — Provision for Income Taxes
$ (3) $— Net Income
16. Leases
The Company is committed to noncancellable leases with remaining terms generally from one to 10 years. Asubstantial portion of the Company’s leases consist of store leases generally with an initial term of 10 years.
85
Fo
rm10-K

Annual store rent consists of a fixed minimum amount and/or contingent rent based on a percentage of salesexceeding a stipulated amount. Store lease terms generally require additional payments covering certainoperating costs such as common area maintenance, utilities, insurance and taxes. These additional payments areexcluded from the table below.
The following table provides rent expense for 2016, 2015 and 2014:
2016 2015 2014
(in millions)
Store Rent:Fixed Minimum . . . . . . . . . . . . . . . . . . . . . . . . . . . . . . . . . . . . . . . . . . . . . . . . . . . . . . . . $607 $535 $516Contingent . . . . . . . . . . . . . . . . . . . . . . . . . . . . . . . . . . . . . . . . . . . . . . . . . . . . . . . . . . . . 71 73 63
Total Store Rent . . . . . . . . . . . . . . . . . . . . . . . . . . . . . . . . . . . . . . . . . . . . . . . . . . . . . . . . . . 678 608 579Office, Equipment and Other . . . . . . . . . . . . . . . . . . . . . . . . . . . . . . . . . . . . . . . . . . . . . . . . . 87 77 68
Gross Rent Expense . . . . . . . . . . . . . . . . . . . . . . . . . . . . . . . . . . . . . . . . . . . . . . . . . . . . . . . 765 685 647Sublease Rental Income . . . . . . . . . . . . . . . . . . . . . . . . . . . . . . . . . . . . . . . . . . . . . . . . . . . . . (2) (2) (2)
Total Rent Expense . . . . . . . . . . . . . . . . . . . . . . . . . . . . . . . . . . . . . . . . . . . . . . . . . . . . . . . . $763 $683 $645
The following table provides the Company’s minimum rent commitments under noncancellable operating leasesin the next five fiscal years and the remaining years thereafter:
Fiscal Year (in millions) (a)
2017 . . . . . . . . . . . . . . . . . . . . . . . . . . . . . . . . . . . . . . . . . . . . . . . . . . . . . . . . . . . . . . . . . . . . . . . . . . . . . . . $ 7072018 . . . . . . . . . . . . . . . . . . . . . . . . . . . . . . . . . . . . . . . . . . . . . . . . . . . . . . . . . . . . . . . . . . . . . . . . . . . . . . . 6512019 . . . . . . . . . . . . . . . . . . . . . . . . . . . . . . . . . . . . . . . . . . . . . . . . . . . . . . . . . . . . . . . . . . . . . . . . . . . . . . . 6052020 . . . . . . . . . . . . . . . . . . . . . . . . . . . . . . . . . . . . . . . . . . . . . . . . . . . . . . . . . . . . . . . . . . . . . . . . . . . . . . . 5712021 . . . . . . . . . . . . . . . . . . . . . . . . . . . . . . . . . . . . . . . . . . . . . . . . . . . . . . . . . . . . . . . . . . . . . . . . . . . . . . . 531Thereafter . . . . . . . . . . . . . . . . . . . . . . . . . . . . . . . . . . . . . . . . . . . . . . . . . . . . . . . . . . . . . . . . . . . . . . . . . . . $2,112
(a) Excludes additional payments covering taxes, common area costs and certain other expenses generallyrequired by store lease terms.
17. Commitments and Contingencies
The Company is subject to various claims and contingencies related to lawsuits, taxes, insurance, regulatory andother matters arising out of the normal course of business. Actions filed against the Company from time to timeinclude commercial, tort, intellectual property, customer, employment, data privacy, securities and other claims,including purported class action lawsuits. Management believes that the ultimate liability arising from suchclaims and contingencies, if any, is not likely to have a material adverse effect on the Company’s results ofoperations, financial condition or cash flows.
Guarantees
In connection with the disposition of certain businesses, the Company has remaining guarantees ofapproximately $14 million related to lease payments under the current terms of noncancellable leases expiring atvarious dates through 2021. These guarantees include minimum rent and additional payments covering taxes,common area costs and certain other expenses and relate to leases that commenced prior to the disposition of thebusinesses. In certain instances, the Company’s guarantee may remain in effect if the term of a lease is extended.The Company has not recorded a liability with respect to any of these guarantee obligations as of January 28,2017 or January 30, 2016 as it concluded that payments under these guarantees were not probable.
86

In connection with the sale and leaseback under noncancellable operating leases of certain assets, the Companyprovides residual value guarantees to the lessor if the leased assets cannot be sold for an amount in excess of aspecified minimum value at the conclusion of the lease term. The leases expire in 2021, and the total amount ofthe guarantees is approximately $133 million. The Company recorded a liability of $1 million and $3 millionrelated to these guarantee obligations as of January 28, 2017 and January 30, 2016, respectively, included inOther Long-term Liabilities on the Consolidated Balance Sheets.
18. Retirement Benefits
The Company sponsors a tax-qualified defined contribution retirement plan and a non-qualified supplementalretirement plan for substantially all of its associates within the U.S. Participation in the tax-qualified plan isavailable to associates who meet certain age and service requirements. Participation in the non-qualified plan isavailable to associates who meet certain age, service, job level and compensation requirements.
The qualified plan permits participating associates to elect contributions up to the maximum limits allowableunder the Internal Revenue Code. The Company matches associate contributions according to a predeterminedformula and contributes additional amounts based on a percentage of the associates’ eligible annualcompensation and years of service. Associate contributions and Company matching contributions vestimmediately. Additional Company contributions and the related investment earnings are subject to vesting basedon years of service. Total expense recognized related to the qualified plan was $67 million for 2016, $64 millionfor 2015 and $59 million for 2014.
The non-qualified plan is an unfunded plan which provides benefits beyond the Internal Revenue Code limits forqualified defined contribution plans. The plan permits participating associates to elect contributions up to amaximum percentage of eligible compensation. The Company matches associate contributions according to apredetermined formula and contributes additional amounts based on a percentage of the associates’ eligiblecompensation and years of service. The plan also permits participating associates to defer additionalcompensation up to a maximum amount which the Company does not match. Associates’ accounts are creditedwith interest using a fixed rate determined by the Company and reviewed by the Compensation Committee of theBoard of Directors, prior to the beginning of each year. Associate contributions and the related interest vestimmediately. Company contributions, along with related interest, are subject to vesting based on years of service.Associates may elect in-service distributions for the unmatched additional deferred compensation componentonly. The remaining vested portion of associates’ accounts in the plan will be distributed upon termination ofemployment in either a lump sum or in annual installments over a specified period of up to 10 years.
The following table provides the Company’s annual activity for this plan and year-end liability, included in OtherLong-term Liabilities on the Consolidated Balance Sheets, as of January 28, 2017 and January 30, 2016:
January 28,2017
January 30,2016
(in millions)
Balance at Beginning of Year . . . . . . . . . . . . . . . . . . . . . . . . . . . . . . . . . . . . . . . . . . . . . . $274 $257Contributions:
Associate . . . . . . . . . . . . . . . . . . . . . . . . . . . . . . . . . . . . . . . . . . . . . . . . . . . . . . . . . . . 14 15Company . . . . . . . . . . . . . . . . . . . . . . . . . . . . . . . . . . . . . . . . . . . . . . . . . . . . . . . . . . . 14 17
Interest . . . . . . . . . . . . . . . . . . . . . . . . . . . . . . . . . . . . . . . . . . . . . . . . . . . . . . . . . . . . . . . . . 12 13Distributions . . . . . . . . . . . . . . . . . . . . . . . . . . . . . . . . . . . . . . . . . . . . . . . . . . . . . . . . . . . . (56) (28)
Balance at End of Year . . . . . . . . . . . . . . . . . . . . . . . . . . . . . . . . . . . . . . . . . . . . . . . . . . . $258 $274
Total expense recognized related to the non-qualified plan was $26 million for 2016, $30 million for 2015 and$24 million for 2014.
87
Fo
rm10-K

19. Shareholders’ Equity (Deficit)
Common Stock Share Repurchases
Under the authority of the Company’s Board of Directors, the Company repurchased shares of its common stockunder the following repurchase programs for the fiscal years 2016, 2015 and 2014:
Shares Repurchased Amount Repurchased
Average StockPrice ofShares
Repurchasedwithin
ProgramRepurchase Program Amount Authorized 2016 2015 2014 2016 2015 2014
(in millions) (in thousands) (in millions)
February 2016 . . . . . . . . . . . . . . $500 5,719 NA NA $438 NA NA $76.63June 2015 . . . . . . . . . . . . . . . . . . 250 NA 2,680 NA NA $233 NA $87.06February 2015 . . . . . . . . . . . . . . 250 NA 2,788 NA NA 250 NA $89.45November 2012 . . . . . . . . . . . . . 250 NA NA 1,317 NA NA $ 84 $54.02
Total . . . . . . . . . . . . . . . . . . . . . 5,719 5,468 1,317 $438 $483 $ 84
In February 2016, the Company’s Board of Directors approved a $500 million share repurchase program, whichincluded the $17 million remaining under the June 2015 repurchase program.
In June 2015, the Company’s Board of Directors approved a $250 million share repurchase program, whichincluded the $0.6 million remaining under the February 2015 repurchase program.
In February 2015, the Company’s Board of Directors approved a $250 million share repurchase program, whichincluded the $91 million remaining under the November 2012 repurchase program.
There were $3 million of share repurchases reflected in Accounts Payable on the January 28, 2017 ConsolidatedBalance Sheet. There were no share repurchases reflected in Accounts Payable on the January 30, 2016Consolidated Balance Sheet.
Subsequent to January 28, 2017, the Company’s Board of Directors approved a new $250 million sharerepurchase program, which included the $59 million remaining under the February 2016 repurchase program.The Company repurchased an additional 0.9 million shares of common stock for $49 million subsequent toJanuary 28, 2017.
88

Dividends
Under the authority and declaration of the Board of Directors, the Company paid the following dividends duringthe fiscal years 2016, 2015 and 2014:
OrdinaryDividends
SpecialDividends
TotalDividends Total Paid
(per share) (in millions)
2016Fourth Quarter . . . . . . . . . . . . . . . . . . . . . . . . . . . . . . . . . . . . . . . . . . $0.60 $ — $0.60 $ 172Third Quarter . . . . . . . . . . . . . . . . . . . . . . . . . . . . . . . . . . . . . . . . . . . 0.60 — 0.60 173Second Quarter . . . . . . . . . . . . . . . . . . . . . . . . . . . . . . . . . . . . . . . . . 0.60 — 0.60 173First Quarter . . . . . . . . . . . . . . . . . . . . . . . . . . . . . . . . . . . . . . . . . . . . 0.60 2.00 2.60 750
2016 Total . . . . . . . . . . . . . . . . . . . . . . . . . . . . . . . . . . . . . . . . . . . . . $2.40 $2.00 $4.40 $1,268
2015Fourth Quarter . . . . . . . . . . . . . . . . . . . . . . . . . . . . . . . . . . . . . . . . . . $0.50 $ — $0.50 $ 145Third Quarter . . . . . . . . . . . . . . . . . . . . . . . . . . . . . . . . . . . . . . . . . . . 0.50 — 0.50 146Second Quarter . . . . . . . . . . . . . . . . . . . . . . . . . . . . . . . . . . . . . . . . . 0.50 — 0.50 146First Quarter . . . . . . . . . . . . . . . . . . . . . . . . . . . . . . . . . . . . . . . . . . . . 0.50 2.00 2.50 734
2015 Total . . . . . . . . . . . . . . . . . . . . . . . . . . . . . . . . . . . . . . . . . . . . . $2.00 $2.00 $4.00 $1,171
2014Fourth Quarter . . . . . . . . . . . . . . . . . . . . . . . . . . . . . . . . . . . . . . . . . . $0.34 $ — $0.34 $ 100Third Quarter . . . . . . . . . . . . . . . . . . . . . . . . . . . . . . . . . . . . . . . . . . . 0.34 — 0.34 100Second Quarter . . . . . . . . . . . . . . . . . . . . . . . . . . . . . . . . . . . . . . . . . 0.34 — 0.34 99First Quarter . . . . . . . . . . . . . . . . . . . . . . . . . . . . . . . . . . . . . . . . . . . . 0.34 1.00 1.34 392
2014 Total . . . . . . . . . . . . . . . . . . . . . . . . . . . . . . . . . . . . . . . . . . . . . $1.36 $1.00 $2.36 $ 691
Subsequent to January 28, 2017, the Company declared the first quarter of 2017 ordinary dividend of $0.60 pershare.
20. Share-based Compensation
Plan Summary
In 2015, the Company’s shareholders approved the 2015 Stock Option and Performance Incentive Plan(“2015 Plan”). The 2015 plan provides for the grant of incentive stock options, non-qualified stock options, stockappreciation rights, restricted stock, performance-based restricted stock, performance units and unrestrictedshares. The Company grants stock options at a price equal to the fair market value of the stock on the date ofgrant. Stock options have a maximum term of 10 years. Stock options generally vest ratably over 3 to 5 years.Restricted stock generally vests (the restrictions lapse) at the end of a three-year period or on a graded basis overa five-year period.
Under the Company’s plans, approximately 160 million options, restricted and unrestricted shares have beenauthorized to be granted to employees and directors. Approximately 16 million options and shares were availablefor grant as of January 28, 2017.
From time to time the Company’s Board of Directors will declare special dividends. For additional information,see Note 19, “Shareholders’ Equity (Deficit).” In accordance with the anti-dilutive provisions of the stock plan,in these circumstances the Company adjusts both the exercise price and the number of share-based awardsoutstanding as of the record date of the special dividends. The aggregate fair value, the aggregate intrinsic valueand the ratio of the exercise price to the market price are approximately equal immediately before and after theadjustments. Therefore, no compensation expense is recognized.
89
Fo
rm10-K

Stock Options
The following table provides the Company’s stock option activity for the fiscal year ended January 28, 2017:
Number ofShares
WeightedAverageOption
Price PerShare
WeightedAverage
RemainingContractual
Life
AggregateIntrinsic
Value
(in thousands) (in years) (in thousands)
Outstanding as of January 30, 2016 . . . . . . . . . . . . . . . . . . . . 5,491 $42.40Granted . . . . . . . . . . . . . . . . . . . . . . . . . . . . . . . . . . . . . . 851 84.92Exercised . . . . . . . . . . . . . . . . . . . . . . . . . . . . . . . . . . . . . (639) 32.58Cancelled . . . . . . . . . . . . . . . . . . . . . . . . . . . . . . . . . . . . (399) 69.44Adjustment for Special Dividend . . . . . . . . . . . . . . . . . . 135
Outstanding as of January 28, 2017 . . . . . . . . . . . . . . . . . . . . 5,439 $47.17 5.66 $108,075
Vested and Expected to Vest as of January 28, 2017 (a) . . . . 5,329 46.41 5.60 107,961Options Exercisable as of January 28, 2017 . . . . . . . . . . . . . . 3,292 29.90 4.09 100,470
(a) The number of options expected to vest includes an estimate of expected forfeitures.
Intrinsic value for stock options is the difference between the current market value of the Company’s stock andthe option strike price. The total intrinsic value of options exercised was $30 million for 2016, $63 million for2015 and $52 million for 2014.
The total fair value at grant date of option awards vested was $10 million for 2016 and $11 million for 2015 and2014.
The Company’s total unrecognized compensation cost, net of estimated forfeitures, related to nonvested optionswas $17 million as of January 28, 2017. This cost is expected to be recognized over a weighted-average period of2.9 years.
The weighted-average estimated fair value of stock options granted was $11.72 per share for 2016, $15.27 pershare for 2015 and $11.74 per share for 2014.
Cash received from stock options exercised was $20 million for 2016, $33 million for 2015 and $35 million for2014. Tax benefits realized from tax deductions associated with stock options exercised were $9 million for2016, $20 million for 2015 and $21 million for 2014.
The Company uses the Black-Scholes option-pricing model for valuation of options granted to employees anddirectors. The Company’s determination of the fair value of options is affected by the Company’s stock price aswell as assumptions regarding a number of highly complex and subjective variables. These variables include, butare not limited to, the Company’s expected stock price volatility over the term of the awards and projectedemployee stock option exercise behaviors.
The following table contains the weighted-average assumptions used during 2016, 2015 and 2014:
2016 2015 2014
Expected Volatility . . . . . . . . . . . . . . . . . . . . . . . . . . . . . . . . . . . . . . . . . . . . . . . . . . . . . . . . . . . 25% 26% 30%Risk-free Interest Rate . . . . . . . . . . . . . . . . . . . . . . . . . . . . . . . . . . . . . . . . . . . . . . . . . . . . . . . . . 1.1% 1.1% 1.4%Dividend Yield . . . . . . . . . . . . . . . . . . . . . . . . . . . . . . . . . . . . . . . . . . . . . . . . . . . . . . . . . . . . . . . 3.3% 2.7% 3.0%Expected Life (in years) . . . . . . . . . . . . . . . . . . . . . . . . . . . . . . . . . . . . . . . . . . . . . . . . . . . . . . . . 4.1 4.5 4.6
The majority of the Company’s stock-based compensation awards are granted on an annual basis in the firstquarter of each year. The expected volatility assumption is based on the Company’s analysis of historical
90

volatility. The risk-free interest rate assumption is based upon the average daily closing rates during the periodfor U.S. treasury notes that have a life which approximates the expected life of the option. The dividend yieldassumption is based on the Company’s history and expectation of dividend payouts in relation to the stock priceat the grant date. The expected life of employee stock options represents the weighted-average period the stockoptions are expected to remain outstanding.
Restricted Stock
The following table provides the Company’s restricted stock activity for the fiscal year ended January 28, 2017:
Number ofShares
WeightedAverage
Grant DateFair Value
(in thousands)
Unvested as of January 30, 2016 . . . . . . . . . . . . . . . . . . . . . . . . . . . . . . . . . . . . . . . . . . 5,791 $54.41Granted . . . . . . . . . . . . . . . . . . . . . . . . . . . . . . . . . . . . . . . . . . . . . . . . . . . . . . . . . . . . . . . 1,758 75.09Vested . . . . . . . . . . . . . . . . . . . . . . . . . . . . . . . . . . . . . . . . . . . . . . . . . . . . . . . . . . . . . . . . (1,754) 38.93Cancelled . . . . . . . . . . . . . . . . . . . . . . . . . . . . . . . . . . . . . . . . . . . . . . . . . . . . . . . . . . . . . (646) 63.11Adjustment for Special Dividend . . . . . . . . . . . . . . . . . . . . . . . . . . . . . . . . . . . . . . . . . . . 143 N/A
Unvested as of January 28, 2017 . . . . . . . . . . . . . . . . . . . . . . . . . . . . . . . . . . . . . . . . . . 5,292 64.14
The Company’s total intrinsic value of restricted stock vested was $140 million for 2016, $217 million for 2015and $128 million for 2014.
The Company’s total fair value at grant date of awards vested was $68 million for 2016, $80 million for 2015 and$56 million for 2014. Fair value of restricted stock awards is based on the market value of an unrestricted shareon the grant date adjusted for anticipated dividend yields.
As of January 28, 2017, there was $141 million of total unrecognized compensation cost, net of estimatedforfeitures, related to unvested restricted stock. That cost is expected to be recognized over a weighted-averageperiod of 2.7 years.
The weighted-average estimated fair value of restricted stock granted was $75.09 per share for 2016, $85.61 pershare for 2015 and $54.03 per share for 2014.
Tax benefits realized from tax deductions associated with restricted stock vested were $61 million for 2016,$82 million for 2015 and $46 million for 2014.
Income Statement Impact
The following table provides share-based compensation expense included in the Consolidated Statements ofIncome for 2016, 2015 and 2014:
2016 2015 2014
(in millions)
Costs of Goods Sold, Buying and Occupancy . . . . . . . . . . . . . . . . . . . . . . . . . . . . . . . . . . . . . . . $31 $27 $24General, Administrative and Store Operating Expenses . . . . . . . . . . . . . . . . . . . . . . . . . . . . . . . 65 70 66
Total Share-based Compensation Expense . . . . . . . . . . . . . . . . . . . . . . . . . . . . . . . . . . . . . . . $96 $97 $90
91
Fo
rm10-K

Share-based compensation expense is based on awards that are ultimately expected to vest. The Companyestimates forfeitures at the time of grant and adjusts, if necessary, in subsequent periods based on historicalexperience and expected future termination rates.
The tax benefit associated with recognized share-based compensation expense was $32 million for 2016,$33 million for 2015 and $30 million for 2014.
21. Segment Information
The Company has three reportable segments: Victoria’s Secret, Bath & Body Works and Victoria’s Secret andBath & Body Works International.
The Victoria’s Secret segment sells women’s intimate and other apparel, personal care and beauty products underthe Victoria’s Secret and PINK brand names. Victoria’s Secret merchandise is sold through retail stores locatedin the U.S. and Canada and its website, www.VictoriasSecret.com.
The Bath & Body Works segment sells personal care, home fragrance products, soaps and sanitizers under theBath & Body Works, White Barn, C.O. Bigelow and other brand names. Bath & Body Works merchandise issold at retail stores located in the U.S. and Canada and through its website, www.BathandBodyWorks.com.
The Victoria’s Secret and Bath & Body Works International segment includes the Victoria’s Secret and Bath &Body Works company-owned and partner-operated stores located outside of the U.S. and Canada. Thesebusinesses include the following:
• Victoria’s Secret Beauty and Accessories, comprised of company-owned stores in Greater China, aswell as stores operated by partners under franchise, license and wholesale arrangements, which featureVictoria’s Secret branded beauty and accessories products;
• Victoria’s Secret International, comprised of company-owned stores in the U.K., as well as storesoperated by partners under franchise and license and wholesale arrangements; and
• Bath & Body Works International stores operated by partners under franchise, license and wholesalearrangements.
Other consists of the following:
• Mast Global, a merchandise sourcing and production function serving the Company and its internationalpartners;
• La Senza, comprised of company-owned stores in the U.S. and Canada, as well as stores operated bypartners under franchise and license arrangements, which feature women’s intimate apparel;
• Henri Bendel, operator of 29 specialty stores, which feature handbags, jewelry and other accessoryproducts; and
• Corporate functions including non-core real estate, equity investments and other governance functionssuch as treasury and tax.
92

The following table provides the Company’s segment information as of and for the fiscal years ended January 28,2017, January 30, 2016 and January 31, 2015:
Victoria’sSecret
Bath & BodyWorks
Victoria’sSecret
andBath & Body
WorksInternational Other Total
(in millions)
January 28, 2017Net Sales . . . . . . . . . . . . . . . . . . . . . . . . . . . . . . . . . . . . $7,781 $3,852 $423 $ 518 $12,574Depreciation and Amortization . . . . . . . . . . . . . . . . . . . 252 91 17 112 472Operating Income (Loss) . . . . . . . . . . . . . . . . . . . . . . . . 1,173 907 40 (117) 2,003Total Assets (a) . . . . . . . . . . . . . . . . . . . . . . . . . . . . . . . 3,285 1,632 593 2,660 8,170Capital Expenditures . . . . . . . . . . . . . . . . . . . . . . . . . . . 460 250 68 212 990
January 30, 2016Net Sales . . . . . . . . . . . . . . . . . . . . . . . . . . . . . . . . . . . . $7,672 $3,587 $385 $ 510 $12,154Depreciation and Amortization . . . . . . . . . . . . . . . . . . . 218 70 16 111 415Operating Income (Loss) . . . . . . . . . . . . . . . . . . . . . . . . 1,391 858 88 (145) 2,192Total Assets (a) . . . . . . . . . . . . . . . . . . . . . . . . . . . . . . . 3,163 1,556 436 3,338 8,493Capital Expenditures . . . . . . . . . . . . . . . . . . . . . . . . . . . 411 166 33 117 727
January 31, 2015Net Sales . . . . . . . . . . . . . . . . . . . . . . . . . . . . . . . . . . . . $7,207 $3,350 $336 $ 561 $11,454Depreciation and Amortization . . . . . . . . . . . . . . . . . . . 198 65 16 119 398Operating Income (Loss) . . . . . . . . . . . . . . . . . . . . . . . . 1,271 737 78 (133) 1,953Total Assets (a) . . . . . . . . . . . . . . . . . . . . . . . . . . . . . . . 2,950 1,365 369 2,792 7,476Capital Expenditures . . . . . . . . . . . . . . . . . . . . . . . . . . . 446 77 37 155 715
(a) Assets are allocated to the operating segments based on decision making authority relevant to the applicableassets.
The Company’s international sales include sales from company-owned stores, royalty revenue from franchiseand license arrangements, wholesale revenues and direct sales shipped internationally. Certain of these sales aresubject to the impact of fluctuations in foreign currency. The Company’s international sales across all segmentstotaled $1.408 billion in 2016, $1.314 billion in 2015 and $1.349 billion in 2014. The Company’s internationallybased long-lived assets were $357 million as of January 28, 2017 and $319 million as of January 30, 2016.
22. Quarterly Financial Data (Unaudited)
The following table provides summarized quarterly financial data for 2016:
Fiscal Quarter Ended
April 30,2016 (a)
July 30,2016 (b)
October 29,2016
January 28,2017 (c)
(in millions except per share data)
Net Sales . . . . . . . . . . . . . . . . . . . . . . . . . . . . . . . . . . . . . . . . . . . . . . . $2,614 $2,890 $2,581 $4,489Gross Profit . . . . . . . . . . . . . . . . . . . . . . . . . . . . . . . . . . . . . . . . . . . . . 1,043 1,113 1,025 1,944Operating Income . . . . . . . . . . . . . . . . . . . . . . . . . . . . . . . . . . . . . . . . . 323 408 284 988Income Before Income Taxes . . . . . . . . . . . . . . . . . . . . . . . . . . . . . . . 233 380 190 893Net Income . . . . . . . . . . . . . . . . . . . . . . . . . . . . . . . . . . . . . . . . . . . . . . 152 252 122 632Net Income Per Basic Share (d) . . . . . . . . . . . . . . . . . . . . . . . . . . . . . . $ 0.53 $ 0.88 $ 0.43 $ 2.21Net Income Per Diluted Share (d) . . . . . . . . . . . . . . . . . . . . . . . . . . . . $ 0.52 $ 0.87 $ 0.42 $ 2.18
93
Fo
rm10-K

(a) Includes the effect of a pre-tax gain of $35 million ($21 million net of tax) included in operating income,related to actions at Victoria’s Secret, including severance charges, fabric cancellations and the write-off ofcatalogue paper.
(b) Includes the effect of a pre-tax gain of $108 million ($70 million net of tax) related to a cash distributionfrom Easton Town Center, offset by a pre-tax loss of $36 million ($22 million net of tax) associated with theearly extinguishment of the 2017 Notes, included in other income.
(c) Includes the effect of a $42 million tax benefit related to the favorable resolution of a discrete income taxmatter.
(d) Due to changes in stock prices during the year and timing of issuances and repurchases of shares, thecumulative total of quarterly net income per share amounts may not equal the net income per share for theyear.
The following table provides summarized quarterly financial data for 2015:
Fiscal Quarter Ended
May 2,2015 (a)
August 1,2015
October 31,2015
January 30,2016
(in millions except per share data)
Net Sales . . . . . . . . . . . . . . . . . . . . . . . . . . . . . . . . . . . . . . . . . . . . . . . $2,512 $2,765 $2,482 $4,395Gross Profit . . . . . . . . . . . . . . . . . . . . . . . . . . . . . . . . . . . . . . . . . . . . . 1,056 1,114 1,031 2,002Operating Income . . . . . . . . . . . . . . . . . . . . . . . . . . . . . . . . . . . . . . . . 372 403 339 1,078Income Before Income Taxes . . . . . . . . . . . . . . . . . . . . . . . . . . . . . . . 369 323 260 982Net Income . . . . . . . . . . . . . . . . . . . . . . . . . . . . . . . . . . . . . . . . . . . . . 250 202 164 636Net Income Per Basic Share (b) . . . . . . . . . . . . . . . . . . . . . . . . . . . . . $ 0.86 $ 0.69 $ 0.56 $ 2.19Net Income Per Diluted Share (b) . . . . . . . . . . . . . . . . . . . . . . . . . . . . $ 0.84 $ 0.68 $ 0.55 $ 2.15
(a) Includes the effect of a pre-tax gain of $78 million ($69 million net of tax) included in other income, relatedto the sale of our remaining interest in the third-party apparel sourcing business.
(b) Due to changes in stock prices during the year and timing of issuances and repurchases of shares, thecumulative total of quarterly net income per share amounts may not equal the net income per share for theyear.
23. Subsequent Events
Subsequent to January 28, 2017, the Company’s Board of Directors approved a new $250 million sharerepurchase program, which included the $59 million remaining under the February 2016 repurchase program.The Company repurchased an additional 0.9 million shares of common stock for $49 million subsequent toJanuary 28, 2017.
The Company declared the first quarter of 2017 ordinary dividend of $0.60 per share. For additional information,see Note 19, “Shareholders’ Equity (Deficit).”
24. Supplemental Guarantor Financial Information
The Company’s 2019 Notes, 2020 Notes, 2021 Notes, 2022 Notes, 2023 Notes, 2035 Notes and 2036 Notes arejointly and severally guaranteed on a full and unconditional basis by the Guarantors. The Company is a holdingcompany, and its most significant assets are the stock of its subsidiaries. The Guarantors represent:(a) substantially all of the sales of the Company’s domestic subsidiaries, (b) more than 90% of the assets ownedby the Company’s domestic subsidiaries, other than real property, certain other assets and intercompanyinvestments and balances, and (c) more than 95% of the accounts receivable and inventory directly owned by theCompany’s domestic subsidiaries.
94
The following supplemental financial information sets forth for the Company and its guarantor and non-guarantor subsidiaries: the Condensed Consolidating Balance Sheets as of January 28, 2017 and January 30, 2016and the Condensed Consolidating Statements of Income, Comprehensive Income and Cash Flows for the yearsended January 28, 2017, January 30, 2016 and January 31, 2015.
95
Fo
rm10-K

L BRANDS, INC.
CONDENSED CONSOLIDATING BALANCE SHEET
(in millions)
January 28, 2017
L Brands, Inc.Guarantor
SubsidiariesNon-guarantor
Subsidiaries EliminationsConsolidated
L Brands, Inc.
ASSETSCurrent Assets:
Cash and Cash Equivalents . . . . . . . . $ — $ 1,562 $ 372 $ — $1,934Accounts Receivable, Net . . . . . . . . . — 228 66 — 294Inventories . . . . . . . . . . . . . . . . . . . . . — 976 120 — 1,096Other . . . . . . . . . . . . . . . . . . . . . . . . . — 53 88 — 141
Total Current Assets . . . . . . . . . . . . . . . . . — 2,819 646 — 3,465Property and Equipment, Net . . . . . . . . . . — 1,897 844 — 2,741Goodwill . . . . . . . . . . . . . . . . . . . . . . . . . . — 1,318 30 — 1,348Trade Names and Other Intangible Assets,
Net . . . . . . . . . . . . . . . . . . . . . . . . . . . . . — 411 — — 411Net Investments in and Advances to/from
Consolidated Affiliates . . . . . . . . . . . . . 4,923 15,824 1,350 (22,097) —Deferred Income Taxes . . . . . . . . . . . . . . . — 10 9 — 19Other Assets . . . . . . . . . . . . . . . . . . . . . . . 130 28 639 (611) 186
Total Assets . . . . . . . . . . . . . . . . . . . . . . . . $5,053 $22,307 $3,518 $(22,708) $8,170
LIABILITIES AND EQUITY(DEFICIT)
Current Liabilities:Accounts Payable . . . . . . . . . . . . . . . $ 3 $ 326 $ 354 $ — $ 683Accrued Expenses and Other . . . . . . 100 526 371 — 997Current Portion of Long-term
Debt . . . . . . . . . . . . . . . . . . . . . . . . — — 36 — 36Income Taxes . . . . . . . . . . . . . . . . . . (11) 221 88 — 298
Total Current Liabilities . . . . . . . . . . . . . . 92 1,073 849 — 2,014Deferred Income Taxes . . . . . . . . . . . . . . . (3) (93) 448 — 352Long-term Debt . . . . . . . . . . . . . . . . . . . . . 5,700 597 — (597) 5,700Other Long-term Liabilities . . . . . . . . . . . 3 761 81 (14) 831Total Equity (Deficit) . . . . . . . . . . . . . . . . (739) 19,969 2,140 (22,097) (727)
Total Liabilities and Equity (Deficit) . . . . $5,053 $22,307 $3,518 $(22,708) $8,170
96

L BRANDS, INC.
CONDENSED CONSOLIDATING BALANCE SHEET
(in millions)
January 30, 2016
L Brands, Inc.Guarantor
SubsidiariesNon-guarantor
Subsidiaries EliminationsConsolidated
L Brands, Inc.
ASSETSCurrent Assets:
Cash and Cash Equivalents . . . . . . . . $ — $ 2,190 $ 358 $ — $2,548Accounts Receivable, Net . . . . . . . . . 1 202 58 — 261Inventories . . . . . . . . . . . . . . . . . . . . . — 978 144 — 1,122Other . . . . . . . . . . . . . . . . . . . . . . . . . — 115 110 — 225
Total Current Assets . . . . . . . . . . . . . . . . . 1 3,485 670 — 4,156Property and Equipment, Net . . . . . . . . . . — 1,574 756 — 2,330Goodwill . . . . . . . . . . . . . . . . . . . . . . . . . . — 1,318 — — 1,318Trade Names and Other Intangible Assets,
Net . . . . . . . . . . . . . . . . . . . . . . . . . . . . . — 411 — — 411Net Investments in and Advances to/from
Consolidated Affiliates . . . . . . . . . . . . . 5,368 13,649 1,242 (20,259) —Deferred Income Taxes . . . . . . . . . . . . . . . — 11 19 — 30Other Assets . . . . . . . . . . . . . . . . . . . . . . . 141 40 679 (612) 248
Total Assets . . . . . . . . . . . . . . . . . . . . . . . . $5,510 $20,488 $3,366 $(20,871) $8,493
LIABILITIES AND EQUITY(DEFICIT)
Current Liabilities:Accounts Payable . . . . . . . . . . . . . . . $ — $ 333 $ 335 $ — $ 668Accrued Expenses and Other . . . . . . 100 519 358 — 977Current Portion of Long-term
Debt . . . . . . . . . . . . . . . . . . . . . . . . — — 6 — 6Income Taxes . . . . . . . . . . . . . . . . . . (3) 237 (10) — 224
Total Current Liabilities . . . . . . . . . . . . . . 97 1,089 689 — 1,875Deferred Income Taxes . . . . . . . . . . . . . . . (3) (86) 346 — 257Long-term Debt . . . . . . . . . . . . . . . . . . . . . 5,714 597 1 (597) 5,715Other Long-term Liabilities . . . . . . . . . . . — 670 248 (14) 904Total Equity (Deficit) . . . . . . . . . . . . . . . . (298) 18,218 2,082 (20,260) (258)
Total Liabilities and Equity (Deficit) . . . . $5,510 $20,488 $3,366 $(20,871) $8,493
97
Fo
rm10-K

L BRANDS, INC.
CONDENSED CONSOLIDATING STATEMENT OF INCOME
(in millions)
2016
L Brands, Inc.Guarantor
SubsidiariesNon-guarantor
Subsidiaries EliminationsConsolidated
L Brands, Inc.
Net Sales . . . . . . . . . . . . . . . . . . . . . . . . . . $ — $11,959 $ 3,533 $(2,918) $12,574Costs of Goods Sold, Buying and
Occupancy . . . . . . . . . . . . . . . . . . . . . . . — (7,277) (2,854) 2,682 (7,449)
Gross Profit . . . . . . . . . . . . . . . . . . . . . . . . — 4,682 679 (236) 5,125General, Administrative and Store
Operating Expenses . . . . . . . . . . . . . . . . (8) (2,843) (457) 186 (3,122)
Operating Income (Loss) . . . . . . . . . . . . . (8) 1,839 222 (50) 2,003Interest Expense . . . . . . . . . . . . . . . . . . . . (394) (60) (11) 71 (394)Other Income . . . . . . . . . . . . . . . . . . . . . . . (35) 3 119 — 87
Income (Loss) Before Income Taxes . . . . (437) 1,782 330 21 1,696Provision (Benefit) for Income Taxes . . . . (10) 432 116 — 538Equity in Earnings, Net of Tax . . . . . . . . . 1,585 39 376 (2,000) —
Net Income (Loss) . . . . . . . . . . . . . . . . . . . $1,158 $ 1,389 $ 590 $(1,979) $ 1,158
L BRANDS, INC.
CONDENSED CONSOLIDATING STATEMENT OF COMPREHENSIVE INCOME
(in millions)
2016
L Brands, Inc.Guarantor
SubsidiariesNon-guarantor
Subsidiaries EliminationsConsolidated
L Brands, Inc.
Net Income (Loss) . . . . . . . . . . . . . . . . . . $1,158 $1,389 $590 $(1,979) $1,158Other Comprehensive Income (Loss), Net
of Tax:Foreign Currency Translation . . . . . — — (19) — (19)Unrealized Loss on Cash Flow
Hedges . . . . . . . . . . . . . . . . . . . . . — — (8) — (8)Reclassification of Cash Flow
Hedges to Earnings . . . . . . . . . . . . — — 7 — 7Unrealized Loss on Marketable
Securities . . . . . . . . . . . . . . . . . . . — — (5) — (5)Reclassification of Gain on
Marketable Securities toEarnings . . . . . . . . . . . . . . . . . . . . — — (3) — (3)
Total Other Comprehensive Income(Loss), Net of Tax . . . . . . . . . . . . . . . . — — (28) — (28)
Total Comprehensive Income . . . . . . . . . $1,158 $1,389 $562 $(1,979) $1,130
98
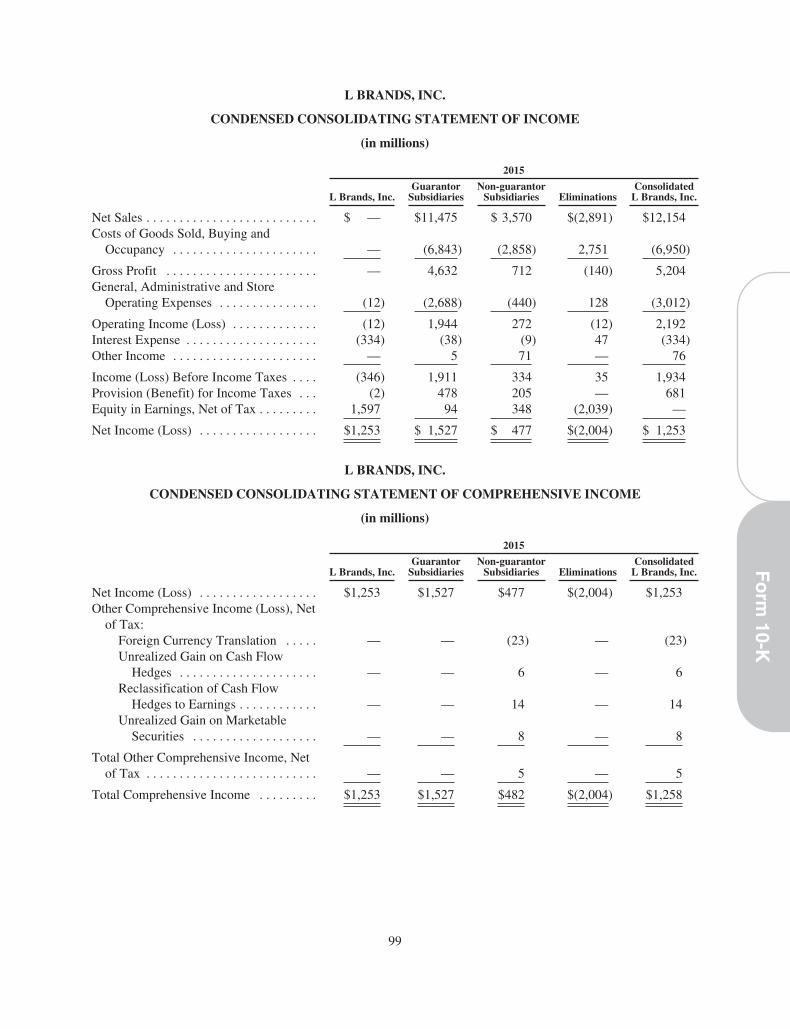
L BRANDS, INC.
CONDENSED CONSOLIDATING STATEMENT OF INCOME
(in millions)
2015
L Brands, Inc.Guarantor
SubsidiariesNon-guarantor
Subsidiaries EliminationsConsolidated
L Brands, Inc.
Net Sales . . . . . . . . . . . . . . . . . . . . . . . . . . $ — $11,475 $ 3,570 $(2,891) $12,154Costs of Goods Sold, Buying and
Occupancy . . . . . . . . . . . . . . . . . . . . . . — (6,843) (2,858) 2,751 (6,950)
Gross Profit . . . . . . . . . . . . . . . . . . . . . . . — 4,632 712 (140) 5,204General, Administrative and Store
Operating Expenses . . . . . . . . . . . . . . . (12) (2,688) (440) 128 (3,012)
Operating Income (Loss) . . . . . . . . . . . . . (12) 1,944 272 (12) 2,192Interest Expense . . . . . . . . . . . . . . . . . . . . (334) (38) (9) 47 (334)Other Income . . . . . . . . . . . . . . . . . . . . . . — 5 71 — 76
Income (Loss) Before Income Taxes . . . . (346) 1,911 334 35 1,934Provision (Benefit) for Income Taxes . . . (2) 478 205 — 681Equity in Earnings, Net of Tax . . . . . . . . . 1,597 94 348 (2,039) —
Net Income (Loss) . . . . . . . . . . . . . . . . . . $1,253 $ 1,527 $ 477 $(2,004) $ 1,253
L BRANDS, INC.
CONDENSED CONSOLIDATING STATEMENT OF COMPREHENSIVE INCOME
(in millions)
2015
L Brands, Inc.Guarantor
SubsidiariesNon-guarantor
Subsidiaries EliminationsConsolidated
L Brands, Inc.
Net Income (Loss) . . . . . . . . . . . . . . . . . . $1,253 $1,527 $477 $(2,004) $1,253Other Comprehensive Income (Loss), Net
of Tax:Foreign Currency Translation . . . . . — — (23) — (23)Unrealized Gain on Cash Flow
Hedges . . . . . . . . . . . . . . . . . . . . . — — 6 — 6Reclassification of Cash Flow
Hedges to Earnings . . . . . . . . . . . . — — 14 — 14Unrealized Gain on Marketable
Securities . . . . . . . . . . . . . . . . . . . — — 8 — 8
Total Other Comprehensive Income, Netof Tax . . . . . . . . . . . . . . . . . . . . . . . . . . — — 5 — 5
Total Comprehensive Income . . . . . . . . . $1,253 $1,527 $482 $(2,004) $1,258
99
Fo
rm10-K

L BRANDS, INC.
CONDENSED CONSOLIDATING STATEMENT OF INCOME
(in millions)
2014
L Brands, Inc.Guarantor
SubsidiariesNon-guarantor
Subsidiaries EliminationsConsolidated
L Brands, Inc.
Net Sales . . . . . . . . . . . . . . . . . . . . . . . . . . $ — $10,711 $ 3,343 $(2,600) $11,454Costs of Goods Sold, Buying and
Occupancy . . . . . . . . . . . . . . . . . . . . . . . — (6,449) (2,611) 2,414 (6,646)
Gross Profit . . . . . . . . . . . . . . . . . . . . . . . . — 4,262 732 (186) 4,808General, Administrative and Store
Operating Expenses . . . . . . . . . . . . . . . . (6) (2,538) (446) 135 (2,855)
Operating Income (Loss) . . . . . . . . . . . . . (6) 1,724 286 (51) 1,953Interest Expense . . . . . . . . . . . . . . . . . . . . (324) (35) (9) 44 (324)Other Income . . . . . . . . . . . . . . . . . . . . . . . 1 — 6 — 7
Income (Loss) Before Income Taxes . . . . (329) 1,689 283 (7) 1,636Provision (Benefit) for Income Taxes . . . . (3) 385 212 — 594Equity in Earnings, Net of Tax . . . . . . . . . 1,368 46 316 (1,730) —
Net Income (Loss) . . . . . . . . . . . . . . . . . . . $1,042 $ 1,350 $ 387 $(1,737) $ 1,042
L BRANDS, INC.
CONDENSED CONSOLIDATING STATEMENT OF COMPREHENSIVE INCOME
(in millions)
2014
L Brands, Inc.Guarantor
SubsidiariesNon-guarantor
Subsidiaries EliminationsConsolidated
L Brands, Inc.
Net Income (Loss) . . . . . . . . . . . . . . . . . . . $1,042 $1,350 $387 $(1,737) $1,042Other Comprehensive Income (Loss), Net
of Tax:Foreign Currency Translation . . . . . . — — 21 — 21Unrealized Gain on Cash Flow
Hedges . . . . . . . . . . . . . . . . . . . . . . — — 34 — 34Reclassification of Cash Flow
Hedges to Earnings . . . . . . . . . . . . — — (60) — (60)
Total Other Comprehensive Income(Loss), Net of Tax . . . . . . . . . . . . . . . . . — — (5) — (5)
Total Comprehensive Income . . . . . . . . . . $1,042 $1,350 $382 $(1,737) $1,037
100

L BRANDS, INC.
CONDENSED CONSOLIDATING STATEMENT OF CASH FLOWS
(in millions)
2016
L Brands, Inc.Guarantor
SubsidiariesNon-guarantor
Subsidiaries EliminationsConsolidated
L Brands, Inc.
Net Cash Provided by (Used for)Operating Activities . . . . . . . . . . . . . . . $ (462) $ 1,848 $ 504 $ — $ 1,890
Investing Activities:Capital Expenditures . . . . . . . . . . . . — (705) (285) — (990)Return of Capital from Easton Town
Center, LLC . . . . . . . . . . . . . . . . . — — 108 — 108Acquisition, Net of Cash Acquired
of $1 . . . . . . . . . . . . . . . . . . . . . . . — — (33) — (33)Proceeds from Sale of Assets . . . . . . — — 53 — 53Proceeds from Sale of Marketable
Securities . . . . . . . . . . . . . . . . . . . — — 10 — 10Other Investing Activities . . . . . . . . — (2) 21 — 19
Net Cash Used for Investing Activities . . — (707) (126) — (833)
Financing Activities:Proceeds from Issuance of Long-
term Debt, Net of IssuanceCosts . . . . . . . . . . . . . . . . . . . . . . . 692 — — — 692
Payments of Long-term Debt . . . . . . (742) — — — (742)Borrowings from Debt Facilities . . . — — 35 — 35Repayments on Debt Facilities . . . . . — — (6) — (6)Dividends Paid . . . . . . . . . . . . . . . . . (1,268) — — — (1,268)Repurchases of Common Stock . . . . (435) — — — (435)Excess Tax Benefits from Share-
based Compensation . . . . . . . . . . . — 37 5 — 42Net Financing Activities and
Advances to/from ConsolidatedAffiliates . . . . . . . . . . . . . . . . . . . . 2,195 (1,803) (392) — —
Proceeds From Exercise of StockOptions . . . . . . . . . . . . . . . . . . . . . 20 — — — 20
Financing Costs and Other . . . . . . . . — (3) — — (3)
Net Cash Provided by (Used for)Financing Activities . . . . . . . . . . . . . . . 462 (1,769) (358) — (1,665)
Effects of Exchange Rate Changes onCash . . . . . . . . . . . . . . . . . . . . . . . . . . . — — (6) — (6)
Net Increase in Cash and CashEquivalents . . . . . . . . . . . . . . . . . . . . . . — (628) 14 — (614)
Cash and Cash Equivalents, Beginning ofYear . . . . . . . . . . . . . . . . . . . . . . . . . . . — 2,190 358 — 2,548
Cash and Cash Equivalents, End ofYear . . . . . . . . . . . . . . . . . . . . . . . . . . . $ — $ 1,562 $ 372 $ — $ 1,934
101
Fo
rm10-K

L BRANDS, INC.
CONDENSED CONSOLIDATING STATEMENT OF CASH FLOWS
(in millions)
2015
L Brands, Inc.Guarantor
SubsidiariesNon-guarantor
Subsidiaries EliminationsConsolidated
L Brands, Inc.
Net Cash Provided by (Used for)Operating Activities . . . . . . . . . . . . . . . $ (322) $1,835 $ 356 $ — $ 1,869
Investing Activities:Capital Expenditures . . . . . . . . . . . . — (506) (221) — (727)Proceeds from Sale of Assets . . . . . . — — 196 — 196Proceeds from Sale of Marketable
Securities . . . . . . . . . . . . . . . . . . . — 50 — — 50Proceeds from Divestiture of Third-
party Apparel SourcingBusiness . . . . . . . . . . . . . . . . . . . . — 1 84 — 85
Purchases of MarketableSecurities . . . . . . . . . . . . . . . . . . . — (50) (10) — (60)
Other Investing Activities . . . . . . . . — — 13 — 13
Net Cash Used for Investing Activities . . — (505) 62 — (443)
Financing Activities:Proceeds from Issuance of Long-
term Debt, Net of IssuanceCosts . . . . . . . . . . . . . . . . . . . . . . . 988 — — — 988
Borrowings from Debt Facilities . . . — — 7 — 7Dividends Paid . . . . . . . . . . . . . . . . . (1,171) — — — (1,171)Repurchases of Common Stock . . . . (483) — — — (483)Excess Tax Benefits from Share-
based Compensation . . . . . . . . . . . — 62 8 — 70Net Financing Activities and
Advances to/from ConsolidatedAffiliates . . . . . . . . . . . . . . . . . . . . 955 (662) (293) — —
Proceeds From Exercise of StockOptions . . . . . . . . . . . . . . . . . . . . . 33 — — — 33
Financing Costs and Other . . . . . . . . — (2) — — (2)
Net Cash Provided by (Used for)Financing Activities . . . . . . . . . . . . . . . 322 (602) (278) — (558)
Effects of Exchange Rate Changes onCash . . . . . . . . . . . . . . . . . . . . . . . . . . . — — (1) — (1)
Net Increase in Cash and CashEquivalents . . . . . . . . . . . . . . . . . . . . . . — 728 139 — 867
Cash and Cash Equivalents, Beginning ofYear . . . . . . . . . . . . . . . . . . . . . . . . . . . — 1,462 219 — 1,681
Cash and Cash Equivalents, End ofYear . . . . . . . . . . . . . . . . . . . . . . . . . . . $ — $2,190 $ 358 $ — $ 2,548
102

L BRANDS, INC.
CONDENSED CONSOLIDATING STATEMENT OF CASH FLOWS
(in millions)
2014
L Brands, Inc.Guarantor
SubsidiariesNon-guarantor
Subsidiaries EliminationsConsolidated
L Brands, Inc.
Net Cash Provided by (Used for)Operating Activities . . . . . . . . . . . . . . . $ (333) $ 1,677 $ 442 $ — $1,786
Investing Activities:Capital Expenditures . . . . . . . . . . . . — (486) (229) — (715)Other Investing Activities . . . . . . . . — (1) 17 — 16
Net Cash Used for Investing Activities . . — (487) (212) — (699)
Financing Activities:Payments of Long-term Debt . . . . . . (213) — — — (213)Borrowings from Debt Facilities . . . — — 5 — 5Repayments on Debt Facilities . . . . . — — (5) — (5)Dividends Paid . . . . . . . . . . . . . . . . . (691) — — — (691)Repurchases of Common Stock . . . . (87) — — — (87)Excess Tax Benefits from Share-
based Compensation . . . . . . . . . . . — 37 6 — 43Net Financing Activities and
Advances to/from ConsolidatedAffiliates . . . . . . . . . . . . . . . . . . . . 1,295 (1,118) (177) — —
Proceeds From Exercise of StockOptions . . . . . . . . . . . . . . . . . . . . . 35 — — — 35
Financing Costs and Other . . . . . . . . (6) — — — (6)
Net Cash Provided by (Used for)Financing Activities . . . . . . . . . . . . . . . 333 (1,081) (171) — (919)
Effects of Exchange Rate Changes onCash . . . . . . . . . . . . . . . . . . . . . . . . . . . — — (6) — (6)
Net Increase (Decrease) in Cash and CashEquivalents . . . . . . . . . . . . . . . . . . . . . . — 109 53 — 162
Cash and Cash Equivalents, Beginning ofYear . . . . . . . . . . . . . . . . . . . . . . . . . . . — 1,353 166 — 1,519
Cash and Cash Equivalents, End ofYear . . . . . . . . . . . . . . . . . . . . . . . . . . . $ — $ 1,462 $ 219 $ — $1,681
103
Fo
rm10-K

ITEM 9. CHANGES IN AND DISAGREEMENTS WITH ACCOUNTANTS ON ACCOUNTING ANDFINANCIAL DISCLOSURE.
None.
ITEM 9A. CONTROLS AND PROCEDURES.
Evaluation of disclosure controls and procedures. As of the end of the period covered by this report, we carriedout an evaluation, under the supervision and with the participation of our management, including our ChiefExecutive Officer and Chief Financial Officer, of the effectiveness of the design and operation of our disclosurecontrols and procedures, as such term is defined in Rules 13a-15(e) and 15d-15(e) of the Exchange Act. Basedupon that evaluation, our Chief Executive Officer and Chief Financial Officer concluded that as of the end of theperiod covered by this report, our disclosure controls and procedures were effective and designed to ensure thatinformation required to be disclosed by us in reports we file or submit under the Exchange Act is (1) recorded,processed, summarized and reported within the time periods specified in SEC rules and forms, and(2) accumulated and communicated to our management, including our Chief Executive Officer and ChiefFinancial Officer, to allow timely decisions regarding required disclosure.
Management’s Report on Internal Control Over Financial Reporting. Management’s Report on Internal ControlOver Financial Reporting as of January 28, 2017 is set forth in Item 8. Financial Statements and SupplementaryData.
Attestation Report of the Registered Public Accounting Firm. The Report of Independent Registered PublicAccounting Firm on Internal Control Over Financial Reporting as of January 28, 2017 is set forth in Item 8.Financial Statements and Supplementary Data.
Changes in internal control over financial reporting. In August 2016, we implemented a new Human Resourcesand Payroll system. Various processes and controls were modified due to the new system. Additionally, weimplemented additional compensating controls over financial reporting to ensure the accuracy and integrity ofour financial statements during the post-implementation phase. We believe the system and process changes willenhance internal control over financial reporting in future periods. There were no other changes in our internalcontrol over financial reporting that occurred in the fourth quarter of 2016 that have materially affected, or arereasonably likely to materially affect, our internal control over financial reporting.
ITEM 9B. OTHER INFORMATION.
None.
104

PART III
ITEM 10. DIRECTORS AND EXECUTIVE OFFICERS AND CORPORATE GOVERNANCE.
Information regarding our directors, executive officers and corporate governance is set forth under the captions“ELECTION OF DIRECTORS—Nominees and Directors”, “—Director Independence”, “—Board LeadershipStructure “, “—Risk Oversight; Certain Compensation Matters”, “—Review of Strategic Plans and CapitalStructure”, “—Succession Planning”, “—Information Concerning Board Meeting Attendance”, “—Committeesof the Board”, “—Meetings of the Company’s Non-Management Directors”, “—Communications withStockholders”, “—Attendance at Annual Meetings”, “—Code of Conduct, Related Person Transaction Policy andAssociated Matters”, “—Copies of the Company’s Code of Conduct, Corporate Governance Principles, Policyand Committee Charters”, and “SECURITY OWNERSHIP OF DIRECTORS AND MANAGEMENT” in theProxy Statement and is incorporated herein by reference. Information regarding compliance with Section 16(A)of the Securities Exchange Act of 1934, as amended, is set forth under the caption “SECTION 16(a)BENEFICIAL OWNERSHIP REPORTING COMPLIANCE” in the Proxy Statement and is incorporated hereinby reference. Information regarding executive officers is set forth herein under the caption “Executive Officers ofRegistrant” in Part I.
ITEM 11. EXECUTIVE COMPENSATION.
Information regarding executive compensation is set forth under the caption “COMPENSATION-RELATEDMATTERS” in the Proxy Statement and is incorporated herein by reference.
ITEM 12. SECURITY OWNERSHIP OF CERTAIN BENEFICIAL OWNERS AND MANAGEMENTAND RELATED STOCKHOLDER MATTERS.
Information regarding the security ownership of certain beneficial owners and management is set forth under thecaptions “SECURITY OWNERSHIP OF DIRECTORS AND MANAGEMENT” in the Proxy Statement and“SHARE OWNERSHIP OF PRINCIPAL STOCKHOLDERS” in the Proxy Statement and is incorporated hereinby reference.
The following table summarizes share and exercise price information about L Brands’ equity compensation plansas of January 28, 2017.
Plan category
(a) Number ofsecurities to be issued
upon exercise ofoutstanding options,warrants and rights
(b) Weighted-averageexercise price of
outstanding options,warrants and rights
(c) Number of securitiesremaining available forfuture issuance underequity compensation
plan (excludingsecurities reflected in
column (a))
Equity compensation plans approved by securityholders (1) . . . . . . . . . . . . . . . . . . . . . . . . . . . . 11,213,614 $47.17(2) 15,519,061
Equity compensation plans not approved bysecurity holders . . . . . . . . . . . . . . . . . . . . . . . . — — —
Total . . . . . . . . . . . . . . . . . . . . . . . . . . . . . . . . . . . 11,213,614 $47.17 15,519,061
(1) Includes the following plans: L Brands, Inc. 2015 Stock Option and Performance Incentive Plan, L Brands,Inc. 2011 Stock Option and Performance Incentive Plan and L Brands, Inc. 1993 Stock Option andPerformance Incentive Plan (2009 Restatement). There are no shares remaining available for grant under the2011 Plan or 1993 Plan.
(2) Does not include outstanding rights to receive Common Stock upon the vesting of restricted share awards orsettlement of deferred stock units.
105
Fo
rm10-K

ITEM 13. CERTAIN RELATIONSHIPS AND RELATED TRANSACTIONS, AND DIRECTORINDEPENDENCE.
Information regarding certain relationships and related transactions is set forth under the caption “ELECTIONOF DIRECTORS—Nominees and Directors” and “—Director Independence” in the Proxy Statement and isincorporated herein by reference.
ITEM 14. PRINCIPAL ACCOUNTANT FEES AND SERVICES.
Information regarding principal accountant fees and services is set forth under the captions “INDEPENDENTREGISTERED PUBLIC ACCOUNTANTS—Audit Fees”, “—Audit Related Fees”, “—Tax Fees”, “—All OtherFees” and “—Pre-approval Policies and Procedures” in the Proxy Statement and is incorporated herein byreference.
106

PART IV
ITEM 15. EXHIBITS, FINANCIAL STATEMENT SCHEDULES
(a) (1) Consolidated Financial Statements
The following consolidated financial statements of L Brands, Inc. are filed as part of this reportunder Item 8. Financial Statements and Supplementary Data:
Management’s Report on Internal Control Over Financial Reporting
Report of Independent Registered Public Accounting Firm on Internal Control OverFinancial Reporting
Report of Independent Registered Public Accounting Firm on Consolidated FinancialStatements
Consolidated Statements of Income for the Years Ended January 28, 2017, January 30,2016 and January 31, 2015
Consolidated Statements of Comprehensive Income for the Years Ended January 28, 2017,January 30, 2016 and January 31, 2015
Consolidated Balance Sheets as of January 28, 2017 and January 30, 2016
Consolidated Statements of Total Equity (Deficit) for the Years Ended January 28, 2017,January 30, 2016 and January 31, 2015
Consolidated Statements of Cash Flows for the Years Ended January 28, 2017, January 30,2016 and January 31, 2015
Notes to Consolidated Financial Statements
(2) Financial Statement Schedules
Schedules have been omitted because they are not required or are not applicable or because theinformation required to be set forth therein either is not material or is included in the financialstatements or notes thereto.
(3) List of Exhibits
3. Articles of Incorporation and Bylaws.
3.1 Restated Certificate of Incorporation of the Company incorporated by reference toExhibit 3.1 to the Company’s Form 10-K dated February 1, 2014.
3.2 Amended and Restated Bylaws of the Company incorporated by reference to Exhibit 3.1 tothe Company’s Form 8-K dated November 3, 2016.
4. Instruments Defining the Rights of Security Holders.
4.1 Conformed copy of the Indenture dated as of March 15, 1988 between the Company andThe Bank of New York, incorporated by reference to Exhibit 4.1 to the Company’sRegistration Statement on Form S-3 (File No. 333-105484) dated May 22, 2003.
4.2 Proposed form of Debt Warrant Agreement for Warrants attached to Debt Securities, withproposed form of Debt Warrant Certificate incorporated by reference to Exhibit 4.2 to theCompany’s Registration Statement on Form S-3 (File No. 33-53366) originally filed with theSecurities and Exchange Commission (the “SEC”) on October 16, 1992, as amended byAmendment No. 1 thereto, filed with the SEC on February 23, 1993 (the “1993 Form S-3”).
107
Fo
rm10-K

4.3 Proposed form of Debt Warrant Agreement for Warrants not attached to Debt Securities,with proposed form of Debt Warrant Certificate incorporated by reference to Exhibit 4.3 tothe 1993 Form S-3.
4.4 Indenture, dated as of February 19, 2003 between the Company and The Bank ofNew York, incorporated by reference to Exhibit 4 to the Company’s Registration Statementon Form S-4 (File No. 333-104633) dated April 18, 2003.
4.5 First Supplemental Indenture dated as of May 31, 2005 among the Company, The Bank ofNew York and The Bank of New York Trust Company, N.A., incorporated by reference toExhibit 4.1.2 to the Company’s Registration Statement on Form S-3 (Reg. No. 333-125561) filed June 6, 2005.
4.6 Second Supplemental Indenture dated as of July 17, 2007 between the Company and TheBank of New York Trust Company, N.A., incorporated by reference to Exhibit 4.1.3 to theCompany’s Registration Statement on Form S-3 (Reg. No. 333-146420) filed October 1,2007.
4.7 Indenture, dated as of June 19, 2009, among the Company, the guarantors named thereinand The Bank of New York Mellon Trust Company, N.A., as trustee, incorporated byreference to Exhibit 4.1 to the Company’s Form 8-K dated June 24, 2009.
4.8 Registration Rights Agreement, dated as of June 19, 2009, among the Company, theguarantors named therein and JP Morgan Securities Inc., as representative of the initialpurchasers, incorporated by reference to Exhibit 4.2 to the Company’s Form 8-K datedJune 24, 2009.
4.9 Third Supplemental Indenture dated as of May 4, 2010 between the Company, theguarantors named therein and The Bank of New York Mellon Trust Company, N.A.,incorporated by reference to Exhibit 4.1.4 to the Company’s Registration Statement onForm S-3 (Reg. No. 333-170406) filed on November 5, 2010.
4.10 Fourth Supplemental Indenture dated as of January 29, 2011 between the Company, theguarantors named therein and The Bank of New York Mellon Trust Company, N.A.,incorporated by reference to Exhibit 4.1.5 to the post-effective amendment to theCompany’s Registration Statement on Form S-3 (Reg. No. 333-170406) filed on March 22,2011.
4.11 Form of Fifth Supplemental Indenture dated as of March 25, 2011 between the Company,the guarantors named therein and The Bank of New York Mellon Trust Company, N.A.,incorporated by reference to Exhibit 4.1.6 to the post-effective amendment to theCompany’s Registration Statement on Form S-3 (Reg. No. 333-170406) filed on March 22,2011.
4.12 Sixth Supplemental Indenture dated as of February 7, 2012 among the Company, theguarantors named therein and The Bank of New York Mellon Trust Company, N.A.,incorporated by reference to Exhibit 4.1 to the Company’s Quarterly Report on Form 10-Qfor the quarter ended April 28, 2012.
4.13 Seventh Supplemental Indenture dated as of March 22, 2013 between the Company, theguarantors named therein and The Bank of New York Mellon Trust Company, N.A.,incorporated by reference to Exhibit 4.1.8 to the Company’s Registration Statement onForm S-3 (Reg. No. 333-191968) filed on October 29, 2013.
4.14 Eighth Supplemental Indenture dated as of October 16, 2013 between the Company, theguarantors named therein and The Bank of New York Mellon Trust Company, N.A.,incorporated by reference to Exhibit 4.1.9 to the Company’s Registration Statement onForm S-3 (Reg. No. 333-191968) filed on October 29, 2013.
108

4.15 Amendment and Restatement Agreement dated July 18, 2014 among L Brands, Inc., aDelaware corporation, L (Overseas) Holdings LP, an Alberta limited partnership, CanadianRetail Holdings Corporation, a Nova Scotia company, Victoria’s Secret UK Limited, acompany organized under the laws of England and Wales, and Mast Industries (Far East)Limited, a Hong Kong corporation, the lenders party thereto and JPMorgan Chase Bank,N.A., as Administrative Agent and Collateral Agent (the “Administrative Agent”), inrespect of the Amended and Restated Five-Year Revolving Credit Agreement dated as ofJuly 15, 2011 among the Company, the lenders from time to time party thereto and theAdministrative Agent, incorporated by reference to Exhibit 4.1 to the Company’s Form 8-K dated July 22, 2014.
4.16 Ninth Supplemental Indenture dated as of January 30, 2015 among the Registrant, the NewGuarantors, The Bank of New York Mellon Trust Company, as Trustee, and the OldGuarantors to the Base Indenture dated as of March 15, 1988, as amended, relating to the7.000% Senior Notes due 2020, the 6.625% Senior Notes due 2021, the 5.625% SeniorNotes due 2022 and the 5.625% Senior Notes due 2023, incorporated by reference toExhibit 4.16 to the Company’s Registration Statement on Form S-4 (Reg. No. 333-209114)filed on January 25, 2016.
4.17 Second Supplemental Indenture dated as of January 30, 2015 among the Registrant, theNew Guarantors, The Bank of New York Mellon Trust Company, as Trustee and the OldGuarantors to the Base Indenture dated as of June 19, 2009, as amended, relating to the8.50% Senior Notes due 2019, incorporated by reference to Exhibit 4.17 to the Company’sRegistration Statement on Form S-4 (Reg. No. 333-209114) filed on January 25, 2016.
4.18 First Amendment dated as of April 21, 2015 among the Company, L (Overseas) HoldingLP, an Alberta limited partnership, Canadian Retail Holdings Corporation, a Nova Scotiacompany, Victoria’s Secret UK Limited, a company organized under the laws of Englandand Wales, and Mast Industries (Far East) Limited, a Hong Kong corporation, the lendersparty thereto and JPMorgan Chase Bank, N.A., as Administrative Agent and CollateralAgent (the “Administrative Agent”), in respect of the Amended and Restated Five-YearRevolving Credit Agreement dated as of July 18, 2014 among the Company, the lendersfrom time to time party thereto and the Administrative Agent, incorporated by reference toExhibit 4.1 to the Company’s Quarterly Report on Form 10-Q for the quarter ended May 2,2015.
4.19 Indenture, dated as of October 30, 2015, among L Brands, Inc., the guarantors namedtherein and The Bank of New York Mellon Trust Company, N.A., as trustee, incorporatedby reference to Exhibit 4.1 to the Company’s Form 8-K dated November 3, 2015.
4.20 Form of 6.875% senior notes due 2035, incorporated by reference to Exhibit 4.2 to theCompany’s Form 8-K dated November 3, 2015.
4.21 Registration Rights Agreement, dated as of October 30, 2015, among L Brands, Inc., theguarantors named therein and Merrill Lynch, Pierce, Fenner & Smith Incorporated asrepresentative of the initial purchasers, incorporated by reference to Exhibit 4.3 to theCompany’s Form 8-K dated November 3, 2015.
4.22 Indenture, dated as of June 16, 2016, among L Brands, Inc. and U.S. Bank NationalAssociation, as trustee, incorporated by reference to Exhibit 4.1 to the Company’s Form 8-Kdated June 16, 2016.
4.23 First Supplemental Indenture, dated as of June 16, 2016, by and among L Brands, Inc., theguarantors named therein and U.S. Bank National Association, as trustee, incorporated byreference to Exhibit 4.2 to the Company’s Form 8-K dated June 16, 2016.
109
Fo
rm10-K

10. Material Contracts.
10.1 Officers’ Benefits Plan incorporated by reference to Exhibit 10.4 to the Company’s AnnualReport on Form 10-K for the fiscal year ended January 28, 1989 (the “1988 Form 10-K”).**
10.2 The Company’s Supplemental Retirement and Deferred Compensation Plan incorporatedby reference to Exhibit 10.3 to the Company’s Annual Report on Form 10-K for the fiscalyear ended February 3, 2001.**
10.3 Form of Indemnification Agreement between the Company and the directors and executiveofficers of the Company incorporated by reference to Exhibit 10.4 to the 1998Form 10-K.**
10.4 Supplemental schedule of directors and executive officers who are parties to anIndemnification Agreement incorporated by reference to Exhibit 10.5 to the 1998Form 10-K.**
10.5 The 1993 Stock Option and Performance Incentive Plan of the Company, incorporated byreference to Exhibit 4 to the Company’s Registration Statement on Form S-8(File No. 33-49871).**
10.6 The Company’s 1996 Stock Plan for Non-Associate Directors incorporated by reference toExhibit 10.2 to the Company’s Quarterly Report on Form 10-Q for the quarter endedNovember 2, 1996.**
10.7 The Company’s Incentive Compensation Performance Plan incorporated by reference toExhibit A to the Company’s Proxy Statement dated April 14, 1997.**
10.8 Agreement dated as of May 3, 1999 among the Company, Leslie H. Wexner and theWexner Children’s Trust, incorporated by reference to Exhibit 99 (c) 1 to the Company’sSchedule 13E-4 dated May 4, 1999.
10.9 The 1998 Restatement of the Company’s 1993 Stock Option and Performance IncentivePlan incorporated by reference to Exhibit A to the Company’s Proxy Statement datedApril 20, 1998.**
10.10 The 2002 Restatement of the Company’s 1993 Stock Option and Performance IncentivePlan, incorporated by reference to Exhibit 10.23 to the Company’s Annual Report onForm 10-K for the fiscal year ended February 1, 2003.**
10.11 The Company’s Stock Award and Deferred Compensation Plan for Non-AssociateDirectors incorporated by reference to Exhibit 4.1 to the Company’s Registration Statementon Form S-8 (File No. 333-110465) dated November 13, 2003.**
10.12 The Company’s 1993 Stock Option and Performance Incentive Plan (2003 Restatement)incorporated by reference to Exhibit 4.2 to the Company’s Registration Statement onForm S-8 (File No. 333-110465) dated November 13, 2003.**
10.13 The Company’s 1993 Stock Option and Performance Incentive Plan (2004 Restatement)incorporated by reference to Appendix A to the Company’s Proxy Statement datedApril 14, 2004.**
10.14 The Company’s Stock Option Award Agreement incorporated by reference to Exhibit10.29 to the Company’s Annual Report on Form 10-K for the fiscal year ended January 29,2005.**
10.15 Form of Stock Ownership Guideline incorporated by reference to Exhibit 10.32 to theCompany’s Annual Report on Form 10-K for the fiscal year ended January 29, 2005.**
110

10.16 Employment Agreement effective as of April 9, 2007 among the Company and StuartBurgdoerfer incorporated by reference to Exhibit 10.2 to the Company’s Form 8-K datedApril 11, 2007.**
10.17 The Company’s 1993 Stock Option and Performance Incentive Plan (2009 Restatement)incorporated by reference to Exhibit 99.1 to the Company’s Registration Statement onForm S-8 (File No. 333-110465) dated September 10, 2009.**
10.18 Employment Agreement dated as of December 31, 2007 among the Company,beautyAvenues, LLC, and Charles C. McGuigan, as amended by Amendment toAgreement dated December 1, 2008 and Form of Employment Agreement Amendmenteffective as of March 15, 2012 incorporated by reference to Exhibit 10.24 to theCompany’s Annual Report on Form 10-K for the fiscal year ended January 28, 2012.**
10.19 The Company’s 2011 Stock Option and Performance Incentive Plan originally incorporatedby reference to Appendix A to the Company’s Proxy Statement dated April 11, 2011 andAmended and Restated dated July 21, 2011 incorporated by reference to Exhibit 10.25 tothe Company’s Annual Report on Form 10-K for the fiscal year ended January 28, 2012.**
10.20 Employment Agreement dated as of March 15, 2013 among the Company, Bath & BodyWorks Brand Management, Inc. and Nicholas P. M. Coe incorporated by reference toExhibit 10.26 to the Company’s Annual Report on Form 10-K for the fiscal year endedFebruary 2, 2013.**
10.21 Form of Sixth Amended and Restated Master Aircraft Time Sharing Agreementincorporated by reference to Exhibit 10.23 to the Company’s Annual Report on Form 10-Kfor the fiscal year ended January 31, 2015.**
10.22 L Brands, Inc. 2015 Stock Option and Performance Incentive Plan Terms and Conditionsof Restricted Share Unit Grant, incorporated by reference to Exhibit 10.1 to the Company’sQuarterly Report on Form 10-Q for the quarter ended August 1, 2015.
10.23 L Brands, Inc. 2015 Stock Option and Performance Incentive Plan Terms and Conditionsof Stock Option Grant, incorporated by reference to Exhibit 10.2 to the Company’sQuarterly Report on Form 10-Q for the quarter ended August 1, 2015.
10.24 L Brands, Inc. 2015 Cash Incentive Compensation Performance Plan, incorporated byreference to Exhibit 10.2 to the Company’s Form 8-K dated May 26, 2015.
10.25 Employment Agreement dated as of July 23, 2009 among Limited Brands, Inc., LimitedService Corporation, Inc., and Martin P. Waters, as amended by Employment AgreementAmendment among Limited Brands, Inc., Limited Brands Service Company, LLC, andMr. Waters effective as of December 19, 2012.**
12. Computation of Ratio of Earnings to Fixed Charges.
21. Subsidiaries of the Registrant.
23.1 Consent of Ernst & Young LLP.
24. Powers of Attorney.
31.1 Section 302 Certification of CEO.
31.2 Section 302 Certification of CFO.
32. Section 906 Certification (by CEO and CFO).
101.INS XBRL Instance Document
111
Fo
rm10-K

101.SCH XBRL Taxonomy Extension Schema Document
101.CAL XBRL Taxonomy Extension Calculation Linkbase Document
101.DEF XBRL Taxonomy Definition Linkbase Document
101.LAB XBRL Taxonomy Extension Label Linkbase Document
101.PRE XBRL Taxonomy Extension Presentation Linkbase Document
** Identifies management contracts or compensatory plans or arrangements.
(b) Exhibits.
The exhibits to this report are listed in section (a)(3) of Item 15 above.
(c) Not applicable.
ITEM 16. FORM 10-K SUMMARY.
None.
112

SIGNATURES
Pursuant to the requirements of Section 13 or l5(d) of the Securities Exchange Act of 1934, the registrant hasduly caused this report to be signed on its behalf by the undersigned, thereunto duly authorized.
Date: March 17, 2017
L BRANDS, INC. (Registrant)By: /s/ STUART B. BURGDOERFER
Stuart B. Burgdoerfer,Executive Vice President andChief Financial Officer
Pursuant to the requirements of the Securities Exchange Act of 1934, this report has been signed below by thefollowing persons on behalf of the registrant and in the capacities indicated on January 28, 2017:
Signature Title
/S/ LESLIE H. WEXNER*Leslie H. Wexner
Chairman of the Board of Directors and ChiefExecutive Officer (Principal Executive Officer)
/S/ STUART B. BURGDOERFER
Stuart B. BurgdoerferExecutive Vice President and Chief Financial
Officer (Principal Financial Officer andPrincipal Accounting Officer)
/S/ E. GORDON GEE*E. Gordon Gee Director
/S/ DENNIS S. HERSCH*Dennis S. Hersch Director
/S/ DONNA A. JAMES*Donna A. James Director
/S/ DAVID T. KOLLAT*David T. Kollat Director
/S/ JEFFREY H. MIRO*Jeffrey H. Miro Director
/S/ MICHAEL G. MORRIS*Michael G. Morris Director
/S/ STEPHEN S. STEINOUR*Stephen S. Steinour Director
/S/ ALLAN R. TESSLER*Allan R. Tessler Director
/S/ ABIGAIL S. WEXNER*Abigail S. Wexner Director
/S/ RAYMOND ZIMMERMAN*Raymond Zimmerman Director
* The undersigned, by signing his name hereto, does hereby sign this report on behalf of each of the above-indicated directors of the registrant pursuant to powers of attorney executed by such directors.
By: /s/ STUART B. BURGDOERFER
Stuart B. BurgdoerferAttorney-in-fact
113
Fo
rm10-K

[THIS PAGE INTENTIONALLY LEFT BLANK]

Executive Officers
Leslie H. Wexner
Chairman and Chief Executive OfficerL Brands, Inc.
Stuart B. Burgdoerfer
Executive Vice President and Chief Financial OfficerL Brands, Inc.
Nicholas P. M. Coe
President and Chief Executive OfficerBath & Body Works
Charles C. McGuigan
Chief Operating OfficerL Brands, Inc.
President and Chief Executive OfficerMast Global
Martin Waters
President and Chief Executive OfficerL Brands International
Board of Directors
Leslie H. Wexner (6)
Chairman and Chief Executive Officer, L Brands, Inc.
E. Gordon Gee (2, 5)
President, West Virginia University
Dennis S. Hersch (4)
President, N.A. Property, Inc.
Donna A. James (1, 3, 5)
Managing Director, Lardon & Associates LLC
David T. Kollat (1, 2, 3, 4)
Chairman, 22, Inc.
Jeffrey H. Miro (2, 3)
Senior Partner, Honigman Miller Schwartz and Cohn LLP
Michael G. Morris (2)
Chairman, American Electric Power Company, Inc. (Retired)
Stephen D. Steinour
Chairman, President and Chief Executive Officer, HuntingtonBancshares Incorporated
Allan R. Tessler (1, 3, 4, 6)
Chairman and Chief Executive Officer, International FinancialGroup, Inc.
Abigail S. Wexner (4, 5)
Chairman and Chief Executive Officer, Whitebarn Associates
Raymond Zimmerman (1, 4)
Chief Executive Officer, Service Merchandise LLC
1 = Member of the Audit Committee2 = Member of the Compensation Committee3 = Member of the Nominating and Governance Committee4 = Member of the Finance Committee5 = Member of the Inclusion Committee6 = Member of the Executive Committee
Co
mp
any
Info
rmatio
n

Company Information
Headquarters
L Brands, Inc.Three Limited ParkwayColumbus, Ohio 43230
614.415.7000www.LB.com
Annual Meeting of Shareholders
8:30 a.m. Thursday, May 18, 2017Three Limited ParkwayColumbus, Ohio 43230
Stock Exchange Listing
New York Stock Exchange(Trading Symbol “LB”)
Independent Public Accountants
Ernst & Young LLPColumbus, Ohio
Information Requests
Through our website: www.LB.com
Upon written request to: L Brands, Inc.Investor RelationsThree Limited ParkwayColumbus, Ohio, 43230
By calling: 614.415.7000
Stock Transfer Agent, Registrar and Dividend Agent
American Stock Transfer & Trust Company (“AST”)6201 15th AvenueBrooklyn, NY 11219
[email protected]://www.astfinancial.com
L Brands, Inc.
Founded 1963
as of Jan. 28, 2017:Approximate associate base: 93,600Approximate shareholder base: 198,000
Investor resources available on our website, www.LB.com,include:
• Anticipated release dates for monthly sales and quarterlyearnings
• Live webcasts of the quarterly earnings conference calls• Audio replays of monthly sales and quarterly earnings
conference calls• Current investor presentations and materials
NYSE Certification Statement
Our Chief Executive Officer and Chief Financial Officer have filedthe certifications required by Section 302 of the Sarbanes-OxleyAct of 2002 with the Securities and Exchange Commission asexhibits to our Form 10-K for the fiscal year ended Jan. 28, 2017.In addition, our Chief Executive Officer filed a separate annualcertification to the New York Stock Exchange following ourannual shareholders’ meeting on May 19, 2016.
©2017 L Brands

ADMITTANCE SLIP
2017 ANNUAL MEETING OF STOCKHOLDERS
Date, Time and Place of Meeting:
Date: Thursday, May 18, 2017
Time: 8:30 a.m., Eastern Time
Place: Three Limited ParkwayColumbus, Ohio 43230
Attending the Meeting:
Stockholders who plan to attend the meeting in person must bring this admittance slip and a photoidentification to gain access. Because of necessary security precautions, bags, purses and briefcases may besubject to inspection. To speed the admissions process, stockholders are encouraged to bring only essential items.Cameras, camcorders or videotaping equipment are not allowed. Photographs or videos taken by the Company atthe meeting may be used by the Company. By attending, you waive any claim or rights to these photographs.
For more information about attending the annual meeting, please visit the website at www.lb.com or contactInvestor Relations at (614) 415-7585.
Ad
mittan
ceS
lip
[THIS PAGE INTENTIONALLY LEFT BLANK]
