prrs the challenge continues - iowa pork · prrs – the challenge continues cameron schmitt, dvm,...
TRANSCRIPT

PRRS – The Challenge Continues
Cameron Schmitt, DVM, MS
Iowa Pork Congress - 2013

My Background
• 2002 graduate of Iowa State University
• Completed DVM and MS (Veterinary Microbiology)
• Joined Pipestone Vet Clinic in 2002
• Started Pipestone Vet Clinic of Iowa 2008
• Married, 3 boys


Outline
• Biosecurity Review
– Transmission
– Filtration
• Immunological Review
– Vaccines
• Sow Farm Clean up
• Epidemiological Data
• Summary Comments

PRRS Biosecurity
• Transmission via:
– Animals
– Semen
– Fomites
– Air

Biosecurity - Animals
• Animals are the highest risk for PRRS transmission
– They propagate the agent
– Shed in all secretions/excretions

Biosecurity - Animals
• Animals – Sow Herds – Gilts
– It is critical to have isolation/quarantine space for breeding herds
– Testing – placement and 2 weeks post placement
• Oral Fluids or Serum
• Wean-to-Finish sites
– All In/All Out flow
– Continuous flow sites tend to circulate PRRS and other diseases once infected

Biosecurity - Semen
• Semen is still a risk today
– Critical to work with a reputable source and understand their testing protocols
– Do not use semen until test cleared for the batch/boars that collection day

Biosecurity - Fomites
• Standardized D&D
– D&D = Disinfection and Down time
– All inanimate objects entering a farm subject to D&D
– Spray all materials, equipment, etc with Synergize and dry
– 1 hour and Dry are the critical elements – must meet both criterion

Biosecurity - Trucks
• Transport is highly correlated with most disease movement
• Are your trucks clean, really clean?
– Inspected?
– Audited?
– The industry needs to re-evaluate current transport biosecurity

Biosecurity - Air
• A lot of new knowledge – we continue to learn

Aerosols
• Viral quantities found in air were significantly higher in 2011 than in previous years
– Hypothesized strains continue to become more virulent/more readily shed
• Vaccination with Modified Live Vaccines significantly reduces aerosol shedding
– Vaccination of sites surrounding sow farms is a good idea
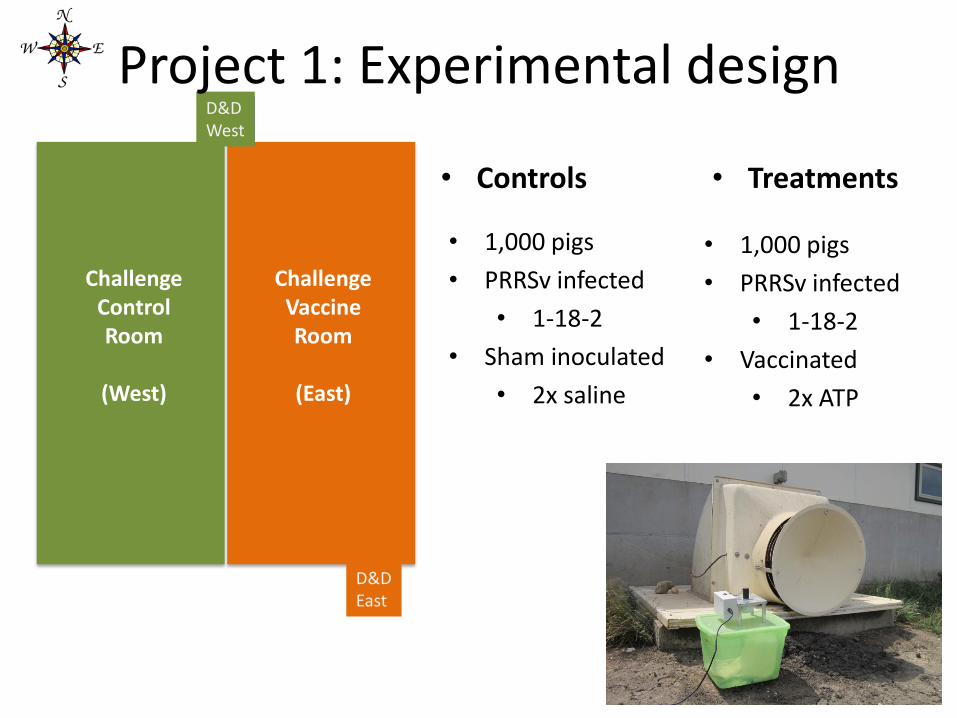
Challenge Control Room
(West)
D&D West
Challenge Vaccine Room
(East)
D&D East
* It was used one cyclonic collector for each room
Project 1: Experimental design
• Controls
• 1,000 pigs
• PRRSv infected
• 1-18-2
• Sham inoculated
• 2x saline
• Treatments
• 1,000 pigs
• PRRSv infected
• 1-18-2
• Vaccinated
• 2x ATP

Results (Linhares et al., Vaccine, 2011)
Outcome Vaccine group Control group
# PRRSV positive air days*
17 days
31 days
Duration of aerosol shedding*
45 days
70 days
* = Differences significant at p < 0.05

Project 2
• Recently completed:
– Vaccinate first
– Challenge second
– Outcomes: shedding and performance

Challenge Control Room
(West)
D&D West
Challenge Vaccine Room
(East)
D&D East
* It was used one cyclonic collector for each room
Experimental design
• Controls
• 1,000 pigs
• Sham inoculated
• 1x saline
• Challenged
• 1-18-2
• Treatments
• 1,000 pigs
• Vaccinated
• 1x MLV
• Challenged
• 1-18-2

Preliminary data: Air Sampling
Days From Inoculation
-27 -26 -25 -24 -23 -22 -21 -20 -19 -18 -17 -16 -15 -14 -13 -12 -11 -10 -9 -8 -7 -6 -5 -4 -3 -2 -1 0 1 2 3 4 5 6 7 8 9 10 11 12 13 14 15 16 17 18 19 20 21 22 23 24 25 26 27 28 29 30 31 32 33 34
Treatment
Group
6/1
2/2
012
6/1
3/2
012
6/1
4/2
012
6/1
5/2
012
6/1
6/2
012
6/1
7/2
012
6/1
8/2
012
6/1
9/2
012
6/2
0/2
012
6/2
1/2
012
6/2
3/2
012
6/2
4/2
012
6/2
5/2
012
6/2
6/2
012
6/2
7/2
012
6/2
8/2
012
6/2
9/2
012
6/3
0/2
012
7/1
/2012
7/3
/2012
7/4
/2012
7/5
/2012
7/6
/2012
7/7
/2012
7/8
/2012
7/9
/2012
7/1
0/2
012
7/1
1/2
012
7/1
2/2
012
7/1
3/2
012
7/1
4/2
012
7/1
5/2
012
7/1
6/2
012
7/1
7/2
012
7/1
8/2
012
7/1
9/2
012
7/2
0/2
012
7/2
1/2
012
7/2
2/2
012
7/2
3/2
012
7/2
4/2
012
7/2
5/2
012
7/2
6/2
012
7/2
7/2
012
7/2
8/2
012
7/2
9/2
012
7/3
0/2
012
7/3
1/2
012
8/1
/2012
8/2
/2012
8/3
/2012
8/4
/2012
8/5
/2012
8/6
/2012
8/7
/2012
8/8
/2012
8/9
/2012
8/1
0/2
012
8/1
1/2
012
8/1
2/2
012
8/1
3/2
012
8/1
4/2
012
North -
NoVax 0 0 0 0 0 0 0 0 0 0 0 0 0 0 0 0 0 0 0 0 0 1 1 0 1 0 0 1 1 1 1 2 1 1 1 1 0 0 1 1 1 1 1 1 1 0 1 1 0 0 1 0 1 1 0 1 0 1 1
South -
Vax 0 1 1 1 1 0 1 0 0 0 0 0 0 0 0 0 0 0 0 0 0 0 0 0 0 0 0 1 1 0 2 1 0 1 0 0 0 0 0 0 0 0 0 0 0 0 0 0 0 0 0 0 0 0 0 0 0 0 0 0 0 0
Days From Innoculation
35 36 37 38 39 40 41 42 43 44 45 46 47 48 49 50 51 52 53 54 55 56
Treatment
Group
8/1
5/2
01
2
8/1
6/2
01
2
8/1
7/2
01
2
8/1
8/2
01
2
8/1
9/2
01
2
8/2
0/2
01
2
8/2
1/2
01
2
8/2
2/2
01
2
8/2
3/2
01
2
8/2
4/2
01
2
8/2
5/2
01
2
8/2
6/2
01
2
8/2
7/2
01
2
8/2
8/2
01
2
8/2
9/2
01
2
8/3
0/2
01
2
8/3
1/2
01
2
9/1
/20
12
9/2
/20
12
9/3
/20
12
9/4
/20
12
9/5
/20
12
North - NoVax 0 0 0 0 0 0 0 0 0 0 0 0 0 0 0 0 0 0
South - Vax 0 1 1 1 1 0 1 0 0 0 0 0 0 0 0 0 0 0 0 0 0 0

Filtered Farms
• Filter bypass continues to be a challenge
– Backdrafting through fans
– Filter Box design/seal
– Cracks, leaks, drains, etc.

Filter Farm Data
• Our data would indicate there is a significant reduction in the frequency of PRRS infections on filtered farms, but it isn’t perfect
• When comparing pre and post filtration, we are observing a 61% reduction in new viral introductions

The impact of air filtration is significant, but not perfect
-40 -30 -20 -10 0 10 20 30 40
1
2
3
4
5
6
7
8
9
10
11
12
13
14
15
16
17
18
19
20
21
22
23
24
Time pre and post air filtration (months)
Bre
ed
ing
he
rds
Pre-filtration
Postfiltration
New PRRSV infection
How often are farms challenged?
------ PRRS

Recipient Populations: Perimeter Testing
5 filtered farms selected for sampling • Recipient farms (PRRSV-negative)
– n = 4 – sampled 30 m outside of building – collector placed into direction of prevailing wind
• Source farm (PRRSV-positive) – n =1 – sampled at exhaust fan – 1 mile SE of neighboring recipient farm
Daily air sampling: March 1-31, 30 minutes per day
Outcomes – Frequency: # PCR-positive air days – Dose: Quantity of viable virus (TCID50/mL) – Diversity: ORF 5 sequencing of selected samples

Farm 4
Farm 3
Results Frequency
Farm number PRRSV positive air days
1 (recipient) 64%
2 (recipient) 41%
3 (source) 75%
4 (recipient) 65%
5 (recipient) Historical
0% 3-11%

Farm1
Farm2
Farm 3
Farm 4
Historical
Dose
L
og
con
cen
trat
ion
vir
us
Farm
Farm 1a
Farm 2a
Farm 3a
Farm 4a
Historical b
ANOVA

Diversity
0
1
2
3
4
5
6
1 2 3 4
1-18-2 (new) 1-26-2 (new) 2-5-2 (MLV)
1-18-2 (old) 1-18-2 (new) 1-26-2 (new) (n=2)
1-3-2 (source) (n=2) 1-26-2 (source)
1-3-2 (source), 1-8-4 1-4-2 (ATP) 1-26-2 (source)
Farm number
# s
equ
ence
s
Recipient
Recipient Recipient
Source

Conclusions
• Under the conditions of this study: – 1. Viral loads in aerosols from source populations infected with
new variants were significantly higher than historical levels.
– 2. PRRSV aerosol challenge of recipient populations was a frequent event.
– 3. Viral loads in recipient aerosol samples collected at the perimeter level were significantly higher than historical levels.
– 4. Extensive viral diversity was observed in air samples collected around the perimeter of recipient populations.

Slurry
• Pigs shed PRRS in feces for 7 days • Virus survives in slurry for 14 days at 40 degrees and 5
days at 50-60 degrees • Virus survival in solids is less than 14 days in standard
pit environments • Virus is aerosolized during agitation if population is
shedding virus • Virus can be found at least at 30 meters from
applicators during application • Pumping equipment can be fomites for transmission of
virus

Slurry application risk: Proof of concept

PRRS Immunology
• Vaccines – New vaccine in the market
– Modified Live Products • PRRS MLV – Boehringer Ingelheim
• PRRS ATP – Boehringer Ingelheim
• Fostera PRRS – Pfizer
– Killed Products • MJ PRRS
• Sirrah
• Autogenous

PRRS Vaccines
• Ongoing research on efficacy
• Have been proven scientifically to:
– Reduce lung lesions
– Reduce duration of viremia
– Reduce shedding of virus via aerosols
– Improve certain production parameters

Load%close%homogenize0to0eliminate0PRRSv0from0acutely0infected0breeding0herds.0
0
Part01:0>me0to0neg0pig0produc>on0(TTNP)0Part02:0produc>on0analysis0(TTBP/total0loss)0Part03:0nega>ve0herd0(factors,0gilt0mgmt)0
Linhares D, DVM, MBA; Cano JP, DVM, PhD; Torremorell M, DVM, PhD; Morrison R, DVM, MBA, PhD.
10

Treatment:(LVI(vs(MLV(TTNP0probability0

Prior(PRRSvBinfec9on:(yes(vs(no(
80

Vaccinated0herds0had0significantly0less0total0loss0

LVI(herds(reached(nega9ve(sooner(
MLV(herds(had(less(total(loss(
PRRSv(monitoring(must(be(done(over(9me(
Median(9meBtoBnega9ve(was((~(210(days(
Herds(with(prior(PRRSv(infec9on(reached(nega9ve(sooner,(recovered(produc9on(faster(and(had(less(total(loss(
Farms(with(up(to(3(monthly(PCRBnega9ve(tests(with(produc9on(levels(“in(control”(might(s9ll(have(PRRSv(
circula9ng(at(low(prevalence(levels(
G(e(n(e(r(a(l((((((S(u(m(m(a(r(y(

Data Provided from Steve Tousignant, Bob Morrison Funding from National Pork Board

Data Provided from Steve Tousignant, Bob Morrison Funding from National Pork Board

Summary Comments
• As an industry, we need to continue to come together to prevent the spread of PRRS
• We need to utilize proven scientific knowledge, not just what might work/seems to work
• We need to continue to research disease movement, immunology, genetics, etc.
• We (as an industry) have cut many corners to decrease cost that are causing problems – Down time – Sanitation – Etc…

Acknowledgements
• Daniel Linhares
• Steve Tousignant
• Dr. Bob Morrison
• Dr. Scott Dee
• Pipestone Research Committee
– Dr. Scott Dee, Dr. Joel Nerem, Dr. Barry Kerkaert, Dr. Luke Minion, Dan Hanson