psat/nmsqt understanding scores 2016 | sat suite of
TRANSCRIPT
PSAT/NMSQT®
Understanding Scores UPDATED WITH SCORE CONVERSIONS
2017
Contact Us About the College Board The College Board is a mission-driven not-for-profit organization that connects students to college success and opportunity. Founded in 1900, the College Board was created to expand access to higher education. Today, the College Board’s membership is made up of over 6,000 of the world’s leading educational institutions and is dedicated to promoting excellence and equity in education. Each year, the College Board helps more than seven million students prepare for a successful transition to college through programs and services in college readiness and college success—including the SAT® and the Advanced Placement Program®. The organization also serves the education community through research and advocacy on behalf of students, educators, and schools. For further information, visit collegeboard.org.
About the PSAT/NMSQT The Preliminary SAT/National Merit Scholarship Qualifying Test(PSAT/NMSQT®) is cosponsored by the College Board and NationalMerit Scholarship Corporation (NMSC). It is administered for theCollege Board and NMSC by Educational Testing Service (ETS).
About the National Merit Scholarship Program The PSAT/NMSQT is the route of entry to the National Merit®Scholarship Program, an academic competition conductedby National Merit Scholarship Corporation (NMSC). Requirementsfor participation, steps in the competition, and awardsoffered are explained in the PSAT/NMSQT Student Guide and on NMSC’s website.
Further information is provided in the Guide to the National Merit Scholarship Program. Questions about the scholarship program notanswered in the published materials should be directed to NMSC:
National Merit Scholarship Corporation1560 Sherman Avenue, Suite 200 Evanston, IL 60201-4897 847-866-5100www.nationalmerit.org
CONTACTS FOR STUDENTS AND PARENTS [email protected]
866-433-7728+1-212-713-8105 (International)609-882-4118 (TTY)8 a.m. to 4 p.m. ET, Mon.–Fri.
GENERAL CONTACTS PSAT/NMSQTP.O. Box 6720 Princeton, NJ 08541-6720 610-290-8979 (fax)
CONTACTS FOR EDUCATORS psat/[email protected]
888-477-PSAT (7728)for educators only
+1-212-237-1335 (International)609-882-4118 (TTY)8 a.m.–8 p.m. ET, Mon.–Fri.
The PSAT/NMSQT and the SAT Suite of Assessments
What is the SAT Suite of Assessments? The SAT® Suite of Assessments is an integrated system oftests that includes the SAT (for students in grades 11 and 12),the PSAT/NMSQT® and the PSAT™ 10 (for grades 10 and 11),and the PSAT™ 8/9 (for grades 8 and 9).
The tests measure the same skills and knowledge in grade-appropriate ways. They work together to show collegereadiness over time so educators, students, and parents canmonitor student progress. Their content reflects the kinds ofmeaningful, engaging, and challenging work that students findin the best middle and high school courses taught today.
What does the PSAT/NMSQT measure? The PSAT/NMSQT measures the skills and knowledge that research shows are the most essential for college and career readiness and success. The Reading Test measures comprehension and reasoning skills and focuses on close reading of passages in a wide array of subject areas. The Writing and Language Test measures a range of skills including command of evidence, expression of ideas, and the use of standard English conventions in grammar and punctuation. The Math Test covers a range of math practices, with an emphasis on problem solving, modeling, using tools strategically, and using algebraic structure.
How is the PSAT/NMSQT scored? Students receive a total score that is the sum of their scores on the two sections (Evidence-Based Reading and Writing, and Math).
To calculate section scores, we first compute the student’sraw score—the number of questions correctly answered—foreach section. Nothing is deducted for incorrect answers or forunanswered questions.
Next, we convert each of the raw section scores to a scaled score of 160 to 760. This conversion process adjusts forslight differences in difficulty among versions of the test andprovides a score that is consistent across different versions.The scaled scores are the scores provided on score reports.
How can I use the student score report? The student score report clearly summarizes a student’scurrent achievement levels and encourages next steps toincrease college and career readiness. You can aid students bygoing over their score reports and helping them understandwhat their scores mean. See the details below.
CHECK-IN: ON TRACK FOR COLLEGE READINESS? The score report includes an indicator for each section thatshows whether the student’s score meets the grade-levelbenchmark. These benchmarks allow students and educators to understand how students are progressing toward collegereadiness.
§ If a student is meeting the benchmark for a section,remind that student to continue to take rigorous coursesand work hard to stay on track for college success.
§ If a student is not meeting the benchmark for a section,connect the student to classroom work that is focusedon areas that need improvement. Khan Academy® canhelp supplement this work.
1
USE STUDENT SCORES TO IDENTIFY STRENGTHS AND WEAKNESSES: § Use test scores, cross-test scores, and subscores to
evaluate a student’s relative strengths and weaknessesand see what skills need practice.
§ Use the red/yellow/green coding on test scores andsubscores to evaluate how your student is performingrelative to students who are meeting or exceeding thebenchmark.
§ Highlight the areas in green as the student’s strengths.
§ Prioritize areas in the red range for additional work andpractice.
HELP STUDENTS DECIDE ON NEXT STEPS: § Use the “Your Scores: Next Steps” section to identify the
specific skills that the student should address.
§ Work with your student to think of ways to developeach of the skills you have identified for focus andimprovement.
§ Encourage students to go online for more details and tolink their College Board account to Khan Academy for apersonalized study plan.
For further guidance on interpreting score reports, see theProfessional Development modules for K–12 educators atsat.org/k12.
Score-Reporting Features On pages 13–14 of this booklet, you will find an annotatedsample score report that includes detailed explanations of theinformation that students receive about their college readinessskills. Students can access their online reports to obtainmore information and guidance, including personalized KhanAcademy instruction and practice based on their results.
The online reporting portal at k12reports.collegeboard.org
offers you an array of powerful tools to assess your students’progress and plan instruction that delivers what they need. Thetools include:
§ Flexible reports that can be sorted and filtered by keydemographics
§ Instructional planning support using test subscoresin specific content areas, benchmarks, informationfor cross-subject tasks, and data for prescribinginterventions when students are behind or ahead
§ Question Analysis Report that helps educators connectsubscores to state standards, analyze students’strengths and weaknesses, learn which mistakeswere most common, and look for opportunities toreinforce skills
§ Access to the AP Potential™ tool to pinpoint studentswho are likely to succeed in more challenging courses
2
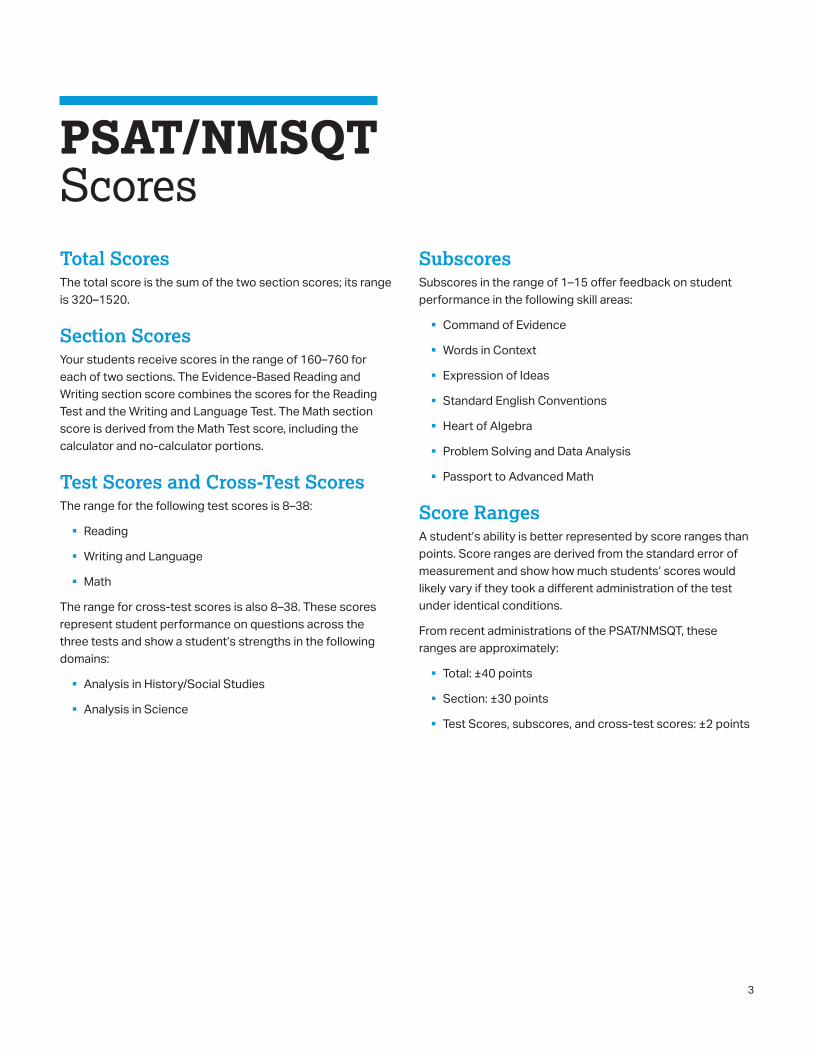
PSAT/NMSQT Scores Total Scores The total score is the sum of the two section scores; its range is 320–1520.
Section Scores Your students receive scores in the range of 160–760 for each of two sections. The Evidence-Based Reading and Writing section score combines the scores for the Reading Test and the Writing and Language Test. The Math section score is derived from the Math Test score, including the calculator and no-calculator portions.
Test Scores and Cross-Test Scores The range for the following test scores is 8–38:
§ Reading
§ Writing and Language
§ Math
The range for cross-test scores is also 8–38. These scores represent student performance on questions across the three tests and show a student’s strengths in the following domains:
§ Analysis in History/Social Studies
§ Analysis in Science
Subscores Subscores in the range of 1–15 offer feedback on student performance in the following skill areas:
§ Command of Evidence
§ Words in Context
§ Expression of Ideas
§ Standard English Conventions
§ Heart of Algebra
§ Problem Solving and Data Analysis
§ Passport to Advanced Math
Score Ranges A student’s ability is better represented by score ranges than points. Score ranges are derived from the standard error of measurement and show how much students’ scores would likely vary if they took a different administration of the test under identical conditions.
From recent administrations of the PSAT/NMSQT, these ranges are approximately:
§ Total: ±40 points
§ Section: ±30 points
§ Test Scores, subscores, and cross-test scores: ±2 points
3
Score Scales and Score Changes How can PSAT/NMSQT scores be used to project SAT scores? The SAT Suite—from PSAT 8/9 through the SAT—uses a common score scale for the total, section, test, and cross-test scores. The ranges reported for each assessment reflect grade-level appropriateness within the common scale. Thus, while the total range for SAT is 400–1600, the total range for PSAT/NMSQT is 320–1520.
This common score scale means that a student who took the PSAT/NMSQT and received a Math section score of 500 would be expected to also get a 500 on the SAT or PSAT 8/9 if they had taken either of those tests on that same day; a score of 500 represents the same level of academic achievement on all three assessments.
This also means that student growth is easy to see across the SAT Suite. If a student takes the PSAT/NMSQT this year and receives a 500 Math section score, and then takes the SAT next year and earns a 550 Math section score, that student has shown a growth of 50 points, which likely resulted from hard work both in and out of school.
The total, section, test, and cross-test scores have been vertically scaled to allow the accurate measurement of growth from test to test. Encourage students to focus on the section scores if they are curious about the growth they can expect to see in their scores over the next year. They should look at the set of projected score ranges we have provided (only in online score reports) for students that reflect typical growth. Of course, a student’s individual growth will be shaped by the courses taken and the practice the student undertakes between assessments.
Subscores are not on a vertical scale, and therefore comparing performance year after year should be based on relative performance rather than by calculating student growth across tests.
Students who wish to improve their performance on the SATshould follow these guidelines:
§ Develop academic skills through challengingcoursework.
§ Read extensively and develop strong writing skills.
§ Engage in deliberate practice in the three math areasthat are emphasized the most in the assessments.
§ Take practice tests and upload their results toKhan Academy for personalized practice of theskills they need to improve. To learn more, go topsat.org/practice.
4
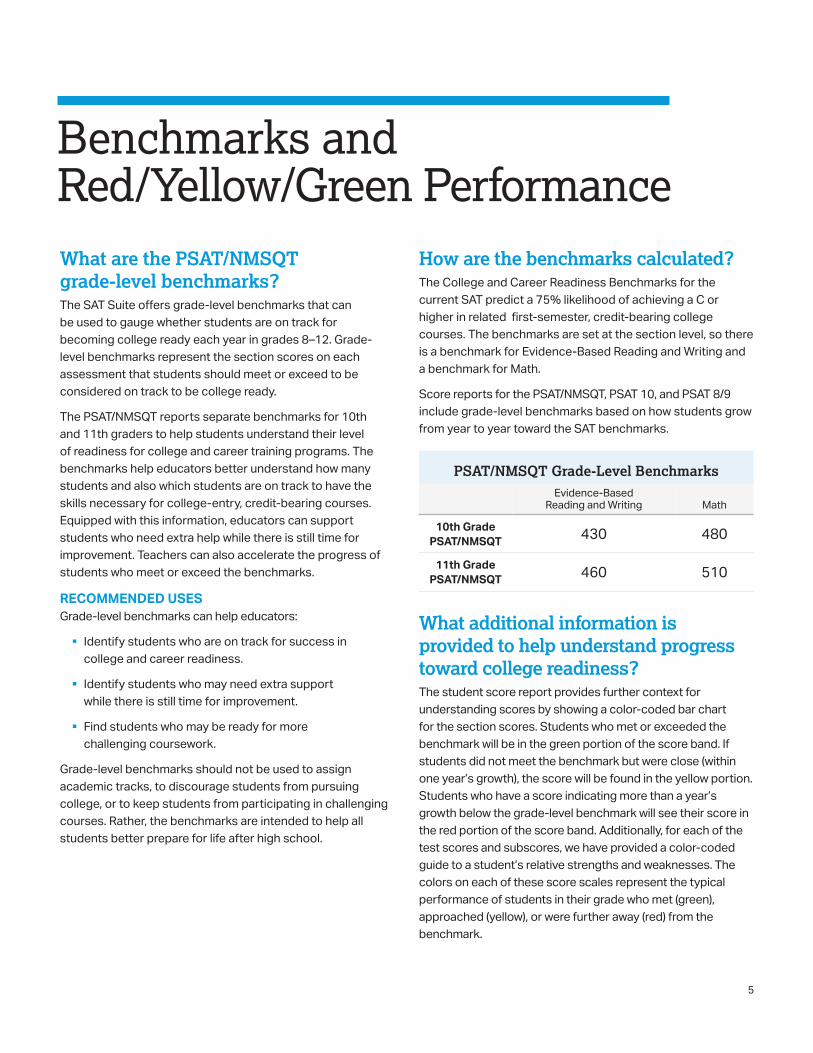
Benchmarks and Red/Yellow/Green Performance What are the PSAT/NMSQT grade-level benchmarks? The SAT Suite offers grade-level benchmarks that can be used to gauge whether students are on track for becoming college ready each year in grades 8–12. Grade-level benchmarks represent the section scores on each assessment that students should meet or exceed to be considered on track to be college ready.
The PSAT/NMSQT reports separate benchmarks for 10th and 11th graders to help students understand their level of readiness for college and career training programs. The benchmarks help educators better understand how many students and also which students are on track to have the skills necessary for college-entry, credit-bearing courses. Equipped with this information, educators can support students who need extra help while there is still time for improvement. Teachers can also accelerate the progress of students who meet or exceed the benchmarks.
RECOMMENDED USES Grade-level benchmarks can help educators:
§ Identify students who are on track for success incollege and career readiness.
§ Identify students who may need extra supportwhile there is still time for improvement.
§ Find students who may be ready for morechallenging coursework.
Grade-level benchmarks should not be used to assign academic tracks, to discourage students from pursuing college, or to keep students from participating in challenging courses. Rather, the benchmarks are intended to help all students better prepare for life after high school.
How are the benchmarks calculated? The College and Career Readiness Benchmarks for the current SAT predict a 75% likelihood of achieving a C or higher in related first-semester, credit-bearing college courses. The benchmarks are set at the section level, so there is a benchmark for Evidence-Based Reading and Writing and a benchmark for Math.
Score reports for the PSAT/NMSQT, PSAT 10, and PSAT 8/9include grade-level benchmarks based on how students grow from year to year toward the SAT benchmarks.
PSAT/NMSQT Grade-Level Benchmarks Evidence-Based
Reading and Writing Math
10th Grade 430 480PSAT/NMSQT
11th Grade 460 510PSAT/NMSQT
What additional information is provided to help understand progress toward college readiness? The student score report provides further context forunderstanding scores by showing a color-coded bar chartfor the section scores. Students who met or exceeded the benchmark will be in the green portion of the score band. Ifstudents did not meet the benchmark but were close (withinone year’s growth), the score will be found in the yellow portion.Students who have a score indicating more than a year’sgrowth below the grade-level benchmark will see their score inthe red portion of the score band. Additionally, for each of thetest scores and subscores, we have provided a color-codedguide to a student’s relative strengths and weaknesses. Thecolors on each of these score scales represent the typicalperformance of students in their grade who met (green),approached (yellow), or were further away (red) from thebenchmark.
5
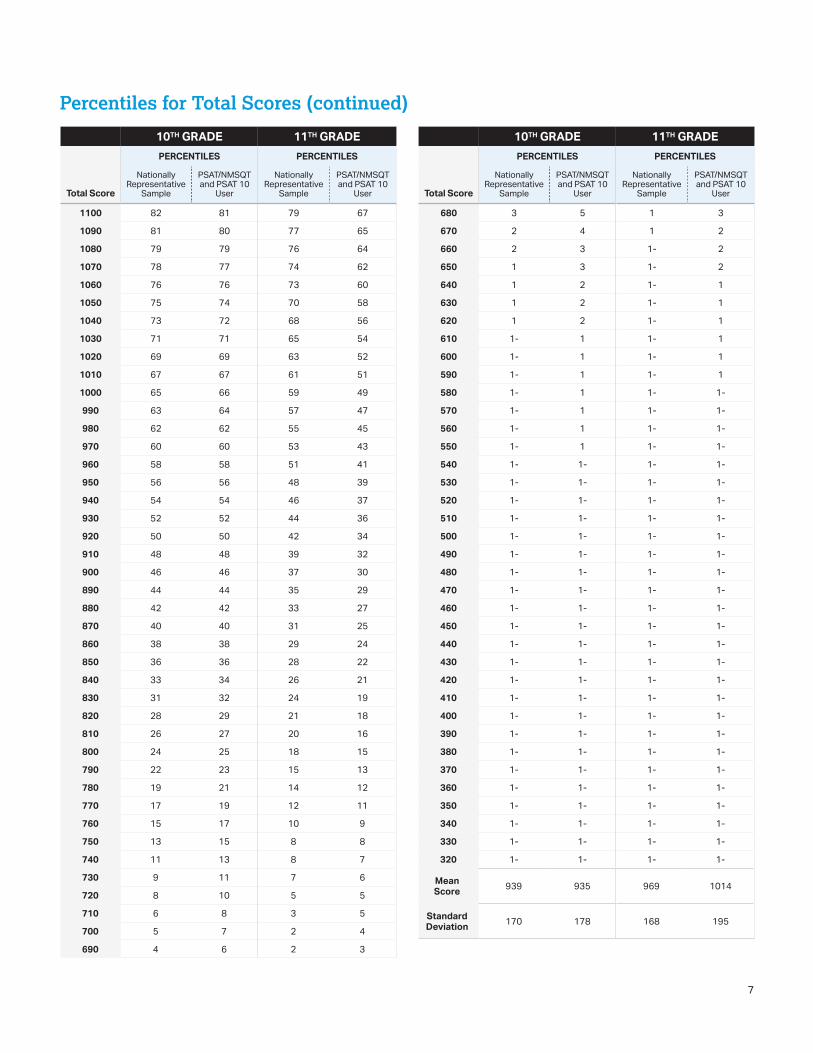
Percentiles for Total Scores
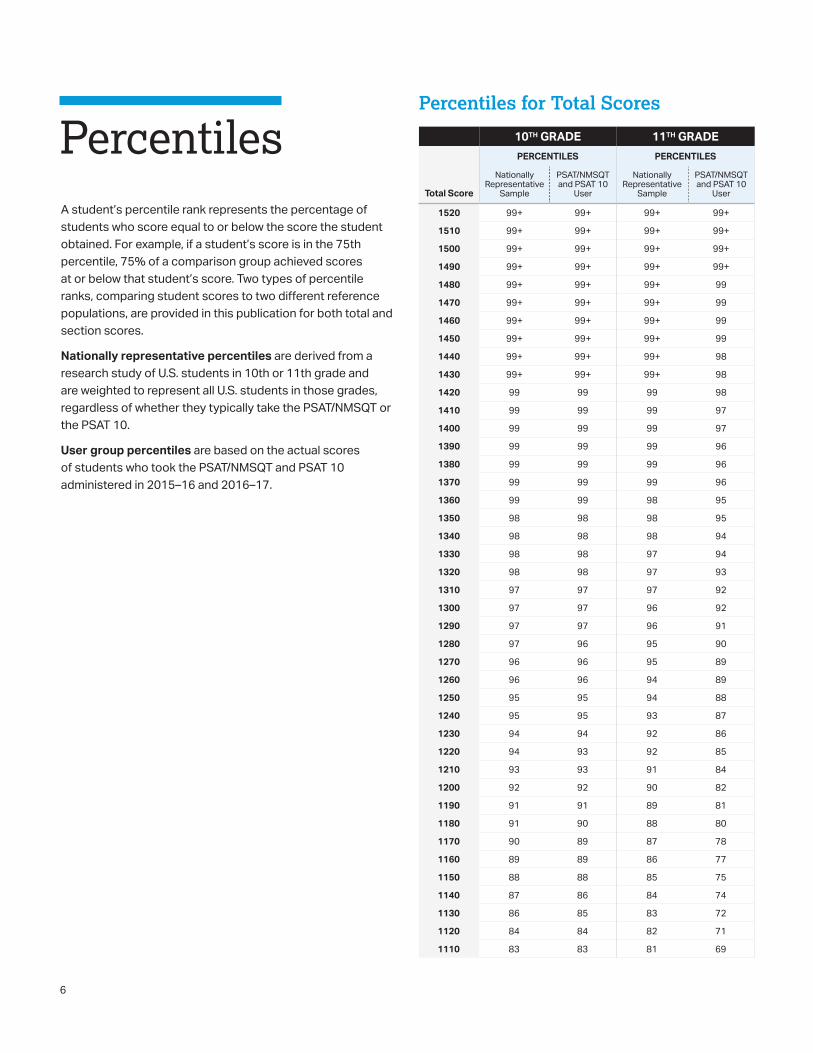
Percentiles A student’s percentile rank represents the percentage of students who score equal to or below the score the student obtained. For example, if a student’s score is in the 75th percentile, 75% of a comparison group achieved scores at or below that student’s score. Two types of percentile ranks, comparing student scores to two different reference populations, are provided in this publication for both total and section scores.
Nationally representative percentiles are derived from a research study of U.S. students in 10th or 11th grade and are weighted to represent all U.S. students in those grades, regardless of whether they typically take the PSAT/NMSQT or the PSAT 10.
User group percentiles are based on the actual scores of students who took the PSAT/NMSQT and PSAT 10 administered in 2015–16 and 2016–17.
10TH GRADE 11TH GRADE PERCENTILES PERCENTILES
Total Score
NationallyRepresentative
Sample
PSAT/NMSQT and PSAT 10
User
NationallyRepresentative
Sample
PSAT/NMSQT and PSAT 10
User
1520 99+ 99+ 99+ 99+
1510 99+ 99+ 99+ 99+
1500 99+ 99+ 99+ 99+
1490 99+ 99+ 99+ 99+
1480 99+ 99+ 99+ 99
1470 99+ 99+ 99+ 99
1460 99+ 99+ 99+ 99
1450 99+ 99+ 99+ 99
1440 99+ 99+ 99+ 98
1430 99+ 99+ 99+ 98
1420 99 99 99 98
1410 99 99 99 97
1400 99 99 99 97
1390 99 99 99 96
1380 99 99 99 96
1370 99 99 99 96
1360 99 99 98 95
1350 98 98 98 95
1340 98 98 98 94
1330 98 98 97 94
1320 98 98 97 93
1310 97 97 97 92
1300 97 97 96 92
1290 97 97 96 91
1280 97 96 95 90
1270 96 96 95 89
1260 96 96 94 89
1250 95 95 94 88
1240 95 95 93 87
1230 94 94 92 86
1220 94 93 92 85
1210 93 93 91 84
1200 92 92 90 82
1190 91 91 89 81
1180 91 90 88 80
1170 90 89 87 78
1160 89 89 86 77
1150 88 88 85 75
1140 87 86 84 74
1130 86 85 83 72
1120 84 84 82 71
1110 83 83 81 69
6
Percentiles for Total Scores
Percentiles for Total Scores (continued)
10TH GRADE 11TH GRADE PERCENTILES PERCENTILES
Total Score
NationallyRepresentative
Sample
PSAT/NMSQT and PSAT 10
User
NationallyRepresentative
Sample
PSAT/NMSQT and PSAT 10
User
1100 82 81 79 67
1090 81 80 77 65
1080 79 79 76 64
1070 78 77 74 62
1060 76 76 73 60
1050 75 74 70 58
1040 73 72 68 56
1030 71 71 65 54
1020 69 69 63 52
1010 67 67 61 51
1000 65 66 59 49
990 63 64 57 47
980 62 62 55 45
970 60 60 53 43
960 58 58 51 41
950 56 56 48 39
940 54 54 46 37
930 52 52 44 36
920 50 50 42 34
910 48 48 39 32
900 46 46 37 30
890 44 44 35 29
880 42 42 33 27
870 40 40 31 25
860 38 38 29 24
850 36 36 28 22
840 33 34 26 21
830 31 32 24 19
820 28 29 21 18
810 26 27 20 16
800 24 25 18 15
790 22 23 15 13
780 19 21 14 12
770 17 19 12 11
760 15 17 10 9
750 13 15 8 8
740 11 13 8 7
730 9 11 7 6
720 8 10 5 5
710 6 8 3 5
700 5 7 2 4
690 4 6 2 3
10TH GRADE 11TH GRADE PERCENTILES PERCENTILES
Total Score
NationallyRepresentative
Sample
PSAT/NMSQT and PSAT 10
User
NationallyRepresentative
Sample
PSAT/NMSQT and PSAT 10
User
680 3 5 1 3
670 2 4 1 2
660 2 3 1 2
650 1 3 1 2
640 1 2 1 1
630 1 2 1 1
620 1 2 1 1
610 1 1 1 1
600 1 1 1 1
590 1 1 1 1
580 1 1 1 1
570 1 1 1 1
560 1 1 1 1
550 1 1 1 1
540 1 1 1 1
530 1 1 1 1
520 1 1 1 1
510 1 1 1 1
500 1 1 1 1
490 1 1 1 1
480 1 1 1 1
470 1 1 1 1
460 1 1 1 1
450 1 1 1 1
440 1 1 1 1
430 1 1 1 1
420 1 1 1 1
410 1 1 1 1
400 1 1 1 1
390 1 1 1 1
380 1 1 1 1
370 1 1 1 1
360 1 1 1 1
350 1 1 1 1
340 1 1 1 1
330 1 1 1 1
320 1 1 1 1
Mean Score 939 935 969 1014
Standard Deviation 170 178 168 195
7
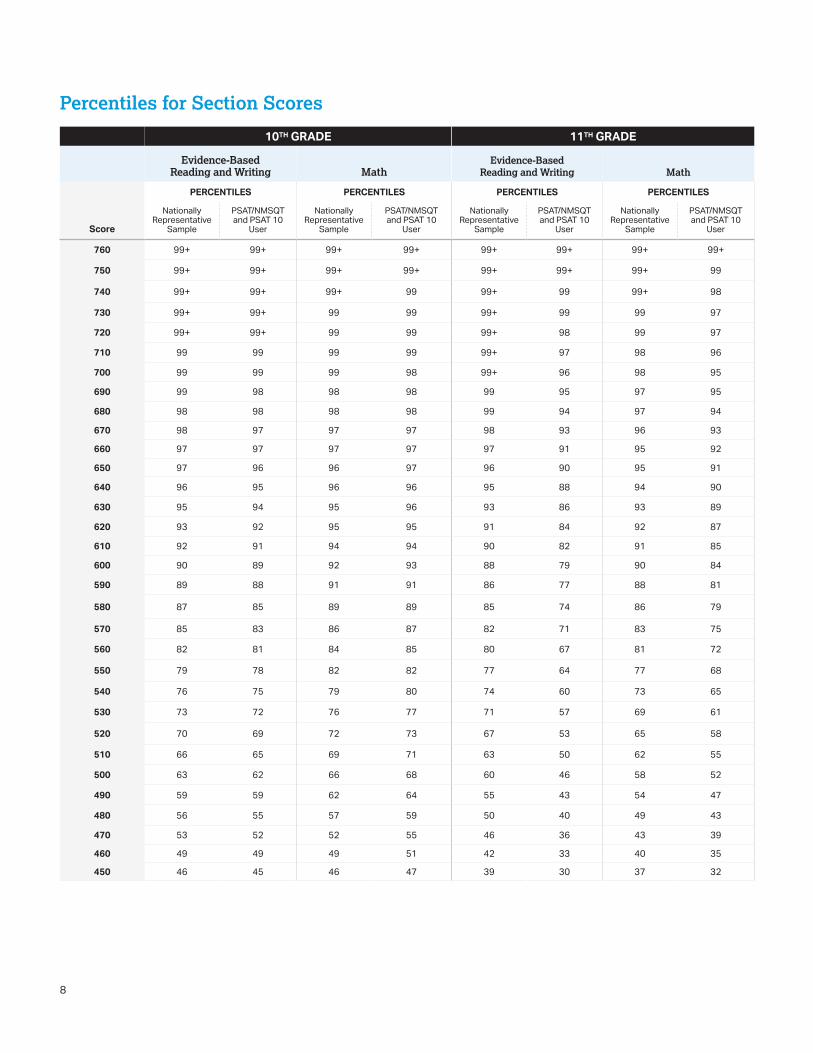
Percentiles for Section Scores
10TH GRADE 11TH GRADE
Evidence-Based Reading and Writing Math
Evidence-Based Reading and Writing Math
PERCENTILES PERCENTILES PERCENTILES PERCENTILES
Score
NationallyRepresentative
Sample
PSAT/NMSQT and PSAT 10
User
NationallyRepresentative
Sample
PSAT/NMSQT and PSAT 10
User
NationallyRepresentative
Sample
PSAT/NMSQT and PSAT 10
User
NationallyRepresentative
Sample
PSAT/NMSQT and PSAT 10
User
760 99+ 99+ 99+ 99+ 99+ 99+ 99+ 99+
750 99+ 99+ 99+ 99+ 99+ 99+ 99+ 99
740 99+ 99+ 99+ 99 99+ 99 99+ 98
730 99+ 99+ 99 99 99+ 99 99 97
720 99+ 99+ 99 99 99+ 98 99 97
710 99 99 99 99 99+ 97 98 96
700 99 99 99 98 99+ 96 98 95
690 99 98 98 98 99 95 97 95
680 98 98 98 98 99 94 97 94
670 98 97 97 97 98 93 96 93
660 97 97 97 97 97 91 95 92
650 97 96 96 97 96 90 95 91
640 96 95 96 96 95 88 94 90
630 95 94 95 96 93 86 93 89
620 93 92 95 95 91 84 92 87
610 92 91 94 94 90 82 91 85
600 90 89 92 93 88 79 90 84
590 89 88 91 91 86 77 88 81
580 87 85 89 89 85 74 86 79
570 85 83 86 87 82 71 83 75
560 82 81 84 85 80 67 81 72
550 79 78 82 82 77 64 77 68
540 76 75 79 80 74 60 73 65
530 73 72 76 77 71 57 69 61
520 70 69 72 73 67 53 65 58
510 66 65 69 71 63 50 62 55
500 63 62 66 68 60 46 58 52
490 59 59 62 64 55 43 54 47
480 56 55 57 59 50 40 49 43
470 53 52 52 55 46 36 43 39
460 49 49 49 51 42 33 40 35
450 46 45 46 47 39 30 37 32
8
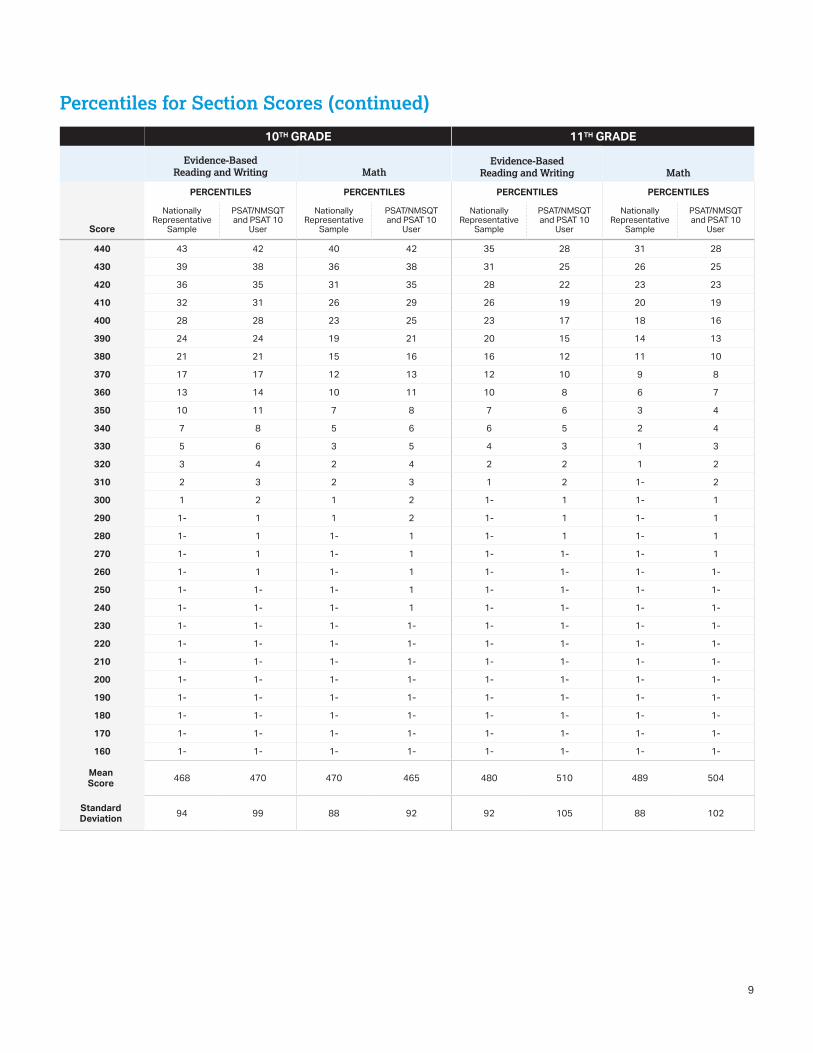
Percentiles for Section Scores (continued)
10TH GRADE 11TH GRADE
Evidence-Based Reading and Writing Math
Evidence-Based Reading and Writing Math
PERCENTILES PERCENTILES PERCENTILES PERCENTILES
Score
NationallyRepresentative
Sample
PSAT/NMSQT and PSAT 10
User
NationallyRepresentative
Sample
PSAT/NMSQT and PSAT 10
User
NationallyRepresentative
Sample
PSAT/NMSQT and PSAT 10
User
NationallyRepresentative
Sample
PSAT/NMSQT and PSAT 10
User
440 43 42 40 42 35 28 31 28
430 39 38 36 38 31 25 26 25
420 36 35 31 35 28 22 23 23
410 32 31 26 29 26 19 20 19
400 28 28 23 25 23 17 18 16
390 24 24 19 21 20 15 14 13
380 21 21 15 16 16 12 11 10
370 17 17 12 13 12 10 9 8
360 13 14 10 11 10 8 6 7
350 10 11 7 8 7 6 3 4
340 7 8 5 6 6 5 2 4
330 5 6 3 5 4 3 1 3
320 3 4 2 4 2 2 1 2
310 2 3 2 3 1 2 1 2
300 1 2 1 2 1 1 1 1
290 1 1 1 2 1 1 1 1
280 1 1 1 1 1 1 1 1
270 1 1 1 1 1 1 1 1
260 1 1 1 1 1 1 1 1
250 1 1 1 1 1 1 1 1
240 1 1 1 1 1 1 1 1
230 1 1 1 1 1 1 1 1
220 1 1 1 1 1 1 1 1
210 1 1 1 1 1 1 1 1
200 1 1 1 1 1 1 1 1
190 1 1 1 1 1 1 1 1
180 1 1 1 1 1 1 1 1
170 1 1 1 1 1 1 1 1
160 1 1 1 1 1 1 1 1
Mean Score 468 470 470 465 480 510 489 504
Standard Deviation 94 99 88 92 92 105 88 102
9

NMSC Selection Index The National Merit® Scholarship Program is an annual academic competition among high school students for recognition and college scholarships. The program is conducted by National Merit Scholarship Corporation (NMSC), a not-for-profit organization that operates without government assistance.
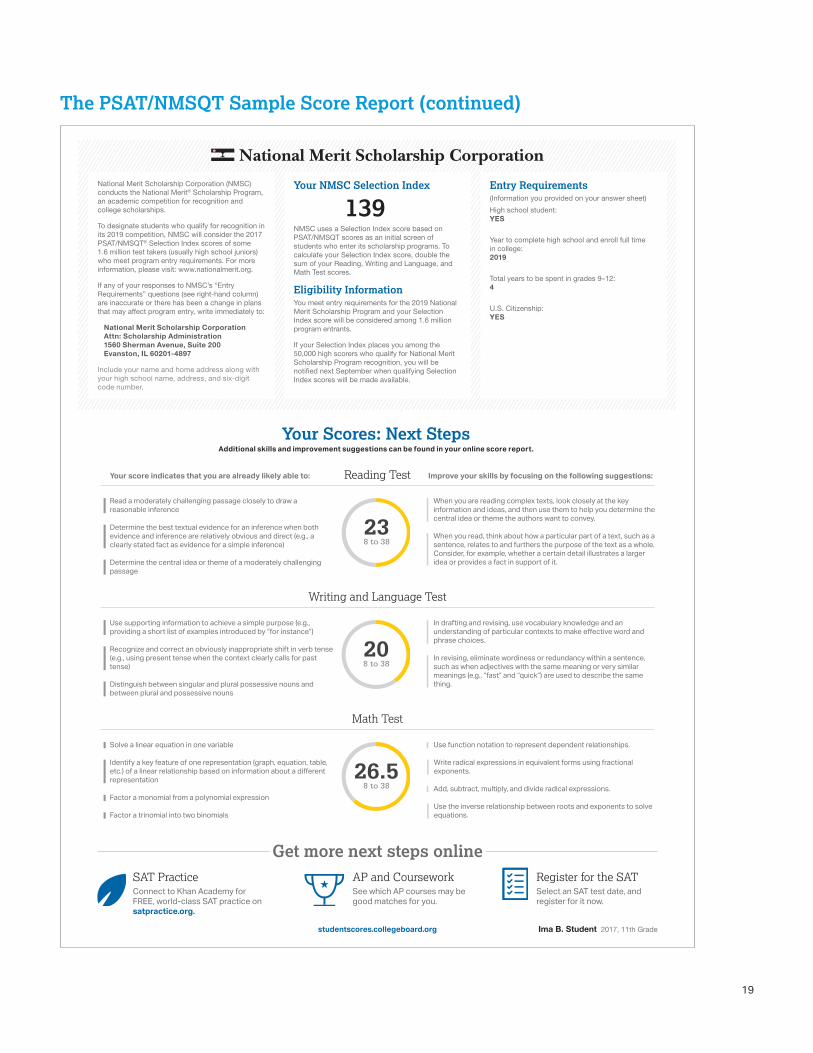
What is the NMSC Selection Index? Reported on a scale ranging from 48 to 228, the Selection Index score is calculated by doubling the sum of the Reading, Writing and Language, and Math Test scores. For example, a Reading score of 23, a Writing and Language score of 20, and a Math score of 26.5 would result in a Selection Index score of 139 [2(23+20+26.5)].
How NMSC uses the Selection Index NMSC uses the Selection Index score to designate groups of students to receive recognition in the National Merit Scholarship Program. Entry to NMSC’s competition for scholarships to be offered in 2019 is determined by students’ responses to program entry questions on the 2017 PSAT/NMSQT answer sheet. Both the printed PSAT/NMSQT student score report and the online report show the student’s Selection Index, the student’s responses to four entry items, and whether the student meets participation requirements. Currently, about 1.6 million test takers meet requirements to enter NMSC’s competition each year. Almost all entrants are in their third year (grade 11, junior year) of high school.
Of the 1.6 million NMSC program entrants, about 50,000 will earn 2017 PSAT/NMSQT scores high enough to qualify them for recognition. These students will be notified of their standing through their high schools in September 2018. Students who qualify to continue in the competition for scholarships to be offered in 2019 must then meet academic and other requirements specified by NMSC to be considered for awards.
A detailed description of the National Merit Scholarship Program is published in the Guide to the National Merit Scholarship Program, mailed to high school principals each fall. For students and parents, information about the competition is given in the PSAT/NMSQT Student Guide and at www.nationalmerit.org.
For inquiries about any aspect of the National Merit Program—including entry requirements, the selection process, and awards to be offered—contact NMSC directly:
www.nationalmerit.org
(847) 866-5100National Merit Scholarship Corporation1560 Sherman Avenue, Suite 200Evanston, IL 60201-4897
10
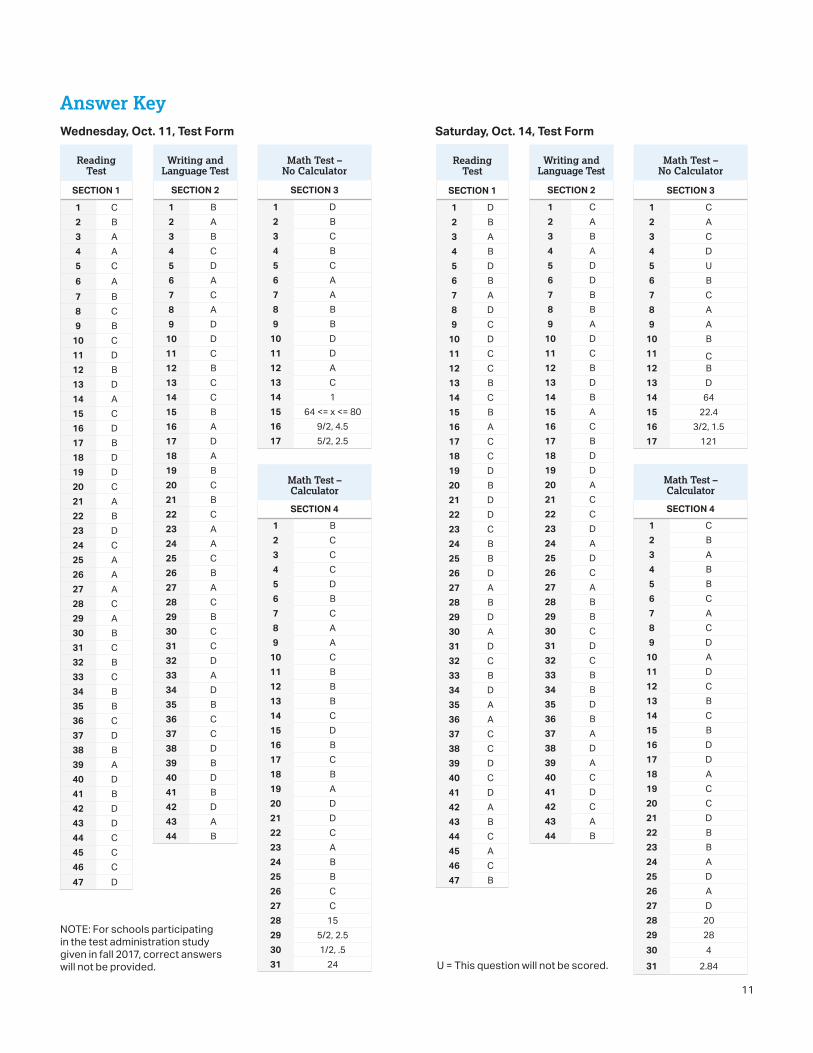
Answer Key Wednesday, Oct. 11, Test Form
Reading Test
SECTION 1
1 C 2 B 3 A 4 A 5 C 6 A 7 B 8 C 9 B
10 C 11 D 12 B 13 D 14 A 15 C 16 D 17 B 18 D 19 D 20 C 21 A 22 B 23 D 24 C 25 A 26 A 27 A 28 C 29 A 30 B 31 C 32 B 33 C 34 B 35 B 36 C 37 D 38 B 39 A 40 D 41 B 42 D 43 D 44 C 45 C 46 C 47 D
SECTION 2
1 B 2 A 3 B 4 C 5 D 6 A 7 C 8 A 9 D
10 D 11 C 12 B 13 C 14 C 15 B 16 A 17 D 18 A 19 B 20 C 21 B 22 C 23 A 24 A 25 C 26 B 27 A 28 C 29 B 30 C 31 C 32 D 33 A 34 D 35 B 36 C 37 C 38 D 39 B 40 D 41 B 42 D 43 A 44 B
Writing and Language Test
NOTE: For schools participating in the test administration study given in fall 2017, correct answerswill not be provided.
Math Test – No Calculator
Math Test – Calculator
SECTION 3
1 D 2 B 3 C 4 B 5 C 6 A 7 A 8 B 9 B
10 D 11 D 12 A 13 C 14 1 15 64 <= x <= 80 16 17
9/2, 4.55/2, 2.5
SECTION 4 1 B 2 C 3 C 4 C 5 D 6 B 7 C 8 A 9 A
10 C 11 B 12 B 13 B 14 C 15 D 16 B 17 C 18 B 19 A 20 D 21 D 22 C 23 A 24 B 25 B 26 C 27 C 28 15 29 30 31
5/2, 2.51/2, .5
24
Saturday, Oct. 14, Test Form
Reading Test
SECTION 1
1 D 2 B 3 A 4 B 5 D 6 B 7 A 8 D 9 C
10 D 11 C 12 C 13 B 14 C 15 B 16 A 17 C 18 C 19 D 20 B 21 D 22 D 23 C 24 B 25 B 26 D 27 A 28 B 29 D 30 A 31 D 32 C 33 B 34 D 35 A 36 A 37 C 38 C 39 D 40 C 41 D 42 A 43 B 44 C 45 A 46 C 47 B
Writing and Language Test
SECTION 2
1 C 2 A 3 B 4 A 5 D 6 D 7 B 8 B 9 A
10 D 11 C 12 B 13 D 14 B 15 A 16 C 17 B 18 D 19 D 20 A 21 C 22 C 23 D 24 A 25 D 26 C 27 A 28 B 29 B 30 C 31 D 32 C 33 B 34 B 35 D 36 B 37 A 38 D 39 A 40 C 41 D 42 C 43 A 44 B
U = This question will not be scored.
Math Test – No Calculator
Math Test – Calculator
SECTION 3
1 C 2 A 3 C 4 D 5 U 6 B 7 C 8 A 9 A
10 B 11 C 12 B 13 D 14 64 15 22.4 16 17
3/2, 1.5121
SECTION 4 1 C 2 B 3 A 4 B 5 B 6 C 7 A 8 C 9 D
10 A 11 D 12 C 13 B 14 C 15 B 16 D 17 D 18 A 19 C 20 C 21 D 22 B 23 B 24 A 25 D 26 A 27 D 28 20 29 28 30 4 31 2.84
11
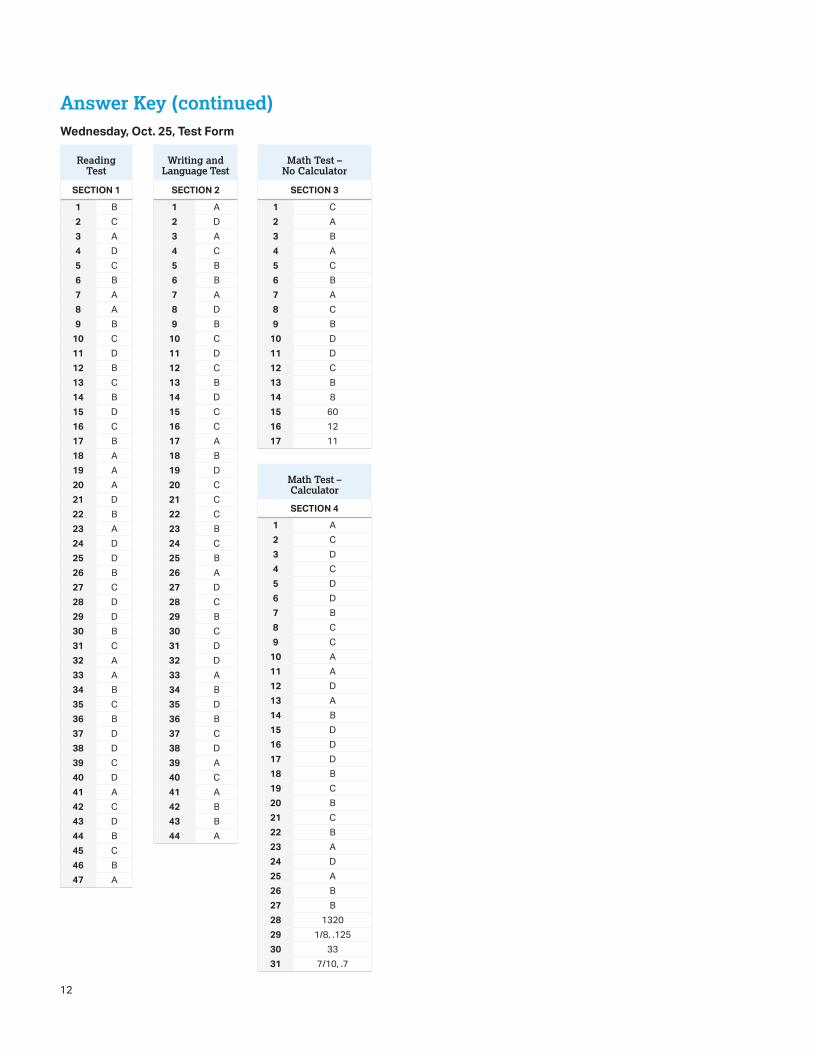
Answer Key (continued) Wednesday, Oct. 25, Test Form
Writing and Language Test
SECTION 2
1 A 2 D 3 A 4 C 5 B 6 B 7 A 8 D 9 B
10 C 11 D 12 C 13 B 14 D 15 C 16 C 17 A 18 B 19 D 20 C 21 C 22 C 23 B 24 C 25 B 26 A 27 D 28 C 29 B 30 C 31 D 32 D 33 A 34 B 35 D 36 B 37 C 38 D 39 A 40 C 41 A 42 B 43 B 44 A
Reading Test
SECTION 1
1 B 2 C 3 A 4 D 5 C 6 B 7 A 8 A 9 B
10 C 11 D 12 B 13 C 14 B 15 D 16 C 17 B 18 A 19 A 20 A 21 D 22 B 23 A 24 D 25 D 26 B 27 C 28 D 29 D 30 B 31 C 32 A 33 A 34 B 35 C 36 B 37 D 38 D 39 C 40 D 41 A 42 C 43 D 44 B 45 C 46 B 47 A
Math Test – No Calculator
SECTION 3
1 C 2 A 3 B 4 A 5 C 6 B 7 A 8 C 9 B
10 D 11 D 12 C 13 B 14 8 15 60 16 12 17 11
Math Test – Calculator
SECTION 4 1 A 2 C 3 D 4 C 5 D 6 D 7 B 8 C 9 C
10 A 11 A 12 D 13 A 14 B 15 D 16 D 17 D 18 B 19 C 20 B 21 C 22 B 23 A 24 D 25 A 26 B 27 B 28 1320 29 30
1/8, .12533
31 7/10, .7
12

Score Conversion Wednesday, Oct. 11, Test Form Score
Conversion Score conversions shows how raw scores are converted into test scores, cross-test scores, and subscores.
IMPORTANT TO NOTE § The section score for the Evidence-Based Reading and
Writing section is calculated by adding the Reading Test score to the Writing and Language Test score and multiplying that figure by 10.
§ The section score for the Math section is calculated by multiplying the Math Test score by 20.
§ There is no advantage or disadvantage in taking either the Wednesday, Oct. 11, Saturday, Oct. 14, or Wednesday, Oct. 25, test form.
13
Raw Score (# of correct
answers) Reading
Test Score
Writing and Language Test Score
Math Test Score
48 38 47 38 38 46 37 37.5 45 36 37.5 44 36 38 37 43 35 38 36.5 42 34 37 35.5 41 34 37 34.5 40 33 36 34 39 33 35 33 38 32 34 32 37 31 34 31.5 36 31 33 31 35 30 32 30.5 34 30 32 30 33 29 31 29.5 32 29 30 29 31 28 30 28.5 30 28 29 28 29 27 29 27.5 28 27 28 27 27 26 28 26.5 26 26 27 26 25 25 27 25.5 24 25 26 25 23 24 26 24.5 22 24 25 24 21 23 24 23.5 20 23 23 23 19 22 23 22.5 18 22 22 22 17 21 21 21.5 16 20 20 21 15 20 19 20.5 14 19 19 20 13 18 18 19.5 12 18 17 18.5 11 17 16 18 10 17 16 17.5 9 16 15 16.5 8 16 14 16 7 15 14 15 6 14 13 14 5 13 12 13 4 12 12 12 3 11 11 11 2 10 10 10 1 9 9 9 0 8 8 8
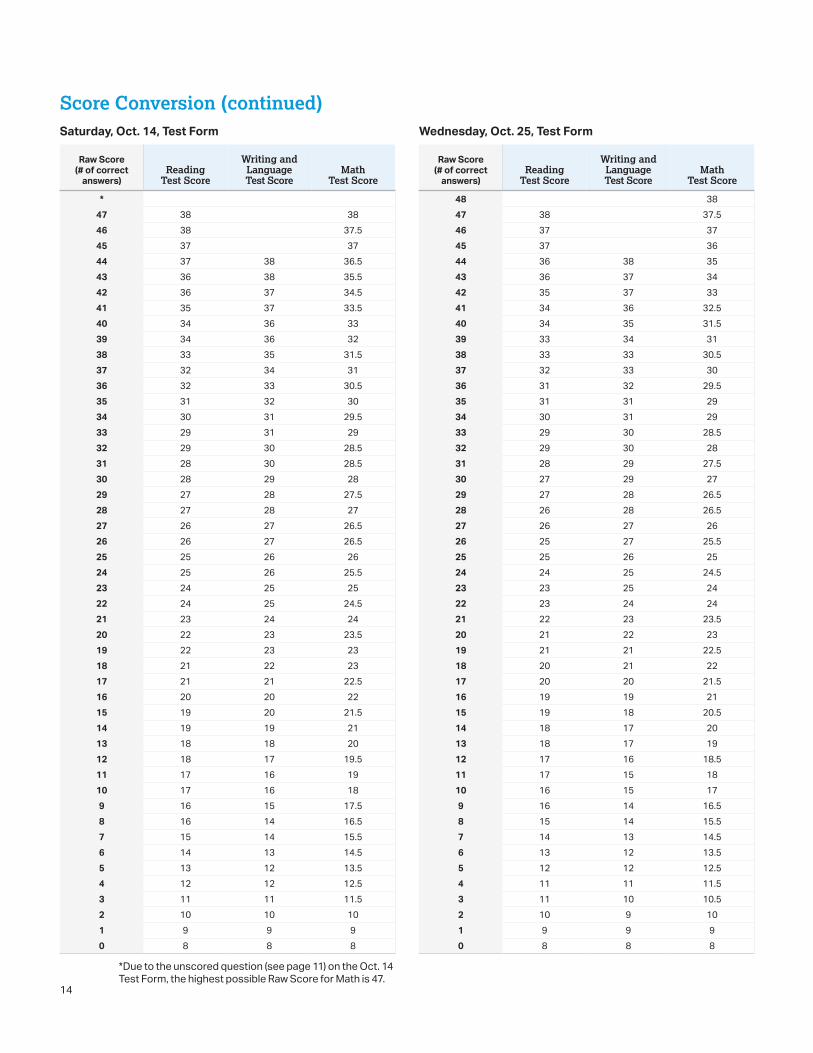
Score Conversion (continued) Saturday, Oct. 14, Test Form Wednesday, Oct. 25, Test Form
*Due to the unscored question (see page 11) on the Oct. 14Test Form, the highest possible Raw Score for Math is 47.
Raw Score (# of correct
answers) Reading
Test Score
Writing and Language Test Score
Math Test Score
* 47 38 38 46 38 37.5 45 37 37 44 37 38 36.5 43 36 38 35.5 42 36 37 34.5 41 35 37 33.5 40 34 36 33 39 34 36 32 38 33 35 31.5 37 32 34 31 36 32 33 30.5 35 31 32 30 34 30 31 29.5 33 29 31 29 32 29 30 28.5 31 28 30 28.5 30 28 29 28 29 27 28 27.5 28 27 28 27 27 26 27 26.5 26 26 27 26.5 25 25 26 26 24 25 26 25.5 23 24 25 25 22 24 25 24.5 21 23 24 24 20 22 23 23.5 19 22 23 23 18 21 22 23 17 21 21 22.5 16 20 20 22 15 19 20 21.5 14 19 19 21 13 18 18 20 12 18 17 19.5 11 17 16 19 10 17 16 18 9 16 15 17.5 8 16 14 16.5 7 15 14 15.5 6 14 13 14.5 5 13 12 13.5 4 12 12 12.5 3 11 11 11.5 2 10 10 10 1 9 9 9 0 8 8 8
Raw Score (# of correct
answers) Reading
Test Score
Writing and Language Test Score
Math Test Score
48 38 47 38 37.5 46 37 37 45 37 36 44 36 38 35 43 36 37 34 42 35 37 33 41 34 36 32.5 40 34 35 31.5 39 33 34 31 38 33 33 30.5 37 32 33 30 36 31 32 29.5 35 31 31 29 34 30 31 29 33 29 30 28.5 32 29 30 28 31 28 29 27.5 30 27 29 27 29 27 28 26.5 28 26 28 26.5 27 26 27 26 26 25 27 25.5 25 25 26 25 24 24 25 24.5 23 23 25 24 22 23 24 24 21 22 23 23.5 20 21 22 23 19 21 21 22.5 18 20 21 22 17 20 20 21.5 16 19 19 21 15 19 18 20.5 14 18 17 20 13 18 17 19 12 17 16 18.5 11 17 15 18 10 16 15 17 9 16 14 16.5 8 15 14 15.5 7 14 13 14.5 6 13 12 13.5 5 12 12 12.5 4 11 11 11.5 3 11 10 10.5 2 10 9 10 1 9 9 9 0 8 8 8
14
15
| 320 to1520
Need to strengthen skills Approaching benchmark Meet or exceed benchmark
Subscores 1 to 15 range*
1 8 15
Test Scores
8 to 38 range
8 to 38 range*
Cross-Test Scores
38238
Your Math ScoreYour Evidence-Based
Reading and Writing ScoreYour Total Score
Your NationallyRepresentative
SamplePercentile
Your NationallyRepresentative
SamplePercentile
Your NationallyRepresentative
SamplePercentile
| 160 to760| 160 to
760
Keep in mind, the PSAT/NMSQT®
and SAT® are on the same scale.
Your score shows how you would have scored that day on the SAT. How well
you do depends on what you do next!
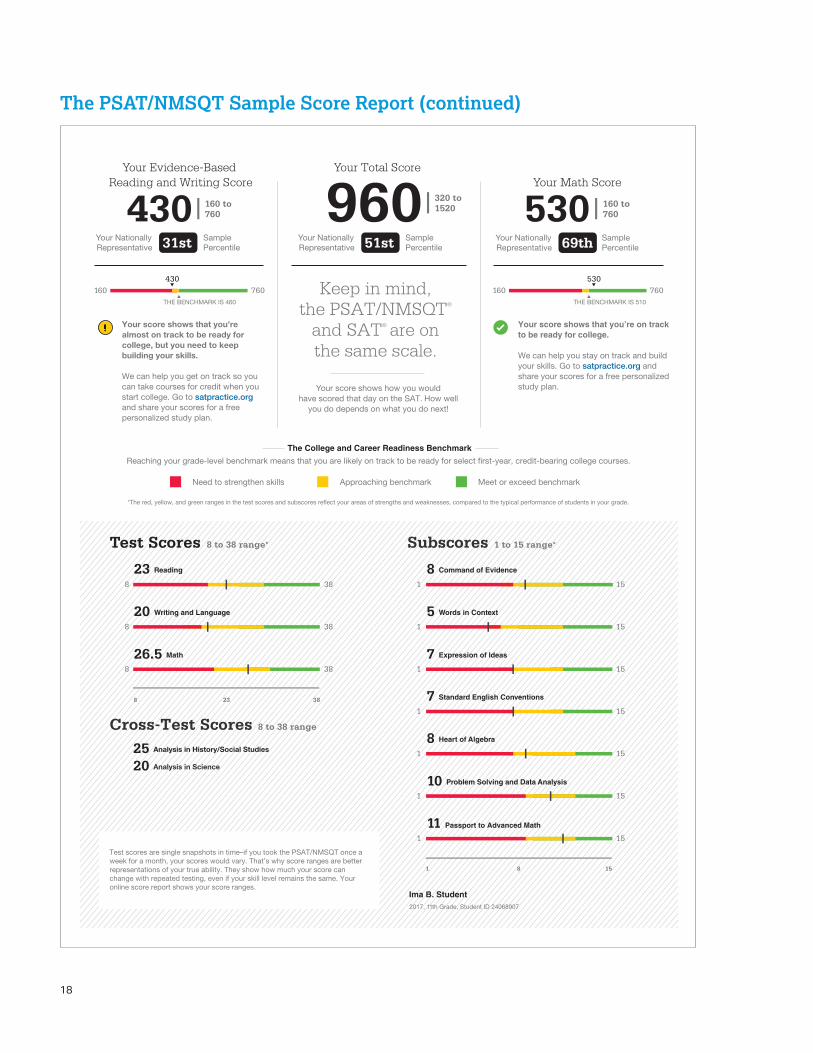
Test scores are single snapshots in time–if you took the PSAT/NMSQT once a week for a month, your scores would vary. That’s why score ranges are better representations of your true ability. They show how much your score can change with repeated testing, even if your skill level remains the same. Your online score report shows your score ranges.
151
151
151
388
388
388
151
151
151
151
530 69th
96051st31st
Your score shows that you’re almost on track to be ready for college, but you need to keep building your skills.
We can help you get on track so you can take courses for credit when you start college. Go to satpractice.org and share your scores for a free personalized study plan.
Your score shows that you’re on track to be ready for college.
We can help you stay on track and build your skills. Go to satpractice.org and share your scores for a free personalized study plan.
20 Writing and Language
26.5 Math
Ima B. Student2017, 11th Grade, Student ID 24068907
430
25 Analysis in History/Social Studies
20 Analysis in Science
8 Command of Evidence
5 Words in Context
7 Expression of Ideas
7 Standard English Conventions
8 Heart of Algebra
10 Problem Solving and Data Analysis
11 Passport to Advanced Math
23 Reading
160 760THE BENCHMARK IS 460
YOUR SCORE IS 430
160 760THE BENCHMARK IS 510
YOUR SCORE IS 530
National Merit Scholarship CorporationNational Merit Scholarship Corporation (NMSC) conducts the National Merit® Scholarship Program, an academic competition for recognition and college scholarships.
To designate students who qualify for recognition in its 2019 competition, NMSC will consider the 2017 PSAT/NMSQT® Selection Index scores of some 1.6 million test takers (usually high school juniors) who meet program entry requirements. For more information, please visit: www.nationalmerit.org.
If any of your responses to NMSC’s “Entry Requirements” questions (see right-hand column) are inaccurate or there has been a change in plans that may affect program entry, write immediately to:
National Merit Scholarship CorporationAttn: Scholarship Administration1560 Sherman Avenue, Suite 200Evanston, IL 60201-4897
Include your name and home address along withyour high school name, address, and six-digitcode number.
Your NMSC Selection Index
139NMSC uses a Selection Index score based on PSAT/NMSQT scores as an initial screen of students who enter its scholarship programs. To calculate your Selection Index score, double the sum of your Reading, Writing and Language, and Math Test scores.
Eligibility InformationYou meet entry requirements for the 2019 National Merit Scholarship Program and your Selection Index score will be considered among 1.6 million program entrants.
If your Selection Index places you among the 50,000 high scorers who qualify for National Merit Scholarship Program recognition, you will be notified next September when qualifying Selection Index scores will be made available.
Entry Requirements(Information you provided on your answer sheet)
High school student:YES
Year to complete high school and enroll full time in college:2019
Total years to be spent in grades 9–12:4
U.S. Citizenship:YES
Your Scores: Next StepsAdditional skills and improvement suggestions can be found in your online score report.
Get more next steps online
Your score indicates that you are already likely able to: Improve your skills by focusing on the following suggestions:Reading Test
Read a moderately challenging passage closely to draw a reasonable inference
When you are reading complex texts, look closely at the key information and ideas, and then use them to help you determine the central idea or theme the authors want to convey.
Determine the best textual evidence for an inference when both evidence and inference are relatively obvious and direct (e.g., a clearly stated fact as evidence for a simple inference)
When you read, think about how a particular part of a text, such as a sentence, relates to and furthers the purpose of the text as a whole. Consider, for example, whether a certain detail illustrates a larger idea or provides a fact in support of it.Determine the central idea or theme of a moderately challenging
passage
238 to 38
Writing and Language Test
Use supporting information to achieve a simple purpose (e.g., providing a short list of examples introduced by “for instance”)
In drafting and revising, use vocabulary knowledge and an understanding of particular contexts to make effective word and phrase choices.
Recognize and correct an obviously inappropriate shift in verb tense (e.g., using present tense when the context clearly calls for past tense)
In revising, eliminate wordiness or redundancy within a sentence, such as when adjectives with the same meaning or very similar meanings (e.g., “fast” and “quick”) are used to describe the same thing.Distinguish between singular and plural possessive nouns and
between plural and possessive nouns
208 to 38
Math Test
Solve a linear equation in one variable Use function notation to represent dependent relationships.
Identify a key feature of one representation (graph, equation, table, etc.) of a linear relationship based on information about a different representation
Write radical expressions in equivalent forms using fractional exponents.
Factor a monomial from a polynomial expression
Factor a trinomial into two binomials
Add, subtract, multiply, and divide radical expressions.
Use the inverse relationship between roots and exponents to solve equations.
26.58 to 38
SAT PracticeConnect to Khan Academy for FREE, world-class SAT practice on satpractice.org.
AP and CourseworkSee which AP courses may be good matches for you.
Register for the SATSelect an SAT test date, and register for it now.
studentscores.collegeboard.org Ima B. Student 2017, 11th Grade
00861-005-Fall-Winter-2017-Sample-Score-Report-PN-disclosed.indd 2-3 11/6/17 12:18 PM
The PSAT/NMSQT Score Report
Score Report
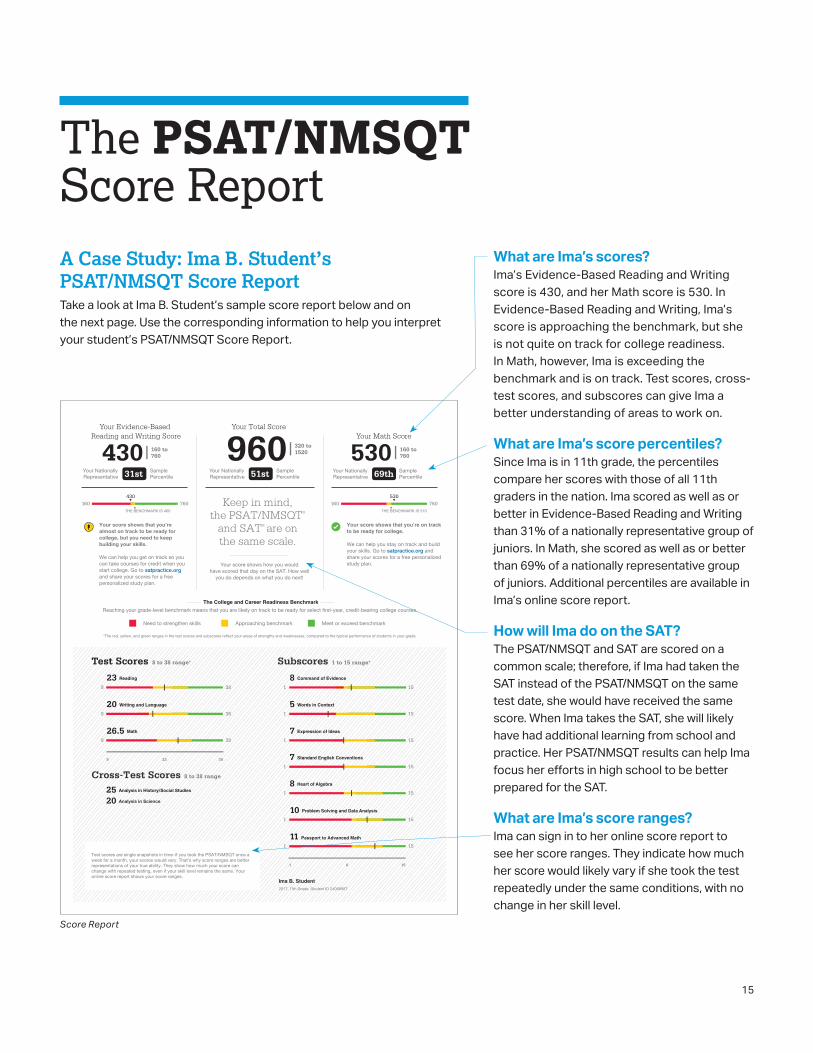
What are Ima’s scores?Ima’s Evidence-Based Reading and Writing score is 430, and her Math score is 530. In Evidence-Based Reading and Writing, Ima’s score is approaching the benchmark, but she is not quite on track for college readiness. In Math, however, Ima is exceeding the benchmark and is on track. Test scores, cross-test scores, and subscores can give Ima a better understanding of areas to work on.
What are Ima’s score percentiles?Since Ima is in 11th grade, the percentiles compare her scores with those of all 11th graders in the nation. Ima scored as well as or better in Evidence-Based Reading and Writing than 31% of a nationally representative group of juniors. In Math, she scored as well as or better than 69% of a nationally representative group of juniors. Additional percentiles are available in Ima’s online score report.
How will Ima do on the SAT?The PSAT/NMSQT and SAT are scored on a common scale; therefore, if Ima had taken the SAT instead of the PSAT/NMSQT on the same test date, she would have received the same score. When Ima takes the SAT, she will likely have had additional learning from school and practice. Her PSAT/NMSQT results can help Ima focus her efforts in high school to be better prepared for the SAT.
What are Ima’s score ranges?Ima can sign in to her online score report to see her score ranges. They indicate how much her score would likely vary if she took the test repeatedly under the same conditions, with no change in her skill level.
A Case Study: Ima B. Student’s PSAT/NMSQT Score Report Take a look at Ima B. Student’s sample score report below and on the next page. Use the corresponding information to help you interpret your student’s PSAT/NMSQT Score Report.
The College and Career Readiness Benchmark
Reaching your grade-level benchmark means that you are likely on track to be ready for select first-year, credit-bearing college courses.
*The red, yellow, and green ranges in the test scores and subscores reflect your areas of strengths and weaknesses, compared to the typical performance of students in your grade.
16
Math Test–CalculatorQ
uest
ion
#
Cor
rect
Your
Ans
wer
Diff
icul
ty
Subs
core
Cro
ss-T
est
Scor
e
Que
stio
n #
Cor
rect
Your
Ans
wer
Diff
icul
ty
Subs
core
Cro
ss-T
est
Scor
e
1 B ■ ■ ■ PSD HSS 15 C A ■ ■ ■
2 A ■ ■ ■ HOA 16 B ■ ■ ■ PSD HSS
3 B ■ ■ ■ PSD SCI 17 D ■ ■ ■ PSD
4 D ■ ■ ■ HOA 18 B A ■ ■ ■ PSD HSS
5 B C ■ ■ ■ PSD 19 C A ■ ■ ■ HOA
6 A ■ ■ ■ PSD 20 B ■ ■ ■ PAM
7 B ■ ■ ■ PSD 21 B C ■ ■ ■ HOA
8 C B ■ ■ ■ PSD 22 D C ■ ■ ■ PAM
9 A ■ ■ ■ PAM 23 D B ■ ■ ■ HOA SCI
10 D C ■ ■ ■ HOA 24 C Ø ■ ■ ■ PAM SCI
11 D ■ ■ ■ PSD HSS 25 B A ■ ■ ■ PSD SCI
12 A ■ ■ ■ PSD 26 D ■ ■ ■ PAM
13 B ■ ■ ■ PSD 27 D A ■ ■ ■ HOA
14 C ■ ■ ■ PSD SCI
Math Test–No Calculator
Que
stio
n #
Cor
rect
Your
Ans
wer
Diff
icul
ty
Subs
core
Cro
ss-T
est
Scor
e
Que
stio
n #
Cor
rect
Your
Ans
wer
Diff
icul
ty
Subs
core
Cro
ss-T
est
Scor
e
1 D ■ ■ ■ PAM 8 B C ■ ■ ■ HOA
2 A ■ ■ ■ PAM SCI 9 C ■ ■ ■ HOA
3 B ■ ■ ■ PAM 10 D ■ ■ ■ HOA HSS
4 C B ■ ■ ■ PAM 11 A C ■ ■ ■
5 C ■ ■ ■ HOA 12 C ■ ■ ■ PAM
6 B ■ ■ ■ HOA SCI 13 B A ■ ■ ■ PAM
7 A ■ ■ ■ HOA
Reading
Que
stio
n #
Cor
rect
Your
Ans
wer
Diff
icul
ty
Subs
core
Cro
ss-T
est
Scor
e
1 A ■ ■ ■
2 B A ■ ■ ■ COE
3 B ■ ■ ■
4 B A ■ ■ ■ WIC
5 C ■ ■ ■
6 D ■ ■ ■
7 B ■ ■ ■ COE
8 A ■ ■ ■ WIC
9 D ■ ■ ■ WIC
10 A ■ ■ ■ HSS
11 D C ■ ■ ■ WIC HSS
12 D B ■ ■ ■ WIC HSS
13 D A ■ ■ ■ COE HSS
14 A X ■ ■ ■ HSS
15 C B ■ ■ ■ COE HSS
16 B C ■ ■ ■ HSS
17 D C ■ ■ ■ HSS
18 B D ■ ■ ■ HSS
19 A ■ ■ ■ SCI
20 C ■ ■ ■ SCI
21 B D ■ ■ ■ COE SCI
22 D ■ ■ ■ SCI
23 B D ■ ■ ■ SCI
24 D ■ ■ ■ WIC SCI
25 C ■ ■ ■ WIC SCI
26 B A ■ ■ ■ SCI
27 B C ■ ■ ■ SCI
28 A C ■ ■ ■ COE SCI
29 D A ■ ■ ■ WIC HSS
30 B A ■ ■ ■ HSS
31 D ■ ■ ■ COE HSS
32 A ■ ■ ■ HSS
33 C ■ ■ ■ COE HSS
34 A B ■ ■ ■ WIC HSS
35 A B ■ ■ ■ HSS
36 C Ø ■ ■ ■ HSS
37 B C ■ ■ ■ HSS
38 C D ■ ■ ■ HSS
39 C ■ ■ ■ SCI
40 C ■ ■ ■ SCI
41 B ■ ■ ■ SCI
42 B ■ ■ ■ COE SCI
43 A B ■ ■ ■ SCI
44 A ■ ■ ■ WIC SCI
45 A C ■ ■ ■ SCI
46 D A ■ ■ ■ COE SCI
47 C B ■ ■ ■ SCI
Writing and Language
Que
stio
n #
Cor
rect
Your
Ans
wer
Diff
icul
ty
Subs
core
Cro
ss-T
est
Scor
e
1 D C ■ ■ ■ SEC
2 B ■ ■ ■ EOI HSS
3 C D ■ ■ ■ SEC
4 C A ■ ■ ■ SEC
5 B D ■ ■ ■ SEC
6 B X ■ ■ ■ COE, EOI HSS
7 A D ■ ■ ■ WIC, EOI HSS
8 B C ■ ■ ■ EOI HSS
9 A B ■ ■ ■ WIC, EOI HSS
10 D ■ ■ ■ SEC
11 D ■ ■ ■ COE, EOI HSS
12 B ■ ■ ■ SEC
13 C ■ ■ ■ SEC
14 C B ■ ■ ■ SEC
15 D ■ ■ ■ WIC, EOI SCI
16 B A ■ ■ ■ SEC
17 B D ■ ■ ■ SEC
18 A ■ ■ ■ EOI SCI
19 B ■ ■ ■ EOI SCI
20 C D ■ ■ ■ COE, EOI SCI
21 A ■ ■ ■ COE, EOI SCI
22 A B ■ ■ ■ WIC, EOI SCI
23 C B ■ ■ ■ WIC, EOI
24 D C ■ ■ ■ SEC
25 C D ■ ■ ■ SEC
26 A ■ ■ ■ COE, EOI
27 A D ■ ■ ■ EOI
28 B ■ ■ ■ COE, EOI
29 D A ■ ■ ■ WIC, EOI
30 C B ■ ■ ■ SEC
31 D ■ ■ ■ EOI
32 B ■ ■ ■ SEC
33 D ■ ■ ■ SEC
34 D B ■ ■ ■ EOI
35 D ■ ■ ■ SEC
36 B A ■ ■ ■ EOI
37 C D ■ ■ ■ COE, EOI
38 A ■ ■ ■ SEC
39 C ■ ■ ■ SEC
40 D A ■ ■ ■ WIC, EOI
41 D B ■ ■ ■ SEC
42 A Ø ■ ■ ■ SEC
43 C B ■ ■ ■ COE, EOI
44 B C ■ ■ ■ WIC, EOI
Your Question-Level Feedback
Que
stio
n #
Cor
rect
Your
Ans
wer
Diff
icul
ty
Subs
core
Cro
ss-T
est
Scor
e
14 2 0 ■ ■ ■ HOA
15 90 80 ■ ■ ■ HOA
16 1 2 ■ ■ ■ PAM
17 0 ■ ■ ■ PAM
Que
stio
n #
Cor
rect
Your
Ans
wer
Diff
icul
ty
Subs
core
Cro
ss-T
est
Scor
e28 65 60 ■ ■ ■ HOA
29 0, 12 2 ■ ■ ■ PAM
30 1368 Ø ■ ■ ■ PSD HSS
31 85 75 ■ ■ ■ PSD HSS
Subscore KeyCOE Command of Evidence Correct
WIC Words in Context Ø Omitted
EOI Expression of Ideas U Unscorable
SEC Standard English Conventions X Multi-Grid/Incorrect
HOA Heart of Algebra ■ ■ ■ Easy
PSD Problem Solving and Data Analysis ■ ■ ■ Medium
PAM Passport to Advanced Math ■ ■ ■ Hard
Cross-Test ScoreHSS Analysis in History/Social Studies
SCI Analysis in Science
See the questions, and the answer explanations, onlinestudentscores.collegeboard.org
Access CodeA02670146P
© 2017 The College Board. College Board, AP, SAT, and the acorn logo are registered trademarks of the College Board. PSAT/NMSQT is a registered trademark of the College Board and National Merit Scholarship Corporation. National Merit and the corporate “Lamp of Learning” logo are federally registered service marks of National Merit Scholarship Corporation.
Visit the College Board on the web: collegeboard.org.
You can also visit National Merit Scholarship Corporation at www.nationalmerit.org.
Khan Academy is a registered trademark in the United States and other jurisdictions.
Ima B. Student 2017, 11th Grade 00861-005 160041901
Get your full report online
AP® and CourseworkSAT PracticeSee which AP courses may be good matches for you.
studentscores.collegeboard.orgAccess Code
Connect to Khan Academy®
for FREE, world-class SAT practice on satpractice.org.
DB
https://bloggingheads.tv/
Hi,
Student ID:Optional Code:
School Name:
Access Code:
Register for the SATSelect an SAT test date, and
register for it now.
John F. Kennedy High School, School Code: 123456
Ima B. Student
2406890700
A02670146P
A02670146P
12345678
2017, 11th Grade
College Board ID:
Preliminary SAT/National Merit Scholarship Qualifying Test
Your Score Report
NATIONAL MERITSCHOLARSHIP CORPORATION
00861-005-Fall-Winter-2017-Sample-Score-Report-PN-disclosed.indd 4-1 11/6/17 12:18 PM
| 320 to1520
Need to strengthen skills Approaching benchmark Meet or exceed benchmark
Subscores 1 to 15 range*
1 8 15
Test Scores
8 to 38 range
8 to 38 range*
Cross-Test Scores
38238
Your Math ScoreYour Evidence-Based
Reading and Writing ScoreYour Total Score
Your NationallyRepresentative
SamplePercentile
Your NationallyRepresentative
SamplePercentile
Your NationallyRepresentative
SamplePercentile
| 160 to760| 160 to
760
The College and Career Readiness Benchmark
Keep in mind, the PSAT/NMSQT®
and SAT® are on the same scale.
Your score shows how you would have scored that day on the SAT. How well
you do depends on what you do next!
Reaching your grade-level benchmark means that you are likely on track to be ready for select �rst-year, credit-bearing college courses.
Test scores are single snapshots in time–if you took the PSAT/NMSQT once a week for a month, your scores would vary. That’s why score ranges are better representations of your true ability. They show how much your score can change with repeated testing, even if your skill level remains the same. Your online score report shows your score ranges.
151
151
151
388
388
388
151
151
151
151
*The red, yellow, and green ranges in the test scores and subscores re�ect your areas of strengths and weaknesses, compared to the typical performance of students in your grade.
530 69th
96051st31st
Your score shows that you’re almost on track to be ready for college, but you need to keep building your skills.
We can help you get on track so you can take courses for credit when you start college. Go to satpractice.organd share your scores for a free personalized study plan.
Your score shows that you’re on track to be ready for college.
We can help you stay on track and build your skills. Go to satpractice.org and share your scores for a free personalized study plan.
20 Writing and Language
26.5 Math
Ima B. Student2017, 11th Grade, Student ID 24068907
430
25 Analysis in History/Social Studies
20 Analysis in Science
8 Command of Evidence
5 Words in Context
7 Expression of Ideas
7 Standard English Conventions
8 Heart of Algebra
10 Problem Solving and Data Analysis
11 Passport to Advanced Math
23 Reading
160 760THE BENCHMARK IS 460
YOUR SCORE IS 430
160 760THE BENCHMARK IS 510
YOUR SCORE IS 530
National Merit Scholarship CorporationNational Merit Scholarship Corporation (NMSC) conducts the National Merit® Scholarship Program, an academic competition for recognition and college scholarships.
To designate students who qualify for recognition in its 2019 competition, NMSC will consider the 2017 PSAT/NMSQT® Selection Index scores of some 1.6 million test takers (usually high school juniors) who meet program entry requirements. For more information, please visit: www.nationalmerit.org.
If any of your responses to NMSC’s “Entry Requirements” questions (see right-hand column) are inaccurate or there has been a change in plans that may affect program entry, write immediately to:
National Merit Scholarship CorporationAttn: Scholarship Administration1560 Sherman Avenue, Suite 200Evanston, IL 60201-4897
Include your name and home address along with your high school name, address, and six-digit code number.
Your NMSC Selection Index
139NMSC uses a Selection Index score based on PSAT/NMSQT scores as an initial screen of students who enter its scholarship programs. To calculate your Selection Index score, double the sum of your Reading, Writing and Language, and Math Test scores.
Eligibility InformationYou meet entry requirements for the 2019 National Merit Scholarship Program and your Selection Index score will be considered among 1.6 million program entrants.
If your Selection Index places you among the 50,000 high scorers who qualify for National Merit Scholarship Program recognition, you will be notified next September when qualifying Selection Index scores will be made available.
Entry Requirements(Information you provided on your answer sheet)
High school student:YES
Year to complete high school and enroll full time in college:2019
Total years to be spent in grades 9–12:4
U.S. Citizenship:YES
Your Scores: Next StepsAdditional skills and improvement suggestions can be found in your online score report.
Get more next steps online
Your score indicates that you are already likely able to: Improve your skills by focusing on the following suggestions:Reading Test
Read a moderately challenging passage closely to draw a reasonable inference
When you are reading complex texts, look closely at the key information and ideas, and then use them to help you determine the central idea or theme the authors want to convey.
Determine the best textual evidence for an inference when both evidence and inference are relatively obvious and direct (e.g., a clearly stated fact as evidence for a simple inference)
When you read, think about how a particular part of a text, such as a sentence, relates to and furthers the purpose of the text as a whole. Consider, for example, whether a certain detail illustrates a larger idea or provides a fact in support of it.Determine the central idea or theme of a moderately challenging
passage
238 to 38
Writing and Language Test
Use supporting information to achieve a simple purpose (e.g., providing a short list of examples introduced by “for instance”)
In drafting and revising, use vocabulary knowledge and an understanding of particular contexts to make effective word and phrase choices.
Recognize and correct an obviously inappropriate shift in verb tense (e.g., using present tense when the context clearly calls for past tense)
In revising, eliminate wordiness or redundancy within a sentence, such as when adjectives with the same meaning or very similar meanings (e.g., “fast” and “quick”) are used to describe the same thing.Distinguish between singular and plural possessive nouns and
between plural and possessive nouns
208 to 38
Math Test
Solve a linear equation in one variable Use function notation to represent dependent relationships.
Identify a key feature of one representation (graph, equation, table, etc.) of a linear relationship based on information about a different representation
Write radical expressions in equivalent forms using fractional exponents.
Factor a monomial from a polynomial expression
Factor a trinomial into two binomials
Add, subtract, multiply, and divide radical expressions.
Use the inverse relationship between roots and exponents to solve equations.
26.58 to 38
SAT PracticeConnect to Khan Academy for FREE, world-class SAT practice on satpractice.org.
AP and CourseworkSee which AP courses may be good matches for you.
Register for the SATSelect an SAT test date, and register for it now.
studentscores.collegeboard.org Ima B. Student 2017, 11th Grade
00861-005-Fall-Winter-2017-Sample-Score-Report-PN-disclosed.indd 2-3 11/6/17 12:18 PMScore Report
Score Report
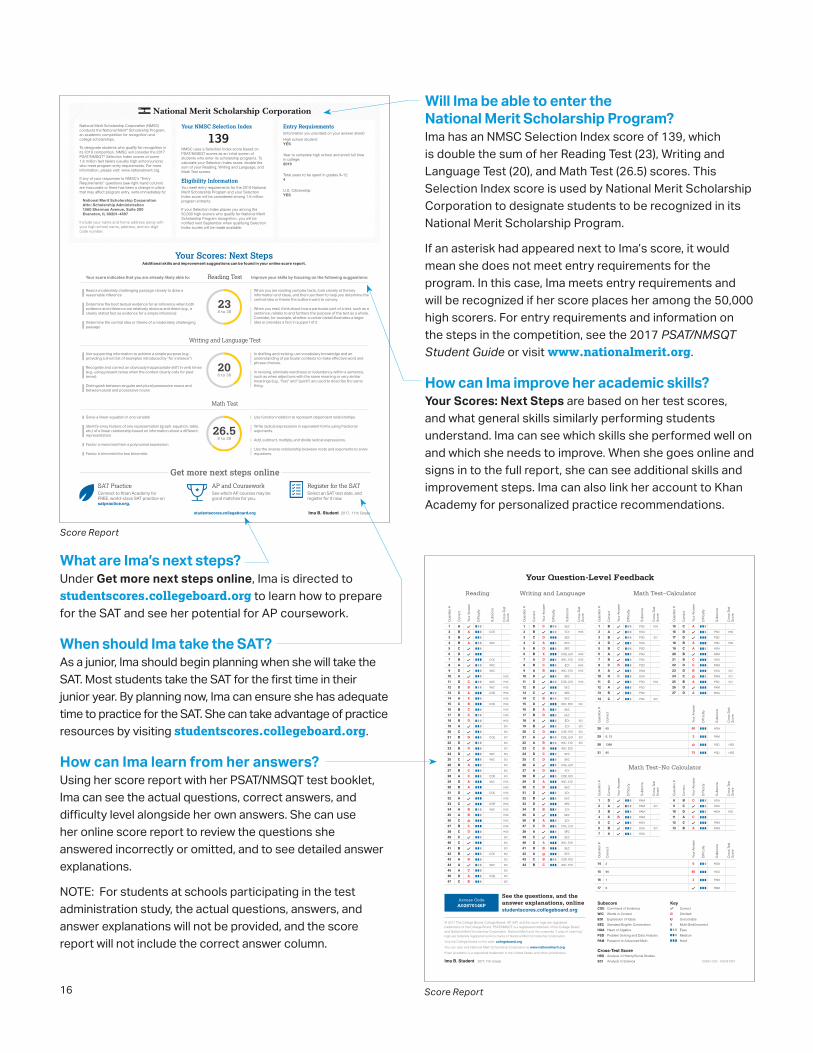
Will Ima be able to enter the National Merit Scholarship Program?Ima has an NMSC Selection Index score of 139, which is double the sum of her Reading Test (23), Writing and Language Test (20), and Math Test (26.5) scores. This Selection Index score is used by National Merit Scholarship Corporation to designate students to be recognized in its National Merit Scholarship Program.
If an asterisk had appeared next to Ima’s score, it would mean she does not meet entry requirements for the program. In this case, Ima meets entry requirements and will be recognized if her score places her among the 50,000 high scorers. For entry requirements and information on the steps in the competition, see the 2017 PSAT/NMSQT Student Guide or visit www.nationalmerit.org.
How can Ima improve her academic skills?Your Scores: Next Steps are based on her test scores, and what general skills similarly performing students understand. Ima can see which skills she performed well on and which she needs to improve. When she goes online and signs in to the full report, she can see additional skills and improvement steps. Ima can also link her account to Khan Academy for personalized practice recommendations.
What are Ima’s next steps?Under Get more next steps online, Ima is directed to studentscores.collegeboard.org to learn how to prepare for the SAT and see her potential for AP coursework.
When should Ima take the SAT?As a junior, Ima should begin planning when she will take the SAT. Most students take the SAT for the first time in their junior year. By planning now, Ima can ensure she has adequate time to practice for the SAT. She can take advantage of practice resources by visiting studentscores.collegeboard.org.
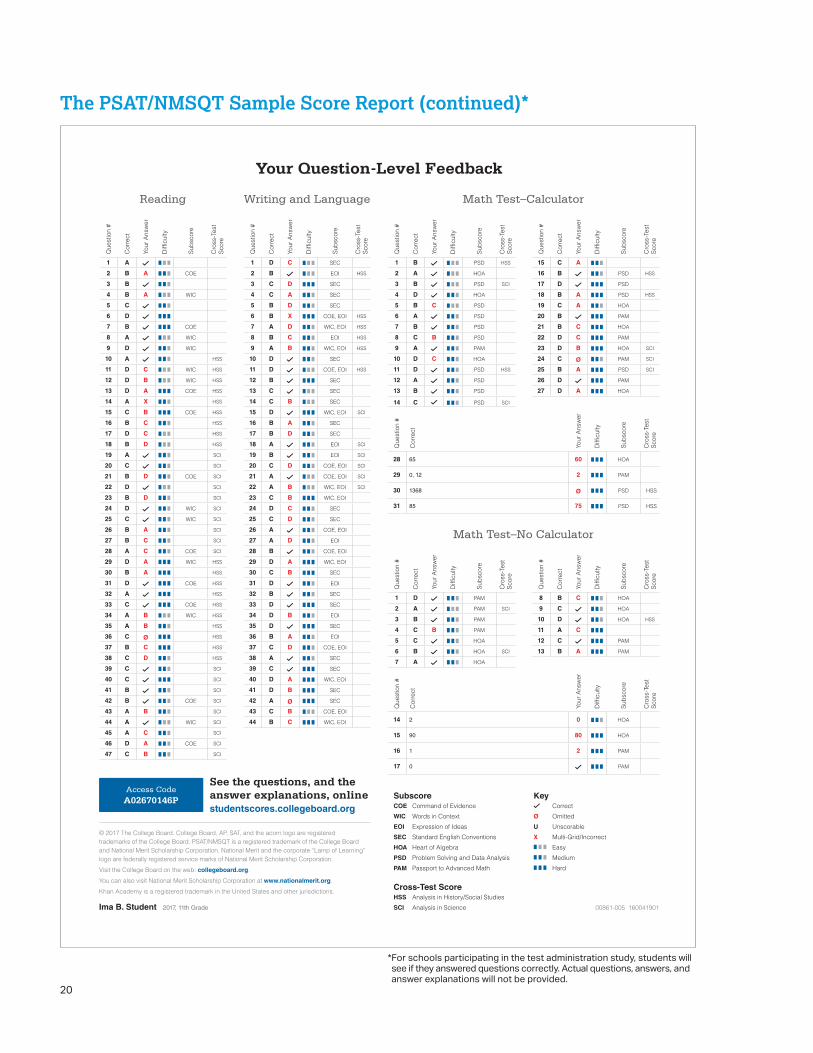
How can Ima learn from her answers?Using her score report with her PSAT/NMSQT test booklet, Ima can see the actual questions, correct answers, and difficulty level alongside her own answers. She can use her online score report to review the questions she answered incorrectly or omitted, and to see detailed answer explanations.
NOTE: For students at schools participating in the test administration study, the actual questions, answers, and answer explanations will not be provided, and the score report will not include the correct answer column.
Math Test–Calculator
Que
stio
n #
Cor
rect
Your
Ans
wer
Diff
icul
ty
Subs
core
Cro
ss-T
est
Scor
e
Que
stio
n #
Cor
rect
Your
Ans
wer
Diff
icul
ty
Subs
core
Cro
ss-T
est
Scor
e
1 B ■ ■ ■ PSD HSS 15 C A ■ ■ ■
2 A ■ ■ ■ HOA 16 B ■ ■ ■ PSD HSS
3 B ■ ■ ■ PSD SCI 17 D ■ ■ ■ PSD
4 D ■ ■ ■ HOA 18 B A ■ ■ ■ PSD HSS
5 B C ■ ■ ■ PSD 19 C A ■ ■ ■ HOA
6 A ■ ■ ■ PSD 20 B ■ ■ ■ PAM
7 B ■ ■ ■ PSD 21 B C ■ ■ ■ HOA
8 C B ■ ■ ■ PSD 22 D C ■ ■ ■ PAM
9 A ■ ■ ■ PAM 23 D B ■ ■ ■ HOA SCI
10 D C ■ ■ ■ HOA 24 C Ø ■ ■ ■ PAM SCI
11 D ■ ■ ■ PSD HSS 25 B A ■ ■ ■ PSD SCI
12 A ■ ■ ■ PSD 26 D ■ ■ ■ PAM
13 B ■ ■ ■ PSD 27 D A ■ ■ ■ HOA
14 C ■ ■ ■ PSD SCI
Math Test–No Calculator
Que
stio
n #
Cor
rect
Your
Ans
wer
Diff
icul
ty
Subs
core
Cro
ss-T
est
Scor
e
Que
stio
n #
Cor
rect
Your
Ans
wer
Diff
icul
ty
Subs
core
Cro
ss-T
est
Scor
e
1 D ■ ■ ■ PAM 8 B C ■ ■ ■ HOA
2 A ■ ■ ■ PAM SCI 9 C ■ ■ ■ HOA
3 B ■ ■ ■ PAM 10 D ■ ■ ■ HOA HSS
4 C B ■ ■ ■ PAM 11 A C ■ ■ ■
5 C ■ ■ ■ HOA 12 C ■ ■ ■ PAM
6 B ■ ■ ■ HOA SCI 13 B A ■ ■ ■ PAM
7 A ■ ■ ■ HOA
Reading
Que
stio
n #
Cor
rect
Your
Ans
wer
Diff
icul
ty
Subs
core
Cro
ss-T
est
Scor
e
1 A ■ ■ ■
2 B A ■ ■ ■ COE
3 B ■ ■ ■
4 B A ■ ■ ■ WIC
5 C ■ ■ ■
6 D ■ ■ ■
7 B ■ ■ ■ COE
8 A ■ ■ ■ WIC
9 D ■ ■ ■ WIC
10 A ■ ■ ■ HSS
11 D C ■ ■ ■ WIC HSS
12 D B ■ ■ ■ WIC HSS
13 D A ■ ■ ■ COE HSS
14 A X ■ ■ ■ HSS
15 C B ■ ■ ■ COE HSS
16 B C ■ ■ ■ HSS
17 D C ■ ■ ■ HSS
18 B D ■ ■ ■ HSS
19 A ■ ■ ■ SCI
20 C ■ ■ ■ SCI
21 B D ■ ■ ■ COE SCI
22 D ■ ■ ■ SCI
23 B D ■ ■ ■ SCI
24 D ■ ■ ■ WIC SCI
25 C ■ ■ ■ WIC SCI
26 B A ■ ■ ■ SCI
27 B C ■ ■ ■ SCI
28 A C ■ ■ ■ COE SCI
29 D A ■ ■ ■ WIC HSS
30 B A ■ ■ ■ HSS
31 D ■ ■ ■ COE HSS
32 A ■ ■ ■ HSS
33 C ■ ■ ■ COE HSS
34 A B ■ ■ ■ WIC HSS
35 A B ■ ■ ■ HSS
36 C Ø ■ ■ ■ HSS
37 B C ■ ■ ■ HSS
38 C D ■ ■ ■ HSS
39 C ■ ■ ■ SCI
40 C ■ ■ ■ SCI
41 B ■ ■ ■ SCI
42 B ■ ■ ■ COE SCI
43 A B ■ ■ ■ SCI
44 A ■ ■ ■ WIC SCI
45 A C ■ ■ ■ SCI
46 D A ■ ■ ■ COE SCI
47 C B ■ ■ ■ SCI
Writing and Language
Que
stio
n #
Cor
rect
Your
Ans
wer
Diff
icul
ty
Subs
core
Cro
ss-T
est
Scor
e
1 D C ■ ■ ■ SEC
2 B ■ ■ ■ EOI HSS
3 C D ■ ■ ■ SEC
4 C A ■ ■ ■ SEC
5 B D ■ ■ ■ SEC
6 B X ■ ■ ■ COE, EOI HSS
7 A D ■ ■ ■ WIC, EOI HSS
8 B C ■ ■ ■ EOI HSS
9 A B ■ ■ ■ WIC, EOI HSS
10 D ■ ■ ■ SEC
11 D ■ ■ ■ COE, EOI HSS
12 B ■ ■ ■ SEC
13 C ■ ■ ■ SEC
14 C B ■ ■ ■ SEC
15 D ■ ■ ■ WIC, EOI SCI
16 B A ■ ■ ■ SEC
17 B D ■ ■ ■ SEC
18 A ■ ■ ■ EOI SCI
19 B ■ ■ ■ EOI SCI
20 C D ■ ■ ■ COE, EOI SCI
21 A ■ ■ ■ COE, EOI SCI
22 A B ■ ■ ■ WIC, EOI SCI
23 C B ■ ■ ■ WIC, EOI
24 D C ■ ■ ■ SEC
25 C D ■ ■ ■ SEC
26 A ■ ■ ■ COE, EOI
27 A D ■ ■ ■ EOI
28 B ■ ■ ■ COE, EOI
29 D A ■ ■ ■ WIC, EOI
30 C B ■ ■ ■ SEC
31 D ■ ■ ■ EOI
32 B ■ ■ ■ SEC
33 D ■ ■ ■ SEC
34 D B ■ ■ ■ EOI
35 D ■ ■ ■ SEC
36 B A ■ ■ ■ EOI
37 C D ■ ■ ■ COE, EOI
38 A ■ ■ ■ SEC
39 C ■ ■ ■ SEC
40 D A ■ ■ ■ WIC, EOI
41 D B ■ ■ ■ SEC
42 A Ø ■ ■ ■ SEC
43 C B ■ ■ ■ COE, EOI
44 B C ■ ■ ■ WIC, EOI
Your Question-Level Feedback
Que
stio
n #
Cor
rect
Your
Ans
wer
Diff
icul
ty
Subs
core
Cro
ss-T
est
Scor
e
14 2 0 ■ ■ ■ HOA
15 90 80 ■ ■ ■ HOA
16 1 2 ■ ■ ■ PAM
17 0 ■ ■ ■ PAM
Que
stio
n #
Cor
rect
Your
Ans
wer
Diff
icul
ty
Subs
core
Cro
ss-T
est
Scor
e
28 65 60 ■ ■ ■ HOA
29 0, 12 2 ■ ■ ■ PAM
30 1368 Ø ■ ■ ■ PSD HSS
31 85 75 ■ ■ ■ PSD HSS
Subscore KeyCOE Command of Evidence Correct
WIC Words in Context Ø Omitted
EOI Expression of Ideas U Unscorable
SEC Standard English Conventions X Multi-Grid/Incorrect
HOA Heart of Algebra ■ ■ ■ Easy
PSD Problem Solving and Data Analysis ■ ■ ■ Medium
PAM Passport to Advanced Math ■ ■ ■ Hard
Cross-Test ScoreHSS Analysis in History/Social Studies
SCI Analysis in Science
See the questions, and the answer explanations, onlinestudentscores.collegeboard.org
Access CodeA02670146P
© 2017 The College Board. College Board, AP, SAT, and the acorn logo are registeredtrademarks of the College Board. PSAT/NMSQT is a registered trademark of the College Boardand National Merit Scholarship Corporation. National Merit and the corporate “Lamp of Learning”logo are federally registered service marks of National Merit Scholarship Corporation.
Visit the College Board on the web: collegeboard.org.
You can also visit National Merit Scholarship Corporation at www.nationalmerit.org.
Khan Academy is a registered trademark in the United States and other jurisdictions.
Ima B. Student 2017, 11th Grade 00861-005 160041901
00861-005-Fall-Winter-2017-Sample-Score-Report-PN-disclosed.indd 4-1 11/6/17 12:18 PM
The PSAT/NMSQT Sample Score Report
Get your full report online
AP® and CourseworkSAT Practice See which AP courses may be good matches for you.
studentscores.collegeboard.org Access Code
Connect to Khan Academy®
for FREE, world-class SAT practice on satpractice.org.
DB
https://bloggingheads.tv/
Hi,
Student ID: Optional Code:
School Name:
Access Code:
Register for the SAT Select an SAT test date, and
register for it now.
John F. Kennedy High School, School Code: 123456
Ima B. Student
24068907 00
A02670146P
A02670146P
12345678
2017, 11th Grade
College Board ID:
Preliminary SAT/National Merit Scholarship Qualifying Test
Your Score Report
NATIONAL MERIT SCHOLARSHIP CORPORATION
17
18
The PSAT/NMSQT Sample Score Report (continued)
| 320 to1520
Need to strengthen skills Approaching benchmark Meet or exceed benchmark
Subscores 1 to 15 range*
1 8 15
Test Scores
8 to 38 range
8 to 38 range*
Cross-Test Scores
38238
Your Math ScoreYour Evidence-Based
Reading and Writing ScoreYour Total Score
Your NationallyRepresentative
SamplePercentile
Your NationallyRepresentative
SamplePercentile
Your NationallyRepresentative
SamplePercentile
| 160 to760| 160 to
760
Keep in mind, the PSAT/NMSQT®
and SAT® are on the same scale.
Your score shows how you would have scored that day on the SAT. How well
you do depends on what you do next!
Test scores are single snapshots in time–if you took the PSAT/NMSQT once a week for a month, your scores would vary. That’s why score ranges are better representations of your true ability. They show how much your score can change with repeated testing, even if your skill level remains the same. Your online score report shows your score ranges.
151
151
151
388
388
388
151
151
151
151
530 69th
96051st31st
Your score shows that you’re almost on track to be ready for college, but you need to keep building your skills.
We can help you get on track so you can take courses for credit when you start college. Go to satpractice.org and share your scores for a free personalized study plan.
Your score shows that you’re on track to be ready for college.
We can help you stay on track and build your skills. Go to satpractice.org and share your scores for a free personalized study plan.
20 Writing and Language
26.5 Math
Ima B. Student2017, 11th Grade, Student ID 24068907
430
25 Analysis in History/Social Studies
20 Analysis in Science
8 Command of Evidence
5 Words in Context
7 Expression of Ideas
7 Standard English Conventions
8 Heart of Algebra
10 Problem Solving and Data Analysis
11 Passport to Advanced Math
23 Reading
160 760THE BENCHMARK IS 460
YOUR SCORE IS 430
160 760THE BENCHMARK IS 510
YOUR SCORE IS 530
National Merit Scholarship CorporationNational Merit Scholarship Corporation (NMSC) conducts the National Merit® Scholarship Program, an academic competition for recognition and college scholarships.
To designate students who qualify for recognition in its 2019 competition, NMSC will consider the 2017 PSAT/NMSQT® Selection Index scores of some 1.6 million test takers (usually high school juniors) who meet program entry requirements. For more information, please visit: www.nationalmerit.org.
If any of your responses to NMSC’s “Entry Requirements” questions (see right-hand column) are inaccurate or there has been a change in plans that may affect program entry, write immediately to:
National Merit Scholarship CorporationAttn: Scholarship Administration1560 Sherman Avenue, Suite 200Evanston, IL 60201-4897
Include your name and home address along withyour high school name, address, and six-digitcode number.
Your NMSC Selection Index
139NMSC uses a Selection Index score based on PSAT/NMSQT scores as an initial screen of students who enter its scholarship programs. To calculate your Selection Index score, double the sum of your Reading, Writing and Language, and Math Test scores.
Eligibility InformationYou meet entry requirements for the 2019 National Merit Scholarship Program and your Selection Index score will be considered among 1.6 million program entrants.
If your Selection Index places you among the 50,000 high scorers who qualify for National Merit Scholarship Program recognition, you will be notified next September when qualifying Selection Index scores will be made available.
Entry Requirements(Information you provided on your answer sheet)
High school student:YES
Year to complete high school and enroll full time in college:2019
Total years to be spent in grades 9–12:4
U.S. Citizenship:YES
Your Scores: Next StepsAdditional skills and improvement suggestions can be found in your online score report.
Get more next steps online
Your score indicates that you are already likely able to: Improve your skills by focusing on the following suggestions:Reading Test
Read a moderately challenging passage closely to draw a reasonable inference
When you are reading complex texts, look closely at the key information and ideas, and then use them to help you determine the central idea or theme the authors want to convey.
Determine the best textual evidence for an inference when both evidence and inference are relatively obvious and direct (e.g., a clearly stated fact as evidence for a simple inference)
When you read, think about how a particular part of a text, such as a sentence, relates to and furthers the purpose of the text as a whole. Consider, for example, whether a certain detail illustrates a larger idea or provides a fact in support of it.Determine the central idea or theme of a moderately challenging
passage
238 to 38
Writing and Language Test
Use supporting information to achieve a simple purpose (e.g., providing a short list of examples introduced by “for instance”)
In drafting and revising, use vocabulary knowledge and an understanding of particular contexts to make effective word and phrase choices.
Recognize and correct an obviously inappropriate shift in verb tense (e.g., using present tense when the context clearly calls for past tense)
In revising, eliminate wordiness or redundancy within a sentence, such as when adjectives with the same meaning or very similar meanings (e.g., “fast” and “quick”) are used to describe the same thing.Distinguish between singular and plural possessive nouns and
between plural and possessive nouns
208 to 38
Math Test
Solve a linear equation in one variable Use function notation to represent dependent relationships.
Identify a key feature of one representation (graph, equation, table, etc.) of a linear relationship based on information about a different representation
Write radical expressions in equivalent forms using fractional exponents.
Factor a monomial from a polynomial expression
Factor a trinomial into two binomials
Add, subtract, multiply, and divide radical expressions.
Use the inverse relationship between roots and exponents to solve equations.
26.58 to 38
SAT PracticeConnect to Khan Academy for FREE, world-class SAT practice on satpractice.org.
AP and CourseworkSee which AP courses may be good matches for you.
Register for the SATSelect an SAT test date, and register for it now.
studentscores.collegeboard.org Ima B. Student 2017, 11th Grade
00861-005-Fall-Winter-2017-Sample-Score-Report-PN-disclosed.indd 2-3 11/6/17 12:18 PM
The College and Career Readiness Benchmark
Reaching your grade-level benchmark means that you are likely on track to be ready for select first-year, credit-bearing college courses.
*The red, yellow, and green ranges in the test scores and subscores reflect your areas of strengths and weaknesses, compared to the typical performance of students in your grade.
19
The PSAT/NMSQT Sample Score Report (continued)
| 320 to1520
Need to strengthen skills Approaching benchmark Meet or exceed benchmark
Subscores 1 to 15 range*
1 8 15
Test Scores
8 to 38 range
8 to 38 range*
Cross-Test Scores
38238
Your Math ScoreYour Evidence-Based
Reading and Writing ScoreYour Total Score
Your NationallyRepresentative
SamplePercentile
Your NationallyRepresentative
SamplePercentile
Your NationallyRepresentative
SamplePercentile
| 160 to760| 160 to
760
The College and Career Readiness Benchmark
Keep in mind, the PSAT/NMSQT®
and SAT® are on the same scale.
Your score shows how you would have scored that day on the SAT. How well
you do depends on what you do next!
Reaching your grade-level benchmark means that you are likely on track to be ready for select �rst-year, credit-bearing college courses.
Test scores are single snapshots in time–if you took the PSAT/NMSQT once a week for a month, your scores would vary. That’s why score ranges are better representations of your true ability. They show how much your score can change with repeated testing, even if your skill level remains the same. Your online score report shows your score ranges.
151
151
151
388
388
388
151
151
151
151
*The red, yellow, and green ranges in the test scores and subscores re�ect your areas of strengths and weaknesses, compared to the typical performance of students in your grade.
530 69th
96051st31st
Your score shows that you’re almost on track to be ready for college, but you need to keep building your skills.
We can help you get on track so you can take courses for credit when you start college. Go to satpractice.organd share your scores for a free personalized study plan.
Your score shows that you’re on track to be ready for college.
We can help you stay on track and build your skills. Go to satpractice.org and share your scores for a free personalized study plan.
20 Writing and Language
26.5 Math
Ima B. Student2017, 11th Grade, Student ID 24068907
430
25 Analysis in History/Social Studies
20 Analysis in Science
8 Command of Evidence
5 Words in Context
7 Expression of Ideas
7 Standard English Conventions
8 Heart of Algebra
10 Problem Solving and Data Analysis
11 Passport to Advanced Math
23 Reading
160 760THE BENCHMARK IS 460
YOUR SCORE IS 430
160 760THE BENCHMARK IS 510
YOUR SCORE IS 530
National Merit Scholarship CorporationNational Merit Scholarship Corporation (NMSC) conducts the National Merit® Scholarship Program, an academic competition for recognition and college scholarships.
To designate students who qualify for recognition in its 2019 competition, NMSC will consider the 2017 PSAT/NMSQT® Selection Index scores of some 1.6 million test takers (usually high school juniors) who meet program entry requirements. For more information, please visit: www.nationalmerit.org.
If any of your responses to NMSC’s “Entry Requirements” questions (see right-hand column) are inaccurate or there has been a change in plans that may affect program entry, write immediately to:
National Merit Scholarship CorporationAttn: Scholarship Administration1560 Sherman Avenue, Suite 200Evanston, IL 60201-4897
Include your name and home address along with your high school name, address, and six-digit code number.
Your NMSC Selection Index
139NMSC uses a Selection Index score based on PSAT/NMSQT scores as an initial screen of students who enter its scholarship programs. To calculate your Selection Index score, double the sum of your Reading, Writing and Language, and Math Test scores.
Eligibility InformationYou meet entry requirements for the 2019 National Merit Scholarship Program and your Selection Index score will be considered among 1.6 million program entrants.
If your Selection Index places you among the 50,000 high scorers who qualify for National Merit Scholarship Program recognition, you will be notified next September when qualifying Selection Index scores will be made available.
Entry Requirements(Information you provided on your answer sheet)
High school student:YES
Year to complete high school and enroll full time in college:2019
Total years to be spent in grades 9–12:4
U.S. Citizenship:YES
Your Scores: Next StepsAdditional skills and improvement suggestions can be found in your online score report.
Get more next steps online
Your score indicates that you are already likely able to: Improve your skills by focusing on the following suggestions:Reading Test
Read a moderately challenging passage closely to draw a reasonable inference
When you are reading complex texts, look closely at the key information and ideas, and then use them to help you determine the central idea or theme the authors want to convey.
Determine the best textual evidence for an inference when both evidence and inference are relatively obvious and direct (e.g., a clearly stated fact as evidence for a simple inference)
When you read, think about how a particular part of a text, such as a sentence, relates to and furthers the purpose of the text as a whole. Consider, for example, whether a certain detail illustrates a larger idea or provides a fact in support of it.Determine the central idea or theme of a moderately challenging
passage
238 to 38
Writing and Language Test
Use supporting information to achieve a simple purpose (e.g., providing a short list of examples introduced by “for instance”)
In drafting and revising, use vocabulary knowledge and an understanding of particular contexts to make effective word and phrase choices.
Recognize and correct an obviously inappropriate shift in verb tense (e.g., using present tense when the context clearly calls for past tense)
In revising, eliminate wordiness or redundancy within a sentence, such as when adjectives with the same meaning or very similar meanings (e.g., “fast” and “quick”) are used to describe the same thing.Distinguish between singular and plural possessive nouns and
between plural and possessive nouns
208 to 38
Math Test
Solve a linear equation in one variable Use function notation to represent dependent relationships.
Identify a key feature of one representation (graph, equation, table, etc.) of a linear relationship based on information about a different representation
Write radical expressions in equivalent forms using fractional exponents.
Factor a monomial from a polynomial expression
Factor a trinomial into two binomials
Add, subtract, multiply, and divide radical expressions.
Use the inverse relationship between roots and exponents to solve equations.
26.58 to 38
SAT PracticeConnect to Khan Academy for FREE, world-class SAT practice on satpractice.org.
AP and CourseworkSee which AP courses may be good matches for you.
Register for the SATSelect an SAT test date, and register for it now.
studentscores.collegeboard.org Ima B. Student 2017, 11th Grade
00861-005-Fall-Winter-2017-Sample-Score-Report-PN-disclosed.indd 2-3 11/6/17 12:18 PM
20
The PSAT/NMSQT Sample Score Report (continued)*
* For schools participating in the test administration study, students will see if they answered questions correctly. Actual questions, answers, and answer explanations will not be provided.
Math Test–Calculator
Que
stio
n #
Cor
rect
Your
Ans
wer
Diff
icul
ty
Subs
core
Cro
ss-T
est
Scor
e
Que
stio
n #
Cor
rect
Your
Ans
wer
Diff
icul
ty
Subs
core
Cro
ss-T
est
Scor
e
1 B ■ ■ ■ PSD HSS 15 C A ■ ■ ■
2 A ■ ■ ■ HOA 16 B ■ ■ ■ PSD HSS
3 B ■ ■ ■ PSD SCI 17 D ■ ■ ■ PSD
4 D ■ ■ ■ HOA 18 B A ■ ■ ■ PSD HSS
5 B C ■ ■ ■ PSD 19 C A ■ ■ ■ HOA
6 A ■ ■ ■ PSD 20 B ■ ■ ■ PAM
7 B ■ ■ ■ PSD 21 B C ■ ■ ■ HOA
8 C B ■ ■ ■ PSD 22 D C ■ ■ ■ PAM
9 A ■ ■ ■ PAM 23 D B ■ ■ ■ HOA SCI
10 D C ■ ■ ■ HOA 24 C Ø ■ ■ ■ PAM SCI
11 D ■ ■ ■ PSD HSS 25 B A ■ ■ ■ PSD SCI
12 A ■ ■ ■ PSD 26 D ■ ■ ■ PAM
13 B ■ ■ ■ PSD 27 D A ■ ■ ■ HOA
14 C ■ ■ ■ PSD SCI
Math Test–No Calculator
Que
stio
n #
Cor
rect
Your
Ans
wer
Diff
icul
ty
Subs
core
Cro
ss-T
est
Scor
e
Que
stio
n #
Cor
rect
Your
Ans
wer
Diff
icul
ty
Subs
core
Cro
ss-T
est
Scor
e
1 D ■ ■ ■ PAM 8 B C ■ ■ ■ HOA
2 A ■ ■ ■ PAM SCI 9 C ■ ■ ■ HOA
3 B ■ ■ ■ PAM 10 D ■ ■ ■ HOA HSS
4 C B ■ ■ ■ PAM 11 A C ■ ■ ■
5 C ■ ■ ■ HOA 12 C ■ ■ ■ PAM
6 B ■ ■ ■ HOA SCI 13 B A ■ ■ ■ PAM
7 A ■ ■ ■ HOA
Reading
Que
stio
n #
Cor
rect
Your
Ans
wer
Diff
icul
ty
Subs
core
Cro
ss-T
est
Scor
e
1 A ■ ■ ■
2 B A ■ ■ ■ COE
3 B ■ ■ ■
4 B A ■ ■ ■ WIC
5 C ■ ■ ■
6 D ■ ■ ■
7 B ■ ■ ■ COE
8 A ■ ■ ■ WIC
9 D ■ ■ ■ WIC
10 A ■ ■ ■ HSS
11 D C ■ ■ ■ WIC HSS
12 D B ■ ■ ■ WIC HSS
13 D A ■ ■ ■ COE HSS
14 A X ■ ■ ■ HSS
15 C B ■ ■ ■ COE HSS
16 B C ■ ■ ■ HSS
17 D C ■ ■ ■ HSS
18 B D ■ ■ ■ HSS
19 A ■ ■ ■ SCI
20 C ■ ■ ■ SCI
21 B D ■ ■ ■ COE SCI
22 D ■ ■ ■ SCI
23 B D ■ ■ ■ SCI
24 D ■ ■ ■ WIC SCI
25 C ■ ■ ■ WIC SCI
26 B A ■ ■ ■ SCI
27 B C ■ ■ ■ SCI
28 A C ■ ■ ■ COE SCI
29 D A ■ ■ ■ WIC HSS
30 B A ■ ■ ■ HSS
31 D ■ ■ ■ COE HSS
32 A ■ ■ ■ HSS
33 C ■ ■ ■ COE HSS
34 A B ■ ■ ■ WIC HSS
35 A B ■ ■ ■ HSS
36 C Ø ■ ■ ■ HSS
37 B C ■ ■ ■ HSS
38 C D ■ ■ ■ HSS
39 C ■ ■ ■ SCI
40 C ■ ■ ■ SCI
41 B ■ ■ ■ SCI
42 B ■ ■ ■ COE SCI
43 A B ■ ■ ■ SCI
44 A ■ ■ ■ WIC SCI
45 A C ■ ■ ■ SCI
46 D A ■ ■ ■ COE SCI
47 C B ■ ■ ■ SCI
Writing and Language
Que
stio
n #
Cor
rect
Your
Ans
wer
Diff
icul
ty
Subs
core
Cro
ss-T
est
Scor
e
1 D C ■ ■ ■ SEC
2 B ■ ■ ■ EOI HSS
3 C D ■ ■ ■ SEC
4 C A ■ ■ ■ SEC
5 B D ■ ■ ■ SEC
6 B X ■ ■ ■ COE, EOI HSS
7 A D ■ ■ ■ WIC, EOI HSS
8 B C ■ ■ ■ EOI HSS
9 A B ■ ■ ■ WIC, EOI HSS
10 D ■ ■ ■ SEC
11 D ■ ■ ■ COE, EOI HSS
12 B ■ ■ ■ SEC
13 C ■ ■ ■ SEC
14 C B ■ ■ ■ SEC
15 D ■ ■ ■ WIC, EOI SCI
16 B A ■ ■ ■ SEC
17 B D ■ ■ ■ SEC
18 A ■ ■ ■ EOI SCI
19 B ■ ■ ■ EOI SCI
20 C D ■ ■ ■ COE, EOI SCI
21 A ■ ■ ■ COE, EOI SCI
22 A B ■ ■ ■ WIC, EOI SCI
23 C B ■ ■ ■ WIC, EOI
24 D C ■ ■ ■ SEC
25 C D ■ ■ ■ SEC
26 A ■ ■ ■ COE, EOI
27 A D ■ ■ ■ EOI
28 B ■ ■ ■ COE, EOI
29 D A ■ ■ ■ WIC, EOI
30 C B ■ ■ ■ SEC
31 D ■ ■ ■ EOI
32 B ■ ■ ■ SEC
33 D ■ ■ ■ SEC
34 D B ■ ■ ■ EOI
35 D ■ ■ ■ SEC
36 B A ■ ■ ■ EOI
37 C D ■ ■ ■ COE, EOI
38 A ■ ■ ■ SEC
39 C ■ ■ ■ SEC
40 D A ■ ■ ■ WIC, EOI
41 D B ■ ■ ■ SEC
42 A Ø ■ ■ ■ SEC
43 C B ■ ■ ■ COE, EOI
44 B C ■ ■ ■ WIC, EOI
Your Question-Level Feedback
Que
stio
n #
Cor
rect
Your
Ans
wer
Diff
icul
ty
Subs
core
Cro
ss-T
est
Scor
e
14 2 0 ■ ■ ■ HOA
15 90 80 ■ ■ ■ HOA
16 1 2 ■ ■ ■ PAM
17 0 ■ ■ ■ PAM
Que
stio
n #
Cor
rect
Your
Ans
wer
Diff
icul
ty
Subs
core
Cro
ss-T
est
Scor
e
28 65 60 ■ ■ ■ HOA
29 0, 12 2 ■ ■ ■ PAM
30 1368 Ø ■ ■ ■ PSD HSS
31 85 75 ■ ■ ■ PSD HSS
Subscore KeyCOE Command of Evidence Correct
WIC Words in Context Ø Omitted
EOI Expression of Ideas U Unscorable
SEC Standard English Conventions X Multi-Grid/Incorrect
HOA Heart of Algebra ■ ■ ■ Easy
PSD Problem Solving and Data Analysis ■ ■ ■ Medium
PAM Passport to Advanced Math ■ ■ ■ Hard
Cross-Test ScoreHSS Analysis in History/Social Studies
SCI Analysis in Science
See the questions, and the answer explanations, onlinestudentscores.collegeboard.org
Access CodeA02670146P
© 2017 The College Board. College Board, AP, SAT, and the acorn logo are registered trademarks of the College Board. PSAT/NMSQT is a registered trademark of the College Board and National Merit Scholarship Corporation. National Merit and the corporate “Lamp of Learning” logo are federally registered service marks of National Merit Scholarship Corporation.
Visit the College Board on the web: collegeboard.org.
You can also visit National Merit Scholarship Corporation at www.nationalmerit.org.
Khan Academy is a registered trademark in the United States and other jurisdictions.
Ima B. Student 2017, 11th Grade 00861-005 160041901
Get your full report online
AP® and CourseworkSAT PracticeSee which AP courses may be good matches for you.
studentscores.collegeboard.orgAccess Code
Connect to Khan Academy® for FREE, world-class SAT practice on satpractice.org.
DB
https://bloggingheads.tv/
Hi,
Student ID:Optional Code:
School Name:
Access Code:
Register for the SATSelect an SAT test date, and
register for it now.
John F. Kennedy High School, School Code: 123456
Ima B. Student
2406890700
A02670146P
A02670146P
12345678
2017, 11th Grade
College Board ID:
Preliminary SAT/National Merit Scholarship Qualifying Test
Your Score Report
NATIONAL MERITSCHOLARSHIP CORPORATION
00861-005-Fall-Winter-2017-Sample-Score-Report-PN-disclosed.indd 4-1 11/6/17 12:18 PM

© 2017 The College Board. College Board, Advanced Placement Program, AP, SAT, and the acorn logo are registered trademarks of the College Board. AP Potential and PSAT are trademarks owned by the College Board. PSAT/NMSQT is a registered trademark of the College Board and National Merit Scholarship Corporation. National Merit and the corporate “Lamp of Learning” logo are federally registered service marks of National Merit Scholarship Corporation. All other marks are the property of their respective owners. Visit the College Board on the web: collegeboard.org.Khan Academy is a registered trademark in the United States and other jurisdictions.00861-010