psc research report research report ... university of michigan psc. ... in the labor market, a task...
TRANSCRIPT

Reynolds Farley
Identifying with Multiple Races: A Social Movement thatSucceeded but Failed?
PSC Research ReportReport No. 01-491
P O P U L A T I O N S T U D I E S C E N T E RAT THE INSTITUTE FOR SOCIAL RESEARCH
UNIVERSITY OF MICHIGAN
PSC

PSC Publications Population Studies Center, University of Michiganhttp://www.psc.isr.umich.edu/pubs/ PO Box 1248, Ann Arbor, MI 48106-1248 USA
The Population Studies Center (PSC) at the University of Michigan is one of the oldestpopulation centers in the United States. Established in 1961 with a grant from the FordFoundation, the Center has a rich history as the main workplace for an interdisciplinarycommunity of scholars in the field of population studies. Today the Center is supported by aPopulation Research Center Core Grant from the National Institute of Child Health andHuman Development (NICHD) as well as by the University of Michigan, the National Instituteon Aging, the Hewlett Foundation, and the Mellon Foundation.
PSC Research Reports are prepublication working papers that report on currentdemographic research conducted by PSC associates and affiliates. These papers are written fortimely dissemination and are often later submitted for publication in scholarly journals. ThePSC Research Report Series was begun in 1981. Copyrights for all Reports are held by theauthors. Readers may quote from, copy, and distribute this work as long as the copyright holderand PSC are properly acknowledged and the original work is not altered.

Identifying with Multiple Races: A Social Movement that Succeeded but Failed?
Reynolds Farley University of Michigan
Population Studies Center Institute for Social Research
311 Maynard Ann Arbor, Michigan 48109
Fax: 734-998-7415 E-mail: [email protected]
Summary Prior to the 1960s, civil rights organizations sought to minimize the collecting of racial
information since such data were often employed to deny opportunities to minorities. By 1970, federal agencies and courts frequently used racial information to enforce civil rights laws by ensuring the minorities were appropriately represented in jobs or in schools and that equitable electoral districts were drawn. In the 1970s, advocacy groups struggled over racial definitions. In 1977, the federal Office of Management and Budget (OMB) defined official races and mandated the gathering of data about them. A decade later a small but highly effective multiracial movement emerged. They contended that many Americans come from several racial backgrounds and should be permitted to identify with a multiracial category. OMB, in 1997, altered the federal regulations, recognized five major races and gave everyone the option to identify with as many races as the wish.
The Census of 2000 adopted the principle that persons could identify with more than one race. About 2.4 percent – or one in 40 – did so. Approximately one-third of these were multiracial because they wrote a Spanish-term for their second race. That is, 1.6 percent of the population or 4.5 million marked two or more of the five major races defined by OMB. White/Other, and White/Indian were the only multiracial groups marked by one million or more.
These innovative multiracial data have not provoked litigation nor bitter controversies as legislatures analyzed census information to reapportion electoral districts. Before to the enumeration, advocacy groups strongly endorsed the use of a multiracial category but they have not highlighted this issue now that data are becoming available from the Census. The multiracial movement succeeded in fundamentally changing the way the government collects racial data but, thus far, there are no great changes in outcomes nor are there prominent pending lawsuit focused on the rights of multiracial.
_________________________ This paper was prepared for the conference The Changing Terrain of Race and Ethnicity: Theory, Methods and Public Policy, held at the University of Illinois at Chicago on October 26 and 27, 2001. For additional information contact: www.uic.edu/depts/ci/raceconf.

Introduction
As President Eisenhower’s administration moved into its final months, the nation was on the cusp of the civil rights revolution that changed our norms and fundamentally altered how many Americans used racial identification to deny employment, to choose applicants for schools, to determine where a person could live or even whom they could marry. The litigation strategy of the National Association for the Advancement of Colored People (NAACP) and their allies shifted federal courts away from their staunch endorsement of state-imposed racial discrimination. And grass roots integration efforts led by such unlikely people as Rosa Parks in Montgomery and Ezell Blair, Franklin McClain, Joseph McNeil and David Richmond in Greensboro, North Carolina evolved into the most potent social movement of the last century effectively championed by Dr. Martin Luther King. In 1960, the word tolerance was still frequently used with regard to race relations, rather than racial ratios, equal opportunity, affirmative action or racist. At that time, racial data were often gathered and then used to promote discrimination. Employers of middle class workers typically asked job seekers to include their picture with their applications, as did many colleges allowing them to readily limit the number of Negroes and then segregate them. Racial information supplied by the census and assessors maps allowed lenders to redline neighborhoods thereby perpetuation residential segregation.
Early in the 1960s, the nascent civil rights movement sought to end this gathering of racial information. Employers and colleges were pressured to drop their demand for photographs. One of the states with the strongest civil rights organizations succeeded in getting their government to end collecting racial data. That is, New Jersey’s legislature removed race from state record keeping including from the birth and death certificate. Later in the decade the pendulum swung in the other direction. By the early 1970s, the federal government mandated that almost all employers and schools at every level gather racial information. If any of us now fills out a job application, seeks admission to a school, or applies to borrow money from any lender; we will have to report our race because of these encompassing federal regulations. And when we die, the mortician will register our race with the federal statistical system. The social movement to allow us to identify with multiple races is the foreseeable outcome of three developments flowing from the civil rights decade. First, federal courts required racial data for the enforcement of constitutional mandates. Second, there was controversy about which races would be identified leading to congressional action and eventually a federal decree about how we were to be classified by race. Third, dissatisfaction with the federal classification scheme that presumed we belonged to one and only one race generated a small but influential multi-racial movement. They succeeded in getting the federal statistical system to acknowledge that a person may be multiracial. This option was used in the Census of 2000 where we had the option to identify simultaneously with as many as five official major races. The federal government will require that in all data gathering by 2003.
Federal Courts and the Federal Government Require Racial Data: the 1960s
Congressional discussion leading to passage of the Civil Rights Act of 1964 focused upon ending racial discrimination (Whalen and Whalen, 1985). Although President Kennedy used the term “affirmative action” in Executive Order #10925 seeking to terminate employment discrimination on the basis of “race, color, creed, or national origin,” in construction paid for with federal dollars (Kelly and Dobbin, 1998), the Civil Rights Act of 1964 did not include any language about the representation of blacks or other minorities in schools or in employment. It did, however, in Title VII, direct the Census Bureau to collect information about registration and

3
voting by race, color and national origin. I believe that this is the first Civil Rights era instance of Congress mandating the collecting of racial data. The Voting Rights Act of 1965 made the Fifteenth Amendment effective in southern states. To accomplish that, it, called for federal oversight of elections in geographic areas where African-Americans had not been allowed to vote. But rather than specifically mentioning race, the law applied federal supervision to jurisdictions in which fewer than 50 percent of the voting age population was registered in November, 1964 or in which fewer than 50 percent of those registered actually cast ballots in the Johnson-Goldwater election. Federal courts at this time wrestled with the unwillingness of southern school districts to accept the integration mandates of Brown (1955). When faced with a court order to desegregate, numerous southern districts adopted “freedom of choice” plans that, in theory, allowed white students and black students to transfer from schools of their own race to schools of the other. As expected, few sought to do so and, in some districts, blacks parents who shifted their children to white schools were targeted for hostility, job loss or violence. (Klueger, 1976, Chap. 27). Reaching the end of their tolerance for southern procrastination, the Supreme Court, in Green v. New Kent County (1968) declared that the only acceptable integration plan was one that actually placed white and black children in the same schools. Quickly, southern federal judges, especially Frank Johnson in Alabama, issued orders requiring the assignment of black and white students and black and white teachers to the same schools. In a key and unanimous ruling, Swann v. Charlotte Mecklenburg County (1971), the Supreme Court called for the use of both racial ratios and busing to integrate school in that large metropolis. Quite clearly a school district could only comply with these court orders if they had classified their students and employees by race. And, by this time, the Office for Civil Rights within the Department of Health, Education and Welfare had begun collecting information about the race of those enrolled in individual public schools using, as authority, Title IV of the Civil Rights Act of 1964. On the employment front, Title VII of the Civil Rights Act of 1965 established the Equal Employment Opportunities Commission and gave it authority to investigate racial discrimination- and later gender discrimination - in the labor market, a task that required racial data about which races worked at which jobs. President Johnson’s Executive Order #11246 prohibited racial discrimination in all work performed by federal contractors and their subcontractors. It created the Office of Federal Contract Compliance (OFCC) with broad powers to terminate contracts and debar firms from new federal contracts if they practiced employment discrimination. The agency rapidly came to collect data about the race of employees by occupations within specific firms. And, employers generally submitted such data readily since it helped them dispute claims about discrimination and kept litigates away. Undoubtedly, many hired and promoted minorities when faced with these federal statistical requirements. George Schultz, Secretary of Labor in the Nixon Administration, sought to end the persistent and thorough exclusion of black men from skilled construction trades. He hammered out an agreement known as the Philadelphia Plan that was to serve as a national model. Construction firms could retain their lucrative federal contracts and unions could avoid federal suits if they took Title VII of the Civil Rights Act seriously and demonstrated that they hired sufficient numbers of black men at all ranks including the crafts trades. The test of compliance was to be the employment of black men. The dominating employment discrimination ruling of the Supreme Court was Griggs v. Duke Power (1971). While banning the use of tests that were inappropriate to assess the actual skill level of the job to be performed, the decision went further and placed great importance upon the classification of workers by race. The justices observed that seeming neutral screening procedures often had a disparate impact upon the employment opportunities of one race. Rather than proving the intent to discriminate, this Supreme Court decision opened the door for litigation based upon the under representation of minorities in a job classification.

4
In a Keysian strategy to prime the pump through creating construction jobs, the Carter Administration supported and Congress enacted a four billion dollar public works act in 1977. Congress used an innovative strategy and, for the first time, specifically set aside 10 percent of these funds for qualified minority contractors defined as “Negroes, Spanish-speaking, Orientals, Indians, Eskimos and Aleuts” (LaNoue and Sullivan, 1998:74). In Fullilove v. Klutznik (1980), the Supreme Court in a 6 to 3 vote upheld the allocating of a share of federal spending for minority firms. During President Reagan administration, this procedure of earmarking federal spending for minority firms was extended to include contracting by the Departments of Defense and Transportation. At the start of the 1960s, many civil rights leaders opposed the collection of racial data since they were used to deny opportunities. But less than a dozen years later, the federal government – and numerous private organizations – established the norm that such data be gathered from everyone. Overcoming past discrimination depended upon whether sufficient numbers of minorities were hired, promoted, admitted to schools and universities, or got contracts from governmental agencies. Rather than promoting discrimination, racial data were used by enforcement agencies and federal courts to overcome historic patterns of discrimination.
Defining Racial Groups: From the Simple to the Complex in the 1970s Almost all of discussion of race in the civil rights decade focused upon the nation’s discrimination against blacks. Few comments were offered about the one-half million American Indians (Snipp, 1989: Figure 3-1), many of them living in remote areas of sparsely populated states. And the Asian population in 1960 numbered just 875,000 – about one half million Japanese and one-quarter million Chinese (Barringer, Gardner and Levin, 1993; Table 2A). They were highly concentrated in Hawaii, Los Angeles, and San Francisco and New York. In 1960, the Census did not specifically identify the Spanish-origin population although they reported there were 892,000 individuals of Puerto Rican birth or parentage and 3.4 million persons living in five southwestern states with Spanish-surnames (Bean and Tienda, 1987: Chap. 2; U.S., Bureau of the Census, 1963a and 1963b). Two changes broadened the discussion of race after 1970. First, the success of the African-American civil rights movement in the 1960s – the adoption of a Constitutional Amendment, the addition of three mos-changing laws and the shift by federal courts from ratifying state-imposed racial discrimination to mandating racial quotas – spurred movements seeking to extend those gains to other groups especially American Indians, the Spanish population, Asians and, later, the disabled and gays and lesbians. Second, the ideology of the Civil Rights Revolution provoked Congress, in 1965, to remove national origin quotas from the immigration laws – the quotas that greatly favored Western Europeans but discouraged immigration from elsewhere. After 1968, immigration from Asia, the Caribbean, Mexico, Latin American and Africa soared thereby increasing the size and heterogeneity of the minority population and providing a strong demographic base for new civil rights organizations. The Spanish population was the largest and occupied a unique status because of the Treaty of Guadeloupe-Hidalgo at the end of the War with Mexico. The nation’s victory in the Spanish American war also added Spanish-speaking colonies. By the late 1960s, Latinos were a rapidly growing minority without obvious ties to either major political party. Political campaigners cannot seek the votes of a minority unless they know their size and location. The Census Bureau had begun printing questionnaires for the 1970 count but Daniel Patrick Moynihan, then a White House domestic policy advisor to President Nixon, ordered that a question identifying this population be added. New forms were printed and a 5 percent sample was asked whether their origin or descent was Mexican, Puerto Rican, Cuban, Central or South American, Other Spanish or none of the above (Choldin, 1986). This was the first time a census question was added to measure the size of a specific ethnic group.
5
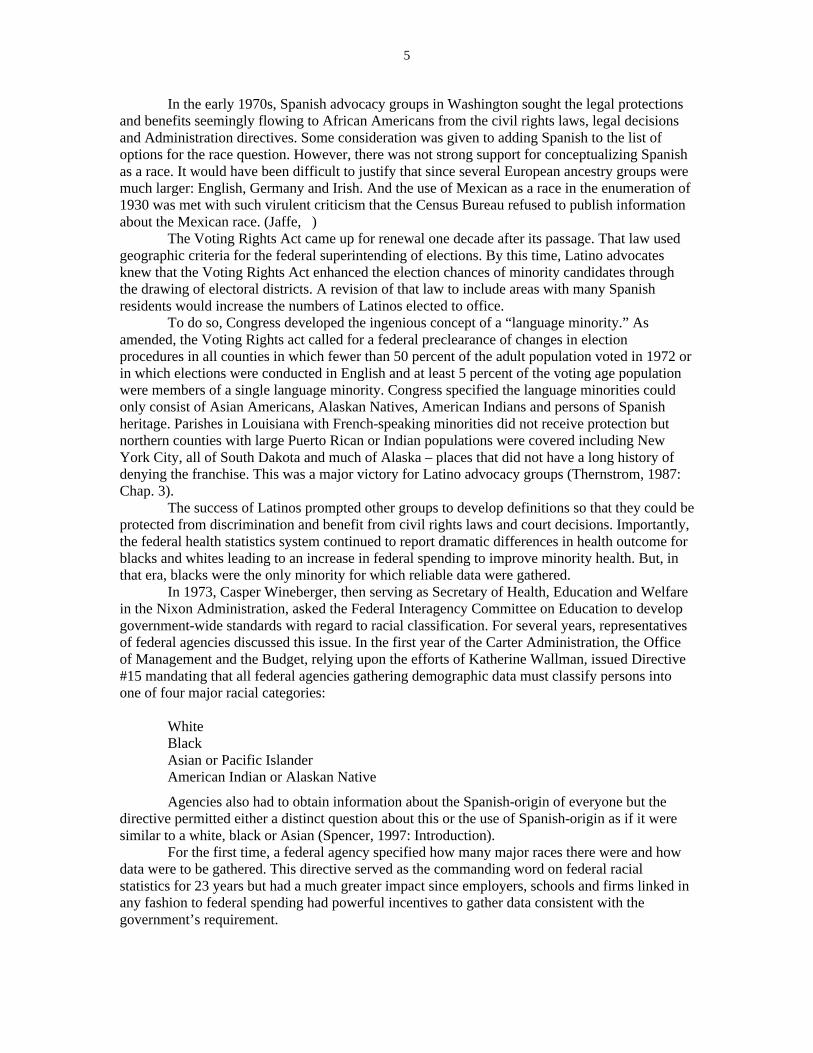
In the early 1970s, Spanish advocacy groups in Washington sought the legal protections and benefits seemingly flowing to African Americans from the civil rights laws, legal decisions and Administration directives. Some consideration was given to adding Spanish to the list of options for the race question. However, there was not strong support for conceptualizing Spanish as a race. It would have been difficult to justify that since several European ancestry groups were much larger: English, Germany and Irish. And the use of Mexican as a race in the enumeration of 1930 was met with such virulent criticism that the Census Bureau refused to publish information about the Mexican race. (Jaffe, ) The Voting Rights Act came up for renewal one decade after its passage. That law used geographic criteria for the federal superintending of elections. By this time, Latino advocates knew that the Voting Rights Act enhanced the election chances of minority candidates through the drawing of electoral districts. A revision of that law to include areas with many Spanish residents would increase the numbers of Latinos elected to office. To do so, Congress developed the ingenious concept of a “language minority.” As amended, the Voting Rights act called for a federal preclearance of changes in election procedures in all counties in which fewer than 50 percent of the adult population voted in 1972 or in which elections were conducted in English and at least 5 percent of the voting age population were members of a single language minority. Congress specified the language minorities could only consist of Asian Americans, Alaskan Natives, American Indians and persons of Spanish heritage. Parishes in Louisiana with French-speaking minorities did not receive protection but northern counties with large Puerto Rican or Indian populations were covered including New York City, all of South Dakota and much of Alaska – places that did not have a long history of denying the franchise. This was a major victory for Latino advocacy groups (Thernstrom, 1987: Chap. 3). The success of Latinos prompted other groups to develop definitions so that they could be protected from discrimination and benefit from civil rights laws and court decisions. Importantly, the federal health statistics system continued to report dramatic differences in health outcome for blacks and whites leading to an increase in federal spending to improve minority health. But, in that era, blacks were the only minority for which reliable data were gathered. In 1973, Casper Wineberger, then serving as Secretary of Health, Education and Welfare in the Nixon Administration, asked the Federal Interagency Committee on Education to develop government-wide standards with regard to racial classification. For several years, representatives of federal agencies discussed this issue. In the first year of the Carter Administration, the Office of Management and the Budget, relying upon the efforts of Katherine Wallman, issued Directive #15 mandating that all federal agencies gathering demographic data must classify persons into one of four major racial categories: White Black Asian or Pacific Islander American Indian or Alaskan Native
Agencies also had to obtain information about the Spanish-origin of everyone but the directive permitted either a distinct question about this or the use of Spanish-origin as if it were similar to a white, black or Asian (Spencer, 1997: Introduction). For the first time, a federal agency specified how many major races there were and how data were to be gathered. This directive served as the commanding word on federal racial statistics for 23 years but had a much greater impact since employers, schools and firms linked in any fashion to federal spending had powerful incentives to gather data consistent with the government’s requirement.

6
This directive influenced the queries appearing on the Census of 1980. To avoid the possibility of minimizing the count of Spanish-origin persons, a special question about this ethnicity was added – a practice followed by most federal offices. All of the major races in OMB Directive #15 were listed but race questions in the last three enumerations have been strongly influenced by Congressman Robert Matsui. Fearing that specific Asian groups might not be identified if the broad term, Asian, were listed, he insisted that many specific Asian origins be listed. The Census Bureau and the Reagan Administration resisted but eventually he added a rider to a military appropriations bill and so the Census of 1980 listed Japanese, Chinese, Filipino, Vietnamese, Asian Indian, Hawaiian, Guamanian and Samoan as the Asian or Pacific Islander races. Directive #15 settled the measurement of race in an official sense, but litigation continued with regard to which groups might be treated as races with regard to laws. In their St. Francis College v. Al Khazraji (1987) decision, the Supreme Court declared that an Iraqi was entitled to sue his employer on grounds of racial discrimination. And, on the same day, the Supreme Court ruled that a Maryland man who defaced a synagogue could be prosecuted under a state law prohibiting crimes of racial hatred, e. g. Jews were protected against racial discrimination (Shaare Tefila Congregation v. Cobb, 1987).
A New Development: The Multiracial Movement Court decisions and Congressional discussions through 1990 never challenged the principle that all persons could be classified into one and only one race. The Census Bureau’s long history of trying to count mulattos, quadroons and octoroons had been forgotten. The one-race only concept was challenged and, by 1997, it disappeared from the federal statistical system. As early as the 1950s, married couples of different races had organized clubs in New York, Detroit, Los Angeles to support each other and their mixed race children (Spencer, Chap. 1). In 1988, Susan Graham, who resided in suburban Atlanta, developed an umbrella organization for clubs and groups representing the interests of mixed race couples and their offspring. She is a white woman married to Gordon Graham, a black man who was an anchorman for CNN. She knew Georgia school systems inevitably classified children as minorities if one parent was not white; hence, the name for her organization: Reclassify All Children Equally (Project RACE.) The arrival of her Census of 1990 questionnaire propelled her to a leadership position in a small but effective social movement. After examining the form, she asserts that she called the Census Bureau to ask how a child’s race should be reported if his or her parents differed in race. She claims she was told that she must mark the mother’s race since only the mother’s race is known with certainty. At approximately the same time, Carlos Fernandez, an attorney in San Francisco of Mexican and white ancestry who was upset by the federal requirements that everyone be slotted into only one race, founded an organization called the Association of Multi-Ethnic Americans (AMEA). Shortly thereafter, local groups sprang up to represent the interests of mixed race persons, including “A Place for Us (APFU),” a national advocacy group founded in Los Angeles by a white man who sought to marry a black woman but was turned down by his minister; the Brick by Brick Church created by Pastor Kenneth Simpson in Lexington, Kentucky to minister to the spiritual needs of multiracial people; the Interracial Family Alliance founded by parishioners at the Episcopal Church in Augusta, Georgia; and the Interracial Lifestyle Connection created as a correspondence club for persons who wished to cross racial boundaries (Sekeney,: Chap. 2). Even before the Census of 1990, Carlos Fernandez considered legal action to challenge OMB Directive #15 with its assumption that there were no multiracial people. He also sought litigants for test cases – individuals who were denied benefits because they refused to identify with only one of the OMB mandated races. (Williams, 2000: Chap. 6). To give national visibility to this emerging movement, AMEA called a Loving Conference for June, 1992 in Washington to

7
commemorate the quarter-century anniversary of the Supreme Court’s Loving v. Virginia (1967) ruling that overturned state laws prohibiting interracial marriage or sex. They invited governmental officials and succeeded in getting the attention of Congressman Thomas Sawyer who headed the House Subcommittee on the Census and Nampeo McKinney who had responsibility for racial statistics at the Census Bureau. When Congressman Sawyer held hearings in 1993 about the Census of 2000, he invited representatives of the multiracial movement to speak, thereby giving them a more prominent platform then they ever had before. Susan Graham and her collaborators, in the meantime, worked at the state level stressing the psychological damage that was done to multiracial children when they were forced to identify with only the mother’s or only the father’s race. They persuaded legislatures in Ohio, Illinois and Georgia to enact laws adding multiracial as a category in state-mandated data collections (Spencer, 1997: 25). By late 1993, traditional civil rights organizations recognized a threat in the adoption of a multiracial category on the census. If it were listed on the census schedule and if the multiracial movement convinced many to mark it rather than one of the traditional races, the demographic foundation for racial advocacy groups would shrink. Billy Tidwell, director of research for the Urban League, relied upon Roderick Harrison of the Census Bureau to argue that black civil rights organization could find they were representing a much smaller African-American population were persons allowed to identify as multiracial (Williams, 2000: Chap. 6). With planning for the enumeration of 2000 speeding along, OMB in 1994 declared that racial categories in Directive #15 were of decreasing value and that a revision of that directive would be considered. This put into play the issue of what racial categories should be used by the government, gave the multiracial movement a new opportunities for congressional testimony and lobbying and, fortunately, stimulated three major Census Bureau surveys that used a great variety of questions to gathered racial data: the 1995 Supplement on Race and Ethnicity to the Current Population Survey, the 1996 National Content Test and the 1996 Race and Ethnic Targeted Test (Hirschman, Alba and Farley, 2000). This OMB decision led to numerous meetings of interagency task forces in Washington since most governmental agencies gathered race data and used them for congressionally mandated purposes. An important consideration to many statisticians was to continue time series data, a consideration that led to the conclusion that the traditional racial categories should be retained unchanged – the desire of most civil rights lobbyists. As officials in OMB wrestled with the issue of racial categories, advocacy organizations succeeded in bringing attention to their cause. Fortuitously, Susan Graham lived in Congressman Newt Gingrich’s district and, after the Republican victory in the 1996 congressional election, he gave his support to this multiracial movement. AMEA spokespersons stressed the very large number of prominent multiracial Americans including persons often considered to be black such as W. E. B. DuBois, Langston Hughes, Alex Haley, Malcolm X and General Colin Powell. A Multiracial Solidarity March was called for Washington in July, 1996 with the specific aim of adding “multiracial” to the list of races on the 2000 Census questionnaire (Williams, 2000: Chap. 6). Tiger Woods’ declared on the Oprah Winfred show in 1997 that he was neither black nor Thai, but rather a Cablinasian. In the same year, Representative Thomas Petri introduced House Bill #830. Known as the “Tiger Woods” bill, it called for the addition of “multiracial” or “multiethnic” as a race category on the Census of 2000 but was never enacted. As pressures for a multiracial category increased, Katherine Wallman and others at OMB considered an alternative strategy: letting everyone identify with as many races as they wished. When asked their opinions about this – and additional Congressional hearing were held in 1997 about the race question for the census- spokespeople for the multiracial movement were unenthusiastic. No one would be given the opportunity to directly identify him or herself as multiracial. Furthermore this procedure would produce unwieldy and, perhaps, unusuable data since there would be dozens of combinations of races. Statisticians and demographers with access

8
to computers and to the public use file that would be released three years after the census count, could extensively describe different racial combinations but this was not good enough for most of the advocacy groups. By 1997, however, the most powerful civil rights lobbyists in Washington, especially the Leadership Conference on Civil Rights representing the interests of African-Americans, came to a different conclusion about the tentative ideas of OMB. Census Bureau studies suggested that a relatively small proportion of people, perhaps 1.5 percent, would identify with either a multiracial category or would mark a second race if given the option. Spokespersons for minorities felt they had little to fear with the “check all that apply” option. Indeed, they knew their group’s size might increase a bit if some who first marked a different race checked their race as a second or third identity. On October 30, 1997, OMB announced their decision. It had its most immediate and greatest impact upon the Census of 2000. All persons were to be given the option to identify with as many races as they wished starting with the decennial enumeration and extending to all federal data systems by 2003. OMB announced that five major races were to be used in the federal system: American Indian and Alaskan Native Asian Black or African American Native Hawaiian or Other Pacific Islander White
This OMB directive also mandated the gathering of data about the Spanish-origin of each person. It recommended distinct questions: one about race and another dichotomous question about whether the individual’s origin was or was not Hispanic or Latino. Theoretically, it permitted the addition of Hispanic or Latino to the list of races if an agency wished to ask a separate question. A few comments are needed about the multiracial movement of the 1990s:
• Frequently spokespeople for this movement and those for the traditional civil rights movement traded heated and ad homonym charges. Civil rights leaders asserted that the multiracial movement intended to turn back the clock and eliminate the racial progress of the last three decades. The multiracialists were described as stalking horses for the growing anti-affirmative action movement. But the multiracialists charged that traditional civil rights leaders were denying the multiracial reality of the nation and were trying to force outdated racial concepts upon everybody for their own gains. Luri Grenier came in for special criticism since some multiracial advocates charged that she was denying her own white and Jewish background while emphasizing her black heritage to get a Clinton Administration appointment.
• Participants in this contentious debate seldom called upon academic experts and they did not conduct any reanalysis of the few scholarly studies that have been done concerning the measurement of race and ethnicity.
• While gaining considerable attention in the press and on Capitol Hill, the multiracial groups were small in number, not well financial and did not establish lobbying offices in Washington. Nor did they have the statistical capability to conduct surveys or analysis the flow of findings from the Census Bureau.
• Nevertheless, there were good reasons to think that the multiracial population grew rapidly in the 1990s since increasing proportions of marriage involved spouses who reported different races (Farley, 1999). The Census of 1990 and the March,2000 Current Population Survey provide revealing information about this trend. Using five racial categories: Spanish-origin; non-Hispanic white, non-Hispanic black, non-

9
Hispanic Asian or Pacific Islander and non-Hispanic American Indian; we find that 4.5 percent of married couples were mixed race in 1990 but 5.4 percent a decade later. The number of same-race married couples increased by 5 percent in the decade while mixed race married couples increased 26 percent.
The grass roots multiracial movement of the 1990s did not get the term “multiracial” added to the government’s list of races. But they won the battle since the Census of 2000 and, after 2003, every other federal demographic system will identify a multiple race population, albeit a situation in which the user will have to ferret out this complex information when and if micro data are made available. And to complicate matters, each person will also be classified as Spanish or not.
Census Questions in 2000: The Concrete and Its Technical Details Figure 1 presents the race and Spanish-origin questions asked of all persons in the censuses of 1990 and 2000. At first glance, the Census of 2000 race inquiry may not appear consistent with the OMB directive of 1997 but it is consistent with that requirement and with the demands of lobbying groups. An individual could check as many of the race boxes as he or she wished. They were given the choices of white, black, American Indian or Alaskan Native. They could go on to identify with one or more of nine specific Asian or Pacific Islander races or write some other term for their Asian or Pacific Islander race. They had one more option: they could mark the “Some other race” box and, if they wished, write a term for their race.
[Figure 1. Questions about Spanish-origin and Race Asked on the Censuses of 1990 and 2000]
About two-thirds of the persons enumerated in last year’s census filled out their own form and, presumably, supplied information for others in their household while about one-third were contacted by an interviewer. Racial data shown in published tabulations or obtained by downloading files from the Census Bureau have been edited and coded. The Asian race and the Native Hawaiian or Other Pacific Islander (NHOPI) race were created as a result of which boxes were checked. The most consequential editing and assignment decisions concerned those who checked “Some other race,” either alone or in combination with one of the five major races. If a respondent marked “Some other race” and wrote a phrase that indicated a Spanish-origin; that person remained in the “Some Other Race” group. If the person wrote any other phrase, data were examined to see if 70 percent or more of the people using that phrase as an ancestry report in the enumeration of 1900 were in one specific major racial group. If they were, the person’s race in 2000 was assigned to that major racial group and was not considered to be “Some other race.” Thus a person writing Italian for their “Some other race” in 2000 was assumed to be white while a person writing Cantonese for their “Some other race” was assumed to be Chinese. We do not know how many marked the “Some other race” box in 2000 and then wrote a phrase but 97 percent of those who remained in the “Some other race” category after editing had reported a Spanish-origin on the preceding question. To be included in two or more races in 2000, a person had to check at least two of the race boxes and not be excluded from the “Some other race” category by the Census Bureau’s editing procedure. A person who checked both Chinese and Filipino was not classified as identifying with two major races but a person who marked Native Hawaiian and Japanese was multiracial since they marked two of the OMB major races. A person who marked white and “Some other race” and then wrote Spanish was multiracial in the Census of 2000. A person who marked white and “Some other race” and wrote Irish was monoracial. Figure 1 also illustrates another major change in last year’s census: the Spanish-origin question came before -not after- the race question. There are few studies of question-order effects

10
concerning racial inquiries although Spanish advocacy organizations favored this change. (Martin, DeMaio and Campanelli, 1990).
Results from the Census of 2000
About one American in 40 – a total of 6.7 million - reported multiple races in the Census of 2000. This is 2.4 percent of the population. If you exclude those persons who were multiracial because they marked one specific race, also marked “Some other race” and then wrote a Spanish term, the count of multiracial falls to 1.6 percent or 4.4 million which is consistent with the findings of Census Bureau surveys done in the 1990s.
[Table 1. Reporting of Multiple Races in the Census of 2000] Few individuals went on to mark a third race. Table 1 shows that about one in one
thousand did so implying that the multiracials overwhelmingly identified with two races. The census questionnaire listed six major races: white, black, Asian, American Indian
and Alaskan Native; Native Hawaiian and Other Pacific Islander (NHOPI) and Some other race (Other). As a result, there are 63 different racial groups for which data are or will be available from the Census of 2000 – six single races and 57 combinations of two to six races.
Table 1 shows the most frequently reported multiple races. As expected, the white/other population was largest reflecting the frequency with which non-Hispanic whites marry persons of Spanish origin: 2.2 million opted for this most popular racial combination, The frequency with which whites and Indians intermarry undoubtedly explains the count of about 1.1 million in this combination. White/Asian, White/Black and Black/Other ranked third, fourth and fifth on this list of most popular multiple races.
Some people identified with each of the 63 racial combinations although quite a few of them were reported by fewer than one in 500,000. As Table 1 reveals, the five-race combination of White/Black/ Indian/NHOPI/Other was least frequently reported – just 68 persons – followed by Black/Indian/NHOPI/Other. Only 823 Americans out of a population of 281.4 million identified with all six races. The single-count total differs greatly from the multiple count for some major races but not for others. Figure 2 shows the maximum count of each race as a percent of the minimum. At one extreme is NHOPI. Of those who checked the Native Hawaiian, Guamanian or Chamorro or Samoan box on the census schedule or wrote an NHOPI term for their race such as Polynesian, Melanesian or Micronesian; 54 percent went on to identify with a second race- typically Asian or white. Thus, the maximum count of this group is 219 percent of the minimum count; that is, those who identified with NHOPI alone.
[Figure 2. Maximum Count of Races in the Census of 2000 as a Percent of the Single Race Only Count]
Approximately 5 percent of those who ticket the black race box on the census form went on to identify with a second race. White was the modal second choice but more than 100,000 who marked black went on to identify with “Some other race” or with both white and Indian – the most popular three race combination. Whites were distinguished by their seldom reporting a second or third race. Of all who marked the white box, no more than one in forty marked a second race. Some other race, Indian and Asian were their most popular choices. Note that even though proportionally few whites identified with a second race, the dominating size of the white population meant that the most popularly reported multiple races include whites.

11
Census of 2000 Findings: Geographic Patterns of Multiple Race Reporting At this time, the only Census of 2000 information available shows the geographic distribution of persons classified by race. We cannot determine how multiple race reporting varied by educational attainment nor whether married couples in which the husband and wife differed by race were more likely to have multiple race children than racially homogeneous couples. Next year, micro data will be released to allow the testing of hypotheses about determinants of multiple race reporting.
[Map 1. Percent Reporting Multiple Races for the 50 States and District of Columbia]
The first map illustrates the multiracial population as a percent of the total in the states. This multiracial population includes those who wrote a Spanish term for their “Some other race.” Hawaii led the nation since more than one resident there in five claimed two or more races. Alaska and California – states traditionally home to several races – came next followed by the state with the highest density of American Indians – Oklahoma. At the other extreme were states that have never had large racial minority populations – West Virginia and Maine – and states where most everyone has, in the past, identified as either black or white. That is, the multiracial population was relatively small in Mississippi, Alabama, South Carolina and Louisiana even though there were many whites and many black residents. The traditional racial dividing line apparently discourages the identification with both black and white simultaneously. In these state maps, five colors are shown to distinguish the quintiles of states reporting the highest percent; then the second quintile; then the middle quintile; than the fourth quintile and, finally, the lowest quintile.
[Map 2. Percent of Population in Metropolitan Areas Reporting More than One Race]
The second map refers to metropolises in the conterminous United States as defined for the Census of 2000 and illustrates a considerable range in the percent multiracial. In five California metropolises including that state’s capital, more than one resident in twenty was multiracial according to the definitions used in the Census. The major metropolises now serving as ports of entry – Los Angeles, Houston, New York, Chicago and Miami – ranked toward the top in multiracial population while this population was rare in many of the smaller metropolises of the Midwest and South. Three metropolises in the hills of Pennsylvania reported the smallest representation of multiracials. In only 13 of the nation’s 315 metropolises did the percent multiracial exceed 4.5 percent but in 38 of them fewer than 1 percent were multiracial.
[Map 3. Percent Reporting Multiple Races in U. S. Counties]
Similar information is presented at the county level in Map 3. Hawaii and Oklahoma led the nation in the representation of the multiracial population. In an immense swath of counties extending from the Indian homelands of Oklahoma in the east, through the Mexican and Spanish populated southwest and into California, the multiracial population was relatively dense. At the opposite end of the distribution, there is a great band of several hundred counties beginning in the Pennsylvania Appalachians, extending into and through the Black Belt of the Deep South and then swinging up into the wheat growing areas of the northern Great Plains, where few individuals used the Census of 2000 to report that they identified with two or more races. Nebraska, the Dakotas and Iowa have several dozen counties where fewer than one person in 500 ticked a box for a second or third race. When it comes to identifying with a second race, the white, black, Asian and American Indian populations differ greatly from one state to the next. In Iowa and Mississippi, almost

12
everyone who marked white ticked only white but this was not the situation in Oklahoma, Alaska or Hawaii. Map 4 reports the maximum count of whites as a percent of the minimum. Where the maximum is much greater than the minimum, many whites reported a second race but where the maximum and minimum were just about equal, only miniscule numbers of whites marked a second race.
[Map 4. Maximum Count of Whites as a Percent of the Single Race Count of Whites in the Census of 2000]
The most inclusive count of whites in Hawaii, that is, counting as white everyone who marked white, was 55 percent greater than the minimum count of whites; that is, counting as white just those who marked only white for their race. This means that realistic estimates of the white population of Hawaii span a wide range. Or, stated differently, of all those who marked white for their race in Hawaii, 37 percent went on to identify with a second or third race. (To ascertain the percent of a race that marked a second or third race, please subtract 100 from the percent for that state shown in Map 4 and use that as a numerator. The denominator is the percent shown in that map [e.g., (155.5 – 100.0)/155.5 = 36.]. In Iowa, Nebraska, Mississippi, North Dakota, Kentucky and South Carolina; less than one percent of those who identified with whites went on to say they were also Asian, black, American Indian or “Some other race”.
[Map 5. Maximum Count of Blacks as a Percent of the Single Race Count of Blacks in the Census of 2000]
In racial composition¸ the small African-American populations dwelling in Vermont, Idaho and Montana differ greater from the numerically larger African-Americans enumerated in Alabama, Louisiana and Mississippi. Where few blacks were counted, a high proportion was multiracial but where many blacks were enumerated, proportionally few were multiracial. Put differently, 38 percent of African Americans counted in Montana went on to identify with white, Indian or Asian or “Some other race” while 31 percent of blacks in Idaho and Vermont did so. But in the Cotton Belt states, no more than one African American in 100 was multiracial.
[Map 6. Maximum Count of Asians as a Percent of the Single Race Count of Asians in the Census of 2000]
Asians differed greatly from whites and blacks in 2000 since a much higher percentage were multiracial. That is, about one Asian in 7 ticked a second race on the census enumeration schedule. Asians living in states that are now attracting few immigrants did this most commonly. That is, a high proportion of the rare Asians in the Dakotas and the northernmost Rocky Mountain states claimed a racial identify in addition to Asian. On the other hand, states that have attracted many immigrants since 1968 – New York, Illinois and California – are ones in which few Asian marked a second identity. Data to be released next year will permit testing of the hypothesis that immigrant Asians are highly likely to identify with Asian only. However, the American-born descendents of earlier Asian immigrants may be the offspring of mixed Asian and white couples who moved to states where there are no ports of entry.
[Map 7. Maximum Count of American Indians as a Percent of the Single Race Count of American Indians in the Census of 2000]
Even more so than Asians, American Indians went on to identify with a second or third race. Of the 4.1 million who identified as American Indians or Alaskan Native, about one-quarter went on to say they were also white; 4 percent said they were also Indian or black and 3 percent

13
identified with the most popular trilogy: Indian/White/Black. In locations where Indians were removed before or just after the Revolution – New Jersey, Pennsylvania and Ohio – a high proportion (more than two thirds) of the Indians enumerated there in 2000 identified as multiracial. At the other end of this multiracial continuum for Indians, New Mexico, South Dakota and Arizona have had Indian populations since long before the arrival of the Spanish explorers. In those states, few went on to identify themselves as also white or black. The Determinants of Multiracial Reporting When public use data from the Census of 2000 are released next year, hypotheses will be tested about what influenced people to identify with two or more races. I hope to test hypotheses about the influence of the following factors:
• The races of the individual’s parents. Presumably, a child born to parents who themselves reported differed races will more likely be reported as multiracial than a child born to parents who share the same race. Census data will provide information about children who live with their parents and, in some few households, about children, their parents and their grandparents.
• The individual’s place or birth and how recently he or she migrated to the United States, if born abroad. Presumably, persons born in foreign lands and, perhaps, children whose parents were born abroad were likely to be monoracial.
• The composition of the respondent’s household including the presence of other relatives and their races and ancestries as measured in the census.
• The educational attainment of the respondent. Analyses of ancestry reports in the Census of 1980 found that educational attainment strongly predicted the reporting of one's ancestry -rather than leaving the question blank - and also the reporting a second ancestry (Farley, 1991). Presumably, those with advanced educations learned more about immigration history and about the racial complexity of the United States than those who dropped out of school at young ages.
• The geographic location of the respondent. One might hypothesize that a Dominican living in a neighborhood of Manhattan or The Bronx where many other Dominicans reside would have many friends that understood the complexity of being both black and Spanish in origin. A Dominican residing in Wyoming might be influenced by circumstances to identify as either black or Spanish. Thus, there may be geographic affects upon multiple race reporting.
[Figure 3. Percent of Children Under Age 18 Reported as Multiple by Race, Census of 2000, and the Percent of Married Couples of Mixed Races in that State:
Current Population Survey of March, 2000] This figure presents the only available information about the determinants of multiple- race reporting in 2000. It plots the percent of children under age 18 reported as multiracial against the percent of married couples in which the race of spouses differed. Data about married couples come from the March 2000 Current Population Survey, a nationally representative Census Bureau sample of 140,000. Husbands and wives were each classified into one of five mutually exclusive groups: Spanish in origin; non-Hispanic white, non-Hispanic black, non-Hispanic Asian or non-Hispanic American Indian. Those in which the races of spouses differed – 5.4 percent of total married couples in 2000 using this classification system – were considered mixed marriages. Data about multiracial children were obtained from the Census of 2000. There was a clear relationship between the percent of racially mixed marriages in a state and the percent of that state’s children reported as multiracial. Micro data from the Census will tell us whether –as anticipated – a high proportion of multiracial children have parents whose races differ.

14
The Census of 2000 and the American Community Survey of 2000: Do They Agree About the Frequency of Multiracials?
The Census of 2010 will not include the long form questionnaire with its several dozen questions about ancestry, migration, education, health and economic variables. The American Community Survey (ACS), a nationally representative rolling national sample to be taken annually, will replace it. Experimentation has already begun. Census-year interviewing for the ACS used the same questionnaire as the decennial enumeration and included the residents of approximately 890,000 housing units- about a one percent sample. Did the persons in the ACS in 2000 report multiple races about as frequently as did those in the Census of 2000? Multiracials were substantially – and significantly – less frequent in the ACS than in the Census itself. In that Survey, only 2.1 percent identified with two or more races – including those that marked “Some other race” and wrote a Spanish term- compared to 2.4 percent in the census. However, if you define the multiracial population as those who marked two of the five major OMB race and did not use a Spanish term for “Some other race,” then the Census and ACS agree that 1.6 percent of the population was multiracial. The maximum counts of the major races as a percent of the minimum were much the same in the Census and ACS, with the exceptions of the small American Indian and NHOPI races as shown below:
Maximum Count of Major Races as a Percent of the Single Race Count
Race Census of 2000 Census Year ACS
White 102.5% 102.3 % Black or African American 105.1 105.5 Asian 116.2 112.6 American Indian or Alaskan Native 166.4 197.6 NHOPI 219.2 182.8
Figure 4 presents information for 50 states and the District of Columbia. It reports that the percent multiracial in these two Census Bureau data arrays. While there was a high degree of correspondence – states with relatively many multiracial in the census also tended to have many multiracial in the Survey – in most states the ACS found significantly fewer identifying with two or more races than did the census. The Census Bureau has yet to explain this apparently large discrepancy. [Figure 4. Percent Reporting Multiple Races in the Census Year American Community Study and
Percent Reporting Multiple Races in the Census of 2000 for States]
Conclusion Five decades ago, racial data helped maintain segregation and disadvantaged minorities. In the 1960s, the Civil Rights movement ended governmental support for discrimination. But they succeeded even more. By 1970, federal courts and agencies employed an effective and unambiguous test to demonstrate the elimination of discrimination: Did an employer hire blacks and promote them to all occupations? Did school systems enroll blacks, hire blacks and assign both black and white students and teachers to the same schools? Were electoral districts drawn so
15
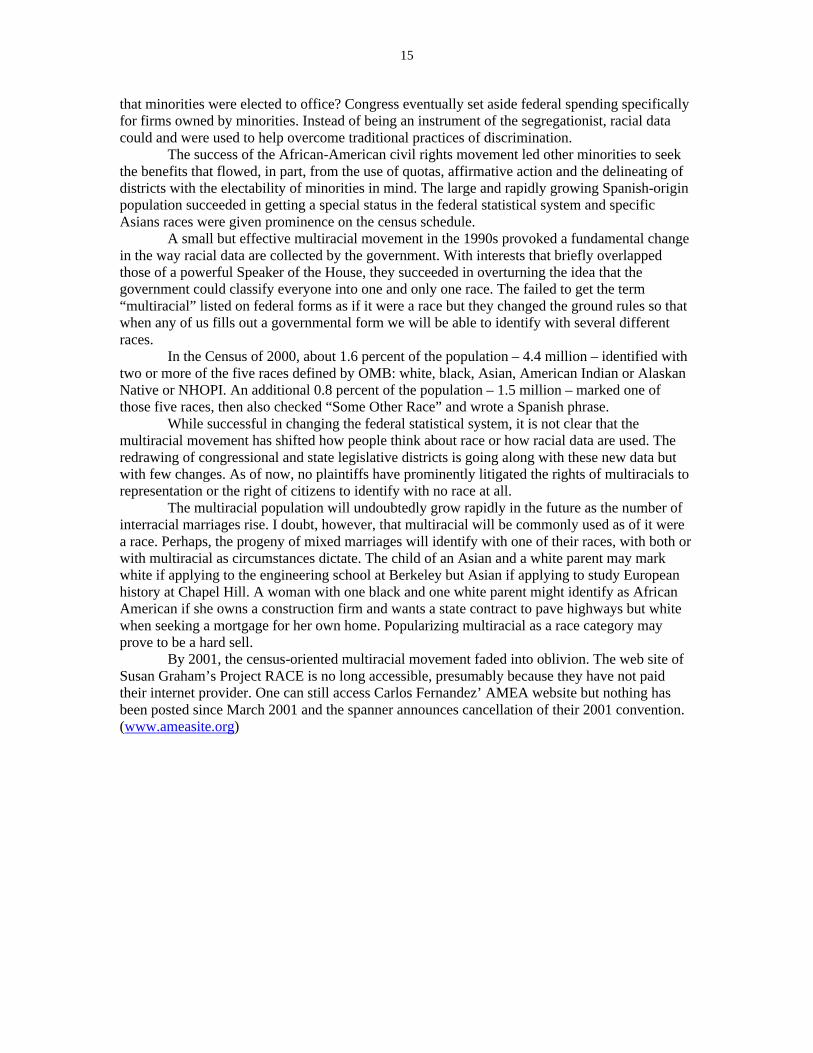
that minorities were elected to office? Congress eventually set aside federal spending specifically for firms owned by minorities. Instead of being an instrument of the segregationist, racial data could and were used to help overcome traditional practices of discrimination. The success of the African-American civil rights movement led other minorities to seek the benefits that flowed, in part, from the use of quotas, affirmative action and the delineating of districts with the electability of minorities in mind. The large and rapidly growing Spanish-origin population succeeded in getting a special status in the federal statistical system and specific Asians races were given prominence on the census schedule. A small but effective multiracial movement in the 1990s provoked a fundamental change in the way racial data are collected by the government. With interests that briefly overlapped those of a powerful Speaker of the House, they succeeded in overturning the idea that the government could classify everyone into one and only one race. The failed to get the term “multiracial” listed on federal forms as if it were a race but they changed the ground rules so that when any of us fills out a governmental form we will be able to identify with several different races. In the Census of 2000, about 1.6 percent of the population – 4.4 million – identified with two or more of the five races defined by OMB: white, black, Asian, American Indian or Alaskan Native or NHOPI. An additional 0.8 percent of the population – 1.5 million – marked one of those five races, then also checked “Some Other Race” and wrote a Spanish phrase. While successful in changing the federal statistical system, it is not clear that the multiracial movement has shifted how people think about race or how racial data are used. The redrawing of congressional and state legislative districts is going along with these new data but with few changes. As of now, no plaintiffs have prominently litigated the rights of multiracials to representation or the right of citizens to identify with no race at all. The multiracial population will undoubtedly grow rapidly in the future as the number of interracial marriages rise. I doubt, however, that multiracial will be commonly used as of it were a race. Perhaps, the progeny of mixed marriages will identify with one of their races, with both or with multiracial as circumstances dictate. The child of an Asian and a white parent may mark white if applying to the engineering school at Berkeley but Asian if applying to study European history at Chapel Hill. A woman with one black and one white parent might identify as African American if she owns a construction firm and wants a state contract to pave highways but white when seeking a mortgage for her own home. Popularizing multiracial as a race category may prove to be a hard sell. By 2001, the census-oriented multiracial movement faded into oblivion. The web site of Susan Graham’s Project RACE is no long accessible, presumably because they have not paid their internet provider. One can still access Carlos Fernandez’ AMEA website but nothing has been posted since March 2001 and the spanner announces cancellation of their 2001 convention. (www.ameasite.org)
16
Bibliography Barringer, Herbert, Robert W. Gardner and Michael J. Levin, 1993. Asians and Pacific Islanders
in the United States. New York: Russell Sage Foundation. Brown v. Board of Education, 1954. 347 U. S. 483 _______, 1955. 349 U. S. 294 Bean, Frank D. and Marta Tienda, 1987. The Hispanic Population of the United States. New
York: Russell Sage Foundation Farley, Reynolds, 1991. “The New Census Question about Ancestry: What Did it Tell Us?
Demography 28: 411-430. _______, 1997. “Racial Issues: Recent Trends in Residential Patterns and Intermarriage.” In Neil
J. Smelser and Jeffrey C. Alexander (editors), Diversity and Its Discontents: Cultural Conflict and Common Ground in Contemporary American Society. Princeton, NJ: Princeton University Press.
Fullilove v. Klutznik, 1980. 448 U. S. 448. Green v. County School Board of New Kent County, 1968. 391 U. S. 430. Griggs v. Duke Power, 1971. 401 U. S. 424. Hirschman, Charles, Richard Alba and Reynolds Farley, 2000. “The Meaning and Measurement
of Race in the U. S. Census: Glimpses Into the Future,” Demography 37(3) (August): 381-394.
Kelly, Erin and Frank Dobbins, 1998. “How Affirmative Action Became Diversity Management:
Employer Response to Antidiscrimination Laws: 1961-1966.” In John David Skerntny (editor), Color Lines, Chicago: University of Chicago Press.
Klinkner, Philip, 1999. The Unsteady March: The Rise and Decline of Racial Inequality in
America. Chicago: University of Chicago Press. Klueger, Richard, 1975. Simple Justice. New York: Alfred A. Knopf. La Noue, George R. and John C. Sullivan, 1999. “Deconstructing Affirmative Action
Categories.” In John David Skrentny, Color Lines. Chicago: University of Chicago Press. Loving v. Virginia, 1967. 388 U. S. 1. Martin, Elizabeth; Theresa J. DeMaio and Pamela C. Campanelli, 1990. “Context Effects for
Census Measures of Race and Hispanic Origin” Public Opinion Quarterly 54: 551-566. Shaare Tefila Congregation v. Cobb, 1987. .481 U. S. 615-618. St. Francis College v. Al-Khazraji, 1987. 481 U. S., 604.

17
Snipp, C. Matthew, 1989. American Indians: The First of This Land. New York: Russell Sage Foundation.
Swann v. Charlotte-Mecklenburg Board of Education, 1971. 402 U. S. 1. Thernstrom, Abigail M., 1987. Who’s Votes Count? Affirmative Action and Minority Voting
Rights. Cambridge, MA: Harvard University Press. U. S. Bureau of the Census, 1963a. Census of Population: 1960. PC (2)-1D. _______, 1963b. Census of Population: 1960 PC (2)-1B. Whalen, Charles and Barbara Whalen, 1985. The Longest Debate: A Legislative History of the
1964 Civil Rights Act. New York: New American Library. Williams, Kim, 2000. “Changing Race As We Know It? The Political Location of the Multiracial
Movement.” Cambridge, MA: Harvard University, John F. Kennedy School of Government, Taubman Center for State and Local Government (Unpublished manuscript).

FIGURE 1. Race and Spanish Origin Questions Asked in the Censuses of 1990 and 2000
CENSUS OF 1990
4. Race ¡ White ¡ Black or Negro
Fill ONE circle for the race that the person ¡ Indian (Amer.) (Print the name of the considers himself/herself to be enrolled or principal tribe If Indian (Amer.) print the name of the enrolled or principal tribe ¡ Eskimo
¡ Aleut
Asian or Pacific Islander (API)
¡ Chinese ¡ Japanese If Other Asian or Pacific Islander (API) ¡ Filipino ¡ Asian Indian Print one group, for example: Hmong, ¡ Hawaiian ¡ Samoan Fijan, Laotian, Thai, Tongen, Pakistani. ¡ Korean ¡ Guamanian Cambodian, and so on ¡ Vietnamese ¡ Other API If Other race, print race
¡ Other race (Print race)
5. Age and year of birth a. Age b. Year of birth
| | | 1 | | | | a. Print each person’s age at last birthday. 0 ¡ 0 ¡ 0 ¡ 1 � 8 ¡ 0 ¡ 0 ¡ Fill in the matching circle below each box. 1 ¡ 1 ¡ 1 ¡ 9 ¡ 1 ¡ 1 ¡ 2 ¡ 2 ¡ ¡ 2 ¡ 2 ¡ b. Print each person’s year of birth and fill the 3 ¡ 3 ¡ ¡ 3 ¡ 3 ¡ matching circle below each box. 4 ¡ 4 ¡ ¡ 4 ¡ 4 ¡ 5 ¡ 5 ¡ ¡ 5 ¡ 5 ¡ 6 ¡ 6 ¡ ¡ 6 ¡ 6 ¡ 7 ¡ 7 ¡ ¡ 7 ¡ 7 ¡ 8 ¡ 8 ¡ ¡ 8 ¡ 8 ¡ 9 ¡ 9 ¡ ¡ 9 ¡ 9 ¡
6. Marital status ¡ Now married ¡ Separated Fill ONE circle for each person ¡ Widowed ¡ Never Married
¡ Divorced
7. Is this person of Spanish/Hispanic origin? ¡ No (not Spanish/Hispanic)
¡ Yes, Mexican, Mexican Am., Chicano Fill ONE circle for each person ¡ Yes, Puerto Rican
¡ Yes, Cuban ¡ Yes, other Spanish/Hispanic Print one group, for example, Argentinean
Columbian, Dominican, Nicaraguan, Salvadoran, Spaniard and so on.
CENSUS OF 2000
èNOTE: Please answer BOTH Questions 5 and 6. 5. Is this person Spanish/Hispanic/Latino? Mark ⌧ the “No” box if not Spanish/Hispanic/Latino. ¨ No, not Spanish/Hispanic/Latino ¨ Yes, Mexican, Mexican Am., Chicano ¨ Yes, Puerto Rican ¨ Yes, Cuban ¨ Yes, other Spanish/Hispanic/Latino Print group 6. What is this person’s race? Mark ⌧ one or more races to indicate what this person considers himself/herself to be ¨ White ¨ Black, African Am., or Negro ¨ American Indian or Alaska Native Print name of enrolled or principal tribe. ¨ Asian Indian ¨ Native Hawaiian ¨ Chinese ¨ Guamanian or Chamorro ¨ Filipino ¨ Samoan ¨ Japanese ¨ Other Pacific Islander Print race ¨ Korean ¨ Vietnamese ¨ Other Asian Print race ¨ Some other race Print race
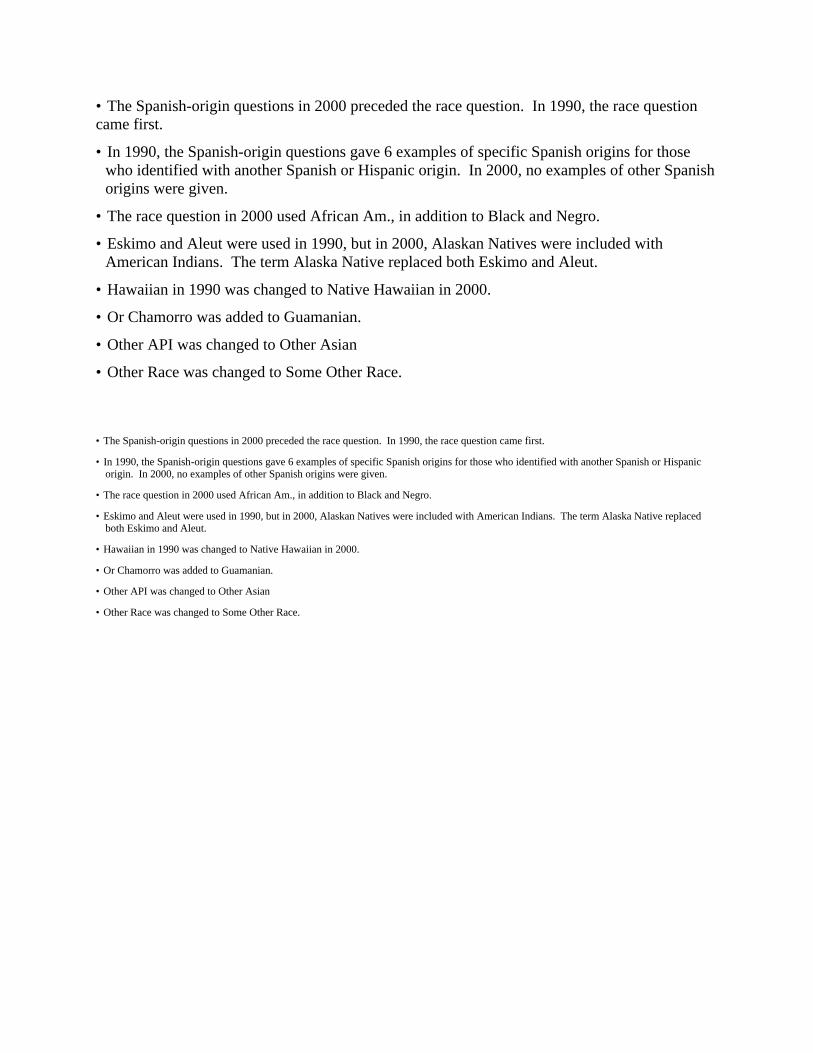
MAJOR CHANGES IN THE RACE AND SPANISH-ORIGIN QUESTIONS
• The Spanish-origin questions in 2000 preceded the race question. In 1990, the race question came first. • In 1990, the Spanish-origin questions gave 6 examples of specific Spanish origins for those who
identified with another Spanish or Hispanic origin. In 2000, no examples of other Spanish origins were given.
• The race question in 2000 used African Am., in addition to Black and Negro. • Eskimo and Aleut were used in 1990, but in 2000, Alaskan Natives were included with American
Indians. The term Alaska Native replaced both Eskimo and Aleut. • Hawaiian in 1990 was changed to Native Hawaiian in 2000. • Or Chamorro was added to Guamanian. • Other API was changed to Other Asian • Other Race was changed to Some Other Race.
The six major races used in the Census of 2000 were: White; Black or African American; American Indian or Alaska Native; Asian; Native Hawaiian and Other Pacific Islander (NHOPI); Some Other Race.
• The Spanish-origin questions in 2000 preceded the race question. In 1990, the race question came first.
• In 1990, the Spanish-origin questions gave 6 examples of specific Spanish origins for those who identified with another Spanish or Hispanic origin. In 2000, no examples of other Spanish origins were given.
• The race question in 2000 used African Am., in addition to Black and Negro.
• Eskimo and Aleut were used in 1990, but in 2000, Alaskan Natives were included with American Indians. The term Alaska Native replaced both Eskimo and Aleut.
• Hawaiian in 1990 was changed to Native Hawaiian in 2000.
• Or Chamorro was added to Guamanian.
• Other API was changed to Other Asian
• Other Race was changed to Some Other Race.

FIGURE 2. Maximum Counts of Races in the Census of 2000 as a Percent of Single-Race-Only Reporting
100% 120% 140% 160% 180% 200% 220%
White
Black or AfricanAmerican
Asian
Some Other
American Indian andAlaska Native
Native Hawaiian andOther Pacific Islander
MAXIMUM AS A PERCENT OF MINIMUM

FIGURE 3. Percent of Children Under 18 Reported as Multiple by Race, Census of 2000, and the Percent of Married Couples of Multiple Race in that State, Current Population Survey of March, 2000
0% 4% 8% 12% 16% 20% 24% 28% 32% 36% 40%
WyomingWisconsin
West VirginiaWashington
VirginiaVermont
UtahTexas
TennesseeeSouth Dakota
South CarolinaRhode IslandPennsylvania
OregonOklahoma
OhioNorth Dakota
North CarolinaNew York
New MexicoNew Jersey
New HampshireNevada
NebraskaMontanaMissouri
MississippiMinnesotaMichigan
MassachusettsMaryland
MaineLouisianaKentucky
KansasIowa
IndianaIllinoisIdaho
HawaiiGeorgiaFlorida
District of ColumbiaDelaware
ConnecticutColorado
CaliforniaArkansas
ArizonaAlaska
Alabama
Children < 18 Married Couples

FIGURE 4. Percent of the U.S. Population Reporting Multiple Races in the Census Year American Community Survey, and the Percent Reporting Multiple Races in the Census of 2000, for States
0% 2% 4% 6% 8% 10% 12% 14% 16% 18% 20% 22%
WyomingWisconsin
West VirginiaWashington
VirginiaVermont
UtahTexas
TennesseeSouth Dakota
South CarolinaRhode IslandPennsylvania
OregonOklahoma
OhioNorth Dakota
North CarolinaNew York
New MexicoNew Jersey
New HampshireNevada
NebraskaMontanaMissouri
MississippiMinnesotaMichigan
MassachusettsMaryland
MaineLouisianaKentucky
KansasIowa
IndianaIllinoisIdaho
HawaiiGeorgiaFlorida
District of ColumbiaDelaware
ConnecticutColorado
CaliforniaArkansas
ArizonaAlaska
Alabama
Census of 2000 Census Year ACS
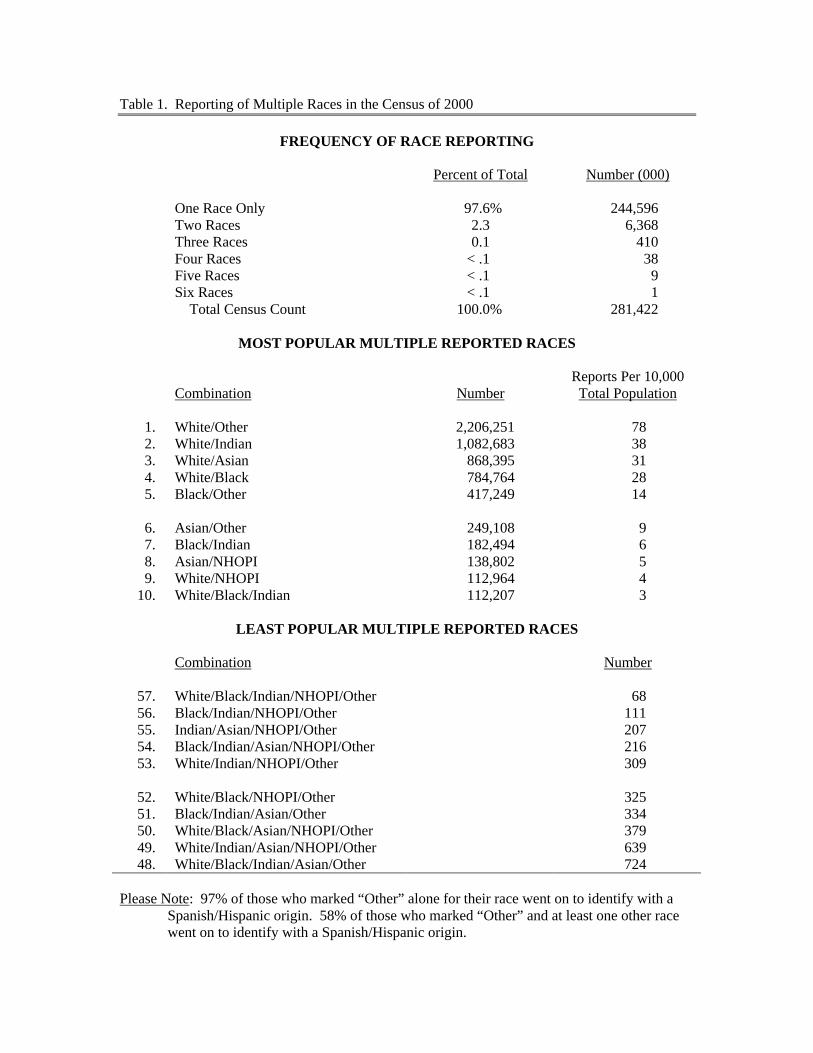
Table 1. Reporting of Multiple Races in the Census of 2000
FREQUENCY OF RACE REPORTING Percent of Total Number (000) One Race Only 97.6% 244,596 Two Races 2.3 6,368 Three Races 0.1 410 Four Races < .1 38 Five Races < .1 9 Six Races < .1 1 Total Census Count 100.0% 281,422
MOST POPULAR MULTIPLE REPORTED RACES Reports Per 10,000 Combination Number Total Population 1. White/Other 2,206,251 78 2. White/Indian 1,082,683 38 3. White/Asian 868,395 31 4. White/Black 784,764 28 5. Black/Other 417,249 14 6. Asian/Other 249,108 9 7. Black/Indian 182,494 6 8. Asian/NHOPI 138,802 5 9. White/NHOPI 112,964 4 10. White/Black/Indian 112,207 3
LEAST POPULAR MULTIPLE REPORTED RACES Combination Number 57. White/Black/Indian/NHOPI/Other 68 56. Black/Indian/NHOPI/Other 111 55. Indian/Asian/NHOPI/Other 207 54. Black/Indian/Asian/NHOPI/Other 216 53. White/Indian/NHOPI/Other 309 52. White/Black/NHOPI/Other 325 51. Black/Indian/Asian/Other 334 50. White/Black/Asian/NHOPI/Other 379 49. White/Indian/Asian/NHOPI/Other 639 48. White/Black/Indian/Asian/Other 724 Please Note: 97% of those who marked “Other” alone for their race went on to identify with a
Spanish/Hispanic origin. 58% of those who marked “Other” and at least one other race went on to identify with a Spanish/Hispanic origin.

APPENDIX TABLE 1. Race of Husband by Race of Wife for Married Couples in the United States; March, 2000
Number of Couples
(thousands)
Percent Distribution
of Couples Race of Husband Race of Wife 2000 1990 2000 1990 White White 42,325 42,547 76.5% 81.3% Hispanic Hispanic 4,403 2,837 8.0 5.4 Black Black 3,745 3,301 6.8 6.3 Asian Asian 1,732 1,172 3.1 2.2 White Hispanic 814 626 1.5 1.2 Hispanic White 696 581 1.3 1.1 White Asian 422 318 0.8 0.6 Black White 223 147 0.4 0.3 Asian White 188 120 0.3 0.2 White Indian 171 171 0.3 0.3 Indian Indian 166 127 0.3 0.2 Indian White 158 151 0.3 0.3 White Black 77 48 0.1 0.1 Black Hispanic 72 43 0.1 0.1 Hispanic Black 38 25 0.1 <0.1 Hispanic Asian 23 27 <0.1 0.1 Black Asian 22 23 <0.1 <0.1 Hispanic Indian 21 19 <0.1 <0.1 Black Hispanic 15 43 <0.1 0.1 Indian Hispanic 14 13 <0.1 <0.1 Black Indian 12 9 <0.1 <0.1 Indian Black 11 6 <0.1 <0.1 Indian Asian 2 3 <0.1 <0.1 Asian Indian 1 4 <0.1 <0.1 Asian Black <1 3 <0.1 <0.1 Total Married Couples 55,352 52,345 100.0% 100.0%
Note: Using Current Population Survey data, all married spouse present persons were classified into one of the following groups: Hispanic
Non-Hispanic White Non-Hispanic Black Non-Hispanic American Indian and Alaskan Native Non-Hispanic Asian or Pacific Islander
Source: U. S. Bureau of the Census, Current Population Survey; March, 2000 Public Use Microdata File; Public Use Microdata Sample of the Census of 2000.
PERCENT IN MIXED MARRIAGES
1990 2000
White Men 2.7% 3.4% White Women 2.2% 2.9 Black Men 6.3 8.4 Black Women 2.4 3.3 Hispanic Men 18.7 15.0 Hispanic Women 19.9 17.2 Asian Men 11.3 9.9 Asian Women 24.1 21.3 Indian Men 57.8 52.3 Indian Women 61.5 53.9

MAP 1. Percent Reporting Multiple Races for the 50 States and the District of Columbia
Highest Percent Lowest Percent
Nevada 3.8% Mississippi 0.7% Oklahoma 4.5% West Virginia 0.8% California 4.8% Maine 0.9% Alaska 5.4% Alabama 0.9% Hawaii 21.4% South Carolina 1.0%
For the United States: 2.4%

MAP 2. Percent of Population in Metropolitan Areas Reporting More Than One Race
Highest Percent Lowest Percent
Sacramento, CA PMSA 5.2% Johnstown, PA MSA 0.5% Yuba City, CA MSA 5.2% Altoona, PA MSA 0.6% Modesto, CA MSA 5.4% Scranton-Wilkes-Barre- Hazleton, PA MSA 0.6% Merced, CA MSA 5.7% Jackson, MS MSA 0.6% Stockton-Lodi, CA PMSA 6.1% Monroe, LA MSA 0.7% For the United States: 2.4%

MAP 3. Percent Reporting Multiple Races in U.S. Counties
Highest Percent Lowest Percent
Craig, OK 11.4% Wheeler, NE 0.1% Honolulu, HI 19.9% Emons, ND 0.1% Maui, HI 22.2% Slope, ND 0.1% Kauai, HI 23.8% Kidder, ND 0.2% Hawaii, HI 28.4% Griggs, ND 0.2%
For the United States 2.4%

MAP 4. Maximum Count of Whites as a Percent of Single Race Count of Whites in the Census of 2000
Highest Percent Lowest Percent
Washington, DC 103.4% Iowa 100.8% California 104.6% Mississippi 100.8% Oklahoma 105.0% West Virginia 100.8% Alaska 106.3% Kentucky 100.9% Hawaii 155.5% Maine 100.9%
For the United States: 102.5%
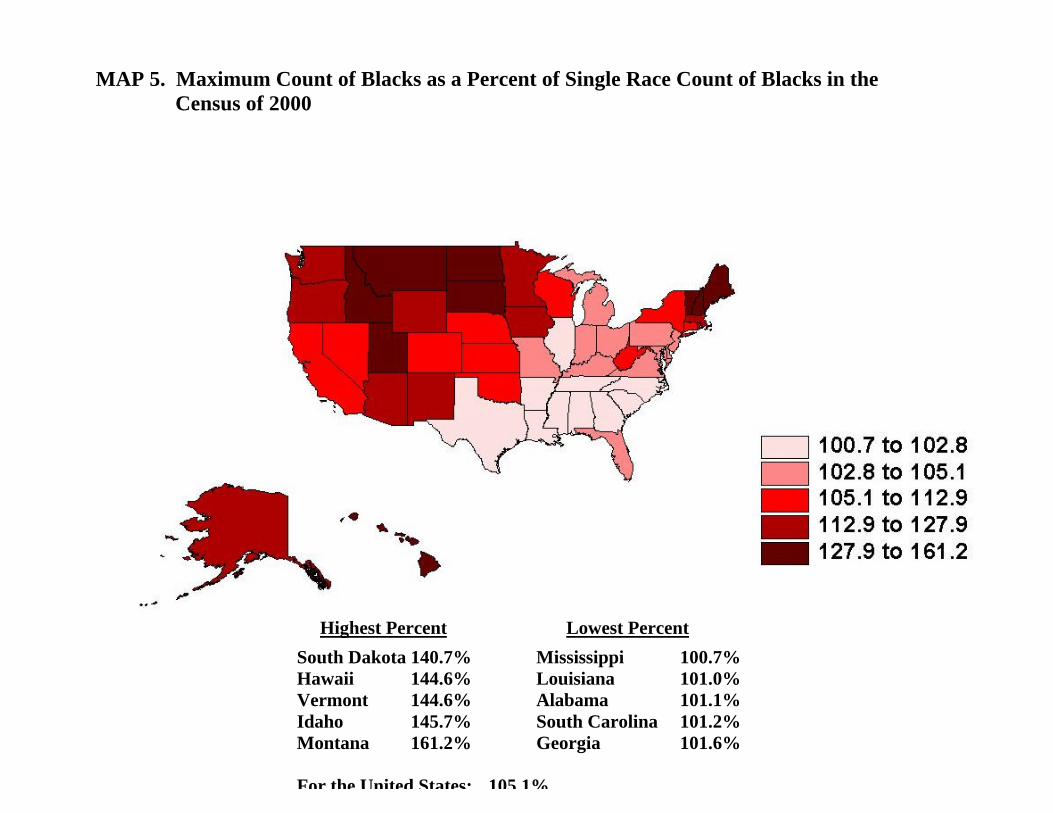
MAP 5. Maximum Count of Blacks as a Percent of Single Race Count of Blacks in the Census of 2000
Highest Percent Lowest Percent
South Dakota 140.7% Mississippi 100.7% Hawaii 144.6% Louisiana 101.0% Vermont 144.6% Alabama 101.1% Idaho 145.7% South Carolina 101.2% Montana 161.2% Georgia 101.6% For the United States: 105.1%

MAP 6. Maximum Count of Asians as a Percent of Single Race Count of Asians in the Census of 2000
Highest Percent Lowest Percent
North Dakota 135.4% New Jersey 108.4% South Dakota 136.0% California 110.4% Idaho 142.4% Massachusetts 110.5% Wyoming 143.9% Illinois 110.8% Montana 148.9% New York 110.8% For the United States: 116.2%
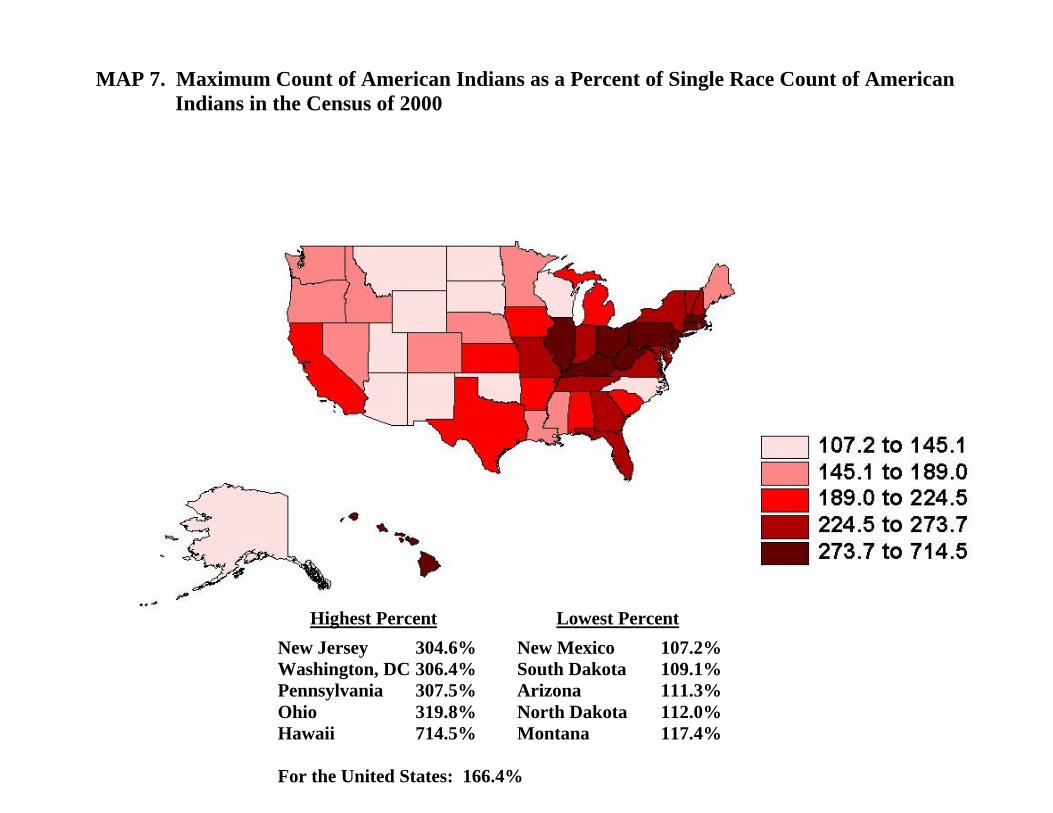
MAP 7. Maximum Count of American Indians as a Percent of Single Race Count of American Indians in the Census of 2000
Highest Percent Lowest Percent
New Jersey 304.6% New Mexico 107.2% Washington, DC 306.4% South Dakota 109.1% Pennsylvania 307.5% Arizona 111.3% Ohio 319.8% North Dakota 112.0% Hawaii 714.5% Montana 117.4% For the United States: 166.4%