psc term and condition and its implementation in · pdf filepsc term and condition and its...
TRANSCRIPT
IPA07-BC-127
PROCEEDINGS, INDONESIAN PETROLEUM ASSOCIATION
Thirty-First Annual Convention and Exhibition, May 2007
PSC TERM AND CONDITION AND ITS IMPLEMENTATION IN SOUTH EAST ASIA REGION
Rovicky Dwi Putrohari* Anggoro Kasyanto**
Heri Suryanto** Ida Marianna Abdul Rashid*
ABSTRACT Comparing the implementation of fiscal term and condition for South East Asia countries is very interesting effort in order to study how oil and gas industry benefit to the host country and how they attract foreign investment through its different competitiveness aspects. In general, the oil and gas industry has been the main source of government income for this region particularly Indonesia and Malaysia for decades. On the other hand, the objectives of oil companies are to maximize value and increase shareholders return by finding and producing oil and gas reserves at the lowest possible cost and highest profit margin. From the government perspective, their intend is to capture as much economic rent as possible by designing a fiscal term that encourage greater exploration and development activities as well as diversification of investors but at the same time ensuring availability of supplies for domestic and export markets and generate new revenue stream for future generations. Royalty Rate, Cost Recovery, Domestic Market Obligation, Signature Bonus, Production Bonus, Export Duty and Corporate Tax are the different forms on how the government extract the economic rent and fulfill their policy objectives. This paper will be comparing the fiscal regime and how SEA countries manage oil and gas resources in order to utilize it in proper way through the fiscal mechanism. The unique approach and implementation of the fiscal regime provide different benefit to the host country and also its attractiveness for foreign investment climate. This paper will look at the contract term at a snap shot point. Any changes on the input assumptions could change the economic outcomes. Therefore
* Hess Oil and Gas Sdn. Bhd ** Hess Indonesia
this paper will hopefully give an idea of the contract terms of one country relatively to other countries for the given set of assumptions. INTRODUCTION Economic analysis is required when an oil and gas company has an opportunity to invest in a project and needs to determine if it is a profitable investment or otherwise. An economic analysis would provide the company with a view of: • Project cash flows • Estimates of profit or loss • Financial and technical risks estimates • Funding requirement • Project ranking There are a number of factors that affect the upstream economics as the sector is very cash intensive and major projects involve substantial cash flows. Often, there is a very long lead time between expenditure and revenue, and investment decision is often made with certain key assumptions and high level of uncertainty.
Fiscal regime is one of the key most important factors to be considered for investment in oil & gas industry. In general, there are two most popular fiscal systems that most countries adopt, which are:
1. Royalty and Income Tax (Concession) 2. Production Sharing Contract (PSC)
However, there are also other types of fiscal systems:
1. Pure Service Agreement – Government compensates contractor in service fees and government bear the risk.
2. Risk Service Contract – Contractor will be compensated by the government in the form of service fee but contractor bear the risk
3. Others e.g. Colombian Association Contract
Fiscal system primarily revolves around division of profits between the government and contractor and upstream economics can be summarized as follows:

Contractor’s Net Cash Flow = Revenue – Costs - Government Take
This paper will be addressing both viewpoints of the government and oil companies by performing economic analysis on the same hypothetical fields using the different fiscal regime of Malaysia, Thailand, Indonesia, Vietnam and Brunei. For all the countries, we will be using the latest fiscal system in placed although at the same time we will also be showing the economic impact in using the previous fiscal system. SCENARIO MODEL It was not easy to compare these countries in South East Asia where HESS Exploration and Production in Kuala Lumpur should be aware of the fiscal and terms in this countries (Malaysia, Thailand, Indonesia, Vietnam and Brunei). An exercise of exploration and production activities were modeled based on the general fiscal terms, including financial, taxation and relinquishment scenario. The scenarios were made based on geological model and estimated reserves were used from historical perspectives. Figure 1 shows the situation map and the production forecast for scenario model of this study. Geological Model This comparative study used single type geological scenario which has been developed using real situation in the South East Asia countries. Geographic situations with a shallow depth offshore shelf type were chosen for a model. This typical situation represents of the Natuna and or Sarawak Areas were selected to be the model. The model area has water depth ranging from 20 meter to approximately 200 meter. Typical petroleum system within this type would be a transition to deltaic sediment reservoirs with hydrocarbon sourced from matured coals and or organic shales. A three play types were modeled on this modeled area. - Play type 1 consist of four structural prospects
(Prospects 1, 2, 3, and 8) - Play type 2 consist of two structural prospects
(Prospects 4 and 5) - Play type 3 consist of two structural prospects
(Prospect 6 and 7). - Two structures with unknown play This geological setting model was then used for the exploration seismic, drilling and development scenario for pricing and costing.
Field sizes A historical field discovery within the South East Asia was used for expected field reserves sizes. The field reserves sizes historical post year 2000 discoveries were taken from IHS- Energy (Probe, 2007) database. Three gas field size classes were selected for the model: - Big Field ~ 100 MMBOE - Marginal Field ~ 10 MMBOE - Undeveloped Field < 10 MMBOE Fiscal Regime- term and condition contract model It is impossible to have a single type contract for each country. As we understand that within Indonesia has some generation for the PSC fiscal. Therefore, the model was based on the latest awarded type contract to the model and using Natuna type area. Even though, there many types of fiscal term, there are many similarities in operational. For all those countries the contractor will have a chance to do a first 5 years exploration phase, follow by three years for second exploration phase and finally continuing with a production phase for the total of 20 years PSC contract. Exploration and Production model Exploration and productions activities were modeled as a basic and typical new entry companies into a new exploration block. It was modeled with three wells commitment in the first exploration phase. Below is a generic time schedule to develop the Block: • Year 1: Seismic survey and exploration G&G studies • Year 2: Drilled 1 exploration Well-1 • Year 3: Drilled 1 exploration Well-2 • Year 4: Drilled 1 exploration Well-3 • Year 5: Seismic 3D Survey for field development,
G&G studies, and Engineering Evaluation for the next exploration-development phase
• Year 6: Drilled 1 exploration Well-4 • Year 7: Drilled 1 exploration Well-5 • Year 9: Drilled 1 exploration Well-6 • Year 11: Drilled 1 exploration Well-7 Based on the above scenario, production profile and cost structures were developed. It is assumed that all fields contain wet gas and will be produced to meet a Gas Sales Agreement which is 100 BBTUPD for first 3 years, ramping up to 140 BBTUPD and entering declining phase at year 10. To simplify the economic evaluation, NGL will not be stripped out at processing plant. Revenue streams

will be only from sales gas and condensate. Production forecast is shown on figure 1. Plan of development consists of developing Field-1 with a drill center bridge link to a Central Processing Plant (CPP). Fields-3 and Field-4 will be developed with subsea completion and tie-back to the CPP. It is also assumed that total well count to optimize the liquid revenue while meeting the GSA is 15 wells which 7 wells for Field-1, 4 wells for Field-3 and 4 wells for Field-4. First gas production is assumed on January 1st Year 9. Relinquishment area during exploration and production phases Due to differences in the relinquishment terms the followings are the expected model for the contract area crafting system. In general there are two period of relinquishments, those are after the first exploration phase and after the second exploration phase for entering the production phase. In Indonesia the first exploration phase ended with a partial (20%) relinquishment, and retains 20% by the end of the contract. In Malaysia, Thailand and Brunei the contractor do not need to relinquish after their first exploration phase. But In Malaysia the company only retains the developed field area or planned developed field confirming by approved POD. Outside this developed or developing fields, the areas were relinquished to the government during the production phase. It is very frequent in Malaysia, that the relinquished areas were re-operated by the previous company with separates PSC contracts and separates entity. In fiscal point view, it was considered separate entity. By the end of the contract there are differences in the crafted of the original PSC area. Figure 9 show how these contract area will be shown during the production period. COUNTRIES BASED MODEL Every country has differences fiscal term model. The following briefly describe the general term of the PSC term of those countries in South East Asia which were selected for comparisons. Malaysia Malaysia carries out its exploration, development and production activities through its National Oil Company, Petronas, through Production Sharing Contracts (PSC) with a number of international oil and gas companies and with its wholly owned
subsidiary, Petronas Carigali Sdn Bhd. It is governed by Petroleum Development Acts of 1974, Petroleum Income Tax Act of 1967 and Petroleum Income Tax Amendment Act 1976. In 1997, a new PSC based on the “revenue over cost” concept (the R/C PSC) was introduced to encourage additional investment in Malaysia’s upstream sector. The R/C PSC allows PSC Contractors to accelerate their cost recovery if the contractors achieved certain cost targets. The basic principle of R/C PSC is to allow the PSC Contractors a higher share of production when the Contractor’s profitability is low and to increase Petronas share of production when Contractor’s profitability improves. The contractor’s profitability is measured by “R/C Index”, which is the ratio of contractor’s cumulative revenue over contractor’s cumulative costs. The figures 2 diagram shows the main features of Malaysia’s R/C PSC concept taken from Petronas Corporate website. Details of the fiscal term are described in the following table:
Fiscal Term Main Features Royalty 10% Petroleum Income Tax
38%
Export Duty (Oil & Condensate)
10%
Research Levy 0.5% (Not inclusive in Cost Oil or Cost Gas)
PETRONAS Carigali’s Participation
20%
Exploration Period 5 years Gas Holding Period
5 years
Development Period
4 years
Production Period 20 years R/C Index Total Cost Tranche (TCT) Total Profit Tranche
(TPT) 0.0 to 1.0 70% 20% 1.0 to 1.4 60% 30% 1.4 to 2.0 50% 40% 2.0 to 2.5 30% 60% 2.5 to 3.0 30% 60% > 3.0 30% 60% Below Threshold Volume (THV)* R/C Index Contractors’ Share of Unused
TCT Contractors’ Share of TPT
0.0 to 1.0 - 80% 1.0 to 1.4 80% 70% 1.4 to 2.0 70% 60% 2.0 to 2.5 60% 50% 2.5 to 3.0 50% 40% > 3.0 40% 30% Above Threshold Volume (THV)* R/C Index Contractors’ Share of Unused
TCT Contractors’ Share of TPT
0.0 to 1.0 - 40% 1.0 to 1.4 40% 30% 1.4 to 2.0 40% 30% 2.0 to 2.5 40% 30% 2.5 to 3.0 40% 30% > 3.0 20% 10%

Note: 1. Supplementary Payment of 70:30 in Petronas’
favor when Contractor’s R/C index exceeds 1.0. 2. The Contractor’s R/C ratio is defined as
a. Revenue (R) = Contractors’ Cumulative Value of Cost Oil and Profit Oil less Supplementary Payment
b. Cost (C) = Contractors’ Cumulative
Petroleum Costs less Non Recoverable Expenditure & Disputed Costs
3. Threshold Volume (THV)*
a. Oil : 30MMSTB b. Gas : 0.75TSCF
Besides the R/C PSC, Malaysia also has two other types of fiscal system which are:- 1) Malaysia Deepwater (200 – 1000M) Production
Sharing Contract 2) Malaysia Ultra-Deepwater (>1000M)
Production Sharing Contract The two fiscal systems are as illustrated in the Figure 2. For the purpose of this paper, the focus will be on R/C PSC as the model area, which has water depth ranging from 20 meter to more than 200 meter. Indonesia Indonesia is the first country created Production Sharing Contract for its oil and gas exploration and production activities. In 2006, the Government of Indonesia had introduced the Indonesia PSC 2006 which is governed by the 1960 Regulation on the Mining of Mineral Oil & Gas, which includes the 1989 and 1992 Incentives. In this 2006 PSC, Pertamina, as the state oil company, has the option to take a 10% undivided interest upon commercial discovery. Pertamina can also elect to repay the contractor by cash payment or from 50% of its production share with a 50% uplift applied to carried cost. A typical Indonesia PSC 2006 is as illustrated in Figure 3. The followings are specific items applied in this PSC term • Signature bonus normally differs from one
contractor to another and is negotiable.
Production Bonus is typically based on certain cumulative production tiers and is negotiable.
• The First Tranche Petroleum (FTP) act as a
royalty and BPMIGAS is entitled to 10% of its gross production. Contractor after tax equity split is 35% for oil and 40% for gas.
• 100% of production available after FTP is used
for Cost Recovery. Bonuses are not cost recoverable. However, operating costs and intangibles are expensed.
• Based production remaining after FTP and Cost
Recovery, profit is shared between the Government and Contractor by the Before Tax Equity split for each product.
• The National Oil Company has an obligation to
sell the oil into domestic market with the price below the market. This is known as Domestic Market Obligation (DMO). Obligation starts 5 years from production start of each field. DMO is calculated based on the following formula:
DMO = 25% X Gross Production X Contractor Before
Tax Equity Split DMO limit is equal to Contractor’s share of profit oil. Income tax is calculated based on the revenue from the contractor share of FTP, the cost recovery, and the contractor profit oil. Operating costs, capital expenditures and bonuses are deductible from taxable income. The effective tax rate is 44% and losses are carried forward indefinitely. Thailand Thailand’s fiscal regime is the Royalty & Income Tax Concession. For the purpose of this paper, we will be using the Thailand R/T (1991) with a Special Remuneration Benefit (SRB). The governing legislation of this Thailand R/T (1991) with SRB is the 18th Bid Round, Petroleum Act, B.E. 2514 (No. 2), B.E. 2516 (No.3), B.E. 2522 (No.4), B.E. 2532 (No.5), B.E. 2534 (B.E. year of Buddha 2534 equals 1991) – Thailand III In this fiscal regime type, state participation is not required but negotiable. Normally, there is no signature bonus on the signing date but possibly negotiated on particular dates. In the latest bid round, the production bonus was waived.

The contract duration is as follows: • Exploration period: 6 years + 3 year renewal • Production period: 20 years from end of
exploration period + 10 year renewal • Obligation to produce is within 4 years, with
possible deferrals of 2 years each. Royalty is imposed at progressive rates: • Up to 2,000 barrels per day 5.0% • 2,000 – 5,000 barrels per day 6.25% • 5,000 – 10,000 barrels per day 10.0% • 10,000 – 20,000 barrels per day 12.5% • Over 20,000 barrels per day 15.0% Royalty is paid in cash based on posted, realized or market price. Royalty in kind is volume equivalent in value to royalty paid in cash. It is payable monthly. Special Remuneration Benefit is windfall profits tax, payable only in years concessionaire has petroleum profit. In calculating such profit or loss, capital expenditure, operating costs and a special reduction (an expense “uplift”) for the year and petroleum loss carried forward indefinitely from prior years may be deducted. The ‘special reduction” was specified as 0%. SRB is calculated by exploration block at following rates , subject to a ceiling of 75% of petroleum profit: Income per meter of well SRB • Up to Baht 4,800 0 • Baht 4,800 to 14,400 1% per
each Baht 240 increment • Baht 14,400 to 33,600 Baht 1% per
each Baht 960 increment • Over 33,600 Baht 1% per
each Baht 3,840 increment To determine “income per meter of well”, annual petroleum profit is first calculated, and then inflation and exchange rates are adjusted. Accumulated total meters of all wells drilled during concession period are then calculated. Income per meter of well equals adjusted annual petroleum profit divided by total depth of all wells + GSF (Geological Stability Factor, which is fixed for each geological region and is at least 150,000 meters, higher in difficult drilling areas). Income tax rate is 50% on profits and payable semi-annually. Revenues, deductions and taxes for all Thailand III blocks of the same concessionaire may be consolidated. Other blocks of the same
concessionaire must be consolidated separately. Capital costs generally are amortized 5 to 10 years and accelerated depreciation is also permitted. Operating costs, royalties and SRB are expensed. Ten-year loss carry forward and no loss carry back. Thailand R/T 1991 can be summarized as per the following diagram. Brunei Like most countries in South East Asia region, Brunei’s fiscal regime type is Petroleum Sharing Contract, governed by Petroleum and Mining Law & Income Tax (Petroleum) Law as amended. The state oil company, BNPC has the option to participate up to 50% at any time before production start and they will repay its portion of past costs from its share of revenue. Royalty is 8% for oil and gas although royalty rate for gas may be different from oil. Cost recovery is calculated on a quarterly basis and the limits is assumed at 80% for oil and gas. All costs for operating, exploration and development are expensed. The unrecovered costs can be carried forward until fully recovered. Contractor’s share for profit oil is determined by the incremental sliding scale of the quarterly averaged production rate and the cumulative production of the field. Windfall Profit Sharing is levied when oil/gas price is higher than base price which 50% of Contractor’s Profit Revenue that excess the Contractor’s Profit revenue when calculated with the base prices. Income tax rate is 55% for petroleum industry. Exploration costs are expensed and losses can be carried forward for 6 years. Withholding tax rate is 20%. No ring fence for income tax. The figure 5 diagram shows the summary of Brunei PSC 2001.
Contractor’s Profit Oil (%)
Cum Production < 200 MMBBL
Cum Production > 200 MMBBL
Production Rate > 25,000 BPD 60 40 Production Rate 25,000 – 50,000 BPD
40 40
Production rate > 50,000 BPD 20 20
Contractor’s share for profit gas is determined by the cumulative production of the field.
Cum Production (TCF)
Contractor’s Profit Gas (%)
> 1.5 60 < 1.5 40
Vietnam The fiscal regime in Vietnam is Production Sharing Contract 1997 and its governing legislation is Petroleum Law 1993 (as amended) and the Petroleum Decree of 1996. PetroVietnam normally participates 15% upon commercial discovery carried through development and they repays Contractor for its exploration costs and carried development costs from a maximum of 60% of state share of revenue. Signature and Discovery bonuses are generally negotiable. Production bonuses are also negotiable and normally follows certain production rate limits (Production start, 25kboe/d, 75kboe/d, 100kboe/d and 150kboe/d). Royalty rate is determined by a production based scale as follows:-
Production Rate (BBL/D)
Royalty Rate (%)
0 – 50,000 8 50,000 – 75,000 10 75,000 – 100,000 15 100,000 – 150,000 20 >150,000 25
Production Rate (Mcf/D)
Royalty Rate (%)
0 – 177,000 8 177,000 – 354,000 10 >354,000 25
35% of revenue after royalty deduction is used for cost recovery. Unrecovered costs are carried forward indefinitely. Bonuses are not cost recoverable and all costs are recovered immediately. Profit share is determined by incremental production rate scale as follows:-
Oil Production Rate (BOE/D)
Contractor Share (%)
0 – 50,000 60 50,000 – 100,000 40 100,000 – 150,000 30 >150,000 20
The income tax rate is 50% and losses can be carried forward 5 years. Bonuses and fees and intangible costs are expensed. Withholding tax is 10% of After Tax Net Income which is also known as Transfer Tax. Ring fencing is within the block for cost recovery, profit sharing and taxes. The fiscal term in Vietnam Can be seen on Figure 6.
RESULT AND DISCUSSION From operator (Oil Company) perspectives, all of these countries have their own attractiveness. The followings is just a one of the operator perspectives how this country become a good place to invest. Assumptions and Methodology As mentioned in the earlier part of this paper, the main objective of this analysis is to compare fiscal regime and how Southeast Asia countries manage oil and gas resources through their fiscal regime mechanism. Analysis will be made on the countries’ benefits and attractiveness to foreign investors. Discounted Net Present Value, Rate of Return and PVI are several economic indicators used to assess the profitability of the project in each country. In order to give a comparable analysis between all the countries, certain assumptions have been made for the calculation. Series of cash flow models have been developed based on typical fields with the same production volumes, prices and cost structures using the generic model of the fiscal regime. The following are the assumptions used in the economic analysis: Field Size 141 MMBOE Peak production rate 175 MMSCFD Life of Field 22 YEARS Signature Bonus * 5 USD MM Discovery Bonus** 5 USD MM 2D Seismic 2 USD MM 3D Seismic 5 USD MM Exploration Wells 72.5 USD MM Development Drilling 79.4 USD MM Facilities 304.8 USD MM Operating Expenditure 305 USD MM Oil Price 60 USD/BBL Condensate Price 55 USD/BBL Gas Price 3.5 USD/MMBTU Note: * Not applicable to Malaysia as the signature and discovery
bonus are waived ** Only applicable to Vietnam PSC (1997) Results and Analysis The following table shows the results of the economic analysis by each country and the fiscal regime they represent.
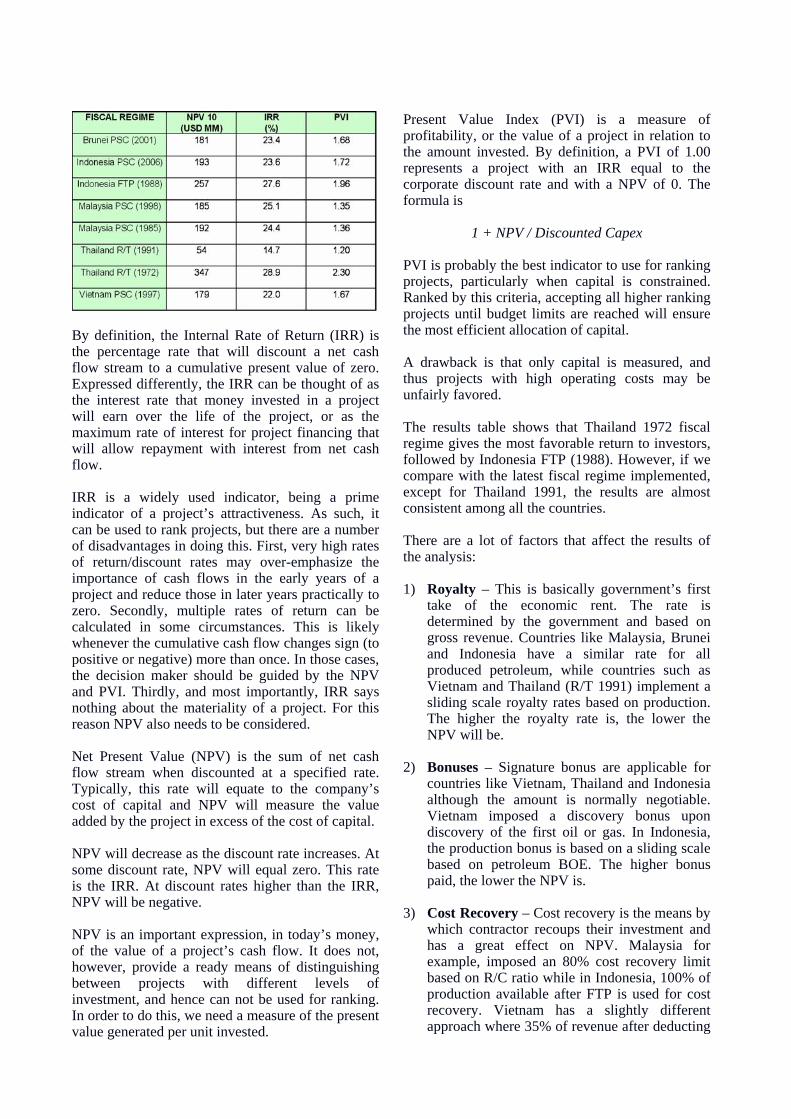
By definition, the Internal Rate of Return (IRR) is the percentage rate that will discount a net cash flow stream to a cumulative present value of zero. Expressed differently, the IRR can be thought of as the interest rate that money invested in a project will earn over the life of the project, or as the maximum rate of interest for project financing that will allow repayment with interest from net cash flow. IRR is a widely used indicator, being a prime indicator of a project’s attractiveness. As such, it can be used to rank projects, but there are a number of disadvantages in doing this. First, very high rates of return/discount rates may over-emphasize the importance of cash flows in the early years of a project and reduce those in later years practically to zero. Secondly, multiple rates of return can be calculated in some circumstances. This is likely whenever the cumulative cash flow changes sign (to positive or negative) more than once. In those cases, the decision maker should be guided by the NPV and PVI. Thirdly, and most importantly, IRR says nothing about the materiality of a project. For this reason NPV also needs to be considered. Net Present Value (NPV) is the sum of net cash flow stream when discounted at a specified rate. Typically, this rate will equate to the company’s cost of capital and NPV will measure the value added by the project in excess of the cost of capital. NPV will decrease as the discount rate increases. At some discount rate, NPV will equal zero. This rate is the IRR. At discount rates higher than the IRR, NPV will be negative. NPV is an important expression, in today’s money, of the value of a project’s cash flow. It does not, however, provide a ready means of distinguishing between projects with different levels of investment, and hence can not be used for ranking. In order to do this, we need a measure of the present value generated per unit invested.
Present Value Index (PVI) is a measure of profitability, or the value of a project in relation to the amount invested. By definition, a PVI of 1.00 represents a project with an IRR equal to the corporate discount rate and with a NPV of 0. The formula is
1 + NPV / Discounted Capex PVI is probably the best indicator to use for ranking projects, particularly when capital is constrained. Ranked by this criteria, accepting all higher ranking projects until budget limits are reached will ensure the most efficient allocation of capital. A drawback is that only capital is measured, and thus projects with high operating costs may be unfairly favored. The results table shows that Thailand 1972 fiscal regime gives the most favorable return to investors, followed by Indonesia FTP (1988). However, if we compare with the latest fiscal regime implemented, except for Thailand 1991, the results are almost consistent among all the countries. There are a lot of factors that affect the results of the analysis: 1) Royalty – This is basically government’s first
take of the economic rent. The rate is determined by the government and based on gross revenue. Countries like Malaysia, Brunei and Indonesia have a similar rate for all produced petroleum, while countries such as Vietnam and Thailand (R/T 1991) implement a sliding scale royalty rates based on production. The higher the royalty rate is, the lower the NPV will be.
2) Bonuses – Signature bonus are applicable for
countries like Vietnam, Thailand and Indonesia although the amount is normally negotiable. Vietnam imposed a discovery bonus upon discovery of the first oil or gas. In Indonesia, the production bonus is based on a sliding scale based on petroleum BOE. The higher bonus paid, the lower the NPV is.
3) Cost Recovery – Cost recovery is the means by
which contractor recoups their investment and has a great effect on NPV. Malaysia for example, imposed an 80% cost recovery limit based on R/C ratio while in Indonesia, 100% of production available after FTP is used for cost recovery. Vietnam has a slightly different approach where 35% of revenue after deducting
royalty is used for cost recovery. Revenues used for cost recovery will be limited by the cost recovery limit. Anything that is in excess of the limit is considered as profit and will be shared with the government.
4) Profit Split – This is split between the
contractor and government. Higher contractor profit split will gives higher NPV. Profit share in Vietnam and Brunei is determined by certain incremental production rate scale while in Malaysia, the contractor’s share of profit is determined by the contractor’s R factor and cumulative sales volume vs THV. The R factor calculation is the same that is used for Cost Recovery. In Indonesia, production remaining after FTP and Cost Recovery is shared between the government and contractor by the Before Tax Equity Split for each product. In concessionary system such as Thailand, cost recovery is similar to deductions in calculating the taxable income.
5) Income Tax – Income tax is one of the main
factor that impacts the NPV. The higher the income tax rate is, the lower the NPV will be. Brunei has the highest income tax rate of 55% as the country is solely dependent on their petroleum revenue. Thailand and Vietnam shares the same income tax rate of 50%, while Malaysia has the lowest income tax rate of 38%.
6) Others Fiscal factors – Besides all the factors
listed above, there are also terms which are unique to the country. Indonesia, for example, imposes Domestic Market Obligation (DMO) which starts 5 years from production start for each field, which will reduce contractor’s cash flow and NPV. In Malaysia, 10% export duty (imposed on exported products) will decrease the project NPV. In Thailand, the type of tax term has a big impact the Project NPV. Thailand (1972) falls under Thailand I tax regime while Thailand (1991) is governed by the Thailand III. Thailand I allows contractor to pay lesser income tax as royalty is tax creditable. Net take for Government is either greater or equal to contractor net take regardless of a fixed royalty rate or sliding scale applied. On the other hand, the introduction of Special Remuneration Benefit (SRB) and sliding scale royalty, which both treated as tax deductible in Thailand III, will enable the government to gain incremental earnings and greater net take, especially during the period of windfall profits linked to the economic environment. The SRB calculation in Thailand (1991) has a huge
impact to the NPV of the project , as seen in the results table as compared to Thailand (1972). The purpose of SRB is to pass to the Thai Government a share of the additional profits arising from substantial increases in prices of petroleum, bonanza discoveries and/or very low-cost discoveries.
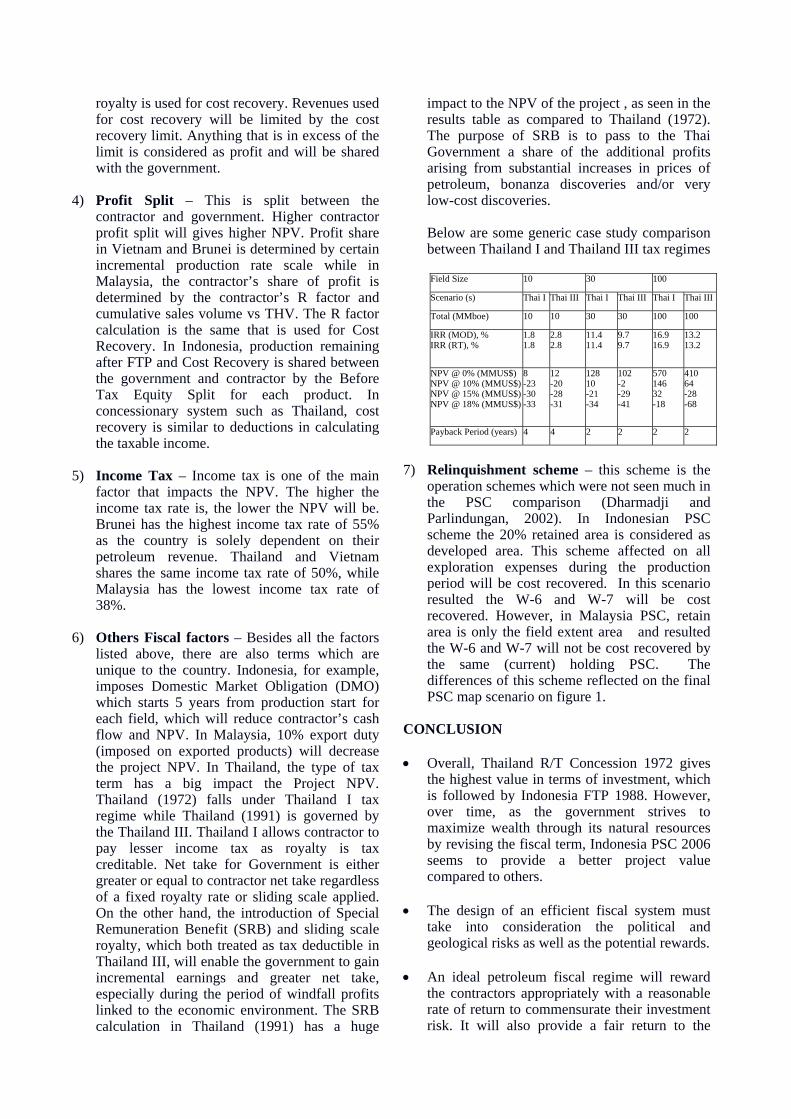
Below are some generic case study comparison between Thailand I and Thailand III tax regimes
Field Size 10 30 100
Scenario (s) Thai I Thai III Thai I Thai III Thai I Thai III
Total (MMboe) 10 10 30 30 100 100
IRR (MOD), % IRR (RT), %
1.8 1.8
2.8 2.8
11.4 11.4
9.7 9.7
16.9 16.9
13.2 13.2
NPV @ 0% (MMUS$) NPV @ 10% (MMUS$)NPV @ 15% (MMUS$)NPV @ 18% (MMUS$)
8 -23 -30 -33
12 -20 -28 -31
128 10 -21 -34
102 -2 -29 -41
570 146 32 -18
410 64 -28 -68
Payback Period (years) 4 4 2 2 2 2
7) Relinquishment scheme – this scheme is the
operation schemes which were not seen much in the PSC comparison (Dharmadji and Parlindungan, 2002). In Indonesian PSC scheme the 20% retained area is considered as developed area. This scheme affected on all exploration expenses during the production period will be cost recovered. In this scenario resulted the W-6 and W-7 will be cost recovered. However, in Malaysia PSC, retain area is only the field extent area and resulted the W-6 and W-7 will not be cost recovered by the same (current) holding PSC. The differences of this scheme reflected on the final PSC map scenario on figure 1.
CONCLUSION • Overall, Thailand R/T Concession 1972 gives
the highest value in terms of investment, which is followed by Indonesia FTP 1988. However, over time, as the government strives to maximize wealth through its natural resources by revising the fiscal term, Indonesia PSC 2006 seems to provide a better project value compared to others.
• The design of an efficient fiscal system must
take into consideration the political and geological risks as well as the potential rewards.
• An ideal petroleum fiscal regime will reward
the contractors appropriately with a reasonable rate of return to commensurate their investment risk. It will also provide a fair return to the

government in a systematic way. Activity is encouraged in low price environment and incentives are offered to exploit small and marginal field resources. Incremental investment is encouraged to maximize hydrocarbon recovery while providing a low risk investment environment.
• The attractiveness of countries in SEA
(Indonesia, Malaysia, Thailand, Brunei and Vietnam) are varies. Every country has a unique situation which may be addressed by the operators.
• Further studies with more detail in the fluid
type and other sensitivities will be more valuable for the government and company (operator) to have win-win situations.
REFERENCES Chandler and Thong-Ek, 2007, Thailand Petroleum Concessions , 2005, Accesses on internet http://www.ctlo.com/pub.htm Dharmadji T and Parlindungan T, 2002,.”Fiscal Regimes Competitiveness Comparison of Oil and Gas Producing Countries in the Asia Pacific Region: Australia, China, India, Indonesia and Malaysia”, Society of Petroleum Engineering. SPE 77912 Fugro Robertson Limited, Beardall Parry & Associates, 2006, “An Introduction to Upstream Petroleum Economics and Economic Aspects of Production Sharing Contracts”, Training material, FUGRO.
HESS, 2004, “Hess Exploration & Production Economics Manual”, Internal Hess manual book. Johnston, D, 1994, “International Petroleum Fiscal Systems and Production Sharing Contracts”, Penn Well Books, Tulsa, Oklahoma Ministry Regulations Announcements of the Department of Mineral Resources under the Petroleum Act and Ministerial Regulations The National Executive Council’s Decree Royal Decrees Notifications of the Director-General of Revenue under the Petroleum Income Tax Act. PETRONAS, 2007, Production Sharing Contracts, Corporate Website, Accesses on internet: http://www.petronas.com.my/internet/corp/centralrep2.nsf/frameset_corp?OpenFrameset Schlumberger, “Merak Fiscal Documentation of Brunei PSC (2001)”, Schlumberger manual book Schlumberger, ”Merak Fiscal Documentation of Malaysia PSC (1985) Schlumberger manual book Schlumberger, “Merak Fiscal Documentation of Indonesia FTP (1998)”, Schlumberger manual book Schlumberger, “Merak Fiscal Documentation of Indonesia PSC (2006)”, Schlumberger manualbook Schlumberger manual book Schlumberger, “Merak Fiscal Documentation of Malaysia PSC (1998) Schlumberger manual book Schlumberger, “Merak Fiscal Documentation of Thailand R/T (1971) Schlumberger manual book Schlumberger, “Merak Fiscal Documentation of Thailand R/T (1991), Schlumberger manual book

a. Model of orginal PSC area with lead prospect pattern distribution
Production Foreast
0
2000
4000
6000
8000
10000
12000
1 2 3 4 5 6 7 8 9 10 11 12 13 14
Production Year
Liqu
id R
ate,
bpd
0
25
50
75
100
125
150
Gas
Rat
e, b
btup
d
Liquid Rate Gas Rate
c. Production Forecast. Three fields developed (100, 30, and 10 MMBOE sizes)
Scenario Model : • Shallow water shelf type (mimics of Natuna and Sarawak
geological model) • Prospect numbering are based on pre-dilling speculative
resources. • Typical wet gas field productions rates
b. Post year 2000 field discoveries
Figure 1 - Scenario setting of the contract area and production forecast model.
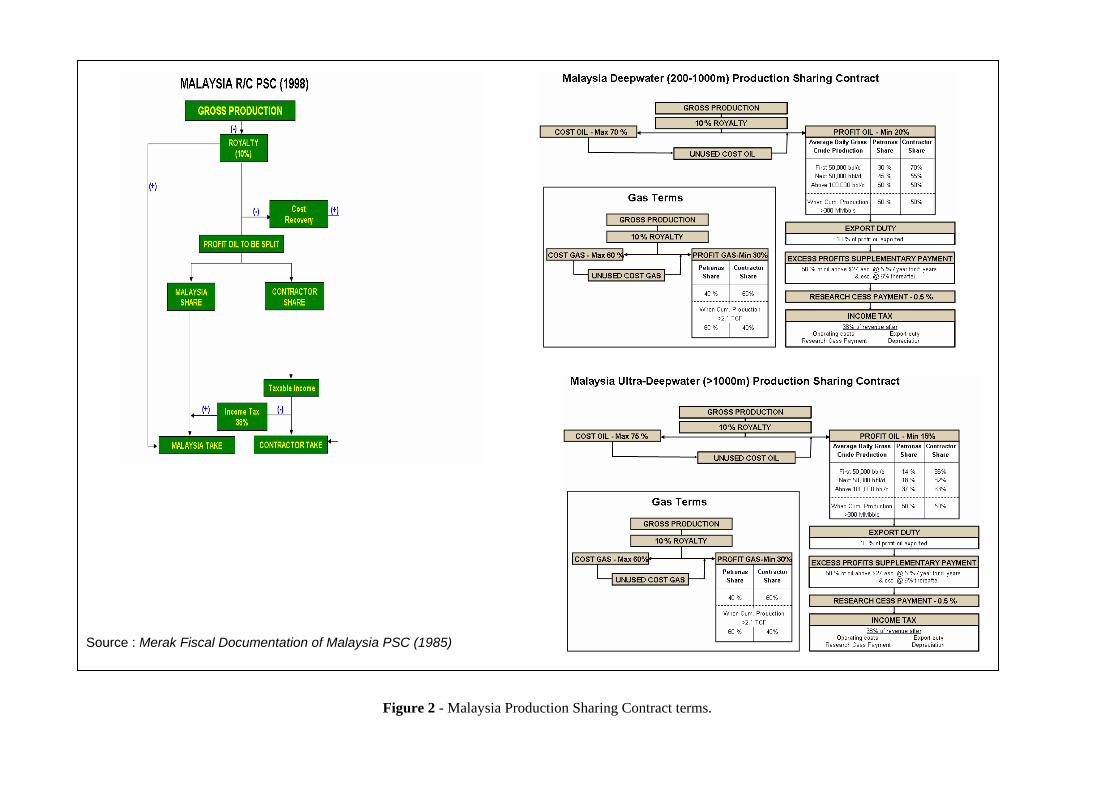
Source : Merak Fiscal Documentation of Malaysia PSC (1985)
Figure 2 - Malaysia Production Sharing Contract terms.
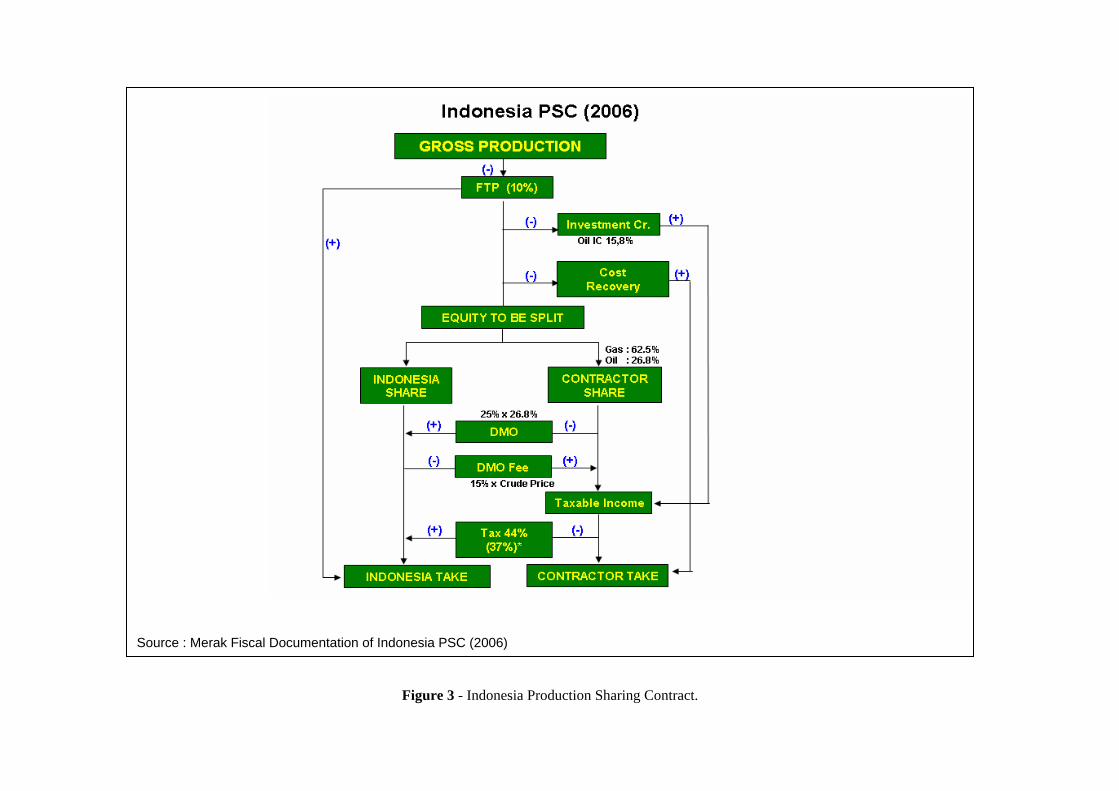
Figure 3 - Indonesia Production Sharing Contract.
Source : Merak Fiscal Documentation of Indonesia PSC (2006)
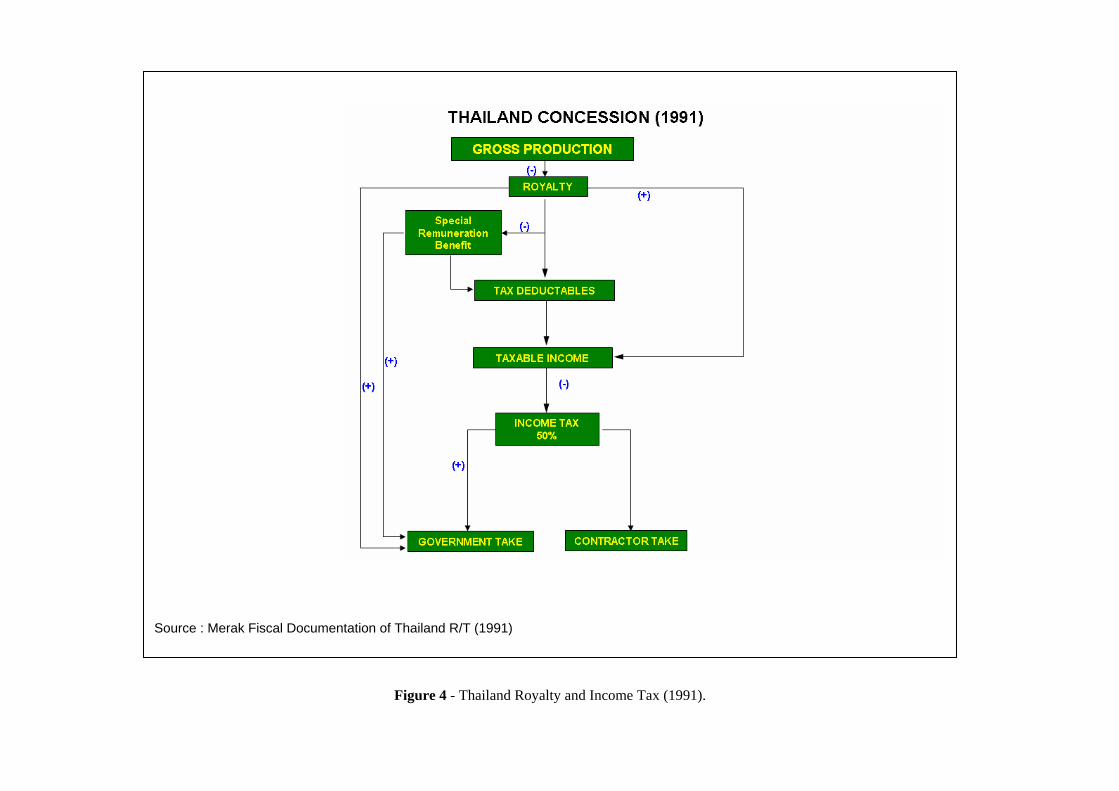
Figure 4 - Thailand Royalty and Income Tax (1991).
Source : Merak Fiscal Documentation of Thailand R/T (1991)

Figure 5 - Brunei Production Sharing Contract.
Source : Merak Fiscal Documentation of Brunei PSC (2001)

Figure 6 - Vietnam Production Sharing Contract.
Source : Merak Fiscal Documentation of Vietnam PSC (1997)

Figure 7 - Summary of fiscal comparisons.
Note (assumption) : • Brunei current opportunity is mostly in the deepwater area which may not reflected in this comparison on the field sizes. • Indonesia has many types of area of opportunities, the Pertamina KSO was not included in this study • Malaysia PSC considered that the well 6 and 7 were in separated contract • Hess currently hold one PSC based on the Thailand R/T (1972)
Summary of fiscal comparisons
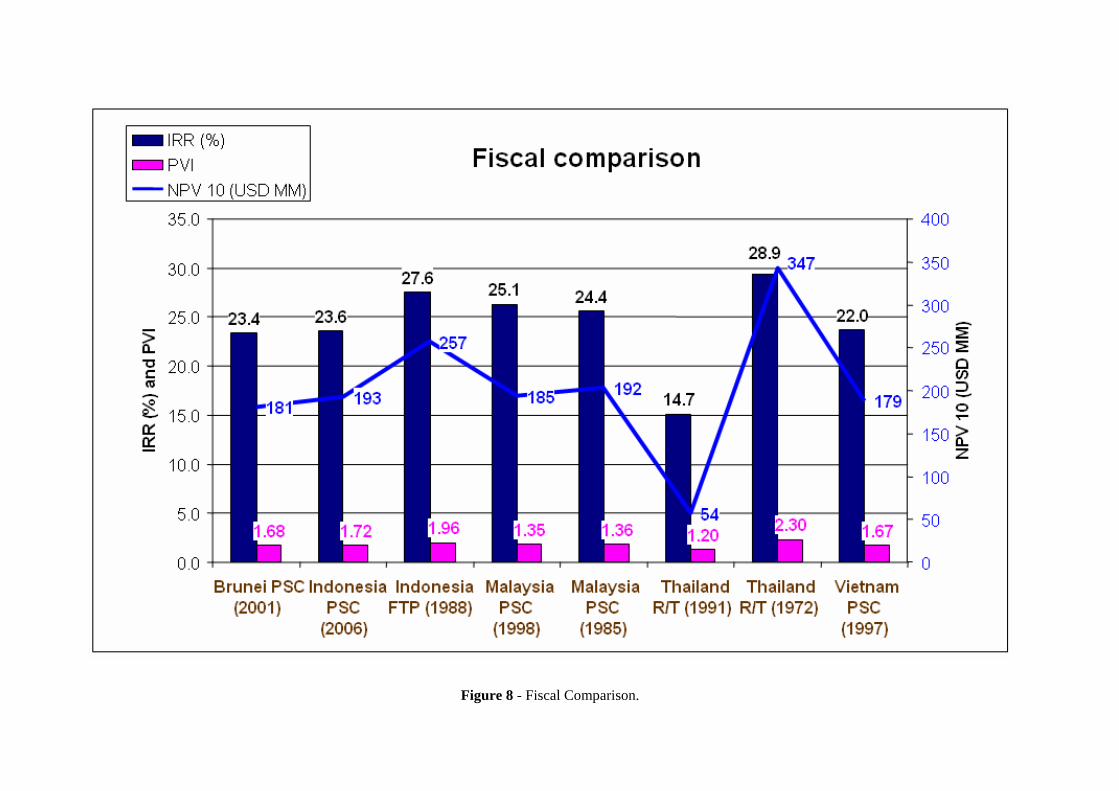
Figure 8 - Fiscal Comparison.
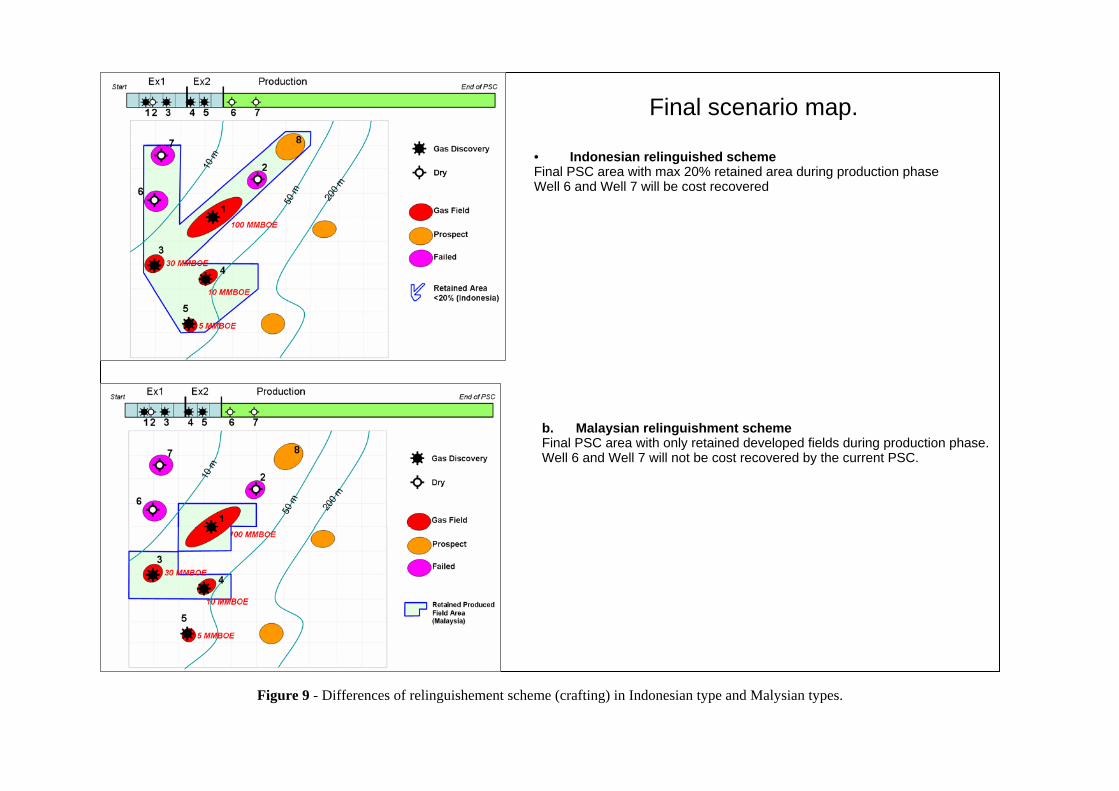
Figure 9 - Differences of relinguishement scheme (crafting) in Indonesian type and Malysian types.
• Indonesian relinguished schemeFinal PSC area with max 20% retained area during production phase Well 6 and Well 7 will be cost recovered
b. Malaysian relinguishment schemeFinal PSC area with only retained developed fields during production phase. Well 6 and Well 7 will not be cost recovered by the current PSC.
Final scenario map.