psd interactive data analysis and plotting web pages: http
TRANSCRIPT
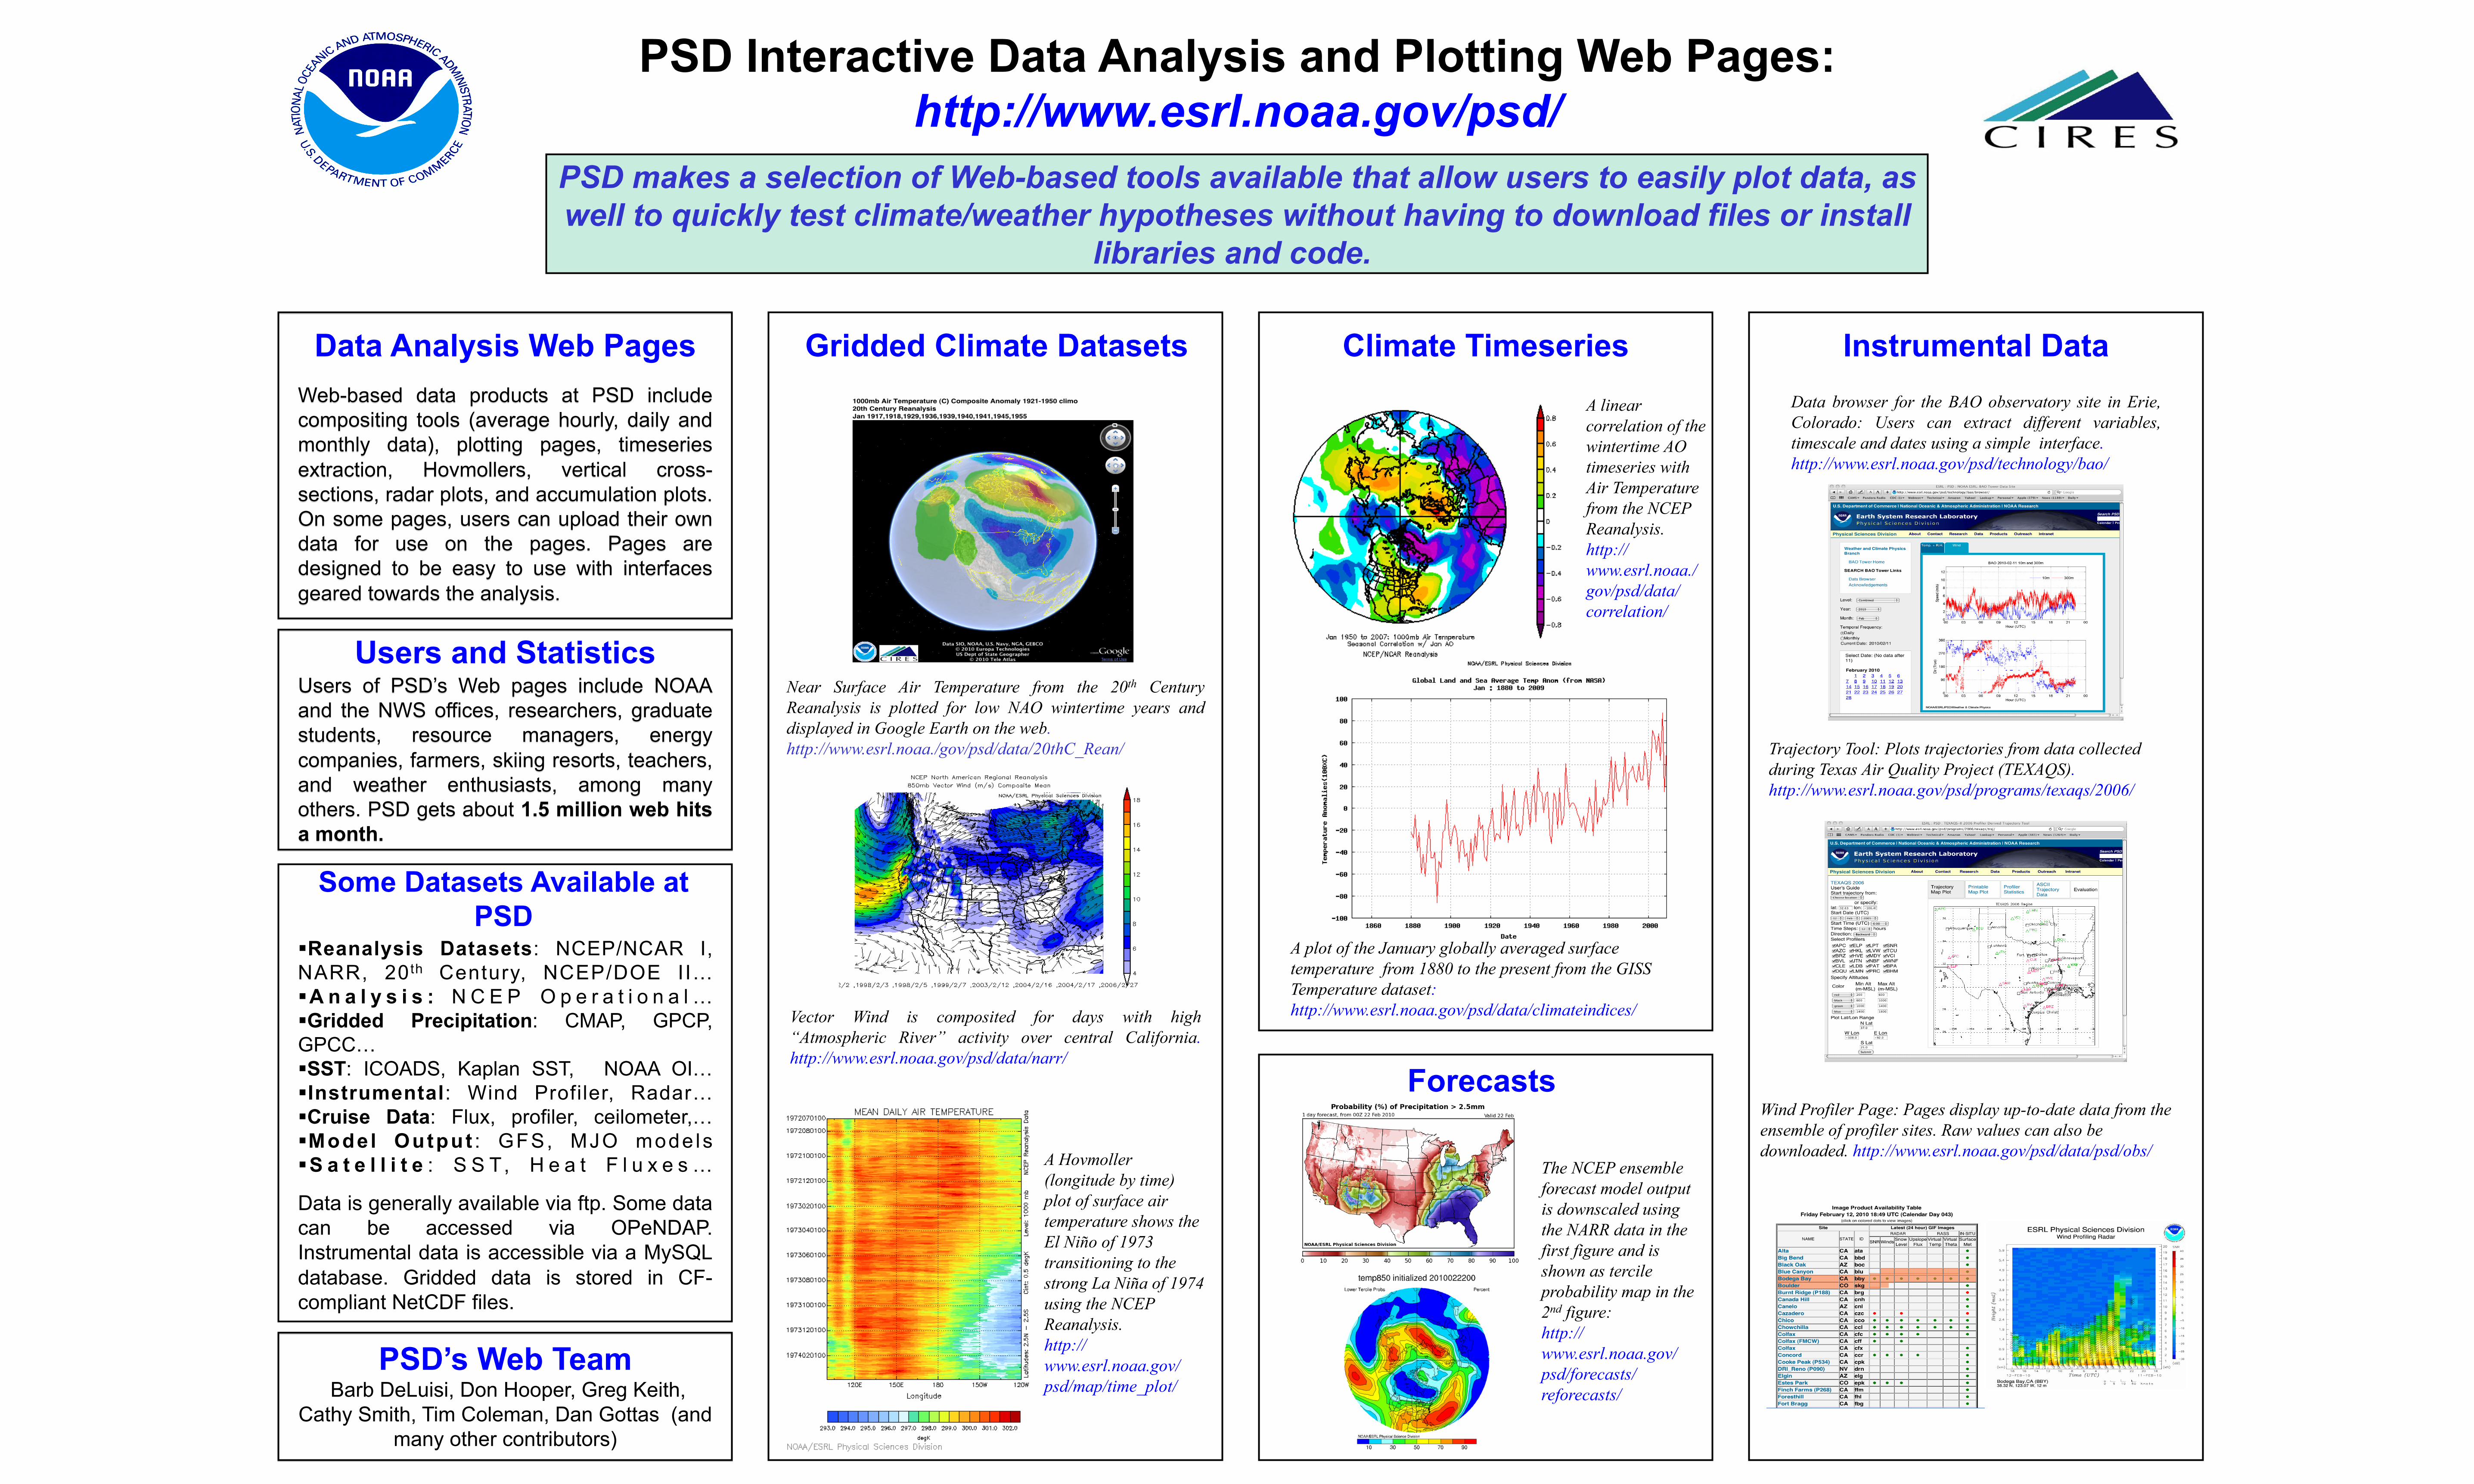
PSD Interactive Data Analysis and Plotting Web Pages: http://www.esrl.noaa.gov/psd/
Instrumental Data Data browser for the BAO observatory site in Erie, Colorado: Users can extract different variables, timescale and dates using a simple interface. http://www.esrl.noaa.gov/psd/technology/bao/
Trajectory Tool: Plots trajectories from data collected during Texas Air Quality Project (TEXAQS). http://www.esrl.noaa.gov/psd/programs/texaqs/2006/
Wind Profiler Page: Pages display up-to-date data from the ensemble of profiler sites. Raw values can also be downloaded. http://www.esrl.noaa.gov/psd/data/psd/obs/
PSD makes a selection of Web-based tools available that allow users to easily plot data, as well to quickly test climate/weather hypotheses without having to download files or install
libraries and code.
Gridded Climate Datasets
Near Surface Air Temperature from the 20th Century Reanalysis is plotted for low NAO wintertime years and displayed in Google Earth on the web. http://www.esrl.noaa./gov/psd/data/20thC_Rean/
Vector Wind is composited for days with high “Atmospheric River” activity over central California. http://www.esrl.noaa.gov/psd/data/narr/
A Hovmoller (longitude by time) plot of surface air temperature shows the El Niño of 1973 transitioning to the strong La Niña of 1974 using the NCEP Reanalysis. http://www.esrl.noaa.gov/psd/map/time_plot/
Forecasts
Climate Timeseries A linear correlation of the wintertime AO timeseries with Air Temperature from the NCEP Reanalysis. http://www.esrl.noaa./gov/psd/data/correlation/
A plot of the January globally averaged surface temperature from 1880 to the present from the GISS Temperature dataset: http://www.esrl.noaa.gov/psd/data/climateindices/
The NCEP ensemble forecast model output is downscaled using the NARR data in the first figure and is shown as tercile probability map in the 2nd figure: http://www.esrl.noaa.gov/psd/forecasts/reforecasts/
Some Datasets Available at PSD
Reanalysis Datasets: NCEP/NCAR I, NARR, 20th Century, NCEP/DOE II… A n a l y s i s : N C E P O p e r a t i o n a l … Gridded Precipitation: CMAP, GPCP, GPCC… SST: ICOADS, Kaplan SST, NOAA OI… Instrumental: Wind Profiler, Radar… Cruise Data: Flux, profiler, ceilometer,… Model Output : GFS, MJO mode ls S a t e l l i t e : S S T, H e a t F l u x e s …
Data is generally available via ftp. Some data can be accessed via OPeNDAP. Instrumental data is accessible via a MySQL database. Gridded data is stored in CF-compliant NetCDF files.
PSD’s Web Team Barb DeLuisi, Don Hooper, Greg Keith,
Cathy Smith, Tim Coleman, Dan Gottas (and many other contributors)
Web-based data products at PSD include compositing tools (average hourly, daily and monthly data), plotting pages, timeseries extraction, Hovmollers, vertical cross-sections, radar plots, and accumulation plots. On some pages, users can upload their own data for use on the pages. Pages are designed to be easy to use with interfaces geared towards the analysis.
Data Analysis Web Pages
Users of PSD’s Web pages include NOAA and the NWS offices, researchers, graduate students, resource managers, energy companies, farmers, skiing resorts, teachers, and weather enthusiasts, among many others. PSD gets about 1.5 million web hits a month.
Users and Statistics