psg banking review - 2016 - banking... · 2016-12-12 · annual inflation rate was estimated at...
TRANSCRIPT
P a g e | 0
PSG BANKING REVIEW
- 2016
DECEMBER 2016

P a g e | 1
PSG Wealth Management (Namibia) (Pty) Ltd
Table of contents
Introduction ................................................................................................................................................................. 3
Executive Summary ...................................................................................................................................................... 4
PSG - Ranking the Local Banks ....................................................................................................................................... 5
Nature of business ....................................................................................................................................................... 7
Local Banks ............................................................................................................................................................................ 7
SA Banks ................................................................................................................................................................................. 8
Botswana Banks ..................................................................................................................................................................... 9
Zambian Banks ....................................................................................................................................................................... 9
Economic Review and Outlook .................................................................................................................................... 10
Real Economic Growth ........................................................................................................................................................ 10
Namibian Inflation ............................................................................................................................................................... 10
Private Sector Credit Extension (PSCE) ................................................................................................................................ 11
Monetary Policy ................................................................................................................................................................... 11
Local Banks - Financial Results Review ........................................................................................................................ 12
CGP ...................................................................................................................................................................................... 12
FNB ....................................................................................................................................................................................... 12
NED ...................................................................................................................................................................................... 13
SBNH .................................................................................................................................................................................... 13
Balance Sheet ............................................................................................................................................................ 14
Bank Assets .......................................................................................................................................................................... 14
Gross Advances .................................................................................................................................................................... 15
Growth by Loan Category – Local Banks .............................................................................................................................. 16
Mortgage Loans ................................................................................................................................................................... 17
Term Loans and Overdrafts ................................................................................................................................................. 20
Instalment Sales and Leases ................................................................................................................................................ 21
Deposits ..................................................................................................................................................................... 22
Total Revenue ............................................................................................................................................................ 23
Net Interest Income (NI) ...................................................................................................................................................... 23
Non-Interest Revenue (NIR)................................................................................................................................................. 24
Non-Interest Revenue as % of Operating Cost .................................................................................................................... 26
Fee and Commission (F&C) Income ..................................................................................................................................... 26
Cost Measures ........................................................................................................................................................... 27
Operating Expenditure (Opex) ............................................................................................................................................. 27
Opex vs. Asset Growth ............................................................................................................................................... 28
Local Banks .......................................................................................................................................................................... 28
SA Banks ............................................................................................................................................................................... 29
Cost-to-Income .......................................................................................................................................................... 31

P a g e | 2
PSG Wealth Management (Namibia) (Pty) Ltd
Staff Cost ................................................................................................................................................................... 33
Staff Cost per Employee ...................................................................................................................................................... 34
Staff Cost as % of Total Revenue – Compensation Ratio ..................................................................................................... 35
Staff Cost as % of Net Interest Income ................................................................................................................................ 36
Profitability ................................................................................................................................................................ 37
Net Profit per Employee ...................................................................................................................................................... 37
Earnings Growth .................................................................................................................................................................. 37
Earnings per Share (EPS) ...................................................................................................................................................... 39
Dividend Payout ................................................................................................................................................................... 40
Return on Average Assets (ROA) ................................................................................................................................. 42
ROA – 2 Factor Du Pont Analysis ......................................................................................................................................... 43
Return on Average Equity (ROE) .................................................................................................................................. 45
ROE Du Pont Analysis ........................................................................................................................................................... 47
Lending Rates ............................................................................................................................................................. 51
Deposit Rates ............................................................................................................................................................. 52
Interest Rate Spread ................................................................................................................................................... 53
Net Interest Margins (NIM) ......................................................................................................................................... 54
Loan-to-Deposit (LTD) Ratio ................................................................................................................................................ 57
Liquid Assets to Deposit (LADST) ......................................................................................................................................... 60
Credit Risk .................................................................................................................................................................. 61
Credit Loss Ratio .................................................................................................................................................................. 61
Non-Performing Loans (NPL’s) ............................................................................................................................................. 62
Provision for Bad Debts ....................................................................................................................................................... 63
Gross Coverage (Provision % of NPL) ................................................................................................................................... 65
Valuation ................................................................................................................................................................... 67
Annexure 1: Definitions .............................................................................................................................................. 69
Annexure 2: Rating and Ratio Definitions .................................................................................................................... 70
Annexure 3: Financial Data ......................................................................................................................................... 71
P a g e | 3
PSG Wealth Management (Namibia) (Pty) Ltd
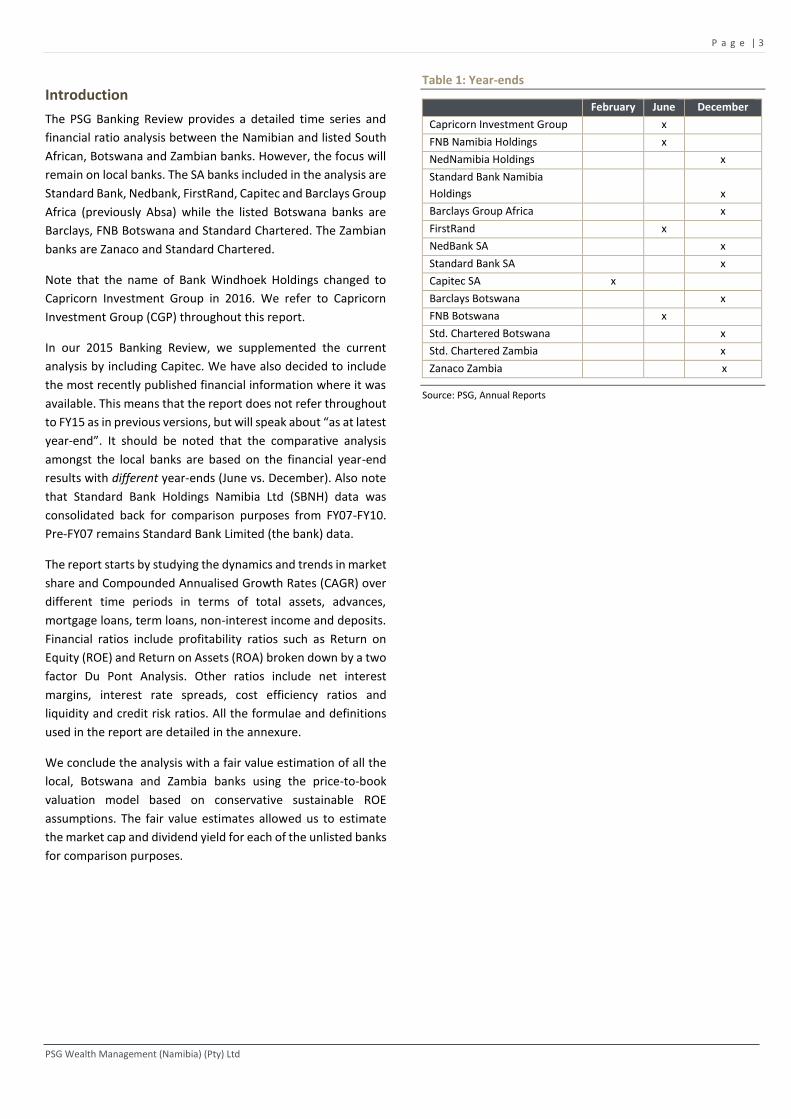
Introduction
The PSG Banking Review provides a detailed time series and
financial ratio analysis between the Namibian and listed South
African, Botswana and Zambian banks. However, the focus will
remain on local banks. The SA banks included in the analysis are
Standard Bank, Nedbank, FirstRand, Capitec and Barclays Group
Africa (previously Absa) while the listed Botswana banks are
Barclays, FNB Botswana and Standard Chartered. The Zambian
banks are Zanaco and Standard Chartered.
Note that the name of Bank Windhoek Holdings changed to
Capricorn Investment Group in 2016. We refer to Capricorn
Investment Group (CGP) throughout this report.
In our 2015 Banking Review, we supplemented the current
analysis by including Capitec. We have also decided to include
the most recently published financial information where it was
available. This means that the report does not refer throughout
to FY15 as in previous versions, but will speak about “as at latest
year-end”. It should be noted that the comparative analysis
amongst the local banks are based on the financial year-end
results with different year-ends (June vs. December). Also note
that Standard Bank Holdings Namibia Ltd (SBNH) data was
consolidated back for comparison purposes from FY07-FY10.
Pre-FY07 remains Standard Bank Limited (the bank) data.
The report starts by studying the dynamics and trends in market
share and Compounded Annualised Growth Rates (CAGR) over
different time periods in terms of total assets, advances,
mortgage loans, term loans, non-interest income and deposits.
Financial ratios include profitability ratios such as Return on
Equity (ROE) and Return on Assets (ROA) broken down by a two
factor Du Pont Analysis. Other ratios include net interest
margins, interest rate spreads, cost efficiency ratios and
liquidity and credit risk ratios. All the formulae and definitions
used in the report are detailed in the annexure.
We conclude the analysis with a fair value estimation of all the
local, Botswana and Zambia banks using the price-to-book
valuation model based on conservative sustainable ROE
assumptions. The fair value estimates allowed us to estimate
the market cap and dividend yield for each of the unlisted banks
for comparison purposes.
Table 1: Year-ends
February June December
Capricorn Investment Group x
FNB Namibia Holdings x
NedNamibia Holdings x
Standard Bank Namibia
Holdings
x
Barclays Group Africa x
FirstRand x
NedBank SA x
Standard Bank SA x
Capitec SA x
Barclays Botswana x
FNB Botswana x
Std. Chartered Botswana x
Std. Chartered Zambia x
Zanaco Zambia x
Source: PSG, Annual Reports
P a g e | 4
PSG Wealth Management (Namibia) (Pty) Ltd
Executive Summary
While profitability remains one of the most important goals of
banks, the efficient provision of financial services through banks
is also critical, especially for a country’s economic growth and
development. A stable and efficient banking system is vital to
provide financial services while having the capability of
absorbing unforeseen shocks through effective risk, credit and
liquidity management. While this study addresses profitability,
more importantly, it enables us to measure the bank’s overall
performance and soundness by identifying their strengths and
weaknesses in terms of other metrics such as liquidity and credit
risk policies. However, it is worthy to note that ratio analysis has
it shortcomings in that it is backward looking, instead of forward
looking.
Economic growth slowed sharply in 2016. The NSA estimates
real GDP growth at -1.2% y-o-y in Q2, down from 3.4% y-o-y in
Q1 2016. The negative growth is mainly attributable to sharp
contractions in real value added recorded by the construction (-
19.9% y-o-y), mining & quarrying (-13.2% y-o-y) and hotels &
restaurants (-15.5% y-o-y) sectors.
Private sector credit extension (PSCE) growth declined in
October, mainly as a result of a decline in demand for credit
from the corporate sector. PSCE growth decreased from 11.1%
y-o-y in September to 10.2% y-o-y in October, therefore,
remaining on a broadly downward trend since March 2015. The
annual inflation rate was estimated at 7.3% y-o-y in October,
higher than the 6.9% y-o-y increase recorded in September and
the highest annual inflation rate since November 2012. The
Namibia prime lending rate increased from 9.75% in January
2015 to 10.75% in December 2016.
In our ranking of the Namibian banks, FNB retains its first place
and all of the other rankings remain the same as well. This is
despite SBNH making up a lot of ground with improvements in
credit risk and cost efficiency. What also emerge from the
analysis is that the two listed banks stand out in terms of ROA.
While the unlisted banks are slightly lagging in terms of this
metric, SBNH have increased ROE significantly over the last
year. In terms of profitability, CGP slid during the last year due
to SBNH and NED outperforming them in 3-year EPS CAGR. NED,
however deteriorated significantly in terms of credit risk due to
worsening credit loss ratios.
Local bank assets made up 69.3% of GDP as at December 2015,
re-iterating the big role it plays it the Namibian economy.
Advances growth remained strong for the local banks at
between 11.6% and 18.3%.
Our finding, based from a range of performance ratios is that
the local banks remain sound in terms of profitability and capital
adequacy with high-quality liquid assets. On the credit risk side,
credit loss ratios remain low. As mentioned last year, we are
concerned about the increasing ratio of the mortgage loan
books that are in early arrears. This is a trend at all the local
banks and it has begun to filter through to impairments.
Although some of the banks experienced margin pressure over
the last 5 years, net interest margins (NIM) have been resilient,
and local banks have benefitted from the rising interest rate
environment. Credit risk did deteriorate slightly, but credit
losses are still well below industry accepted levels. All the local
banks reported double digit annualised compounded growth in
earnings over the last three years, but we could see this taper
as advances growth slows in the challenging economic
environment.
The SA banks experienced mixed results in their EPS growth
numbers over the last year but NPL ratios continue to gradually
improve. Operational expenses growth outpacing asset growth
for most of the SA banks over 5 years creates challenges.
Besides Capitec, SBK SA and BGA are the only banks which grew
assets ahead of opex marginally over 5 years. Credit quality for
the SA banks has remained good. Drawing a comparison
between local banks and SA banks, the analysis reflects the
superior net interest margins, ROE, ROA and credit quality of
local banks for the last year, but the trend is that SA banks’
credit quality is improving, while the Namibian banks are seeing
headwinds.
The two listed Zambian banks have suffered severely over the
last year with earnings declining at double digit rates attributed
to high operating cost and low revenue growth. Cost-to-income
ratios for both banks have increased, but Standard Chartered
Zambia did grow assets ahead of the operating costs. ROE
declined for both banks despite the increase in interest rates in
Zambia. The Zambian banking system is under severe pressure,
and Zanaco specifically have experienced a spike in NPLs. From
the performance metrics broadly, it looks like Standard
Chartered is more resilient in these tough times.
The Botswana banks saw earnings decline by more than 20%
over the last year. Standard Chartered Botswana performed the
worst with earnings declining by 85%. Botswana banks
generally have higher NIM than local and SA banks. These
margins have come under severe pressure with the declining
interest rates in Botswana. Net interest income took a huge hit
for all the Botswana banks. These banks reported NIMs of
between 6.7% and 8.0% in FY13, but this has reduced to 4.0%
to 7.0%.
The outlook for local banks remain positive, although there will
be a period of slower growth and increased credit losses over
the next 18 to 24 months. They remain profitable, well
capitalised with acceptable credit quality.
P a g e | 5
PSG Wealth Management (Namibia) (Pty) Ltd
PSG - Ranking the Local Banks
To evaluate and compare the local banks we developed a
ranking system based on several of the ratios and data
contained in this report whereby we rank the four local banks
from “1” to “4”, with 1 being the best and 4 the worst. The
ranking system consist of 5 categories namely profitability, cost
efficiency, credit risk, advances growth & market share and
capital adequacy. In this report, financial ratios were based on
the most recent financial statement data and all compounded
growth numbers on three years to represent the category. Each
category and sub-category is assigned a weighting based on our
opinion of the relative importance of each in order to determine
the ranking for each bank.
Under the ranking system, a greater emphasis is placed on
profitability and credit risk, these two categories account for
50% of the total weighting. We allocated a weight of 20% each
to advances and cost efficiency categories whilst the capital
adequacy category represents 10% of the total weighting. The
categories and sub-categories and the respective weights are
shown in the table 2 below.
Table 2: Category and sub-category weights
Category Category
weight
Sub-category
Weight
Profitability 25%
EPS (CAGR) 30%
NIM 15%
NIR (CAGR) 15%
ROA 10%
ROE 30%
Advances 20%
Market share 40%
Advances Growth (CAGR) 60%
Cost efficiency 20%
Cost-to-income ratio 50%
Opex (CAGR) 20%
Asset vs. Opex (CAGR) 30%
Credit Risk 25%
Credit loss Ratio 60%
NPL/Gross Advances 40%
Capital adequacy 10% 100%
Source: PSG
Within the profitability category EPS growth and ROE were
assigned more weight relative to the other profitability metrics
mainly due to the importance attached to it in the valuation
process and since they represent how successful a bank’s
strategies are implemented. Similarly, the cost-to-income ratio
carries the biggest weight in its category. The credit loss ratio
has been assigned 60% of the weight in the credit risk category
because we regard actual impairment of advances more
important than NPLs that can still become performing loans.
This is the ratio of bad debt to average gross advances.
The ranking system does not consider liquidity ratios since the
optimal liquidity ratio will differ between banks depending on
the risk profile and is open for interpretation. Moreover, there
is a fine line between too much liquidity and too little making
ranking banks according to this metric problematic. While
service delivery could play a significant role in the rankings it
was not included in the ranking system given the subjective
nature of assigning a rating. We opt to include market share and
advances growth which to some extent is an indication of
service delivery since a bank with poor service will find it
difficult to grow or maintain market share.
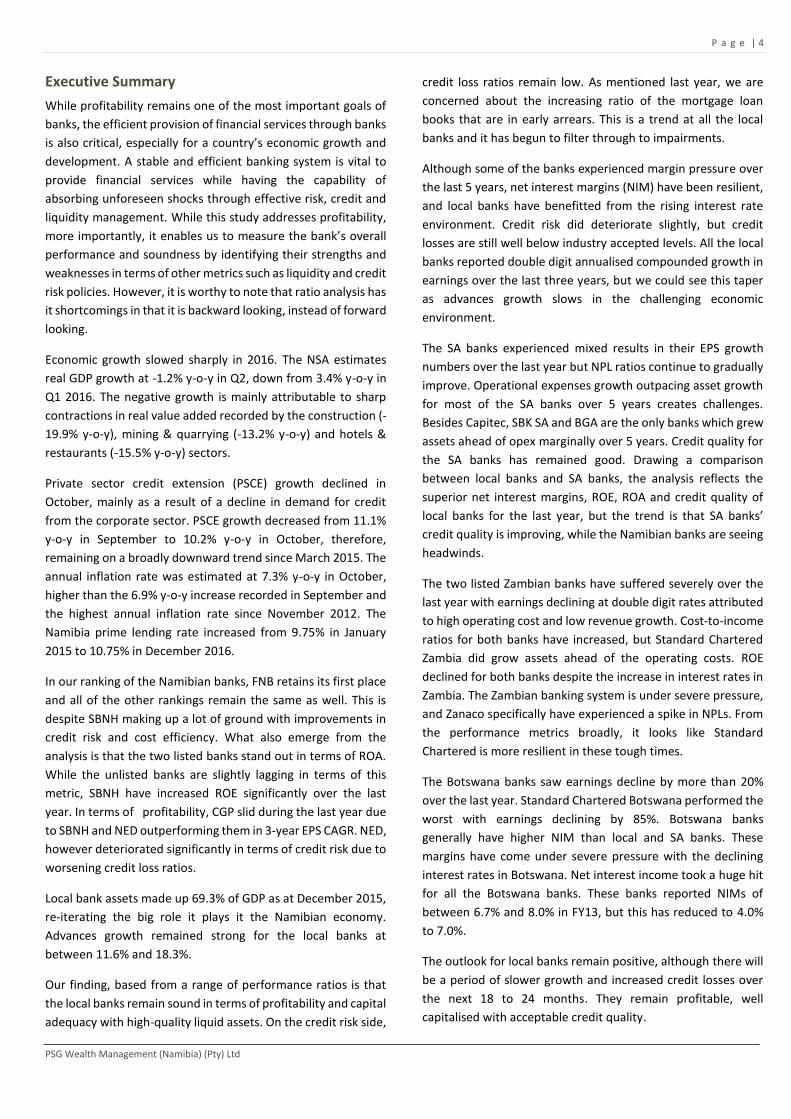
We rank FNB the best bank in Namibia as it performed best
overall in the weighted score assigned to 13 sub-categories.
Table 3: Weighted ranking by category
FNB NED SBNH CGP
Profitability 1.3 3.7 2.1 2.9
Advances 1.4 2.8 3.6 2.2
Cost efficiency 1.8 2.0 3.8 2.4
Credit risk 1.0 3.2 3.4 2.4
Capital adequacy 1.0 4.0 3.0 2.0
Overall rating 1.3 3.1 3.2 2.4
Overall ranking 1.0 3.0 4.0 2.0
Source: PSG
Table 4 shows the detail of the performance metrics for each
bank by category and sub-category.
Table 4: Performance metrics
Category Weighted Score
FNB NED SBNH CGP
Profitability
EPS (CAGR) 26.8% 19.6% 20.2% 18.6%
NIM 5.4% 4.8% 5.9% 5.1%
NIR (CAGR) 20.2% 12.5% 19.0% 22.2%
ROA 3.7% 2.1% 2.3% 3.0%
ROE 32.7% 15.4% 23.4% 22.9%
Total score 1.3 3.7 2.1 2.9
Advances
Market share 32.2% 12.7% 22.1% 33.0%
Growth (CAGR) 17.9% 17.4% 11.8% 15.8%
Total score 1.4 2.8 3.6 2.2
Cost efficiency
Cost-to-income ratio 43.6% 59.6% 60.9% 50.2%
Opex (CAGR) 14.5% 11.7% 14.8% 15.7%
Asset vs. Opex (CAGR) 1.8% 4.4% -0.3% 2.2%
Total score 1.8 2.0 3.8 2.4
Credit Risk
Credit loss Ratio 0.23% 0.58% 0.52% 0.24%
NPL/Gross Advances 1.0% 1.0% 2.9% 1.4%
Total score 1.0 3.2 3.4 2.4
Capital adequacy 17.8% 14.3% 15.6% 15.8%
Overall Score 1.3 3.1 3.2 2.4
Source: PSG
P a g e | 6
PSG Wealth Management (Namibia) (Pty) Ltd
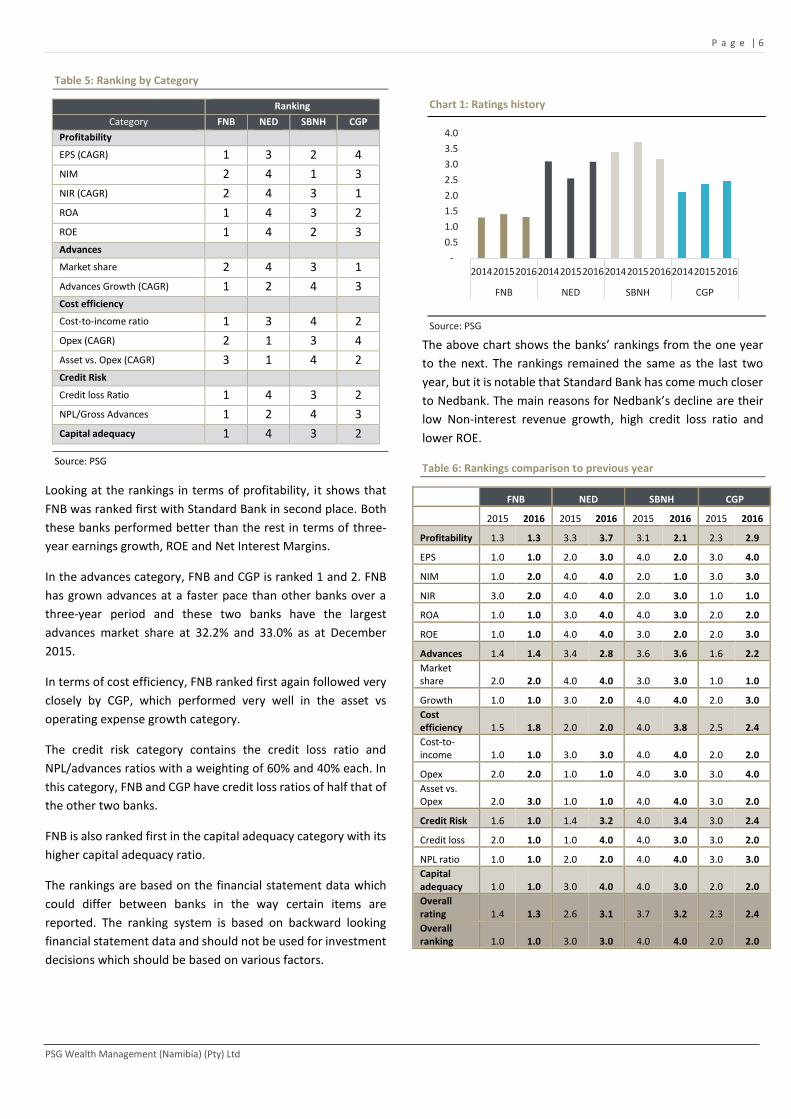
Table 5: Ranking by Category
Ranking
Category FNB NED SBNH CGP
Profitability
EPS (CAGR) 1 3 2 4
NIM 2 4 1 3
NIR (CAGR) 2 4 3 1
ROA 1 4 3 2
ROE 1 4 2 3
Advances
Market share 2 4 3 1
Advances Growth (CAGR) 1 2 4 3
Cost efficiency
Cost-to-income ratio 1 3 4 2
Opex (CAGR) 2 1 3 4
Asset vs. Opex (CAGR) 3 1 4 2
Credit Risk
Credit loss Ratio 1 4 3 2
NPL/Gross Advances 1 2 4 3
Capital adequacy 1 4 3 2
Source: PSG
Looking at the rankings in terms of profitability, it shows that
FNB was ranked first with Standard Bank in second place. Both
these banks performed better than the rest in terms of three-
year earnings growth, ROE and Net Interest Margins.
In the advances category, FNB and CGP is ranked 1 and 2. FNB
has grown advances at a faster pace than other banks over a
three-year period and these two banks have the largest
advances market share at 32.2% and 33.0% as at December
2015.
In terms of cost efficiency, FNB ranked first again followed very
closely by CGP, which performed very well in the asset vs
operating expense growth category.
The credit risk category contains the credit loss ratio and
NPL/advances ratios with a weighting of 60% and 40% each. In
this category, FNB and CGP have credit loss ratios of half that of
the other two banks.
FNB is also ranked first in the capital adequacy category with its
higher capital adequacy ratio.
The rankings are based on the financial statement data which
could differ between banks in the way certain items are
reported. The ranking system is based on backward looking
financial statement data and should not be used for investment
decisions which should be based on various factors.
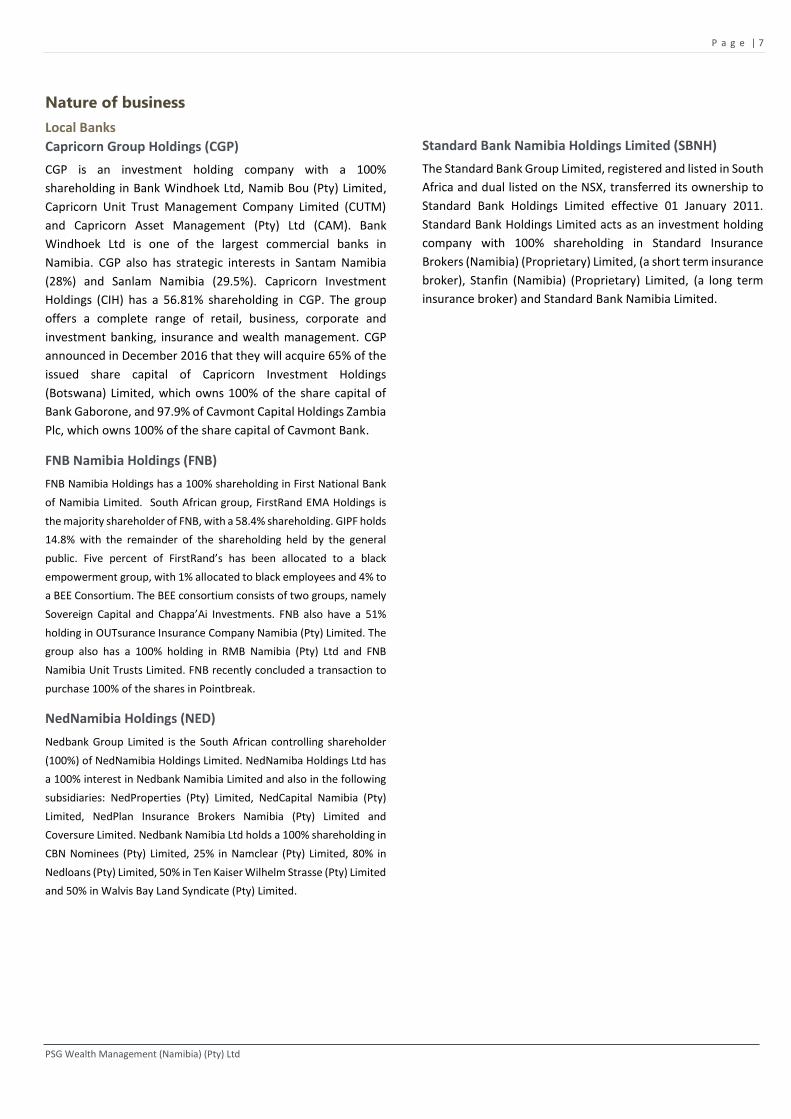
Chart 1: Ratings history
Source: PSG
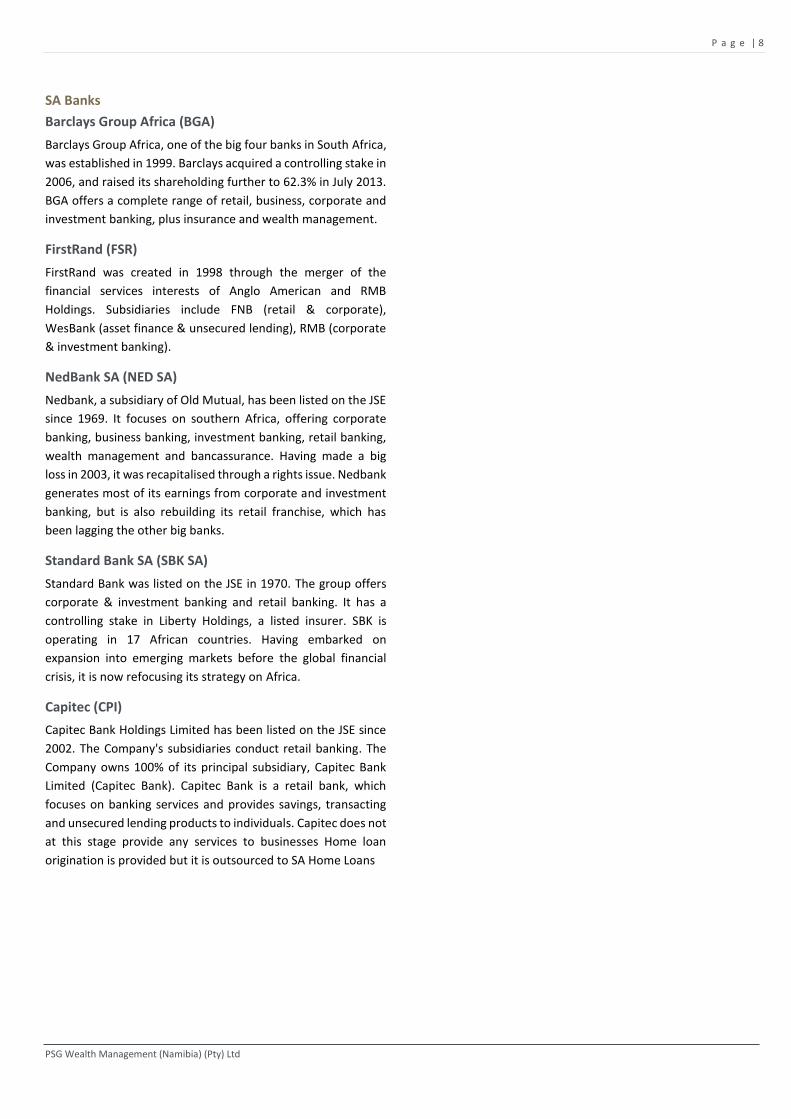
The above chart shows the banks’ rankings from the one year
to the next. The rankings remained the same as the last two
year, but it is notable that Standard Bank has come much closer
to Nedbank. The main reasons for Nedbank’s decline are their
low Non-interest revenue growth, high credit loss ratio and
lower ROE.
Table 6: Rankings comparison to previous year
FNB NED SBNH CGP
2015 2016 2015 2016 2015 2016 2015 2016
Profitability 1.3 1.3 3.3 3.7 3.1 2.1 2.3 2.9
EPS 1.0 1.0 2.0 3.0 4.0 2.0 3.0 4.0
NIM 1.0 2.0 4.0 4.0 2.0 1.0 3.0 3.0
NIR 3.0 2.0 4.0 4.0 2.0 3.0 1.0 1.0
ROA 1.0 1.0 3.0 4.0 4.0 3.0 2.0 2.0
ROE 1.0 1.0 4.0 4.0 3.0 2.0 2.0 3.0
Advances 1.4 1.4 3.4 2.8 3.6 3.6 1.6 2.2
Market share 2.0 2.0 4.0 4.0 3.0 3.0 1.0 1.0
Growth 1.0 1.0 3.0 2.0 4.0 4.0 2.0 3.0
Cost efficiency 1.5 1.8 2.0 2.0 4.0 3.8 2.5 2.4
Cost-to-income 1.0 1.0 3.0 3.0 4.0 4.0 2.0 2.0
Opex 2.0 2.0 1.0 1.0 4.0 3.0 3.0 4.0
Asset vs. Opex 2.0 3.0 1.0 1.0 4.0 4.0 3.0 2.0
Credit Risk 1.6 1.0 1.4 3.2 4.0 3.4 3.0 2.4
Credit loss 2.0 1.0 1.0 4.0 4.0 3.0 3.0 2.0
NPL ratio 1.0 1.0 2.0 2.0 4.0 4.0 3.0 3.0
Capital adequacy 1.0 1.0 3.0 4.0 4.0 3.0 2.0 2.0
Overall rating 1.4 1.3 2.6 3.1 3.7 3.2 2.3 2.4
Overall ranking 1.0 1.0 3.0 3.0 4.0 4.0 2.0 2.0
-
0.5
1.0
1.5
2.0
2.5
3.0
3.5
4.0
201420152016201420152016201420152016201420152016
FNB NED SBNH CGP
P a g e | 7
PSG Wealth Management (Namibia) (Pty) Ltd
Nature of business
Local Banks
Capricorn Group Holdings (CGP)
CGP is an investment holding company with a 100%
shareholding in Bank Windhoek Ltd, Namib Bou (Pty) Limited,
Capricorn Unit Trust Management Company Limited (CUTM)
and Capricorn Asset Management (Pty) Ltd (CAM). Bank
Windhoek Ltd is one of the largest commercial banks in
Namibia. CGP also has strategic interests in Santam Namibia
(28%) and Sanlam Namibia (29.5%). Capricorn Investment
Holdings (CIH) has a 56.81% shareholding in CGP. The group
offers a complete range of retail, business, corporate and
investment banking, insurance and wealth management. CGP
announced in December 2016 that they will acquire 65% of the
issued share capital of Capricorn Investment Holdings
(Botswana) Limited, which owns 100% of the share capital of
Bank Gaborone, and 97.9% of Cavmont Capital Holdings Zambia
Plc, which owns 100% of the share capital of Cavmont Bank.
FNB Namibia Holdings (FNB)
FNB Namibia Holdings has a 100% shareholding in First National Bank
of Namibia Limited. South African group, FirstRand EMA Holdings is
the majority shareholder of FNB, with a 58.4% shareholding. GIPF holds
14.8% with the remainder of the shareholding held by the general
public. Five percent of FirstRand’s has been allocated to a black
empowerment group, with 1% allocated to black employees and 4% to
a BEE Consortium. The BEE consortium consists of two groups, namely
Sovereign Capital and Chappa’Ai Investments. FNB also have a 51%
holding in OUTsurance Insurance Company Namibia (Pty) Limited. The
group also has a 100% holding in RMB Namibia (Pty) Ltd and FNB
Namibia Unit Trusts Limited. FNB recently concluded a transaction to
purchase 100% of the shares in Pointbreak.
NedNamibia Holdings (NED)
Nedbank Group Limited is the South African controlling shareholder
(100%) of NedNamibia Holdings Limited. NedNamiba Holdings Ltd has
a 100% interest in Nedbank Namibia Limited and also in the following
subsidiaries: NedProperties (Pty) Limited, NedCapital Namibia (Pty)
Limited, NedPlan Insurance Brokers Namibia (Pty) Limited and
Coversure Limited. Nedbank Namibia Ltd holds a 100% shareholding in
CBN Nominees (Pty) Limited, 25% in Namclear (Pty) Limited, 80% in
Nedloans (Pty) Limited, 50% in Ten Kaiser Wilhelm Strasse (Pty) Limited
and 50% in Walvis Bay Land Syndicate (Pty) Limited.
Standard Bank Namibia Holdings Limited (SBNH)
The Standard Bank Group Limited, registered and listed in South
Africa and dual listed on the NSX, transferred its ownership to
Standard Bank Holdings Limited effective 01 January 2011.
Standard Bank Holdings Limited acts as an investment holding
company with 100% shareholding in Standard Insurance
Brokers (Namibia) (Proprietary) Limited, (a short term insurance
broker), Stanfin (Namibia) (Proprietary) Limited, (a long term
insurance broker) and Standard Bank Namibia Limited.
P a g e | 8
PSG Wealth Management (Namibia) (Pty) Ltd
SA Banks
Barclays Group Africa (BGA) Barclays Group Africa, one of the big four banks in South Africa,
was established in 1999. Barclays acquired a controlling stake in
2006, and raised its shareholding further to 62.3% in July 2013.
BGA offers a complete range of retail, business, corporate and
investment banking, plus insurance and wealth management.
FirstRand (FSR)
FirstRand was created in 1998 through the merger of the
financial services interests of Anglo American and RMB
Holdings. Subsidiaries include FNB (retail & corporate),
WesBank (asset finance & unsecured lending), RMB (corporate
& investment banking).
NedBank SA (NED SA)
Nedbank, a subsidiary of Old Mutual, has been listed on the JSE
since 1969. It focuses on southern Africa, offering corporate
banking, business banking, investment banking, retail banking,
wealth management and bancassurance. Having made a big
loss in 2003, it was recapitalised through a rights issue. Nedbank
generates most of its earnings from corporate and investment
banking, but is also rebuilding its retail franchise, which has
been lagging the other big banks.
Standard Bank SA (SBK SA)
Standard Bank was listed on the JSE in 1970. The group offers
corporate & investment banking and retail banking. It has a
controlling stake in Liberty Holdings, a listed insurer. SBK is
operating in 17 African countries. Having embarked on
expansion into emerging markets before the global financial
crisis, it is now refocusing its strategy on Africa.
Capitec (CPI)
Capitec Bank Holdings Limited has been listed on the JSE since
2002. The Company's subsidiaries conduct retail banking. The
Company owns 100% of its principal subsidiary, Capitec Bank
Limited (Capitec Bank). Capitec Bank is a retail bank, which
focuses on banking services and provides savings, transacting
and unsecured lending products to individuals. Capitec does not
at this stage provide any services to businesses Home loan
origination is provided but it is outsourced to SA Home Loans

P a g e | 9
PSG Wealth Management (Namibia) (Pty) Ltd
Botswana Banks
Barclays Bank Botswana (BBB) The Bank is controlled by Barclays Africa Group Limited which
owns 67.82% of the ordinary shares, which is a subsidiary of
Barclays PLC (incorporated in the United Kingdom). The
remaining 32.18% of the shares are widely held. The bank
employs 1 247 people and has 43 branches and 115 ATMs
throughout the country. Their consumer business serves
customers across a network of 43 branches, which is the largest
branch network in Botswana, and 115 ATMs.
First National Bank of Botswana (FNBB)
FNBB was registered in 1991, as a wholly owned subsidiary of
First National Bank Holdings (Botswana). The Bank became a
listed entity on the Botswana Stock Exchange in 1993. The
Company’s stated capital consists of 2 563 700 000 ordinary
shares, of which First National Bank Holdings (Botswana)
Limited holds 1 780 590 000 shares (69.45%), and the balance is
traded on the Botswana Stock Exchange (BSE).
Standard Chartered Botswana (SCB)
SCB first opened for business in 1897, making it the country's
oldest bank. The Bank was locally incorporated in 1975 with a
full board. The bank operates with 19 branches and 25% of its
shares are listed on the Botswana Stock Exchange.
Zambian Banks
Standard Chartered Bank of Zambia (SCZ)
The bank was established in 1906 and has a total of 25 branches
spread across the country, 47 automated teller machines
(ATMs) and 719 employees. The Bank, which is a registered
commercial bank under the Zambian Banking and Financial
Services Act 1994, is owned 90% by Standard Chartered
Holdings (Africa) BV, a company incorporated in the
Netherlands, which in turn is wholly owned by Standard
Chartered Plc, a company incorporated in the England and
Wales.
Zambia National Commercial Bank Plc (Zanaco)
Zanaco was established in 1969. The bank remains majority-
owned by Zambians. In 2007, the Government of Zambia sold a
49% stake in the bank to Rabo Financial Institutions
Development (RFID) a subsidiary of Rabobank of the
Netherlands. Following the Banks Initial public offer in 2008
RFID sold 3.41% stake to Lizara Investments Limited (a nominee
of the Zambia National Farmers Union (ZNFU). Current
shareholding 25% GRZ, 45.59% RFID, 3.41% ZNFU and 25.6%
free float.
P a g e | 10
PSG Wealth Management (Namibia) (Pty) Ltd
Economic Review and Outlook
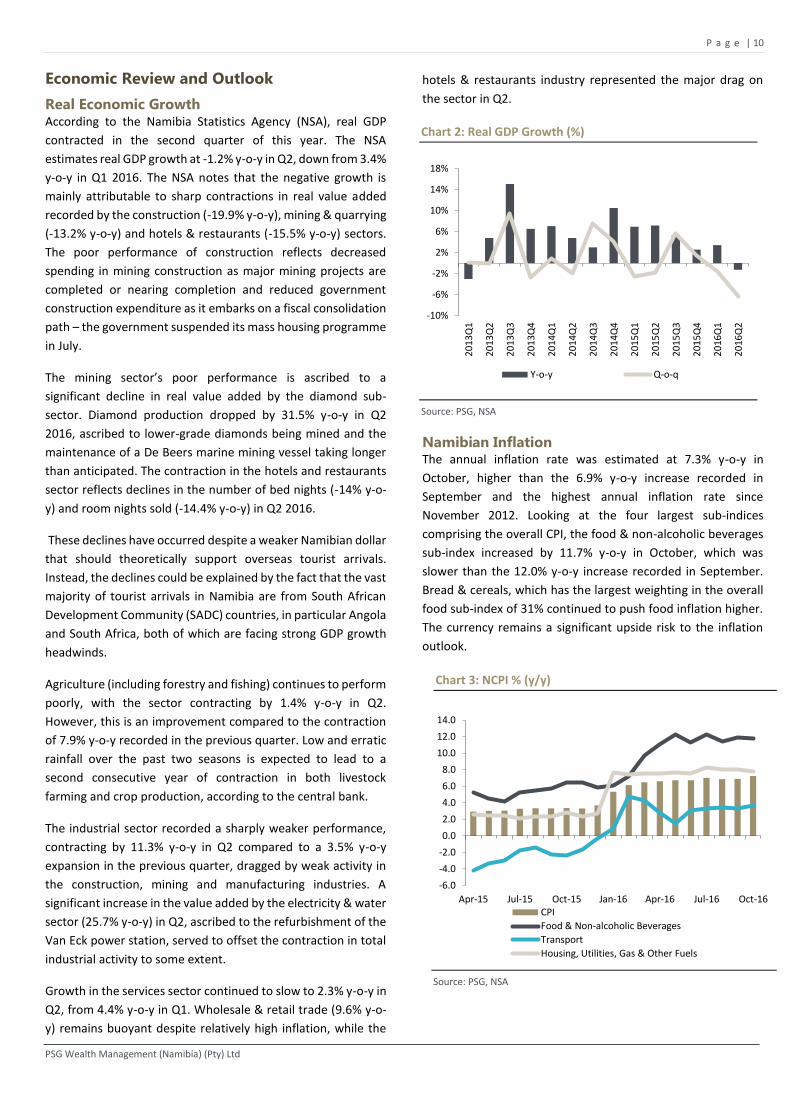
Real Economic Growth According to the Namibia Statistics Agency (NSA), real GDP
contracted in the second quarter of this year. The NSA
estimates real GDP growth at -1.2% y-o-y in Q2, down from 3.4%
y-o-y in Q1 2016. The NSA notes that the negative growth is
mainly attributable to sharp contractions in real value added
recorded by the construction (-19.9% y-o-y), mining & quarrying
(-13.2% y-o-y) and hotels & restaurants (-15.5% y-o-y) sectors.
The poor performance of construction reflects decreased
spending in mining construction as major mining projects are
completed or nearing completion and reduced government
construction expenditure as it embarks on a fiscal consolidation
path – the government suspended its mass housing programme
in July.
The mining sector’s poor performance is ascribed to a
significant decline in real value added by the diamond sub-
sector. Diamond production dropped by 31.5% y-o-y in Q2
2016, ascribed to lower-grade diamonds being mined and the
maintenance of a De Beers marine mining vessel taking longer
than anticipated. The contraction in the hotels and restaurants
sector reflects declines in the number of bed nights (-14% y-o-
y) and room nights sold (-14.4% y-o-y) in Q2 2016.
These declines have occurred despite a weaker Namibian dollar
that should theoretically support overseas tourist arrivals.
Instead, the declines could be explained by the fact that the vast
majority of tourist arrivals in Namibia are from South African
Development Community (SADC) countries, in particular Angola
and South Africa, both of which are facing strong GDP growth
headwinds.
Agriculture (including forestry and fishing) continues to perform
poorly, with the sector contracting by 1.4% y-o-y in Q2.
However, this is an improvement compared to the contraction
of 7.9% y-o-y recorded in the previous quarter. Low and erratic
rainfall over the past two seasons is expected to lead to a
second consecutive year of contraction in both livestock
farming and crop production, according to the central bank.
The industrial sector recorded a sharply weaker performance,
contracting by 11.3% y-o-y in Q2 compared to a 3.5% y-o-y
expansion in the previous quarter, dragged by weak activity in
the construction, mining and manufacturing industries. A
significant increase in the value added by the electricity & water
sector (25.7% y-o-y) in Q2, ascribed to the refurbishment of the
Van Eck power station, served to offset the contraction in total
industrial activity to some extent.
Growth in the services sector continued to slow to 2.3% y-o-y in
Q2, from 4.4% y-o-y in Q1. Wholesale & retail trade (9.6% y-o-
y) remains buoyant despite relatively high inflation, while the
hotels & restaurants industry represented the major drag on
the sector in Q2.
Namibian Inflation The annual inflation rate was estimated at 7.3% y-o-y in
October, higher than the 6.9% y-o-y increase recorded in
September and the highest annual inflation rate since
November 2012. Looking at the four largest sub-indices
comprising the overall CPI, the food & non-alcoholic beverages
sub-index increased by 11.7% y-o-y in October, which was
slower than the 12.0% y-o-y increase recorded in September.
Bread & cereals, which has the largest weighting in the overall
food sub-index of 31% continued to push food inflation higher.
The currency remains a significant upside risk to the inflation
outlook.
Chart 2: Real GDP Growth (%)
Source: PSG, NSA
Chart 3: NCPI % (y/y)
Source: PSG, NSA
-10%
-6%
-2%
2%
6%
10%
14%
18%
20
13Q
1
20
13Q
2
20
13Q
3
20
13Q
4
20
14Q
1
20
14Q
2
20
14Q
3
20
14Q
4
20
15Q
1
20
15Q
2
20
15Q
3
20
15Q
4
20
16Q
1
20
16Q
2
Y-o-y Q-o-q
-6.0
-4.0
-2.0
0.0
2.0
4.0
6.0
8.0
10.0
12.0
14.0
Apr-15 Jul-15 Oct-15 Jan-16 Apr-16 Jul-16 Oct-16CPI
Food & Non-alcoholic Beverages
Transport
Housing, Utilities, Gas & Other Fuels

P a g e | 11
PSG Wealth Management (Namibia) (Pty) Ltd
Private Sector Credit Extension (PSCE)
Private sector credit extension (PSCE) growth declined in
October, mainly as a result of a decline in demand for credit
from the corporate sector, according to the Bank of Namibia’s
(BoN, the central bank) recently released Money and Banking
Statistics report. PSCE growth decreased from 11.1% y-o-y in
September to 10.2% y-o-y in October, therefore, remaining on
a broadly downward trend since March 2015.
Growth in credit extended to businesses dropped by 90.2 bps
to 10.2% y-o-y in October, while credit growth to households
remained unchanged at 9.7% y-o-y. The growth in mortgage
credit, which accounts for more than 50% of total PSCE, slowed
to 9.4% y-o-y in October, compared to 10.1% y-o-y in the
preceding month.
Elsewhere in the report, the central bank said that the stock of
international reserves dropped to N$25.1bn at the end of
October, from N$26.5bn in the prior month. “The decrease
emanated mainly from net government payments and net
foreign currency purchases by commercial banks during the
reviewed period,” the BoN said.
Chart 4: PSCE (% y/y)
Source: BoN
Monetary Policy
The Monetary Policy Committee (MPC) of the Bank of Namibia
(BoN, the central bank) decided to keep the repo rate
unchanged following its most recent meeting. The policy rate
therefore remains stable at 7%. According to the MPC, a repo
rate at this level “is appropriate to support growth and maintain
the one-to-one link of the Namibian dollar to the South African
rand”. The central bank states that since the previous MPC
meeting in October 2016, monetary policy stances in both key
advanced economies and emerging market economies have
remained accommodative.
No doubt the South African Reserve Bank’s (SARB) decision to
keep its policy rate unchanged in November contributed to the
decision to hold Namibian rates steady. Furthermore, the BoN’s
decision was supported by the downward trend in private
sector credit extension (PSCE) growth and a sharp drop in
overall economic growth during the first 10 months of 2016.
PSCE growth slowed to an average of 11.8% y-o-y over the first
10 months of 2016, compared to 15.5% y-o-y for the same
period in 2015.
According to the central bank, weaker economic growth is
ascribed to declines in the production of diamonds and zinc as
well as slower growth in the construction, agriculture and
transport sectors. However, wholesale & retail trade as well as
communications continue to perform well. The BoN still
projects real GDP growth of 2.5% in 2016, sharply lower than
the 5.3% recorded in 2015.
Chart 5: Namibian vs. South African Interest Rates
Source: PSG
Nevertheless, the outlook for monetary policy remains very
uncertain and the exchange rate continues to be a significant
upside risk to the inflation outlook. In recent months, the
inflation rate kept close to 7% y-o-y and we still expect price
pressures to remain elevated in 2017.
A source of depreciatory pressure on the rand is the substantial
risk that South Africa will lose its investment-grade status
during the course of 2017. Despite the recent decisions by credit
rating agencies not to downgrade South Africa’s foreign
currency credit rating, both S&P Global Ratings and Fitch
Ratings now have the country on “BBB-” with a negative
outlook.
Looking ahead, our baseline expectation is for the BoN to raise
the repo rate by 25 bps during 2017. This is on the back of our
projected 50 bps hike in the US federal funds rate next year,
which will put pressure on the Namibian dollar, as well as our
expectation of elevated food and administrated prices well into
2017.
0.0
2.0
4.0
6.0
8.0
10.0
12.0
14.0
16.0
18.0
20.0
Oct
-15
No
v-15
Dec
-15
Jan
-16
Feb
-16
Mar
-16
Ap
r-16
May
-16
Jun
-16
Jul-
16
Au
g-16
Sep
-16
Oct
-16
%ch
g, y
-o-y
PSCE Corporates Households
0.00%
2.00%
4.00%
6.00%
8.00%
10.00%
12.00%
Jan
-14
Mar
-14
May
-14
Jul-
14
Sep
-14
No
v-1
4
Jan
-15
Mar
-15
May
-15
Jul-
15
Sep
-15
No
v-1
5
Jan
-16
Mar
-16
May
-16
Jul-
16
Sep
-16
No
v-1
6
Nam Prime SA Prime
Nam repo SA Repo rate
Nam Real Interest

P a g e | 12
PSG Wealth Management (Namibia) (Pty) Ltd
Local Banks - Financial Results Review
At time of writing this report, the two local listed banks, FNB and CGP have
already published annual results for the year ended June 2016.
CGP
After reporting strong interim results, advances growth slowed
in the second half of FY16. Headline earnings increased by
20.5% from 151 cps in FY15 to 182cps in FY16. The net interest
margin (IEA) after impairment charges remained resilient at
4.9% on the back of 15.1% growth in net interest income despite
lower advances growth of 12.6%.
In FY16 there was an increase of 65 bps in interest income on
average IEA and an increase of 82 bps in the interest expense
on average interest paying assets.
After peaking at 62.9% in 2010, the cost-to-income ratio has
consistently come down and has improved to 50.2% in the 2016
financial year. This has been because of increased income but
also a substantial curbing of operating cost growth in the last
two years.
The loan to deposit ratio increased further to 111%. This ratio
remaining above 100% shows the bank is not only relying on
deposits to fund loan growth but also on borrowed funds.
ROE increased further over the last year from 22.4% to 22.9%.
While gearing has continued to come down over the three-year
period, it was offset by strong improvement in asset utilisation
from 2.8% in FY15 to 3.0% in FY16 keeping ROE above 22%.
Despite this, the liquid assets to deposits and short term
borrowing figure improved further to 19.5% from 18.3% in
FY15. CGP is well capitalised with a total capital adequacy ratio
of 15.8%.
The group declared a total dividend of 66 cps up 10.6% from last
year (53cps).
Table 7: CGP - Key Financial Data at Year-end
FY14 FY15 FY16
Growth net interest income 15.6% 19.9% 15.1%
Growth non-interest income 29.9% 19.4% 17.5%
ROA 2.6% 2.6% 2.8%
ROE 21.9% 22.4% 22.9%
Interest margin (Avg. IEA) 4.8% 4.8% 4.9%
Cost- to-income 53.6% 51.6% 50.2%
Gross advances growth (%) 14.7% 16.7% 12.6%
NPL/Avg. Advances 0.7% 0.7% 1.4%
Credit loss Ratio (%) 0.15% 0.26% 0.24%
Compensation ratio (%) 28.3% 27.5% 27.9%
DPS (cps) 44 53 66
Capital Adequacy (%) 15.8% 15.8% 15.8%
Growth operating Cost (%) 19.9% 13.9% 13.2%
Source: PSG, Annual Reports
FNB
FNB reported an excellent set of financial results for the 12
months ended 30 June 2016. The group increased headline
earnings by 22.0% for the year. Non-interest income growth at
19.6% was higher than our forecasted 14.9%, but net interest
income was lower which meant that Profit before tax growth of
17.8% is in line with our expectations.
FY16 has been more challenging, there was an increase of 40
bps in interest income on average IEA and an increase of 48 bps
in the interest expense on average interest paying assets.
Non-performing loans were also higher at 0.97% but is
influenced by a large commercial transaction write-off which is
expected to be recovered.
The size of the growth in digital channels is significant and the
continued strong growth in non-interest income despite the
removal of cash deposit fees for individuals and SMEs. Also, the
strong growth in deposits bodes very well for the future funding
requirements of the bank.
Credit losses, however, have remained at very low levels of
below 1% and even during the current economic slowdown it
has not increased in FY16. We are seeing that NPLs are
increasing as expected from 0.7% to 1.0%.
The group declared a total dividend of 213 cps up 16.4% from
last year (183cps). ROE improved further from 32.2% in FY15 to
32.7% in FY16 driven by a significant increase in ROA from 3.5%
to 3.7%.
Table 8: FNB - Key Financial Data at Year-end
FY14 FY15 FY16
Growth net interest income 15.5% 27.7% 13.8%
Growth non-interest income 25.2% 15.9% 19.6%
ROA 3.2% 3.5% 3.7%
ROE 30.9% 32.2% 32.7%
Interest margin (Avg. IEA) 4.8% 5.4% 5.4%
Cost- to-income 47.3% 43.9% 43.6%
Gross advances growth (%) 17.8% 14.2% 12.9%
NPL/Avg. Advances 0.8% 0.7% 1.0%
Credit loss Ratio (%) 0.10% 0.23% 0.23%
Compensation ratio (%) 19.3% 19.2% 22.2%
DPS (cps) 122 183 213
Capital Adequacy (%) 17.0% 17.4% 17.8%
Growth operating Cost (%) 13.3% 14.3% 16.0%
Source: PSG, Annual Reports

P a g e | 13
PSG Wealth Management (Namibia) (Pty) Ltd
NED
NED reported an average set of financial results for the 12
months ending 30 December 2015. EPS increased by 10.8%. Net
interest income growth accelerated strongly to 31.2% but
interest expenditure growth was even higher at 40.0%.
There was a strong increase in net interest margins (IEA) to 4.8%
from 4.6% and high advances growth of 18.3%. This came at a
cost, however with bad debt charges soaring to N$53 million
from N$4.3 million. NPL as % of gross advances reduced further
to 1.0%.
The gains made in cost efficiency in FY14 was reversed in FY15,
with the cost-to-income ratio returning to 59.6% from 56.6%
The group has not paid a dividend since 2005. ROE declined
from 16.5% in FY14 to 15.4% in FY15, and still remains below
the other local banks.
Table 9: NED - Key Financial Data at Year-end
FY13 FY14 FY15
Growth net interest income 7.2% 24.3% 31.2%
Growth non-interest income 18.9% 10.5% 8.4%
ROA 2.1% 2.3% 2.1%
ROE 16.1% 16.5% 15.4%
Interest margin (Avg. IEA) 4.7% 4.6% 4.8%
Cost- to-income 59.9% 56.6% 59.6%
Gross advances growth (%) 14.4% 19.5% 18.3%
NPL/Avg. Advances 1.3% 1.1% 1.0%
Credit loss Ratio (%) 0.1% 0.0% 0.4%
Compensation ratio (%) 26.0% 27.0% 27.4%
DPS (cps) ND ND ND
Capital Adequacy (%) 14.3% 14.3% 14.3%
Growth operating Cost (%) 8.9% 8.7% 17.6%
Source: PSG, Annual Reports, ND = No Dividend
SBNH
SBNH reported results as at 31 December 2015 which were
significantly better than expected with earnings growth at
44.7%, amid continued declining advances growth.
Significant improvement in ROA from 1.7% to 2.3% driving ROE
up to 23.4% from a previous 18.8%. Deposit growth was very
low at 4.2%
The credit loss ratio amounted to 0.44% of total advances, a
significant improvement from the 0.65% for FY14. Net interest
income rose by 29.6% while non-interest revenue grew by 8.6%.
Operating cost was 12.5% higher than the previous year,
resulting in the cost-to-income (after impairment) ratio
declining from 66.5% in FY14 to 60.9% in FY15, the highest
among local banks. SBNH reported a NPL/Advances ratio of
2.9%, the same as in FY14.
The NPL ratio remains the highest among local banks,
nevertheless still favourable below the 3% acceptable level. Net
advances grew by 11.6% in FY15, below the average PSCE
growth rate. ROE increased from 18.8% in FY14 to 23.4% in
FY15. The group declared a total dividend of 260 cps in FY14,
but did not declare any dividends in FY15.
Table 10: SBNH - Key Financial Data at Year-end
FY13 FY14 FY15
Growth net interest income 15.8% 28.6% 29.6%
Growth non-interest income 39.2% 11.4% 8.6%
ROA 1.7% 1.7% 2.6%
ROE 18.0% 18.8% 23.4%
Interest margin (Avg. IEA) 4.4% 5.1% 5.9%
Cost- to-income 68.1% 66.5% 60.9%
Gross advances growth (%) 7.4% 16.5% 11.6%
NPL/Avg. Advances 2.9% 2.9% 2.9%
Credit loss Ratio (%) 0.5% 0.7% 0.4%
Compensation ratio (%) 34.5% 31.1% 26.0%
DPS (cps) 120 260 -
Capital Adequacy (%) 12.1% 13.2% 15.6%
Growth operating Cost (%) 17.4% 14.4% 12.5%
Source: PSG, Annual Reports, ND = No Dividend
On balance, local banks remain profitable while the overall
credit quality remains intact. The NPL/Average advances ratio
remains significantly below the accepted 3% for all the local
banks. All the banks, except for NED improved their cost-to-
income ratios, partly attributable to rising interest rates. The
pressure the economy is under will influence the housing
market which could push up credit losses and NPLs in the next
year.

P a g e | 14
PSG Wealth Management (Namibia) (Pty) Ltd
Balance Sheet
This section measures assets and gross advances as at 31
December to compare all the banks at the exact same point
in time. Interim results from CGP and FNB are used.
Bank Assets
The banking system plays an important role in the economic
development of any country. The importance of the banking
sector in the Namibian economy, in particular for the
contribution to economic growth cannot be underestimated.
Total bank assets between the four local banks as a % of
nominal GDP increased from 60.3% in 2008 to 69.3% in 2015
indicating the importance of the banking sector in Namibia.
Chart 6: Total Local Bank Assets as % of Current GDP
Source: PSG, NSA
Total assets between the four local banks amounted to
N$101.6 billion measured at 31 December 2015, up from
N$88 billion the previous year. FNB and CGP remain the two
largest banks in Namibia with total assets amounting to
N$32.5 and N$31.3bn, respectively, followed by SBNH with
N$23.9bn and NED at N$13.8bn.
Chart 7: Local Banks - Total Assets (N$billion)
Source: PSG, Annual Reports
Table 11 shows the asset market share at December 2015.
FNB remains the market leader with 32.0% of total assets,
followed closely by CGP at 30.8%. NED, the smallest in terms
of assets, increased its market share from 11.9% to 13.6%
over the 5-year period. SBNH has lost significant market share
from ten years ago from 36% to 23.6% in FY15, and is now the
third biggest bank in terms of assets at December 2015.
Table 11: Total Assets at 31 December (N$000)
N$000 2012 2013 2014 2015
FNB 20 226 000 24 793 727 28 101 816 32 479 750
NED 8 786 263 9 999 919 11 871 305 13 828 598
SBNH 18 190 783 20 108 898 21 822 523 23 991 803
CGP 20 167 542 22 761 093 26 323 929 31 346 136
Total 67 370 588 77 663 637 88 119 573 101 646 287
Source: PSG, Annual Reports
Table 12: Total Assets Market Share (%)
2011 2012 2013 2014 2015
FNB 32.5% 30.0% 31.9% 31.9% 32.0%
NED 11.9% 13.0% 12.9% 13.5% 13.6%
SBNH 25.6% 27.0% 25.9% 24.8% 23.6%
CGP 29.9% 29.9% 29.3% 29.9% 30.8%
Source: PSG, Annual Reports
Table 13 shows the Compounded Annualised Growth Rate
(CAGR) in assets over different time periods. All the banks
grew their assets at double digit growth over the last 5 years.
Table 13: Total Assets Market Share (%)
1 year 3 years 5 years
FNB 15.6% 17.1% 13.5%
NED 16.5% 16.3% 14.1%
SBNH 9.9% 9.7% 10.7%
CGP 19.1% 15.8% 14.4%
Source: PSG, Annual Reports
63.5%
60.3%
66.2%67.6%
69.0%
62.8%63.3%63.2%
69.3%
54.0%56.0%58.0%60.0%62.0%64.0%66.0%68.0%70.0%72.0%
2007 2008 2009 2010 2011 2012 2013 2014 2015
20.6
7.5
16.218.9
32.5
13.8
24.0
31.3
-
5
10
15
20
25
30
35
FNB NED SBNH CGP
N$
Bn
2011 2012 2013 2014 2015
Chart 8: Local Banks - Total Assets Market Share (%)
Source: PSG, Annual Reports
32.5%
11.9%
25.6%
29.9%32.0%
13.6%
23.6%
30.8%
0%
5%
10%
15%
20%
25%
30%
35%
FNB NED SBNH CGP
2011 2012 2013 2014 2015
P a g e | 15
PSG Wealth Management (Namibia) (Pty) Ltd
CGP has grown its assets fastest over the last year and over 5
years. FNB is the frontrunner over 3 years. SBNH has lagged in
assets growth over all periods.
Gross Advances
Total loans and advances continued to grow in 2015, at an
average rate of 15.0%, slower than the 16.9% rate in 2014.
Advances grew from N$67.8bn to N$77.9bn.
Table 14: Total Gross Advances at 31 December (N$000)
2012 2013 2014 2015
FNB 15 303 999 18 988 162 21 803 113 25 096 180
NED 6 124 565 7 008 385 8 374 544 9 907 360
SBNH 12 336 081 13 250 316 15 432 811 17 216 332
CGP 16 578 549 18 796 458 22 217 161 25 757 009
Total 50 343 194 58 043 321 67 827 629 77 976 881
Source: PSG, Annual Reports
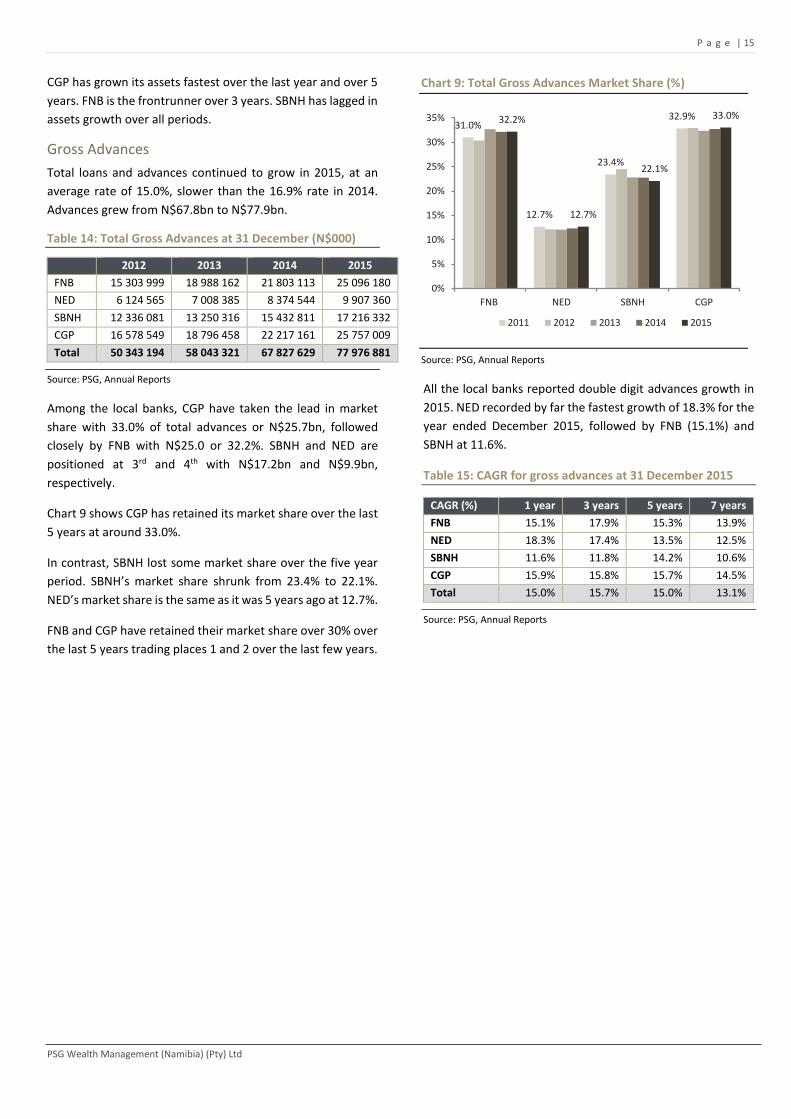
Among the local banks, CGP have taken the lead in market
share with 33.0% of total advances or N$25.7bn, followed
closely by FNB with N$25.0 or 32.2%. SBNH and NED are
positioned at 3rd and 4th with N$17.2bn and N$9.9bn,
respectively.
Chart 9 shows CGP has retained its market share over the last
5 years at around 33.0%.
In contrast, SBNH lost some market share over the five year
period. SBNH’s market share shrunk from 23.4% to 22.1%.
NED’s market share is the same as it was 5 years ago at 12.7%.
FNB and CGP have retained their market share over 30% over
the last 5 years trading places 1 and 2 over the last few years.
All the local banks reported double digit advances growth in
2015. NED recorded by far the fastest growth of 18.3% for the
year ended December 2015, followed by FNB (15.1%) and
SBNH at 11.6%.
Table 15: CAGR for gross advances at 31 December 2015
CAGR (%) 1 year 3 years 5 years 7 years
FNB 15.1% 17.9% 15.3% 13.9%
NED 18.3% 17.4% 13.5% 12.5%
SBNH 11.6% 11.8% 14.2% 10.6%
CGP 15.9% 15.8% 15.7% 14.5%
Total 15.0% 15.7% 15.0% 13.1%
Source: PSG, Annual Reports
Chart 9: Total Gross Advances Market Share (%)
Source: PSG, Annual Reports
31.0%
12.7%
23.4%
32.9%32.2%
12.7%
22.1%
33.0%
0%
5%
10%
15%
20%
25%
30%
35%
FNB NED SBNH CGP
2011 2012 2013 2014 2015
P a g e | 16
PSG Wealth Management (Namibia) (Pty) Ltd
The data shown from here onwards, refers to the latest
financial year ends of the different banks. There is a timing
difference of 6 months or less.
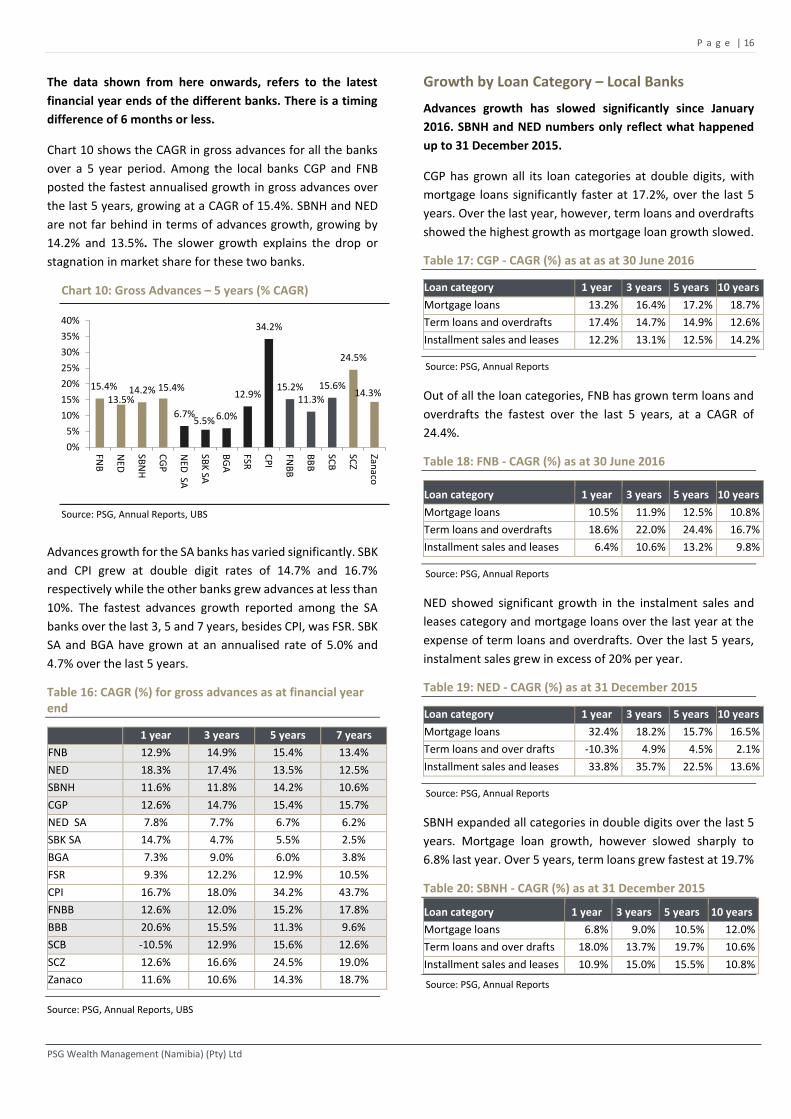
Chart 10 shows the CAGR in gross advances for all the banks
over a 5 year period. Among the local banks CGP and FNB
posted the fastest annualised growth in gross advances over
the last 5 years, growing at a CAGR of 15.4%. SBNH and NED
are not far behind in terms of advances growth, growing by
14.2% and 13.5%. The slower growth explains the drop or
stagnation in market share for these two banks.
Chart 10: Gross Advances – 5 years (% CAGR)
Source: PSG, Annual Reports, UBS
Advances growth for the SA banks has varied significantly. SBK
and CPI grew at double digit rates of 14.7% and 16.7%
respectively while the other banks grew advances at less than
10%. The fastest advances growth reported among the SA
banks over the last 3, 5 and 7 years, besides CPI, was FSR. SBK
SA and BGA have grown at an annualised rate of 5.0% and
4.7% over the last 5 years.
Table 16: CAGR (%) for gross advances as at financial year end
1 year 3 years 5 years 7 years
FNB 12.9% 14.9% 15.4% 13.4%
NED 18.3% 17.4% 13.5% 12.5%
SBNH 11.6% 11.8% 14.2% 10.6%
CGP 12.6% 14.7% 15.4% 15.7%
NED SA 7.8% 7.7% 6.7% 6.2%
SBK SA 14.7% 4.7% 5.5% 2.5%
BGA 7.3% 9.0% 6.0% 3.8%
FSR 9.3% 12.2% 12.9% 10.5%
CPI 16.7% 18.0% 34.2% 43.7%
FNBB 12.6% 12.0% 15.2% 17.8%
BBB 20.6% 15.5% 11.3% 9.6%
SCB -10.5% 12.9% 15.6% 12.6%
SCZ 12.6% 16.6% 24.5% 19.0%
Zanaco 11.6% 10.6% 14.3% 18.7%
Source: PSG, Annual Reports, UBS
Growth by Loan Category – Local Banks
Advances growth has slowed significantly since January
2016. SBNH and NED numbers only reflect what happened
up to 31 December 2015.
CGP has grown all its loan categories at double digits, with
mortgage loans significantly faster at 17.2%, over the last 5
years. Over the last year, however, term loans and overdrafts
showed the highest growth as mortgage loan growth slowed.
Table 17: CGP - CAGR (%) as at as at 30 June 2016
Loan category 1 year 3 years 5 years 10 years
Mortgage loans 13.2% 16.4% 17.2% 18.7%
Term loans and overdrafts 17.4% 14.7% 14.9% 12.6%
Installment sales and leases 12.2% 13.1% 12.5% 14.2%
Source: PSG, Annual Reports
Out of all the loan categories, FNB has grown term loans and
overdrafts the fastest over the last 5 years, at a CAGR of
24.4%.
Table 18: FNB - CAGR (%) as at 30 June 2016
Loan category 1 year 3 years 5 years 10 years
Mortgage loans 10.5% 11.9% 12.5% 10.8%
Term loans and overdrafts 18.6% 22.0% 24.4% 16.7%
Installment sales and leases 6.4% 10.6% 13.2% 9.8%
Source: PSG, Annual Reports
NED showed significant growth in the instalment sales and
leases category and mortgage loans over the last year at the
expense of term loans and overdrafts. Over the last 5 years,
instalment sales grew in excess of 20% per year.
Table 19: NED - CAGR (%) as at 31 December 2015
Loan category 1 year 3 years 5 years 10 years
Mortgage loans 32.4% 18.2% 15.7% 16.5%
Term loans and over drafts -10.3% 4.9% 4.5% 2.1%
Installment sales and leases 33.8% 35.7% 22.5% 13.6%
Source: PSG, Annual Reports
SBNH expanded all categories in double digits over the last 5
years. Mortgage loan growth, however slowed sharply to
6.8% last year. Over 5 years, term loans grew fastest at 19.7%
Table 20: SBNH - CAGR (%) as at 31 December 2015
Loan category 1 year 3 years 5 years 10 years
Mortgage loans 6.8% 9.0% 10.5% 12.0%
Term loans and over drafts 18.0% 13.7% 19.7% 10.6%
Installment sales and leases 10.9% 15.0% 15.5% 10.8%
Source: PSG, Annual Reports
15.4%
13.5%14.2% 15.4%
6.7%5.5% 6.0%
12.9%
34.2%
15.2%11.3%
15.6%
24.5%
14.3%
0%
5%
10%
15%
20%
25%
30%
35%
40%
FNB
NED
SBN
H
CG
P
NED
SA
SBK
SA
BG
A
FSR
CP
I
FNB
B
BB
B
SCB
SCZ
Zanaco
P a g e | 17
PSG Wealth Management (Namibia) (Pty) Ltd
Mortgage Loans
As mentioned, mortgage loans has gained in significance over
the last decade and remain a major earnings driver for local
commercial banks. As we have done last year, we include a
section on the early arrears of the mortgage loan books. The
total mortgage loans consisting of commercial and residential
loans between the four commercial banks amounted to about
N$36.9bn and account on average for about 46.2% of total
average gross advances at the latest year-ends.
Chart 11: Total Mortgage Loans at Year-end (N$ billion)
Source: PSG, Annual Reports
Table 21: Mortgage loans - CAGR (%)
1 year 3 years 5 years 10 years
FNB 10.5% 11.9% 12.5% 10.8%
NED 32.4% 18.2% 15.7% 16.5%
SBNH 6.8% 9.0% 10.5% 12.0%
CGP 13.2% 16.4% 17.2% 18.7%
Source: PSG, Annual Reports
Table 22: Mortgage Loans (N$000)
FY13 FY14 FY15 FY16
FNB 8 442 123 9 667 352 10 694 799 11 815 279
NED 3 065 491 3 476 328 4 601 266
SBNH 6 042 297 6 616 835 7 063 798
CGP 8 499 995 9 919 583 11 850 416 13 412 655
Source: PSG, Annual Reports
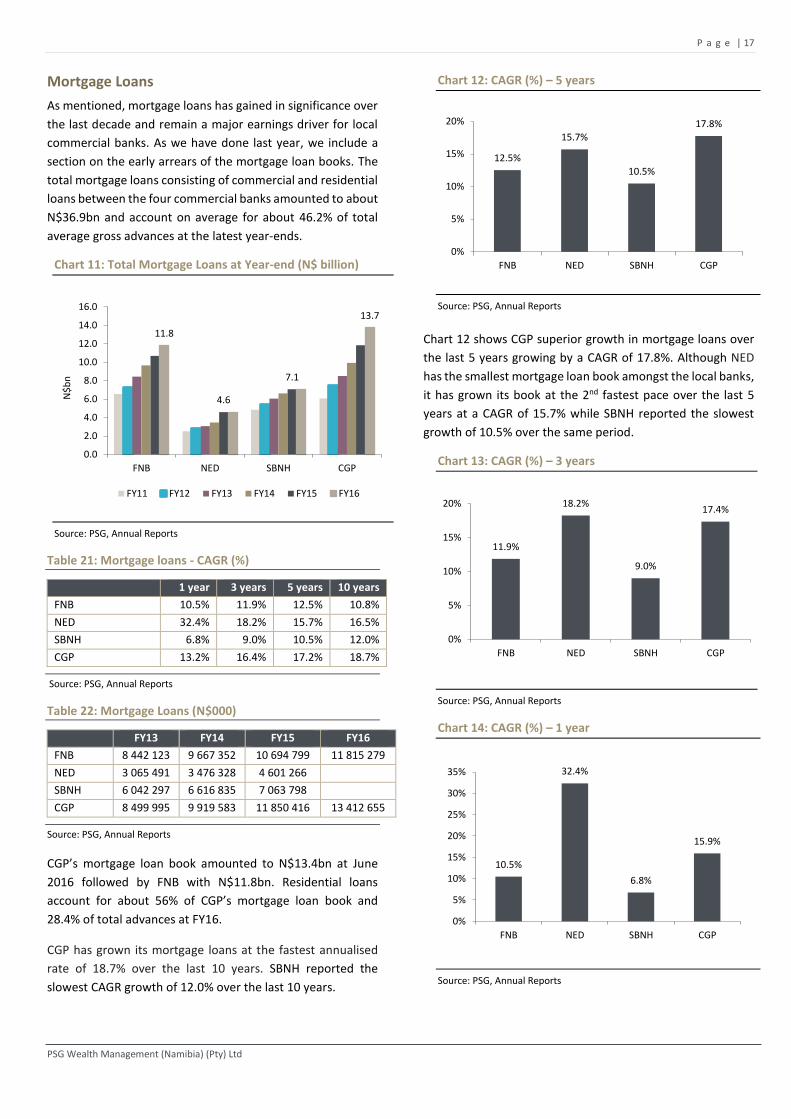
CGP’s mortgage loan book amounted to N$13.4bn at June
2016 followed by FNB with N$11.8bn. Residential loans
account for about 56% of CGP’s mortgage loan book and
28.4% of total advances at FY16.
CGP has grown its mortgage loans at the fastest annualised
rate of 18.7% over the last 10 years. SBNH reported the
slowest CAGR growth of 12.0% over the last 10 years.
Chart 12: CAGR (%) – 5 years
Source: PSG, Annual Reports
Chart 12 shows CGP superior growth in mortgage loans over
the last 5 years growing by a CAGR of 17.8%. Although NED
has the smallest mortgage loan book amongst the local banks,
it has grown its book at the 2nd fastest pace over the last 5
years at a CAGR of 15.7% while SBNH reported the slowest
growth of 10.5% over the same period.
Chart 13: CAGR (%) – 3 years
Source: PSG, Annual Reports
Chart 14: CAGR (%) – 1 year
Source: PSG, Annual Reports
4.6
7.1
11.8
13.7
0.0
2.0
4.0
6.0
8.0
10.0
12.0
14.0
16.0
FNB NED SBNH CGP
N$
bn
FY11 FY12 FY13 FY14 FY15 FY16
12.5%
15.7%
10.5%
17.8%
0%
5%
10%
15%
20%
FNB NED SBNH CGP
11.9%
18.2%
9.0%
17.4%
0%
5%
10%
15%
20%
FNB NED SBNH CGP
10.5%
32.4%
6.8%
15.9%
0%
5%
10%
15%
20%
25%
30%
35%
FNB NED SBNH CGP

P a g e | 18
PSG Wealth Management (Namibia) (Pty) Ltd
NED’s fast growth in mortgages over the last year of 32.4%,
also boosted them to record the fastest growth (18.2%) over
the last 3 years.
Mortgage loans accounted for 45.5% of FNB’s total gross
advances in FY16 while mortgage loans accounted for 46.4%
and 41.0% of total advances for NED and SBNH, respectively.
CGP and NED have increased the share that mortgages make
up of their total advances book, while FNB and SBNH have
decreased their exposure to mortgages.
Chart 15: Mortgage Loans as % of Total Gross Advances
Source: PSG, Annual Reports
Chart 16 shows how mortgage loans continue to account for
a larger part of total loans over the last 10 years. Mortgage
loans as percentage of advances have gradually increased
from between 20% - 40% of total advances a decade ago to
between 40% and 55% at latest year end. Over the last 3
years, though one can see how SBNH and FNB have tapered
their exposure to home loans as % of their total advances.
Interestingly, even though CGP increased its mortgage loan
book as % of total gross advances from 36.5% in FY06 to 51.2%
in FY15. NED’s mortgage loans as a percentage of its total
gross advances increased at a faster pace over the last 10
years from 21% to 46.4% in FY15.
Chart 16: Mortgage Loans as % of total gross advances
Source: PSG, Annual Reports
Mortgage book age analysis
An analysis of the credit quality of the mortgage loan books,
have yielded thought-provoking results. Even though
impairment figures in the mortgage home loan books have
increased slightly since 2011, there is evidence of pressure on
the consumer in the ratio of the books which are 1 or 2
instalments behind.
For FNB, the ratio of the book in good standing has declined
from 98.1% in FY11 to 92.7% in FY16. The ratio of the
mortgage loan book which has missed one or two installments
has increased every year, from 0.7% in FY11 to 6.0% in FY15.
Chart 17: Age analysis of FNB mortgage loans
Source: PSG, Annual Reports
The situation looks markedly different for CGP. Information is
only available since its listing in 2012, but the overall % of the
loan book in good standing has remained above 98.0% since
then.
The model that CGP applies where each branch manager is
responsible for managing his/her own book could be the
reason for their superior early arrear numbers. Despite this,
there is also a trend of the % of early arrears, which are not
accounted for in non-performing loans, increasing every year.
51.7%
45.6%47.6% 46.2%46.4%
41.0%45.5%
51.2%
0%
10%
20%
30%
40%
50%
60%
FNB NED SBNH CGP
FY11 FY12 FY13 FY14 FY15 FY16
20%
30%
40%
50%
60%
FY0
3
FY0
4
FY0
5
FY0
6
FY0
7
FY0
8
FY0
9
FY1
0
FY1
1
FY1
2
FY1
3
FY1
4
FY1
5
FY1
6
FNB NED SBNH CGP
98.1% 97.2% 96.9%95.5%
94.0%92.7%
0.7%1.5% 2.0%
3.5%5.0%
6.0%
1.2% 1.3% 1.1% 1.0% 1.0% 1.3%
80.0%
82.0%
84.0%
86.0%
88.0%
90.0%
92.0%
94.0%
96.0%
98.0%
100.0%
2011 2012 2013 2014 2015 2016
Good standing Early arrears Impaired

P a g e | 19
PSG Wealth Management (Namibia) (Pty) Ltd
Chart 18: Age analysis of CGP mortgage loans
Source: PSG, Annual Reports
NED improved their loans in good standing from 93.1% of
the portfolio in FY11 to 96.0% in FY14, but this deteriorated
significantly in FY15 to 89.4%. This can be as a result of their
very aggressive mortgage advances growth of 32.4%.
Chart 19: Age analysis of NED mortgage loans
Source: PSG, Annual Reports
SBHN has a much lower ratio for loans in good standing than
the other Namibian banks. This could be due to timing
differences in their system. We do, still see the trend of an
increase over the last few years in early arrears even though
FY14 showed some improvement where 86.3% of their home
loans were in good standing. The impairments figure did
increase significantly in FY15 to 2.5% to 3.6%
Chart 20: Age analysis of SBNH mortgage loans
Source: PSG, Annual Reports
This prevailing trend of the early arrears number increasing
for the past 4 years is an indication of the continued pressure
on the Namibian consumer. It is likely that these mortgage
loan arrears do not relate to primary residences, but more to
investment properties where tenants might be struggling to
make rent payments. We are starting to see these early
arrears feeding through to larger impairment and credit loss
numbers, which are discussed in the Credit Risk section.
98.64% 98.60% 98.62% 98.16%
0.61% 0.80% 0.73% 0.97%0.75% 0.60% 0.65% 0.87%
80.0%
82.0%
84.0%
86.0%
88.0%
90.0%
92.0%
94.0%
96.0%
98.0%
100.0%
FY13 FY14 FY15 FY16
Good standing Early arrears Impaired
92.6%94.2% 95.0% 96.1%
94.5% 94.5%
89.4%
1.5%
1.4%2.1%
1.2%2.8% 3.2%
8.5%
5.8%4.4%
2.9% 2.7% 2.7% 2.3% 2.1%
80.0%
82.0%
84.0%
86.0%
88.0%
90.0%
92.0%
94.0%
96.0%
98.0%
100.0%
2009 2010 2011 2012 2013 2014 2015
Good standing Early arrears Impaired
89.0%86.5%
84.2%86.3% 85.6%
8.7%11.1%
13.5%11.2%
10.8%
2.3% 2.4% 2.3% 2.5% 3.6%
80.0%
82.0%
84.0%
86.0%
88.0%
90.0%
92.0%
94.0%
96.0%
98.0%
100.0%
2011 2012 2013 2014 2015
Good standing Early arrears Impaired
P a g e | 20
PSG Wealth Management (Namibia) (Pty) Ltd
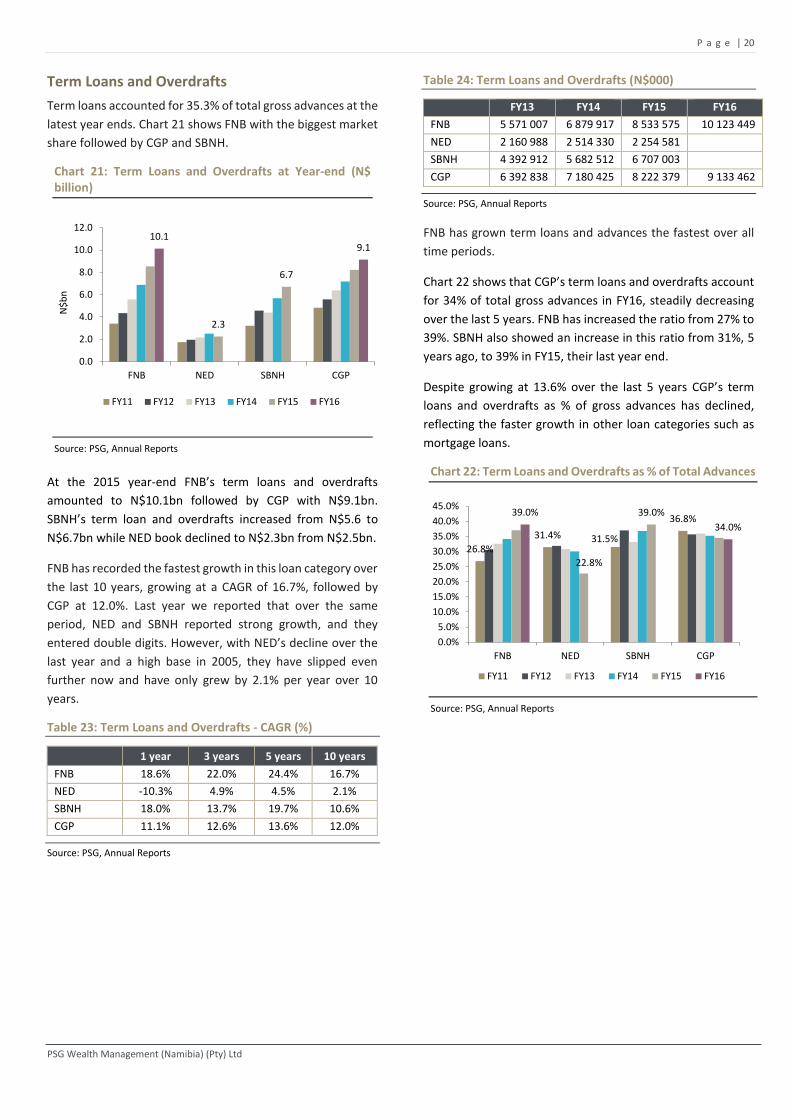
Term Loans and Overdrafts
Term loans accounted for 35.3% of total gross advances at the
latest year ends. Chart 21 shows FNB with the biggest market
share followed by CGP and SBNH.
Chart 21: Term Loans and Overdrafts at Year-end (N$ billion)
Source: PSG, Annual Reports
At the 2015 year-end FNB’s term loans and overdrafts
amounted to N$10.1bn followed by CGP with N$9.1bn.
SBNH’s term loan and overdrafts increased from N$5.6 to
N$6.7bn while NED book declined to N$2.3bn from N$2.5bn.
FNB has recorded the fastest growth in this loan category over
the last 10 years, growing at a CAGR of 16.7%, followed by
CGP at 12.0%. Last year we reported that over the same
period, NED and SBNH reported strong growth, and they
entered double digits. However, with NED’s decline over the
last year and a high base in 2005, they have slipped even
further now and have only grew by 2.1% per year over 10
years.
Table 23: Term Loans and Overdrafts - CAGR (%)
1 year 3 years 5 years 10 years
FNB 18.6% 22.0% 24.4% 16.7%
NED -10.3% 4.9% 4.5% 2.1%
SBNH 18.0% 13.7% 19.7% 10.6%
CGP 11.1% 12.6% 13.6% 12.0%
Source: PSG, Annual Reports
Table 24: Term Loans and Overdrafts (N$000)
FY13 FY14 FY15 FY16
FNB 5 571 007 6 879 917 8 533 575 10 123 449
NED 2 160 988 2 514 330 2 254 581 SBNH 4 392 912 5 682 512 6 707 003 CGP 6 392 838 7 180 425 8 222 379 9 133 462
Source: PSG, Annual Reports
FNB has grown term loans and advances the fastest over all
time periods.
Chart 22 shows that CGP’s term loans and overdrafts account
for 34% of total gross advances in FY16, steadily decreasing
over the last 5 years. FNB has increased the ratio from 27% to
39%. SBNH also showed an increase in this ratio from 31%, 5
years ago, to 39% in FY15, their last year end.
Despite growing at 13.6% over the last 5 years CGP’s term
loans and overdrafts as % of gross advances has declined,
reflecting the faster growth in other loan categories such as
mortgage loans.
Chart 22: Term Loans and Overdrafts as % of Total Advances
Source: PSG, Annual Reports
2.3
6.7
10.19.1
0.0
2.0
4.0
6.0
8.0
10.0
12.0
FNB NED SBNH CGP
N$
bn
FY11 FY12 FY13 FY14 FY15 FY16
26.8%
31.4% 31.5%
36.8%
22.8%
39.0%39.0%
34.0%
0.0%
5.0%
10.0%
15.0%
20.0%
25.0%
30.0%
35.0%
40.0%
45.0%
FNB NED SBNH CGP
FY11 FY12 FY13 FY14 FY15 FY16
P a g e | 21
PSG Wealth Management (Namibia) (Pty) Ltd
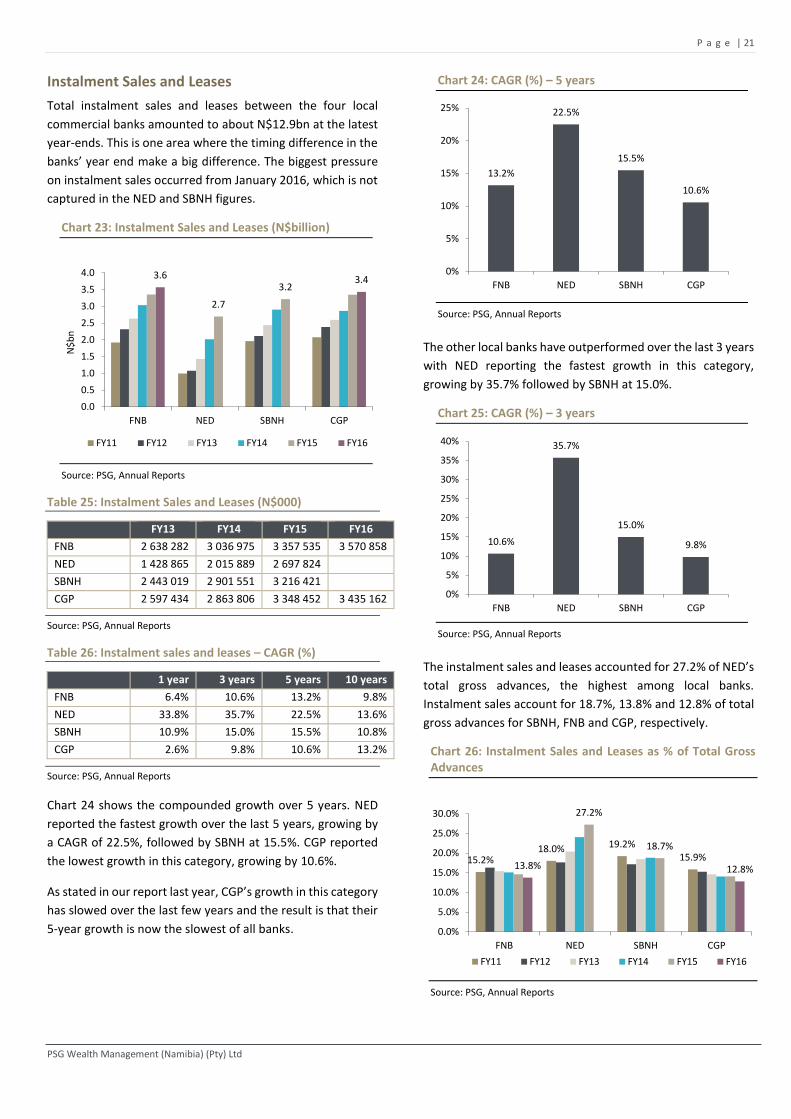
Instalment Sales and Leases
Total instalment sales and leases between the four local
commercial banks amounted to about N$12.9bn at the latest
year-ends. This is one area where the timing difference in the
banks’ year end make a big difference. The biggest pressure
on instalment sales occurred from January 2016, which is not
captured in the NED and SBNH figures.
Chart 23: Instalment Sales and Leases (N$billion)
Source: PSG, Annual Reports
Table 25: Instalment Sales and Leases (N$000)
FY13 FY14 FY15 FY16
FNB 2 638 282 3 036 975 3 357 535 3 570 858
NED 1 428 865 2 015 889 2 697 824
SBNH 2 443 019 2 901 551 3 216 421
CGP 2 597 434 2 863 806 3 348 452 3 435 162
Source: PSG, Annual Reports
Table 26: Instalment sales and leases – CAGR (%)
1 year 3 years 5 years 10 years
FNB 6.4% 10.6% 13.2% 9.8%
NED 33.8% 35.7% 22.5% 13.6%
SBNH 10.9% 15.0% 15.5% 10.8%
CGP 2.6% 9.8% 10.6% 13.2%
Source: PSG, Annual Reports
Chart 24 shows the compounded growth over 5 years. NED
reported the fastest growth over the last 5 years, growing by
a CAGR of 22.5%, followed by SBNH at 15.5%. CGP reported
the lowest growth in this category, growing by 10.6%.
As stated in our report last year, CGP’s growth in this category
has slowed over the last few years and the result is that their
5-year growth is now the slowest of all banks.
Chart 24: CAGR (%) – 5 years
Source: PSG, Annual Reports
The other local banks have outperformed over the last 3 years
with NED reporting the fastest growth in this category,
growing by 35.7% followed by SBNH at 15.0%.
Chart 25: CAGR (%) – 3 years
Source: PSG, Annual Reports
The instalment sales and leases accounted for 27.2% of NED’s
total gross advances, the highest among local banks.
Instalment sales account for 18.7%, 13.8% and 12.8% of total
gross advances for SBNH, FNB and CGP, respectively.
Chart 26: Instalment Sales and Leases as % of Total Gross Advances
Source: PSG, Annual Reports
2.7
3.23.6 3.4
0.0
0.5
1.0
1.5
2.0
2.5
3.0
3.5
4.0
FNB NED SBNH CGP
N$
bn
FY11 FY12 FY13 FY14 FY15 FY16
13.2%
22.5%
15.5%
10.6%
0%
5%
10%
15%
20%
25%
FNB NED SBNH CGP
10.6%
35.7%
15.0%
9.8%
0%
5%
10%
15%
20%
25%
30%
35%
40%
FNB NED SBNH CGP
15.2%18.0% 19.2%
15.9%
27.2%
18.7%
13.8% 12.8%
0.0%
5.0%
10.0%
15.0%
20.0%
25.0%
30.0%
FNB NED SBNH CGP
FY11 FY12 FY13 FY14 FY15 FY16

P a g e | 22
PSG Wealth Management (Namibia) (Pty) Ltd
Deposits
Total deposits consist of current/transactional accounts and
investment accounts such as call deposits, fixed deposits,
money market investments, NCDs and investment funds.
Deposit growth is critical to a bank’s success, higher deposit
rates in combination with service delivery generally translates
into deposit growth. High inflation could negatively impact
deposit growth when deposits are not able to provide any real
rate of return. In a later section the loan-to-deposit ratio
analysis provides a better picture on how effectively deposits
are utilised for writing loans.
Deposit growth slowed to below 10% in the last year for SBNH
and CGP. NED showed the fastest deposit growth over the last
3 years growing at 16.5%. FNB is the current market leader
with N$28.5 deposits followed by CGP at N$24.1bn.
Table 27: Deposits - CAGR (%)
1 year 3 years 5 years 10 years
FNB 14.5% 14.3% 16.5% 13.9%
NED 17.4% 16.5% 13.9% 11.6%
SBNH 4.2% 8.7% 8.4% 10.0%
CGP 9.3% 12.3% 12.5% 14.2%
Source: PSG, Annual Reports
Table 28: Deposits (N$000)
FY13 FY14 FY15 FY16
FNB 19 154 760 22 335 341 24 971 829 28 594 771
NED 8 335 554 9 818 234 11 531 141
SBNH 15 850 883 17 460 602 18 185 518
CGP 17 082 611 19 065 075 22 124 149 24 171 257
Source: PSG, Annual Reports
Chart 27: CAGR (%) – 3 years
Source: PSG, Annual Reports
Chart 27 shows that NED posted the fastest annualised
growth in deposits over the last 3 years growing at a CAGR of
16.5% followed by FNB (14.3%). SBNH growth has slowed
down and all the banks except for them grew deposits at
double digit rates over the last three years.
Chart 28: CAGR (%) – Rolling 5 year deposit growth
Source: PSG, Annual Reports
As can be seen from the above chart, the rolling 5 year deposit
growth has shown a downward trend from 2007. In 2007 the
5 year deposit growth CAGR for all the banks was 18% - 21%
per year. FNB and NED have improved since 2011 and SBNH
has kept this medium term growth consistent. CGP’s rolling 5
year growth has continued declining. As at the latest year
ends, all the banks have 5 year deposit rate growth of below
17%.
14.3%16.5%
8.7%
12.3%
0%
5%
10%
15%
20%
FNB NED SBNH CGP
16.5%
13.9%
8.4%
12.5%
0.0%
5.0%
10.0%
15.0%
20.0%
25.0%
FY07 FY08 FY09 FY10 FY11 FY12 FY13 FY14 FY15 FY16
FNB NED SBNH CGP
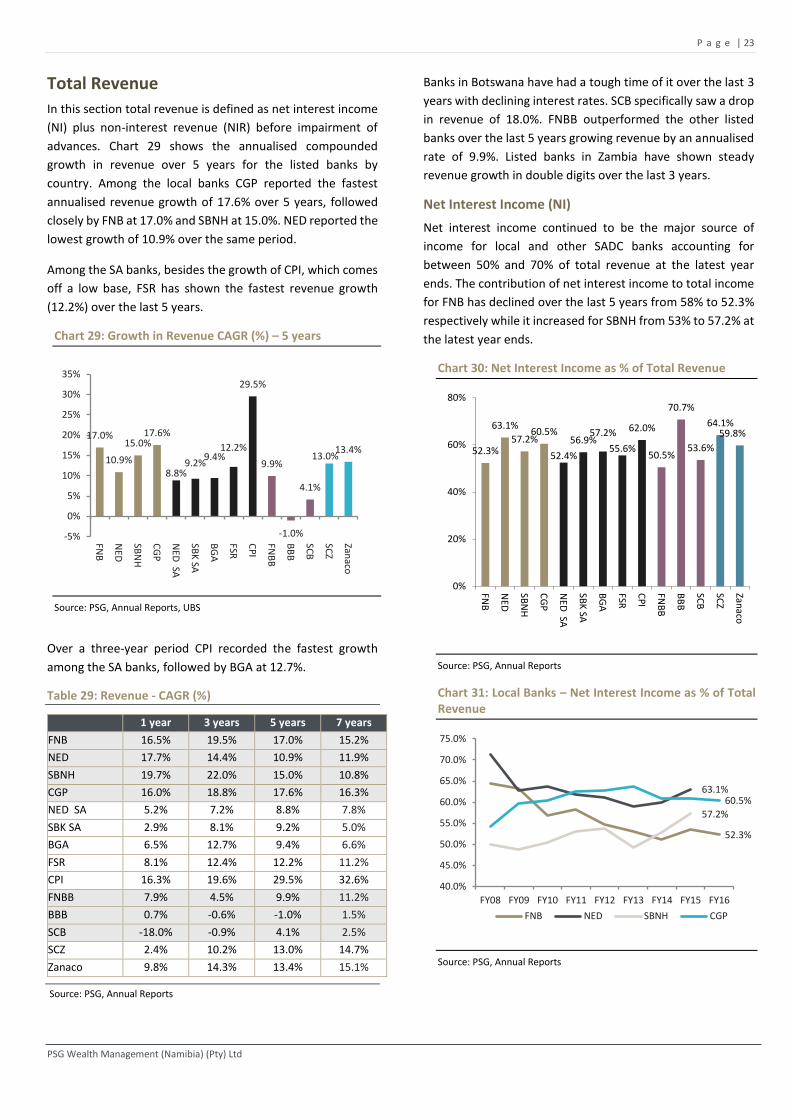
P a g e | 23
PSG Wealth Management (Namibia) (Pty) Ltd
Total Revenue
In this section total revenue is defined as net interest income
(NI) plus non-interest revenue (NIR) before impairment of
advances. Chart 29 shows the annualised compounded
growth in revenue over 5 years for the listed banks by
country. Among the local banks CGP reported the fastest
annualised revenue growth of 17.6% over 5 years, followed
closely by FNB at 17.0% and SBNH at 15.0%. NED reported the
lowest growth of 10.9% over the same period.
Among the SA banks, besides the growth of CPI, which comes
off a low base, FSR has shown the fastest revenue growth
(12.2%) over the last 5 years.
Chart 29: Growth in Revenue CAGR (%) – 5 years
Source: PSG, Annual Reports, UBS
Over a three-year period CPI recorded the fastest growth
among the SA banks, followed by BGA at 12.7%.
Table 29: Revenue - CAGR (%)
1 year 3 years 5 years 7 years
FNB 16.5% 19.5% 17.0% 15.2%
NED 17.7% 14.4% 10.9% 11.9%
SBNH 19.7% 22.0% 15.0% 10.8%
CGP 16.0% 18.8% 17.6% 16.3%
NED SA 5.2% 7.2% 8.8% 7.8%
SBK SA 2.9% 8.1% 9.2% 5.0%
BGA 6.5% 12.7% 9.4% 6.6%
FSR 8.1% 12.4% 12.2% 11.2%
CPI 16.3% 19.6% 29.5% 32.6%
FNBB 7.9% 4.5% 9.9% 11.2%
BBB 0.7% -0.6% -1.0% 1.5%
SCB -18.0% -0.9% 4.1% 2.5%
SCZ 2.4% 10.2% 13.0% 14.7%
Zanaco 9.8% 14.3% 13.4% 15.1%
Source: PSG, Annual Reports
Banks in Botswana have had a tough time of it over the last 3
years with declining interest rates. SCB specifically saw a drop
in revenue of 18.0%. FNBB outperformed the other listed
banks over the last 5 years growing revenue by an annualised
rate of 9.9%. Listed banks in Zambia have shown steady
revenue growth in double digits over the last 3 years.
Net Interest Income (NI)
Net interest income continued to be the major source of
income for local and other SADC banks accounting for
between 50% and 70% of total revenue at the latest year
ends. The contribution of net interest income to total income
for FNB has declined over the last 5 years from 58% to 52.3%
respectively while it increased for SBNH from 53% to 57.2% at
the latest year ends.
Chart 30: Net Interest Income as % of Total Revenue
Source: PSG, Annual Reports
Chart 31: Local Banks – Net Interest Income as % of Total Revenue
Source: PSG, Annual Reports
17.0%
10.9%
15.0%17.6%
8.8%9.2%
9.4%12.2%
29.5%
9.9%
-1.0%
4.1%
13.0%13.4%
-5%
0%
5%
10%
15%
20%
25%
30%
35%
FNB
NED
SBN
H
CG
P
NED
SA
SBK
SA
BG
A
FSR
CP
I
FNB
B
BB
B
SCB
SCZ
Zanaco
52.3%
63.1%
57.2%60.5%
52.4%
56.9%57.2%
55.6%
62.0%
50.5%
70.7%
53.6%
64.1%59.8%
0%
20%
40%
60%
80%
FNB
NED
SBN
H
CG
P
NED
SA
SBK
SA
BG
A
FSR
CP
I
FNB
B
BB
B
SCB
SCZ
Zanaco
52.3%
63.1%
57.2%
60.5%
40.0%
45.0%
50.0%
55.0%
60.0%
65.0%
70.0%
75.0%
FY08 FY09 FY10 FY11 FY12 FY13 FY14 FY15 FY16
FNB NED SBNH CGP

P a g e | 24
PSG Wealth Management (Namibia) (Pty) Ltd
Among the local banks CGP recorded the fastest annualised
growth in NI income over 10 years. NED reported the
slowest annualised growth over the last 5 years at 10.7%. All
the local banks managed double digit growth over 5 and 10
years. The Zambian banks continue to record strong growth
over the last 5 years, even though Zanaco struggled over the
last year.
Table 30: Net Interest Income - CAGR (%)
1 year 3 years 5 years 10 years
FNB 13.8% 18.9% 14.5% 13.1%
NED 23.9% 15.6% 10.7% 11.8%
SBNH 29.6% 24.5% 17.9% 13.1%
CGP 15.1% 16.8% 16.8% 16.6%
NED SA 4.0% 6.7% 7.5% 10.8%
SBK SA 9.0% 12.9% 12.8% 14.0%
BGA 7.9% 17.0% 10.5% 12.5%
FSR 13.3% 15.9% 16.4% 14.9%
CPI 14.8% 20.9% 36.0% 29.1%
FNBB 8.2% 1.7% 7.4% 12.6%
BBB 2.1% -1.8% -1.9% 9.2%
SCB -20.8% -6.5% -0.5% 4.9%
SCZ 14.6% 18.3% 22.2%
Zanaco -1.2% 11.4% 14.5%
Source: PSG, Annual Reports
Chart 32 shows the CAGR in net interest over the last 7
years. Besides CPI at 39.3%, FSR reported the fastest growth
among the SA banks at CAGR of 13.9%. Among the
Botswana banks, FNBB grew net NI at the fastest CAGR of
8.8% over the last 7 years. The banks in Botswana have had
a particularly tough time of it, with NI declining for SCB at
20.8% over the last year. Interest rates in Botswana have
decreased by 4% over the last 5 years.
Chart 32: Net Interest Income CAGR (%) – 7 years
Source: PSG, Annual Reports
Chart 33: Net Interest Income CAGR (%) – 5 years
Source: PSG, Annual Reports
Non-Interest Revenue (NIR)
In developing markets income has always been skewed
towards interest income due to higher interest rates and
spreads where in developed markets non-interest income has
generally accounted for the bulk of total revenue. For some
local banks, such as FNB and NED the reliance on non-interest
revenue is starting to grow in importance, especially during
the low/declining interest environment.
FNB increased its non–interest revenue as % of total income
over the last 5 years from 41.9% to 47.7% in FY16 while CGP
has reduced its ratio of NIR to total revenue and it has
stabilised at 39% over the last 3 years. In CGP’s case the
decline could be attributed to net interest income
outstripping non-interest income growth as a result of strong
advances growth.
Chart 34: NIR as % of Total Revenue
Source: PSG, Annual Reports
Table 31 shows that over the last 5 years, FNB has driven
earnings growth primarily through superior growth in non-
interest income. This is tied closely to their drive of digital
channels in transacting. In contrast, SBNH’s earnings were
driven primarily by net-interest income over the last 5 years,
while CGP and NED has grown the two streams at an equal
pace.
12.1%9.9%
13.0%16.6%
5.7%6.3%8.2%13.9%
39.3%
8.8%
2.1%
-2.1%
15.6%13.6%
-10%
0%
10%
20%
30%
40%
50%
FNB
NED
SBN
H
CG
P
NED
SA
SBK
SA
BG
A
FSR
CP
I
FNB
B
BB
B
SCB
SCZ
Zanaco
14.5%10.7%
17.9%16.8%
7.5%12.8%
10.5%
16.4%
36.0%
7.4%
-1.9%-0.5%
22.2%
14.5%
-5%0%5%
10%15%20%25%30%35%40%
FNB
NED
SBN
H
CG
P
NED
SA
SBK
SA
BG
A
FSR
CP
I
FNB
B
BB
B
SCB
SCZ
Zanaco
47.7%
36.9%
42.8%39.5%
20%
25%
30%
35%
40%
45%
50%
55%
FY08 FY09 FY10 FY11 FY12 FY13 FY14 FY15 FY16
FNB NED SBNH CGP
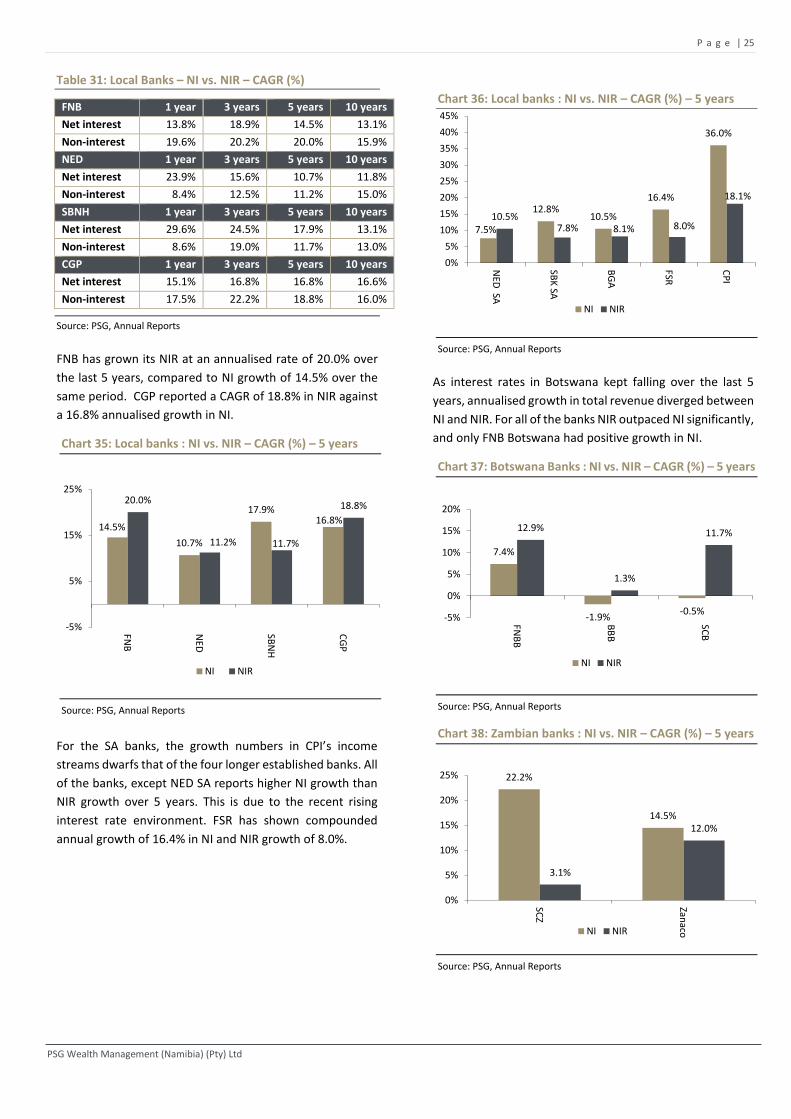
P a g e | 25
PSG Wealth Management (Namibia) (Pty) Ltd
Table 31: Local Banks – NI vs. NIR – CAGR (%)
FNB 1 year 3 years 5 years 10 years
Net interest 13.8% 18.9% 14.5% 13.1%
Non-interest 19.6% 20.2% 20.0% 15.9%
NED 1 year 3 years 5 years 10 years
Net interest 23.9% 15.6% 10.7% 11.8%
Non-interest 8.4% 12.5% 11.2% 15.0%
SBNH 1 year 3 years 5 years 10 years
Net interest 29.6% 24.5% 17.9% 13.1%
Non-interest 8.6% 19.0% 11.7% 13.0%
CGP 1 year 3 years 5 years 10 years
Net interest 15.1% 16.8% 16.8% 16.6%
Non-interest 17.5% 22.2% 18.8% 16.0%
Source: PSG, Annual Reports
FNB has grown its NIR at an annualised rate of 20.0% over
the last 5 years, compared to NI growth of 14.5% over the
same period. CGP reported a CAGR of 18.8% in NIR against
a 16.8% annualised growth in NI.
Chart 35: Local banks : NI vs. NIR – CAGR (%) – 5 years
Source: PSG, Annual Reports
For the SA banks, the growth numbers in CPI’s income
streams dwarfs that of the four longer established banks. All
of the banks, except NED SA reports higher NI growth than
NIR growth over 5 years. This is due to the recent rising
interest rate environment. FSR has shown compounded
annual growth of 16.4% in NI and NIR growth of 8.0%.
Chart 36: Local banks : NI vs. NIR – CAGR (%) – 5 years
Source: PSG, Annual Reports
As interest rates in Botswana kept falling over the last 5
years, annualised growth in total revenue diverged between
NI and NIR. For all of the banks NIR outpaced NI significantly,
and only FNB Botswana had positive growth in NI.
Chart 37: Botswana Banks : NI vs. NIR – CAGR (%) – 5 years
Source: PSG, Annual Reports
Chart 38: Zambian banks : NI vs. NIR – CAGR (%) – 5 years
Source: PSG, Annual Reports
14.5%
10.7%
17.9%16.8%
20.0%
11.2% 11.7%
18.8%
-5%
5%
15%
25%
FNB
NED
SBN
H
CG
P
NI NIR
7.5%
12.8%10.5%
16.4%
36.0%
10.5%7.8% 8.1% 8.0%
18.1%
0%
5%
10%
15%
20%
25%
30%
35%
40%
45%
NED
SA
SBK
SA
BG
A
FSR
CP
I
NI NIR
7.4%
-1.9%-0.5%
12.9%
1.3%
11.7%
-5%
0%
5%
10%
15%
20%
FNB
B
BB
B
SCB
NI NIR
22.2%
14.5%
3.1%
12.0%
0%
5%
10%
15%
20%
25%
SCZ
ZanacoNI NIR
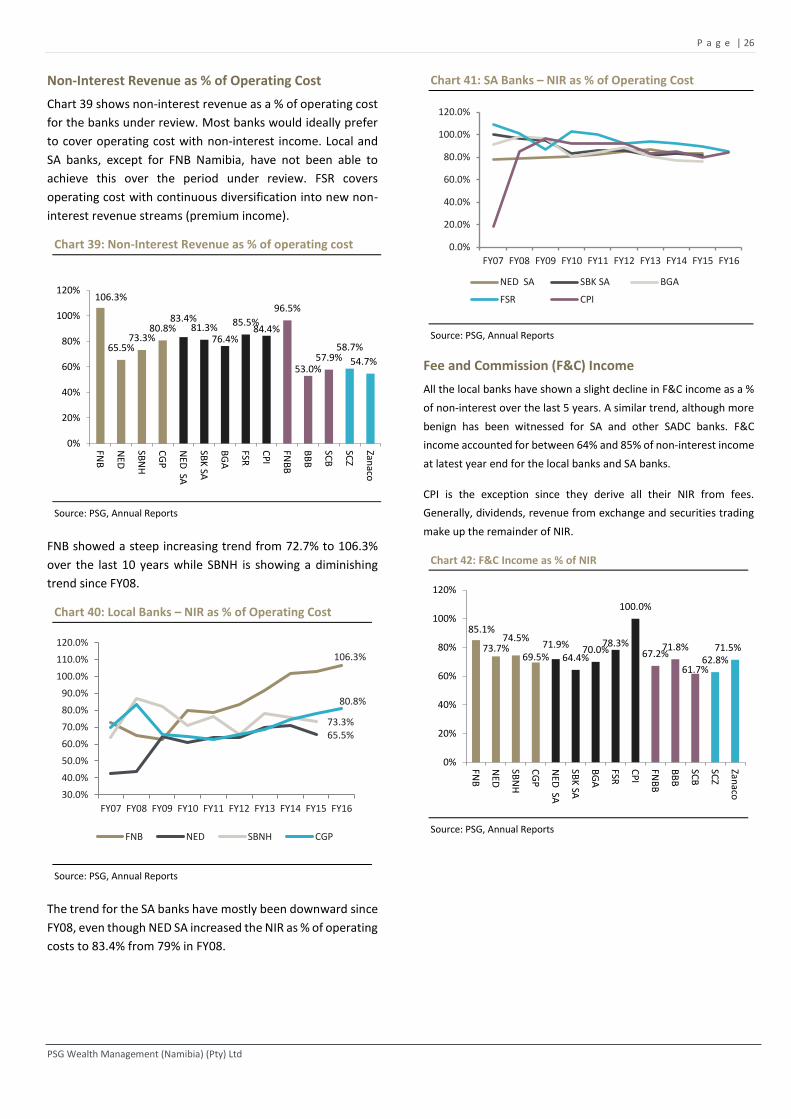
P a g e | 26
PSG Wealth Management (Namibia) (Pty) Ltd
Non-Interest Revenue as % of Operating Cost
Chart 39 shows non-interest revenue as a % of operating cost
for the banks under review. Most banks would ideally prefer
to cover operating cost with non-interest income. Local and
SA banks, except for FNB Namibia, have not been able to
achieve this over the period under review. FSR covers
operating cost with continuous diversification into new non-
interest revenue streams (premium income).
Chart 39: Non-Interest Revenue as % of operating cost
Source: PSG, Annual Reports
FNB showed a steep increasing trend from 72.7% to 106.3%
over the last 10 years while SBNH is showing a diminishing
trend since FY08.
Chart 40: Local Banks – NIR as % of Operating Cost
Source: PSG, Annual Reports
The trend for the SA banks have mostly been downward since
FY08, even though NED SA increased the NIR as % of operating
costs to 83.4% from 79% in FY08.
Chart 41: SA Banks – NIR as % of Operating Cost
Source: PSG, Annual Reports
Fee and Commission (F&C) Income
All the local banks have shown a slight decline in F&C income as a %
of non-interest over the last 5 years. A similar trend, although more
benign has been witnessed for SA and other SADC banks. F&C
income accounted for between 64% and 85% of non-interest income
at latest year end for the local banks and SA banks.
CPI is the exception since they derive all their NIR from fees.
Generally, dividends, revenue from exchange and securities trading
make up the remainder of NIR.
Chart 42: F&C Income as % of NIR
Source: PSG, Annual Reports
106.3%
65.5%73.3%
80.8%83.4%
81.3%76.4%
85.5%84.4%
96.5%
53.0%57.9%
58.7%
54.7%
0%
20%
40%
60%
80%
100%
120%
FNB
NED
SBN
H
CG
P
NED
SA
SBK
SA
BG
A
FSR
CP
I
FNB
B
BB
B
SCB
SCZ
Zanaco
106.3%
80.8%
73.3%65.5%
30.0%
40.0%
50.0%
60.0%
70.0%
80.0%
90.0%
100.0%
110.0%
120.0%
FY07 FY08 FY09 FY10 FY11 FY12 FY13 FY14 FY15 FY16
FNB NED SBNH CGP
0.0%
20.0%
40.0%
60.0%
80.0%
100.0%
120.0%
FY07 FY08 FY09 FY10 FY11 FY12 FY13 FY14 FY15 FY16
NED SA SBK SA BGA
FSR CPI
85.1%
73.7%74.5%
69.5%71.9%
64.4%70.0%
78.3%
100.0%
67.2%71.8%
61.7%62.8%
71.5%
0%
20%
40%
60%
80%
100%
120%
FNB
NED
SBN
H
CG
P
NED
SA
SBK
SA
BG
A
FSR
CP
I
FNB
B
BB
B
SCB
SCZ
Zanaco
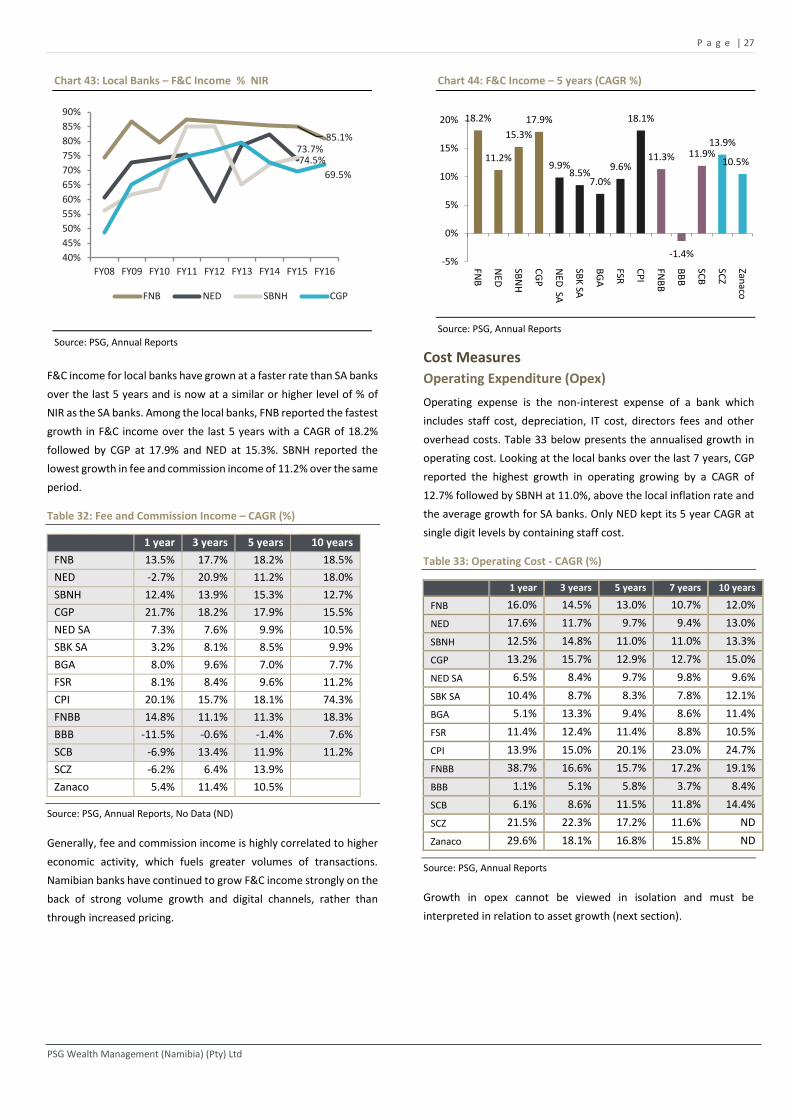
P a g e | 27
PSG Wealth Management (Namibia) (Pty) Ltd
Chart 43: Local Banks – F&C Income % NIR
Source: PSG, Annual Reports
F&C income for local banks have grown at a faster rate than SA banks
over the last 5 years and is now at a similar or higher level of % of
NIR as the SA banks. Among the local banks, FNB reported the fastest
growth in F&C income over the last 5 years with a CAGR of 18.2%
followed by CGP at 17.9% and NED at 15.3%. SBNH reported the
lowest growth in fee and commission income of 11.2% over the same
period.
Table 32: Fee and Commission Income – CAGR (%)
1 year 3 years 5 years 10 years
FNB 13.5% 17.7% 18.2% 18.5%
NED -2.7% 20.9% 11.2% 18.0%
SBNH 12.4% 13.9% 15.3% 12.7%
CGP 21.7% 18.2% 17.9% 15.5%
NED SA 7.3% 7.6% 9.9% 10.5%
SBK SA 3.2% 8.1% 8.5% 9.9%
BGA 8.0% 9.6% 7.0% 7.7%
FSR 8.1% 8.4% 9.6% 11.2%
CPI 20.1% 15.7% 18.1% 74.3%
FNBB 14.8% 11.1% 11.3% 18.3%
BBB -11.5% -0.6% -1.4% 7.6%
SCB -6.9% 13.4% 11.9% 11.2%
SCZ -6.2% 6.4% 13.9%
Zanaco 5.4% 11.4% 10.5%
Source: PSG, Annual Reports, No Data (ND)
Generally, fee and commission income is highly correlated to higher
economic activity, which fuels greater volumes of transactions.
Namibian banks have continued to grow F&C income strongly on the
back of strong volume growth and digital channels, rather than
through increased pricing.
Chart 44: F&C Income – 5 years (CAGR %)
Source: PSG, Annual Reports
Cost Measures
Operating Expenditure (Opex)
Operating expense is the non-interest expense of a bank which
includes staff cost, depreciation, IT cost, directors fees and other
overhead costs. Table 33 below presents the annualised growth in
operating cost. Looking at the local banks over the last 7 years, CGP
reported the highest growth in operating growing by a CAGR of
12.7% followed by SBNH at 11.0%, above the local inflation rate and
the average growth for SA banks. Only NED kept its 5 year CAGR at
single digit levels by containing staff cost.
Table 33: Operating Cost - CAGR (%)
1 year 3 years 5 years 7 years 10 years
FNB 16.0% 14.5% 13.0% 10.7% 12.0%
NED 17.6% 11.7% 9.7% 9.4% 13.0%
SBNH 12.5% 14.8% 11.0% 11.0% 13.3%
CGP 13.2% 15.7% 12.9% 12.7% 15.0%
NED SA 6.5% 8.4% 9.7% 9.8% 9.6%
SBK SA 10.4% 8.7% 8.3% 7.8% 12.1%
BGA 5.1% 13.3% 9.4% 8.6% 11.4%
FSR 11.4% 12.4% 11.4% 8.8% 10.5%
CPI 13.9% 15.0% 20.1% 23.0% 24.7%
FNBB 38.7% 16.6% 15.7% 17.2% 19.1%
BBB 1.1% 5.1% 5.8% 3.7% 8.4%
SCB 6.1% 8.6% 11.5% 11.8% 14.4%
SCZ 21.5% 22.3% 17.2% 11.6% ND
Zanaco 29.6% 18.1% 16.8% 15.8% ND
Source: PSG, Annual Reports
Growth in opex cannot be viewed in isolation and must be
interpreted in relation to asset growth (next section).
85.1%73.7%74.5%
69.5%
40%
45%
50%
55%
60%
65%
70%
75%
80%
85%
90%
FY08 FY09 FY10 FY11 FY12 FY13 FY14 FY15 FY16
FNB NED SBNH CGP
18.2%
11.2%
15.3%
17.9%
9.9%8.5%
7.0%
9.6%
18.1%
11.3%
-1.4%
11.9%13.9%
10.5%
-5%
0%
5%
10%
15%
20%
FNB
NED
SBN
H
CG
P
NED
SA
SBK
SA
BG
A
FSR
CP
I
FNB
B
BB
B
SCB
SCZ
Zanaco
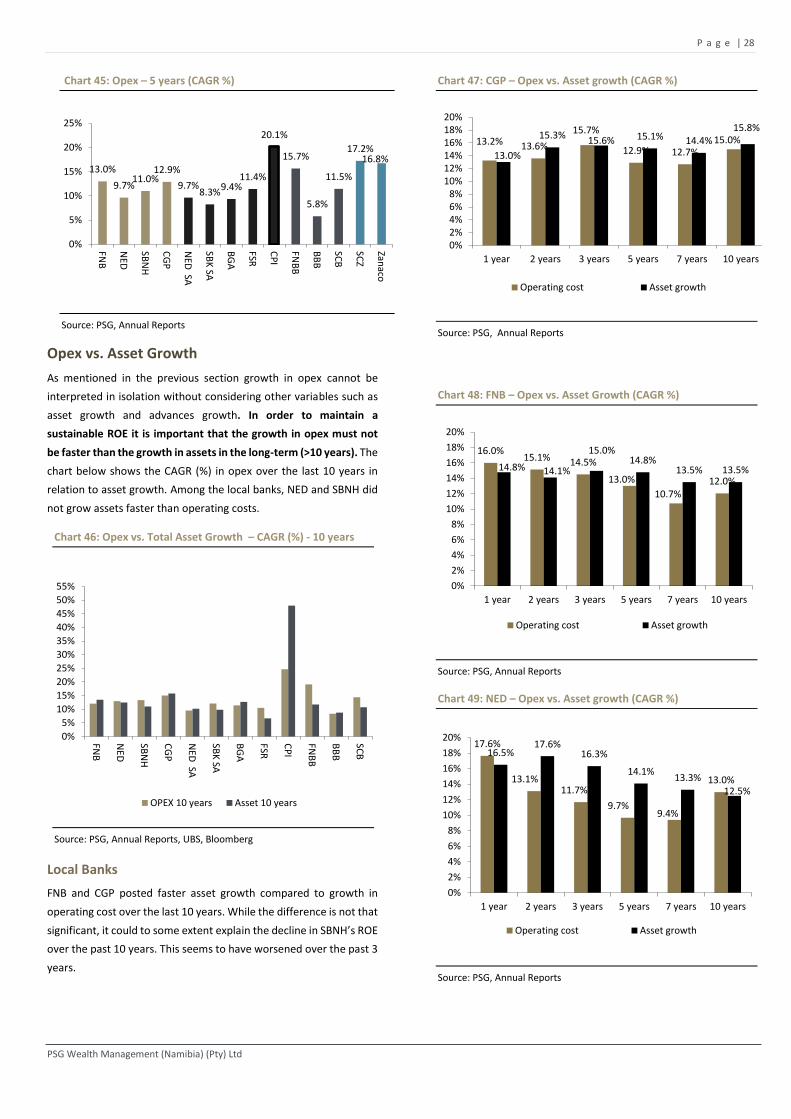
P a g e | 28
PSG Wealth Management (Namibia) (Pty) Ltd
Chart 45: Opex – 5 years (CAGR %)
Source: PSG, Annual Reports
Opex vs. Asset Growth
As mentioned in the previous section growth in opex cannot be
interpreted in isolation without considering other variables such as
asset growth and advances growth. In order to maintain a
sustainable ROE it is important that the growth in opex must not
be faster than the growth in assets in the long-term (>10 years). The
chart below shows the CAGR (%) in opex over the last 10 years in
relation to asset growth. Among the local banks, NED and SBNH did
not grow assets faster than operating costs.
Chart 46: Opex vs. Total Asset Growth – CAGR (%) - 10 years
Source: PSG, Annual Reports, UBS, Bloomberg
Local Banks
FNB and CGP posted faster asset growth compared to growth in
operating cost over the last 10 years. While the difference is not that
significant, it could to some extent explain the decline in SBNH’s ROE
over the past 10 years. This seems to have worsened over the past 3
years.
Chart 47: CGP – Opex vs. Asset growth (CAGR %)
Source: PSG, Annual Reports
Chart 48: FNB – Opex vs. Asset Growth (CAGR %)
Source: PSG, Annual Reports
Chart 49: NED – Opex vs. Asset growth (CAGR %)
Source: PSG, Annual Reports
13.0%
9.7%11.0%
12.9%
9.7%8.3%9.4%
11.4%
20.1%
15.7%
5.8%
11.5%
17.2%16.8%
0%
5%
10%
15%
20%
25%
FNB
NED
SBN
H
CG
P
NED
SA
SBK
SA
BG
A
FSR
CP
I
FNB
B
BB
B
SCB
SCZ
Zanaco
0%
5%
10%
15%
20%
25%
30%
35%
40%
45%
50%
55%
FNB
NED
SBN
H
CG
P
NED
SA
SBK
SA
BG
A
FSR
CP
I
FNB
B
BB
B
SCB
OPEX 10 years Asset 10 years
13.2% 13.6%
15.7%
12.9% 12.7%15.0%
13.0%
15.3% 15.6% 15.1% 14.4%15.8%
0%2%4%6%8%
10%12%14%16%18%20%
1 year 2 years 3 years 5 years 7 years 10 years
Operating cost Asset growth
16.0%15.1% 14.5%
13.0%
10.7%12.0%
14.8% 14.1%
15.0%14.8%
13.5% 13.5%
0%
2%
4%
6%
8%
10%
12%
14%
16%
18%
20%
1 year 2 years 3 years 5 years 7 years 10 years
Operating cost Asset growth
17.6%
13.1%11.7%
9.7%9.4%
13.0%
16.5%17.6%
16.3%
14.1%13.3%
12.5%
0%
2%
4%
6%
8%
10%
12%
14%
16%
18%
20%
1 year 2 years 3 years 5 years 7 years 10 years
Operating cost Asset growth

P a g e | 29
PSG Wealth Management (Namibia) (Pty) Ltd
Chart 50: SBNH – Opex vs. Asset growth (CAGR %)
Source: PSG, Annual Reports
SA Banks
Except for FSR and SBK, all the SA banks grew assets at a faster
annualised rate than opex over the last 10 years.
Chart 51: BGA – Opex vs. Asset Growth (CAGR %)
Source: PSG, UBS
Chart 52: FSR – Opex vs. Asset growth (CAGR %)
Source: PSG, UBS, Bloomberg, Annual reports
Chart 53: NED SA – Opex vs. Asset Growth (CAGR %)
Source: PSG, UBS, Bloomberg, Annual Reports
SBK SA has grown its assets grew at a CAGR of 8.2% over the last 5
years and this asset growth has lagged behind operating cost
growth over all periods.
12.5%13.5%
14.8%
11.0% 11.0%
13.3%
9.9%9.2% 9.7% 10.7% 10.5% 11.0%
0%
2%
4%
6%
8%
10%
12%
14%
16%
18%
20%
1 year 2 years 3 years 5 years 7 years 10 years
Operating cost Asset growth
5.1%6.2%
13.3%
9.4% 8.6%
11.4%
15.5%
9.0%
12.1%9.5%
5.7%
12.7%
0%
2%
4%
6%
8%
10%
12%
14%
16%
18%
20%
1 year 2 years 3 years 5 years 7 years 10 years
Operating cost Asset growth
11.4% 10.9%12.4%
11.4%
8.8%
10.5%
8.5%10.2% 9.9% 10.4%
5.1%6.7%
0%
2%
4%
6%
8%
10%
12%
14%
16%
18%
20%
1 year 2 years 3 years 5 years 7 years 10 years
Operating cost Asset growth
6.5%8.0% 8.4%
9.7% 9.8% 9.6%
14.4%
11.1% 10.7%
8.7%7.3%
10.1%
0%
2%
4%
6%
8%
10%
12%
14%
16%
18%
20%
1 year 2 years 3 years 5 years 7 years 10 years
Operating cost Asset growth

P a g e | 30
PSG Wealth Management (Namibia) (Pty) Ltd
Chart 54: SBK SA – Opex vs. Asset Growth (CAGR %)
Source: PSG, UBS
Chart 55: CPI – Opex vs. Asset Growth (CAGR %)
Source: PSG, UBS, Bloomberg, Annual reports
The shining star in the Opex vs Asset growth ratio, CPI have, in the
last financial year, returned to asset growth outpacing operating
cost.
Botswana and Zambian Banks
BBB reported consistent faster growth in assets relative to costs
over the last 3 years, which is contributing to improving the 10 year
difference in asset and opex growth.
Chart 56: BBB – Opex vs. Asset Growth (CAGR %)
Source: PSG, Annual Reports
FNBB’s very high growth in opex over the last year of 38.7% has
caused all of the reporting periods to indicate opex growth being
higher than asset growth. This is due to intensive focus now being
placed on the regulatory environment in Botswana, requiring the
Bank to invest substantially in the risk, compliance and regulatory
functions. The cost to the Bank of maintaining and upskilling
adequate risk and compliance capacity and of responding to new
requirements is reflected by the increased human resource costs.
Chart 57: FNBB – Opex vs. Asset Growth (CAGR %)
Source: PSG, Annual Reports
10.4% 10.6%8.7% 8.3%
7.8%
12.1%
3.9%
8.2% 8.2% 8.2%
4.0%
9.8%
0%
2%
4%
6%
8%
10%
12%
14%
16%
18%
20%
1 year 2 years 3 years 5 years 7 years 10 years
Operating cost Asset growth
13.9%
19.0%
15.0%
20.1% 23.0%24.7%
16.7%16.7% 18.0%
34.2%
43.7%48.0%
0%
5%
10%
15%
20%
25%
30%
35%
40%
45%
50%
1 year 2 years 3 years 5 years 7 years 10 years
Operating cost Asset growth
1.1%2.9%
5.1%5.8%
3.7%
8.4%
19.6%
11.8%
8.1%
4.7%
0.8%
8.8%
0%2%4%6%8%
10%12%14%16%18%20%
1 year 2 years 3 years 5 years 7 years 10 years
Operating cost Asset growth
38.7%
17.7% 16.6% 15.7%17.2%
19.1%
4.4%
11.4% 11.5% 10.7%8.4%
11.7%
0%
5%
10%
15%
20%
25%
30%
35%
40%
45%
1 year 2 years 3 years 5 years 7 years 10 years
Operating cost Asset growth

P a g e | 31
PSG Wealth Management (Namibia) (Pty) Ltd
Chart 58: SCB – Opex vs. Asset Growth (CAGR %)
Source: PSG, Annual Reports
Over the last 7 years, SCZ has been growing its assets (19.7%) at a
faster pace than opex while SCB has seen 7 year opex growth far
exceed asset growth.
Chart 59: SCZ – Opex vs. Asset Growth (CAGR %)
Source: PSG, Annual Reports
Chart 60: Zanaco– Opex vs. Asset Growth (CAGR %)
Source: PSG, Annual Reports
Cost-to-Income
The cost-to-income ratio is a measure of cost efficiency relative to
total operating income after the impairment of advances. When
total income is growing faster than operating cost, a bank can
achieve improved cost efficiency resulting in a gradually declining
cost-to-income ratio over time. Improved cost efficiency has a
positive impact on profits, meaning there exists an inverse
relationship between the cost-to-income ratio and the bank's
profitability.
A generally accepted rule of thumb is that a ratio under 60% is
favourable. Chart 61 shows that most of the local and SA banks are
operating at or below this level. Among the local banks FNB and CGP
are the most cost efficient banks at 43.6% and 50.2% at FY16 while
NED is at 59.6%
Chart 61: Cost-to-Income
Source: PSG, Annual Reports, Bloomberg, Annual reports
Chart 62: Local Banks – Cost-to-Income (%)
Source: PSG, Annual Reports
6.1%
10.5%
8.6%
11.5% 11.8%
14.4%
2.6%
14.4%
12.0%
4.4%5.4%
10.7%
0%
2%
4%
6%
8%
10%
12%
14%
16%
18%
20%
1 year 2 years 3 years 5 years 7 years 10 years
Operating cost Asset growth
21.5%
24.5%22.3%
17.2%
11.6%
30.7%
25.5%
18.6%
13.5%
19.7%
0%
5%
10%
15%
20%
25%
30%
35%
1 year 2 years 3 years 5 years 7 years
Operating cost Asset growth
29.6%
20.3%18.1%
16.8% 15.8%19.2%
6.8%
11.0%
17.7%
15.4%
0%
5%
10%
15%
20%
25%
30%
35%
1 year 2 years 3 years 5 years 7 years
Operating cost Asset growth
43.6%
59.6%60.9%
50.2%59.2%
61.1%58.2%
53.2%
34.1%
58.4%
68.1%
91.1%
64.2%
80.9%
0.0%
10.0%
20.0%
30.0%
40.0%
50.0%
60.0%
70.0%
80.0%
90.0%
100.0%
FNB
NED
SBN
H
CG
P
NED
SA
SBK
SA
BG
A
FSR
CP
I
FNB
B
BB
B
SCB
SCZ
Zanaco
43.6%
59.6%
60.9%
50.2%
40%
50%
60%
70%
80%
FY07 FY08 FY09 FY10 FY11 FY12 FY13 FY14 FY15 FY16
FNB NED SBNH CGP

P a g e | 32
PSG Wealth Management (Namibia) (Pty) Ltd
Local banks have generally improved cost efficiencies over the last 5
years. SBNH have also improved their ratio over the last two years,
after deteriorating from FY08. The SA banks have consistently kept
their cost-to-income ratios between 50% and 60% over the last 5
years. SBK SA has seen its ratio increase to 61.1% over the last year.
CPI is the outlier which reduced its cost-to-income ratio to below
35%
Chart 63: SA Banks – Cost-to-Income (%)
Source: PSG, UBS, Bloomberg, Annual reports
In contrast, the Botswana banks have showed some deterioration in
cost efficiency over the last 5 years, especially BBB where the cost-
to income ratio increased significantly from 44.9% in FY10 to 68.1%
in FY15. SCB’s ratio has increased to over 90% in the last year with
the decrease in NI and NIR coupled with the increase in opex. FNBB
is the most cost efficient bank at 58.4% of total income.
Chart 64: Botswana Banks – Cost-to-Income (%)
Source: PSG, Annual Reports
After reporting significant improvement in cost efficiencies from
FY08 to FY12, the Zambian banks have seen their cost-to-income
ratios increase over the last 3 years.
Chart 65: Zambian Banks – Cost-to-Income (%)
Source: PSG, Annual Reports
20%
30%
40%
50%
60%
70%
FY07 FY08 FY09 FY10 FY11 FY12 FY13 FY14 FY15 FY16
NED SA SBK SA BGA FSR CPI
58.4%68.1%
91.1%
0%10%
20%
30%
40%
50%60%
70%80%
90%
100%
FY07 FY08 FY09 FY10 FY11 FY12 FY13 FY14 FY15 FY16
FNBB BBB SCB
30%
40%
50%
60%
70%
80%
90%
FY07 FY08 FY09 FY10 FY11 FY12 FY13 FY14 FY15
SCZ Zanaco
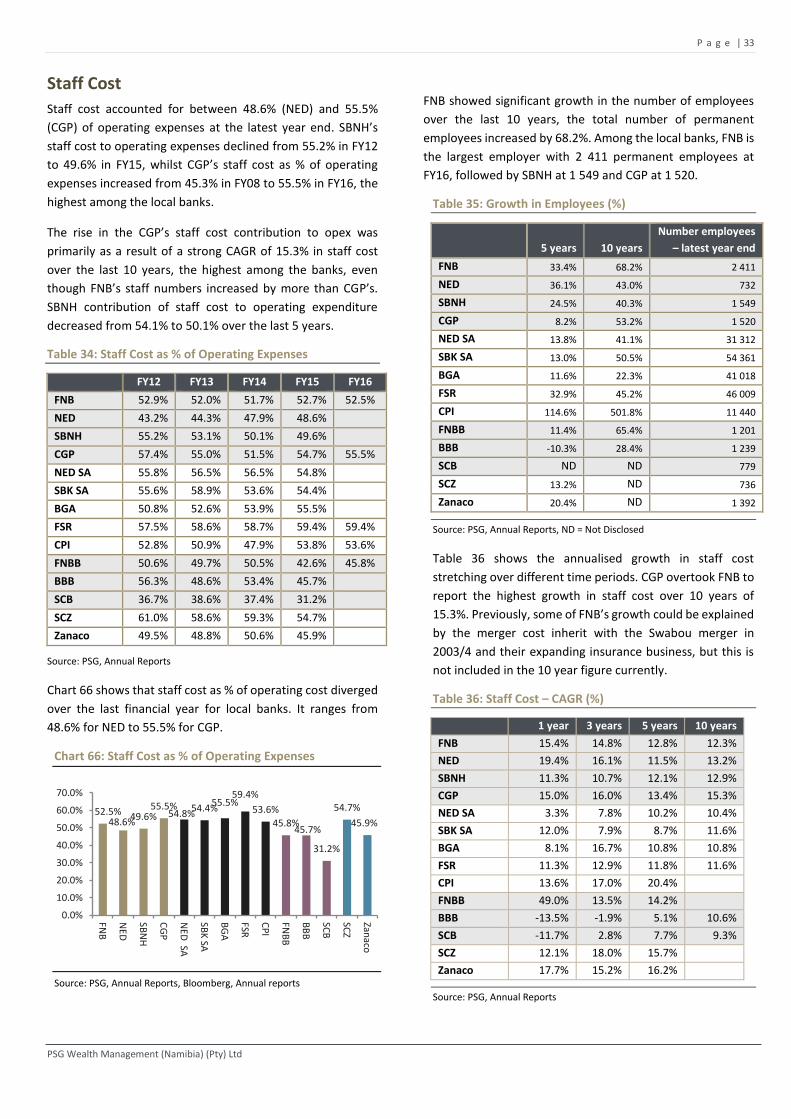
P a g e | 33
PSG Wealth Management (Namibia) (Pty) Ltd
Staff Cost
Staff cost accounted for between 48.6% (NED) and 55.5%
(CGP) of operating expenses at the latest year end. SBNH’s
staff cost to operating expenses declined from 55.2% in FY12
to 49.6% in FY15, whilst CGP’s staff cost as % of operating
expenses increased from 45.3% in FY08 to 55.5% in FY16, the
highest among the local banks.
The rise in the CGP’s staff cost contribution to opex was
primarily as a result of a strong CAGR of 15.3% in staff cost
over the last 10 years, the highest among the banks, even
though FNB’s staff numbers increased by more than CGP’s.
SBNH contribution of staff cost to operating expenditure
decreased from 54.1% to 50.1% over the last 5 years.
Table 34: Staff Cost as % of Operating Expenses
FY12 FY13 FY14 FY15 FY16
FNB 52.9% 52.0% 51.7% 52.7% 52.5%
NED 43.2% 44.3% 47.9% 48.6%
SBNH 55.2% 53.1% 50.1% 49.6%
CGP 57.4% 55.0% 51.5% 54.7% 55.5%
NED SA 55.8% 56.5% 56.5% 54.8%
SBK SA 55.6% 58.9% 53.6% 54.4%
BGA 50.8% 52.6% 53.9% 55.5%
FSR 57.5% 58.6% 58.7% 59.4% 59.4%
CPI 52.8% 50.9% 47.9% 53.8% 53.6%
FNBB 50.6% 49.7% 50.5% 42.6% 45.8%
BBB 56.3% 48.6% 53.4% 45.7%
SCB 36.7% 38.6% 37.4% 31.2%
SCZ 61.0% 58.6% 59.3% 54.7%
Zanaco 49.5% 48.8% 50.6% 45.9%
Source: PSG, Annual Reports
Chart 66 shows that staff cost as % of operating cost diverged
over the last financial year for local banks. It ranges from
48.6% for NED to 55.5% for CGP.
Chart 66: Staff Cost as % of Operating Expenses
Source: PSG, Annual Reports, Bloomberg, Annual reports
FNB showed significant growth in the number of employees
over the last 10 years, the total number of permanent
employees increased by 68.2%. Among the local banks, FNB is
the largest employer with 2 411 permanent employees at
FY16, followed by SBNH at 1 549 and CGP at 1 520.
Table 35: Growth in Employees (%)
5 years 10 years
Number employees
– latest year end
FNB 33.4% 68.2% 2 411
NED 36.1% 43.0% 732
SBNH 24.5% 40.3% 1 549
CGP 8.2% 53.2% 1 520
NED SA 13.8% 41.1% 31 312
SBK SA 13.0% 50.5% 54 361
BGA 11.6% 22.3% 41 018
FSR 32.9% 45.2% 46 009
CPI 114.6% 501.8% 11 440
FNBB 11.4% 65.4% 1 201
BBB -10.3% 28.4% 1 239
SCB ND ND 779
SCZ 13.2% ND 736
Zanaco 20.4% ND 1 392
Source: PSG, Annual Reports, ND = Not Disclosed
Table 36 shows the annualised growth in staff cost
stretching over different time periods. CGP overtook FNB to
report the highest growth in staff cost over 10 years of
15.3%. Previously, some of FNB’s growth could be explained
by the merger cost inherit with the Swabou merger in
2003/4 and their expanding insurance business, but this is
not included in the 10 year figure currently.
Table 36: Staff Cost – CAGR (%)
1 year 3 years 5 years 10 years
FNB 15.4% 14.8% 12.8% 12.3%
NED 19.4% 16.1% 11.5% 13.2%
SBNH 11.3% 10.7% 12.1% 12.9%
CGP 15.0% 16.0% 13.4% 15.3%
NED SA 3.3% 7.8% 10.2% 10.4%
SBK SA 12.0% 7.9% 8.7% 11.6%
BGA 8.1% 16.7% 10.8% 10.8%
FSR 11.3% 12.9% 11.8% 11.6%
CPI 13.6% 17.0% 20.4%
FNBB 49.0% 13.5% 14.2%
BBB -13.5% -1.9% 5.1% 10.6%
SCB -11.7% 2.8% 7.7% 9.3%
SCZ 12.1% 18.0% 15.7%
Zanaco 17.7% 15.2% 16.2%
Source: PSG, Annual Reports
52.5%48.6%
49.6%55.5%
54.8%54.4%
55.5%59.4%
53.6%
45.8%45.7%
31.2%
54.7%
45.9%
0.0%
10.0%
20.0%
30.0%
40.0%
50.0%
60.0%
70.0%
FNB
NED
SBN
H
CG
P
NED
SA
SBK
SA
BG
A
FSR
CP
I
FNB
B
BB
B
SCB
SCZ
Zanaco

P a g e | 34
PSG Wealth Management (Namibia) (Pty) Ltd
For the Botswana banks, it is interesting to note that
Barclays and SCB laid off workers and their staff cost
declined over the last year while FNB employed more staff
for risk and compliance, increasing their staff cost by 49.0%.
Table 36 shows the growth in other operating expenses
(Operating expenses less staff cost). It is only NED that has
grown other operating expenses at single digits over the last
3, 5 and 7 years. All the other banks show double digit
growth in this number over all measured periods.
Table 37: Other Operating Expense – CAGR (%)
1 year 3 years 5 years 7 years 10 years
FNB 16.7% 14.2% 13.3% 9.1% 11.8%
NED 16.0% 8.1% 8.1% 9.7% 12.7%
SBNH 13.8% 19.4% 10.0% 10.6% 13.8%
CGP 11.1% 15.2% 12.3% 10.5% 14.6%
NED SA 10.6% 9.2% 9.0% 8.9% 8.6%
SBK SA 8.5% 9.6% 7.8% 8.3% 12.7%
BGA 1.5% 9.6% 7.8% 8.4% 12.2%
FSR 11.6% 11.7% 10.8% 5.5% 9.2%
CPI 14.3% 12.9% 19.8% 20.2% 15.5%
FNBB 31.1% 19.6% 17.0% 18.1% 20.0%
BBB 17.9% 13.0% 6.4% 2.0% 6.8%
SCB 16.7% 11.7% 13.4% 16.5% 17.9%
SCZ 35.1% 28.5% 19.3% 12.5%
Zanaco 41.8% 20.9% 17.2% 6.1%
Source: PSG, Annual Reports
Staff Cost per Employee
Chart 67 shows the staff cost per employee (converted to N$)
for the local and SA banks under review at the latest year-end.
Staff cost includes salaries, pension and other benefits.
Among the local banks, CGP and SBNH reported the highest
cost per employee at the latest year end, however this must
be seen in relation to the growth in profit per employee and
growth over time.
Chart 67: Staff Cost per Employee (N$000)
Source: PSG, Annual Reports, Bloomberg, Annual reports
In order to better illustrate each bank’s growth in staff cost
per employee over the last 13 years, we constructed an index
with 2003 as base year (base year = 100). Chart 68 shows the
growth in staff cost per employee for the local banks relative
to the Namibia Consumer Price Index (NCPI). SBNH recorded
the highest cost per employee growth over the last 10 years,
significantly above the local inflation rate and SA peers.
CGP reported the lowest growth in staff cost per employee
over the last 10 years, in line with the local inflation rate which
contributed to the bank’s superior earnings growth over the
period.
Chart 68: Local Banks – Staff Cost per Employee Index (2003 =100)
Source: PSG, Annual Reports
298 320 336375
454507
464517
211
298 289 284
481
360
0
100
200
300
400
500
600
FNB
NED
SBN
H
CG
P
NED
SA
SBK
SA
BG
A
FSR
CP
I
FNB
B
BB
B
SCB
SCZ
Zanaco
371
450
248 285
193
50
100
150
200
250
300
350
400
450
500
FY0
3
FY0
4
FY0
5
FY0
6
FY0
7
FY0
8
FY0
9
FY1
0
FY1
1
FY1
2
FY1
3
FY1
4
FY1
5
FY1
6
FNB NED SBNH
CGP NCPI Index
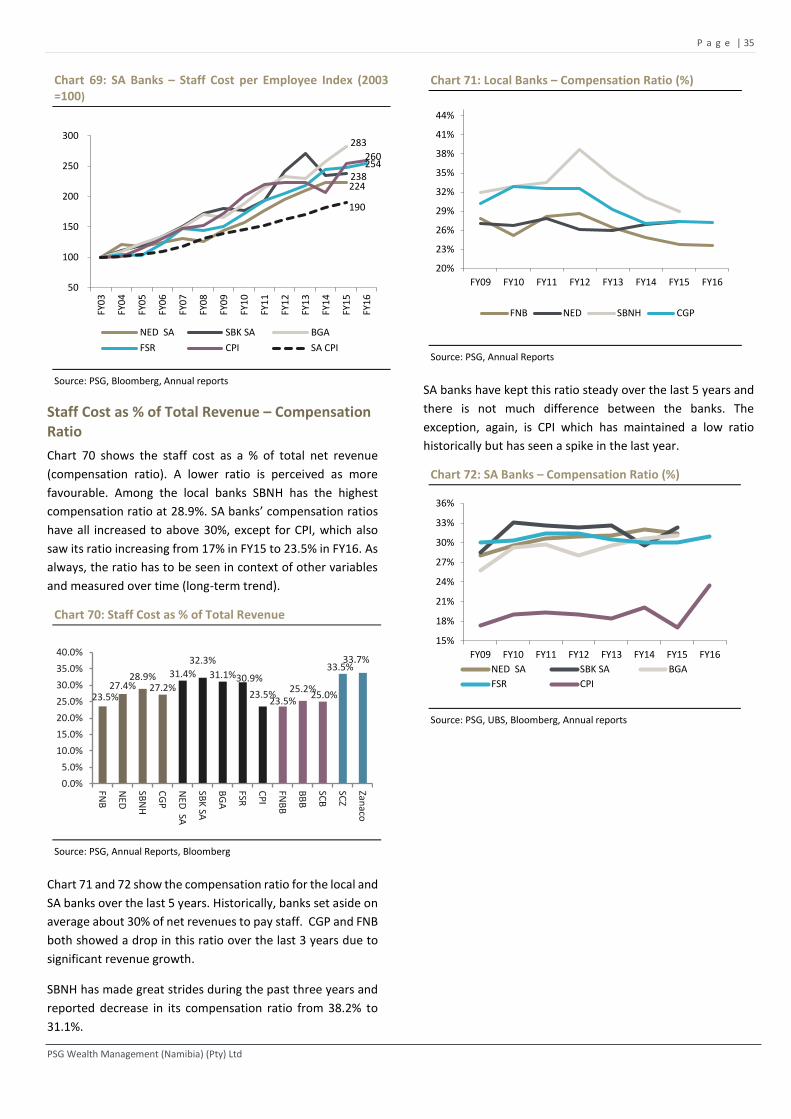
P a g e | 35
PSG Wealth Management (Namibia) (Pty) Ltd
Chart 69: SA Banks – Staff Cost per Employee Index (2003 =100)
Source: PSG, Bloomberg, Annual reports
Staff Cost as % of Total Revenue – Compensation Ratio
Chart 70 shows the staff cost as a % of total net revenue
(compensation ratio). A lower ratio is perceived as more
favourable. Among the local banks SBNH has the highest
compensation ratio at 28.9%. SA banks’ compensation ratios
have all increased to above 30%, except for CPI, which also
saw its ratio increasing from 17% in FY15 to 23.5% in FY16. As
always, the ratio has to be seen in context of other variables
and measured over time (long-term trend).
Chart 70: Staff Cost as % of Total Revenue
Source: PSG, Annual Reports, Bloomberg
Chart 71 and 72 show the compensation ratio for the local and
SA banks over the last 5 years. Historically, banks set aside on
average about 30% of net revenues to pay staff. CGP and FNB
both showed a drop in this ratio over the last 3 years due to
significant revenue growth.
SBNH has made great strides during the past three years and
reported decrease in its compensation ratio from 38.2% to
31.1%.
Chart 71: Local Banks – Compensation Ratio (%)
Source: PSG, Annual Reports
SA banks have kept this ratio steady over the last 5 years and
there is not much difference between the banks. The
exception, again, is CPI which has maintained a low ratio
historically but has seen a spike in the last year.
Chart 72: SA Banks – Compensation Ratio (%)
Source: PSG, UBS, Bloomberg, Annual reports
224 238
283
254 260
190
50
100
150
200
250
300
FY0
3
FY0
4
FY0
5
FY0
6
FY0
7
FY0
8
FY0
9
FY1
0
FY1
1
FY1
2
FY1
3
FY1
4
FY1
5
FY1
6
NED SA SBK SA BGA
FSR CPI SA CPI
23.5%27.4%
28.9%27.2%
31.4%
32.3%
31.1%30.9%
23.5%23.5%
25.2%25.0%
33.5%33.7%
0.0%
5.0%
10.0%
15.0%
20.0%
25.0%
30.0%
35.0%
40.0%
FNB
NED
SBN
H
CG
P
NED
SA
SBK
SA
BG
A
FSR
CP
I
FNB
B
BB
B
SCB
SCZ
Zanaco
20%
23%
26%
29%
32%
35%
38%
41%
44%
FY09 FY10 FY11 FY12 FY13 FY14 FY15 FY16
FNB NED SBNH CGP
15%
18%
21%
24%
27%
30%
33%
36%
FY09 FY10 FY11 FY12 FY13 FY14 FY15 FY16
NED SA SBK SA BGA
FSR CPI
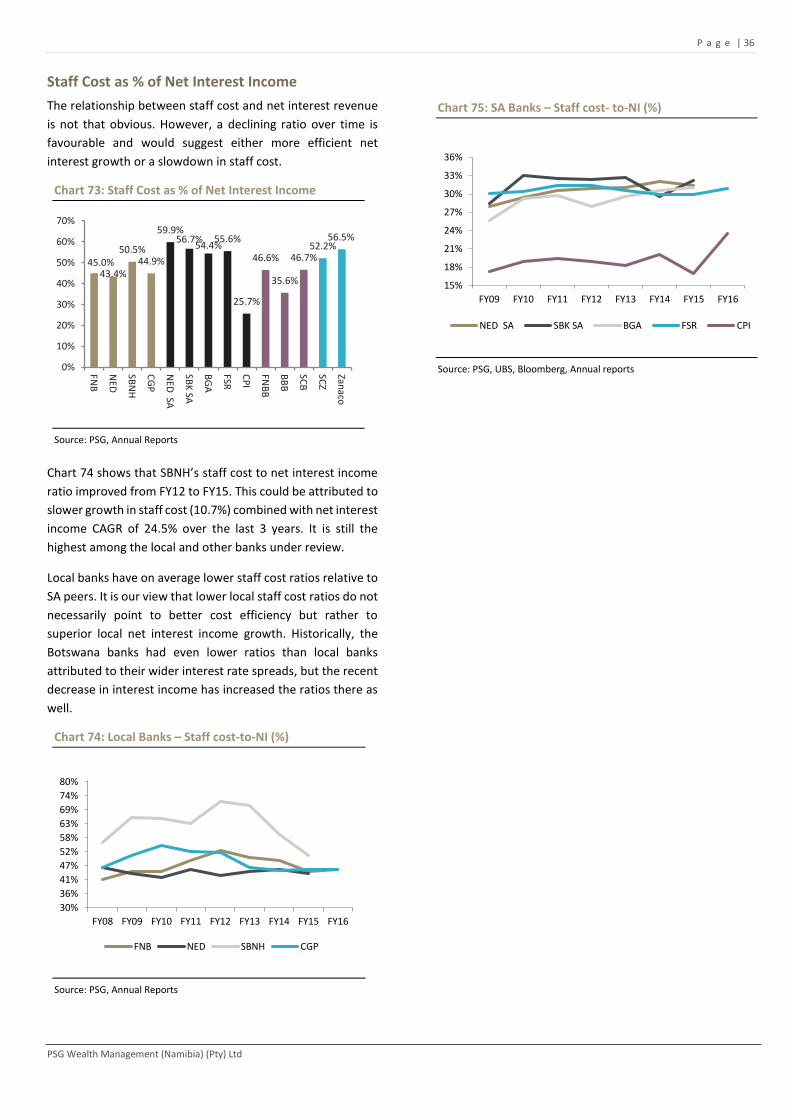
P a g e | 36
PSG Wealth Management (Namibia) (Pty) Ltd
Staff Cost as % of Net Interest Income
The relationship between staff cost and net interest revenue
is not that obvious. However, a declining ratio over time is
favourable and would suggest either more efficient net
interest growth or a slowdown in staff cost.
Chart 73: Staff Cost as % of Net Interest Income
Source: PSG, Annual Reports
Chart 74 shows that SBNH’s staff cost to net interest income
ratio improved from FY12 to FY15. This could be attributed to
slower growth in staff cost (10.7%) combined with net interest
income CAGR of 24.5% over the last 3 years. It is still the
highest among the local and other banks under review.
Local banks have on average lower staff cost ratios relative to
SA peers. It is our view that lower local staff cost ratios do not
necessarily point to better cost efficiency but rather to
superior local net interest income growth. Historically, the
Botswana banks had even lower ratios than local banks
attributed to their wider interest rate spreads, but the recent
decrease in interest income has increased the ratios there as
well.
Chart 74: Local Banks – Staff cost-to-NI (%)
Source: PSG, Annual Reports
Chart 75: SA Banks – Staff cost- to-NI (%)
Source: PSG, UBS, Bloomberg, Annual reports
45.0%43.4%
50.5%44.9%
59.9%56.7%
54.4%55.6%
25.7%
46.6%
35.6%
46.7%52.2%
56.5%
0%
10%
20%
30%
40%
50%
60%
70%
FNB
NED
SBN
H
CG
P
NED
SA
SBK
SA
BG
A
FSR
CP
I
FNB
B
BB
B
SCB
SCZ
Zanaco
30%
36%
41%
47%
52%
58%
63%
69%
74%
80%
FY08 FY09 FY10 FY11 FY12 FY13 FY14 FY15 FY16
FNB NED SBNH CGP
15%
18%
21%
24%
27%
30%
33%
36%
FY09 FY10 FY11 FY12 FY13 FY14 FY15 FY16
NED SA SBK SA BGA FSR CPI
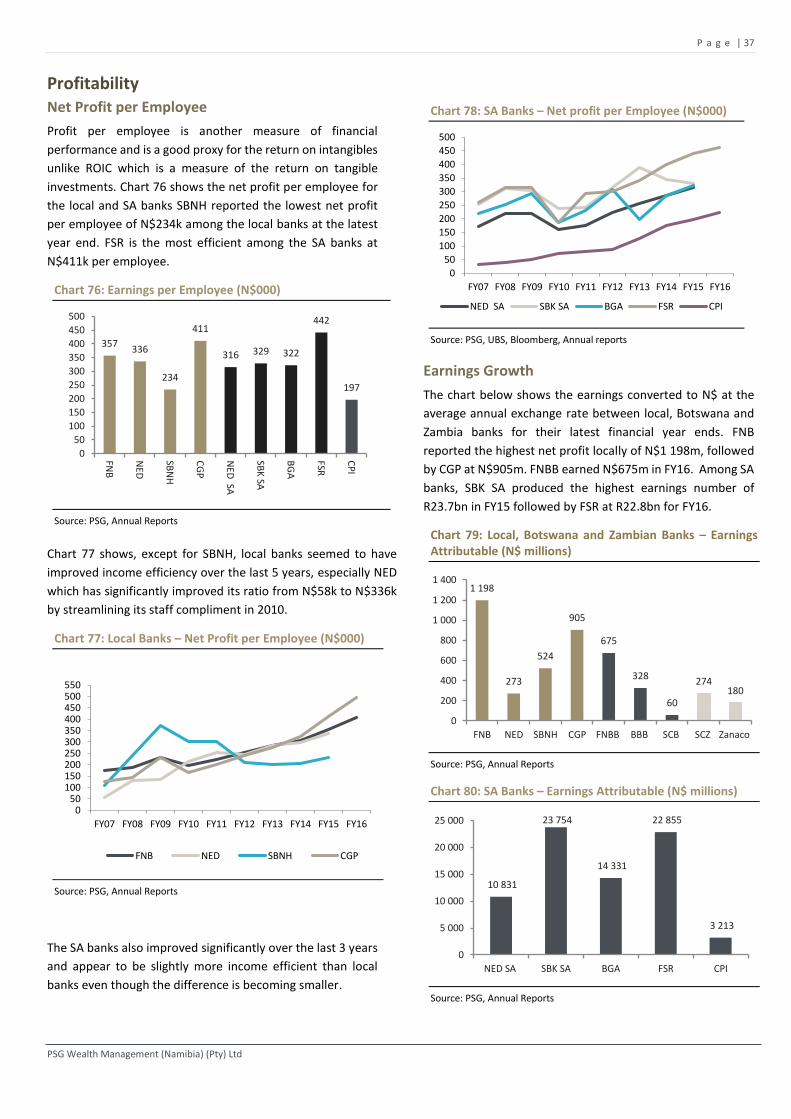
P a g e | 37
PSG Wealth Management (Namibia) (Pty) Ltd
Profitability Net Profit per Employee
Profit per employee is another measure of financial
performance and is a good proxy for the return on intangibles
unlike ROIC which is a measure of the return on tangible
investments. Chart 76 shows the net profit per employee for
the local and SA banks SBNH reported the lowest net profit
per employee of N$234k among the local banks at the latest
year end. FSR is the most efficient among the SA banks at
N$411k per employee.
Chart 76: Earnings per Employee (N$000)
Source: PSG, Annual Reports
Chart 77 shows, except for SBNH, local banks seemed to have
improved income efficiency over the last 5 years, especially NED
which has significantly improved its ratio from N$58k to N$336k
by streamlining its staff compliment in 2010.
Chart 77: Local Banks – Net Profit per Employee (N$000)
Source: PSG, Annual Reports
The SA banks also improved significantly over the last 3 years
and appear to be slightly more income efficient than local
banks even though the difference is becoming smaller.
Chart 78: SA Banks – Net profit per Employee (N$000)
Source: PSG, UBS, Bloomberg, Annual reports
Earnings Growth
The chart below shows the earnings converted to N$ at the
average annual exchange rate between local, Botswana and
Zambia banks for their latest financial year ends. FNB
reported the highest net profit locally of N$1 198m, followed
by CGP at N$905m. FNBB earned N$675m in FY16. Among SA
banks, SBK SA produced the highest earnings number of
R23.7bn in FY15 followed by FSR at R22.8bn for FY16.
Chart 79: Local, Botswana and Zambian Banks – Earnings Attributable (N$ millions)
Source: PSG, Annual Reports
Chart 80: SA Banks – Earnings Attributable (N$ millions)
Source: PSG, Annual Reports
357336
234
411
316 329 322
442
197
0
50
100
150
200
250
300
350
400
450
500
FNB
NED
SBN
H
CG
P
NED
SA
SBK
SA
BG
A
FSR
CP
I
050
100150200250300350400450500550
FY07 FY08 FY09 FY10 FY11 FY12 FY13 FY14 FY15 FY16
FNB NED SBNH CGP
0
50
100
150
200
250
300
350
400
450
500
FY07 FY08 FY09 FY10 FY11 FY12 FY13 FY14 FY15 FY16
NED SA SBK SA BGA FSR CPI
1 198
273
524
905
675
328
60
274180
0
200
400
600
800
1 000
1 200
1 400
FNB NED SBNH CGP FNBB BBB SCB SCZ Zanaco
10 831
23 754
14 331
22 855
3 213
0
5 000
10 000
15 000
20 000
25 000
NED SA SBK SA BGA FSR CPI
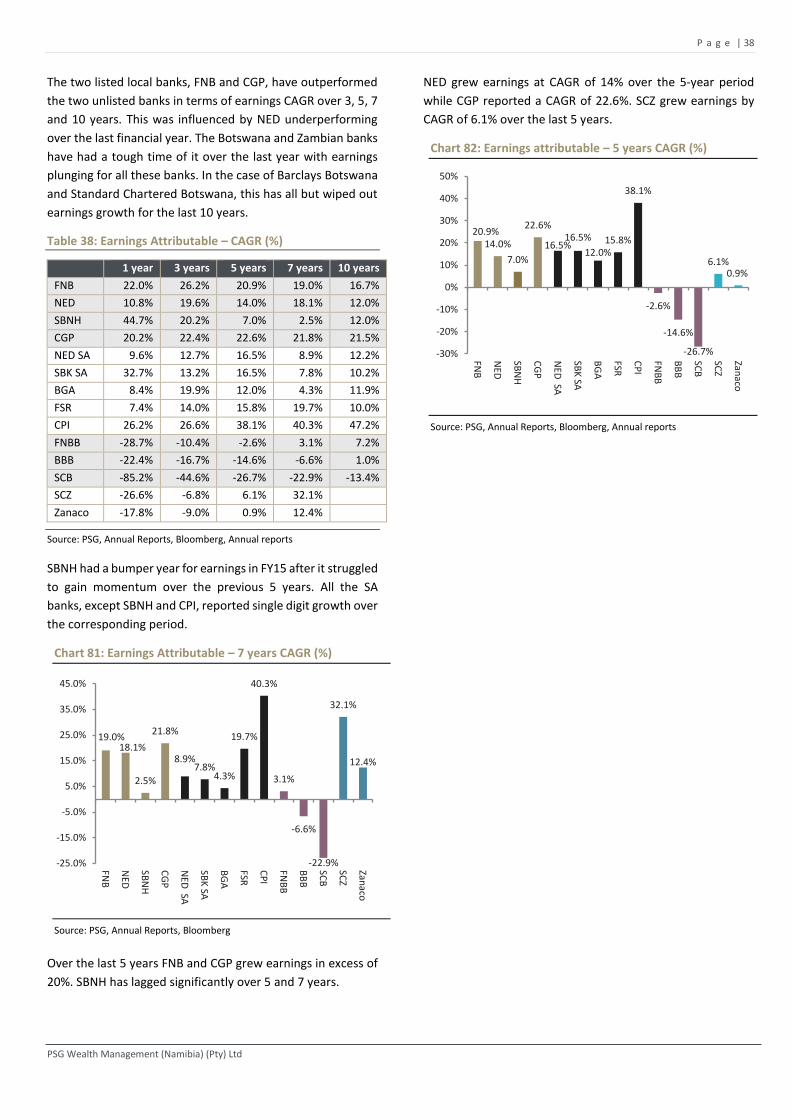
P a g e | 38
PSG Wealth Management (Namibia) (Pty) Ltd
The two listed local banks, FNB and CGP, have outperformed
the two unlisted banks in terms of earnings CAGR over 3, 5, 7
and 10 years. This was influenced by NED underperforming
over the last financial year. The Botswana and Zambian banks
have had a tough time of it over the last year with earnings
plunging for all these banks. In the case of Barclays Botswana
and Standard Chartered Botswana, this has all but wiped out
earnings growth for the last 10 years.
Table 38: Earnings Attributable – CAGR (%)
1 year 3 years 5 years 7 years 10 years
FNB 22.0% 26.2% 20.9% 19.0% 16.7%
NED 10.8% 19.6% 14.0% 18.1% 12.0%
SBNH 44.7% 20.2% 7.0% 2.5% 12.0%
CGP 20.2% 22.4% 22.6% 21.8% 21.5%
NED SA 9.6% 12.7% 16.5% 8.9% 12.2%
SBK SA 32.7% 13.2% 16.5% 7.8% 10.2%
BGA 8.4% 19.9% 12.0% 4.3% 11.9%
FSR 7.4% 14.0% 15.8% 19.7% 10.0%
CPI 26.2% 26.6% 38.1% 40.3% 47.2%
FNBB -28.7% -10.4% -2.6% 3.1% 7.2%
BBB -22.4% -16.7% -14.6% -6.6% 1.0%
SCB -85.2% -44.6% -26.7% -22.9% -13.4%
SCZ -26.6% -6.8% 6.1% 32.1%
Zanaco -17.8% -9.0% 0.9% 12.4%
Source: PSG, Annual Reports, Bloomberg, Annual reports
SBNH had a bumper year for earnings in FY15 after it struggled
to gain momentum over the previous 5 years. All the SA
banks, except SBNH and CPI, reported single digit growth over
the corresponding period.
Chart 81: Earnings Attributable – 7 years CAGR (%)
Source: PSG, Annual Reports, Bloomberg
Over the last 5 years FNB and CGP grew earnings in excess of
20%. SBNH has lagged significantly over 5 and 7 years.
NED grew earnings at CAGR of 14% over the 5-year period
while CGP reported a CAGR of 22.6%. SCZ grew earnings by
CAGR of 6.1% over the last 5 years.
Chart 82: Earnings attributable – 5 years CAGR (%)
Source: PSG, Annual Reports, Bloomberg, Annual reports
19.0%18.1%
2.5%
21.8%
8.9%7.8%
4.3%
19.7%
40.3%
3.1%
-6.6%
-22.9%
32.1%
12.4%
-25.0%
-15.0%
-5.0%
5.0%
15.0%
25.0%
35.0%
45.0%FN
B
NED
SBN
H
CG
P
NED
SA
SBK
SA
BG
A
FSR
CP
I
FNB
B
BB
B
SCB
SCZ
Zanaco
20.9%14.0%
7.0%
22.6%
16.5%16.5%
12.0%15.8%
38.1%
-2.6%
-14.6%
-26.7%
6.1%0.9%
-30%
-20%
-10%
0%
10%
20%
30%
40%
50%
FNB
NED
SBN
H
CG
P
NED
SA
SBK
SA
BG
A
FSR
CP
I
FNB
B
BB
B
SCB
SCZ
Zanaco

P a g e | 39
PSG Wealth Management (Namibia) (Pty) Ltd
Earnings per Share (EPS)
Chart 83 shows the EPS (converted to N$) for FY14, FY15 and
FY16 at various year-ends. All the local banks improved EPS in
the latest financial year.
Chart 83: EPS (N$cps) – FY14, FY15 and FY16
Source: PSG, Annual Reports, Bloomberg
Chart 84 shows the y/y growth for the last 5 years. SBNH’s
strong growth for FY15 is attributable to a big reduction of
24.2% in impairments and interest income growth exceeding
interest expenditure growth by 3.0%. Trading income growth
for SBNH was also very high at 31.5%. The other banks
reported double digit growth every year for the last 5 years.
Chart 84: Local Banks – EPS Growth (y/y %)
Source: PSG, Annual Reports
On balance the SA banks performed well over the last five
years, NED SA and FSR being slightly more consistent than the
other banks, but with declining EPS growth. BGA EPS declined
by 9.3% in FY12 on the back of a significant rise in bad debts.
CPI has also seen growth in the last two years which is more
in line with that of the mature banks.
Chart 85: SA Banks – EPS Growth (y/y %)
Source: PSG, Annual Reports
Table 39 shows the annualised compounded growth over
different time periods. Please note that the EPS for CGP was
adjusted backward for the 4:1 share split for comparison
purposes and EPS for Zambia banks could be difficult to
interpret due to bonus shares issued and a change in Zambian
Kwacha 1000 (ZMK) to 1 ZMW.
What stands out is the poor performance of SBNH with single
digit EPS growth over the last 5 years. All the other local banks
have grown EPS with more than 10% on the back of strong
non-interest income growth and effective cost management.
Among the Botswana banks, only FNBB has posted positive
annualised growth over the last 10 years. CPI, NED SA and FSR
outshine the other SA banks with double digit growth over 10
years.
Table 39: EPS – CAGR (%)
1 year 3 years 5 years 10 years
FNB 22.9% 26.8% 21.5% 17.1%
NED 10.8% 19.6% 14.0% 11.4%
SBNH 44.7% 20.2% 7.0% 12.0%
CGP 20.6% 18.6% 19.6% 19.8%
NED SA 6.7% 11.1% 14.8% 10.1%
SBK SA 28.8% 14.2% 14.2% 7.7%
BGA 10.3% 11.7% 8.6% 7.5%
FSR 7.5% 14.2% 16.3% 10.3%
CPI 26.2% 23.0% 30.6% 40.2%
FNBB -28.7% -10.4% -2.6% 7.2%
BBB -37.9% -20.8% -15.2% -15.5%
SCB -85.2% -44.6% -27.2% -13.7%
SCZ -26.6% -6.8% 6.1%
Zanaco -17.8% -9.0% -32.6%
Source: PSG, Annual Reports
Zanaco Zambia EPS declined due to a 13 to 2 bonus share
issue in FY12 which diluted EPS as well as recent poor
performance.
388 524
2269
1392
1697
32 20 0.160.02
469
181407
2787
27 0
500
1 000
1 500
2 000
2 500
3 000
FNB
NED
SBN
H
CG
P
NED
SA
SBK
SA
BG
A
FSR
CP
I
FNB
B
BB
B
SCB
SCZ
Zanaco
FY14 FY15 FY16
15.5% 17.4%
0.0%
19.9%
10.8%
44.7%
20.2%22.9%
0%
10%
20%
30%
40%
50%
FNB NED SBNH CGP
FY12 FY13 FY14 FY15 FY16
17.7%
9.1%
-10.2%
17.8%
48.6%
6.7%
28.8%
10.3% 7.5%
26.2%
-20%
-10%
0%
10%
20%
30%
40%
50%
60%
NED SA SBK SA BGA FSR CPI
FY12 FY13 FY14 FY15 FY16
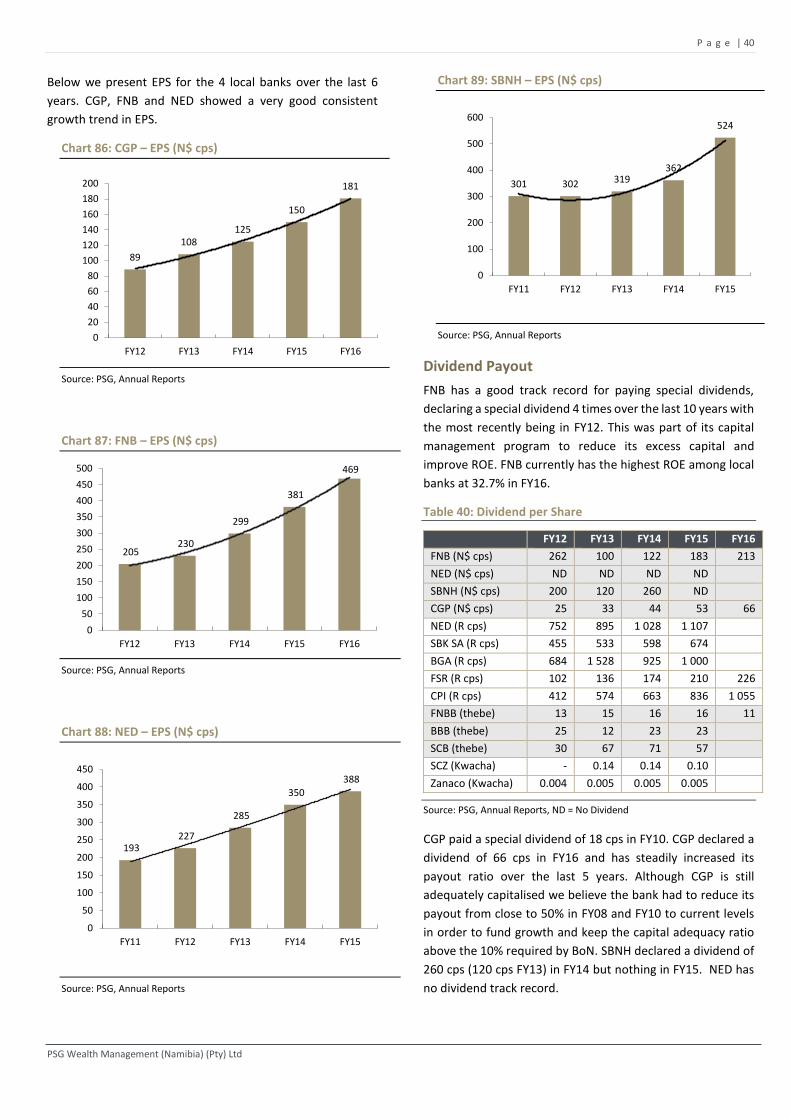
P a g e | 40
PSG Wealth Management (Namibia) (Pty) Ltd
Below we present EPS for the 4 local banks over the last 6
years. CGP, FNB and NED showed a very good consistent
growth trend in EPS.
Chart 86: CGP – EPS (N$ cps)
Source: PSG, Annual Reports
Chart 87: FNB – EPS (N$ cps)
Source: PSG, Annual Reports
Chart 88: NED – EPS (N$ cps)
Source: PSG, Annual Reports
Chart 89: SBNH – EPS (N$ cps)
Source: PSG, Annual Reports
Dividend Payout
FNB has a good track record for paying special dividends,
declaring a special dividend 4 times over the last 10 years with
the most recently being in FY12. This was part of its capital
management program to reduce its excess capital and
improve ROE. FNB currently has the highest ROE among local
banks at 32.7% in FY16.
Table 40: Dividend per Share
FY12 FY13 FY14 FY15 FY16
FNB (N$ cps) 262 100 122 183 213
NED (N$ cps) ND ND ND ND
SBNH (N$ cps) 200 120 260 ND
CGP (N$ cps) 25 33 44 53 66
NED (R cps) 752 895 1 028 1 107
SBK SA (R cps) 455 533 598 674
BGA (R cps) 684 1 528 925 1 000
FSR (R cps) 102 136 174 210 226
CPI (R cps) 412 574 663 836 1 055
FNBB (thebe) 13 15 16 16 11
BBB (thebe) 25 12 23 23
SCB (thebe) 30 67 71 57
SCZ (Kwacha) - 0.14 0.14 0.10
Zanaco (Kwacha) 0.004 0.005 0.005 0.005
Source: PSG, Annual Reports, ND = No Dividend
CGP paid a special dividend of 18 cps in FY10. CGP declared a
dividend of 66 cps in FY16 and has steadily increased its
payout ratio over the last 5 years. Although CGP is still
adequately capitalised we believe the bank had to reduce its
payout from close to 50% in FY08 and FY10 to current levels
in order to fund growth and keep the capital adequacy ratio
above the 10% required by BoN. SBNH declared a dividend of
260 cps (120 cps FY13) in FY14 but nothing in FY15. NED has
no dividend track record.
89
108125
150
181
0
20
40
60
80
100
120
140
160
180
200
FY12 FY13 FY14 FY15 FY16
205 230
299
381
469
0
50
100
150
200
250
300
350
400
450
500
FY12 FY13 FY14 FY15 FY16
193 227
285
350
388
0
50
100
150
200
250
300
350
400
450
FY11 FY12 FY13 FY14 FY15
301 302 319362
524
0
100
200
300
400
500
600
FY11 FY12 FY13 FY14 FY15
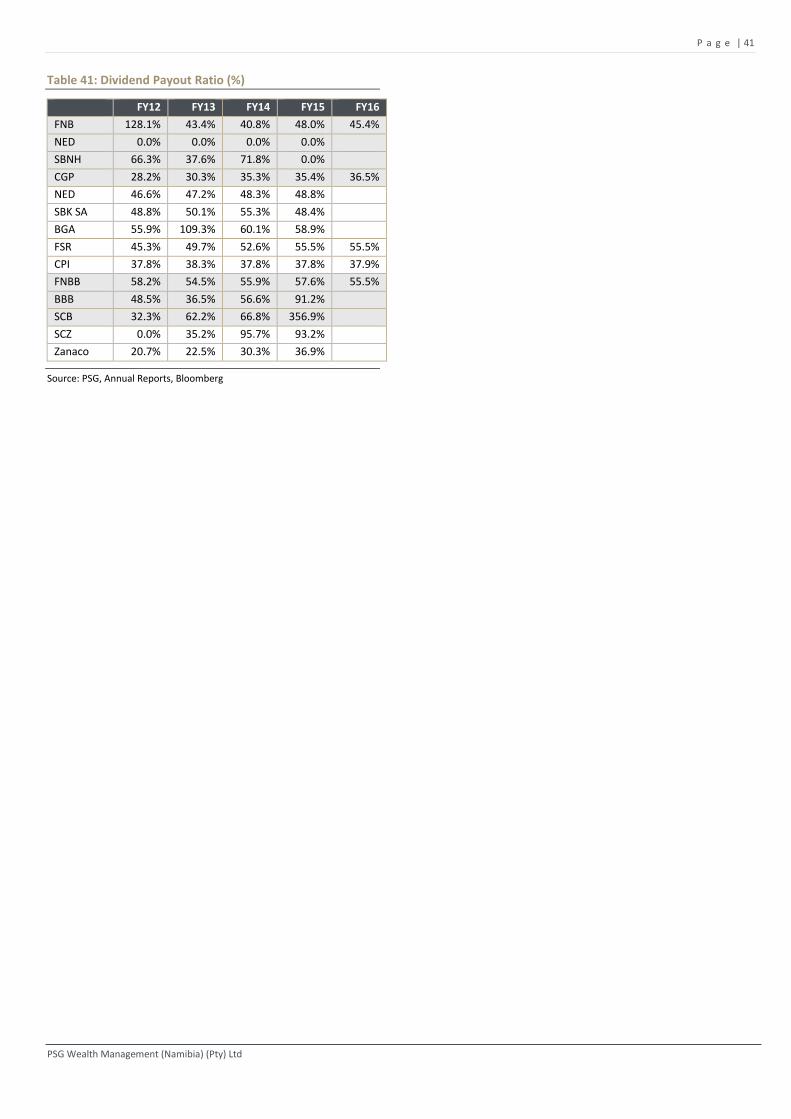
P a g e | 41
PSG Wealth Management (Namibia) (Pty) Ltd
Table 41: Dividend Payout Ratio (%)
FY12 FY13 FY14 FY15 FY16
FNB 128.1% 43.4% 40.8% 48.0% 45.4%
NED 0.0% 0.0% 0.0% 0.0%
SBNH 66.3% 37.6% 71.8% 0.0%
CGP 28.2% 30.3% 35.3% 35.4% 36.5%
NED 46.6% 47.2% 48.3% 48.8%
SBK SA 48.8% 50.1% 55.3% 48.4%
BGA 55.9% 109.3% 60.1% 58.9%
FSR 45.3% 49.7% 52.6% 55.5% 55.5%
CPI 37.8% 38.3% 37.8% 37.8% 37.9%
FNBB 58.2% 54.5% 55.9% 57.6% 55.5%
BBB 48.5% 36.5% 56.6% 91.2%
SCB 32.3% 62.2% 66.8% 356.9%
SCZ 0.0% 35.2% 95.7% 93.2%
Zanaco 20.7% 22.5% 30.3% 36.9%
Source: PSG, Annual Reports, Bloomberg

P a g e | 42
PSG Wealth Management (Namibia) (Pty) Ltd
Return on Average Assets (ROA)
ROA is an important tool for assessing a bank’s profitability.
ROA measures the ability of the bank management to
generate income by utilizing the bank’s assets at their
disposal. It shows how efficiently the resources of the banks
are used to generate the income. In advanced economies, a
bank is regarded as adequately profitable if its ROA is greater
than 1%. This could be attributed to keen competition among
banks in developed countries which are highly leveraged, low
margin, high volume businesses. Banks in Sub-Saharan Africa
appear more profitable with the average ROA around 2%,
however this could be a case of riskier assets demanding
higher returns.
From the charts below, we see that local banks posted higher
average returns than SA banks over the last 10 years. Except
for SBNH, local banks on average reported ROA between 2% -
3.7% at their most recent year ends, while SA banks average
ROA was below 2%. Subsequent to the financial crisis ROA
from SA banks deteriorated to below 1%. The decline was
attributed to slowing PSCE and stricter credit policies, interest
margin pressure and deteriorating bad debt levels.
Historically, the Botswana and Zambian banks reported even
higher average ROA than local banks, but this in our view
could be attributed to these banks being skewed to riskier
unsecured assets. In the last financial year ROA for these
banks also dropped.
Looking at local banks, FNB has steadily increased its ROA over
the last 7 years from 2.6% to 3.7% in FY16, the highest among
the local banks. Over the same period, CGP also increased
ROA from 2.0% in FY09 to 3.0% while SBNH’s ROA declined
from 3.8% in FY08 to 1.7% in FY14, but has picked up in FY15
to be higher than that of NED. NED has also improved its ROA
over the same period from 1.9% to 2.3%.
Chart 90: Local Banks – ROA (%)
Source: PSG, Annual Reports
The SA banks all improved ROA from FY09 and FSR had a
significantly more pronounced improvement than the other
banks. SBK SA saw their ROA increasing again to 1.3% after
declining slightly from 1.2% to 1.1% in FY14. CPI achieves very
high ROA ratios, even though it has been declining as the bank
acquires more assets. It is currently at 5.5%, considerably
higher than any local or other SA bank.
Chart 91: SA Banks – ROA (%)
Source: PSG, Annual Reports
All the Botswana and Zambian banks saw their ROA plunge
over the last year. The reason for this will be explained in the
next section, in the breakdown Du Pont analysis. ROA in
Zambian banks generally improved over the last 6 years, but
dropped off over the last year.
Chart 92: Botswana Banks – ROA (%)
Source: PSG, Annual Reports
Chart 93: Zambian Banks – ROA (%)
Source: PSG, Annual Reports
0.0%
1.0%
2.0%
3.0%
4.0%
FY07 FY08 FY09 FY10 FY11 FY12 FY13 FY14 FY15 FY16
FNB NED SBNH CGP
0.0%1.0%2.0%3.0%4.0%5.0%6.0%7.0%8.0%9.0%
10.0%
FY07 FY08 FY09 FY10 FY11 FY12 FY13 FY14 FY15 FY16
NED SA SBK SA BGA FSR CPI (rhs)
2.4%1.9%
0.4%0.0%
1.0%
2.0%
3.0%
4.0%
5.0%
6.0%
FY07 FY08 FY09 FY10 FY11 FY12 FY13 FY14 FY15 FY16
FNBB BBB SCB
2.4%
1.6%
0.0%
1.0%
2.0%
3.0%
4.0%
5.0%
FY07 FY08 FY09 FY10 FY11 FY12 FY13 FY14 FY15
SCZ Zanaco

P a g e | 43
PSG Wealth Management (Namibia) (Pty) Ltd
ROA – 2 Factor Du Pont Analysis
To understand the trends in ROA, it is necessary to look at the
Du Pont analysis where ROA is stripped down into a revenue
management and a cost management factor. It follows that
ROA = Asset utilisation – Expense ratio, where Asset
utilisation is total income as % of average assets and the
expense ratio is calculated as all interest and non-interest
expenses as % of average assets.
Chart 94 and 95 show the increase in CGP and FNB’s ROA over
the last five years could be attributed mainly to improved
asset utilisation while managing to keep the expense ratio
steady at about 5.3% and 6.7%, respectively.
Chart 94: CGP – ROA, Expense Ratio and Asset Utilisation
Source: PSG, Annual Reports
Chart 95: FNB – ROA, Expense Ratio and Asset Utilisation
Source: PSG, Annual Reports
SBNH’s ROA has seen significant improvement over the last 2
years to the current 2.3%. This is mainly due to the asset
utilisation ratio increasing from 6.9% in FY11 to 9.1% in FY15.
There is still risk in SBNH’s expense ratio which has increased
from 4.9% in FY11 to 6.5% in FY15.
After improving from 1.9% in FY09 to 2.3% in 2014, NED saw
a decline in ROA in FY15 to 2.1% on the back of a deterioration
in the expense ratio.
3.0%
0.0%
0.5%
1.0%
1.5%
2.0%
2.5%
3.0%
3.5%
0.0%
2.0%
4.0%
6.0%
8.0%
10.0%
FY10 FY11 FY12 FY13 FY14 FY15 FY16
Asset utilisation (LHS) Expense ratio (LHS)
ROA (RHS)
3.7%
0.0%
0.5%
1.0%
1.5%
2.0%
2.5%
3.0%
3.5%
4.0%
0%
2%
4%
6%
8%
10%
12%
FY12 FY13 FY14 FY15 FY16
Asset utilisation (LHS) Expense ratio (LHS)
ROA (RHS)
Chart 96: SBNH – ROA, Expense Ratio and Asset Utilisation
Source: PSG, Annual Reports
Chart 97: NED – ROA, Expense Ratio and Asset Utilisation
Source: PSG, Annual Reports
2.3%
-0.6%
-0.1%
0.4%
0.9%
1.4%
1.9%
2.4%
2.9%
0%
1%
2%
3%
4%
5%
6%
7%
8%
9%
10%
FY10 FY11 FY12 FY13 FY14 FY15
Asset utilisation (LHS) Expense ratio (LHS)
ROA (RHS)
2.1%
0.0%
0.5%
1.0%
1.5%
2.0%
2.5%
0%
1%
2%
3%
4%
5%
6%
7%
8%
9%
FY9 FY10 FY11 FY12 FY13 FY14 FY15
Asset utilisation (LHS) Expense ratio (LHS)
ROA (RHS)
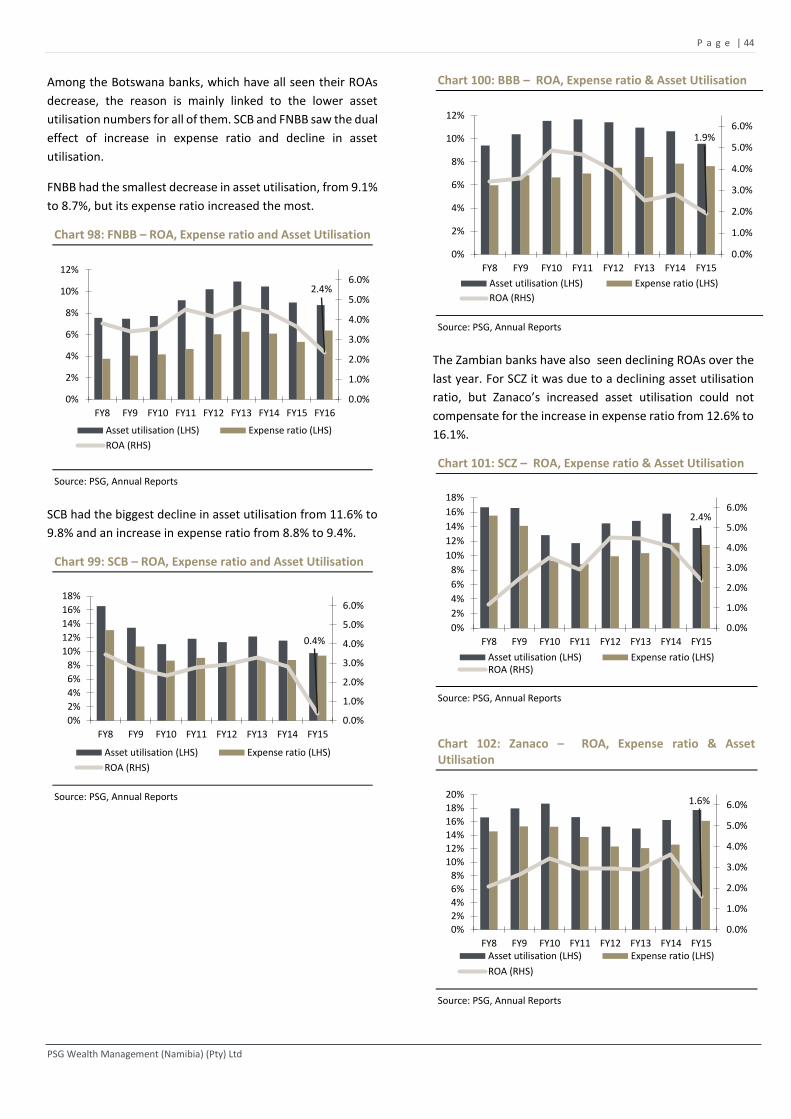
P a g e | 44
PSG Wealth Management (Namibia) (Pty) Ltd
Among the Botswana banks, which have all seen their ROAs
decrease, the reason is mainly linked to the lower asset
utilisation numbers for all of them. SCB and FNBB saw the dual
effect of increase in expense ratio and decline in asset
utilisation.
FNBB had the smallest decrease in asset utilisation, from 9.1%
to 8.7%, but its expense ratio increased the most.
Chart 98: FNBB – ROA, Expense ratio and Asset Utilisation
Source: PSG, Annual Reports
SCB had the biggest decline in asset utilisation from 11.6% to
9.8% and an increase in expense ratio from 8.8% to 9.4%.
Chart 99: SCB – ROA, Expense ratio and Asset Utilisation
Source: PSG, Annual Reports
Chart 100: BBB – ROA, Expense ratio & Asset Utilisation
Source: PSG, Annual Reports
The Zambian banks have also seen declining ROAs over the
last year. For SCZ it was due to a declining asset utilisation
ratio, but Zanaco’s increased asset utilisation could not
compensate for the increase in expense ratio from 12.6% to
16.1%.
Chart 101: SCZ – ROA, Expense ratio & Asset Utilisation
Source: PSG, Annual Reports
Chart 102: Zanaco – ROA, Expense ratio & Asset Utilisation
Source: PSG, Annual Reports
2.4%
0.0%
1.0%
2.0%
3.0%
4.0%
5.0%
6.0%
0%
2%
4%
6%
8%
10%
12%
FY8 FY9 FY10 FY11 FY12 FY13 FY14 FY15 FY16
Asset utilisation (LHS) Expense ratio (LHS)
ROA (RHS)
0.4%
0.0%
1.0%
2.0%
3.0%
4.0%
5.0%
6.0%
0%
2%
4%
6%
8%
10%
12%
14%
16%
18%
FY8 FY9 FY10 FY11 FY12 FY13 FY14 FY15
Asset utilisation (LHS) Expense ratio (LHS)
ROA (RHS)
1.9%
0.0%
1.0%
2.0%
3.0%
4.0%
5.0%
6.0%
0%
2%
4%
6%
8%
10%
12%
FY8 FY9 FY10 FY11 FY12 FY13 FY14 FY15
Asset utilisation (LHS) Expense ratio (LHS)
ROA (RHS)
2.4%
0.0%
1.0%
2.0%
3.0%
4.0%
5.0%
6.0%
0%
2%
4%
6%
8%
10%
12%
14%
16%
18%
FY8 FY9 FY10 FY11 FY12 FY13 FY14 FY15
Asset utilisation (LHS) Expense ratio (LHS)ROA (RHS)
1.6%
0.0%
1.0%
2.0%
3.0%
4.0%
5.0%
6.0%
0%
2%
4%
6%
8%
10%
12%
14%
16%
18%
20%
FY8 FY9 FY10 FY11 FY12 FY13 FY14 FY15Asset utilisation (LHS) Expense ratio (LHS)
ROA (RHS)
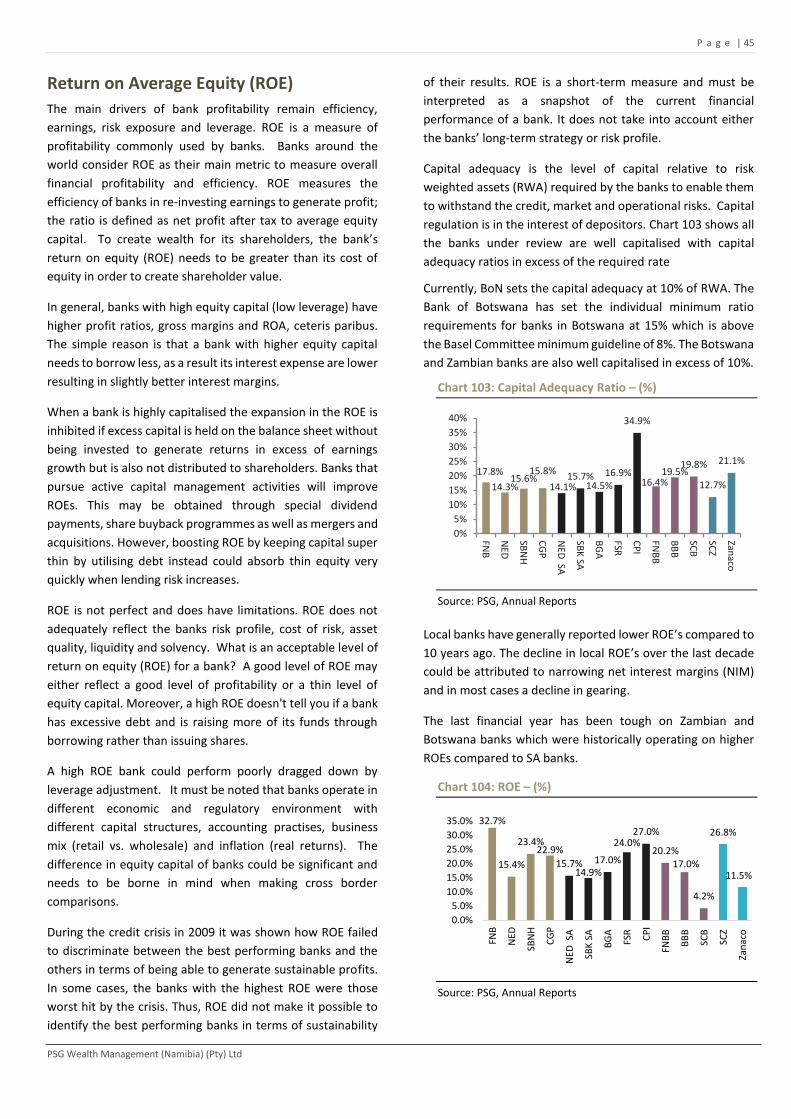
P a g e | 45
PSG Wealth Management (Namibia) (Pty) Ltd
Return on Average Equity (ROE)
The main drivers of bank profitability remain efficiency,
earnings, risk exposure and leverage. ROE is a measure of
profitability commonly used by banks. Banks around the
world consider ROE as their main metric to measure overall
financial profitability and efficiency. ROE measures the
efficiency of banks in re-investing earnings to generate profit;
the ratio is defined as net profit after tax to average equity
capital. To create wealth for its shareholders, the bank’s
return on equity (ROE) needs to be greater than its cost of
equity in order to create shareholder value.
In general, banks with high equity capital (low leverage) have
higher profit ratios, gross margins and ROA, ceteris paribus.
The simple reason is that a bank with higher equity capital
needs to borrow less, as a result its interest expense are lower
resulting in slightly better interest margins.
When a bank is highly capitalised the expansion in the ROE is
inhibited if excess capital is held on the balance sheet without
being invested to generate returns in excess of earnings
growth but is also not distributed to shareholders. Banks that
pursue active capital management activities will improve
ROEs. This may be obtained through special dividend
payments, share buyback programmes as well as mergers and
acquisitions. However, boosting ROE by keeping capital super
thin by utilising debt instead could absorb thin equity very
quickly when lending risk increases.
ROE is not perfect and does have limitations. ROE does not
adequately reflect the banks risk profile, cost of risk, asset
quality, liquidity and solvency. What is an acceptable level of
return on equity (ROE) for a bank? A good level of ROE may
either reflect a good level of profitability or a thin level of
equity capital. Moreover, a high ROE doesn't tell you if a bank
has excessive debt and is raising more of its funds through
borrowing rather than issuing shares.
A high ROE bank could perform poorly dragged down by
leverage adjustment. It must be noted that banks operate in
different economic and regulatory environment with
different capital structures, accounting practises, business
mix (retail vs. wholesale) and inflation (real returns). The
difference in equity capital of banks could be significant and
needs to be borne in mind when making cross border
comparisons.
During the credit crisis in 2009 it was shown how ROE failed
to discriminate between the best performing banks and the
others in terms of being able to generate sustainable profits.
In some cases, the banks with the highest ROE were those
worst hit by the crisis. Thus, ROE did not make it possible to
identify the best performing banks in terms of sustainability
of their results. ROE is a short-term measure and must be
interpreted as a snapshot of the current financial
performance of a bank. It does not take into account either
the banks’ long-term strategy or risk profile.
Capital adequacy is the level of capital relative to risk
weighted assets (RWA) required by the banks to enable them
to withstand the credit, market and operational risks. Capital
regulation is in the interest of depositors. Chart 103 shows all
the banks under review are well capitalised with capital
adequacy ratios in excess of the required rate
Currently, BoN sets the capital adequacy at 10% of RWA. The
Bank of Botswana has set the individual minimum ratio
requirements for banks in Botswana at 15% which is above
the Basel Committee minimum guideline of 8%. The Botswana
and Zambian banks are also well capitalised in excess of 10%.
Chart 103: Capital Adequacy Ratio – (%)
Source: PSG, Annual Reports
Local banks have generally reported lower ROE’s compared to
10 years ago. The decline in local ROE’s over the last decade
could be attributed to narrowing net interest margins (NIM)
and in most cases a decline in gearing.
The last financial year has been tough on Zambian and
Botswana banks which were historically operating on higher
ROEs compared to SA banks.
Chart 104: ROE – (%)
Source: PSG, Annual Reports
17.8%
14.3%15.6%
15.8%
14.1%15.7%
14.5%16.9%
34.9%
16.4%19.5%
19.8%
12.7%
21.1%
0%
5%
10%
15%
20%
25%
30%
35%
40%
FNB
NED
SBN
H
CG
P
NED
SA
SBK
SA
BG
A
FSR
CP
I
FNB
B
BB
B
SCB
SCZ
Zanaco
32.7%
15.4%
23.4%22.9%
15.7%14.9%
17.0%
24.0%27.0%
20.2%17.0%
4.2%
26.8%
11.5%
0.0%
5.0%
10.0%
15.0%
20.0%
25.0%
30.0%
35.0%
FNB
NED
SBN
H
CG
P
NED
SA
SBK
SA
BG
A
FSR
CP
I
FNB
B
BB
B
SCB
SCZ
Zan
aco

P a g e | 46
PSG Wealth Management (Namibia) (Pty) Ltd
Table 42: ROE (%)
FY12 FY13 FY14 FY15 FY16
FNB 25.4% 25.8% 30.9% 32.2% 32.7%
NED 15.1% 16.1% 16.5% 15.4%
SBNH 18.6% 18.0% 18.8% 23.4%
CGP 23.1% 21.9% 21.9% 22.4% 22.9%
NED 14.8% 15.6% 15.8% 15.7%
SBK SA 13.2% 13.2% 12.3% 14.9%
BGA 13.5% 15.5% 16.7% 17.0%
FSR 20.7% 22.7% 24.2% 24.7% 24.0%
CPI 29.0% 27.0% 23.0% 25.0% 27.0%
FNBB 42.4% 40.5% 34.7% 30.0% 20.2%
BBB 32.4% 21.6% 23.0% 17.0%
SCB 32.1% 31.2% 27.7% 4.2%
SCZ 45.7% 35.6% 34.2% 26.8%
Zanaco 24.1% 23.6% 15.3% 11.5%
Source: PSG, UBS, Annual Reports
Although ROE is generally lower than historical levels, FNB
and CGP have steadily increased ROE over the last four years
on the back of higher ROA.
FNB reported the highest ROE at 32.7% in FY16, up from
32.2% in FY15.
SA banks’ ROE’s have showed a decline since September 2007
against the backdrop of the ongoing turmoil in the global
financial markets whilst local ROE’s remained fairly resilient
over the same period.
Slowing PSCE, stricter credit policies, interest margin
pressure, and deteriorating bad debt levels all contributed to
SA banks’ lower ROE’s. The last year has had mixed results for
the various banks with SBK, BGA and CPI increasing while NED
and FSR’s ROE decreased.
Chart 105: Local Banks – ROE (%)
Source: PSG, Annual Reports
Chart 106: SA Banks – ROE (%)
Source: UBS, Bloomberg, Annual reports
The Botswana banks showed a significant decline in ROE since
2009, on the back of a gradual decline in gearing while
Zambian banks have improved ROE over the same period
mainly due to higher ROA (next section).
Chart 107: Botswana Banks – ROE (%)
Source: PSG, Annual Reports
Chart 108: Zambian Banks – ROE (%)
Source: PSG, Annual Reports
32.7%
15.4%
23.4%22.9%
0%5%
10%15%20%25%30%35%40%45%50%
FY07 FY08 FY09 FY10 FY11 FY12 FY13 FY14 FY15 FY16
FNB NED SBNH CGP
15.7%14.9%
17.0%
24.0%27.0%
0%
5%
10%
15%
20%
25%
30%
35%
40%
FY07 FY08 FY09 FY10 FY11 FY12 FY13 FY14 FY15 FY16
NED SA SBK SA BGA FSR CPI
20.2%17.0%
4.2%0%10%20%30%40%50%60%70%80%90%
100%
FY07 FY08 FY09 FY10 FY11 FY12 FY13 FY14 FY15 FY16
FNBB BBB SCB
26.8%
11.5%
0%
10%
20%
30%
40%
50%
60%
FY07 FY08 FY09 FY10 FY11 FY12 FY13 FY14 FY15
SCZ Zanaco
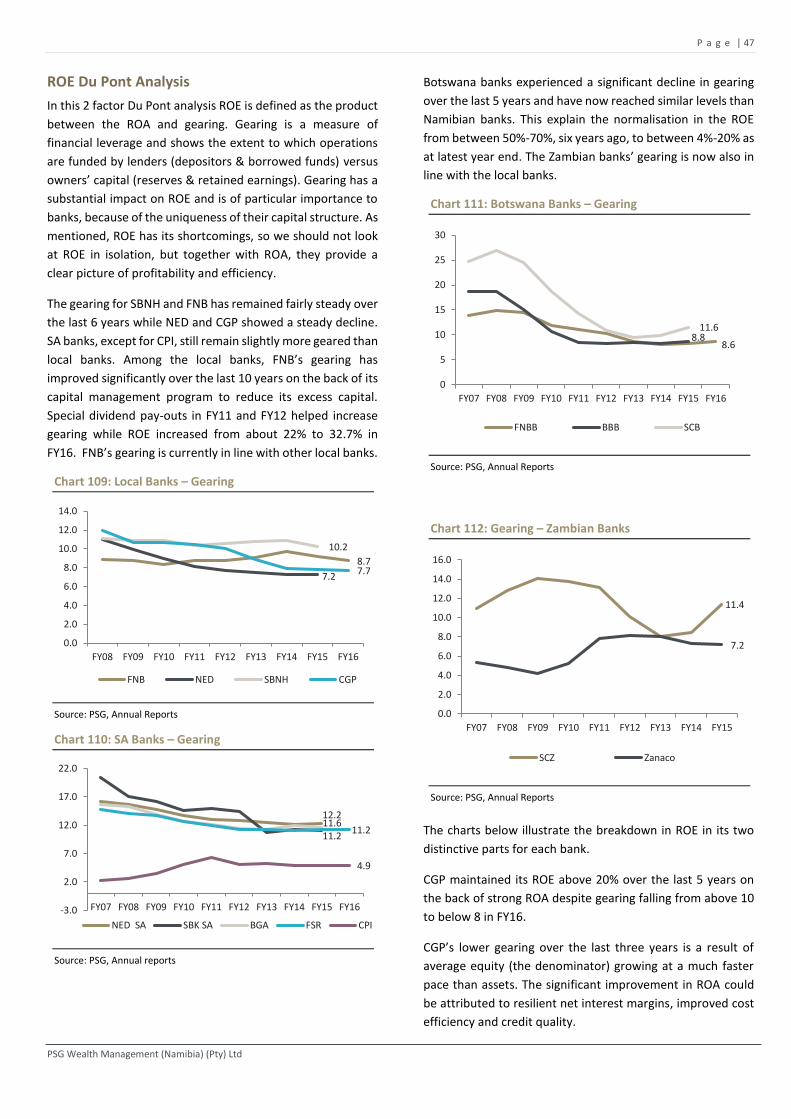
P a g e | 47
PSG Wealth Management (Namibia) (Pty) Ltd
ROE Du Pont Analysis
In this 2 factor Du Pont analysis ROE is defined as the product
between the ROA and gearing. Gearing is a measure of
financial leverage and shows the extent to which operations
are funded by lenders (depositors & borrowed funds) versus
owners’ capital (reserves & retained earnings). Gearing has a
substantial impact on ROE and is of particular importance to
banks, because of the uniqueness of their capital structure. As
mentioned, ROE has its shortcomings, so we should not look
at ROE in isolation, but together with ROA, they provide a
clear picture of profitability and efficiency.
The gearing for SBNH and FNB has remained fairly steady over
the last 6 years while NED and CGP showed a steady decline.
SA banks, except for CPI, still remain slightly more geared than
local banks. Among the local banks, FNB’s gearing has
improved significantly over the last 10 years on the back of its
capital management program to reduce its excess capital.
Special dividend pay-outs in FY11 and FY12 helped increase
gearing while ROE increased from about 22% to 32.7% in
FY16. FNB’s gearing is currently in line with other local banks.
Chart 109: Local Banks – Gearing
Source: PSG, Annual Reports
Chart 110: SA Banks – Gearing
Source: PSG, Annual reports
Botswana banks experienced a significant decline in gearing
over the last 5 years and have now reached similar levels than
Namibian banks. This explain the normalisation in the ROE
from between 50%-70%, six years ago, to between 4%-20% as
at latest year end. The Zambian banks’ gearing is now also in
line with the local banks.
Chart 111: Botswana Banks – Gearing
Source: PSG, Annual Reports
Chart 112: Gearing – Zambian Banks
Source: PSG, Annual Reports
The charts below illustrate the breakdown in ROE in its two
distinctive parts for each bank.
CGP maintained its ROE above 20% over the last 5 years on
the back of strong ROA despite gearing falling from above 10
to below 8 in FY16.
CGP’s lower gearing over the last three years is a result of
average equity (the denominator) growing at a much faster
pace than assets. The significant improvement in ROA could
be attributed to resilient net interest margins, improved cost
efficiency and credit quality.
8.7
7.2
10.2
7.7
0.0
2.0
4.0
6.0
8.0
10.0
12.0
14.0
FY08 FY09 FY10 FY11 FY12 FY13 FY14 FY15 FY16
FNB NED SBNH CGP
12.211.611.2
11.2
4.9
-3.0
2.0
7.0
12.0
17.0
22.0
FY07 FY08 FY09 FY10 FY11 FY12 FY13 FY14 FY15 FY16
NED SA SBK SA BGA FSR CPI
8.68.8
11.6
0
5
10
15
20
25
30
FY07 FY08 FY09 FY10 FY11 FY12 FY13 FY14 FY15 FY16
FNBB BBB SCB
11.4
7.2
0.0
2.0
4.0
6.0
8.0
10.0
12.0
14.0
16.0
FY07 FY08 FY09 FY10 FY11 FY12 FY13 FY14 FY15
SCZ Zanaco
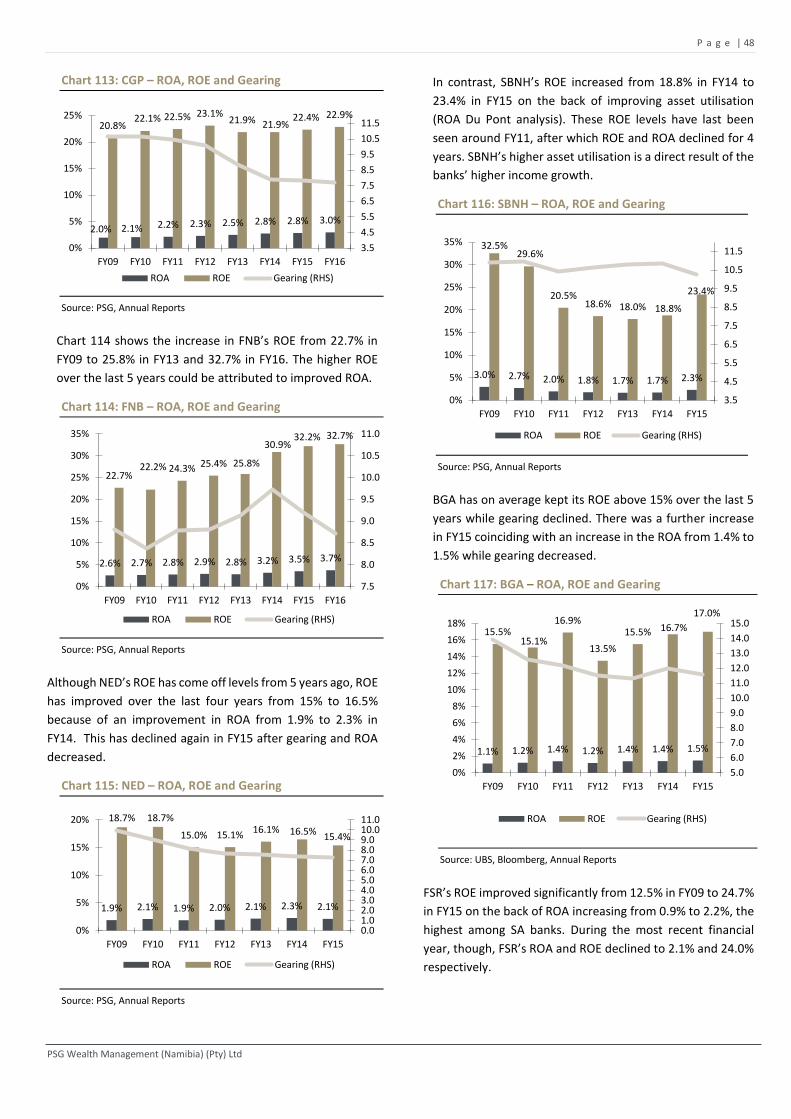
P a g e | 48
PSG Wealth Management (Namibia) (Pty) Ltd
Chart 113: CGP – ROA, ROE and Gearing
Source: PSG, Annual Reports
Chart 114 shows the increase in FNB’s ROE from 22.7% in
FY09 to 25.8% in FY13 and 32.7% in FY16. The higher ROE
over the last 5 years could be attributed to improved ROA.
Chart 114: FNB – ROA, ROE and Gearing
Source: PSG, Annual Reports
Although NED’s ROE has come off levels from 5 years ago, ROE
has improved over the last four years from 15% to 16.5%
because of an improvement in ROA from 1.9% to 2.3% in
FY14. This has declined again in FY15 after gearing and ROA
decreased.
Chart 115: NED – ROA, ROE and Gearing
Source: PSG, Annual Reports
In contrast, SBNH’s ROE increased from 18.8% in FY14 to
23.4% in FY15 on the back of improving asset utilisation
(ROA Du Pont analysis). These ROE levels have last been
seen around FY11, after which ROE and ROA declined for 4
years. SBNH’s higher asset utilisation is a direct result of the
banks’ higher income growth.
Chart 116: SBNH – ROA, ROE and Gearing
Source: PSG, Annual Reports
BGA has on average kept its ROE above 15% over the last 5
years while gearing declined. There was a further increase
in FY15 coinciding with an increase in the ROA from 1.4% to
1.5% while gearing decreased.
Chart 117: BGA – ROA, ROE and Gearing
Source: UBS, Bloomberg, Annual Reports
FSR’s ROE improved significantly from 12.5% in FY09 to 24.7%
in FY15 on the back of ROA increasing from 0.9% to 2.2%, the
highest among SA banks. During the most recent financial
year, though, FSR’s ROA and ROE declined to 2.1% and 24.0%
respectively.
2.0% 2.1% 2.2% 2.3% 2.5% 2.8% 2.8% 3.0%
20.8%22.1% 22.5% 23.1%
21.9% 21.9%22.4% 22.9%
3.5
4.5
5.5
6.5
7.5
8.5
9.5
10.5
11.5
0%
5%
10%
15%
20%
25%
FY09 FY10 FY11 FY12 FY13 FY14 FY15 FY16
ROA ROE Gearing (RHS)
2.6% 2.7% 2.8% 2.9% 2.8% 3.2% 3.5% 3.7%
22.7%22.2% 24.3% 25.4% 25.8%
30.9%32.2% 32.7%
7.5
8.0
8.5
9.0
9.5
10.0
10.5
11.0
0%
5%
10%
15%
20%
25%
30%
35%
FY09 FY10 FY11 FY12 FY13 FY14 FY15 FY16
ROA ROE Gearing (RHS)
1.9% 2.1% 1.9% 2.0% 2.1% 2.3% 2.1%
18.7% 18.7%
15.0% 15.1%16.1% 16.5%
15.4%
0.01.02.03.04.05.06.07.08.09.010.011.0
0%
5%
10%
15%
20%
FY09 FY10 FY11 FY12 FY13 FY14 FY15
ROA ROE Gearing (RHS)
3.0% 2.7% 2.0% 1.8% 1.7% 1.7% 2.3%
32.5%29.6%
20.5%18.6% 18.0% 18.8%
23.4%
3.5
4.5
5.5
6.5
7.5
8.5
9.5
10.5
11.5
0%
5%
10%
15%
20%
25%
30%
35%
FY09 FY10 FY11 FY12 FY13 FY14 FY15
ROA ROE Gearing (RHS)
1.1% 1.2% 1.4% 1.2% 1.4% 1.4% 1.5%
15.5%15.1%
16.9%
13.5%
15.5% 16.7%
17.0%
5.0
6.0
7.0
8.0
9.0
10.0
11.0
12.0
13.0
14.0
15.0
0%
2%
4%
6%
8%
10%
12%
14%
16%
18%
FY09 FY10 FY11 FY12 FY13 FY14 FY15
ROA ROE Gearing (RHS)
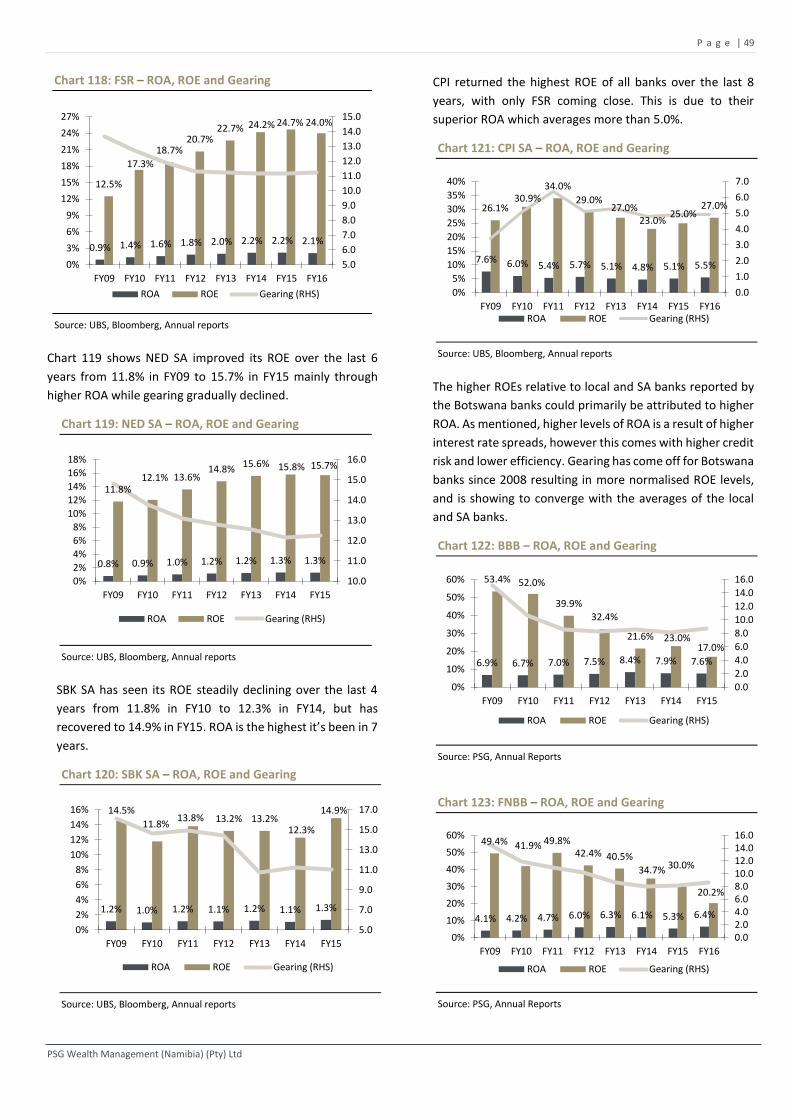
P a g e | 49
PSG Wealth Management (Namibia) (Pty) Ltd
Chart 118: FSR – ROA, ROE and Gearing
Source: UBS, Bloomberg, Annual reports
Chart 119 shows NED SA improved its ROE over the last 6
years from 11.8% in FY09 to 15.7% in FY15 mainly through
higher ROA while gearing gradually declined.
Chart 119: NED SA – ROA, ROE and Gearing
Source: UBS, Bloomberg, Annual reports
SBK SA has seen its ROE steadily declining over the last 4
years from 11.8% in FY10 to 12.3% in FY14, but has
recovered to 14.9% in FY15. ROA is the highest it’s been in 7
years.
Chart 120: SBK SA – ROA, ROE and Gearing
Source: UBS, Bloomberg, Annual reports
CPI returned the highest ROE of all banks over the last 8
years, with only FSR coming close. This is due to their
superior ROA which averages more than 5.0%.
Chart 121: CPI SA – ROA, ROE and Gearing
Source: UBS, Bloomberg, Annual reports
The higher ROEs relative to local and SA banks reported by
the Botswana banks could primarily be attributed to higher
ROA. As mentioned, higher levels of ROA is a result of higher
interest rate spreads, however this comes with higher credit
risk and lower efficiency. Gearing has come off for Botswana
banks since 2008 resulting in more normalised ROE levels,
and is showing to converge with the averages of the local
and SA banks.
Chart 122: BBB – ROA, ROE and Gearing
Source: PSG, Annual Reports
Chart 123: FNBB – ROA, ROE and Gearing
Source: PSG, Annual Reports
0.9% 1.4% 1.6% 1.8% 2.0% 2.2% 2.2% 2.1%
12.5%
17.3%
18.7%20.7%
22.7% 24.2% 24.7% 24.0%
5.0
6.0
7.0
8.0
9.0
10.0
11.0
12.0
13.0
14.0
15.0
0%
3%
6%
9%
12%
15%
18%
21%
24%
27%
FY09 FY10 FY11 FY12 FY13 FY14 FY15 FY16
ROA ROE Gearing (RHS)
0.8% 0.9% 1.0% 1.2% 1.2% 1.3% 1.3%
11.8%12.1% 13.6%
14.8%15.6% 15.8% 15.7%
10.0
11.0
12.0
13.0
14.0
15.0
16.0
0%
2%
4%
6%
8%
10%
12%
14%
16%
18%
FY09 FY10 FY11 FY12 FY13 FY14 FY15
ROA ROE Gearing (RHS)
1.2% 1.0% 1.2% 1.1% 1.2% 1.1% 1.3%
14.5%
11.8%13.8% 13.2% 13.2%
12.3%
14.9%
5.0
7.0
9.0
11.0
13.0
15.0
17.0
0%
2%
4%
6%
8%
10%
12%
14%
16%
FY09 FY10 FY11 FY12 FY13 FY14 FY15
ROA ROE Gearing (RHS)
7.6% 6.0% 5.4% 5.7% 5.1% 4.8% 5.1% 5.5%
26.1%30.9%
34.0%
29.0%27.0%
23.0%25.0%
27.0%
0.0
1.0
2.0
3.0
4.0
5.0
6.0
7.0
0%
5%
10%
15%
20%
25%
30%
35%
40%
FY09 FY10 FY11 FY12 FY13 FY14 FY15 FY16ROA ROE Gearing (RHS)
6.9% 6.7% 7.0% 7.5% 8.4% 7.9% 7.6%
53.4% 52.0%
39.9%
32.4%
21.6% 23.0%17.0%
0.0
2.0
4.0
6.0
8.0
10.0
12.0
14.0
16.0
0%
10%
20%
30%
40%
50%
60%
FY09 FY10 FY11 FY12 FY13 FY14 FY15
ROA ROE Gearing (RHS)
4.1% 4.2% 4.7% 6.0% 6.3% 6.1% 5.3% 6.4%
49.4% 41.9% 49.8%42.4% 40.5%
34.7% 30.0%
20.2%
0.02.04.06.08.010.012.014.016.0
0%
10%
20%
30%
40%
50%
60%
FY09 FY10 FY11 FY12 FY13 FY14 FY15 FY16
ROA ROE Gearing (RHS)
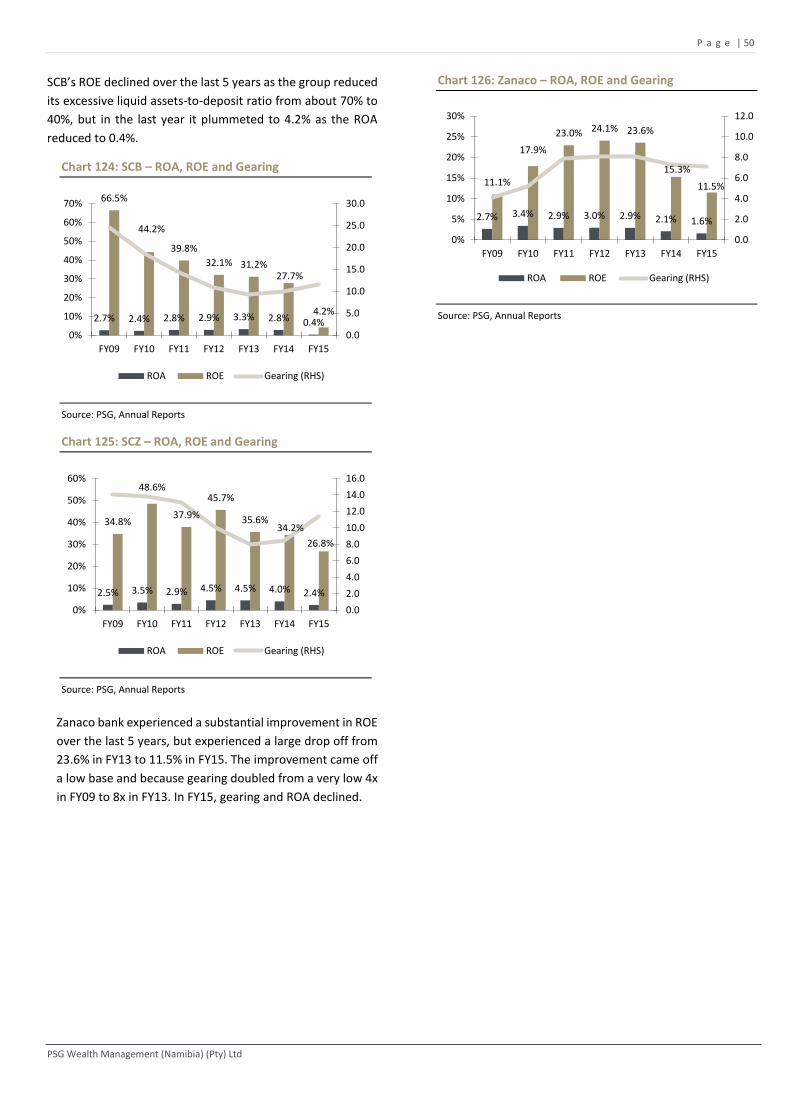
P a g e | 50
PSG Wealth Management (Namibia) (Pty) Ltd
SCB’s ROE declined over the last 5 years as the group reduced
its excessive liquid assets-to-deposit ratio from about 70% to
40%, but in the last year it plummeted to 4.2% as the ROA
reduced to 0.4%.
Chart 124: SCB – ROA, ROE and Gearing
Source: PSG, Annual Reports
Chart 125: SCZ – ROA, ROE and Gearing
Source: PSG, Annual Reports
Zanaco bank experienced a substantial improvement in ROE
over the last 5 years, but experienced a large drop off from
23.6% in FY13 to 11.5% in FY15. The improvement came off
a low base and because gearing doubled from a very low 4x
in FY09 to 8x in FY13. In FY15, gearing and ROA declined.
Chart 126: Zanaco – ROA, ROE and Gearing
Source: PSG, Annual Reports
2.7% 2.4% 2.8% 2.9% 3.3% 2.8% 0.4%
66.5%
44.2%
39.8%
32.1% 31.2%27.7%
4.2%
0.0
5.0
10.0
15.0
20.0
25.0
30.0
0%
10%
20%
30%
40%
50%
60%
70%
FY09 FY10 FY11 FY12 FY13 FY14 FY15
ROA ROE Gearing (RHS)
2.5% 3.5% 2.9% 4.5% 4.5% 4.0% 2.4%
34.8%
48.6%
37.9%
45.7%
35.6%34.2%
26.8%
0.0
2.0
4.0
6.0
8.0
10.0
12.0
14.0
16.0
0%
10%
20%
30%
40%
50%
60%
FY09 FY10 FY11 FY12 FY13 FY14 FY15
ROA ROE Gearing (RHS)
2.7% 3.4% 2.9% 3.0% 2.9% 2.1% 1.6%
11.1%
17.9%
23.0% 24.1% 23.6%
15.3%
11.5%
0.0
2.0
4.0
6.0
8.0
10.0
12.0
0%
5%
10%
15%
20%
25%
30%
FY09 FY10 FY11 FY12 FY13 FY14 FY15
ROA ROE Gearing (RHS)
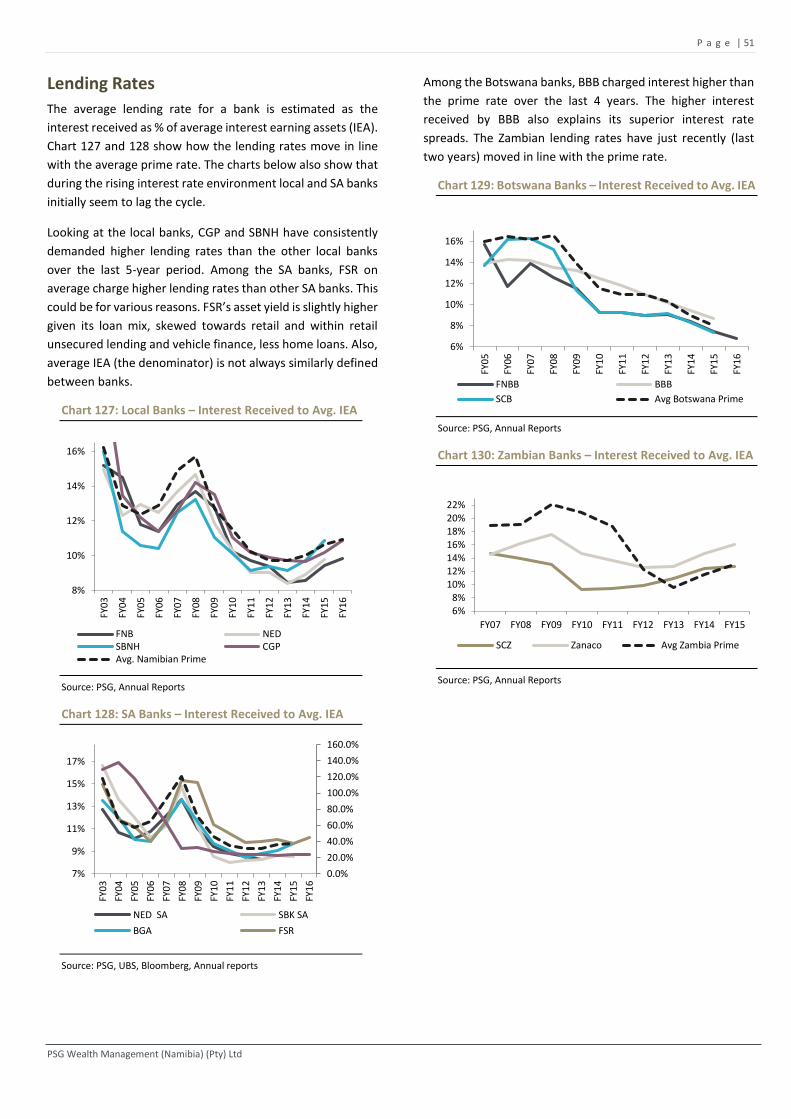
P a g e | 51
PSG Wealth Management (Namibia) (Pty) Ltd
Lending Rates
The average lending rate for a bank is estimated as the
interest received as % of average interest earning assets (IEA).
Chart 127 and 128 show how the lending rates move in line
with the average prime rate. The charts below also show that
during the rising interest rate environment local and SA banks
initially seem to lag the cycle.
Looking at the local banks, CGP and SBNH have consistently
demanded higher lending rates than the other local banks
over the last 5-year period. Among the SA banks, FSR on
average charge higher lending rates than other SA banks. This
could be for various reasons. FSR’s asset yield is slightly higher
given its loan mix, skewed towards retail and within retail
unsecured lending and vehicle finance, less home loans. Also,
average IEA (the denominator) is not always similarly defined
between banks.
Chart 127: Local Banks – Interest Received to Avg. IEA
Source: PSG, Annual Reports
Chart 128: SA Banks – Interest Received to Avg. IEA
Source: PSG, UBS, Bloomberg, Annual reports
Among the Botswana banks, BBB charged interest higher than
the prime rate over the last 4 years. The higher interest
received by BBB also explains its superior interest rate
spreads. The Zambian lending rates have just recently (last
two years) moved in line with the prime rate.
Chart 129: Botswana Banks – Interest Received to Avg. IEA
Source: PSG, Annual Reports
Chart 130: Zambian Banks – Interest Received to Avg. IEA
Source: PSG, Annual Reports
8%
10%
12%
14%
16%
FY0
3
FY0
4
FY0
5
FY0
6
FY0
7
FY0
8
FY0
9
FY1
0
FY1
1
FY1
2
FY1
3
FY1
4
FY1
5
FY1
6
FNB NEDSBNH CGPAvg. Namibian Prime
0.0%
20.0%
40.0%
60.0%
80.0%
100.0%
120.0%
140.0%
160.0%
7%
9%
11%
13%
15%
17%
FY0
3
FY0
4
FY0
5
FY0
6
FY0
7
FY0
8
FY0
9
FY1
0
FY1
1
FY1
2
FY1
3
FY1
4
FY1
5
FY1
6
NED SA SBK SA
BGA FSR
6%
8%
10%
12%
14%
16%
FY0
5
FY0
6
FY0
7
FY0
8
FY0
9
FY1
0
FY1
1
FY1
2
FY1
3
FY1
4
FY1
5
FY1
6
FNBB BBB
SCB Avg Botswana Prime
6%8%
10%12%14%16%18%20%22%
FY07 FY08 FY09 FY10 FY11 FY12 FY13 FY14 FY15
SCZ Zanaco Avg Zambia Prime
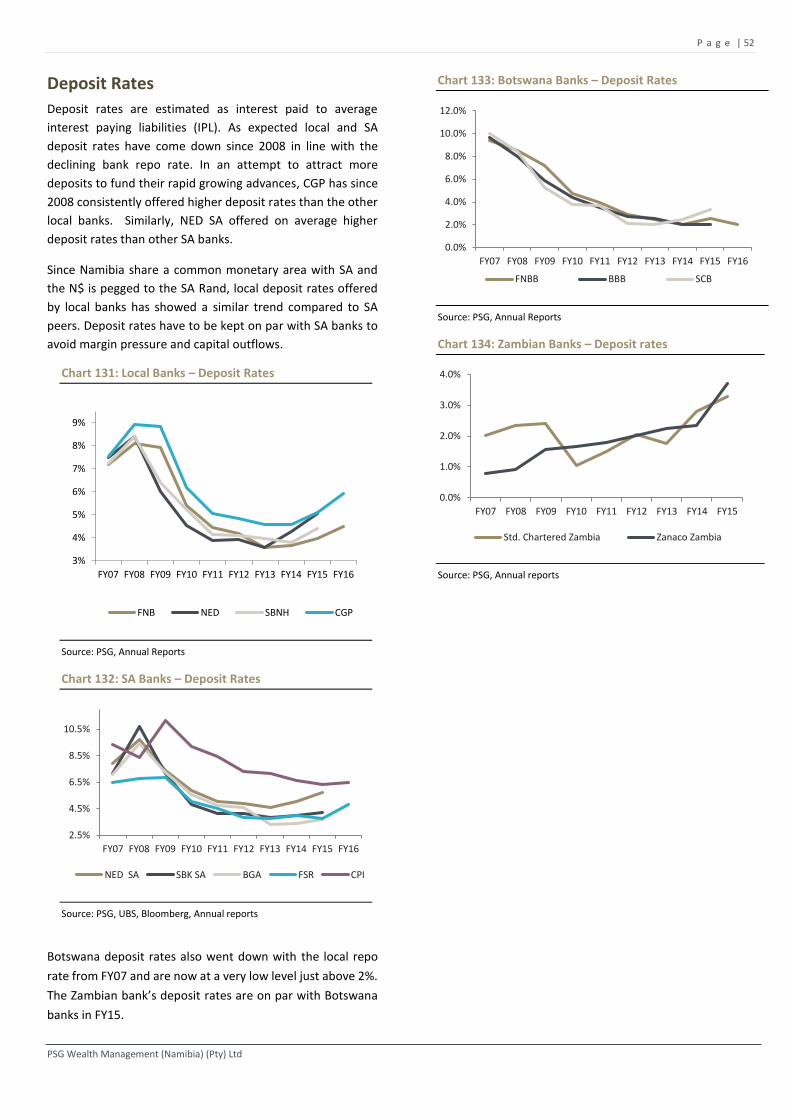
P a g e | 52
PSG Wealth Management (Namibia) (Pty) Ltd
Deposit Rates
Deposit rates are estimated as interest paid to average
interest paying liabilities (IPL). As expected local and SA
deposit rates have come down since 2008 in line with the
declining bank repo rate. In an attempt to attract more
deposits to fund their rapid growing advances, CGP has since
2008 consistently offered higher deposit rates than the other
local banks. Similarly, NED SA offered on average higher
deposit rates than other SA banks.
Since Namibia share a common monetary area with SA and
the N$ is pegged to the SA Rand, local deposit rates offered
by local banks has showed a similar trend compared to SA
peers. Deposit rates have to be kept on par with SA banks to
avoid margin pressure and capital outflows.
Chart 131: Local Banks – Deposit Rates
Source: PSG, Annual Reports
Chart 132: SA Banks – Deposit Rates
Source: PSG, UBS, Bloomberg, Annual reports
Botswana deposit rates also went down with the local repo
rate from FY07 and are now at a very low level just above 2%.
The Zambian bank’s deposit rates are on par with Botswana
banks in FY15.
Chart 133: Botswana Banks – Deposit Rates
Source: PSG, Annual Reports
Chart 134: Zambian Banks – Deposit rates
Source: PSG, Annual reports
3%
4%
5%
6%
7%
8%
9%
FY07 FY08 FY09 FY10 FY11 FY12 FY13 FY14 FY15 FY16
FNB NED SBNH CGP
2.5%
4.5%
6.5%
8.5%
10.5%
FY07 FY08 FY09 FY10 FY11 FY12 FY13 FY14 FY15 FY16
NED SA SBK SA BGA FSR CPI
0.0%
2.0%
4.0%
6.0%
8.0%
10.0%
12.0%
FY07 FY08 FY09 FY10 FY11 FY12 FY13 FY14 FY15 FY16
FNBB BBB SCB
0.0%
1.0%
2.0%
3.0%
4.0%
FY07 FY08 FY09 FY10 FY11 FY12 FY13 FY14 FY15
Std. Chartered Zambia Zanaco Zambia
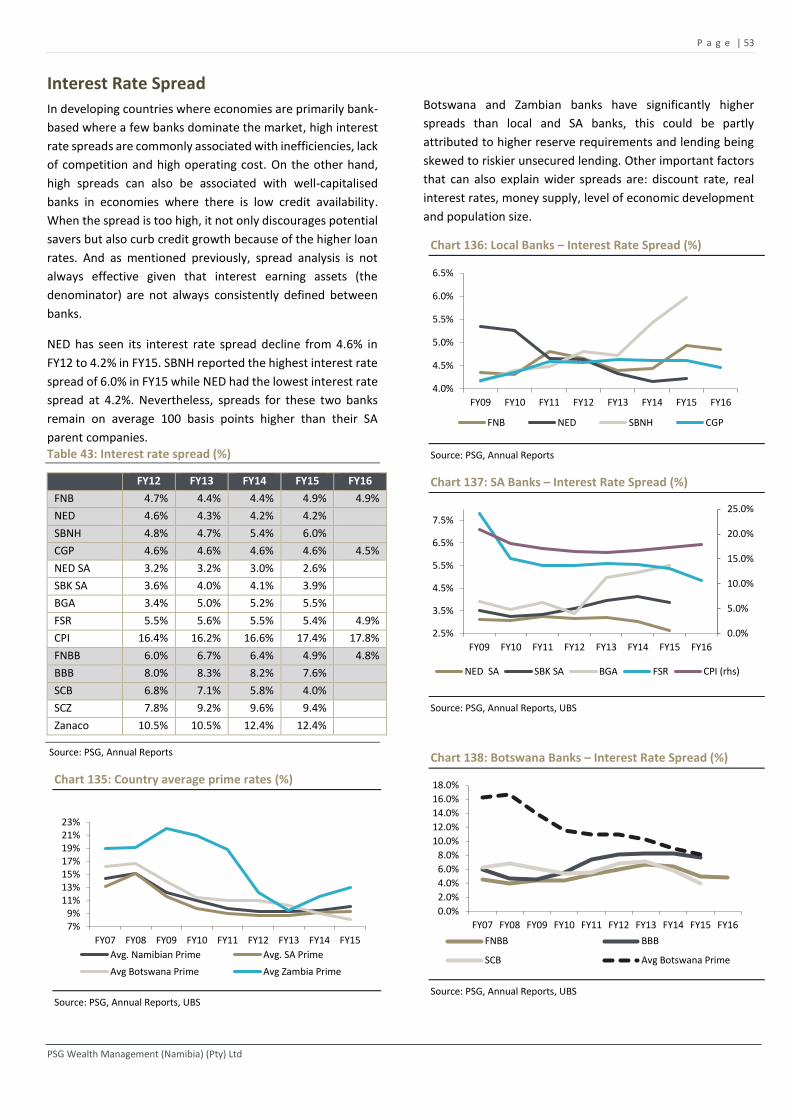
P a g e | 53
PSG Wealth Management (Namibia) (Pty) Ltd
Interest Rate Spread
In developing countries where economies are primarily bank-
based where a few banks dominate the market, high interest
rate spreads are commonly associated with inefficiencies, lack
of competition and high operating cost. On the other hand,
high spreads can also be associated with well-capitalised
banks in economies where there is low credit availability.
When the spread is too high, it not only discourages potential
savers but also curb credit growth because of the higher loan
rates. And as mentioned previously, spread analysis is not
always effective given that interest earning assets (the
denominator) are not always consistently defined between
banks.
NED has seen its interest rate spread decline from 4.6% in
FY12 to 4.2% in FY15. SBNH reported the highest interest rate
spread of 6.0% in FY15 while NED had the lowest interest rate
spread at 4.2%. Nevertheless, spreads for these two banks
remain on average 100 basis points higher than their SA
parent companies. Table 43: Interest rate spread (%)
FY12 FY13 FY14 FY15 FY16
FNB 4.7% 4.4% 4.4% 4.9% 4.9%
NED 4.6% 4.3% 4.2% 4.2%
SBNH 4.8% 4.7% 5.4% 6.0%
CGP 4.6% 4.6% 4.6% 4.6% 4.5%
NED SA 3.2% 3.2% 3.0% 2.6%
SBK SA 3.6% 4.0% 4.1% 3.9%
BGA 3.4% 5.0% 5.2% 5.5%
FSR 5.5% 5.6% 5.5% 5.4% 4.9%
CPI 16.4% 16.2% 16.6% 17.4% 17.8%
FNBB 6.0% 6.7% 6.4% 4.9% 4.8%
BBB 8.0% 8.3% 8.2% 7.6% SCB 6.8% 7.1% 5.8% 4.0%
SCZ 7.8% 9.2% 9.6% 9.4%
Zanaco 10.5% 10.5% 12.4% 12.4%
Source: PSG, Annual Reports
Chart 135: Country average prime rates (%)
Source: PSG, Annual Reports, UBS
Botswana and Zambian banks have significantly higher
spreads than local and SA banks, this could be partly
attributed to higher reserve requirements and lending being
skewed to riskier unsecured lending. Other important factors
that can also explain wider spreads are: discount rate, real
interest rates, money supply, level of economic development
and population size.
Chart 136: Local Banks – Interest Rate Spread (%)
Source: PSG, Annual Reports
Chart 137: SA Banks – Interest Rate Spread (%)
Source: PSG, Annual Reports, UBS
Chart 138: Botswana Banks – Interest Rate Spread (%)
Source: PSG, Annual Reports, UBS
7%9%
11%13%15%17%19%21%23%
FY07 FY08 FY09 FY10 FY11 FY12 FY13 FY14 FY15
Avg. Namibian Prime Avg. SA Prime
Avg Botswana Prime Avg Zambia Prime
4.0%
4.5%
5.0%
5.5%
6.0%
6.5%
FY09 FY10 FY11 FY12 FY13 FY14 FY15 FY16
FNB NED SBNH CGP
0.0%
5.0%
10.0%
15.0%
20.0%
25.0%
2.5%
3.5%
4.5%
5.5%
6.5%
7.5%
FY09 FY10 FY11 FY12 FY13 FY14 FY15 FY16
NED SA SBK SA BGA FSR CPI (rhs)
0.0%
2.0%
4.0%
6.0%
8.0%
10.0%
12.0%
14.0%
16.0%
18.0%
FY07 FY08 FY09 FY10 FY11 FY12 FY13 FY14 FY15 FY16
FNBB BBB
SCB Avg Botswana Prime
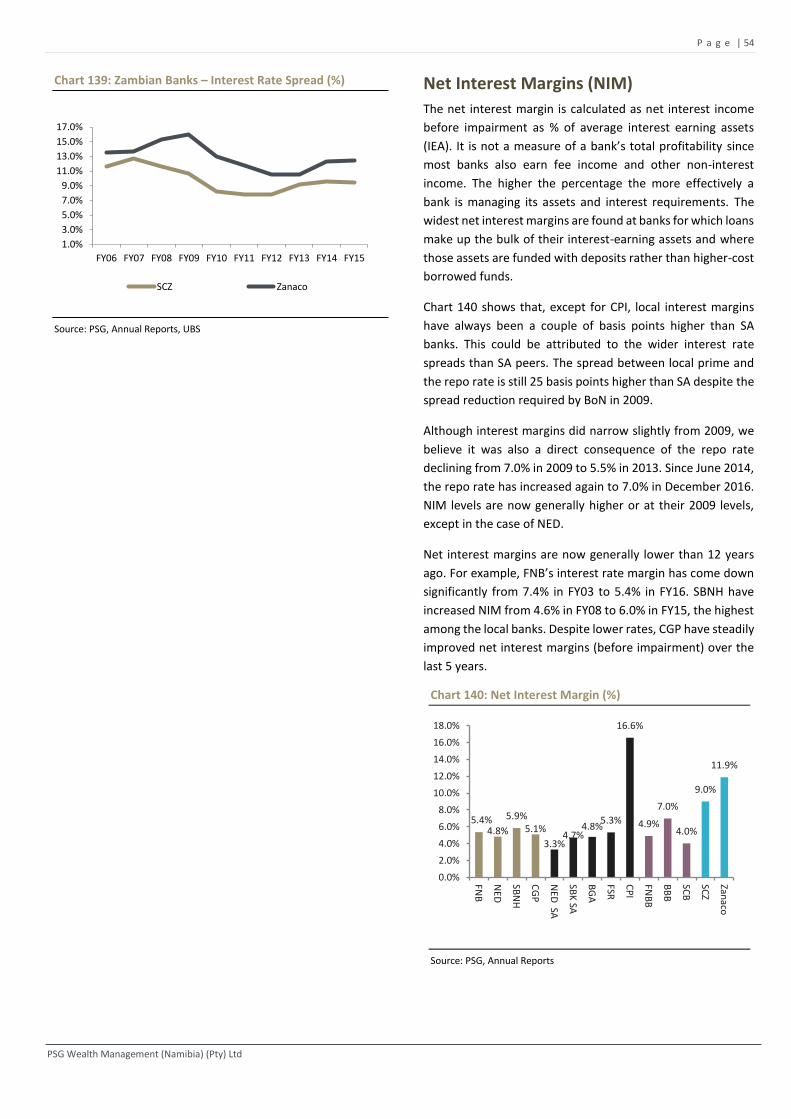
P a g e | 54
PSG Wealth Management (Namibia) (Pty) Ltd
Chart 139: Zambian Banks – Interest Rate Spread (%)
Source: PSG, Annual Reports, UBS
Net Interest Margins (NIM)
The net interest margin is calculated as net interest income
before impairment as % of average interest earning assets
(IEA). It is not a measure of a bank’s total profitability since
most banks also earn fee income and other non-interest
income. The higher the percentage the more effectively a
bank is managing its assets and interest requirements. The
widest net interest margins are found at banks for which loans
make up the bulk of their interest-earning assets and where
those assets are funded with deposits rather than higher-cost
borrowed funds.
Chart 140 shows that, except for CPI, local interest margins
have always been a couple of basis points higher than SA
banks. This could be attributed to the wider interest rate
spreads than SA peers. The spread between local prime and
the repo rate is still 25 basis points higher than SA despite the
spread reduction required by BoN in 2009.
Although interest margins did narrow slightly from 2009, we
believe it was also a direct consequence of the repo rate
declining from 7.0% in 2009 to 5.5% in 2013. Since June 2014,
the repo rate has increased again to 7.0% in December 2016.
NIM levels are now generally higher or at their 2009 levels,
except in the case of NED.
Net interest margins are now generally lower than 12 years
ago. For example, FNB’s interest rate margin has come down
significantly from 7.4% in FY03 to 5.4% in FY16. SBNH have
increased NIM from 4.6% in FY08 to 6.0% in FY15, the highest
among the local banks. Despite lower rates, CGP have steadily
improved net interest margins (before impairment) over the
last 5 years.
Chart 140: Net Interest Margin (%)
Source: PSG, Annual Reports
1.0%
3.0%
5.0%
7.0%
9.0%
11.0%
13.0%
15.0%
17.0%
FY06 FY07 FY08 FY09 FY10 FY11 FY12 FY13 FY14 FY15
SCZ Zanaco
5.4%4.8%
5.9%5.1%
3.3%4.7%
4.8%5.3%
16.6%
4.9%
7.0%
4.0%
9.0%
11.9%
0.0%
2.0%
4.0%
6.0%
8.0%
10.0%
12.0%
14.0%
16.0%
18.0%
FNB
NED
SBN
H
CG
P
NED
SA
SBK
SA
BG
A
FSR
CP
I
FNB
B
BB
B
SCB
SCZ
Zanaco

P a g e | 55
PSG Wealth Management (Namibia) (Pty) Ltd
Chart 141: Local Banks – Net Interest Margin (%)
Source: PSG, Annual Reports
SBNH has previously reported the lowest net interest
margin among the four local banks over the last 5 years, but
has made gains in FY14 and is now tied in second place with
CGP. This is reflected by their CAGR in net interest income
over the same period now outperforming that of NED. NED
experienced some margin pressure over the last 5 years.
FNB’s margins narrowed from 5.8% in FY09 to 4.8% in FY14
and recovered to 5.4% in FY16 while NED’s margins
narrowed from 5.7% to 4.8% in FY15. From the sideways
trajectory of FNB and CGP’s NIM margins, who reported in
FY16, one can expect the same for NED and SBNH for their
end of FY16 results.
Chart 142: SA Banks - Net Interest Margin (%)
Source: PSG, UBS
On balance, the BoN spread reduction requirement put local
banks under pressure to maintain interest rate margins.
Some local banks experienced downward pressure on
interest margins while others, against expectations, were
very resilient and maintained net interest margins.
Among the Botswana banks, SCB and FNBB have
consistently increased interest margins from FY08 to FY13
but there has been margin compression over the last three
years. BBB’s NIM remains the highest among the Botswana
banks mainly because it is heavily skewed toward higher risk
unsecured lending. It is also interesting to note that BBB’s
net interest margin is much higher than local banks,
however, this comes at the expense of higher risk (higher
NPL ratios).
The continued declining trend for the most recent year end
(FY16) for FNBB could prove an indication of what will
happen with SCB and BBB for their next earnings results.
Chart 143: Botswana Banks – Net Interest Margin (%)
Source: PSG, Annual Reports
Rates in Botswana have decreased from 11.5% in FY10 to
8.1% in FY15, while Zambia has seen rates increase from
10.4% in FY13 to 13.0% in FY15. Despite this increase, NIM
in Zambian has decreased over the last two years.
Chart 144: Zambian Banks - Net Interest Margin (%)
Source: PSG, UBS
3.0%
3.5%
4.0%
4.5%
5.0%
5.5%
6.0%
6.5%
7.0%
FY08 FY09 FY10 FY11 FY12 FY13 FY14 FY15 FY16
FNB NED SBNH CGP
0.0%
5.0%
10.0%
15.0%
20.0%
25.0%
30.0%
3.0%
3.5%
4.0%
4.5%
5.0%
5.5%
6.0%
6.5%
7.0%
FY08 FY09 FY10 FY11 FY12 FY13 FY14 FY15 FY16
NED SA SBK SA BGA FSR CPI
0.0%
2.0%
4.0%
6.0%
8.0%
10.0%
12.0%
14.0%
16.0%
18.0%
FY08 FY09 FY10 FY11 FY12 FY13 FY14 FY15 FY16
FNBB BBB
SCB Avg Botswana Prime
0%
10%
20%
30%
40%
50%
60%
FY06 FY07 FY08 FY09 FY10 FY11 FY12 FY13 FY14 FY15
SCZ Zanaco Avg Zambia Prime
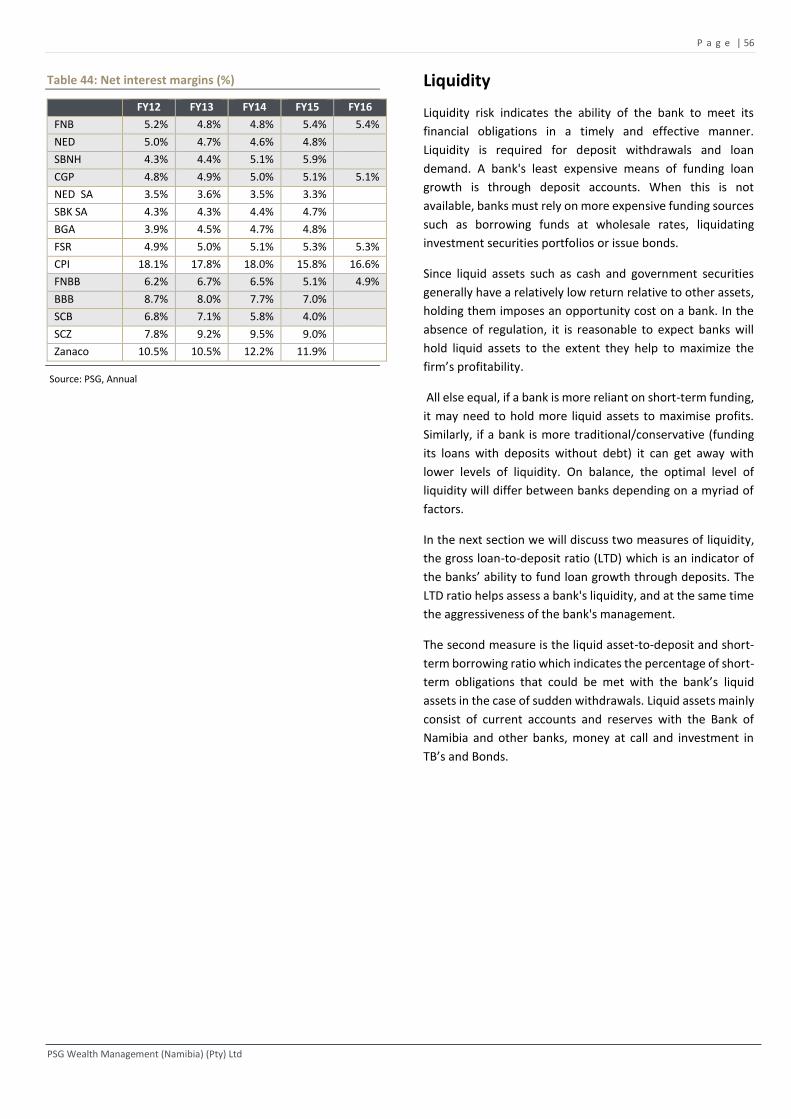
P a g e | 56
PSG Wealth Management (Namibia) (Pty) Ltd
Table 44: Net interest margins (%)
FY12 FY13 FY14 FY15 FY16
FNB 5.2% 4.8% 4.8% 5.4% 5.4%
NED 5.0% 4.7% 4.6% 4.8%
SBNH 4.3% 4.4% 5.1% 5.9%
CGP 4.8% 4.9% 5.0% 5.1% 5.1%
NED SA 3.5% 3.6% 3.5% 3.3%
SBK SA 4.3% 4.3% 4.4% 4.7%
BGA 3.9% 4.5% 4.7% 4.8%
FSR 4.9% 5.0% 5.1% 5.3% 5.3%
CPI 18.1% 17.8% 18.0% 15.8% 16.6%
FNBB 6.2% 6.7% 6.5% 5.1% 4.9%
BBB 8.7% 8.0% 7.7% 7.0%
SCB 6.8% 7.1% 5.8% 4.0%
SCZ 7.8% 9.2% 9.5% 9.0%
Zanaco 10.5% 10.5% 12.2% 11.9%
Source: PSG, Annual
Liquidity
Liquidity risk indicates the ability of the bank to meet its
financial obligations in a timely and effective manner.
Liquidity is required for deposit withdrawals and loan
demand. A bank's least expensive means of funding loan
growth is through deposit accounts. When this is not
available, banks must rely on more expensive funding sources
such as borrowing funds at wholesale rates, liquidating
investment securities portfolios or issue bonds.
Since liquid assets such as cash and government securities
generally have a relatively low return relative to other assets,
holding them imposes an opportunity cost on a bank. In the
absence of regulation, it is reasonable to expect banks will
hold liquid assets to the extent they help to maximize the
firm’s profitability.
All else equal, if a bank is more reliant on short-term funding,
it may need to hold more liquid assets to maximise profits.
Similarly, if a bank is more traditional/conservative (funding
its loans with deposits without debt) it can get away with
lower levels of liquidity. On balance, the optimal level of
liquidity will differ between banks depending on a myriad of
factors.
In the next section we will discuss two measures of liquidity,
the gross loan-to-deposit ratio (LTD) which is an indicator of
the banks’ ability to fund loan growth through deposits. The
LTD ratio helps assess a bank's liquidity, and at the same time
the aggressiveness of the bank's management.
The second measure is the liquid asset-to-deposit and short-
term borrowing ratio which indicates the percentage of short-
term obligations that could be met with the bank’s liquid
assets in the case of sudden withdrawals. Liquid assets mainly
consist of current accounts and reserves with the Bank of
Namibia and other banks, money at call and investment in
TB’s and Bonds.

P a g e | 57
PSG Wealth Management (Namibia) (Pty) Ltd
Loan-to-Deposit (LTD) Ratio
A LTD below 100% is preferable indicating that the bank still
has significant capacity to write new loans from existing
deposits. A LTD ratio above 100% is not necessarily
detrimental it just shows the bank is not only relying on
deposits but also on borrowed funds to fund its loans.
However, if the ratio is too high, the bank could be vulnerable
to any sudden adverse changes in its deposit base.
Conversely, if the ratio is too low, the bank is holding on to
unproductive capital and not generating sufficient returns.
Chart 145: LTD – (%)
Source: PSG, Annual Reports, Bloomberg
CGP’s LTD ratio steadily increased from 92.2% to 111.0% in
FY16 on the back of significant advances growth (7 year CAGR
15.7%), while total deposits increased by (7 year CAGR
12.4%). This suggests that CGP is currently not only relying on
deposits but also on borrowed funds to fund loan growth.
CGP’s debt in issue doubled from N$943m in FY13 to
N$1.84bn in FY14 and increased further to N$2.2bn at FY16
year-end despite a reduction of N$ 200 million over the last
financial year.
Chart 146: CGP – Gross loan-to- deposit
Source: PSG, Annual Reports
Chart 147 shows that FNB has improved its LTD ratio from
levels above 100% in FY09 to 90.8% in FY16. The improvement
can be ascribed to deposits growing at a faster pace than
advances over the period under review.
Chart 147: FNB – Gross LTD (%)
Source: PSG, Annual Reports
NED consistently operated on a LTD ratio between 84% and
90% over the period.
Chart 148: NED – Gross LTD (%)
Source: PSG, Annual Reports
After SBNH’s LTD ratio fluctuated just under 90% levels over
the last 5 years, in the most recent financial year it increased
to 94.7% with very low deposit growth of 4.2%.
As mentioned, this ratio should ideally be below 100%,
however, it must also be noted that LTD is just a snapshot of
total loans to total deposits at one point in time and should
be monitored regularly. The ratio does not give any idea about
the prevailing money multiplier; it also depends on several
deposit-to-loan cycles and LTD ratio of each of them.
90.8%85.9%
94.7%
111.0%
95.5%91.6%
81.9%
93.1%85.3%85.4%
89.3%
65.8%
47.0%
60.3%
0%
20%
40%
60%
80%
100%
120%
FNB
NED
SBN
H
CG
P
NED
SA
SBK
SA
BG
A
FSR
CP
I
FNB
B
BB
B
SCB
SCZ
Zanaco
92.2%98.0% 98.1%
104.1% 107.0% 107.7% 111.0%
0%
20%
40%
60%
80%
100%
120%
FY10 FY11 FY12 FY13 FY14 FY15 FY16
101.1%94.8% 95.0%
87.4% 89.3% 90.2% 92.1% 90.8%
0%
20%
40%
60%
80%
100%
120%
FY09 FY10 FY11 FY12 FY13 FY14 FY15 FY16
88.8% 87.5% 89.5%84.0% 84.1% 85.3% 85.9%
0%
10%
20%
30%
40%
50%
60%
70%
80%
90%
100%
FY09 FY10 FY11 FY12 FY13 FY14 FY15
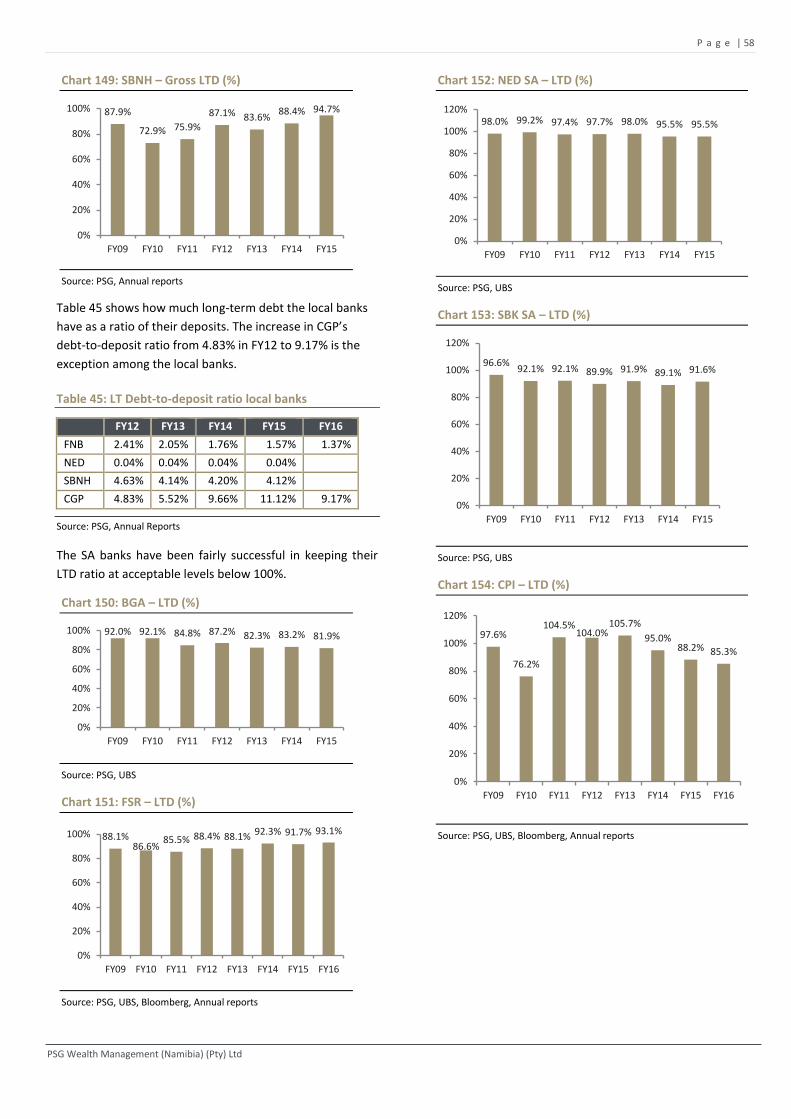
P a g e | 58
PSG Wealth Management (Namibia) (Pty) Ltd
Chart 149: SBNH – Gross LTD (%)
Source: PSG, Annual reports
Table 45 shows how much long-term debt the local banks
have as a ratio of their deposits. The increase in CGP’s
debt-to-deposit ratio from 4.83% in FY12 to 9.17% is the
exception among the local banks.
Table 45: LT Debt-to-deposit ratio local banks
FY12 FY13 FY14 FY15 FY16
FNB 2.41% 2.05% 1.76% 1.57% 1.37%
NED 0.04% 0.04% 0.04% 0.04%
SBNH 4.63% 4.14% 4.20% 4.12%
CGP 4.83% 5.52% 9.66% 11.12% 9.17%
Source: PSG, Annual Reports
The SA banks have been fairly successful in keeping their
LTD ratio at acceptable levels below 100%.
Chart 150: BGA – LTD (%)
Source: PSG, UBS
Chart 151: FSR – LTD (%)
Source: PSG, UBS, Bloomberg, Annual reports
Chart 152: NED SA – LTD (%)
Source: PSG, UBS
Chart 153: SBK SA – LTD (%)
Source: PSG, UBS
Chart 154: CPI – LTD (%)
Source: PSG, UBS, Bloomberg, Annual reports
87.9%
72.9% 75.9%
87.1% 83.6%88.4% 94.7%
0%
20%
40%
60%
80%
100%
FY09 FY10 FY11 FY12 FY13 FY14 FY15
92.0% 92.1% 84.8% 87.2% 82.3% 83.2% 81.9%
0%
20%
40%
60%
80%
100%
FY09 FY10 FY11 FY12 FY13 FY14 FY15
88.1%86.6%
85.5% 88.4% 88.1% 92.3% 91.7% 93.1%
0%
20%
40%
60%
80%
100%
FY09 FY10 FY11 FY12 FY13 FY14 FY15 FY16
98.0% 99.2% 97.4% 97.7% 98.0% 95.5% 95.5%
0%
20%
40%
60%
80%
100%
120%
FY09 FY10 FY11 FY12 FY13 FY14 FY15
96.6%92.1% 92.1% 89.9% 91.9% 89.1% 91.6%
0%
20%
40%
60%
80%
100%
120%
FY09 FY10 FY11 FY12 FY13 FY14 FY15
97.6%
76.2%
104.5%104.0%
105.7%
95.0%88.2% 85.3%
0%
20%
40%
60%
80%
100%
120%
FY09 FY10 FY11 FY12 FY13 FY14 FY15 FY16
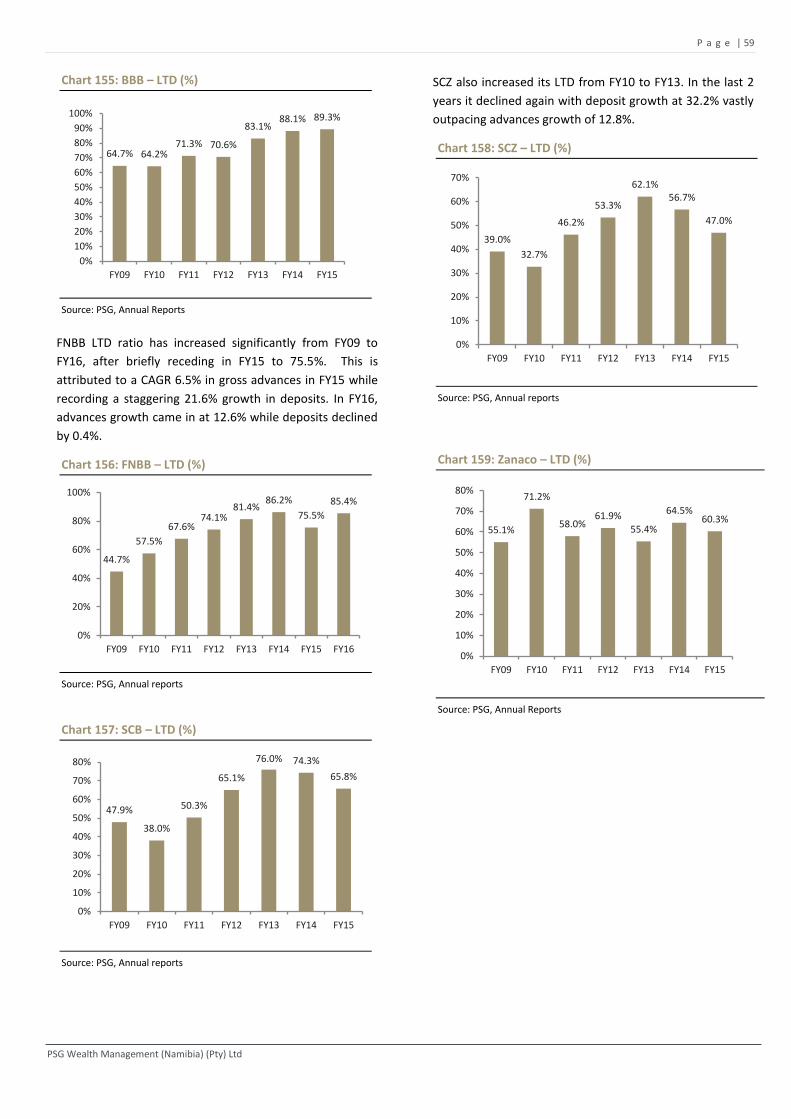
P a g e | 59
PSG Wealth Management (Namibia) (Pty) Ltd
Chart 155: BBB – LTD (%)
Source: PSG, Annual Reports
FNBB LTD ratio has increased significantly from FY09 to
FY16, after briefly receding in FY15 to 75.5%. This is
attributed to a CAGR 6.5% in gross advances in FY15 while
recording a staggering 21.6% growth in deposits. In FY16,
advances growth came in at 12.6% while deposits declined
by 0.4%.
Chart 156: FNBB – LTD (%)
Source: PSG, Annual reports
Chart 157: SCB – LTD (%)
Source: PSG, Annual reports
SCZ also increased its LTD from FY10 to FY13. In the last 2
years it declined again with deposit growth at 32.2% vastly
outpacing advances growth of 12.8%.
Chart 158: SCZ – LTD (%)
Source: PSG, Annual reports
Chart 159: Zanaco – LTD (%)
Source: PSG, Annual Reports
64.7% 64.2%71.3% 70.6%
83.1%88.1% 89.3%
0%
10%
20%
30%
40%
50%
60%
70%
80%
90%
100%
FY09 FY10 FY11 FY12 FY13 FY14 FY15
44.7%
57.5%
67.6%74.1%
81.4%86.2%
75.5%
85.4%
0%
20%
40%
60%
80%
100%
FY09 FY10 FY11 FY12 FY13 FY14 FY15 FY16
47.9%
38.0%
50.3%
65.1%
76.0% 74.3%
65.8%
0%
10%
20%
30%
40%
50%
60%
70%
80%
FY09 FY10 FY11 FY12 FY13 FY14 FY15
39.0%
32.7%
46.2%
53.3%
62.1%56.7%
47.0%
0%
10%
20%
30%
40%
50%
60%
70%
FY09 FY10 FY11 FY12 FY13 FY14 FY15
55.1%
71.2%
58.0%61.9%
55.4%
64.5%60.3%
0%
10%
20%
30%
40%
50%
60%
70%
80%
FY09 FY10 FY11 FY12 FY13 FY14 FY15

P a g e | 60
PSG Wealth Management (Namibia) (Pty) Ltd
Liquid Assets to Deposit (LADST)
This ratio represents the percentage of short-term obligations
that could be met with the bank’s liquid assets in the case of
sudden withdrawals. It captures the bank’s vulnerability
related to funding sources such as customer and business
deposits from other banks and other financial institutions.
The higher the value of the ratio, the higher is the capacity to
absorb liquidity shock. Nevertheless, a high value of this ratio
could also be interpreted as inefficiency since liquid assets
yield a lower return than other assets and imposes high
opportunity costs for the bank, thereby having a negative
impact on profitability.
The optimal level of liquidity will vary from bank to bank,
however, if the banks are more reliant on short-term funding
it may need to hold more liquid assets to maximise
profitability and investor confidence.
Chart 160: LADST
Source: PSG, Annual Reports, UBS
Chart 160 shows that local banks are on average more liquid
than SA banks. The Botswana and Zambian banks on the other
hand seem excessively liquid bordering on inefficiency, which
we have mentioned is having a negative impact on their
profitability.
Chart 161: CGP – LADST (%)
Source: PSG, Company data
Chart 162 shows FNB’s liquidity remains favourable over the
last 6 years. While CGP’s LADST ratio might be the lowest
among local banks, it remains at acceptable levels.
Chart 162: FNB – LADST (%)
Source: PSG, Annual Report
NED’s liquidity has gradually increased from 18.9% in FY07
to 31.5% in FY15. As mentioned, if this ratio becomes too
high, it could be interpreted as inefficiency of funds with a
potential negative impact on profitability.
Chart 163: NED – LADST (%)
Source: PSG, Annual Report
Chart 164: SBNH – LADST (%)
Source: PSG, Annual Reports
24.9%
31.5%26.3%
19.5%21.3%
19.4%18.9%
27.2%
52.1%
25.6%
33.8%
50.9%
61.6%65.1%
0%
10%
20%
30%
40%
50%
60%
70%
FNB
NED
SBN
H
CG
P
NED
SA
SBK
SA
BG
A
FSR
CP
I
FNB
B
BB
B
SCB
SCZ
Zanaco
19.4%20.8%
18.5% 18.7%15.9%
17.6% 18.3%19.5%
0%
5%
10%
15%
20%
25%
FY09 FY10 FY11 FY12 FY13 FY14 FY15 FY16
25.7%
33.9%
21.2%
31.1%
25.3% 24.5% 23.0%24.9%
0%
5%
10%
15%
20%
25%
30%
35%
40%
FY09 FY10 FY11 FY12 FY13 FY14 FY15 FY16
18.9%20.5%
22.1%
26.4% 27.1%
32.7% 32.1% 32.2% 31.5%
0%
5%
10%
15%
20%
25%
30%
35%
FY07 FY08 FY09 FY10 FY11 FY12 FY13 FY14 FY15
26.1%28.7% 28.0%
26.4% 27.2%
22.6%
26.3%
0%
5%
10%
15%
20%
25%
30%
35%
FY09 FY10 FY11 FY12 FY13 FY14 FY15
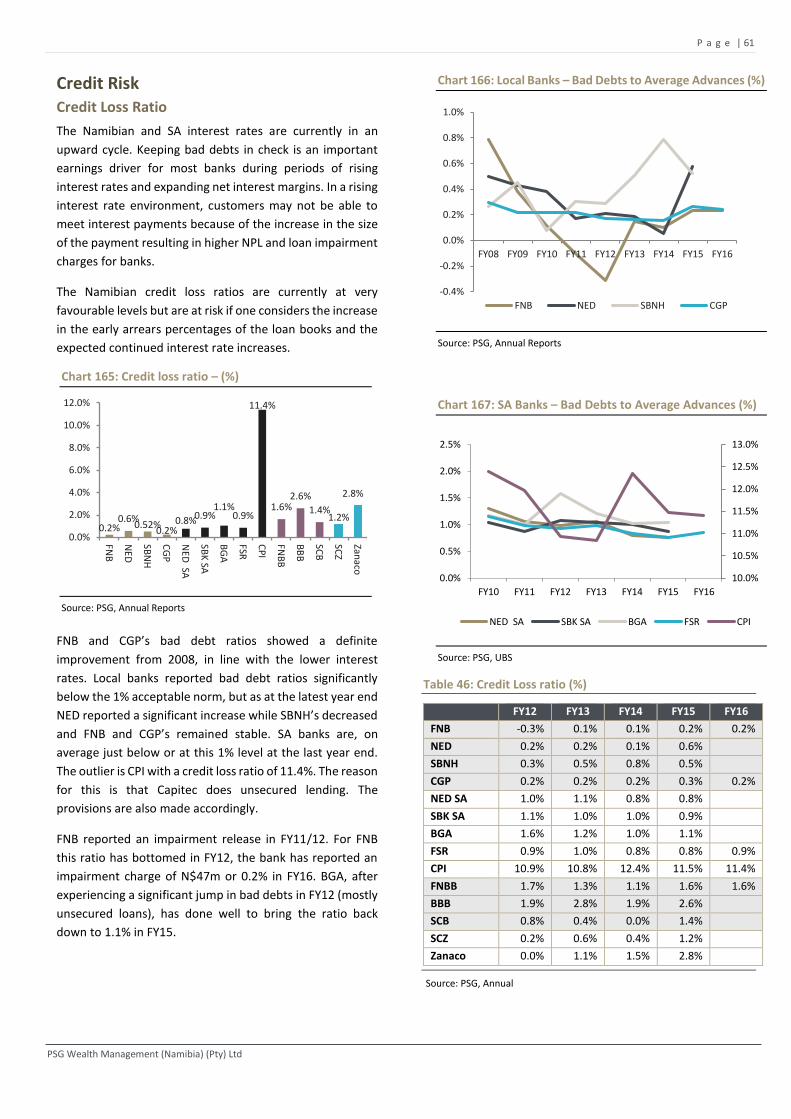
P a g e | 61
PSG Wealth Management (Namibia) (Pty) Ltd
Credit Risk Credit Loss Ratio
The Namibian and SA interest rates are currently in an
upward cycle. Keeping bad debts in check is an important
earnings driver for most banks during periods of rising
interest rates and expanding net interest margins. In a rising
interest rate environment, customers may not be able to
meet interest payments because of the increase in the size
of the payment resulting in higher NPL and loan impairment
charges for banks.
The Namibian credit loss ratios are currently at very
favourable levels but are at risk if one considers the increase
in the early arrears percentages of the loan books and the
expected continued interest rate increases.
Chart 165: Credit loss ratio – (%)
Source: PSG, Annual Reports
FNB and CGP’s bad debt ratios showed a definite
improvement from 2008, in line with the lower interest
rates. Local banks reported bad debt ratios significantly
below the 1% acceptable norm, but as at the latest year end
NED reported a significant increase while SBNH’s decreased
and FNB and CGP’s remained stable. SA banks are, on
average just below or at this 1% level at the last year end.
The outlier is CPI with a credit loss ratio of 11.4%. The reason
for this is that Capitec does unsecured lending. The
provisions are also made accordingly.
FNB reported an impairment release in FY11/12. For FNB
this ratio has bottomed in FY12, the bank has reported an
impairment charge of N$47m or 0.2% in FY16. BGA, after
experiencing a significant jump in bad debts in FY12 (mostly
unsecured loans), has done well to bring the ratio back
down to 1.1% in FY15.
Chart 166: Local Banks – Bad Debts to Average Advances (%)
Source: PSG, Annual Reports
Chart 167: SA Banks – Bad Debts to Average Advances (%)
Source: PSG, UBS
Table 46: Credit Loss ratio (%)
FY12 FY13 FY14 FY15 FY16
FNB -0.3% 0.1% 0.1% 0.2% 0.2%
NED 0.2% 0.2% 0.1% 0.6%
SBNH 0.3% 0.5% 0.8% 0.5%
CGP 0.2% 0.2% 0.2% 0.3% 0.2%
NED SA 1.0% 1.1% 0.8% 0.8%
SBK SA 1.1% 1.0% 1.0% 0.9%
BGA 1.6% 1.2% 1.0% 1.1%
FSR 0.9% 1.0% 0.8% 0.8% 0.9%
CPI 10.9% 10.8% 12.4% 11.5% 11.4%
FNBB 1.7% 1.3% 1.1% 1.6% 1.6%
BBB 1.9% 2.8% 1.9% 2.6%
SCB 0.8% 0.4% 0.0% 1.4%
SCZ 0.2% 0.6% 0.4% 1.2%
Zanaco 0.0% 1.1% 1.5% 2.8%
Source: PSG, Annual
0.2%0.6%
0.52%0.2%
0.8%0.9%1.1%
0.9%
11.4%
1.6%2.6%
1.4%1.2%
2.8%
0.0%
2.0%
4.0%
6.0%
8.0%
10.0%
12.0%
FNB
NED
SBN
H
CG
P
NED
SA
SBK
SA
BG
A
FSR
CP
I
FNB
B
BB
B
SCB
SCZ
Zanaco
-0.4%
-0.2%
0.0%
0.2%
0.4%
0.6%
0.8%
1.0%
FY08 FY09 FY10 FY11 FY12 FY13 FY14 FY15 FY16
FNB NED SBNH CGP
10.0%
10.5%
11.0%
11.5%
12.0%
12.5%
13.0%
0.0%
0.5%
1.0%
1.5%
2.0%
2.5%
FY10 FY11 FY12 FY13 FY14 FY15 FY16
NED SA SBK SA BGA FSR CPI
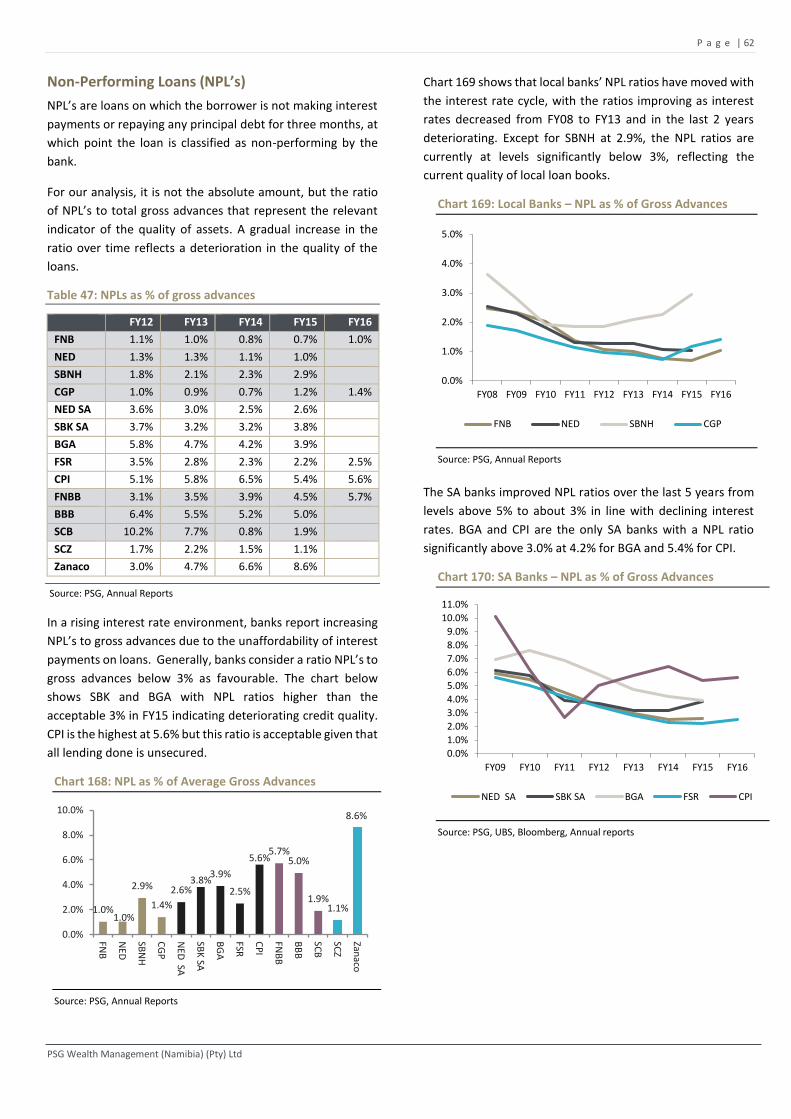
P a g e | 62
PSG Wealth Management (Namibia) (Pty) Ltd
Non-Performing Loans (NPL’s)
NPL’s are loans on which the borrower is not making interest
payments or repaying any principal debt for three months, at
which point the loan is classified as non-performing by the
bank.
For our analysis, it is not the absolute amount, but the ratio
of NPL’s to total gross advances that represent the relevant
indicator of the quality of assets. A gradual increase in the
ratio over time reflects a deterioration in the quality of the
loans.
Table 47: NPLs as % of gross advances
FY12 FY13 FY14 FY15 FY16
FNB 1.1% 1.0% 0.8% 0.7% 1.0%
NED 1.3% 1.3% 1.1% 1.0%
SBNH 1.8% 2.1% 2.3% 2.9%
CGP 1.0% 0.9% 0.7% 1.2% 1.4%
NED SA 3.6% 3.0% 2.5% 2.6%
SBK SA 3.7% 3.2% 3.2% 3.8%
BGA 5.8% 4.7% 4.2% 3.9%
FSR 3.5% 2.8% 2.3% 2.2% 2.5%
CPI 5.1% 5.8% 6.5% 5.4% 5.6%
FNBB 3.1% 3.5% 3.9% 4.5% 5.7%
BBB 6.4% 5.5% 5.2% 5.0%
SCB 10.2% 7.7% 0.8% 1.9%
SCZ 1.7% 2.2% 1.5% 1.1%
Zanaco 3.0% 4.7% 6.6% 8.6%
Source: PSG, Annual Reports
In a rising interest rate environment, banks report increasing
NPL’s to gross advances due to the unaffordability of interest
payments on loans. Generally, banks consider a ratio NPL’s to
gross advances below 3% as favourable. The chart below
shows SBK and BGA with NPL ratios higher than the
acceptable 3% in FY15 indicating deteriorating credit quality.
CPI is the highest at 5.6% but this ratio is acceptable given that
all lending done is unsecured.
Chart 168: NPL as % of Average Gross Advances
Source: PSG, Annual Reports
Chart 169 shows that local banks’ NPL ratios have moved with
the interest rate cycle, with the ratios improving as interest
rates decreased from FY08 to FY13 and in the last 2 years
deteriorating. Except for SBNH at 2.9%, the NPL ratios are
currently at levels significantly below 3%, reflecting the
current quality of local loan books.
Chart 169: Local Banks – NPL as % of Gross Advances
Source: PSG, Annual Reports
The SA banks improved NPL ratios over the last 5 years from
levels above 5% to about 3% in line with declining interest
rates. BGA and CPI are the only SA banks with a NPL ratio
significantly above 3.0% at 4.2% for BGA and 5.4% for CPI.
Chart 170: SA Banks – NPL as % of Gross Advances
Source: PSG, UBS, Bloomberg, Annual reports
1.0%1.0%
2.9%
1.4%
2.6%3.8%
3.9%
2.5%
5.6%5.7%
5.0%
1.9%1.1%
8.6%
0.0%
2.0%
4.0%
6.0%
8.0%
10.0%
FNB
NED
SBN
H
CG
P
NED
SA
SBK
SA
BG
A
FSR
CP
I
FNB
B
BB
B
SCB
SCZ
Zanaco
0.0%
1.0%
2.0%
3.0%
4.0%
5.0%
FY08 FY09 FY10 FY11 FY12 FY13 FY14 FY15 FY16
FNB NED SBNH CGP
0.0%
1.0%
2.0%
3.0%
4.0%
5.0%
6.0%
7.0%
8.0%
9.0%
10.0%
11.0%
FY09 FY10 FY11 FY12 FY13 FY14 FY15 FY16
NED SA SBK SA BGA FSR CPI
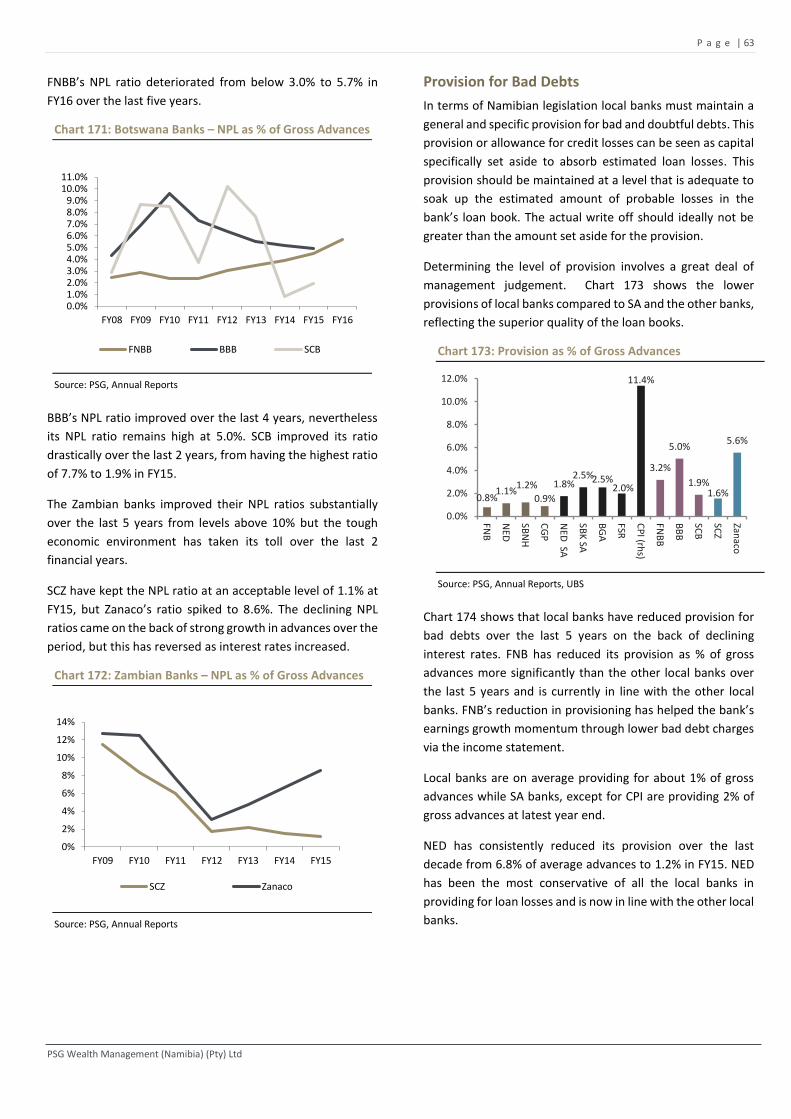
P a g e | 63
PSG Wealth Management (Namibia) (Pty) Ltd
FNBB’s NPL ratio deteriorated from below 3.0% to 5.7% in
FY16 over the last five years.
Chart 171: Botswana Banks – NPL as % of Gross Advances
Source: PSG, Annual Reports
BBB’s NPL ratio improved over the last 4 years, nevertheless
its NPL ratio remains high at 5.0%. SCB improved its ratio
drastically over the last 2 years, from having the highest ratio
of 7.7% to 1.9% in FY15.
The Zambian banks improved their NPL ratios substantially
over the last 5 years from levels above 10% but the tough
economic environment has taken its toll over the last 2
financial years.
SCZ have kept the NPL ratio at an acceptable level of 1.1% at
FY15, but Zanaco’s ratio spiked to 8.6%. The declining NPL
ratios came on the back of strong growth in advances over the
period, but this has reversed as interest rates increased.
Chart 172: Zambian Banks – NPL as % of Gross Advances
Source: PSG, Annual Reports
Provision for Bad Debts
In terms of Namibian legislation local banks must maintain a
general and specific provision for bad and doubtful debts. This
provision or allowance for credit losses can be seen as capital
specifically set aside to absorb estimated loan losses. This
provision should be maintained at a level that is adequate to
soak up the estimated amount of probable losses in the
bank’s loan book. The actual write off should ideally not be
greater than the amount set aside for the provision.
Determining the level of provision involves a great deal of
management judgement. Chart 173 shows the lower
provisions of local banks compared to SA and the other banks,
reflecting the superior quality of the loan books.
Chart 173: Provision as % of Gross Advances
Source: PSG, Annual Reports, UBS
Chart 174 shows that local banks have reduced provision for
bad debts over the last 5 years on the back of declining
interest rates. FNB has reduced its provision as % of gross
advances more significantly than the other local banks over
the last 5 years and is currently in line with the other local
banks. FNB’s reduction in provisioning has helped the bank’s
earnings growth momentum through lower bad debt charges
via the income statement.
Local banks are on average providing for about 1% of gross
advances while SA banks, except for CPI are providing 2% of
gross advances at latest year end.
NED has consistently reduced its provision over the last
decade from 6.8% of average advances to 1.2% in FY15. NED
has been the most conservative of all the local banks in
providing for loan losses and is now in line with the other local
banks.
0.0%1.0%2.0%3.0%4.0%5.0%6.0%7.0%8.0%9.0%
10.0%11.0%
FY08 FY09 FY10 FY11 FY12 FY13 FY14 FY15 FY16
FNBB BBB SCB
0%
2%
4%
6%
8%
10%
12%
14%
FY09 FY10 FY11 FY12 FY13 FY14 FY15
SCZ Zanaco
0.8%1.1%
1.2%
0.9%
1.8%2.5%2.5%
2.0%
11.4%
3.2%
5.0%
1.9%1.6%
5.6%
0.0%
2.0%
4.0%
6.0%
8.0%
10.0%
12.0%
FNB
NED
SBN
H
CG
P
NED
SA
SBK
SA
BG
A
FSR
CP
I (rhs)
FNB
B
BB
B
SCB
SCZ
Zanaco
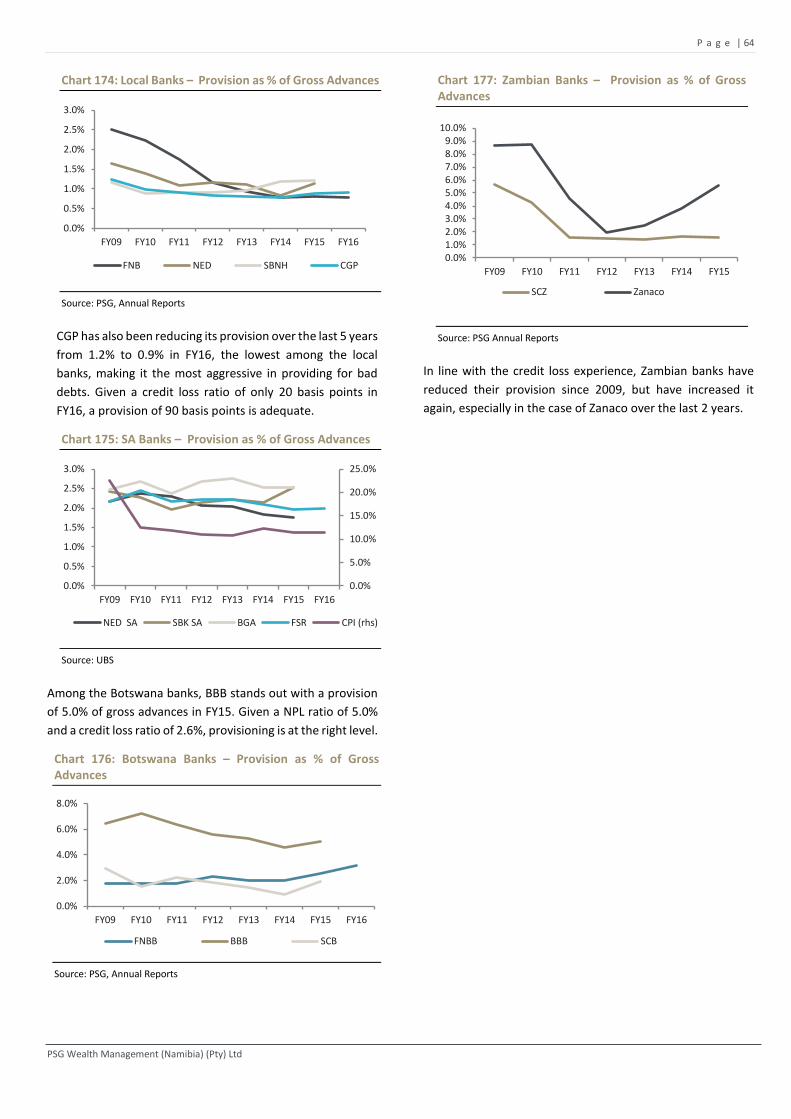
P a g e | 64
PSG Wealth Management (Namibia) (Pty) Ltd
Chart 174: Local Banks – Provision as % of Gross Advances
Source: PSG, Annual Reports
CGP has also been reducing its provision over the last 5 years
from 1.2% to 0.9% in FY16, the lowest among the local
banks, making it the most aggressive in providing for bad
debts. Given a credit loss ratio of only 20 basis points in
FY16, a provision of 90 basis points is adequate.
Chart 175: SA Banks – Provision as % of Gross Advances
Source: UBS
Among the Botswana banks, BBB stands out with a provision
of 5.0% of gross advances in FY15. Given a NPL ratio of 5.0%
and a credit loss ratio of 2.6%, provisioning is at the right level.
Chart 176: Botswana Banks – Provision as % of Gross Advances
Source: PSG, Annual Reports
Chart 177: Zambian Banks – Provision as % of Gross Advances
Source: PSG Annual Reports
In line with the credit loss experience, Zambian banks have
reduced their provision since 2009, but have increased it
again, especially in the case of Zanaco over the last 2 years.
0.0%
0.5%
1.0%
1.5%
2.0%
2.5%
3.0%
FY09 FY10 FY11 FY12 FY13 FY14 FY15 FY16
FNB NED SBNH CGP
0.0%
5.0%
10.0%
15.0%
20.0%
25.0%
0.0%
0.5%
1.0%
1.5%
2.0%
2.5%
3.0%
FY09 FY10 FY11 FY12 FY13 FY14 FY15 FY16
NED SA SBK SA BGA FSR CPI (rhs)
0.0%
2.0%
4.0%
6.0%
8.0%
FY09 FY10 FY11 FY12 FY13 FY14 FY15 FY16
FNBB BBB SCB
0.0%1.0%2.0%3.0%4.0%5.0%6.0%7.0%8.0%9.0%
10.0%
FY09 FY10 FY11 FY12 FY13 FY14 FY15
SCZ Zanaco
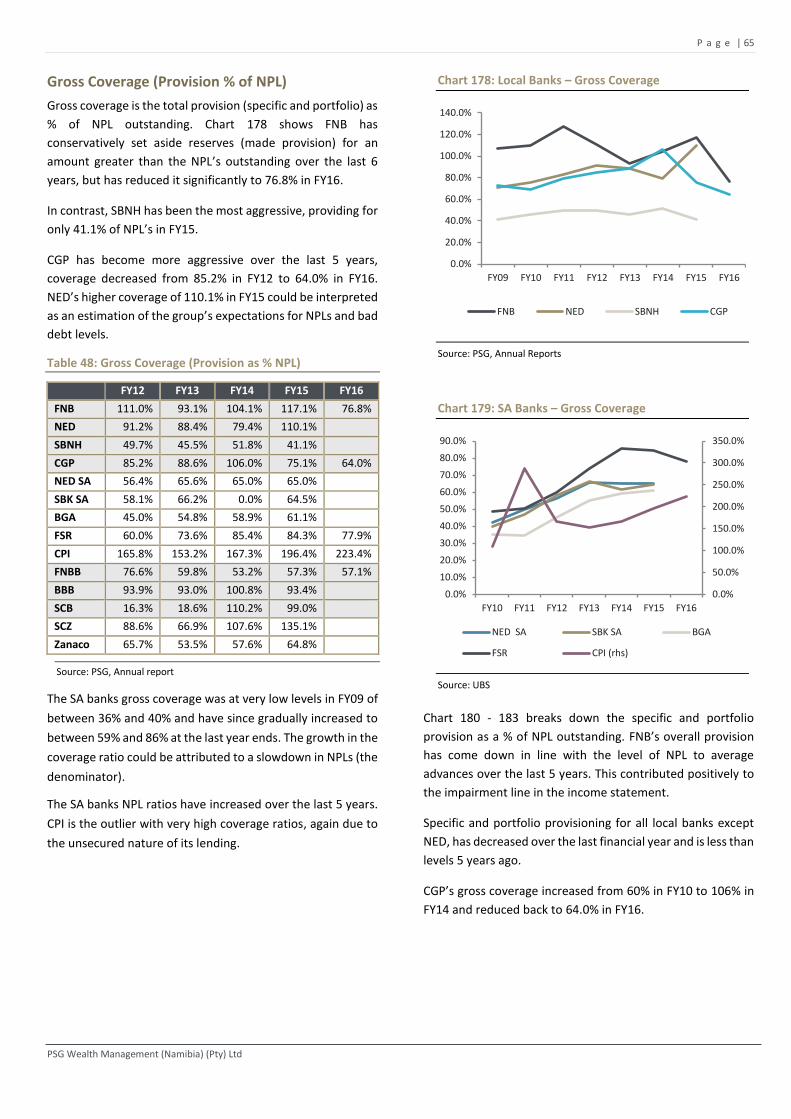
P a g e | 65
PSG Wealth Management (Namibia) (Pty) Ltd
Gross Coverage (Provision % of NPL)
Gross coverage is the total provision (specific and portfolio) as
% of NPL outstanding. Chart 178 shows FNB has
conservatively set aside reserves (made provision) for an
amount greater than the NPL’s outstanding over the last 6
years, but has reduced it significantly to 76.8% in FY16.
In contrast, SBNH has been the most aggressive, providing for
only 41.1% of NPL’s in FY15.
CGP has become more aggressive over the last 5 years,
coverage decreased from 85.2% in FY12 to 64.0% in FY16.
NED’s higher coverage of 110.1% in FY15 could be interpreted
as an estimation of the group’s expectations for NPLs and bad
debt levels.
Table 48: Gross Coverage (Provision as % NPL)
FY12 FY13 FY14 FY15 FY16
FNB 111.0% 93.1% 104.1% 117.1% 76.8%
NED 91.2% 88.4% 79.4% 110.1%
SBNH 49.7% 45.5% 51.8% 41.1%
CGP 85.2% 88.6% 106.0% 75.1% 64.0%
NED SA 56.4% 65.6% 65.0% 65.0%
SBK SA 58.1% 66.2% 0.0% 64.5%
BGA 45.0% 54.8% 58.9% 61.1%
FSR 60.0% 73.6% 85.4% 84.3% 77.9%
CPI 165.8% 153.2% 167.3% 196.4% 223.4%
FNBB 76.6% 59.8% 53.2% 57.3% 57.1%
BBB 93.9% 93.0% 100.8% 93.4% SCB 16.3% 18.6% 110.2% 99.0%
SCZ 88.6% 66.9% 107.6% 135.1%
Zanaco 65.7% 53.5% 57.6% 64.8%
Source: PSG, Annual report
The SA banks gross coverage was at very low levels in FY09 of
between 36% and 40% and have since gradually increased to
between 59% and 86% at the last year ends. The growth in the
coverage ratio could be attributed to a slowdown in NPLs (the
denominator).
The SA banks NPL ratios have increased over the last 5 years.
CPI is the outlier with very high coverage ratios, again due to
the unsecured nature of its lending.
Chart 178: Local Banks – Gross Coverage
Source: PSG, Annual Reports
Chart 179: SA Banks – Gross Coverage
Source: UBS
Chart 180 - 183 breaks down the specific and portfolio
provision as a % of NPL outstanding. FNB’s overall provision
has come down in line with the level of NPL to average
advances over the last 5 years. This contributed positively to
the impairment line in the income statement.
Specific and portfolio provisioning for all local banks except
NED, has decreased over the last financial year and is less than
levels 5 years ago.
CGP’s gross coverage increased from 60% in FY10 to 106% in
FY14 and reduced back to 64.0% in FY16.
0.0%
20.0%
40.0%
60.0%
80.0%
100.0%
120.0%
140.0%
FY09 FY10 FY11 FY12 FY13 FY14 FY15 FY16
FNB NED SBNH CGP
0.0%
50.0%
100.0%
150.0%
200.0%
250.0%
300.0%
350.0%
0.0%
10.0%
20.0%
30.0%
40.0%
50.0%
60.0%
70.0%
80.0%
90.0%
FY10 FY11 FY12 FY13 FY14 FY15 FY16
NED SA SBK SA BGA
FSR CPI (rhs)
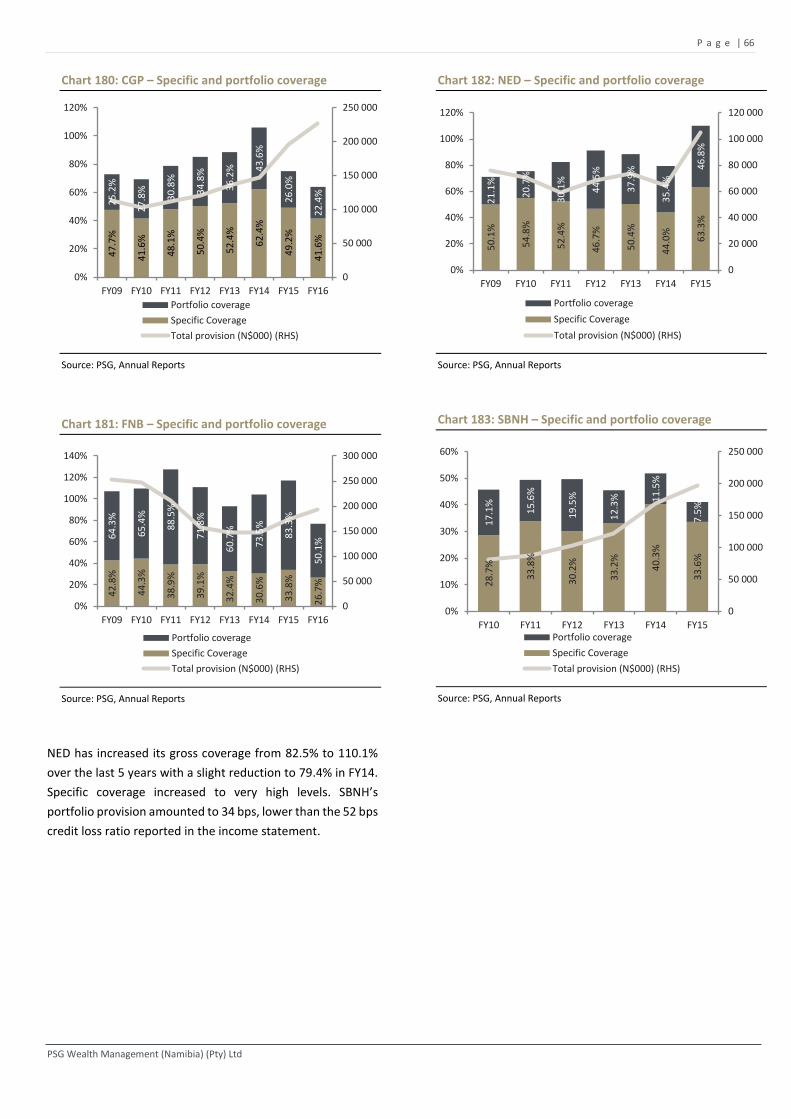
P a g e | 66
PSG Wealth Management (Namibia) (Pty) Ltd
Chart 180: CGP – Specific and portfolio coverage
Source: PSG, Annual Reports
Chart 181: FNB – Specific and portfolio coverage
Source: PSG, Annual Reports
NED has increased its gross coverage from 82.5% to 110.1%
over the last 5 years with a slight reduction to 79.4% in FY14.
Specific coverage increased to very high levels. SBNH’s
portfolio provision amounted to 34 bps, lower than the 52 bps
credit loss ratio reported in the income statement.
Chart 182: NED – Specific and portfolio coverage
Source: PSG, Annual Reports
Chart 183: SBNH – Specific and portfolio coverage
Source: PSG, Annual Reports
47
.7%
41
.6%
48
.1%
50
.4%
52
.4%
62
.4%
49
.2%
41
.6%
25
.2%
27
.8%
30
.8%
34
.8%
36
.2% 4
3.6
%
26
.0%
22
.4%
0
50 000
100 000
150 000
200 000
250 000
0%
20%
40%
60%
80%
100%
120%
FY09 FY10 FY11 FY12 FY13 FY14 FY15 FY16
Portfolio coverage
Specific Coverage
Total provision (N$000) (RHS)
42
.8%
44
.3%
38
.9%
39
.1%
32
.4%
30
.6%
33
.8%
26
.7%
64
.3%
65
.4%
88
.5%
71
.8%
60
.7%
73
.5%
83
.3%
50
.1%
0
50 000
100 000
150 000
200 000
250 000
300 000
0%
20%
40%
60%
80%
100%
120%
140%
FY09 FY10 FY11 FY12 FY13 FY14 FY15 FY16
Portfolio coverage
Specific Coverage
Total provision (N$000) (RHS)
50
.1%
54
.8%
52
.4%
46
.7%
50
.4%
44
.0%
63
.3%
21
.1%
20
.7%
30
.1%
44
.5%
37
.9%
35
.4%
46
.8%
0
20 000
40 000
60 000
80 000
100 000
120 000
0%
20%
40%
60%
80%
100%
120%
FY09 FY10 FY11 FY12 FY13 FY14 FY15
Portfolio coverage
Specific Coverage
Total provision (N$000) (RHS)
28
.7%
33
.8%
30
.2%
33
.2%
40
.3%
33
.6%
17
.1%
15
.6%
19
.5%
12
.3% 11
.5%
7.5
%
0
50 000
100 000
150 000
200 000
250 000
0%
10%
20%
30%
40%
50%
60%
FY10 FY11 FY12 FY13 FY14 FY15Portfolio coverage
Specific Coverage
Total provision (N$000) (RHS)

P a g e | 67
PSG Wealth Management (Namibia) (Pty) Ltd
Valuation
In this section, we estimate a fair value for the local, Botswana
and Zambian banks.
The listed Namibian banks, FNB and CGP are valued using a
three-stage discounted cash flow model with the terminal
value determined by the justified price-to-book multiple.
All the other banks are valued on a justified price-to-book
value method. The justified PB value is represented by ROE-
g/COE–g, where COE is the cost of equity and g is the
sustainable growth rate.
Other valuation inputs include risk free rate, sustainable and
a risk premium.
We have used the latest data available for FNB and CGP and
FY15 data for the other banks. Chart 184 shows the market
cap for the SA banks at 7 December 2016. FSR has the highest
market cap at R 290bn.
Chart 184: SA Banks – Market Cap (Rbn) at 7 December 2016
Source: PSG, Bloomberg
Chart 185 shows the market cap for local, Botswana and
Zambian banks (converted to N$) based on share price and
exchange rates at 7 December 2016. Estimated prices were
used for the two unlisted banks (NED and SBNH). At N$12.8bn
FNB has the highest market cap among local banks, but
remains small compared to SA banks.
Chart 185: Market Cap (N$billion) at December 2016
Source: PSG, Bloomberg
The chart below shows the fair value of the banks based on
our P/B valuation. We value FNB at N$14.46bn, the highest
among the banks. CGP is valued at N$10.38bn. NED is
currently valued at N$1.82bn at a sustainable ROE of 15%
while SBNH is valued at N$3.95bn at a sustainable ROE of 18%.
Chart 186: Fair value (N$billion)
Source: PSG
FNBB, BBB and SCB are valued at N$10.5bn, N$3.8bn and
N$3.4bn based on sustainable ROE of 30%, 20% and 25%,
respectively. All the Botswana banks have historically
operated on very high ROEs (above 50%), however, ROE has
started to come off over the last couple of years.
Chart 187: Justified Price-to-Book and Sustainable ROE
Source: PSG
NED has not paid a dividend in the last 7 years. SBNH did not
pay a dividend in FY15 so there is no dividend yield applicable.
114.6
241.5
137.2
290.6
74.5
0
50
100
150
200
250
300
350
NedBank SA StandardBank SA
BarclaysAfrica
FirstRand Capitec
12.81
1.82 3.95
8.84 9.9
5.5 3.0 4.0
0.6
-
5.00
10.00
15.00
FNB
NED
(es
t)
SBN
H (
est)
CG
P
FNB
B
BB
B
SCB
SCZ
Zan
aco
14.46
1.82
3.95
10.38 10.5
3.8 3.4
1.1 0.6
-
2.00
4.00
6.00
8.00
10.00
12.00
14.00
16.00
FNB
NED
(es
t)
SBN
H (
est)
CG
P
FNB
B
BB
B
SCB
SCZ
Zan
aco
23%
15%
19% 18%
30%
20%
25%
32%
15%2.9
0.9
2.0
1.6
4.1
2.5
3.3
1.7
0.60.1
0.6
1.1
1.6
2.1
2.6
3.1
3.6
4.1
4.6
0%
5%
10%
15%
20%
25%
30%
35%
FNB
NED
CG
P
SNB
H
FNB
B
BB
B
SCB
SCZ
Zan
aco
ROE (LHS) PB (RHS)
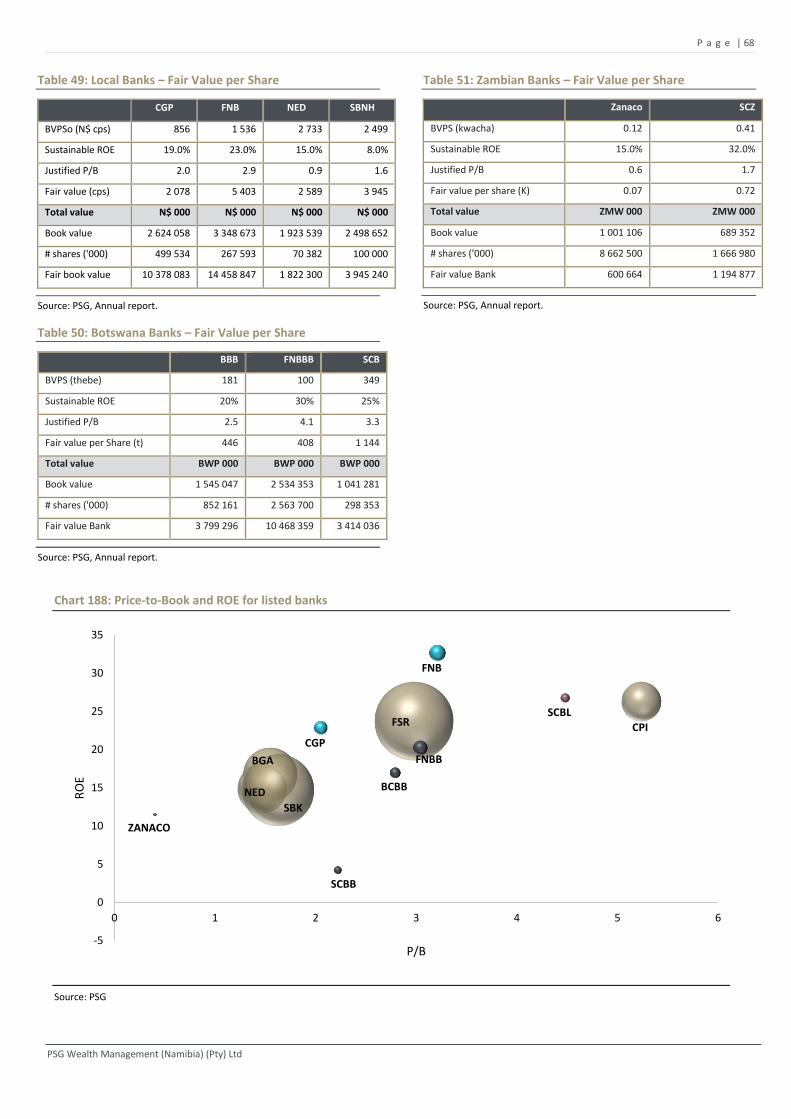
P a g e | 68
PSG Wealth Management (Namibia) (Pty) Ltd
Table 49: Local Banks – Fair Value per Share
CGP FNB NED SBNH
BVPSo (N$ cps) 856 1 536 2 733 2 499
Sustainable ROE 19.0% 23.0% 15.0% 8.0%
Justified P/B 2.0 2.9 0.9 1.6
Fair value (cps) 2 078 5 403 2 589 3 945
Total value N$ 000 N$ 000 N$ 000 N$ 000
Book value 2 624 058 3 348 673 1 923 539 2 498 652
# shares ('000) 499 534 267 593 70 382 100 000
Fair book value 10 378 083 14 458 847 1 822 300 3 945 240
Source: PSG, Annual report.
Table 50: Botswana Banks – Fair Value per Share
BBB FNBBB SCB
BVPS (thebe) 181 100 349
Sustainable ROE 20% 30% 25%
Justified P/B 2.5 4.1 3.3
Fair value per Share (t) 446 408 1 144
Total value BWP 000 BWP 000 BWP 000
Book value 1 545 047 2 534 353 1 041 281
# shares ('000) 852 161 2 563 700 298 353
Fair value Bank 3 799 296 10 468 359 3 414 036
Source: PSG, Annual report.
Table 51: Zambian Banks – Fair Value per Share
Zanaco SCZ
BVPS (kwacha) 0.12 0.41
Sustainable ROE 15.0% 32.0%
Justified P/B 0.6 1.7
Fair value per share (K) 0.07 0.72
Total value ZMW 000 ZMW 000
Book value 1 001 106 689 352
# shares ('000) 8 662 500 1 666 980
Fair value Bank 600 664 1 194 877
Source: PSG, Annual report.
Chart 188: Price-to-Book and ROE for listed banks
Source: PSG
FNB
FSR
BGA
CPI
NED
SBK
ZANACO
BCBB
SCBB
SCBL
FNBB
CGP
-5
0
5
10
15
20
25
30
35
0 1 2 3 4 5 6
RO
E
P/B

P a g e | 69
PSG Wealth Management (Namibia) (Pty) Ltd
Annexure 1: Definitions
Cost-to-Income Operating expenditure divided by total income (net interest before impairment + non-interest income)
Earnings Per Share (EPS) Net Income after tax, extraordinary items, outside shareholders and income associates but before dividends
and reserve transfers divided by the weighted average number of ordinary shares.
Endowment effect
The endowment effect refers to a change in interest margin which occurs when market interest rates change
and the assets and liabilities reprice at different ways. In both the up and down interest rate cycles, assets
reprice more than liabilities, therefore margins compress in a downward cycle and widen in an upward cycle
Return on Assets (ROA) Net income after tax for the financial year divided by average total assets, expressed as a percentage.
Return on Equity (ROE) Net income after tax for the financial year divided by the average shareholders’ funds, expressed as a
percentage or ROA * gearing (assets/equity)
Interest Earning Assets (IEA) Total interest earning loans and advances, including investments that generate interest income, but before any
specific provisions
Interest Bearing Liabilities Total liabilities excluding acceptances, trade creditors and tax liabilities, as well as capital and reserves
Interest Income Total interest income earned on loans, advances and other interest bearing investments.
Net Interest Margin (NIM) The current year’s net interest income before impairment divided by average interest earning assets (IEA).
Interest Spread
The difference between the rate earned on average interest earning assets (interest income/average interest
earning assets) and the rate paid on average interest bearing liabilities (interest expenditure/average interest
bearing liabilities)
Non-Performing Loans A loan on which the recovery of the contractual interest and capital is doubtful. Many loans become non-
performing after being in default for three months, but this can depend on the contract terms.
NAV per share Shareholders’ funds (share capital plus distributable and non-distributable reserves) excluding debentures and
preference shares divided by the number of ordinary shares in issue at the year end
Gross Advances Gross Advances include debtors and acceptances before general provisions and specific provisions
Total risk-based capital ratio The Bank of Namibia (BON) sets the total regulatory to risk weighted assets at a minimum of 10% capital
adequacy ratio at 10% of risk- weighted assets.
Risk Weighted Assets
Different weights are applied to different assets based on the perceived risk. For example - cash and cash
equivalents and all government-backed debt (TB’s and Bonds) are assigned a zero weighting (risk free).
Mortgage loans, with residential property as collateral, are assigned a 50% weighting. More risky assets such as
overdrafts (no collateral) are assigned a 100% weighting.
Tier 1 Capital
This is the core measure of a bank's financial strength from a regulator's point of view. It consists of the types
of financial capital considered the most reliable and liquid, primarily Shareholders' equity less goodwill and
treasury shares
Tier 2 Capital Tier II capital is secondary bank capital that includes items such as undisclosed reserves, collective impairment
allowances, subordinated term debt.
Tier 3 Capital Includes short-term subordinate debt that may be used only to cover a portion of banking institution’s capital
charges for market risk
Gross-loan-to deposit ratio
The gross loan-to-deposit ratio is an indicator of the banks’ ability to fund loan growth through deposits. The
LTD ratio helps assess a bank's liquidity, and at the same time the aggressiveness of the bank's management.
Ideally the ratio should be below 100% indicating that the bank still has significant capacity to write new loans.
Liquid assets-to-deposit & ST borrowing
This ratio indicates the percentage of short-term obligations that could be met with the bank’s liquid assets in
case of sudden withdrawals. Liquid assets mainly consist of current accounts and reserves with the Bank of
Namibia and other banks, money at call and investment in TB’s and Bonds.
Gross Coverage Provision as % of NPL outstanding. .
Bad debt ratio/Credit loss ratio Impairment charge (income statement) divided by average gross advances.
Basis point 1 basis point = 0.01%, 100 basis points =1%

P a g e | 70
PSG Wealth Management (Namibia) (Pty) Ltd
Annexure 2: Rating and Ratio Definitions
12 month Rating Definition
Buy Forecasted Stock Return is >6% above the Market Return Assumption
Hold Forecasted Stock Return is between -6% and 6% of the Market Return Assumption
Reduce Forecasted Stock Return is >6% below the Market Return Assumption
Forecast Stock Return (FSR) is defined as expected percentage price appreciation plus gross dividend yield over the next 12months.
Market Return Assumption (MRA) is defined as the one-year local market interest rate plus an implied the equity risk premium.
Under Review (UR) Stocks may be flagged as UR by the analyst, indicating that the stock's price target and/or rating are subject to possible change in the near
term, usually in response to an event that may affect the investment case or valuation.
Equity Price Targets have an investment horizon of 12 months.

P a g e | 71
PSG Wealth Management (Namibia) (Pty) Ltd
Annexure 3: Financial Data Table 52: Bank Windhoek Holdings Limited for the year ended 30 June
Income statement (N000) FY11 FY12 FY13 FY14 FY15 FY16
Net Interest Income (NII) 671 316 783 058 914 454 1 056 898 1 266 961 1 458 142
Impairment advances (27 129) (25 243) (26 803) (29 115) (58 305) (60 779)
Non-interest Income 402 914 463 332 523 191 679 732 811 891 953 804
Fee & Commission Income 301 215 355 155 416 361 493 301 568 324 686 739
Trading Income 44 444 42 009 46 209 47 263 97 427 143 071
Other non-interest 57 255 66 168 60 621 139 168 146 140 123 995
Operating cost (643 275) (706 511) (762 759) (914 641) (1 042 231) (1 180 153)
Pre-tax profits 462 555 569 981 709 719 878 289 1 067 142 1 269 542
Net Income attributable 327 374 399 803 493 271 624 915 753 002 905 048
Per share data FY11 FY12 FY13 FY14 FY15E FY16
HEPS 73.90 87.00 108.70 121.00 150.9 181.8
DPS 23.00 25.00 32.80 44.00 53.0 66.0
BVPS cents 349.30 417.00 532.10 617.50 728 856
DY (%) 0.0% 2.9% 3.2% 3.6% 3.3% 3.8%
Payout ratio 31.8% 28.2% 30.3% 35.3% 35.4% 36.5%
Profitability FY11 FY12 FY13 FY14 FY15E FY16
NIM (Avg. IEA) 4.40% 4.50% 4.60% 4.70% 4.8% 4.8%
ROA (%) 2.00% 2.10% 2.40% 2.60% 2.6% 2.8%
ROE (%) 22.50% 23.10% 21.90% 21.9% 22.4% 22.9%
Productivity FY11 FY12 FY13 FY14 FY15E FY16
Cost-to-income ratio 61.4% 54.4% 50.9% 50.2% 48.1% 50.2%
Cost/average assets 4.2% 4.0% 3.8% 4.0% 3.9% 3.9%
Compensation expense ratio 32.6% 32.5% 29.2% 28.3% 27.5% 27.9%
Balance sheet (N$000) FY11 FY12 FY13 FY14 FY15E FY16
Total assets 15 984 823 18 921 050 20 938 608 24 318 268 28 700 631 32 333 653
Total deposits 13 387 519 15 911 343 17 082 611 19 065 075 22 251 161 24 171 257
Gross loans 13 115 389 15 604 620 17 786 928 20 393 082 23 621 871 26 825 310
Specific impairment 67 719 70 779 79 864 86 887 95 576 147 829
Portfolio impairment 43 265 48 909 55 102 60 800 66 880 79 458
Net advances 13 004 405 15 484 932 17 651 962 20 245 395 23 621 871 26 598 023
Book value 1 572 853 1 887 059 2 624 058 3 094 158 3 643 373 4 274 039
Capital Adequacy FY11 FY12 FY13 FY14 FY15E FY16
Tier 1 Capital 1 300 722 1 543 094 2 316 138 2 752 941 3 236 196 3 830 115
Total Capital 1 744 181 2 116 897 2 919 832 3 221 507 3 732 256 4 202 488
RWA year-end 13 198 935 15 754 130 17 589 161 20 395 703 23 621 871 26 598 023
Tier 1 ratio % 9.90% 9.80% 13.20% 13.50% 13.70% 14.40%
Total capital ratio 13.20% 13.40% 16.60% 15.80% 15.80% 15.80%
Equity multiplier (x) 10.40 10.10 8.80 7.90 7.90 7.70
Asset Quality FY11 FY12 FY13 FY14 FY15E FY16
Bad debt ratio (%) 0.22% 0.18% 0.16% 0.15% 0.26% 0.24%
NPL 140 673 140 444 152 397 139 290 160 184 355 216
NPL/Gross Advances 1.1% 1.0% 0.9% 0.7% 0.7% 1.4%
Gross coverage 78.9% 85.2% 88.6% 106.0% 101.4% 64.0%
Liquidity FY11 FY12 FY13 FY14 FY15E FY16
Gross loan-to-total funding 93.3% 93.6% 98.7% 97.5% 96.1% 97.4%
Liquid assets to deposit 18.4% 18.7% 15.9% 17.6% 18.3% 19.5%
Value (x) FY11 FY12 FY13 FY14 FY15E FY16
Market cap/revenues 3.5 3.5 3.9 3.6
Market cap/deposits 0.3 0.3 0.4 0.4
P/E 9.4 10.0 10.6 9.6
P/B 1.9 2.0 2.2 2.0
DY (%) 3.2% 3.6% 3.3% 3.8%
Source: PSG, Annual Reports
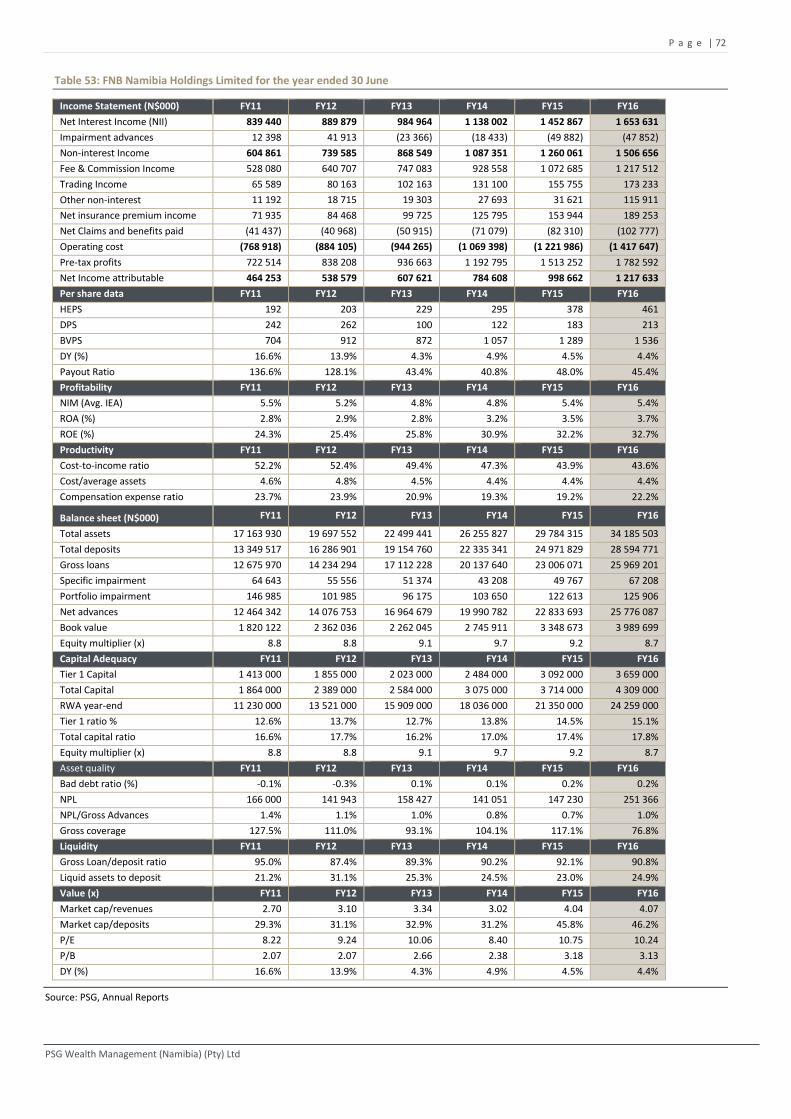
P a g e | 72
PSG Wealth Management (Namibia) (Pty) Ltd
Table 53: FNB Namibia Holdings Limited for the year ended 30 June
Income Statement (N$000) FY11 FY12 FY13 FY14 FY15 FY16
Net Interest Income (NII) 839 440 889 879 984 964 1 138 002 1 452 867 1 653 631
Impairment advances 12 398 41 913 (23 366) (18 433) (49 882) (47 852)
Non-interest Income 604 861 739 585 868 549 1 087 351 1 260 061 1 506 656
Fee & Commission Income 528 080 640 707 747 083 928 558 1 072 685 1 217 512
Trading Income 65 589 80 163 102 163 131 100 155 755 173 233
Other non-interest 11 192 18 715 19 303 27 693 31 621 115 911
Net insurance premium income 71 935 84 468 99 725 125 795 153 944 189 253
Net Claims and benefits paid (41 437) (40 968) (50 915) (71 079) (82 310) (102 777)
Operating cost (768 918) (884 105) (944 265) (1 069 398) (1 221 986) (1 417 647)
Pre-tax profits 722 514 838 208 936 663 1 192 795 1 513 252 1 782 592
Net Income attributable 464 253 538 579 607 621 784 608 998 662 1 217 633
Per share data FY11 FY12 FY13 FY14 FY15 FY16
HEPS 192 203 229 295 378 461
DPS 242 262 100 122 183 213
BVPS 704 912 872 1 057 1 289 1 536
DY (%) 16.6% 13.9% 4.3% 4.9% 4.5% 4.4%
Payout Ratio 136.6% 128.1% 43.4% 40.8% 48.0% 45.4%
Profitability FY11 FY12 FY13 FY14 FY15 FY16
NIM (Avg. IEA) 5.5% 5.2% 4.8% 4.8% 5.4% 5.4%
ROA (%) 2.8% 2.9% 2.8% 3.2% 3.5% 3.7%
ROE (%) 24.3% 25.4% 25.8% 30.9% 32.2% 32.7%
Productivity FY11 FY12 FY13 FY14 FY15 FY16
Cost-to-income ratio 52.2% 52.4% 49.4% 47.3% 43.9% 43.6%
Cost/average assets 4.6% 4.8% 4.5% 4.4% 4.4% 4.4%
Compensation expense ratio 23.7% 23.9% 20.9% 19.3% 19.2% 22.2%
Balance sheet (N$000) FY11 FY12 FY13 FY14 FY15 FY16
Total assets 17 163 930 19 697 552 22 499 441 26 255 827 29 784 315 34 185 503
Total deposits 13 349 517 16 286 901 19 154 760 22 335 341 24 971 829 28 594 771
Gross loans 12 675 970 14 234 294 17 112 228 20 137 640 23 006 071 25 969 201
Specific impairment 64 643 55 556 51 374 43 208 49 767 67 208
Portfolio impairment 146 985 101 985 96 175 103 650 122 613 125 906
Net advances 12 464 342 14 076 753 16 964 679 19 990 782 22 833 693 25 776 087
Book value 1 820 122 2 362 036 2 262 045 2 745 911 3 348 673 3 989 699
Equity multiplier (x) 8.8 8.8 9.1 9.7 9.2 8.7
Capital Adequacy FY11 FY12 FY13 FY14 FY15 FY16
Tier 1 Capital 1 413 000 1 855 000 2 023 000 2 484 000 3 092 000 3 659 000
Total Capital 1 864 000 2 389 000 2 584 000 3 075 000 3 714 000 4 309 000
RWA year-end 11 230 000 13 521 000 15 909 000 18 036 000 21 350 000 24 259 000
Tier 1 ratio % 12.6% 13.7% 12.7% 13.8% 14.5% 15.1%
Total capital ratio 16.6% 17.7% 16.2% 17.0% 17.4% 17.8%
Equity multiplier (x) 8.8 8.8 9.1 9.7 9.2 8.7
Asset quality FY11 FY12 FY13 FY14 FY15 FY16
Bad debt ratio (%) -0.1% -0.3% 0.1% 0.1% 0.2% 0.2%
NPL 166 000 141 943 158 427 141 051 147 230 251 366
NPL/Gross Advances 1.4% 1.1% 1.0% 0.8% 0.7% 1.0%
Gross coverage 127.5% 111.0% 93.1% 104.1% 117.1% 76.8%
Liquidity FY11 FY12 FY13 FY14 FY15 FY16
Gross Loan/deposit ratio 95.0% 87.4% 89.3% 90.2% 92.1% 90.8%
Liquid assets to deposit 21.2% 31.1% 25.3% 24.5% 23.0% 24.9%
Value (x) FY11 FY12 FY13 FY14 FY15 FY16
Market cap/revenues 2.70 3.10 3.34 3.02 4.04 4.07
Market cap/deposits 29.3% 31.1% 32.9% 31.2% 45.8% 46.2%
P/E 8.22 9.24 10.06 8.40 10.75 10.24
P/B 2.07 2.07 2.66 2.38 3.18 3.13
DY (%) 16.6% 13.9% 4.3% 4.9% 4.5% 4.4%
Source: PSG, Annual Reports

P a g e | 73
PSG Wealth Management (Namibia) (Pty) Ltd
Table 54: NedNamibia for the year ended 31 December
Income statement (N000) FY10 FY11 FY12 FY13 FY14 FY15
Net Interest Income (NII) 354 489 342 745 380 922 411 483 475 085 588 781
Impairment advances (19 568) (9 278) (12 150) (12 323) (4 392) (53 053)
Non-interest Income 202 173 211 219 241 646 287 251 317 463 344 233
Fee & Commission Income 149 446 159 078 143 544 225 724 260 743 253 825
Trading Income 5 241 5 264 5 381 7 481 6 195 764
Other non-interest 12 261 4 481 3 558 3 680 6 530 13 922
Operating cost (331 289) (331 185) (377 244) (410 769) (446 620) (525 404)
Pre-tax profits 194 733 193 519 218 108 259 625 325 210 343 820
Net Income attributable 141 439 135 865 159 517 200 253 246 190 272 877
Per share data FY10 FY11 FY12 FY13 FY14 FY15
EPS 201 193 227 285 350 388
DPS ND ND ND ND ND ND
BVPS cents 1 185 1 389 1 633 1 923 2 345 2 733
DY (%) ND ND ND ND ND ND
Payout Ratio ND ND ND ND ND ND
Profitability FY10 FY11 FY12 FY13 FY14 FY15
NIM (Avg. IEA) 5.6% 5.0% 5.0% 4.7% 4.6% 4.8%
ROA (%) 2.1% 1.9% 2.0% 2.1% 2.3% 2.1%
ROE (%) 18.7% 15.0% 15.1% 16.1% 16.5% 15.4%
Productivity FY10 FY11 FY12 FY13 FY14 FY15
Cost-to-income ratio 61.6% 60.8% 61.7% 59.9% 56.6% 59.6%
Cost/average assets 4.9% 4.5% 4.6% 4.4% 4.1% 4.1%
Compensation expense ratio 26.7% 27.8% 26.2% 26.0% 27.0% 27.4%
Balance sheet (N$000) FY10 FY11 FY12 FY13 FY14 FY15
Total assets 7 159 494 7 515 911 8 786 263 9 999 919 11 871 305 13 828 598
Total deposits 6 020 944 6 185 252 7 292 729 8 335 554 9 818 234 11 531 141
Gross loans 5 267 951 5 535 214 6 124 565 7 008 385 8 374 544 9 907 360
Specific impairment 51 203 37 406 34 900 41 826 35 876 60 331
Portfolio impairment 19 340 21 485 33 211 31 450 28 825 44 629
Net advances 5 197 409 5 476 323 6 056 454 6 935 109 8 309 843 9 802 400
Book value 833 942 972 197 1 143 957 1 348 331 1 637 668 1 910 200
Capital Adequacy FY10 FY11 FY12 FY13 FY14 FY15
Tier 1 Capital 769 702 916 859 1 070 428 1 227 533 1 403 156
Total Capital 848 118 999 388 1 162 507 1 360 160 1 525 441
RWA year-end 5 592 443 5 425 128 6 934 049 8 363 680 9 677 562
Tier 1 ratio % 13.8% 16.9% 15.4% 14.7% 14.5%
Total capital ratio 13.3% 15.2% 18.4% 14.3% 14.3% 14.3%
Equity multiplier (x) 9.0 8.1 7.7 7.5 7.3 7.2
Asset Quality FY10 FY11 FY12 FY13 FY14 FY15
Bad debt ratio (%) 0.31% 0.14% 0.16% 0.14% 0.04% 0.44%
NPL 93 403 71 390 74 691 82 928 81 490 95 343
NPL/Gross Advances 1.8% 1.3% 1.3% 1.3% 1.1% 1.0%
Gross coverage 75.5% 82.5% 91.2% 88.4% 79.4% 110.1%
Liquidity FY10 FY11 FY12 FY13 FY14 FY15
Gross Loan/deposit ratio 87.5% 89.5% 84.0% 84.1% 85.3% 85.9%
Liquid assets to deposit 26.4% 27.1% 32.7% 32.1% 32.2% 31.5%
Source: PSG, Annual Reports
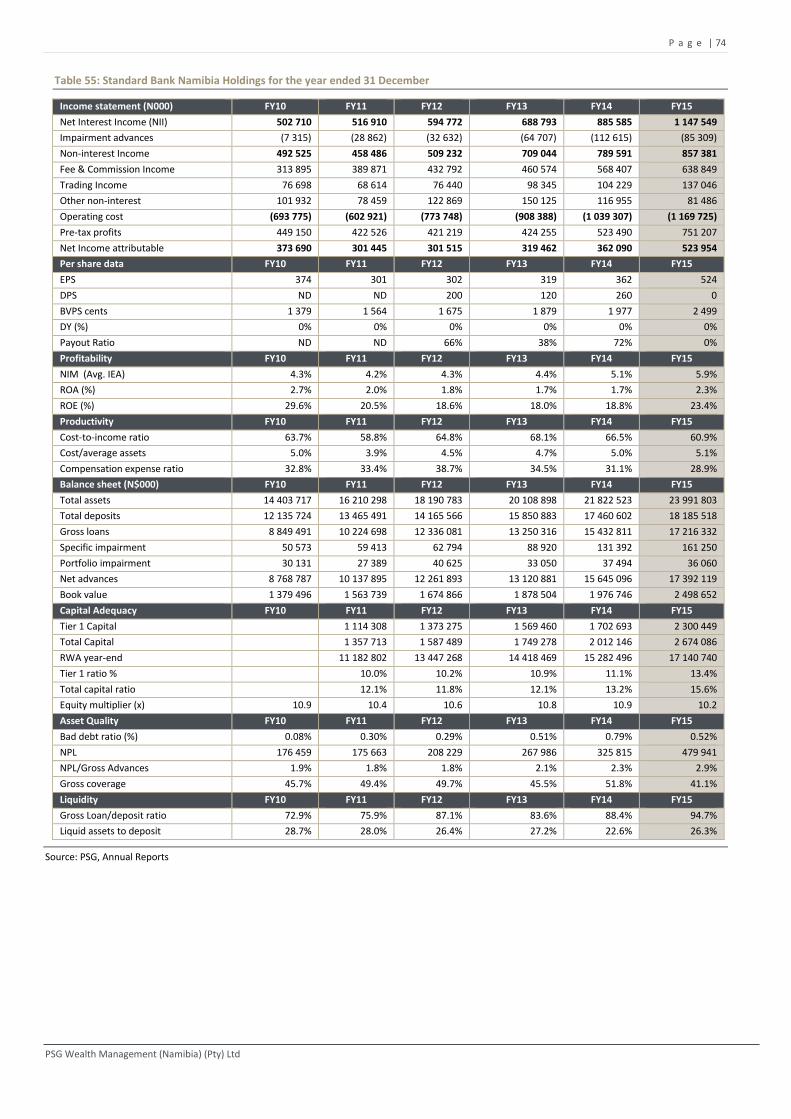
P a g e | 74
PSG Wealth Management (Namibia) (Pty) Ltd
Table 55: Standard Bank Namibia Holdings for the year ended 31 December
Income statement (N000) FY10 FY11 FY12 FY13 FY14 FY15
Net Interest Income (NII) 502 710 516 910 594 772 688 793 885 585 1 147 549
Impairment advances (7 315) (28 862) (32 632) (64 707) (112 615) (85 309)
Non-interest Income 492 525 458 486 509 232 709 044 789 591 857 381
Fee & Commission Income 313 895 389 871 432 792 460 574 568 407 638 849
Trading Income 76 698 68 614 76 440 98 345 104 229 137 046
Other non-interest 101 932 78 459 122 869 150 125 116 955 81 486
Operating cost (693 775) (602 921) (773 748) (908 388) (1 039 307) (1 169 725)
Pre-tax profits 449 150 422 526 421 219 424 255 523 490 751 207
Net Income attributable 373 690 301 445 301 515 319 462 362 090 523 954
Per share data FY10 FY11 FY12 FY13 FY14 FY15
EPS 374 301 302 319 362 524
DPS ND ND 200 120 260 0
BVPS cents 1 379 1 564 1 675 1 879 1 977 2 499
DY (%) 0% 0% 0% 0% 0% 0%
Payout Ratio ND ND 66% 38% 72% 0%
Profitability FY10 FY11 FY12 FY13 FY14 FY15
NIM (Avg. IEA) 4.3% 4.2% 4.3% 4.4% 5.1% 5.9%
ROA (%) 2.7% 2.0% 1.8% 1.7% 1.7% 2.3%
ROE (%) 29.6% 20.5% 18.6% 18.0% 18.8% 23.4%
Productivity FY10 FY11 FY12 FY13 FY14 FY15
Cost-to-income ratio 63.7% 58.8% 64.8% 68.1% 66.5% 60.9%
Cost/average assets 5.0% 3.9% 4.5% 4.7% 5.0% 5.1%
Compensation expense ratio 32.8% 33.4% 38.7% 34.5% 31.1% 28.9%
Balance sheet (N$000) FY10 FY11 FY12 FY13 FY14 FY15
Total assets 14 403 717 16 210 298 18 190 783 20 108 898 21 822 523 23 991 803
Total deposits 12 135 724 13 465 491 14 165 566 15 850 883 17 460 602 18 185 518
Gross loans 8 849 491 10 224 698 12 336 081 13 250 316 15 432 811 17 216 332
Specific impairment 50 573 59 413 62 794 88 920 131 392 161 250
Portfolio impairment 30 131 27 389 40 625 33 050 37 494 36 060
Net advances 8 768 787 10 137 895 12 261 893 13 120 881 15 645 096 17 392 119
Book value 1 379 496 1 563 739 1 674 866 1 878 504 1 976 746 2 498 652
Capital Adequacy FY10 FY11 FY12 FY13 FY14 FY15
Tier 1 Capital 1 114 308 1 373 275 1 569 460 1 702 693 2 300 449
Total Capital 1 357 713 1 587 489 1 749 278 2 012 146 2 674 086
RWA year-end 11 182 802 13 447 268 14 418 469 15 282 496 17 140 740
Tier 1 ratio % 10.0% 10.2% 10.9% 11.1% 13.4%
Total capital ratio 12.1% 11.8% 12.1% 13.2% 15.6%
Equity multiplier (x) 10.9 10.4 10.6 10.8 10.9 10.2
Asset Quality FY10 FY11 FY12 FY13 FY14 FY15
Bad debt ratio (%) 0.08% 0.30% 0.29% 0.51% 0.79% 0.52%
NPL 176 459 175 663 208 229 267 986 325 815 479 941
NPL/Gross Advances 1.9% 1.8% 1.8% 2.1% 2.3% 2.9%
Gross coverage 45.7% 49.4% 49.7% 45.5% 51.8% 41.1%
Liquidity FY10 FY11 FY12 FY13 FY14 FY15
Gross Loan/deposit ratio 72.9% 75.9% 87.1% 83.6% 88.4% 94.7%
Liquid assets to deposit 28.7% 28.0% 26.4% 27.2% 22.6% 26.3%
Source: PSG, Annual Reports
P a g e | 75
PSG Wealth Management (Namibia) (Pty) Ltd
Copyright PSG
Disclaimer
This publication has been issued by PSG Wealth Management (Namibia) (Pty) Ltd (“PSG”), a member of the PSG Group Limited. It is confidential and issued for
the information of clients only. It shall not be reproduced in whole or in part without our permission. The information contained herein has been obtained
from sources which and persons whom we believe to be reliable but is not guaranteed for accuracy, completeness or otherwise. Opinions and estimates
constitute our judgement as of the date of this material and are subject to change without notice.
Past performance is not indicative of future results. This report is provided for informational purposes only. No information contained herein, no opinion
expressed and no recommendation made constitutes a representation by us or a solicitation for the purchase of any of the securities mentioned herein and
we have no responsibility whatsoever arising here from or in consequence hereof. Securities, financial instruments or strategies mention herein may not be
suitable for all investors and investors must make their own investment decisions using their own independent advisers as they believe necessary and based
upon their specific financial situations and investment objectives. The employees of PSG may from time to time own securities mentioned herein.
Analyst Certification
The research analyst who prepared this report certifies that the view expressed herein accurately reflect the research analyst’s personal views about the
subject security and issuer and that no part of his compensation was, is or will be directly or indirectly related to specific recommendations or views contained
in this report.
Member of the Namibian Stock Exchange
Registration number: (98/528)
Directors: Hanli Jacobs, Dan Hugo*, Isaac Kaulinge, Milka Mungunda, Willem Theron*, Brian van Rensburg
* South African
5 Conradie Street, Windhoek, NAMIBIA
PO Box 196, Windhoek, NAMIBIA
Telephone +264 61 378 900 Fax +264 61 378901, E-Mail [email protected]

P a g e | 76
PSG Wealth Management (Namibia) (Pty) Ltd