pssa results writing district totals 2010 and statistics/pssa...the 2010 pssa writing district level...
TRANSCRIPT

The 2010 PSSA Writing District Level Proficiency Results - District Totals*
CountyIU
Number District Group
Number Scored Writing
% Advanced
Writing
% Proficient
Writing% Basic Writing
% Below Basic
WritingAdams 12 BERMUDIAN SPRINGS SD All students 451 7.5 67.2 23.5 1.8Adams 12 BERMUDIAN SPRINGS SD Male 243 5.8 58.0 32.9 3.3Adams 12 BERMUDIAN SPRINGS SD Female 208 9.6 77.9 12.5 0.0Adams 12 BERMUDIAN SPRINGS SD White 406 7.4 68.0 23.2 1.5Adams 12 BERMUDIAN SPRINGS SD Black 2Adams 12 BERMUDIAN SPRINGS SD Hispanic 33 3.0 60.6 30.3 6.1Adams 12 BERMUDIAN SPRINGS SD Asian 6Adams 12 BERMUDIAN SPRINGS SD Native American 1Adams 12 BERMUDIAN SPRINGS SD Multi-ethnic 3Adams 12 BERMUDIAN SPRINGS SD IEP 57 8.8 35.1 45.6 10.5Adams 12 BERMUDIAN SPRINGS SD ELL 5Adams 12 BERMUDIAN SPRINGS SD Economically Disadvantaged 120 4.2 56.7 35.0 4.2Adams 12 CONEWAGO VALLEY SD All students 851 5.8 63.7 29.6 0.9Adams 12 CONEWAGO VALLEY SD Male 416 3.1 55.8 39.7 1.4Adams 12 CONEWAGO VALLEY SD Female 435 8.3 71.3 20.0 0.5Adams 12 CONEWAGO VALLEY SD White 730 6.0 64.7 28.5 0.8Adams 12 CONEWAGO VALLEY SD Black 17 5.9 41.2 47.1 5.9Adams 12 CONEWAGO VALLEY SD Hispanic 97 4.1 59.8 35.1 1.0Adams 12 CONEWAGO VALLEY SD Asian 5Adams 12 CONEWAGO VALLEY SD Native American 1Adams 12 CONEWAGO VALLEY SD Multi-ethnic 0Adams 12 CONEWAGO VALLEY SD IEP 80 0.0 26.3 67.5 6.3Adams 12 CONEWAGO VALLEY SD ELL 22 0.0 36.4 59.1 4.5Adams 12 CONEWAGO VALLEY SD Economically Disadvantaged 260 3.8 56.5 38.1 1.5Adams 12 FAIRFIELD AREA SD All students 271 3.0 64.6 30.3 2.2Adams 12 FAIRFIELD AREA SD Male 139 0.0 56.8 40.3 2.9Adams 12 FAIRFIELD AREA SD Female 131 6.1 72.5 19.8 1.5Adams 12 FAIRFIELD AREA SD White 262 3.1 64.1 30.5 2.3Adams 12 FAIRFIELD AREA SD Black 1Adams 12 FAIRFIELD AREA SD Hispanic 4
*Full Academic Year Students. Data for groups with less than 10 students assessed were replaced by blanks.Percentages were rounded to the nearest one-tenth.Proficiency percentages may not add up to 100 due to rounding. 1
The 2010 PSSA Writing District Level Proficiency Results - District Totals*
CountyIU
Number District Group
Number Scored Writing
% Advanced
Writing
% Proficient
Writing% Basic Writing
% Below Basic
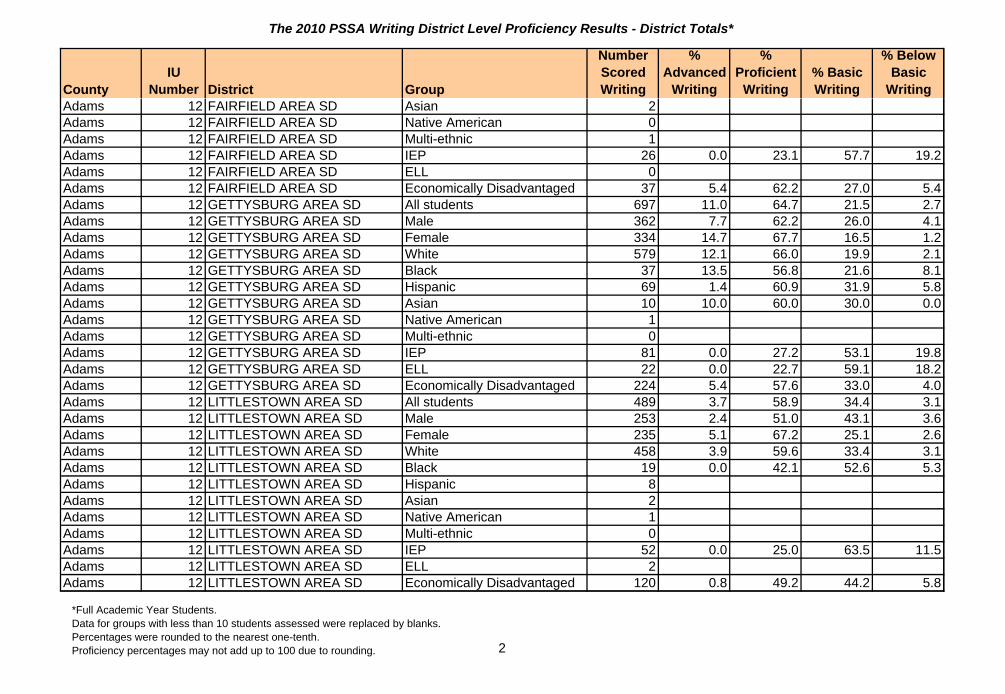
WritingAdams 12 FAIRFIELD AREA SD Asian 2Adams 12 FAIRFIELD AREA SD Native American 0Adams 12 FAIRFIELD AREA SD Multi-ethnic 1Adams 12 FAIRFIELD AREA SD IEP 26 0.0 23.1 57.7 19.2Adams 12 FAIRFIELD AREA SD ELL 0Adams 12 FAIRFIELD AREA SD Economically Disadvantaged 37 5.4 62.2 27.0 5.4Adams 12 GETTYSBURG AREA SD All students 697 11.0 64.7 21.5 2.7Adams 12 GETTYSBURG AREA SD Male 362 7.7 62.2 26.0 4.1Adams 12 GETTYSBURG AREA SD Female 334 14.7 67.7 16.5 1.2Adams 12 GETTYSBURG AREA SD White 579 12.1 66.0 19.9 2.1Adams 12 GETTYSBURG AREA SD Black 37 13.5 56.8 21.6 8.1Adams 12 GETTYSBURG AREA SD Hispanic 69 1.4 60.9 31.9 5.8Adams 12 GETTYSBURG AREA SD Asian 10 10.0 60.0 30.0 0.0Adams 12 GETTYSBURG AREA SD Native American 1Adams 12 GETTYSBURG AREA SD Multi-ethnic 0Adams 12 GETTYSBURG AREA SD IEP 81 0.0 27.2 53.1 19.8Adams 12 GETTYSBURG AREA SD ELL 22 0.0 22.7 59.1 18.2Adams 12 GETTYSBURG AREA SD Economically Disadvantaged 224 5.4 57.6 33.0 4.0Adams 12 LITTLESTOWN AREA SD All students 489 3.7 58.9 34.4 3.1Adams 12 LITTLESTOWN AREA SD Male 253 2.4 51.0 43.1 3.6Adams 12 LITTLESTOWN AREA SD Female 235 5.1 67.2 25.1 2.6Adams 12 LITTLESTOWN AREA SD White 458 3.9 59.6 33.4 3.1Adams 12 LITTLESTOWN AREA SD Black 19 0.0 42.1 52.6 5.3Adams 12 LITTLESTOWN AREA SD Hispanic 8Adams 12 LITTLESTOWN AREA SD Asian 2Adams 12 LITTLESTOWN AREA SD Native American 1Adams 12 LITTLESTOWN AREA SD Multi-ethnic 0Adams 12 LITTLESTOWN AREA SD IEP 52 0.0 25.0 63.5 11.5Adams 12 LITTLESTOWN AREA SD ELL 2Adams 12 LITTLESTOWN AREA SD Economically Disadvantaged 120 0.8 49.2 44.2 5.8
*Full Academic Year Students. Data for groups with less than 10 students assessed were replaced by blanks.Percentages were rounded to the nearest one-tenth.Proficiency percentages may not add up to 100 due to rounding. 2

The 2010 PSSA Writing District Level Proficiency Results - District Totals*
CountyIU
Number District Group
Number Scored Writing
% Advanced
Writing
% Proficient
Writing% Basic Writing
% Below Basic
WritingAdams 12 UPPER ADAMS SD All students 368 2.7 66.6 28.5 2.2Adams 12 UPPER ADAMS SD Male 186 1.6 58.1 36.6 3.8Adams 12 UPPER ADAMS SD Female 182 3.8 75.3 20.3 0.5Adams 12 UPPER ADAMS SD White 292 3.1 67.5 27.1 2.4Adams 12 UPPER ADAMS SD Black 10 0.0 60.0 40.0 0.0Adams 12 UPPER ADAMS SD Hispanic 63 0.0 65.1 33.3 1.6Adams 12 UPPER ADAMS SD Asian 3Adams 12 UPPER ADAMS SD Native American 0Adams 12 UPPER ADAMS SD Multi-ethnic 0Adams 12 UPPER ADAMS SD IEP 50 0.0 32.0 58.0 10.0Adams 12 UPPER ADAMS SD ELL 10 0.0 50.0 40.0 10.0Adams 12 UPPER ADAMS SD Economically Disadvantaged 146 1.4 59.6 36.3 2.7Allegheny 3 ALLEGHENY VALLEY SD All students 253 10.3 66.0 21.7 2.0Allegheny 3 ALLEGHENY VALLEY SD Male 133 3.8 64.7 28.6 3.0Allegheny 3 ALLEGHENY VALLEY SD Female 120 17.5 67.5 14.2 0.8Allegheny 3 ALLEGHENY VALLEY SD White 244 10.7 66.8 20.5 2.0Allegheny 3 ALLEGHENY VALLEY SD Black 5Allegheny 3 ALLEGHENY VALLEY SD Hispanic 1Allegheny 3 ALLEGHENY VALLEY SD Asian 3Allegheny 3 ALLEGHENY VALLEY SD Native American 0Allegheny 3 ALLEGHENY VALLEY SD Multi-ethnic 0Allegheny 3 ALLEGHENY VALLEY SD IEP 34 2.9 29.4 55.9 11.8Allegheny 3 ALLEGHENY VALLEY SD ELL 0Allegheny 3 ALLEGHENY VALLEY SD Economically Disadvantaged 89 4.5 58.4 33.7 3.4Allegheny 3 AVONWORTH SD All students 326 11.0 70.9 17.2 0.9Allegheny 3 AVONWORTH SD Male 159 5.7 66.7 26.4 1.3Allegheny 3 AVONWORTH SD Female 167 16.2 74.9 8.4 0.6Allegheny 3 AVONWORTH SD White 305 11.8 70.5 16.7 1.0Allegheny 3 AVONWORTH SD Black 10 0.0 80.0 20.0 0.0Allegheny 3 AVONWORTH SD Hispanic 5
*Full Academic Year Students. Data for groups with less than 10 students assessed were replaced by blanks.Percentages were rounded to the nearest one-tenth.Proficiency percentages may not add up to 100 due to rounding. 3

The 2010 PSSA Writing District Level Proficiency Results - District Totals*
CountyIU
Number District Group
Number Scored Writing
% Advanced
Writing
% Proficient
Writing% Basic Writing
% Below Basic
WritingAllegheny 3 AVONWORTH SD Asian 5Allegheny 3 AVONWORTH SD Native American 1Allegheny 3 AVONWORTH SD Multi-ethnic 0Allegheny 3 AVONWORTH SD IEP 37 0.0 37.8 54.1 8.1Allegheny 3 AVONWORTH SD ELL 4Allegheny 3 AVONWORTH SD Economically Disadvantaged 34 0.0 70.6 26.5 2.9Allegheny 3 BALDWIN-WHITEHALL SD All students 938 12.4 68.4 17.4 1.8Allegheny 3 BALDWIN-WHITEHALL SD Male 501 10.0 65.1 22.6 2.4Allegheny 3 BALDWIN-WHITEHALL SD Female 435 15.2 72.4 11.5 0.9Allegheny 3 BALDWIN-WHITEHALL SD White 823 13.4 70.5 15.4 0.7Allegheny 3 BALDWIN-WHITEHALL SD Black 76 5.3 53.9 36.8 3.9Allegheny 3 BALDWIN-WHITEHALL SD Hispanic 6Allegheny 3 BALDWIN-WHITEHALL SD Asian 18 0.0 44.4 22.2 33.3Allegheny 3 BALDWIN-WHITEHALL SD Native American 0Allegheny 3 BALDWIN-WHITEHALL SD Multi-ethnic 13 15.4 53.8 30.8 0.0Allegheny 3 BALDWIN-WHITEHALL SD IEP 69 0.0 46.4 44.9 8.7Allegheny 3 BALDWIN-WHITEHALL SD ELL 34 0.0 20.6 61.8 17.6Allegheny 3 BALDWIN-WHITEHALL SD Economically Disadvantaged 253 5.1 60.5 28.9 5.5Allegheny 3 BETHEL PARK SD All students 1,140 25.5 65.0 8.9 0.5Allegheny 3 BETHEL PARK SD Male 577 20.8 65.9 12.5 0.9Allegheny 3 BETHEL PARK SD Female 559 30.6 64.4 4.8 0.2Allegheny 3 BETHEL PARK SD White 1,096 25.9 65.5 8.0 0.5Allegheny 3 BETHEL PARK SD Black 17 0.0 76.5 23.5 0.0Allegheny 3 BETHEL PARK SD Hispanic 7Allegheny 3 BETHEL PARK SD Asian 12 50.0 25.0 25.0 0.0Allegheny 3 BETHEL PARK SD Native American 0Allegheny 3 BETHEL PARK SD Multi-ethnic 4Allegheny 3 BETHEL PARK SD IEP 134 5.2 59.7 32.1 3.0Allegheny 3 BETHEL PARK SD ELL 2Allegheny 3 BETHEL PARK SD Economically Disadvantaged 103 9.7 68.9 19.4 1.9
*Full Academic Year Students. Data for groups with less than 10 students assessed were replaced by blanks.Percentages were rounded to the nearest one-tenth.Proficiency percentages may not add up to 100 due to rounding. 4

The 2010 PSSA Writing District Level Proficiency Results - District Totals*
CountyIU
Number District Group
Number Scored Writing
% Advanced
Writing
% Proficient
Writing% Basic Writing
% Below Basic
WritingAllegheny 3 BRENTWOOD BOROUGH SD All students 244 27.0 61.1 9.4 2.5Allegheny 3 BRENTWOOD BOROUGH SD Male 121 23.1 57.0 17.4 2.5Allegheny 3 BRENTWOOD BOROUGH SD Female 123 30.9 65.0 1.6 2.4Allegheny 3 BRENTWOOD BOROUGH SD White 220 27.7 61.4 9.5 1.4Allegheny 3 BRENTWOOD BOROUGH SD Black 15 13.3 66.7 13.3 6.7Allegheny 3 BRENTWOOD BOROUGH SD Hispanic 1Allegheny 3 BRENTWOOD BOROUGH SD Asian 2Allegheny 3 BRENTWOOD BOROUGH SD Native American 0Allegheny 3 BRENTWOOD BOROUGH SD Multi-ethnic 6Allegheny 3 BRENTWOOD BOROUGH SD IEP 25 0.0 32.0 56.0 12.0Allegheny 3 BRENTWOOD BOROUGH SD ELL 3Allegheny 3 BRENTWOOD BOROUGH SD Economically Disadvantaged 102 23.5 56.9 15.7 3.9Allegheny 3 CARLYNTON SD All students 319 12.9 68.3 17.2 1.6Allegheny 3 CARLYNTON SD Male 158 10.1 62.0 25.3 2.5Allegheny 3 CARLYNTON SD Female 161 15.5 74.5 9.3 0.6Allegheny 3 CARLYNTON SD White 267 13.9 67.4 16.9 1.9Allegheny 3 CARLYNTON SD Black 44 4.5 77.3 18.2 0.0Allegheny 3 CARLYNTON SD Hispanic 5Allegheny 3 CARLYNTON SD Asian 2Allegheny 3 CARLYNTON SD Native American 1Allegheny 3 CARLYNTON SD Multi-ethnic 0Allegheny 3 CARLYNTON SD IEP 41 2.4 29.3 56.1 12.2Allegheny 3 CARLYNTON SD ELL 1Allegheny 3 CARLYNTON SD Economically Disadvantaged 131 10.7 67.2 19.8 2.3Allegheny 3 CHARTIERS VALLEY SD All students 781 13.8 64.0 20.7 1.4Allegheny 3 CHARTIERS VALLEY SD Male 421 9.7 61.5 27.3 1.4Allegheny 3 CHARTIERS VALLEY SD Female 360 18.6 66.9 13.1 1.4Allegheny 3 CHARTIERS VALLEY SD White 710 13.2 64.8 20.6 1.4Allegheny 3 CHARTIERS VALLEY SD Black 41 9.8 61.0 26.8 2.4Allegheny 3 CHARTIERS VALLEY SD Hispanic 3
*Full Academic Year Students. Data for groups with less than 10 students assessed were replaced by blanks.Percentages were rounded to the nearest one-tenth.Proficiency percentages may not add up to 100 due to rounding. 5

The 2010 PSSA Writing District Level Proficiency Results - District Totals*
CountyIU
Number District Group
Number Scored Writing
% Advanced
Writing
% Proficient
Writing% Basic Writing
% Below Basic
WritingAllegheny 3 CHARTIERS VALLEY SD Asian 27 37.0 44.4 18.5 0.0Allegheny 3 CHARTIERS VALLEY SD Native American 0Allegheny 3 CHARTIERS VALLEY SD Multi-ethnic 0Allegheny 3 CHARTIERS VALLEY SD IEP 80 1.3 35.0 51.3 12.5Allegheny 3 CHARTIERS VALLEY SD ELL 7Allegheny 3 CHARTIERS VALLEY SD Economically Disadvantaged 178 9.6 55.6 32.0 2.8Allegheny 3 CLAIRTON CITY SD All students 164 0.6 44.5 47.6 7.3Allegheny 3 CLAIRTON CITY SD Male 76 0.0 34.2 57.9 7.9Allegheny 3 CLAIRTON CITY SD Female 88 1.1 53.4 38.6 6.8Allegheny 3 CLAIRTON CITY SD White 42 0.0 59.5 35.7 4.8Allegheny 3 CLAIRTON CITY SD Black 120 0.8 38.3 52.5 8.3Allegheny 3 CLAIRTON CITY SD Hispanic 0Allegheny 3 CLAIRTON CITY SD Asian 0Allegheny 3 CLAIRTON CITY SD Native American 0Allegheny 3 CLAIRTON CITY SD Multi-ethnic 2Allegheny 3 CLAIRTON CITY SD IEP 27 0.0 18.5 51.9 29.6Allegheny 3 CLAIRTON CITY SD ELL 0Allegheny 3 CLAIRTON CITY SD Economically Disadvantaged 131 0.8 44.3 48.9 6.1Allegheny 3 CORNELL SD All students 159 3.8 68.6 25.8 1.9Allegheny 3 CORNELL SD Male 85 2.4 57.6 37.6 2.4Allegheny 3 CORNELL SD Female 73 5.5 80.8 12.3 1.4Allegheny 3 CORNELL SD White 116 4.3 67.2 25.9 2.6Allegheny 3 CORNELL SD Black 21 0.0 66.7 33.3 0.0Allegheny 3 CORNELL SD Hispanic 1Allegheny 3 CORNELL SD Asian 0Allegheny 3 CORNELL SD Native American 0Allegheny 3 CORNELL SD Multi-ethnic 20 5.0 75.0 20.0 0.0Allegheny 3 CORNELL SD IEP 26 0.0 30.8 61.5 7.7Allegheny 3 CORNELL SD ELL 0Allegheny 3 CORNELL SD Economically Disadvantaged 100 2.0 63.0 33.0 2.0
*Full Academic Year Students. Data for groups with less than 10 students assessed were replaced by blanks.Percentages were rounded to the nearest one-tenth.Proficiency percentages may not add up to 100 due to rounding. 6

The 2010 PSSA Writing District Level Proficiency Results - District Totals*
CountyIU
Number District Group
Number Scored Writing
% Advanced
Writing
% Proficient
Writing% Basic Writing
% Below Basic
WritingAllegheny 3 DEER LAKES SD All students 455 14.3 70.5 14.5 0.7Allegheny 3 DEER LAKES SD Male 242 12.8 68.2 17.8 1.2Allegheny 3 DEER LAKES SD Female 210 16.2 72.9 11.0 0.0Allegheny 3 DEER LAKES SD White 438 14.2 70.8 14.4 0.7Allegheny 3 DEER LAKES SD Black 5Allegheny 3 DEER LAKES SD Hispanic 1Allegheny 3 DEER LAKES SD Asian 3Allegheny 3 DEER LAKES SD Native American 1Allegheny 3 DEER LAKES SD Multi-ethnic 4Allegheny 3 DEER LAKES SD IEP 78 0.0 52.6 43.6 3.8Allegheny 3 DEER LAKES SD ELL 1Allegheny 3 DEER LAKES SD Economically Disadvantaged 118 6.8 61.9 30.5 0.8Allegheny 3 DUQUESNE CITY SD All students 115 0.9 38.3 48.7 12.2Allegheny 3 DUQUESNE CITY SD Male 51 0.0 25.5 62.7 11.8Allegheny 3 DUQUESNE CITY SD Female 62 1.6 48.4 38.7 11.3Allegheny 3 DUQUESNE CITY SD White 3Allegheny 3 DUQUESNE CITY SD Black 107 0.9 38.3 49.5 11.2Allegheny 3 DUQUESNE CITY SD Hispanic 1Allegheny 3 DUQUESNE CITY SD Asian 0Allegheny 3 DUQUESNE CITY SD Native American 0Allegheny 3 DUQUESNE CITY SD Multi-ethnic 2Allegheny 3 DUQUESNE CITY SD IEP 25 0.0 16.0 64.0 20.0Allegheny 3 DUQUESNE CITY SD ELL 0Allegheny 3 DUQUESNE CITY SD Economically Disadvantaged 100 1.0 36.0 51.0 12.0Allegheny 3 EAST ALLEGHENY SD All students 401 4.2 57.9 34.9 3.0Allegheny 3 EAST ALLEGHENY SD Male 197 2.0 51.8 41.1 5.1Allegheny 3 EAST ALLEGHENY SD Female 202 6.4 63.4 29.2 1.0Allegheny 3 EAST ALLEGHENY SD White 287 4.9 61.7 30.7 2.8Allegheny 3 EAST ALLEGHENY SD Black 87 1.1 47.1 48.3 3.4Allegheny 3 EAST ALLEGHENY SD Hispanic 7
*Full Academic Year Students. Data for groups with less than 10 students assessed were replaced by blanks.Percentages were rounded to the nearest one-tenth.Proficiency percentages may not add up to 100 due to rounding. 7
The 2010 PSSA Writing District Level Proficiency Results - District Totals*
CountyIU
Number District Group
Number Scored Writing
% Advanced
Writing
% Proficient
Writing% Basic Writing
% Below Basic
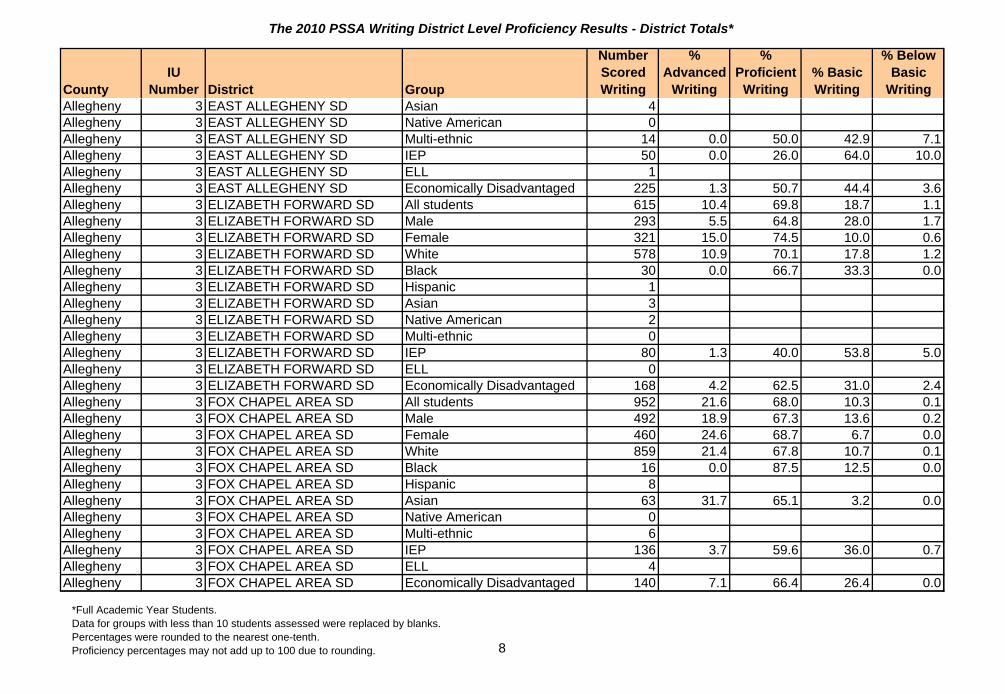
WritingAllegheny 3 EAST ALLEGHENY SD Asian 4Allegheny 3 EAST ALLEGHENY SD Native American 0Allegheny 3 EAST ALLEGHENY SD Multi-ethnic 14 0.0 50.0 42.9 7.1Allegheny 3 EAST ALLEGHENY SD IEP 50 0.0 26.0 64.0 10.0Allegheny 3 EAST ALLEGHENY SD ELL 1Allegheny 3 EAST ALLEGHENY SD Economically Disadvantaged 225 1.3 50.7 44.4 3.6Allegheny 3 ELIZABETH FORWARD SD All students 615 10.4 69.8 18.7 1.1Allegheny 3 ELIZABETH FORWARD SD Male 293 5.5 64.8 28.0 1.7Allegheny 3 ELIZABETH FORWARD SD Female 321 15.0 74.5 10.0 0.6Allegheny 3 ELIZABETH FORWARD SD White 578 10.9 70.1 17.8 1.2Allegheny 3 ELIZABETH FORWARD SD Black 30 0.0 66.7 33.3 0.0Allegheny 3 ELIZABETH FORWARD SD Hispanic 1Allegheny 3 ELIZABETH FORWARD SD Asian 3Allegheny 3 ELIZABETH FORWARD SD Native American 2Allegheny 3 ELIZABETH FORWARD SD Multi-ethnic 0Allegheny 3 ELIZABETH FORWARD SD IEP 80 1.3 40.0 53.8 5.0Allegheny 3 ELIZABETH FORWARD SD ELL 0Allegheny 3 ELIZABETH FORWARD SD Economically Disadvantaged 168 4.2 62.5 31.0 2.4Allegheny 3 FOX CHAPEL AREA SD All students 952 21.6 68.0 10.3 0.1Allegheny 3 FOX CHAPEL AREA SD Male 492 18.9 67.3 13.6 0.2Allegheny 3 FOX CHAPEL AREA SD Female 460 24.6 68.7 6.7 0.0Allegheny 3 FOX CHAPEL AREA SD White 859 21.4 67.8 10.7 0.1Allegheny 3 FOX CHAPEL AREA SD Black 16 0.0 87.5 12.5 0.0Allegheny 3 FOX CHAPEL AREA SD Hispanic 8Allegheny 3 FOX CHAPEL AREA SD Asian 63 31.7 65.1 3.2 0.0Allegheny 3 FOX CHAPEL AREA SD Native American 0Allegheny 3 FOX CHAPEL AREA SD Multi-ethnic 6Allegheny 3 FOX CHAPEL AREA SD IEP 136 3.7 59.6 36.0 0.7Allegheny 3 FOX CHAPEL AREA SD ELL 4Allegheny 3 FOX CHAPEL AREA SD Economically Disadvantaged 140 7.1 66.4 26.4 0.0
*Full Academic Year Students. Data for groups with less than 10 students assessed were replaced by blanks.Percentages were rounded to the nearest one-tenth.Proficiency percentages may not add up to 100 due to rounding. 8

The 2010 PSSA Writing District Level Proficiency Results - District Totals*
CountyIU
Number District Group
Number Scored Writing
% Advanced
Writing
% Proficient
Writing% Basic Writing
% Below Basic
WritingAllegheny 3 GATEWAY SD All students 933 17.1 61.4 19.1 2.4Allegheny 3 GATEWAY SD Male 454 10.4 63.7 21.6 4.4Allegheny 3 GATEWAY SD Female 479 23.6 59.3 16.7 0.4Allegheny 3 GATEWAY SD White 659 19.9 62.5 16.2 1.4Allegheny 3 GATEWAY SD Black 172 5.8 59.3 30.2 4.7Allegheny 3 GATEWAY SD Hispanic 11 9.1 45.5 36.4 9.1Allegheny 3 GATEWAY SD Asian 66 25.8 62.1 9.1 3.0Allegheny 3 GATEWAY SD Native American 0Allegheny 3 GATEWAY SD Multi-ethnic 25 4.0 52.0 36.0 8.0Allegheny 3 GATEWAY SD IEP 123 3.3 43.9 41.5 11.4Allegheny 3 GATEWAY SD ELL 7Allegheny 3 GATEWAY SD Economically Disadvantaged 247 8.1 61.1 27.1 3.6Allegheny 3 HAMPTON TOWNSHIP SD All students 753 23.0 70.3 6.5 0.3Allegheny 3 HAMPTON TOWNSHIP SD Male 372 14.5 74.5 10.5 0.5Allegheny 3 HAMPTON TOWNSHIP SD Female 381 31.2 66.1 2.6 0.0Allegheny 3 HAMPTON TOWNSHIP SD White 727 22.6 70.6 6.6 0.3Allegheny 3 HAMPTON TOWNSHIP SD Black 8Allegheny 3 HAMPTON TOWNSHIP SD Hispanic 0Allegheny 3 HAMPTON TOWNSHIP SD Asian 18 50.0 50.0 0.0 0.0Allegheny 3 HAMPTON TOWNSHIP SD Native American 0Allegheny 3 HAMPTON TOWNSHIP SD Multi-ethnic 0Allegheny 3 HAMPTON TOWNSHIP SD IEP 59 5.1 59.3 33.9 1.7Allegheny 3 HAMPTON TOWNSHIP SD ELL 0Allegheny 3 HAMPTON TOWNSHIP SD Economically Disadvantaged 72 20.8 56.9 19.4 2.8Allegheny 3 HIGHLANDS SD All students 592 8.1 65.9 25.2 0.8Allegheny 3 HIGHLANDS SD Male 311 5.8 62.1 30.9 1.3Allegheny 3 HIGHLANDS SD Female 281 10.7 70.1 18.9 0.4Allegheny 3 HIGHLANDS SD White 539 8.7 65.7 24.9 0.7Allegheny 3 HIGHLANDS SD Black 41 2.4 61.0 34.1 2.4Allegheny 3 HIGHLANDS SD Hispanic 1
*Full Academic Year Students. Data for groups with less than 10 students assessed were replaced by blanks.Percentages were rounded to the nearest one-tenth.Proficiency percentages may not add up to 100 due to rounding. 9

The 2010 PSSA Writing District Level Proficiency Results - District Totals*
CountyIU
Number District Group
Number Scored Writing
% Advanced
Writing
% Proficient
Writing% Basic Writing
% Below Basic
WritingAllegheny 3 HIGHLANDS SD Asian 4Allegheny 3 HIGHLANDS SD Native American 3Allegheny 3 HIGHLANDS SD Multi-ethnic 4Allegheny 3 HIGHLANDS SD IEP 95 1.1 40.0 55.8 3.2Allegheny 3 HIGHLANDS SD ELL 1Allegheny 3 HIGHLANDS SD Economically Disadvantaged 329 4.0 62.0 33.1 0.9Allegheny 3 KEYSTONE OAKS SD All students 469 13.9 63.8 21.3 1.1Allegheny 3 KEYSTONE OAKS SD Male 244 9.8 57.8 30.3 2.0Allegheny 3 KEYSTONE OAKS SD Female 225 18.2 70.2 11.6 0.0Allegheny 3 KEYSTONE OAKS SD White 436 13.5 64.7 20.6 1.1Allegheny 3 KEYSTONE OAKS SD Black 16 6.3 62.5 31.3 0.0Allegheny 3 KEYSTONE OAKS SD Hispanic 5Allegheny 3 KEYSTONE OAKS SD Asian 10 50.0 30.0 20.0 0.0Allegheny 3 KEYSTONE OAKS SD Native American 1Allegheny 3 KEYSTONE OAKS SD Multi-ethnic 1Allegheny 3 KEYSTONE OAKS SD IEP 50 8.0 42.0 48.0 2.0Allegheny 3 KEYSTONE OAKS SD ELL 2Allegheny 3 KEYSTONE OAKS SD Economically Disadvantaged 137 8.0 58.4 32.8 0.7Allegheny 3 MCKEESPORT AREA SD All students 805 1.6 44.0 45.7 8.7Allegheny 3 MCKEESPORT AREA SD Male 426 0.7 34.5 53.3 11.5Allegheny 3 MCKEESPORT AREA SD Female 376 2.7 55.1 36.7 5.6Allegheny 3 MCKEESPORT AREA SD White 418 2.9 51.0 39.5 6.7Allegheny 3 MCKEESPORT AREA SD Black 359 0.3 36.5 51.5 11.7Allegheny 3 MCKEESPORT AREA SD Hispanic 8Allegheny 3 MCKEESPORT AREA SD Asian 0Allegheny 3 MCKEESPORT AREA SD Native American 2Allegheny 3 MCKEESPORT AREA SD Multi-ethnic 15 0.0 40.0 60.0 0.0Allegheny 3 MCKEESPORT AREA SD IEP 150 0.0 20.0 49.3 30.7Allegheny 3 MCKEESPORT AREA SD ELL 1Allegheny 3 MCKEESPORT AREA SD Economically Disadvantaged 529 0.8 40.5 48.6 10.2
*Full Academic Year Students. Data for groups with less than 10 students assessed were replaced by blanks.Percentages were rounded to the nearest one-tenth.Proficiency percentages may not add up to 100 due to rounding. 10

The 2010 PSSA Writing District Level Proficiency Results - District Totals*
CountyIU
Number District Group
Number Scored Writing
% Advanced
Writing
% Proficient
Writing% Basic Writing
% Below Basic
WritingAllegheny 3 MONTOUR SD All students 689 17.0 70.0 12.2 0.9Allegheny 3 MONTOUR SD Male 333 11.7 68.2 18.9 1.2Allegheny 3 MONTOUR SD Female 356 21.9 71.6 5.9 0.6Allegheny 3 MONTOUR SD White 647 17.6 69.7 11.9 0.8Allegheny 3 MONTOUR SD Black 20 5.0 75.0 15.0 5.0Allegheny 3 MONTOUR SD Hispanic 3Allegheny 3 MONTOUR SD Asian 12 8.3 75.0 16.7 0.0Allegheny 3 MONTOUR SD Native American 0Allegheny 3 MONTOUR SD Multi-ethnic 7Allegheny 3 MONTOUR SD IEP 85 2.4 51.8 41.2 4.7Allegheny 3 MONTOUR SD ELL 3Allegheny 3 MONTOUR SD Economically Disadvantaged 96 10.4 69.8 18.8 1.0Allegheny 3 MOON AREA SD All students 843 14.8 72.0 12.7 0.5Allegheny 3 MOON AREA SD Male 417 10.8 71.5 17.3 0.5Allegheny 3 MOON AREA SD Female 422 19.0 72.5 8.1 0.5Allegheny 3 MOON AREA SD White 733 15.7 72.7 11.3 0.3Allegheny 3 MOON AREA SD Black 71 9.9 66.2 21.1 2.8Allegheny 3 MOON AREA SD Hispanic 10 0.0 80.0 20.0 0.0Allegheny 3 MOON AREA SD Asian 18 16.7 61.1 22.2 0.0Allegheny 3 MOON AREA SD Native American 0Allegheny 3 MOON AREA SD Multi-ethnic 7Allegheny 3 MOON AREA SD IEP 96 2.1 53.1 42.7 2.1Allegheny 3 MOON AREA SD ELL 2Allegheny 3 MOON AREA SD Economically Disadvantaged 107 5.6 64.5 29.9 0.0Allegheny 3 MT LEBANON SD All students 1,187 28.8 64.6 6.1 0.4Allegheny 3 MT LEBANON SD Male 615 22.8 67.3 9.1 0.8Allegheny 3 MT LEBANON SD Female 571 35.4 61.6 3.0 0.0Allegheny 3 MT LEBANON SD White 1,101 28.6 65.1 6.0 0.3Allegheny 3 MT LEBANON SD Black 19 10.5 57.9 21.1 10.5Allegheny 3 MT LEBANON SD Hispanic 15 20.0 80.0 0.0 0.0
*Full Academic Year Students. Data for groups with less than 10 students assessed were replaced by blanks.Percentages were rounded to the nearest one-tenth.Proficiency percentages may not add up to 100 due to rounding. 11

The 2010 PSSA Writing District Level Proficiency Results - District Totals*
CountyIU
Number District Group
Number Scored Writing
% Advanced
Writing
% Proficient
Writing% Basic Writing
% Below Basic
WritingAllegheny 3 MT LEBANON SD Asian 47 46.8 48.9 4.3 0.0Allegheny 3 MT LEBANON SD Native American 1Allegheny 3 MT LEBANON SD Multi-ethnic 3Allegheny 3 MT LEBANON SD IEP 238 28.6 51.7 18.9 0.8Allegheny 3 MT LEBANON SD ELL 1Allegheny 3 MT LEBANON SD Economically Disadvantaged 78 11.5 64.1 21.8 2.6Allegheny 3 NORTH ALLEGHENY SD All students 1,817 18.9 71.9 8.6 0.6Allegheny 3 NORTH ALLEGHENY SD Male 930 14.8 71.5 12.9 0.8Allegheny 3 NORTH ALLEGHENY SD Female 885 23.2 72.3 4.2 0.3Allegheny 3 NORTH ALLEGHENY SD White 1,599 17.6 72.9 8.9 0.6Allegheny 3 NORTH ALLEGHENY SD Black 38 13.2 68.4 18.4 0.0Allegheny 3 NORTH ALLEGHENY SD Hispanic 22 9.1 81.8 9.1 0.0Allegheny 3 NORTH ALLEGHENY SD Asian 148 37.2 60.1 2.7 0.0Allegheny 3 NORTH ALLEGHENY SD Native American 0Allegheny 3 NORTH ALLEGHENY SD Multi-ethnic 8Allegheny 3 NORTH ALLEGHENY SD IEP 164 2.4 59.1 34.1 4.3Allegheny 3 NORTH ALLEGHENY SD ELL 4Allegheny 3 NORTH ALLEGHENY SD Economically Disadvantaged 79 11.4 70.9 16.5 1.3Allegheny 3 NORTH HILLS SD All students 1,018 13.5 72.1 13.7 0.8Allegheny 3 NORTH HILLS SD Male 532 11.5 68.6 18.6 1.3Allegheny 3 NORTH HILLS SD Female 485 15.7 75.9 8.2 0.2Allegheny 3 NORTH HILLS SD White 958 13.5 72.4 13.6 0.5Allegheny 3 NORTH HILLS SD Black 23 8.7 69.6 21.7 0.0Allegheny 3 NORTH HILLS SD Hispanic 9Allegheny 3 NORTH HILLS SD Asian 23 21.7 60.9 13.0 4.3Allegheny 3 NORTH HILLS SD Native American 1Allegheny 3 NORTH HILLS SD Multi-ethnic 3Allegheny 3 NORTH HILLS SD IEP 144 2.1 56.9 37.5 3.5Allegheny 3 NORTH HILLS SD ELL 11 0.0 36.4 54.5 9.1Allegheny 3 NORTH HILLS SD Economically Disadvantaged 187 8.0 64.7 25.7 1.6
*Full Academic Year Students. Data for groups with less than 10 students assessed were replaced by blanks.Percentages were rounded to the nearest one-tenth.Proficiency percentages may not add up to 100 due to rounding. 12
The 2010 PSSA Writing District Level Proficiency Results - District Totals*
CountyIU
Number District Group
Number Scored Writing
% Advanced
Writing
% Proficient
Writing% Basic Writing
% Below Basic
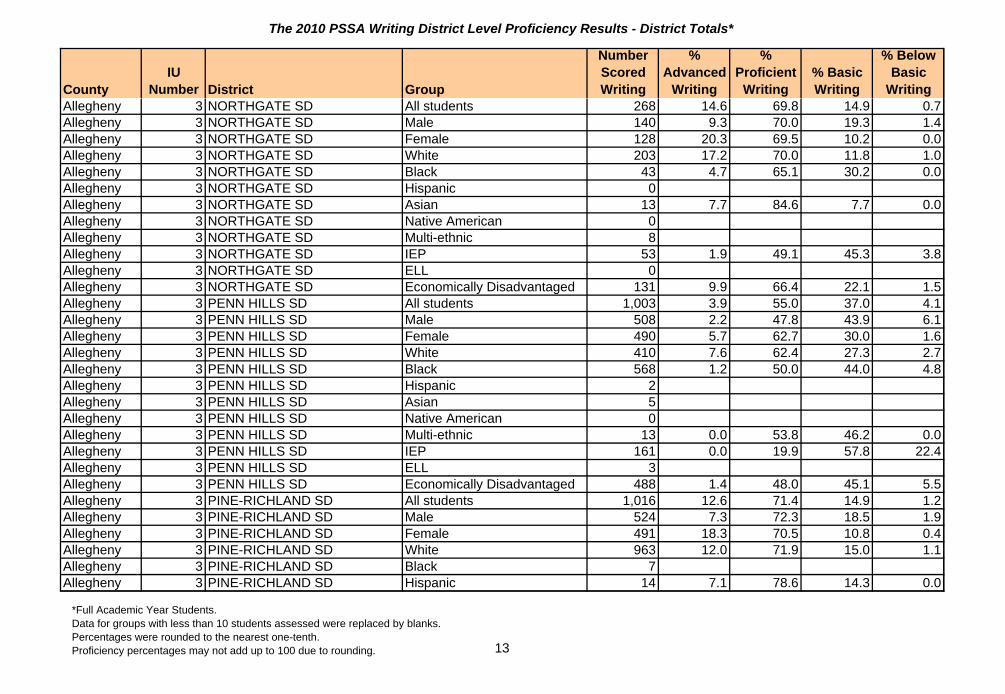
WritingAllegheny 3 NORTHGATE SD All students 268 14.6 69.8 14.9 0.7Allegheny 3 NORTHGATE SD Male 140 9.3 70.0 19.3 1.4Allegheny 3 NORTHGATE SD Female 128 20.3 69.5 10.2 0.0Allegheny 3 NORTHGATE SD White 203 17.2 70.0 11.8 1.0Allegheny 3 NORTHGATE SD Black 43 4.7 65.1 30.2 0.0Allegheny 3 NORTHGATE SD Hispanic 0Allegheny 3 NORTHGATE SD Asian 13 7.7 84.6 7.7 0.0Allegheny 3 NORTHGATE SD Native American 0Allegheny 3 NORTHGATE SD Multi-ethnic 8Allegheny 3 NORTHGATE SD IEP 53 1.9 49.1 45.3 3.8Allegheny 3 NORTHGATE SD ELL 0Allegheny 3 NORTHGATE SD Economically Disadvantaged 131 9.9 66.4 22.1 1.5Allegheny 3 PENN HILLS SD All students 1,003 3.9 55.0 37.0 4.1Allegheny 3 PENN HILLS SD Male 508 2.2 47.8 43.9 6.1Allegheny 3 PENN HILLS SD Female 490 5.7 62.7 30.0 1.6Allegheny 3 PENN HILLS SD White 410 7.6 62.4 27.3 2.7Allegheny 3 PENN HILLS SD Black 568 1.2 50.0 44.0 4.8Allegheny 3 PENN HILLS SD Hispanic 2Allegheny 3 PENN HILLS SD Asian 5Allegheny 3 PENN HILLS SD Native American 0Allegheny 3 PENN HILLS SD Multi-ethnic 13 0.0 53.8 46.2 0.0Allegheny 3 PENN HILLS SD IEP 161 0.0 19.9 57.8 22.4Allegheny 3 PENN HILLS SD ELL 3Allegheny 3 PENN HILLS SD Economically Disadvantaged 488 1.4 48.0 45.1 5.5Allegheny 3 PINE-RICHLAND SD All students 1,016 12.6 71.4 14.9 1.2Allegheny 3 PINE-RICHLAND SD Male 524 7.3 72.3 18.5 1.9Allegheny 3 PINE-RICHLAND SD Female 491 18.3 70.5 10.8 0.4Allegheny 3 PINE-RICHLAND SD White 963 12.0 71.9 15.0 1.1Allegheny 3 PINE-RICHLAND SD Black 7Allegheny 3 PINE-RICHLAND SD Hispanic 14 7.1 78.6 14.3 0.0
*Full Academic Year Students. Data for groups with less than 10 students assessed were replaced by blanks.Percentages were rounded to the nearest one-tenth.Proficiency percentages may not add up to 100 due to rounding. 13

The 2010 PSSA Writing District Level Proficiency Results - District Totals*
CountyIU
Number District Group
Number Scored Writing
% Advanced
Writing
% Proficient
Writing% Basic Writing
% Below Basic
WritingAllegheny 3 PINE-RICHLAND SD Asian 31 29.0 58.1 9.7 3.2Allegheny 3 PINE-RICHLAND SD Native American 0Allegheny 3 PINE-RICHLAND SD Multi-ethnic 0Allegheny 3 PINE-RICHLAND SD IEP 106 3.8 46.2 41.5 8.5Allegheny 3 PINE-RICHLAND SD ELL 1Allegheny 3 PINE-RICHLAND SD Economically Disadvantaged 51 2.0 62.7 31.4 3.9Allegheny 2 PITTSBURGH SD All students 5,261 6.5 52.1 36.6 4.8Allegheny 2 PITTSBURGH SD Male 2,607 4.2 45.3 43.5 6.9Allegheny 2 PITTSBURGH SD Female 2,645 8.7 58.8 29.9 2.6Allegheny 2 PITTSBURGH SD White 1,899 10.7 60.8 25.7 2.8Allegheny 2 PITTSBURGH SD Black 2,945 3.7 46.0 44.3 6.0Allegheny 2 PITTSBURGH SD Hispanic 68 5.9 57.4 27.9 8.8Allegheny 2 PITTSBURGH SD Asian 93 11.8 51.6 32.3 4.3Allegheny 2 PITTSBURGH SD Native American 7Allegheny 2 PITTSBURGH SD Multi-ethnic 239 5.0 57.7 33.9 3.3Allegheny 2 PITTSBURGH SD IEP 929 0.8 18.8 61.7 18.7Allegheny 2 PITTSBURGH SD ELL 54 1.9 27.8 51.9 18.5Allegheny 2 PITTSBURGH SD Economically Disadvantaged 3,680 3.6 48.3 42.5 5.6Allegheny 3 PLUM BOROUGH SD All students 1,006 9.3 73.7 16.4 0.6Allegheny 3 PLUM BOROUGH SD Male 501 6.2 69.3 23.6 1.0Allegheny 3 PLUM BOROUGH SD Female 504 12.5 78.0 9.3 0.2Allegheny 3 PLUM BOROUGH SD White 949 9.2 74.0 16.2 0.6Allegheny 3 PLUM BOROUGH SD Black 36 2.8 66.7 30.6 0.0Allegheny 3 PLUM BOROUGH SD Hispanic 5Allegheny 3 PLUM BOROUGH SD Asian 13 30.8 69.2 0.0 0.0Allegheny 3 PLUM BOROUGH SD Native American 2Allegheny 3 PLUM BOROUGH SD Multi-ethnic 0Allegheny 3 PLUM BOROUGH SD IEP 101 2.0 46.5 46.5 5.0Allegheny 3 PLUM BOROUGH SD ELL 0Allegheny 3 PLUM BOROUGH SD Economically Disadvantaged 174 3.4 68.4 26.4 1.7
*Full Academic Year Students. Data for groups with less than 10 students assessed were replaced by blanks.Percentages were rounded to the nearest one-tenth.Proficiency percentages may not add up to 100 due to rounding. 14

The 2010 PSSA Writing District Level Proficiency Results - District Totals*
CountyIU
Number District Group
Number Scored Writing
% Advanced
Writing
% Proficient
Writing% Basic Writing
% Below Basic
WritingAllegheny 3 QUAKER VALLEY SD All students 472 18.9 66.3 13.6 1.3Allegheny 3 QUAKER VALLEY SD Male 234 14.1 63.7 20.1 2.1Allegheny 3 QUAKER VALLEY SD Female 234 23.5 69.2 6.8 0.4Allegheny 3 QUAKER VALLEY SD White 407 17.4 68.3 13.0 1.2Allegheny 3 QUAKER VALLEY SD Black 27 25.9 48.1 25.9 0.0Allegheny 3 QUAKER VALLEY SD Hispanic 9Allegheny 3 QUAKER VALLEY SD Asian 9Allegheny 3 QUAKER VALLEY SD Native American 3Allegheny 3 QUAKER VALLEY SD Multi-ethnic 13 30.8 53.8 15.4 0.0Allegheny 3 QUAKER VALLEY SD IEP 64 1.6 56.3 35.9 6.3Allegheny 3 QUAKER VALLEY SD ELL 1Allegheny 3 QUAKER VALLEY SD Economically Disadvantaged 73 13.7 53.4 30.1 2.7Allegheny 3 RIVERVIEW SD All students 246 8.9 73.2 15.4 2.4Allegheny 3 RIVERVIEW SD Male 125 7.2 68.0 20.8 4.0Allegheny 3 RIVERVIEW SD Female 120 10.8 78.3 10.0 0.8Allegheny 3 RIVERVIEW SD White 224 9.4 73.7 14.7 2.2Allegheny 3 RIVERVIEW SD Black 18 5.6 66.7 22.2 5.6Allegheny 3 RIVERVIEW SD Hispanic 1Allegheny 3 RIVERVIEW SD Asian 0Allegheny 3 RIVERVIEW SD Native American 0Allegheny 3 RIVERVIEW SD Multi-ethnic 2Allegheny 3 RIVERVIEW SD IEP 36 2.8 38.9 41.7 16.7Allegheny 3 RIVERVIEW SD ELL 0Allegheny 3 RIVERVIEW SD Economically Disadvantaged 85 2.4 71.8 21.2 4.7Allegheny 3 SHALER AREA SD All students 1,100 9.6 66.5 22.5 1.4Allegheny 3 SHALER AREA SD Male 541 6.5 62.1 29.6 1.8Allegheny 3 SHALER AREA SD Female 556 12.8 70.9 15.6 0.7Allegheny 3 SHALER AREA SD White 1,076 9.9 66.4 22.6 1.2Allegheny 3 SHALER AREA SD Black 11 0.0 72.7 18.2 9.1Allegheny 3 SHALER AREA SD Hispanic 3
*Full Academic Year Students. Data for groups with less than 10 students assessed were replaced by blanks.Percentages were rounded to the nearest one-tenth.Proficiency percentages may not add up to 100 due to rounding. 15

The 2010 PSSA Writing District Level Proficiency Results - District Totals*
CountyIU
Number District Group
Number Scored Writing
% Advanced
Writing
% Proficient
Writing% Basic Writing
% Below Basic
WritingAllegheny 3 SHALER AREA SD Asian 5Allegheny 3 SHALER AREA SD Native American 1Allegheny 3 SHALER AREA SD Multi-ethnic 1Allegheny 3 SHALER AREA SD IEP 178 0.6 41.6 51.1 6.7Allegheny 3 SHALER AREA SD ELL 2Allegheny 3 SHALER AREA SD Economically Disadvantaged 268 3.4 60.1 34.3 2.2Allegheny 3 SOUTH ALLEGHENY SD All students 363 8.3 70.8 19.6 1.4Allegheny 3 SOUTH ALLEGHENY SD Male 189 4.8 67.7 25.9 1.6Allegheny 3 SOUTH ALLEGHENY SD Female 173 12.1 74.6 12.7 0.6Allegheny 3 SOUTH ALLEGHENY SD White 349 8.3 71.1 19.5 1.1Allegheny 3 SOUTH ALLEGHENY SD Black 8Allegheny 3 SOUTH ALLEGHENY SD Hispanic 1Allegheny 3 SOUTH ALLEGHENY SD Asian 0Allegheny 3 SOUTH ALLEGHENY SD Native American 0Allegheny 3 SOUTH ALLEGHENY SD Multi-ethnic 4Allegheny 3 SOUTH ALLEGHENY SD IEP 61 1.6 62.3 29.5 6.6Allegheny 3 SOUTH ALLEGHENY SD ELL 0Allegheny 3 SOUTH ALLEGHENY SD Economically Disadvantaged 159 3.8 69.8 24.5 1.9Allegheny 3 SOUTH FAYETTE TOWNSHIP SAll students 534 18.4 69.7 11.0 0.9Allegheny 3 SOUTH FAYETTE TOWNSHIP SMale 282 15.2 68.1 16.0 0.7Allegheny 3 SOUTH FAYETTE TOWNSHIP SFemale 252 21.8 71.4 5.6 1.2Allegheny 3 SOUTH FAYETTE TOWNSHIP SWhite 489 19.0 69.9 10.2 0.8Allegheny 3 SOUTH FAYETTE TOWNSHIP SBlack 20 0.0 65.0 30.0 5.0Allegheny 3 SOUTH FAYETTE TOWNSHIP SHispanic 4Allegheny 3 SOUTH FAYETTE TOWNSHIP SAsian 17 23.5 64.7 11.8 0.0Allegheny 3 SOUTH FAYETTE TOWNSHIP SNative American 0Allegheny 3 SOUTH FAYETTE TOWNSHIP SMulti-ethnic 4Allegheny 3 SOUTH FAYETTE TOWNSHIP SIEP 44 0.0 34.1 54.5 11.4Allegheny 3 SOUTH FAYETTE TOWNSHIP SELL 2Allegheny 3 SOUTH FAYETTE TOWNSHIP SEconomically Disadvantaged 73 9.6 54.8 32.9 2.7
*Full Academic Year Students. Data for groups with less than 10 students assessed were replaced by blanks.Percentages were rounded to the nearest one-tenth.Proficiency percentages may not add up to 100 due to rounding. 16

The 2010 PSSA Writing District Level Proficiency Results - District Totals*
CountyIU
Number District Group
Number Scored Writing
% Advanced
Writing
% Proficient
Writing% Basic Writing
% Below Basic
WritingAllegheny 3 SOUTH PARK SD All students 478 13.0 63.0 22.6 1.5Allegheny 3 SOUTH PARK SD Male 247 10.9 59.5 27.5 2.0Allegheny 3 SOUTH PARK SD Female 229 15.3 66.4 17.5 0.9Allegheny 3 SOUTH PARK SD White 449 13.4 63.7 21.6 1.3Allegheny 3 SOUTH PARK SD Black 24 4.2 50.0 41.7 4.2Allegheny 3 SOUTH PARK SD Hispanic 1Allegheny 3 SOUTH PARK SD Asian 2Allegheny 3 SOUTH PARK SD Native American 0Allegheny 3 SOUTH PARK SD Multi-ethnic 0Allegheny 3 SOUTH PARK SD IEP 43 0.0 37.2 60.5 2.3Allegheny 3 SOUTH PARK SD ELL 2Allegheny 3 SOUTH PARK SD Economically Disadvantaged 88 5.7 53.4 36.4 4.5Allegheny 3 STEEL VALLEY SD All students 371 7.0 61.2 27.0 4.9Allegheny 3 STEEL VALLEY SD Male 179 4.5 53.6 33.5 8.4Allegheny 3 STEEL VALLEY SD Female 192 9.4 68.2 20.8 1.6Allegheny 3 STEEL VALLEY SD White 239 10.0 69.5 17.6 2.9Allegheny 3 STEEL VALLEY SD Black 111 0.0 47.7 43.2 9.0Allegheny 3 STEEL VALLEY SD Hispanic 1Allegheny 3 STEEL VALLEY SD Asian 8Allegheny 3 STEEL VALLEY SD Native American 0Allegheny 3 STEEL VALLEY SD Multi-ethnic 12 0.0 16.7 75.0 8.3Allegheny 3 STEEL VALLEY SD IEP 55 0.0 20.0 50.9 29.1Allegheny 3 STEEL VALLEY SD ELL 1Allegheny 3 STEEL VALLEY SD Economically Disadvantaged 191 4.2 48.7 39.8 7.3Allegheny 3 STO-ROX SD All students 272 1.5 46.7 46.3 5.5Allegheny 3 STO-ROX SD Male 147 0.0 44.9 47.6 7.5Allegheny 3 STO-ROX SD Female 122 3.3 50.0 43.4 3.3Allegheny 3 STO-ROX SD White 115 2.6 51.3 44.3 1.7Allegheny 3 STO-ROX SD Black 131 0.8 45.0 45.8 8.4Allegheny 3 STO-ROX SD Hispanic 5
*Full Academic Year Students. Data for groups with less than 10 students assessed were replaced by blanks.Percentages were rounded to the nearest one-tenth.Proficiency percentages may not add up to 100 due to rounding. 17
The 2010 PSSA Writing District Level Proficiency Results - District Totals*
CountyIU
Number District Group
Number Scored Writing
% Advanced
Writing
% Proficient
Writing% Basic Writing
% Below Basic
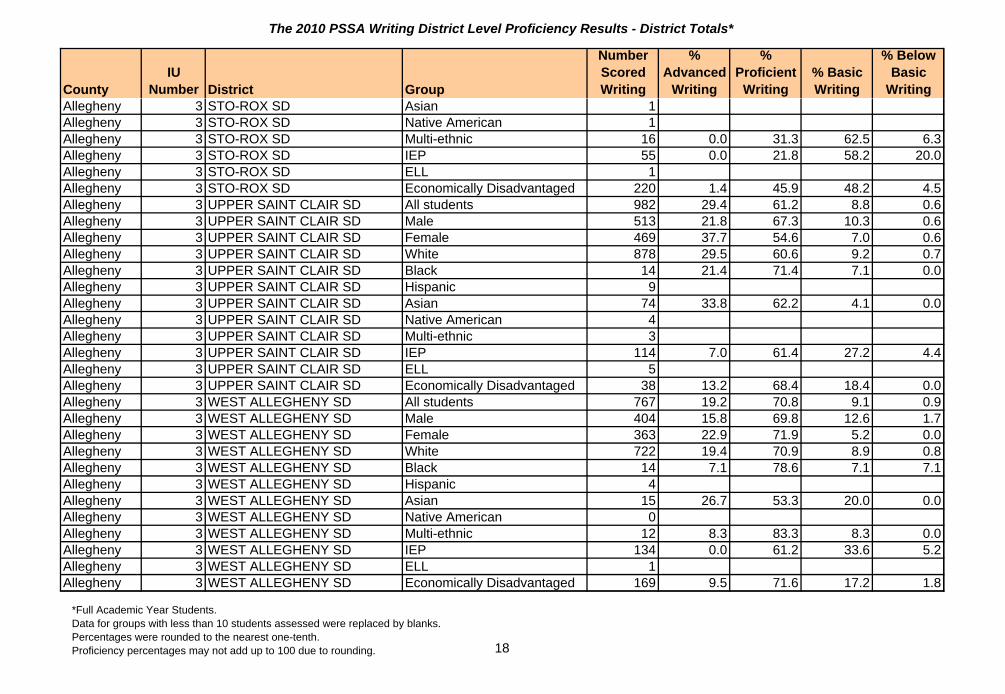
WritingAllegheny 3 STO-ROX SD Asian 1Allegheny 3 STO-ROX SD Native American 1Allegheny 3 STO-ROX SD Multi-ethnic 16 0.0 31.3 62.5 6.3Allegheny 3 STO-ROX SD IEP 55 0.0 21.8 58.2 20.0Allegheny 3 STO-ROX SD ELL 1Allegheny 3 STO-ROX SD Economically Disadvantaged 220 1.4 45.9 48.2 4.5Allegheny 3 UPPER SAINT CLAIR SD All students 982 29.4 61.2 8.8 0.6Allegheny 3 UPPER SAINT CLAIR SD Male 513 21.8 67.3 10.3 0.6Allegheny 3 UPPER SAINT CLAIR SD Female 469 37.7 54.6 7.0 0.6Allegheny 3 UPPER SAINT CLAIR SD White 878 29.5 60.6 9.2 0.7Allegheny 3 UPPER SAINT CLAIR SD Black 14 21.4 71.4 7.1 0.0Allegheny 3 UPPER SAINT CLAIR SD Hispanic 9Allegheny 3 UPPER SAINT CLAIR SD Asian 74 33.8 62.2 4.1 0.0Allegheny 3 UPPER SAINT CLAIR SD Native American 4Allegheny 3 UPPER SAINT CLAIR SD Multi-ethnic 3Allegheny 3 UPPER SAINT CLAIR SD IEP 114 7.0 61.4 27.2 4.4Allegheny 3 UPPER SAINT CLAIR SD ELL 5Allegheny 3 UPPER SAINT CLAIR SD Economically Disadvantaged 38 13.2 68.4 18.4 0.0Allegheny 3 WEST ALLEGHENY SD All students 767 19.2 70.8 9.1 0.9Allegheny 3 WEST ALLEGHENY SD Male 404 15.8 69.8 12.6 1.7Allegheny 3 WEST ALLEGHENY SD Female 363 22.9 71.9 5.2 0.0Allegheny 3 WEST ALLEGHENY SD White 722 19.4 70.9 8.9 0.8Allegheny 3 WEST ALLEGHENY SD Black 14 7.1 78.6 7.1 7.1Allegheny 3 WEST ALLEGHENY SD Hispanic 4Allegheny 3 WEST ALLEGHENY SD Asian 15 26.7 53.3 20.0 0.0Allegheny 3 WEST ALLEGHENY SD Native American 0Allegheny 3 WEST ALLEGHENY SD Multi-ethnic 12 8.3 83.3 8.3 0.0Allegheny 3 WEST ALLEGHENY SD IEP 134 0.0 61.2 33.6 5.2Allegheny 3 WEST ALLEGHENY SD ELL 1Allegheny 3 WEST ALLEGHENY SD Economically Disadvantaged 169 9.5 71.6 17.2 1.8
*Full Academic Year Students. Data for groups with less than 10 students assessed were replaced by blanks.Percentages were rounded to the nearest one-tenth.Proficiency percentages may not add up to 100 due to rounding. 18
The 2010 PSSA Writing District Level Proficiency Results - District Totals*
CountyIU
Number District Group
Number Scored Writing
% Advanced
Writing
% Proficient
Writing% Basic Writing
% Below Basic
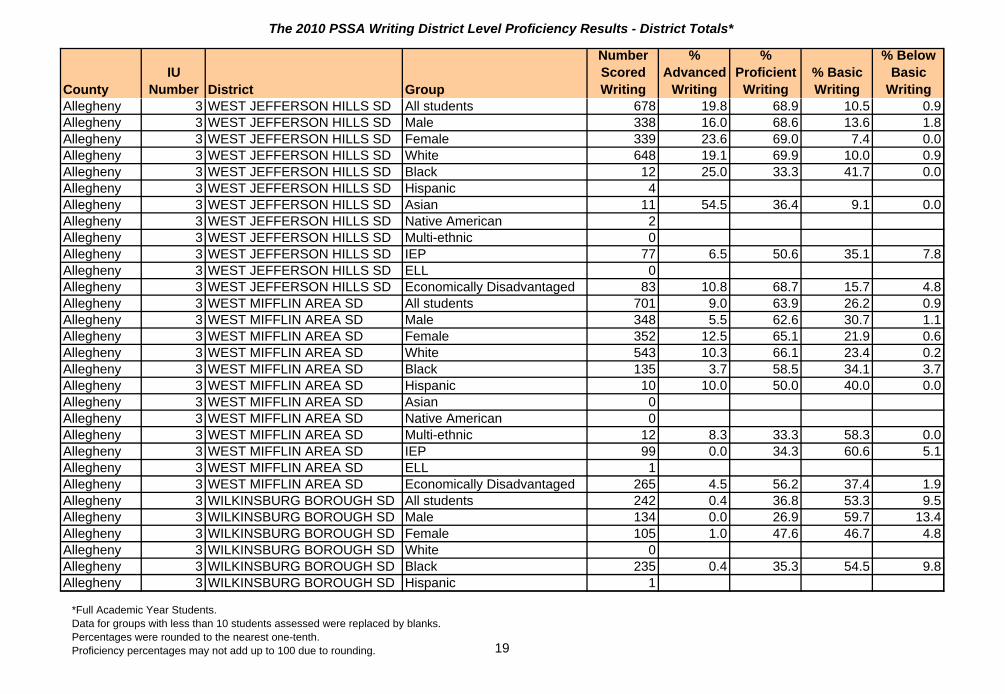
WritingAllegheny 3 WEST JEFFERSON HILLS SD All students 678 19.8 68.9 10.5 0.9Allegheny 3 WEST JEFFERSON HILLS SD Male 338 16.0 68.6 13.6 1.8Allegheny 3 WEST JEFFERSON HILLS SD Female 339 23.6 69.0 7.4 0.0Allegheny 3 WEST JEFFERSON HILLS SD White 648 19.1 69.9 10.0 0.9Allegheny 3 WEST JEFFERSON HILLS SD Black 12 25.0 33.3 41.7 0.0Allegheny 3 WEST JEFFERSON HILLS SD Hispanic 4Allegheny 3 WEST JEFFERSON HILLS SD Asian 11 54.5 36.4 9.1 0.0Allegheny 3 WEST JEFFERSON HILLS SD Native American 2Allegheny 3 WEST JEFFERSON HILLS SD Multi-ethnic 0Allegheny 3 WEST JEFFERSON HILLS SD IEP 77 6.5 50.6 35.1 7.8Allegheny 3 WEST JEFFERSON HILLS SD ELL 0Allegheny 3 WEST JEFFERSON HILLS SD Economically Disadvantaged 83 10.8 68.7 15.7 4.8Allegheny 3 WEST MIFFLIN AREA SD All students 701 9.0 63.9 26.2 0.9Allegheny 3 WEST MIFFLIN AREA SD Male 348 5.5 62.6 30.7 1.1Allegheny 3 WEST MIFFLIN AREA SD Female 352 12.5 65.1 21.9 0.6Allegheny 3 WEST MIFFLIN AREA SD White 543 10.3 66.1 23.4 0.2Allegheny 3 WEST MIFFLIN AREA SD Black 135 3.7 58.5 34.1 3.7Allegheny 3 WEST MIFFLIN AREA SD Hispanic 10 10.0 50.0 40.0 0.0Allegheny 3 WEST MIFFLIN AREA SD Asian 0Allegheny 3 WEST MIFFLIN AREA SD Native American 0Allegheny 3 WEST MIFFLIN AREA SD Multi-ethnic 12 8.3 33.3 58.3 0.0Allegheny 3 WEST MIFFLIN AREA SD IEP 99 0.0 34.3 60.6 5.1Allegheny 3 WEST MIFFLIN AREA SD ELL 1Allegheny 3 WEST MIFFLIN AREA SD Economically Disadvantaged 265 4.5 56.2 37.4 1.9Allegheny 3 WILKINSBURG BOROUGH SD All students 242 0.4 36.8 53.3 9.5Allegheny 3 WILKINSBURG BOROUGH SD Male 134 0.0 26.9 59.7 13.4Allegheny 3 WILKINSBURG BOROUGH SD Female 105 1.0 47.6 46.7 4.8Allegheny 3 WILKINSBURG BOROUGH SD White 0Allegheny 3 WILKINSBURG BOROUGH SD Black 235 0.4 35.3 54.5 9.8Allegheny 3 WILKINSBURG BOROUGH SD Hispanic 1
*Full Academic Year Students. Data for groups with less than 10 students assessed were replaced by blanks.Percentages were rounded to the nearest one-tenth.Proficiency percentages may not add up to 100 due to rounding. 19

The 2010 PSSA Writing District Level Proficiency Results - District Totals*
CountyIU
Number District Group
Number Scored Writing
% Advanced
Writing
% Proficient
Writing% Basic Writing
% Below Basic
WritingAllegheny 3 WILKINSBURG BOROUGH SD Asian 0Allegheny 3 WILKINSBURG BOROUGH SD Native American 0Allegheny 3 WILKINSBURG BOROUGH SD Multi-ethnic 3Allegheny 3 WILKINSBURG BOROUGH SD IEP 73 0.0 19.2 57.5 23.3Allegheny 3 WILKINSBURG BOROUGH SD ELL 0Allegheny 3 WILKINSBURG BOROUGH SD Economically Disadvantaged 166 0.6 32.5 57.2 9.6Allegheny 3 WOODLAND HILLS SD All students 854 3.0 44.8 44.1 8.0Allegheny 3 WOODLAND HILLS SD Male 422 2.4 35.3 50.5 11.8Allegheny 3 WOODLAND HILLS SD Female 427 3.7 54.8 37.5 4.0Allegheny 3 WOODLAND HILLS SD White 288 6.9 57.6 29.9 5.6Allegheny 3 WOODLAND HILLS SD Black 542 0.7 38.0 52.0 9.2Allegheny 3 WOODLAND HILLS SD Hispanic 5Allegheny 3 WOODLAND HILLS SD Asian 12 16.7 58.3 25.0 0.0Allegheny 3 WOODLAND HILLS SD Native American 0Allegheny 3 WOODLAND HILLS SD Multi-ethnic 2Allegheny 3 WOODLAND HILLS SD IEP 159 0.0 15.1 56.6 28.3Allegheny 3 WOODLAND HILLS SD ELL 2Allegheny 3 WOODLAND HILLS SD Economically Disadvantaged 560 1.1 37.9 51.6 9.5Armstrong 28 APOLLO-RIDGE SD All students 366 3.3 65.0 30.3 1.4Armstrong 28 APOLLO-RIDGE SD Male 181 2.8 59.1 35.4 2.8Armstrong 28 APOLLO-RIDGE SD Female 182 3.8 70.3 25.8 0.0Armstrong 28 APOLLO-RIDGE SD White 347 3.2 64.3 31.1 1.4Armstrong 28 APOLLO-RIDGE SD Black 7Armstrong 28 APOLLO-RIDGE SD Hispanic 0Armstrong 28 APOLLO-RIDGE SD Asian 0Armstrong 28 APOLLO-RIDGE SD Native American 0Armstrong 28 APOLLO-RIDGE SD Multi-ethnic 9Armstrong 28 APOLLO-RIDGE SD IEP 49 0.0 40.8 51.0 8.2Armstrong 28 APOLLO-RIDGE SD ELL 0Armstrong 28 APOLLO-RIDGE SD Economically Disadvantaged 163 2.5 59.5 35.0 3.1
*Full Academic Year Students. Data for groups with less than 10 students assessed were replaced by blanks.Percentages were rounded to the nearest one-tenth.Proficiency percentages may not add up to 100 due to rounding. 20

The 2010 PSSA Writing District Level Proficiency Results - District Totals*
CountyIU
Number District Group
Number Scored Writing
% Advanced
Writing
% Proficient
Writing% Basic Writing
% Below Basic
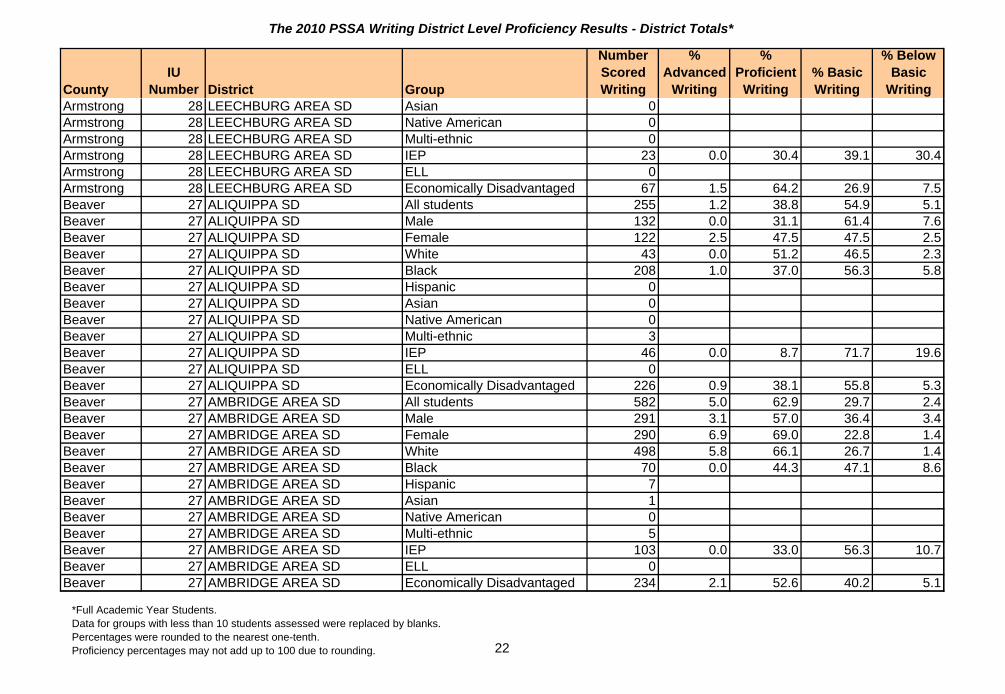
WritingArmstrong 28 ARMSTRONG SD All students 1,383 4.0 65.1 28.3 2.5Armstrong 28 ARMSTRONG SD Male 693 2.2 55.1 39.0 3.8Armstrong 28 ARMSTRONG SD Female 688 6.0 75.1 17.6 1.3Armstrong 28 ARMSTRONG SD White 1,364 4.0 65.4 28.1 2.6Armstrong 28 ARMSTRONG SD Black 10 0.0 50.0 50.0 0.0Armstrong 28 ARMSTRONG SD Hispanic 1Armstrong 28 ARMSTRONG SD Asian 2Armstrong 28 ARMSTRONG SD Native American 3Armstrong 28 ARMSTRONG SD Multi-ethnic 1Armstrong 28 ARMSTRONG SD IEP 193 1.0 29.5 57.0 12.4Armstrong 28 ARMSTRONG SD ELL 1Armstrong 28 ARMSTRONG SD Economically Disadvantaged 558 2.0 57.7 37.3 3.0Armstrong 28 FREEPORT AREA SD All students 484 12.2 71.5 15.3 1.0Armstrong 28 FREEPORT AREA SD Male 246 7.7 67.9 22.8 1.6Armstrong 28 FREEPORT AREA SD Female 238 16.8 75.2 7.6 0.4Armstrong 28 FREEPORT AREA SD White 472 12.5 71.2 15.3 1.1Armstrong 28 FREEPORT AREA SD Black 3Armstrong 28 FREEPORT AREA SD Hispanic 2Armstrong 28 FREEPORT AREA SD Asian 2Armstrong 28 FREEPORT AREA SD Native American 0Armstrong 28 FREEPORT AREA SD Multi-ethnic 5Armstrong 28 FREEPORT AREA SD IEP 54 5.6 38.9 53.7 1.9Armstrong 28 FREEPORT AREA SD ELL 0Armstrong 28 FREEPORT AREA SD Economically Disadvantaged 140 7.9 70.0 20.0 2.1Armstrong 28 LEECHBURG AREA SD All students 192 1.6 72.9 21.9 3.6Armstrong 28 LEECHBURG AREA SD Male 113 0.0 66.4 27.4 6.2Armstrong 28 LEECHBURG AREA SD Female 79 3.8 82.3 13.9 0.0Armstrong 28 LEECHBURG AREA SD White 188 1.6 72.9 21.8 3.7Armstrong 28 LEECHBURG AREA SD Black 4Armstrong 28 LEECHBURG AREA SD Hispanic 0
*Full Academic Year Students. Data for groups with less than 10 students assessed were replaced by blanks.Percentages were rounded to the nearest one-tenth.Proficiency percentages may not add up to 100 due to rounding. 21
The 2010 PSSA Writing District Level Proficiency Results - District Totals*
CountyIU
Number District Group
Number Scored Writing
% Advanced
Writing
% Proficient
Writing% Basic Writing
% Below Basic
WritingArmstrong 28 LEECHBURG AREA SD Asian 0Armstrong 28 LEECHBURG AREA SD Native American 0Armstrong 28 LEECHBURG AREA SD Multi-ethnic 0Armstrong 28 LEECHBURG AREA SD IEP 23 0.0 30.4 39.1 30.4Armstrong 28 LEECHBURG AREA SD ELL 0Armstrong 28 LEECHBURG AREA SD Economically Disadvantaged 67 1.5 64.2 26.9 7.5Beaver 27 ALIQUIPPA SD All students 255 1.2 38.8 54.9 5.1Beaver 27 ALIQUIPPA SD Male 132 0.0 31.1 61.4 7.6Beaver 27 ALIQUIPPA SD Female 122 2.5 47.5 47.5 2.5Beaver 27 ALIQUIPPA SD White 43 0.0 51.2 46.5 2.3Beaver 27 ALIQUIPPA SD Black 208 1.0 37.0 56.3 5.8Beaver 27 ALIQUIPPA SD Hispanic 0Beaver 27 ALIQUIPPA SD Asian 0Beaver 27 ALIQUIPPA SD Native American 0Beaver 27 ALIQUIPPA SD Multi-ethnic 3Beaver 27 ALIQUIPPA SD IEP 46 0.0 8.7 71.7 19.6Beaver 27 ALIQUIPPA SD ELL 0Beaver 27 ALIQUIPPA SD Economically Disadvantaged 226 0.9 38.1 55.8 5.3Beaver 27 AMBRIDGE AREA SD All students 582 5.0 62.9 29.7 2.4Beaver 27 AMBRIDGE AREA SD Male 291 3.1 57.0 36.4 3.4Beaver 27 AMBRIDGE AREA SD Female 290 6.9 69.0 22.8 1.4Beaver 27 AMBRIDGE AREA SD White 498 5.8 66.1 26.7 1.4Beaver 27 AMBRIDGE AREA SD Black 70 0.0 44.3 47.1 8.6Beaver 27 AMBRIDGE AREA SD Hispanic 7Beaver 27 AMBRIDGE AREA SD Asian 1Beaver 27 AMBRIDGE AREA SD Native American 0Beaver 27 AMBRIDGE AREA SD Multi-ethnic 5Beaver 27 AMBRIDGE AREA SD IEP 103 0.0 33.0 56.3 10.7Beaver 27 AMBRIDGE AREA SD ELL 0Beaver 27 AMBRIDGE AREA SD Economically Disadvantaged 234 2.1 52.6 40.2 5.1
*Full Academic Year Students. Data for groups with less than 10 students assessed were replaced by blanks.Percentages were rounded to the nearest one-tenth.Proficiency percentages may not add up to 100 due to rounding. 22

The 2010 PSSA Writing District Level Proficiency Results - District Totals*
CountyIU
Number District Group
Number Scored Writing
% Advanced
Writing
% Proficient
Writing% Basic Writing
% Below Basic
WritingBeaver 27 BEAVER AREA SD All students 430 16.5 73.7 9.8 0.0Beaver 27 BEAVER AREA SD Male 233 11.2 73.4 15.5 0.0Beaver 27 BEAVER AREA SD Female 197 22.8 74.1 3.0 0.0Beaver 27 BEAVER AREA SD White 418 16.3 73.9 9.8 0.0Beaver 27 BEAVER AREA SD Black 7Beaver 27 BEAVER AREA SD Hispanic 1Beaver 27 BEAVER AREA SD Asian 3Beaver 27 BEAVER AREA SD Native American 1Beaver 27 BEAVER AREA SD Multi-ethnic 0Beaver 27 BEAVER AREA SD IEP 43 2.3 60.5 37.2 0.0Beaver 27 BEAVER AREA SD ELL 0Beaver 27 BEAVER AREA SD Economically Disadvantaged 54 9.3 72.2 18.5 0.0Beaver 27 BIG BEAVER FALLS AREA SD All students 334 3.6 76.3 18.6 1.5Beaver 27 BIG BEAVER FALLS AREA SD Male 173 2.9 71.7 23.1 2.3Beaver 27 BIG BEAVER FALLS AREA SD Female 161 4.3 81.4 13.7 0.6Beaver 27 BIG BEAVER FALLS AREA SD White 205 4.9 79.0 14.1 2.0Beaver 27 BIG BEAVER FALLS AREA SD Black 97 1.0 72.2 25.8 1.0Beaver 27 BIG BEAVER FALLS AREA SD Hispanic 2Beaver 27 BIG BEAVER FALLS AREA SD Asian 1Beaver 27 BIG BEAVER FALLS AREA SD Native American 1Beaver 27 BIG BEAVER FALLS AREA SD Multi-ethnic 28 3.6 78.6 17.9 0.0Beaver 27 BIG BEAVER FALLS AREA SD IEP 33 0.0 51.5 36.4 12.1Beaver 27 BIG BEAVER FALLS AREA SD ELL 0Beaver 27 BIG BEAVER FALLS AREA SD Economically Disadvantaged 214 1.9 73.4 23.4 1.4Beaver 27 BLACKHAWK SD All students 585 6.7 74.0 18.8 0.5Beaver 27 BLACKHAWK SD Male 307 3.3 74.3 21.8 0.7Beaver 27 BLACKHAWK SD Female 278 10.4 73.7 15.5 0.4Beaver 27 BLACKHAWK SD White 567 6.5 74.4 18.7 0.4Beaver 27 BLACKHAWK SD Black 7Beaver 27 BLACKHAWK SD Hispanic 1
*Full Academic Year Students. Data for groups with less than 10 students assessed were replaced by blanks.Percentages were rounded to the nearest one-tenth.Proficiency percentages may not add up to 100 due to rounding. 23

The 2010 PSSA Writing District Level Proficiency Results - District Totals*
CountyIU
Number District Group
Number Scored Writing
% Advanced
Writing
% Proficient
Writing% Basic Writing
% Below Basic
WritingBeaver 27 BLACKHAWK SD Asian 7Beaver 27 BLACKHAWK SD Native American 0Beaver 27 BLACKHAWK SD Multi-ethnic 3Beaver 27 BLACKHAWK SD IEP 41 0.0 53.7 41.5 4.9Beaver 27 BLACKHAWK SD ELL 0Beaver 27 BLACKHAWK SD Economically Disadvantaged 130 2.3 62.3 33.1 2.3Beaver 27 CENTRAL VALLEY SD All students 582 10.5 67.4 20.1 2.1Beaver 27 CENTRAL VALLEY SD Male 311 8.4 65.0 24.4 2.3Beaver 27 CENTRAL VALLEY SD Female 270 13.0 70.4 15.2 1.5Beaver 27 CENTRAL VALLEY SD White 538 11.0 67.5 19.9 1.7Beaver 27 CENTRAL VALLEY SD Black 37 0.0 70.3 24.3 5.4Beaver 27 CENTRAL VALLEY SD Hispanic 2Beaver 27 CENTRAL VALLEY SD Asian 4Beaver 27 CENTRAL VALLEY SD Native American 0Beaver 27 CENTRAL VALLEY SD Multi-ethnic 0Beaver 27 CENTRAL VALLEY SD IEP 49 2.0 28.6 53.1 16.3Beaver 27 CENTRAL VALLEY SD ELL 0Beaver 27 CENTRAL VALLEY SD Economically Disadvantaged 125 3.2 52.0 40.8 4.0Beaver 27 FREEDOM AREA SD All students 353 16.4 66.6 14.4 2.5Beaver 27 FREEDOM AREA SD Male 170 12.4 64.1 18.8 4.7Beaver 27 FREEDOM AREA SD Female 183 20.2 68.9 10.4 0.5Beaver 27 FREEDOM AREA SD White 340 16.8 65.9 14.7 2.6Beaver 27 FREEDOM AREA SD Black 11 0.0 90.9 9.1 0.0Beaver 27 FREEDOM AREA SD Hispanic 1Beaver 27 FREEDOM AREA SD Asian 0Beaver 27 FREEDOM AREA SD Native American 1Beaver 27 FREEDOM AREA SD Multi-ethnic 0Beaver 27 FREEDOM AREA SD IEP 33 0.0 36.4 39.4 24.2Beaver 27 FREEDOM AREA SD ELL 0Beaver 27 FREEDOM AREA SD Economically Disadvantaged 135 5.9 65.2 23.0 5.9
*Full Academic Year Students. Data for groups with less than 10 students assessed were replaced by blanks.Percentages were rounded to the nearest one-tenth.Proficiency percentages may not add up to 100 due to rounding. 24

The 2010 PSSA Writing District Level Proficiency Results - District Totals*
CountyIU
Number District Group
Number Scored Writing
% Advanced
Writing
% Proficient
Writing% Basic Writing
% Below Basic
WritingBeaver 27 HOPEWELL AREA SD All students 577 7.3 77.3 14.7 0.7Beaver 27 HOPEWELL AREA SD Male 293 5.8 74.4 18.4 1.4Beaver 27 HOPEWELL AREA SD Female 284 8.8 80.3 10.9 0.0Beaver 27 HOPEWELL AREA SD White 548 7.7 76.8 15.0 0.5Beaver 27 HOPEWELL AREA SD Black 14 0.0 92.9 0.0 7.1Beaver 27 HOPEWELL AREA SD Hispanic 7Beaver 27 HOPEWELL AREA SD Asian 6Beaver 27 HOPEWELL AREA SD Native American 0Beaver 27 HOPEWELL AREA SD Multi-ethnic 2Beaver 27 HOPEWELL AREA SD IEP 81 1.2 51.9 42.0 4.9Beaver 27 HOPEWELL AREA SD ELL 0Beaver 27 HOPEWELL AREA SD Economically Disadvantaged 141 2.1 75.2 20.6 2.1Beaver 27 MIDLAND BOROUGH SD All students 66 9.1 75.8 13.6 1.5Beaver 27 MIDLAND BOROUGH SD Male 31 3.2 74.2 19.4 3.2Beaver 27 MIDLAND BOROUGH SD Female 35 14.3 77.1 8.6 0.0Beaver 27 MIDLAND BOROUGH SD White 30 10.0 76.7 13.3 0.0Beaver 27 MIDLAND BOROUGH SD Black 23 13.0 69.6 17.4 0.0Beaver 27 MIDLAND BOROUGH SD Hispanic 6Beaver 27 MIDLAND BOROUGH SD Asian 1Beaver 27 MIDLAND BOROUGH SD Native American 0Beaver 27 MIDLAND BOROUGH SD Multi-ethnic 6Beaver 27 MIDLAND BOROUGH SD IEP 11 0.0 36.4 54.5 9.1Beaver 27 MIDLAND BOROUGH SD ELL 0Beaver 27 MIDLAND BOROUGH SD Economically Disadvantaged 38 7.9 68.4 21.1 2.6Beaver 27 NEW BRIGHTON AREA SD All students 389 10.3 68.4 20.1 1.3Beaver 27 NEW BRIGHTON AREA SD Male 213 6.1 68.1 23.9 1.9Beaver 27 NEW BRIGHTON AREA SD Female 176 15.3 68.8 15.3 0.6Beaver 27 NEW BRIGHTON AREA SD White 322 10.2 69.9 18.3 1.6Beaver 27 NEW BRIGHTON AREA SD Black 62 8.1 64.5 27.4 0.0Beaver 27 NEW BRIGHTON AREA SD Hispanic 3
*Full Academic Year Students. Data for groups with less than 10 students assessed were replaced by blanks.Percentages were rounded to the nearest one-tenth.Proficiency percentages may not add up to 100 due to rounding. 25

The 2010 PSSA Writing District Level Proficiency Results - District Totals*
CountyIU
Number District Group
Number Scored Writing
% Advanced
Writing
% Proficient
Writing% Basic Writing
% Below Basic
WritingBeaver 27 NEW BRIGHTON AREA SD Asian 0Beaver 27 NEW BRIGHTON AREA SD Native American 2Beaver 27 NEW BRIGHTON AREA SD Multi-ethnic 0Beaver 27 NEW BRIGHTON AREA SD IEP 41 0.0 29.3 61.0 9.8Beaver 27 NEW BRIGHTON AREA SD ELL 0Beaver 27 NEW BRIGHTON AREA SD Economically Disadvantaged 192 6.3 63.0 29.2 1.6Beaver 27 RIVERSIDE BEAVER COUNTY SAll students 366 10.9 79.2 9.0 0.8Beaver 27 RIVERSIDE BEAVER COUNTY SMale 175 6.9 78.9 13.7 0.6Beaver 27 RIVERSIDE BEAVER COUNTY SFemale 191 14.7 79.6 4.7 1.0Beaver 27 RIVERSIDE BEAVER COUNTY SWhite 358 10.9 79.1 9.2 0.8Beaver 27 RIVERSIDE BEAVER COUNTY SBlack 4Beaver 27 RIVERSIDE BEAVER COUNTY SHispanic 0Beaver 27 RIVERSIDE BEAVER COUNTY SAsian 2Beaver 27 RIVERSIDE BEAVER COUNTY SNative American 0Beaver 27 RIVERSIDE BEAVER COUNTY SMulti-ethnic 2Beaver 27 RIVERSIDE BEAVER COUNTY SIEP 53 0.0 50.9 43.4 5.7Beaver 27 RIVERSIDE BEAVER COUNTY SELL 0Beaver 27 RIVERSIDE BEAVER COUNTY SEconomically Disadvantaged 107 1.9 84.1 13.1 0.9Beaver 27 ROCHESTER AREA SD All students 201 8.0 76.6 14.9 0.5Beaver 27 ROCHESTER AREA SD Male 108 4.6 74.1 20.4 0.9Beaver 27 ROCHESTER AREA SD Female 93 11.8 79.6 8.6 0.0Beaver 27 ROCHESTER AREA SD White 158 9.5 73.4 16.5 0.6Beaver 27 ROCHESTER AREA SD Black 40 0.0 90.0 10.0 0.0Beaver 27 ROCHESTER AREA SD Hispanic 0Beaver 27 ROCHESTER AREA SD Asian 1Beaver 27 ROCHESTER AREA SD Native American 0Beaver 27 ROCHESTER AREA SD Multi-ethnic 0Beaver 27 ROCHESTER AREA SD IEP 30 3.3 46.7 50.0 0.0Beaver 27 ROCHESTER AREA SD ELL 0Beaver 27 ROCHESTER AREA SD Economically Disadvantaged 109 5.5 75.2 19.3 0.0
*Full Academic Year Students. Data for groups with less than 10 students assessed were replaced by blanks.Percentages were rounded to the nearest one-tenth.Proficiency percentages may not add up to 100 due to rounding. 26

The 2010 PSSA Writing District Level Proficiency Results - District Totals*
CountyIU
Number District Group
Number Scored Writing
% Advanced
Writing
% Proficient
Writing% Basic Writing
% Below Basic
WritingBeaver 27 SOUTH SIDE AREA SD All students 296 6.4 77.0 14.9 1.7Beaver 27 SOUTH SIDE AREA SD Male 144 2.1 74.3 20.1 3.5Beaver 27 SOUTH SIDE AREA SD Female 152 10.5 79.6 9.9 0.0Beaver 27 SOUTH SIDE AREA SD White 293 6.5 77.1 14.7 1.7Beaver 27 SOUTH SIDE AREA SD Black 0Beaver 27 SOUTH SIDE AREA SD Hispanic 0Beaver 27 SOUTH SIDE AREA SD Asian 0Beaver 27 SOUTH SIDE AREA SD Native American 0Beaver 27 SOUTH SIDE AREA SD Multi-ethnic 3Beaver 27 SOUTH SIDE AREA SD IEP 33 0.0 57.6 39.4 3.0Beaver 27 SOUTH SIDE AREA SD ELL 0Beaver 27 SOUTH SIDE AREA SD Economically Disadvantaged 97 2.1 72.2 22.7 3.1Beaver 27 WESTERN BEAVER COUNTY SAll students 184 6.5 75.5 17.9 0.0Beaver 27 WESTERN BEAVER COUNTY SMale 91 3.3 69.2 27.5 0.0Beaver 27 WESTERN BEAVER COUNTY SFemale 93 9.7 81.7 8.6 0.0Beaver 27 WESTERN BEAVER COUNTY SWhite 179 6.1 76.0 17.9 0.0Beaver 27 WESTERN BEAVER COUNTY SBlack 3Beaver 27 WESTERN BEAVER COUNTY SHispanic 0Beaver 27 WESTERN BEAVER COUNTY SAsian 0Beaver 27 WESTERN BEAVER COUNTY SNative American 0Beaver 27 WESTERN BEAVER COUNTY SMulti-ethnic 2Beaver 27 WESTERN BEAVER COUNTY SIEP 28 0.0 42.9 57.1 0.0Beaver 27 WESTERN BEAVER COUNTY SELL 0Beaver 27 WESTERN BEAVER COUNTY SEconomically Disadvantaged 78 2.6 73.1 24.4 0.0Bedford 8 BEDFORD AREA SD All students 489 4.5 59.5 32.3 3.7Bedford 8 BEDFORD AREA SD Male 254 1.6 51.2 40.9 6.3Bedford 8 BEDFORD AREA SD Female 235 7.7 68.5 23.0 0.9Bedford 8 BEDFORD AREA SD White 476 4.6 59.5 32.4 3.6Bedford 8 BEDFORD AREA SD Black 4Bedford 8 BEDFORD AREA SD Hispanic 5
*Full Academic Year Students. Data for groups with less than 10 students assessed were replaced by blanks.Percentages were rounded to the nearest one-tenth.Proficiency percentages may not add up to 100 due to rounding. 27

The 2010 PSSA Writing District Level Proficiency Results - District Totals*
CountyIU
Number District Group
Number Scored Writing
% Advanced
Writing
% Proficient
Writing% Basic Writing
% Below Basic
WritingBedford 8 BEDFORD AREA SD Asian 3Bedford 8 BEDFORD AREA SD Native American 1Bedford 8 BEDFORD AREA SD Multi-ethnic 0Bedford 8 BEDFORD AREA SD IEP 73 0.0 15.1 64.4 20.5Bedford 8 BEDFORD AREA SD ELL 1Bedford 8 BEDFORD AREA SD Economically Disadvantaged 190 2.6 46.8 43.2 7.4Bedford 8 CHESTNUT RIDGE SD All students 342 8.8 75.1 15.5 0.6Bedford 8 CHESTNUT RIDGE SD Male 176 5.1 73.3 21.0 0.6Bedford 8 CHESTNUT RIDGE SD Female 165 12.7 77.6 9.1 0.6Bedford 8 CHESTNUT RIDGE SD White 338 8.9 75.4 15.1 0.6Bedford 8 CHESTNUT RIDGE SD Black 2Bedford 8 CHESTNUT RIDGE SD Hispanic 0Bedford 8 CHESTNUT RIDGE SD Asian 1Bedford 8 CHESTNUT RIDGE SD Native American 0Bedford 8 CHESTNUT RIDGE SD Multi-ethnic 0Bedford 8 CHESTNUT RIDGE SD IEP 49 2.0 57.1 36.7 4.1Bedford 8 CHESTNUT RIDGE SD ELL 1Bedford 8 CHESTNUT RIDGE SD Economically Disadvantaged 145 4.8 76.6 17.9 0.7Bedford 8 EVERETT AREA SD All students 316 5.1 63.6 31.0 0.3Bedford 8 EVERETT AREA SD Male 166 3.6 58.4 37.3 0.6Bedford 8 EVERETT AREA SD Female 150 6.7 69.3 24.0 0.0Bedford 8 EVERETT AREA SD White 308 5.2 64.0 30.5 0.3Bedford 8 EVERETT AREA SD Black 5Bedford 8 EVERETT AREA SD Hispanic 2Bedford 8 EVERETT AREA SD Asian 1Bedford 8 EVERETT AREA SD Native American 0Bedford 8 EVERETT AREA SD Multi-ethnic 0Bedford 8 EVERETT AREA SD IEP 55 0.0 30.9 67.3 1.8Bedford 8 EVERETT AREA SD ELL 0Bedford 8 EVERETT AREA SD Economically Disadvantaged 133 5.3 53.4 41.4 0.0
*Full Academic Year Students. Data for groups with less than 10 students assessed were replaced by blanks.Percentages were rounded to the nearest one-tenth.Proficiency percentages may not add up to 100 due to rounding. 28

The 2010 PSSA Writing District Level Proficiency Results - District Totals*
CountyIU
Number District Group
Number Scored Writing
% Advanced
Writing
% Proficient
Writing% Basic Writing
% Below Basic
WritingBedford 8 NORTHERN BEDFORD COUNT All students 224 5.8 76.8 17.4 0.0Bedford 8 NORTHERN BEDFORD COUNT Male 117 4.3 70.9 24.8 0.0Bedford 8 NORTHERN BEDFORD COUNT Female 107 7.5 83.2 9.3 0.0Bedford 8 NORTHERN BEDFORD COUNT White 219 5.9 76.3 17.8 0.0Bedford 8 NORTHERN BEDFORD COUNT Black 0Bedford 8 NORTHERN BEDFORD COUNT Hispanic 1Bedford 8 NORTHERN BEDFORD COUNT Asian 1Bedford 8 NORTHERN BEDFORD COUNT Native American 0Bedford 8 NORTHERN BEDFORD COUNT Multi-ethnic 3Bedford 8 NORTHERN BEDFORD COUNT IEP 22 0.0 50.0 50.0 0.0Bedford 8 NORTHERN BEDFORD COUNT ELL 0Bedford 8 NORTHERN BEDFORD COUNT Economically Disadvantaged 74 2.7 81.1 16.2 0.0Bedford 8 TUSSEY MOUNTAIN SD All students 277 1.1 64.3 32.5 2.2Bedford 8 TUSSEY MOUNTAIN SD Male 149 1.3 59.1 36.2 3.4Bedford 8 TUSSEY MOUNTAIN SD Female 128 0.8 70.3 28.1 0.8Bedford 8 TUSSEY MOUNTAIN SD White 270 1.1 64.4 32.6 1.9Bedford 8 TUSSEY MOUNTAIN SD Black 6Bedford 8 TUSSEY MOUNTAIN SD Hispanic 1Bedford 8 TUSSEY MOUNTAIN SD Asian 0Bedford 8 TUSSEY MOUNTAIN SD Native American 0Bedford 8 TUSSEY MOUNTAIN SD Multi-ethnic 0Bedford 8 TUSSEY MOUNTAIN SD IEP 38 0.0 28.9 57.9 13.2Bedford 8 TUSSEY MOUNTAIN SD ELL 0Bedford 8 TUSSEY MOUNTAIN SD Economically Disadvantaged 136 0.0 55.9 40.4 3.7Berks 14 ANTIETAM SD All students 222 0.9 51.8 46.8 0.5Berks 14 ANTIETAM SD Male 123 1.6 37.4 60.2 0.8Berks 14 ANTIETAM SD Female 99 0.0 69.7 30.3 0.0Berks 14 ANTIETAM SD White 171 1.2 53.2 45.0 0.6Berks 14 ANTIETAM SD Black 16 0.0 50.0 50.0 0.0Berks 14 ANTIETAM SD Hispanic 34 0.0 47.1 52.9 0.0
*Full Academic Year Students. Data for groups with less than 10 students assessed were replaced by blanks.Percentages were rounded to the nearest one-tenth.Proficiency percentages may not add up to 100 due to rounding. 29

The 2010 PSSA Writing District Level Proficiency Results - District Totals*
CountyIU
Number District Group
Number Scored Writing
% Advanced
Writing
% Proficient
Writing% Basic Writing
% Below Basic
WritingBerks 14 ANTIETAM SD Asian 0Berks 14 ANTIETAM SD Native American 0Berks 14 ANTIETAM SD Multi-ethnic 1Berks 14 ANTIETAM SD IEP 24 0.0 16.7 83.3 0.0Berks 14 ANTIETAM SD ELL 11 0.0 36.4 63.6 0.0Berks 14 ANTIETAM SD Economically Disadvantaged 87 2.3 43.7 52.9 1.1Berks 14 BOYERTOWN AREA SD All students 1,649 9.6 68.8 20.6 1.0Berks 14 BOYERTOWN AREA SD Male 825 5.9 64.8 27.4 1.8Berks 14 BOYERTOWN AREA SD Female 824 13.3 72.7 13.8 0.1Berks 14 BOYERTOWN AREA SD White 1,582 9.7 68.7 20.7 0.9Berks 14 BOYERTOWN AREA SD Black 19 0.0 63.2 36.8 0.0Berks 14 BOYERTOWN AREA SD Hispanic 12 0.0 83.3 16.7 0.0Berks 14 BOYERTOWN AREA SD Asian 29 20.7 69.0 6.9 3.4Berks 14 BOYERTOWN AREA SD Native American 1Berks 14 BOYERTOWN AREA SD Multi-ethnic 6Berks 14 BOYERTOWN AREA SD IEP 269 1.5 41.6 52.8 4.1Berks 14 BOYERTOWN AREA SD ELL 2Berks 14 BOYERTOWN AREA SD Economically Disadvantaged 234 3.8 61.5 33.8 0.9Berks 14 BRANDYWINE HEIGHTS AREA All students 437 16.5 56.5 25.4 1.6Berks 14 BRANDYWINE HEIGHTS AREA Male 208 11.5 56.3 30.3 1.9Berks 14 BRANDYWINE HEIGHTS AREA Female 229 21.0 56.8 21.0 1.3Berks 14 BRANDYWINE HEIGHTS AREA White 421 16.4 57.0 24.9 1.7Berks 14 BRANDYWINE HEIGHTS AREA Black 5Berks 14 BRANDYWINE HEIGHTS AREA Hispanic 8Berks 14 BRANDYWINE HEIGHTS AREA Asian 2Berks 14 BRANDYWINE HEIGHTS AREA Native American 1Berks 14 BRANDYWINE HEIGHTS AREA Multi-ethnic 0Berks 14 BRANDYWINE HEIGHTS AREA IEP 81 2.5 37.0 51.9 8.6Berks 14 BRANDYWINE HEIGHTS AREA ELL 0Berks 14 BRANDYWINE HEIGHTS AREA Economically Disadvantaged 75 12.0 48.0 36.0 4.0
*Full Academic Year Students. Data for groups with less than 10 students assessed were replaced by blanks.Percentages were rounded to the nearest one-tenth.Proficiency percentages may not add up to 100 due to rounding. 30

The 2010 PSSA Writing District Level Proficiency Results - District Totals*
CountyIU
Number District Group
Number Scored Writing
% Advanced
Writing
% Proficient
Writing% Basic Writing
% Below Basic
WritingBerks 14 CONRAD WEISER AREA SD All students 653 3.8 62.2 32.0 2.0Berks 14 CONRAD WEISER AREA SD Male 336 1.8 55.7 38.7 3.9Berks 14 CONRAD WEISER AREA SD Female 317 6.0 69.1 24.9 0.0Berks 14 CONRAD WEISER AREA SD White 575 4.2 63.1 30.6 2.1Berks 14 CONRAD WEISER AREA SD Black 31 3.2 58.1 35.5 3.2Berks 14 CONRAD WEISER AREA SD Hispanic 40 0.0 50.0 50.0 0.0Berks 14 CONRAD WEISER AREA SD Asian 3Berks 14 CONRAD WEISER AREA SD Native American 1Berks 14 CONRAD WEISER AREA SD Multi-ethnic 3Berks 14 CONRAD WEISER AREA SD IEP 139 1.4 33.8 55.4 9.4Berks 14 CONRAD WEISER AREA SD ELL 5Berks 14 CONRAD WEISER AREA SD Economically Disadvantaged 180 2.2 50.6 44.4 2.8Berks 14 DANIEL BOONE AREA SD All students 871 5.6 64.5 26.9 3.0Berks 14 DANIEL BOONE AREA SD Male 474 4.0 57.0 34.8 4.2Berks 14 DANIEL BOONE AREA SD Female 392 7.7 73.5 17.3 1.5Berks 14 DANIEL BOONE AREA SD White 769 6.0 64.0 27.0 3.0Berks 14 DANIEL BOONE AREA SD Black 55 3.6 72.7 20.0 3.6Berks 14 DANIEL BOONE AREA SD Hispanic 23 4.3 52.2 39.1 4.3Berks 14 DANIEL BOONE AREA SD Asian 17 0.0 76.5 23.5 0.0Berks 14 DANIEL BOONE AREA SD Native American 1Berks 14 DANIEL BOONE AREA SD Multi-ethnic 0Berks 14 DANIEL BOONE AREA SD IEP 112 0.9 32.1 51.8 15.2Berks 14 DANIEL BOONE AREA SD ELL 3Berks 14 DANIEL BOONE AREA SD Economically Disadvantaged 143 1.4 46.2 43.4 9.1Berks 14 EXETER TOWNSHIP SD All students 975 6.9 74.6 18.3 0.3Berks 14 EXETER TOWNSHIP SD Male 515 5.4 70.3 23.9 0.4Berks 14 EXETER TOWNSHIP SD Female 459 8.5 79.5 12.0 0.0Berks 14 EXETER TOWNSHIP SD White 872 7.2 74.4 18.2 0.1Berks 14 EXETER TOWNSHIP SD Black 47 2.1 78.7 19.1 0.0Berks 14 EXETER TOWNSHIP SD Hispanic 37 2.7 70.3 24.3 2.7
*Full Academic Year Students. Data for groups with less than 10 students assessed were replaced by blanks.Percentages were rounded to the nearest one-tenth.Proficiency percentages may not add up to 100 due to rounding. 31

The 2010 PSSA Writing District Level Proficiency Results - District Totals*
CountyIU
Number District Group
Number Scored Writing
% Advanced
Writing
% Proficient
Writing% Basic Writing
% Below Basic
WritingBerks 14 EXETER TOWNSHIP SD Asian 16 12.5 81.3 6.3 0.0Berks 14 EXETER TOWNSHIP SD Native American 2Berks 14 EXETER TOWNSHIP SD Multi-ethnic 0Berks 14 EXETER TOWNSHIP SD IEP 195 3.1 54.4 41.0 1.5Berks 14 EXETER TOWNSHIP SD ELL 2Berks 14 EXETER TOWNSHIP SD Economically Disadvantaged 170 1.2 67.1 31.2 0.6Berks 14 FLEETWOOD AREA SD All students 597 10.2 71.4 17.3 1.2Berks 14 FLEETWOOD AREA SD Male 305 6.6 70.5 21.3 1.6Berks 14 FLEETWOOD AREA SD Female 292 14.0 72.3 13.0 0.7Berks 14 FLEETWOOD AREA SD White 531 10.5 72.3 15.8 1.3Berks 14 FLEETWOOD AREA SD Black 16 12.5 68.8 18.8 0.0Berks 14 FLEETWOOD AREA SD Hispanic 37 5.4 56.8 37.8 0.0Berks 14 FLEETWOOD AREA SD Asian 13 7.7 76.9 15.4 0.0Berks 14 FLEETWOOD AREA SD Native American 0Berks 14 FLEETWOOD AREA SD Multi-ethnic 0Berks 14 FLEETWOOD AREA SD IEP 85 0.0 44.7 48.2 7.1Berks 14 FLEETWOOD AREA SD ELL 9Berks 14 FLEETWOOD AREA SD Economically Disadvantaged 110 9.1 66.4 22.7 1.8Berks 14 GOVERNOR MIFFLIN SD All students 925 7.8 65.4 25.5 1.3Berks 14 GOVERNOR MIFFLIN SD Male 499 5.2 57.3 35.3 2.2Berks 14 GOVERNOR MIFFLIN SD Female 426 10.8 74.9 14.1 0.2Berks 14 GOVERNOR MIFFLIN SD White 764 8.4 66.4 24.1 1.2Berks 14 GOVERNOR MIFFLIN SD Black 59 8.5 66.1 25.4 0.0Berks 14 GOVERNOR MIFFLIN SD Hispanic 82 2.4 52.4 41.5 3.7Berks 14 GOVERNOR MIFFLIN SD Asian 20 5.0 80.0 15.0 0.0Berks 14 GOVERNOR MIFFLIN SD Native American 0Berks 14 GOVERNOR MIFFLIN SD Multi-ethnic 0Berks 14 GOVERNOR MIFFLIN SD IEP 164 1.2 40.2 52.4 6.1Berks 14 GOVERNOR MIFFLIN SD ELL 3Berks 14 GOVERNOR MIFFLIN SD Economically Disadvantaged 193 5.2 63.2 30.1 1.6
*Full Academic Year Students. Data for groups with less than 10 students assessed were replaced by blanks.Percentages were rounded to the nearest one-tenth.Proficiency percentages may not add up to 100 due to rounding. 32

The 2010 PSSA Writing District Level Proficiency Results - District Totals*
CountyIU
Number District Group
Number Scored Writing
% Advanced
Writing
% Proficient
Writing% Basic Writing
% Below Basic
WritingBerks 14 HAMBURG AREA SD All students 593 13.3 63.4 21.2 2.0Berks 14 HAMBURG AREA SD Male 305 12.1 59.7 25.6 2.6Berks 14 HAMBURG AREA SD Female 286 14.7 67.8 16.4 1.0Berks 14 HAMBURG AREA SD White 553 13.7 64.0 20.6 1.6Berks 14 HAMBURG AREA SD Black 11 18.2 36.4 36.4 9.1Berks 14 HAMBURG AREA SD Hispanic 25 0.0 68.0 28.0 4.0Berks 14 HAMBURG AREA SD Asian 2Berks 14 HAMBURG AREA SD Native American 0Berks 14 HAMBURG AREA SD Multi-ethnic 0Berks 14 HAMBURG AREA SD IEP 86 2.3 34.9 52.3 10.5Berks 14 HAMBURG AREA SD ELL 4Berks 14 HAMBURG AREA SD Economically Disadvantaged 170 8.2 55.3 33.5 2.9Berks 14 KUTZTOWN AREA SD All students 389 6.9 60.2 30.8 2.1Berks 14 KUTZTOWN AREA SD Male 189 4.8 49.7 41.8 3.7Berks 14 KUTZTOWN AREA SD Female 200 9.0 70.0 20.5 0.5Berks 14 KUTZTOWN AREA SD White 370 7.0 60.5 30.3 2.2Berks 14 KUTZTOWN AREA SD Black 7Berks 14 KUTZTOWN AREA SD Hispanic 9Berks 14 KUTZTOWN AREA SD Asian 3Berks 14 KUTZTOWN AREA SD Native American 0Berks 14 KUTZTOWN AREA SD Multi-ethnic 0Berks 14 KUTZTOWN AREA SD IEP 79 0.0 26.6 65.8 7.6Berks 14 KUTZTOWN AREA SD ELL 0Berks 14 KUTZTOWN AREA SD Economically Disadvantaged 62 1.6 43.5 50.0 4.8Berks 14 MUHLENBERG SD All students 812 8.7 60.0 30.3 1.0Berks 14 MUHLENBERG SD Male 405 6.4 55.1 37.0 1.5Berks 14 MUHLENBERG SD Female 407 11.1 64.9 23.6 0.5Berks 14 MUHLENBERG SD White 548 10.6 59.9 28.5 1.1Berks 14 MUHLENBERG SD Black 54 7.4 53.7 38.9 0.0Berks 14 MUHLENBERG SD Hispanic 186 3.2 60.8 34.9 1.1
*Full Academic Year Students. Data for groups with less than 10 students assessed were replaced by blanks.Percentages were rounded to the nearest one-tenth.Proficiency percentages may not add up to 100 due to rounding. 33

The 2010 PSSA Writing District Level Proficiency Results - District Totals*
CountyIU
Number District Group
Number Scored Writing
% Advanced
Writing
% Proficient
Writing% Basic Writing
% Below Basic
WritingBerks 14 MUHLENBERG SD Asian 20 10.0 75.0 15.0 0.0Berks 14 MUHLENBERG SD Native American 0Berks 14 MUHLENBERG SD Multi-ethnic 4Berks 14 MUHLENBERG SD IEP 137 0.0 38.7 55.5 5.8Berks 14 MUHLENBERG SD ELL 19 0.0 42.1 57.9 0.0Berks 14 MUHLENBERG SD Economically Disadvantaged 318 5.0 57.2 36.2 1.6Berks 14 OLEY VALLEY SD All students 443 8.1 67.7 23.5 0.7Berks 14 OLEY VALLEY SD Male 250 6.0 60.4 32.4 1.2Berks 14 OLEY VALLEY SD Female 193 10.9 77.2 11.9 0.0Berks 14 OLEY VALLEY SD White 427 8.4 67.2 23.7 0.7Berks 14 OLEY VALLEY SD Black 4Berks 14 OLEY VALLEY SD Hispanic 5Berks 14 OLEY VALLEY SD Asian 7Berks 14 OLEY VALLEY SD Native American 0Berks 14 OLEY VALLEY SD Multi-ethnic 0Berks 14 OLEY VALLEY SD IEP 57 1.8 22.8 70.2 5.3Berks 14 OLEY VALLEY SD ELL 2Berks 14 OLEY VALLEY SD Economically Disadvantaged 71 1.4 60.6 36.6 1.4Berks 14 READING SD All students 3,145 2.6 45.8 46.3 5.3Berks 14 READING SD Male 1,600 1.4 37.9 52.6 8.1Berks 14 READING SD Female 1,542 3.8 54.0 39.8 2.5Berks 14 READING SD White 327 6.4 53.5 37.3 2.8Berks 14 READING SD Black 383 3.7 50.4 42.6 3.4Berks 14 READING SD Hispanic 2,414 1.9 43.8 48.3 6.0Berks 14 READING SD Asian 14 0.0 78.6 21.4 0.0Berks 14 READING SD Native American 0Berks 14 READING SD Multi-ethnic 4Berks 14 READING SD IEP 579 0.5 16.1 64.2 19.2Berks 14 READING SD ELL 472 0.2 25.2 62.3 12.3Berks 14 READING SD Economically Disadvantaged 2,879 2.3 44.7 47.4 5.6
*Full Academic Year Students. Data for groups with less than 10 students assessed were replaced by blanks.Percentages were rounded to the nearest one-tenth.Proficiency percentages may not add up to 100 due to rounding. 34

The 2010 PSSA Writing District Level Proficiency Results - District Totals*
CountyIU
Number District Group
Number Scored Writing
% Advanced
Writing
% Proficient
Writing% Basic Writing
% Below Basic
WritingBerks 14 SCHUYLKILL VALLEY SD All students 469 13.2 72.3 13.9 0.6Berks 14 SCHUYLKILL VALLEY SD Male 253 7.5 72.3 19.0 1.2Berks 14 SCHUYLKILL VALLEY SD Female 216 19.9 72.2 7.9 0.0Berks 14 SCHUYLKILL VALLEY SD White 433 13.6 72.1 13.6 0.7Berks 14 SCHUYLKILL VALLEY SD Black 13 7.7 84.6 7.7 0.0Berks 14 SCHUYLKILL VALLEY SD Hispanic 20 5.0 70.0 25.0 0.0Berks 14 SCHUYLKILL VALLEY SD Asian 3Berks 14 SCHUYLKILL VALLEY SD Native American 0Berks 14 SCHUYLKILL VALLEY SD Multi-ethnic 0Berks 14 SCHUYLKILL VALLEY SD IEP 74 2.7 54.1 39.2 4.1Berks 14 SCHUYLKILL VALLEY SD ELL 3Berks 14 SCHUYLKILL VALLEY SD Economically Disadvantaged 68 5.9 70.6 22.1 1.5Berks 14 TULPEHOCKEN AREA SD All students 358 7.0 69.3 22.1 1.7Berks 14 TULPEHOCKEN AREA SD Male 187 4.8 61.5 31.0 2.7Berks 14 TULPEHOCKEN AREA SD Female 171 9.4 77.8 12.3 0.6Berks 14 TULPEHOCKEN AREA SD White 315 7.9 70.5 20.3 1.3Berks 14 TULPEHOCKEN AREA SD Black 10 0.0 70.0 20.0 10.0Berks 14 TULPEHOCKEN AREA SD Hispanic 32 0.0 56.3 40.6 3.1Berks 14 TULPEHOCKEN AREA SD Asian 1Berks 14 TULPEHOCKEN AREA SD Native American 0Berks 14 TULPEHOCKEN AREA SD Multi-ethnic 0Berks 14 TULPEHOCKEN AREA SD IEP 53 1.9 32.1 58.5 7.5Berks 14 TULPEHOCKEN AREA SD ELL 9Berks 14 TULPEHOCKEN AREA SD Economically Disadvantaged 82 4.9 57.3 34.1 3.7Berks 14 TWIN VALLEY SD All students 739 8.1 66.0 24.2 1.6Berks 14 TWIN VALLEY SD Male 373 6.2 59.0 31.9 2.9Berks 14 TWIN VALLEY SD Female 366 10.1 73.2 16.4 0.3Berks 14 TWIN VALLEY SD White 713 8.3 66.6 23.7 1.4Berks 14 TWIN VALLEY SD Black 8Berks 14 TWIN VALLEY SD Hispanic 11 0.0 36.4 54.5 9.1
*Full Academic Year Students. Data for groups with less than 10 students assessed were replaced by blanks.Percentages were rounded to the nearest one-tenth.Proficiency percentages may not add up to 100 due to rounding. 35
The 2010 PSSA Writing District Level Proficiency Results - District Totals*
CountyIU
Number District Group
Number Scored Writing
% Advanced
Writing
% Proficient
Writing% Basic Writing
% Below Basic
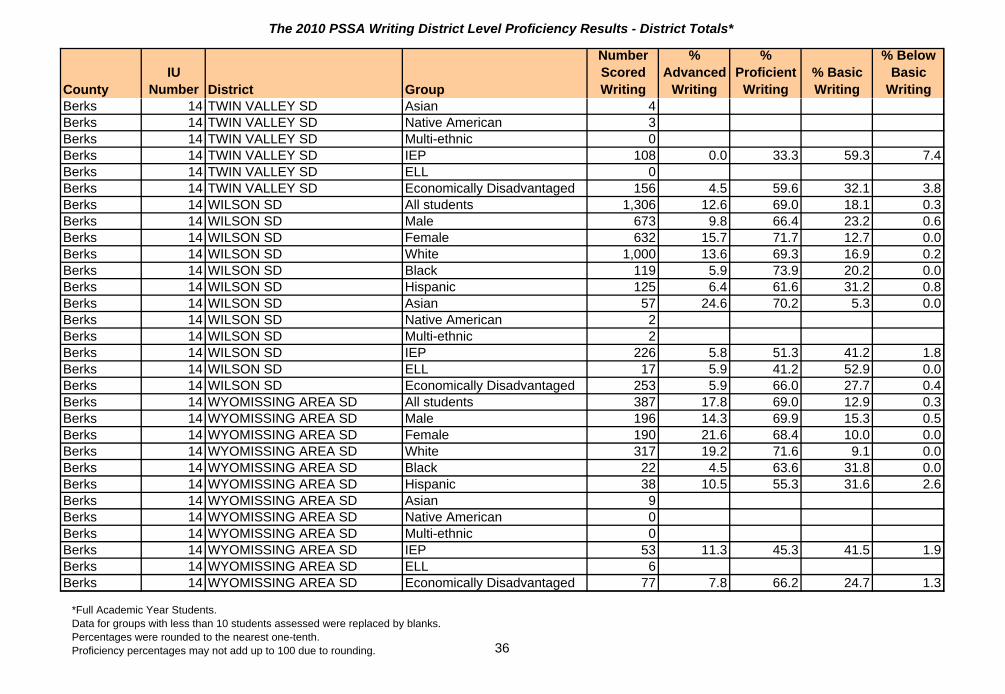
WritingBerks 14 TWIN VALLEY SD Asian 4Berks 14 TWIN VALLEY SD Native American 3Berks 14 TWIN VALLEY SD Multi-ethnic 0Berks 14 TWIN VALLEY SD IEP 108 0.0 33.3 59.3 7.4Berks 14 TWIN VALLEY SD ELL 0Berks 14 TWIN VALLEY SD Economically Disadvantaged 156 4.5 59.6 32.1 3.8Berks 14 WILSON SD All students 1,306 12.6 69.0 18.1 0.3Berks 14 WILSON SD Male 673 9.8 66.4 23.2 0.6Berks 14 WILSON SD Female 632 15.7 71.7 12.7 0.0Berks 14 WILSON SD White 1,000 13.6 69.3 16.9 0.2Berks 14 WILSON SD Black 119 5.9 73.9 20.2 0.0Berks 14 WILSON SD Hispanic 125 6.4 61.6 31.2 0.8Berks 14 WILSON SD Asian 57 24.6 70.2 5.3 0.0Berks 14 WILSON SD Native American 2Berks 14 WILSON SD Multi-ethnic 2Berks 14 WILSON SD IEP 226 5.8 51.3 41.2 1.8Berks 14 WILSON SD ELL 17 5.9 41.2 52.9 0.0Berks 14 WILSON SD Economically Disadvantaged 253 5.9 66.0 27.7 0.4Berks 14 WYOMISSING AREA SD All students 387 17.8 69.0 12.9 0.3Berks 14 WYOMISSING AREA SD Male 196 14.3 69.9 15.3 0.5Berks 14 WYOMISSING AREA SD Female 190 21.6 68.4 10.0 0.0Berks 14 WYOMISSING AREA SD White 317 19.2 71.6 9.1 0.0Berks 14 WYOMISSING AREA SD Black 22 4.5 63.6 31.8 0.0Berks 14 WYOMISSING AREA SD Hispanic 38 10.5 55.3 31.6 2.6Berks 14 WYOMISSING AREA SD Asian 9Berks 14 WYOMISSING AREA SD Native American 0Berks 14 WYOMISSING AREA SD Multi-ethnic 0Berks 14 WYOMISSING AREA SD IEP 53 11.3 45.3 41.5 1.9Berks 14 WYOMISSING AREA SD ELL 6Berks 14 WYOMISSING AREA SD Economically Disadvantaged 77 7.8 66.2 24.7 1.3
*Full Academic Year Students. Data for groups with less than 10 students assessed were replaced by blanks.Percentages were rounded to the nearest one-tenth.Proficiency percentages may not add up to 100 due to rounding. 36

The 2010 PSSA Writing District Level Proficiency Results - District Totals*
CountyIU
Number District Group
Number Scored Writing
% Advanced
Writing
% Proficient
Writing% Basic Writing
% Below Basic
WritingBlair 8 ALTOONA AREA SD All students 1,724 15.2 66.9 16.4 1.6Blair 8 ALTOONA AREA SD Male 850 11.8 64.4 21.6 2.2Blair 8 ALTOONA AREA SD Female 874 18.5 69.3 11.2 0.9Blair 8 ALTOONA AREA SD White 1,594 15.6 67.3 15.6 1.5Blair 8 ALTOONA AREA SD Black 106 10.4 64.2 23.6 1.9Blair 8 ALTOONA AREA SD Hispanic 16 6.3 56.3 31.3 6.3Blair 8 ALTOONA AREA SD Asian 5Blair 8 ALTOONA AREA SD Native American 1Blair 8 ALTOONA AREA SD Multi-ethnic 2Blair 8 ALTOONA AREA SD IEP 349 1.7 50.7 40.4 7.2Blair 8 ALTOONA AREA SD ELL 2Blair 8 ALTOONA AREA SD Economically Disadvantaged 883 8.9 65.5 23.1 2.5Blair 8 BELLWOOD-ANTIS SD All students 283 15.2 71.7 12.7 0.4Blair 8 BELLWOOD-ANTIS SD Male 137 12.4 72.3 15.3 0.0Blair 8 BELLWOOD-ANTIS SD Female 146 17.8 71.2 10.3 0.7Blair 8 BELLWOOD-ANTIS SD White 279 15.1 72.0 12.5 0.4Blair 8 BELLWOOD-ANTIS SD Black 2Blair 8 BELLWOOD-ANTIS SD Hispanic 1Blair 8 BELLWOOD-ANTIS SD Asian 1Blair 8 BELLWOOD-ANTIS SD Native American 0Blair 8 BELLWOOD-ANTIS SD Multi-ethnic 0Blair 8 BELLWOOD-ANTIS SD IEP 18 0.0 38.9 55.6 5.6Blair 8 BELLWOOD-ANTIS SD ELL 1Blair 8 BELLWOOD-ANTIS SD Economically Disadvantaged 84 7.1 73.8 19.0 0.0Blair 8 CLAYSBURG-KIMMEL SD All students 216 1.9 49.5 45.4 3.2Blair 8 CLAYSBURG-KIMMEL SD Male 105 0.0 43.8 52.4 3.8Blair 8 CLAYSBURG-KIMMEL SD Female 110 3.6 55.5 38.2 2.7Blair 8 CLAYSBURG-KIMMEL SD White 211 1.9 50.2 45.0 2.8Blair 8 CLAYSBURG-KIMMEL SD Black 4Blair 8 CLAYSBURG-KIMMEL SD Hispanic 0
*Full Academic Year Students. Data for groups with less than 10 students assessed were replaced by blanks.Percentages were rounded to the nearest one-tenth.Proficiency percentages may not add up to 100 due to rounding. 37

The 2010 PSSA Writing District Level Proficiency Results - District Totals*
CountyIU
Number District Group
Number Scored Writing
% Advanced
Writing
% Proficient
Writing% Basic Writing
% Below Basic
WritingBlair 8 CLAYSBURG-KIMMEL SD Asian 0Blair 8 CLAYSBURG-KIMMEL SD Native American 0Blair 8 CLAYSBURG-KIMMEL SD Multi-ethnic 0Blair 8 CLAYSBURG-KIMMEL SD IEP 36 2.8 36.1 44.4 16.7Blair 8 CLAYSBURG-KIMMEL SD ELL 0Blair 8 CLAYSBURG-KIMMEL SD Economically Disadvantaged 115 3.5 43.5 49.6 3.5Blair 8 HOLLIDAYSBURG AREA SD All students 875 11.3 64.1 22.5 2.1Blair 8 HOLLIDAYSBURG AREA SD Male 432 7.2 59.3 30.3 3.2Blair 8 HOLLIDAYSBURG AREA SD Female 443 15.3 68.8 14.9 0.9Blair 8 HOLLIDAYSBURG AREA SD White 851 10.8 64.5 22.6 2.1Blair 8 HOLLIDAYSBURG AREA SD Black 9Blair 8 HOLLIDAYSBURG AREA SD Hispanic 6Blair 8 HOLLIDAYSBURG AREA SD Asian 7Blair 8 HOLLIDAYSBURG AREA SD Native American 2Blair 8 HOLLIDAYSBURG AREA SD Multi-ethnic 0Blair 8 HOLLIDAYSBURG AREA SD IEP 96 0.0 33.3 53.1 13.5Blair 8 HOLLIDAYSBURG AREA SD ELL 1Blair 8 HOLLIDAYSBURG AREA SD Economically Disadvantaged 232 5.2 55.6 33.6 5.6Blair 8 SPRING COVE SD All students 408 7.1 71.6 19.6 1.7Blair 8 SPRING COVE SD Male 216 4.2 65.3 27.3 3.2Blair 8 SPRING COVE SD Female 192 10.4 78.6 10.9 0.0Blair 8 SPRING COVE SD White 400 7.3 71.5 19.5 1.8Blair 8 SPRING COVE SD Black 4Blair 8 SPRING COVE SD Hispanic 0Blair 8 SPRING COVE SD Asian 2Blair 8 SPRING COVE SD Native American 0Blair 8 SPRING COVE SD Multi-ethnic 2Blair 8 SPRING COVE SD IEP 78 0.0 37.2 53.8 9.0Blair 8 SPRING COVE SD ELL 1Blair 8 SPRING COVE SD Economically Disadvantaged 142 2.8 62.7 33.1 1.4
*Full Academic Year Students. Data for groups with less than 10 students assessed were replaced by blanks.Percentages were rounded to the nearest one-tenth.Proficiency percentages may not add up to 100 due to rounding. 38

The 2010 PSSA Writing District Level Proficiency Results - District Totals*
CountyIU
Number District Group
Number Scored Writing
% Advanced
Writing
% Proficient
Writing% Basic Writing
% Below Basic
WritingBlair 8 TYRONE AREA SD All students 364 34.9 53.0 10.4 1.6Blair 8 TYRONE AREA SD Male 189 34.9 50.8 11.6 2.6Blair 8 TYRONE AREA SD Female 175 34.9 55.4 9.1 0.6Blair 8 TYRONE AREA SD White 352 35.5 52.8 9.9 1.7Blair 8 TYRONE AREA SD Black 7Blair 8 TYRONE AREA SD Hispanic 1Blair 8 TYRONE AREA SD Asian 2Blair 8 TYRONE AREA SD Native American 0Blair 8 TYRONE AREA SD Multi-ethnic 2Blair 8 TYRONE AREA SD IEP 73 16.4 46.6 28.8 8.2Blair 8 TYRONE AREA SD ELL 0Blair 8 TYRONE AREA SD Economically Disadvantaged 141 27.0 51.8 19.1 2.1Blair 8 WILLIAMSBURG COMMUNITY SAll students 135 5.9 53.3 38.5 2.2Blair 8 WILLIAMSBURG COMMUNITY SMale 72 1.4 44.4 50.0 4.2Blair 8 WILLIAMSBURG COMMUNITY SFemale 63 11.1 63.5 25.4 0.0Blair 8 WILLIAMSBURG COMMUNITY SWhite 131 6.1 52.7 38.9 2.3Blair 8 WILLIAMSBURG COMMUNITY SBlack 3Blair 8 WILLIAMSBURG COMMUNITY SHispanic 1Blair 8 WILLIAMSBURG COMMUNITY SAsian 0Blair 8 WILLIAMSBURG COMMUNITY SNative American 0Blair 8 WILLIAMSBURG COMMUNITY SMulti-ethnic 0Blair 8 WILLIAMSBURG COMMUNITY SIEP 35 0.0 40.0 57.1 2.9Blair 8 WILLIAMSBURG COMMUNITY SELL 0Blair 8 WILLIAMSBURG COMMUNITY SEconomically Disadvantaged 57 7.0 52.6 35.1 5.3Bradford 17 ATHENS AREA SD All students 459 5.4 60.1 32.0 2.4Bradford 17 ATHENS AREA SD Male 222 1.4 51.4 43.2 4.1Bradford 17 ATHENS AREA SD Female 237 9.3 68.4 21.5 0.8Bradford 17 ATHENS AREA SD White 445 5.2 60.2 32.1 2.5Bradford 17 ATHENS AREA SD Black 6Bradford 17 ATHENS AREA SD Hispanic 4
*Full Academic Year Students. Data for groups with less than 10 students assessed were replaced by blanks.Percentages were rounded to the nearest one-tenth.Proficiency percentages may not add up to 100 due to rounding. 39

The 2010 PSSA Writing District Level Proficiency Results - District Totals*
CountyIU
Number District Group
Number Scored Writing
% Advanced
Writing
% Proficient
Writing% Basic Writing
% Below Basic
WritingBradford 17 ATHENS AREA SD Asian 4Bradford 17 ATHENS AREA SD Native American 0Bradford 17 ATHENS AREA SD Multi-ethnic 0Bradford 17 ATHENS AREA SD IEP 97 2.1 33.0 55.7 9.3Bradford 17 ATHENS AREA SD ELL 1Bradford 17 ATHENS AREA SD Economically Disadvantaged 173 2.3 52.0 41.0 4.6Bradford 17 CANTON AREA SD All students 230 0.4 70.0 26.1 3.5Bradford 17 CANTON AREA SD Male 118 0.0 56.8 36.4 6.8Bradford 17 CANTON AREA SD Female 112 0.9 83.9 15.2 0.0Bradford 17 CANTON AREA SD White 229 0.4 69.9 26.2 3.5Bradford 17 CANTON AREA SD Black 1Bradford 17 CANTON AREA SD Hispanic 0Bradford 17 CANTON AREA SD Asian 0Bradford 17 CANTON AREA SD Native American 0Bradford 17 CANTON AREA SD Multi-ethnic 0Bradford 17 CANTON AREA SD IEP 44 0.0 34.1 52.3 13.6Bradford 17 CANTON AREA SD ELL 0Bradford 17 CANTON AREA SD Economically Disadvantaged 104 0.0 71.2 26.0 2.9Bradford 17 NORTHEAST BRADFORD SD All students 183 2.7 55.7 38.3 3.3Bradford 17 NORTHEAST BRADFORD SD Male 93 3.2 47.3 44.1 5.4Bradford 17 NORTHEAST BRADFORD SD Female 89 2.2 65.2 31.5 1.1Bradford 17 NORTHEAST BRADFORD SD White 179 2.8 55.9 38.0 3.4Bradford 17 NORTHEAST BRADFORD SD Black 2Bradford 17 NORTHEAST BRADFORD SD Hispanic 0Bradford 17 NORTHEAST BRADFORD SD Asian 0Bradford 17 NORTHEAST BRADFORD SD Native American 1Bradford 17 NORTHEAST BRADFORD SD Multi-ethnic 0Bradford 17 NORTHEAST BRADFORD SD IEP 24 0.0 29.2 62.5 8.3Bradford 17 NORTHEAST BRADFORD SD ELL 0Bradford 17 NORTHEAST BRADFORD SD Economically Disadvantaged 65 0.0 43.1 49.2 7.7
*Full Academic Year Students. Data for groups with less than 10 students assessed were replaced by blanks.Percentages were rounded to the nearest one-tenth.Proficiency percentages may not add up to 100 due to rounding. 40

The 2010 PSSA Writing District Level Proficiency Results - District Totals*
CountyIU
Number District Group
Number Scored Writing
% Advanced
Writing
% Proficient
Writing% Basic Writing
% Below Basic
WritingBradford 17 SAYRE AREA SD All students 252 7.1 69.4 21.4 2.0Bradford 17 SAYRE AREA SD Male 118 2.5 61.0 33.1 3.4Bradford 17 SAYRE AREA SD Female 134 11.2 76.9 11.2 0.7Bradford 17 SAYRE AREA SD White 236 7.2 69.9 21.6 1.3Bradford 17 SAYRE AREA SD Black 7Bradford 17 SAYRE AREA SD Hispanic 2Bradford 17 SAYRE AREA SD Asian 5Bradford 17 SAYRE AREA SD Native American 1Bradford 17 SAYRE AREA SD Multi-ethnic 1Bradford 17 SAYRE AREA SD IEP 33 3.0 51.5 36.4 9.1Bradford 17 SAYRE AREA SD ELL 0Bradford 17 SAYRE AREA SD Economically Disadvantaged 103 5.8 63.1 27.2 3.9Bradford 17 TOWANDA AREA SD All students 358 4.7 58.9 33.2 3.1Bradford 17 TOWANDA AREA SD Male 187 3.2 51.3 40.1 5.3Bradford 17 TOWANDA AREA SD Female 171 6.4 67.3 25.7 0.6Bradford 17 TOWANDA AREA SD White 346 4.6 58.4 33.8 3.2Bradford 17 TOWANDA AREA SD Black 4Bradford 17 TOWANDA AREA SD Hispanic 2Bradford 17 TOWANDA AREA SD Asian 5Bradford 17 TOWANDA AREA SD Native American 0Bradford 17 TOWANDA AREA SD Multi-ethnic 1Bradford 17 TOWANDA AREA SD IEP 41 0.0 22.0 73.2 4.9Bradford 17 TOWANDA AREA SD ELL 3Bradford 17 TOWANDA AREA SD Economically Disadvantaged 151 1.3 52.3 41.1 5.3Bradford 17 TROY AREA SD All students 326 5.8 66.9 25.5 1.8Bradford 17 TROY AREA SD Male 183 3.3 59.6 33.9 3.3Bradford 17 TROY AREA SD Female 143 9.1 76.2 14.7 0.0Bradford 17 TROY AREA SD White 317 5.7 66.6 25.9 1.9Bradford 17 TROY AREA SD Black 4Bradford 17 TROY AREA SD Hispanic 3
*Full Academic Year Students. Data for groups with less than 10 students assessed were replaced by blanks.Percentages were rounded to the nearest one-tenth.Proficiency percentages may not add up to 100 due to rounding. 41
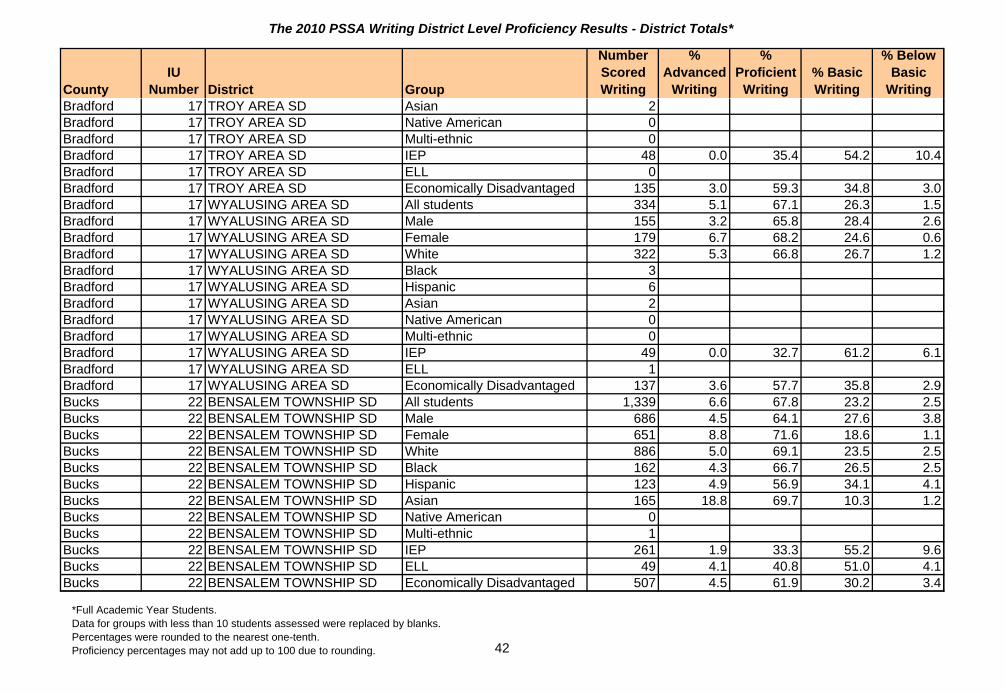
The 2010 PSSA Writing District Level Proficiency Results - District Totals*
CountyIU
Number District Group
Number Scored Writing
% Advanced
Writing
% Proficient
Writing% Basic Writing
% Below Basic
WritingBradford 17 TROY AREA SD Asian 2Bradford 17 TROY AREA SD Native American 0Bradford 17 TROY AREA SD Multi-ethnic 0Bradford 17 TROY AREA SD IEP 48 0.0 35.4 54.2 10.4Bradford 17 TROY AREA SD ELL 0Bradford 17 TROY AREA SD Economically Disadvantaged 135 3.0 59.3 34.8 3.0Bradford 17 WYALUSING AREA SD All students 334 5.1 67.1 26.3 1.5Bradford 17 WYALUSING AREA SD Male 155 3.2 65.8 28.4 2.6Bradford 17 WYALUSING AREA SD Female 179 6.7 68.2 24.6 0.6Bradford 17 WYALUSING AREA SD White 322 5.3 66.8 26.7 1.2Bradford 17 WYALUSING AREA SD Black 3Bradford 17 WYALUSING AREA SD Hispanic 6Bradford 17 WYALUSING AREA SD Asian 2Bradford 17 WYALUSING AREA SD Native American 0Bradford 17 WYALUSING AREA SD Multi-ethnic 0Bradford 17 WYALUSING AREA SD IEP 49 0.0 32.7 61.2 6.1Bradford 17 WYALUSING AREA SD ELL 1Bradford 17 WYALUSING AREA SD Economically Disadvantaged 137 3.6 57.7 35.8 2.9Bucks 22 BENSALEM TOWNSHIP SD All students 1,339 6.6 67.8 23.2 2.5Bucks 22 BENSALEM TOWNSHIP SD Male 686 4.5 64.1 27.6 3.8Bucks 22 BENSALEM TOWNSHIP SD Female 651 8.8 71.6 18.6 1.1Bucks 22 BENSALEM TOWNSHIP SD White 886 5.0 69.1 23.5 2.5Bucks 22 BENSALEM TOWNSHIP SD Black 162 4.3 66.7 26.5 2.5Bucks 22 BENSALEM TOWNSHIP SD Hispanic 123 4.9 56.9 34.1 4.1Bucks 22 BENSALEM TOWNSHIP SD Asian 165 18.8 69.7 10.3 1.2Bucks 22 BENSALEM TOWNSHIP SD Native American 0Bucks 22 BENSALEM TOWNSHIP SD Multi-ethnic 1Bucks 22 BENSALEM TOWNSHIP SD IEP 261 1.9 33.3 55.2 9.6Bucks 22 BENSALEM TOWNSHIP SD ELL 49 4.1 40.8 51.0 4.1Bucks 22 BENSALEM TOWNSHIP SD Economically Disadvantaged 507 4.5 61.9 30.2 3.4
*Full Academic Year Students. Data for groups with less than 10 students assessed were replaced by blanks.Percentages were rounded to the nearest one-tenth.Proficiency percentages may not add up to 100 due to rounding. 42

The 2010 PSSA Writing District Level Proficiency Results - District Totals*
CountyIU
Number District Group
Number Scored Writing
% Advanced
Writing
% Proficient
Writing% Basic Writing
% Below Basic
WritingBucks 22 BRISTOL BOROUGH SD All students 290 4.5 63.4 30.3 1.7Bucks 22 BRISTOL BOROUGH SD Male 148 1.4 62.2 34.5 2.0Bucks 22 BRISTOL BOROUGH SD Female 142 7.7 64.8 26.1 1.4Bucks 22 BRISTOL BOROUGH SD White 167 5.4 61.7 31.1 1.8Bucks 22 BRISTOL BOROUGH SD Black 60 6.7 63.3 28.3 1.7Bucks 22 BRISTOL BOROUGH SD Hispanic 48 0.0 66.7 31.3 2.1Bucks 22 BRISTOL BOROUGH SD Asian 3Bucks 22 BRISTOL BOROUGH SD Native American 0Bucks 22 BRISTOL BOROUGH SD Multi-ethnic 12 0.0 66.7 33.3 0.0Bucks 22 BRISTOL BOROUGH SD IEP 51 0.0 43.1 51.0 5.9Bucks 22 BRISTOL BOROUGH SD ELL 10 0.0 40.0 60.0 0.0Bucks 22 BRISTOL BOROUGH SD Economically Disadvantaged 183 2.7 60.7 35.0 1.6Bucks 22 BRISTOL TOWNSHIP SD All students 1,412 3.5 60.1 34.1 2.4Bucks 22 BRISTOL TOWNSHIP SD Male 710 1.4 52.7 42.3 3.7Bucks 22 BRISTOL TOWNSHIP SD Female 699 5.6 67.8 25.5 1.1Bucks 22 BRISTOL TOWNSHIP SD White 945 4.2 62.0 31.3 2.4Bucks 22 BRISTOL TOWNSHIP SD Black 254 1.6 53.5 42.5 2.4Bucks 22 BRISTOL TOWNSHIP SD Hispanic 125 0.8 56.0 41.6 1.6Bucks 22 BRISTOL TOWNSHIP SD Asian 44 9.1 65.9 22.7 2.3Bucks 22 BRISTOL TOWNSHIP SD Native American 3Bucks 22 BRISTOL TOWNSHIP SD Multi-ethnic 36 0.0 66.7 27.8 5.6Bucks 22 BRISTOL TOWNSHIP SD IEP 282 2.5 42.2 47.5 7.8Bucks 22 BRISTOL TOWNSHIP SD ELL 42 0.0 42.9 52.4 4.8Bucks 22 BRISTOL TOWNSHIP SD Economically Disadvantaged 676 2.2 56.2 38.6 3.0Bucks 22 CENTENNIAL SD All students 1,321 8.6 71.8 19.2 0.5Bucks 22 CENTENNIAL SD Male 723 5.7 69.2 24.5 0.7Bucks 22 CENTENNIAL SD Female 596 12.2 74.8 12.8 0.2Bucks 22 CENTENNIAL SD White 1,117 9.3 72.6 17.6 0.4Bucks 22 CENTENNIAL SD Black 52 3.8 61.5 32.7 1.9Bucks 22 CENTENNIAL SD Hispanic 101 5.0 68.3 26.7 0.0
*Full Academic Year Students. Data for groups with less than 10 students assessed were replaced by blanks.Percentages were rounded to the nearest one-tenth.Proficiency percentages may not add up to 100 due to rounding. 43
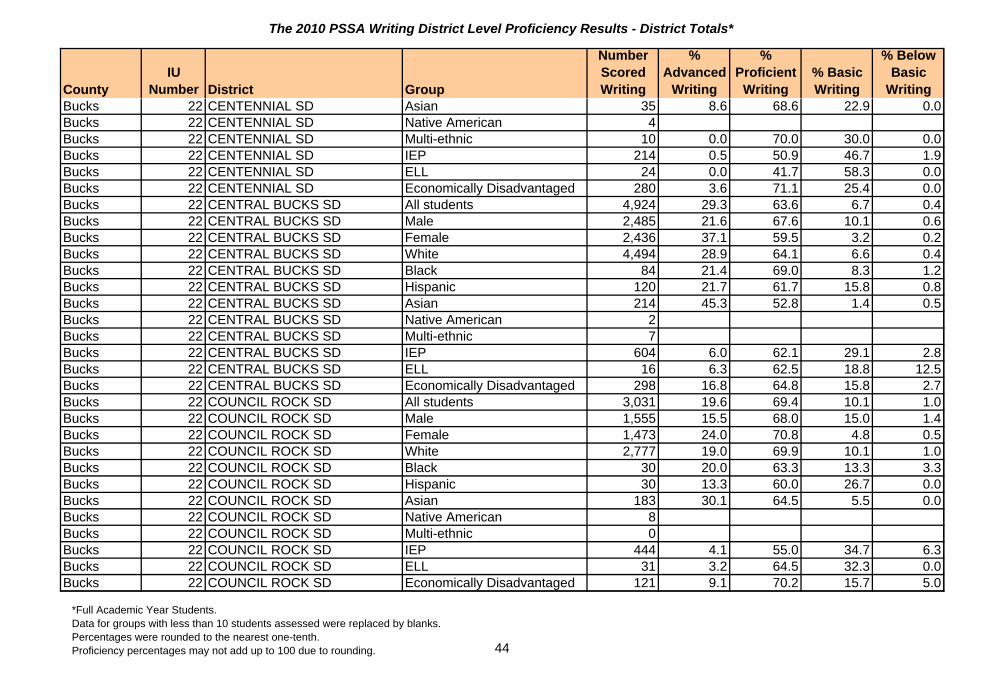
The 2010 PSSA Writing District Level Proficiency Results - District Totals*
CountyIU
Number District Group
Number Scored Writing
% Advanced
Writing
% Proficient
Writing% Basic Writing
% Below Basic
WritingBucks 22 CENTENNIAL SD Asian 35 8.6 68.6 22.9 0.0Bucks 22 CENTENNIAL SD Native American 4Bucks 22 CENTENNIAL SD Multi-ethnic 10 0.0 70.0 30.0 0.0Bucks 22 CENTENNIAL SD IEP 214 0.5 50.9 46.7 1.9Bucks 22 CENTENNIAL SD ELL 24 0.0 41.7 58.3 0.0Bucks 22 CENTENNIAL SD Economically Disadvantaged 280 3.6 71.1 25.4 0.0Bucks 22 CENTRAL BUCKS SD All students 4,924 29.3 63.6 6.7 0.4Bucks 22 CENTRAL BUCKS SD Male 2,485 21.6 67.6 10.1 0.6Bucks 22 CENTRAL BUCKS SD Female 2,436 37.1 59.5 3.2 0.2Bucks 22 CENTRAL BUCKS SD White 4,494 28.9 64.1 6.6 0.4Bucks 22 CENTRAL BUCKS SD Black 84 21.4 69.0 8.3 1.2Bucks 22 CENTRAL BUCKS SD Hispanic 120 21.7 61.7 15.8 0.8Bucks 22 CENTRAL BUCKS SD Asian 214 45.3 52.8 1.4 0.5Bucks 22 CENTRAL BUCKS SD Native American 2Bucks 22 CENTRAL BUCKS SD Multi-ethnic 7Bucks 22 CENTRAL BUCKS SD IEP 604 6.0 62.1 29.1 2.8Bucks 22 CENTRAL BUCKS SD ELL 16 6.3 62.5 18.8 12.5Bucks 22 CENTRAL BUCKS SD Economically Disadvantaged 298 16.8 64.8 15.8 2.7Bucks 22 COUNCIL ROCK SD All students 3,031 19.6 69.4 10.1 1.0Bucks 22 COUNCIL ROCK SD Male 1,555 15.5 68.0 15.0 1.4Bucks 22 COUNCIL ROCK SD Female 1,473 24.0 70.8 4.8 0.5Bucks 22 COUNCIL ROCK SD White 2,777 19.0 69.9 10.1 1.0Bucks 22 COUNCIL ROCK SD Black 30 20.0 63.3 13.3 3.3Bucks 22 COUNCIL ROCK SD Hispanic 30 13.3 60.0 26.7 0.0Bucks 22 COUNCIL ROCK SD Asian 183 30.1 64.5 5.5 0.0Bucks 22 COUNCIL ROCK SD Native American 8Bucks 22 COUNCIL ROCK SD Multi-ethnic 0Bucks 22 COUNCIL ROCK SD IEP 444 4.1 55.0 34.7 6.3Bucks 22 COUNCIL ROCK SD ELL 31 3.2 64.5 32.3 0.0Bucks 22 COUNCIL ROCK SD Economically Disadvantaged 121 9.1 70.2 15.7 5.0
*Full Academic Year Students. Data for groups with less than 10 students assessed were replaced by blanks.Percentages were rounded to the nearest one-tenth.Proficiency percentages may not add up to 100 due to rounding. 44

The 2010 PSSA Writing District Level Proficiency Results - District Totals*
CountyIU
Number District Group
Number Scored Writing
% Advanced
Writing
% Proficient
Writing% Basic Writing
% Below Basic
WritingBucks 22 MORRISVILLE BOROUGH SD All students 177 5.6 65.0 24.9 4.5Bucks 22 MORRISVILLE BOROUGH SD Male 87 2.3 56.3 34.5 6.9Bucks 22 MORRISVILLE BOROUGH SD Female 90 8.9 73.3 15.6 2.2Bucks 22 MORRISVILLE BOROUGH SD White 97 4.1 69.1 21.6 5.2Bucks 22 MORRISVILLE BOROUGH SD Black 60 6.7 60.0 30.0 3.3Bucks 22 MORRISVILLE BOROUGH SD Hispanic 19 5.3 63.2 26.3 5.3Bucks 22 MORRISVILLE BOROUGH SD Asian 1Bucks 22 MORRISVILLE BOROUGH SD Native American 0Bucks 22 MORRISVILLE BOROUGH SD Multi-ethnic 0Bucks 22 MORRISVILLE BOROUGH SD IEP 42 0.0 40.5 40.5 19.0Bucks 22 MORRISVILLE BOROUGH SD ELL 3Bucks 22 MORRISVILLE BOROUGH SD Economically Disadvantaged 76 5.3 60.5 27.6 6.6Bucks 22 NESHAMINY SD All students 2,095 8.2 69.8 20.2 1.8Bucks 22 NESHAMINY SD Male 1,090 5.0 63.9 28.3 2.8Bucks 22 NESHAMINY SD Female 1,004 11.8 76.4 11.4 0.5Bucks 22 NESHAMINY SD White 1,859 8.4 70.3 19.7 1.5Bucks 22 NESHAMINY SD Black 104 2.9 57.7 35.6 3.8Bucks 22 NESHAMINY SD Hispanic 49 6.1 69.4 18.4 6.1Bucks 22 NESHAMINY SD Asian 60 13.3 81.7 5.0 0.0Bucks 22 NESHAMINY SD Native American 7Bucks 22 NESHAMINY SD Multi-ethnic 14 0.0 50.0 50.0 0.0Bucks 22 NESHAMINY SD IEP 403 1.0 44.4 46.7 7.9Bucks 22 NESHAMINY SD ELL 5Bucks 22 NESHAMINY SD Economically Disadvantaged 314 2.2 59.6 34.7 3.5Bucks 22 NEW HOPE-SOLEBURY SD All students 370 16.5 77.0 6.5 0.0Bucks 22 NEW HOPE-SOLEBURY SD Male 187 12.8 77.5 9.6 0.0Bucks 22 NEW HOPE-SOLEBURY SD Female 183 20.2 76.5 3.3 0.0Bucks 22 NEW HOPE-SOLEBURY SD White 354 16.4 77.1 6.5 0.0Bucks 22 NEW HOPE-SOLEBURY SD Black 3Bucks 22 NEW HOPE-SOLEBURY SD Hispanic 2
*Full Academic Year Students. Data for groups with less than 10 students assessed were replaced by blanks.Percentages were rounded to the nearest one-tenth.Proficiency percentages may not add up to 100 due to rounding. 45

The 2010 PSSA Writing District Level Proficiency Results - District Totals*
CountyIU
Number District Group
Number Scored Writing
% Advanced
Writing
% Proficient
Writing% Basic Writing
% Below Basic
WritingBucks 22 NEW HOPE-SOLEBURY SD Asian 8Bucks 22 NEW HOPE-SOLEBURY SD Native American 1Bucks 22 NEW HOPE-SOLEBURY SD Multi-ethnic 2Bucks 22 NEW HOPE-SOLEBURY SD IEP 52 7.7 65.4 26.9 0.0Bucks 22 NEW HOPE-SOLEBURY SD ELL 1Bucks 22 NEW HOPE-SOLEBURY SD Economically Disadvantaged 9Bucks 22 PALISADES SD All students 444 18.9 65.8 14.2 1.1Bucks 22 PALISADES SD Male 230 11.7 66.1 20.0 2.2Bucks 22 PALISADES SD Female 214 26.6 65.4 7.9 0.0Bucks 22 PALISADES SD White 432 19.2 65.5 14.1 1.2Bucks 22 PALISADES SD Black 4Bucks 22 PALISADES SD Hispanic 3Bucks 22 PALISADES SD Asian 3Bucks 22 PALISADES SD Native American 1Bucks 22 PALISADES SD Multi-ethnic 1Bucks 22 PALISADES SD IEP 69 2.9 43.5 46.4 7.2Bucks 22 PALISADES SD ELL 0Bucks 22 PALISADES SD Economically Disadvantaged 55 5.5 65.5 23.6 5.5Bucks 22 PENNRIDGE SD All students 1,704 11.6 72.2 15.7 0.5Bucks 22 PENNRIDGE SD Male 921 7.4 71.3 20.6 0.7Bucks 22 PENNRIDGE SD Female 783 16.5 73.3 10.0 0.3Bucks 22 PENNRIDGE SD White 1,578 11.9 72.8 15.0 0.4Bucks 22 PENNRIDGE SD Black 45 2.2 51.1 44.4 2.2Bucks 22 PENNRIDGE SD Hispanic 38 10.5 68.4 18.4 2.6Bucks 22 PENNRIDGE SD Asian 38 13.2 76.3 10.5 0.0Bucks 22 PENNRIDGE SD Native American 4Bucks 22 PENNRIDGE SD Multi-ethnic 1Bucks 22 PENNRIDGE SD IEP 266 3.4 49.2 44.7 2.6Bucks 22 PENNRIDGE SD ELL 15 0.0 66.7 26.7 6.7Bucks 22 PENNRIDGE SD Economically Disadvantaged 242 5.4 65.3 28.5 0.8
*Full Academic Year Students. Data for groups with less than 10 students assessed were replaced by blanks.Percentages were rounded to the nearest one-tenth.Proficiency percentages may not add up to 100 due to rounding. 46

The 2010 PSSA Writing District Level Proficiency Results - District Totals*
CountyIU
Number District Group
Number Scored Writing
% Advanced
Writing
% Proficient
Writing% Basic Writing
% Below Basic
WritingBucks 22 PENNSBURY SD All students 2,626 12.9 69.7 16.9 0.5Bucks 22 PENNSBURY SD Male 1,319 9.8 66.3 23.0 0.9Bucks 22 PENNSBURY SD Female 1,303 16.0 73.2 10.7 0.1Bucks 22 PENNSBURY SD White 2,206 12.7 69.5 17.3 0.5Bucks 22 PENNSBURY SD Black 154 10.4 68.2 21.4 0.0Bucks 22 PENNSBURY SD Hispanic 90 11.1 72.2 14.4 2.2Bucks 22 PENNSBURY SD Asian 155 19.4 71.6 9.0 0.0Bucks 22 PENNSBURY SD Native American 6Bucks 22 PENNSBURY SD Multi-ethnic 11 9.1 81.8 9.1 0.0Bucks 22 PENNSBURY SD IEP 411 2.7 51.1 44.0 2.2Bucks 22 PENNSBURY SD ELL 26 0.0 50.0 46.2 3.8Bucks 22 PENNSBURY SD Economically Disadvantaged 343 4.1 67.1 27.7 1.2Bucks 22 QUAKERTOWN COMMUNITY S All students 1,214 13.2 67.5 18.7 0.6Bucks 22 QUAKERTOWN COMMUNITY S Male 614 9.0 62.7 27.4 1.0Bucks 22 QUAKERTOWN COMMUNITY S Female 600 17.5 72.5 9.8 0.2Bucks 22 QUAKERTOWN COMMUNITY S White 1,103 12.8 67.7 19.0 0.5Bucks 22 QUAKERTOWN COMMUNITY S Black 20 0.0 65.0 35.0 0.0Bucks 22 QUAKERTOWN COMMUNITY S Hispanic 42 11.9 69.0 16.7 2.4Bucks 22 QUAKERTOWN COMMUNITY S Asian 20 35.0 55.0 5.0 5.0Bucks 22 QUAKERTOWN COMMUNITY S Native American 0Bucks 22 QUAKERTOWN COMMUNITY S Multi-ethnic 29 24.1 69.0 6.9 0.0Bucks 22 QUAKERTOWN COMMUNITY S IEP 130 3.1 39.2 54.6 3.1Bucks 22 QUAKERTOWN COMMUNITY S ELL 12 0.0 58.3 33.3 8.3Bucks 22 QUAKERTOWN COMMUNITY S Economically Disadvantaged 220 4.5 66.8 27.3 1.4Butler 4 BUTLER AREA SD All students 1,795 7.3 66.4 24.2 2.2Butler 4 BUTLER AREA SD Male 943 5.0 61.5 30.0 3.5Butler 4 BUTLER AREA SD Female 849 9.9 71.7 17.7 0.7Butler 4 BUTLER AREA SD White 1,717 7.3 66.9 23.8 2.0Butler 4 BUTLER AREA SD Black 36 5.6 55.6 33.3 5.6Butler 4 BUTLER AREA SD Hispanic 20 5.0 55.0 30.0 10.0
*Full Academic Year Students. Data for groups with less than 10 students assessed were replaced by blanks.Percentages were rounded to the nearest one-tenth.Proficiency percentages may not add up to 100 due to rounding. 47

The 2010 PSSA Writing District Level Proficiency Results - District Totals*
CountyIU
Number District Group
Number Scored Writing
% Advanced
Writing
% Proficient
Writing% Basic Writing
% Below Basic
WritingButler 4 BUTLER AREA SD Asian 14 14.3 50.0 35.7 0.0Butler 4 BUTLER AREA SD Native American 4Butler 4 BUTLER AREA SD Multi-ethnic 1Butler 4 BUTLER AREA SD IEP 204 0.5 35.3 52.5 11.8Butler 4 BUTLER AREA SD ELL 3Butler 4 BUTLER AREA SD Economically Disadvantaged 488 3.1 54.9 37.5 4.5Butler 4 KARNS CITY AREA SD All students 367 10.4 59.4 30.0 0.3Butler 4 KARNS CITY AREA SD Male 190 7.9 55.3 36.3 0.5Butler 4 KARNS CITY AREA SD Female 176 13.1 64.2 22.7 0.0Butler 4 KARNS CITY AREA SD White 362 10.2 59.9 29.6 0.3Butler 4 KARNS CITY AREA SD Black 3Butler 4 KARNS CITY AREA SD Hispanic 1Butler 4 KARNS CITY AREA SD Asian 0Butler 4 KARNS CITY AREA SD Native American 0Butler 4 KARNS CITY AREA SD Multi-ethnic 0Butler 4 KARNS CITY AREA SD IEP 34 0.0 20.6 76.5 2.9Butler 4 KARNS CITY AREA SD ELL 0Butler 4 KARNS CITY AREA SD Economically Disadvantaged 129 4.7 58.1 36.4 0.8Butler 4 MARS AREA SD All students 720 14.6 72.8 11.8 0.8Butler 4 MARS AREA SD Male 357 7.8 72.8 17.6 1.7Butler 4 MARS AREA SD Female 360 21.1 73.1 5.8 0.0Butler 4 MARS AREA SD White 709 14.7 72.6 11.8 0.8Butler 4 MARS AREA SD Black 0Butler 4 MARS AREA SD Hispanic 2Butler 4 MARS AREA SD Asian 4Butler 4 MARS AREA SD Native American 1Butler 4 MARS AREA SD Multi-ethnic 1Butler 4 MARS AREA SD IEP 28 3.6 32.1 60.7 3.6Butler 4 MARS AREA SD ELL 1Butler 4 MARS AREA SD Economically Disadvantaged 68 4.4 54.4 41.2 0.0
*Full Academic Year Students. Data for groups with less than 10 students assessed were replaced by blanks.Percentages were rounded to the nearest one-tenth.Proficiency percentages may not add up to 100 due to rounding. 48
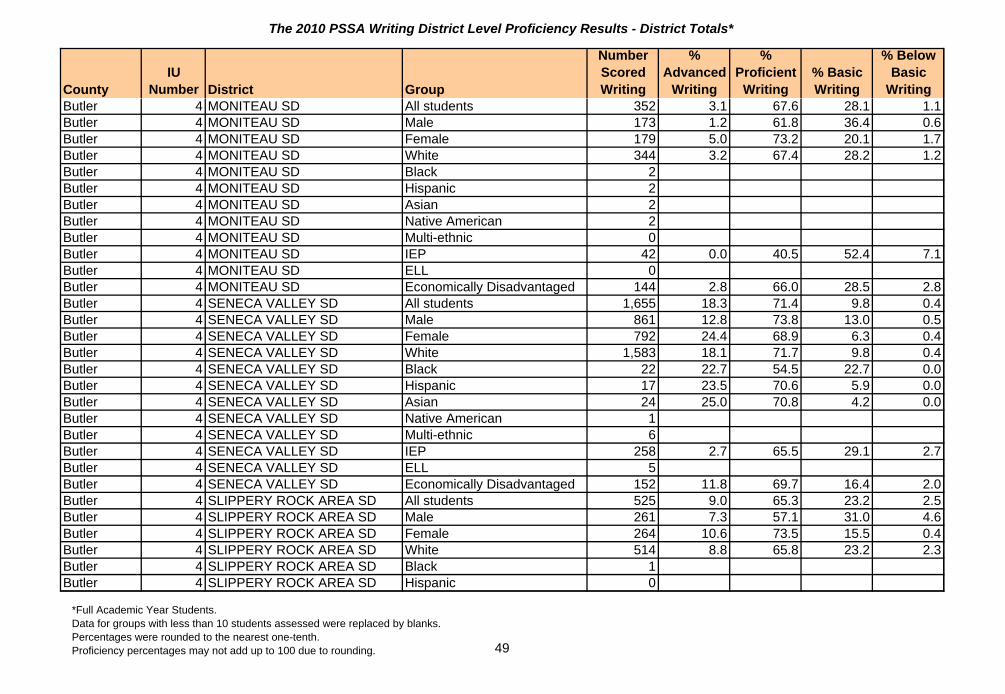
The 2010 PSSA Writing District Level Proficiency Results - District Totals*
CountyIU
Number District Group
Number Scored Writing
% Advanced
Writing
% Proficient
Writing% Basic Writing
% Below Basic
WritingButler 4 MONITEAU SD All students 352 3.1 67.6 28.1 1.1Butler 4 MONITEAU SD Male 173 1.2 61.8 36.4 0.6Butler 4 MONITEAU SD Female 179 5.0 73.2 20.1 1.7Butler 4 MONITEAU SD White 344 3.2 67.4 28.2 1.2Butler 4 MONITEAU SD Black 2Butler 4 MONITEAU SD Hispanic 2Butler 4 MONITEAU SD Asian 2Butler 4 MONITEAU SD Native American 2Butler 4 MONITEAU SD Multi-ethnic 0Butler 4 MONITEAU SD IEP 42 0.0 40.5 52.4 7.1Butler 4 MONITEAU SD ELL 0Butler 4 MONITEAU SD Economically Disadvantaged 144 2.8 66.0 28.5 2.8Butler 4 SENECA VALLEY SD All students 1,655 18.3 71.4 9.8 0.4Butler 4 SENECA VALLEY SD Male 861 12.8 73.8 13.0 0.5Butler 4 SENECA VALLEY SD Female 792 24.4 68.9 6.3 0.4Butler 4 SENECA VALLEY SD White 1,583 18.1 71.7 9.8 0.4Butler 4 SENECA VALLEY SD Black 22 22.7 54.5 22.7 0.0Butler 4 SENECA VALLEY SD Hispanic 17 23.5 70.6 5.9 0.0Butler 4 SENECA VALLEY SD Asian 24 25.0 70.8 4.2 0.0Butler 4 SENECA VALLEY SD Native American 1Butler 4 SENECA VALLEY SD Multi-ethnic 6Butler 4 SENECA VALLEY SD IEP 258 2.7 65.5 29.1 2.7Butler 4 SENECA VALLEY SD ELL 5Butler 4 SENECA VALLEY SD Economically Disadvantaged 152 11.8 69.7 16.4 2.0Butler 4 SLIPPERY ROCK AREA SD All students 525 9.0 65.3 23.2 2.5Butler 4 SLIPPERY ROCK AREA SD Male 261 7.3 57.1 31.0 4.6Butler 4 SLIPPERY ROCK AREA SD Female 264 10.6 73.5 15.5 0.4Butler 4 SLIPPERY ROCK AREA SD White 514 8.8 65.8 23.2 2.3Butler 4 SLIPPERY ROCK AREA SD Black 1Butler 4 SLIPPERY ROCK AREA SD Hispanic 0
*Full Academic Year Students. Data for groups with less than 10 students assessed were replaced by blanks.Percentages were rounded to the nearest one-tenth.Proficiency percentages may not add up to 100 due to rounding. 49
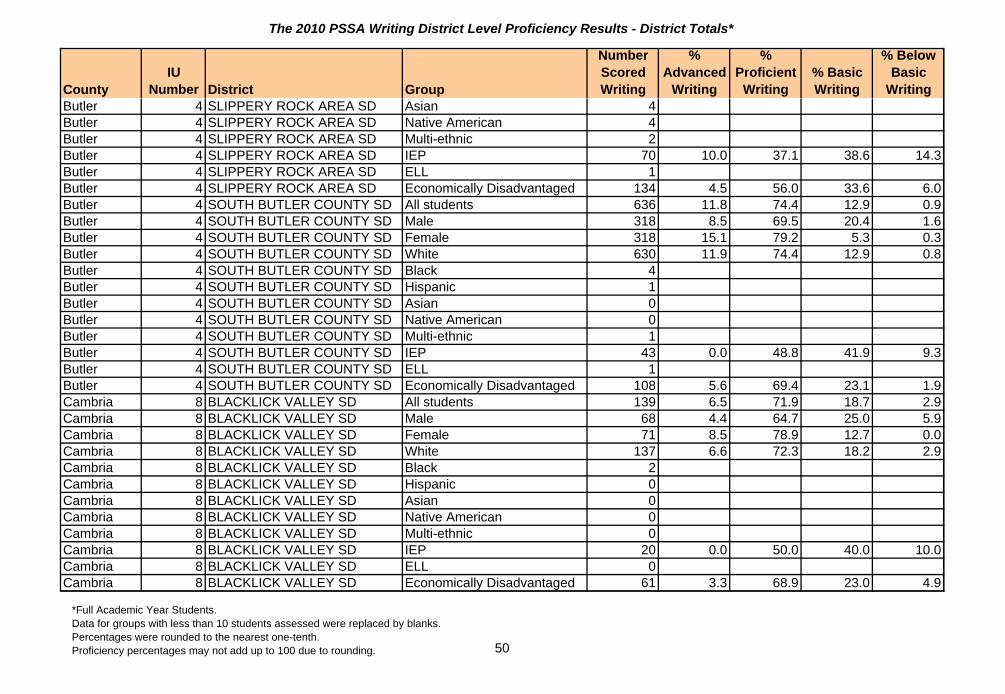
The 2010 PSSA Writing District Level Proficiency Results - District Totals*
CountyIU
Number District Group
Number Scored Writing
% Advanced
Writing
% Proficient
Writing% Basic Writing
% Below Basic
WritingButler 4 SLIPPERY ROCK AREA SD Asian 4Butler 4 SLIPPERY ROCK AREA SD Native American 4Butler 4 SLIPPERY ROCK AREA SD Multi-ethnic 2Butler 4 SLIPPERY ROCK AREA SD IEP 70 10.0 37.1 38.6 14.3Butler 4 SLIPPERY ROCK AREA SD ELL 1Butler 4 SLIPPERY ROCK AREA SD Economically Disadvantaged 134 4.5 56.0 33.6 6.0Butler 4 SOUTH BUTLER COUNTY SD All students 636 11.8 74.4 12.9 0.9Butler 4 SOUTH BUTLER COUNTY SD Male 318 8.5 69.5 20.4 1.6Butler 4 SOUTH BUTLER COUNTY SD Female 318 15.1 79.2 5.3 0.3Butler 4 SOUTH BUTLER COUNTY SD White 630 11.9 74.4 12.9 0.8Butler 4 SOUTH BUTLER COUNTY SD Black 4Butler 4 SOUTH BUTLER COUNTY SD Hispanic 1Butler 4 SOUTH BUTLER COUNTY SD Asian 0Butler 4 SOUTH BUTLER COUNTY SD Native American 0Butler 4 SOUTH BUTLER COUNTY SD Multi-ethnic 1Butler 4 SOUTH BUTLER COUNTY SD IEP 43 0.0 48.8 41.9 9.3Butler 4 SOUTH BUTLER COUNTY SD ELL 1Butler 4 SOUTH BUTLER COUNTY SD Economically Disadvantaged 108 5.6 69.4 23.1 1.9Cambria 8 BLACKLICK VALLEY SD All students 139 6.5 71.9 18.7 2.9Cambria 8 BLACKLICK VALLEY SD Male 68 4.4 64.7 25.0 5.9Cambria 8 BLACKLICK VALLEY SD Female 71 8.5 78.9 12.7 0.0Cambria 8 BLACKLICK VALLEY SD White 137 6.6 72.3 18.2 2.9Cambria 8 BLACKLICK VALLEY SD Black 2Cambria 8 BLACKLICK VALLEY SD Hispanic 0Cambria 8 BLACKLICK VALLEY SD Asian 0Cambria 8 BLACKLICK VALLEY SD Native American 0Cambria 8 BLACKLICK VALLEY SD Multi-ethnic 0Cambria 8 BLACKLICK VALLEY SD IEP 20 0.0 50.0 40.0 10.0Cambria 8 BLACKLICK VALLEY SD ELL 0Cambria 8 BLACKLICK VALLEY SD Economically Disadvantaged 61 3.3 68.9 23.0 4.9
*Full Academic Year Students. Data for groups with less than 10 students assessed were replaced by blanks.Percentages were rounded to the nearest one-tenth.Proficiency percentages may not add up to 100 due to rounding. 50

The 2010 PSSA Writing District Level Proficiency Results - District Totals*
CountyIU
Number District Group
Number Scored Writing
% Advanced
Writing
% Proficient
Writing% Basic Writing
% Below Basic
WritingCambria 8 CAMBRIA HEIGHTS SD All students 360 10.6 70.8 18.3 0.3Cambria 8 CAMBRIA HEIGHTS SD Male 174 7.5 66.7 25.3 0.6Cambria 8 CAMBRIA HEIGHTS SD Female 186 13.4 74.7 11.8 0.0Cambria 8 CAMBRIA HEIGHTS SD White 355 10.7 71.0 18.0 0.3Cambria 8 CAMBRIA HEIGHTS SD Black 2Cambria 8 CAMBRIA HEIGHTS SD Hispanic 1Cambria 8 CAMBRIA HEIGHTS SD Asian 1Cambria 8 CAMBRIA HEIGHTS SD Native American 1Cambria 8 CAMBRIA HEIGHTS SD Multi-ethnic 0Cambria 8 CAMBRIA HEIGHTS SD IEP 49 6.1 30.6 61.2 2.0Cambria 8 CAMBRIA HEIGHTS SD ELL 0Cambria 8 CAMBRIA HEIGHTS SD Economically Disadvantaged 135 10.4 61.5 27.4 0.7Cambria 8 CENTRAL CAMBRIA SD All students 425 15.8 64.0 17.6 2.6Cambria 8 CENTRAL CAMBRIA SD Male 215 11.6 61.4 23.7 3.3Cambria 8 CENTRAL CAMBRIA SD Female 210 20.0 66.7 11.4 1.9Cambria 8 CENTRAL CAMBRIA SD White 415 15.9 63.9 17.6 2.7Cambria 8 CENTRAL CAMBRIA SD Black 5Cambria 8 CENTRAL CAMBRIA SD Hispanic 1Cambria 8 CENTRAL CAMBRIA SD Asian 3Cambria 8 CENTRAL CAMBRIA SD Native American 1Cambria 8 CENTRAL CAMBRIA SD Multi-ethnic 0Cambria 8 CENTRAL CAMBRIA SD IEP 73 0.0 38.4 46.6 15.1Cambria 8 CENTRAL CAMBRIA SD ELL 2Cambria 8 CENTRAL CAMBRIA SD Economically Disadvantaged 144 6.9 61.1 27.1 4.9Cambria 8 CONEMAUGH VALLEY SD All students 201 10.9 67.7 19.9 1.5Cambria 8 CONEMAUGH VALLEY SD Male 96 7.3 60.4 30.2 2.1Cambria 8 CONEMAUGH VALLEY SD Female 105 14.3 74.3 10.5 1.0Cambria 8 CONEMAUGH VALLEY SD White 194 11.3 68.6 18.6 1.5Cambria 8 CONEMAUGH VALLEY SD Black 7Cambria 8 CONEMAUGH VALLEY SD Hispanic 0
*Full Academic Year Students. Data for groups with less than 10 students assessed were replaced by blanks.Percentages were rounded to the nearest one-tenth.Proficiency percentages may not add up to 100 due to rounding. 51

The 2010 PSSA Writing District Level Proficiency Results - District Totals*
CountyIU
Number District Group
Number Scored Writing
% Advanced
Writing
% Proficient
Writing% Basic Writing
% Below Basic
WritingCambria 8 CONEMAUGH VALLEY SD Asian 0Cambria 8 CONEMAUGH VALLEY SD Native American 0Cambria 8 CONEMAUGH VALLEY SD Multi-ethnic 0Cambria 8 CONEMAUGH VALLEY SD IEP 29 0.0 37.9 51.7 10.3Cambria 8 CONEMAUGH VALLEY SD ELL 0Cambria 8 CONEMAUGH VALLEY SD Economically Disadvantaged 74 5.4 62.2 31.1 1.4Cambria 8 FERNDALE AREA SD All students 163 8.6 68.7 20.9 1.8Cambria 8 FERNDALE AREA SD Male 88 9.1 65.9 21.6 3.4Cambria 8 FERNDALE AREA SD Female 75 8.0 72.0 20.0 0.0Cambria 8 FERNDALE AREA SD White 148 9.5 68.9 20.3 1.4Cambria 8 FERNDALE AREA SD Black 10 0.0 60.0 40.0 0.0Cambria 8 FERNDALE AREA SD Hispanic 3Cambria 8 FERNDALE AREA SD Asian 1Cambria 8 FERNDALE AREA SD Native American 0Cambria 8 FERNDALE AREA SD Multi-ethnic 0Cambria 8 FERNDALE AREA SD IEP 34 5.9 44.1 44.1 5.9Cambria 8 FERNDALE AREA SD ELL 0Cambria 8 FERNDALE AREA SD Economically Disadvantaged 86 5.8 69.8 23.3 1.2Cambria 8 FOREST HILLS SD All students 503 7.4 67.8 23.5 1.4Cambria 8 FOREST HILLS SD Male 257 4.7 60.3 33.1 1.9Cambria 8 FOREST HILLS SD Female 246 10.2 75.6 13.4 0.8Cambria 8 FOREST HILLS SD White 498 7.2 67.9 23.5 1.4Cambria 8 FOREST HILLS SD Black 2Cambria 8 FOREST HILLS SD Hispanic 0Cambria 8 FOREST HILLS SD Asian 1Cambria 8 FOREST HILLS SD Native American 0Cambria 8 FOREST HILLS SD Multi-ethnic 2Cambria 8 FOREST HILLS SD IEP 49 0.0 24.5 63.3 12.2Cambria 8 FOREST HILLS SD ELL 0Cambria 8 FOREST HILLS SD Economically Disadvantaged 222 4.5 58.6 35.6 1.4
*Full Academic Year Students. Data for groups with less than 10 students assessed were replaced by blanks.Percentages were rounded to the nearest one-tenth.Proficiency percentages may not add up to 100 due to rounding. 52

The 2010 PSSA Writing District Level Proficiency Results - District Totals*
CountyIU
Number District Group
Number Scored Writing
% Advanced
Writing
% Proficient
Writing% Basic Writing
% Below Basic
WritingCambria 8 GREATER JOHNSTOWN SD All students 541 1.8 44.9 48.4 4.8Cambria 8 GREATER JOHNSTOWN SD Male 270 0.7 38.5 53.3 7.4Cambria 8 GREATER JOHNSTOWN SD Female 270 3.0 51.5 43.7 1.9Cambria 8 GREATER JOHNSTOWN SD White 353 2.5 49.6 43.1 4.8Cambria 8 GREATER JOHNSTOWN SD Black 143 0.7 39.9 56.6 2.8Cambria 8 GREATER JOHNSTOWN SD Hispanic 7Cambria 8 GREATER JOHNSTOWN SD Asian 1Cambria 8 GREATER JOHNSTOWN SD Native American 0Cambria 8 GREATER JOHNSTOWN SD Multi-ethnic 36 0.0 25.0 63.9 11.1Cambria 8 GREATER JOHNSTOWN SD IEP 90 0.0 15.6 66.7 17.8Cambria 8 GREATER JOHNSTOWN SD ELL 2Cambria 8 GREATER JOHNSTOWN SD Economically Disadvantaged 407 0.7 42.3 51.6 5.4Cambria 8 NORTHERN CAMBRIA SD All students 286 6.6 76.6 15.7 1.0Cambria 8 NORTHERN CAMBRIA SD Male 151 5.3 67.5 25.2 2.0Cambria 8 NORTHERN CAMBRIA SD Female 135 8.1 86.7 5.2 0.0Cambria 8 NORTHERN CAMBRIA SD White 286 6.6 76.6 15.7 1.0Cambria 8 NORTHERN CAMBRIA SD Black 0Cambria 8 NORTHERN CAMBRIA SD Hispanic 0Cambria 8 NORTHERN CAMBRIA SD Asian 0Cambria 8 NORTHERN CAMBRIA SD Native American 0Cambria 8 NORTHERN CAMBRIA SD Multi-ethnic 0Cambria 8 NORTHERN CAMBRIA SD IEP 32 0.0 37.5 53.1 9.4Cambria 8 NORTHERN CAMBRIA SD ELL 0Cambria 8 NORTHERN CAMBRIA SD Economically Disadvantaged 77 2.6 71.4 24.7 1.3Cambria 8 PENN CAMBRIA SD All students 376 9.3 69.7 19.7 1.3Cambria 8 PENN CAMBRIA SD Male 206 8.7 62.6 26.2 2.4Cambria 8 PENN CAMBRIA SD Female 170 10.0 78.2 11.8 0.0Cambria 8 PENN CAMBRIA SD White 373 9.4 70.2 19.0 1.3Cambria 8 PENN CAMBRIA SD Black 2Cambria 8 PENN CAMBRIA SD Hispanic 0
*Full Academic Year Students. Data for groups with less than 10 students assessed were replaced by blanks.Percentages were rounded to the nearest one-tenth.Proficiency percentages may not add up to 100 due to rounding. 53

The 2010 PSSA Writing District Level Proficiency Results - District Totals*
CountyIU
Number District Group
Number Scored Writing
% Advanced
Writing
% Proficient
Writing% Basic Writing
% Below Basic
WritingCambria 8 PENN CAMBRIA SD Asian 0Cambria 8 PENN CAMBRIA SD Native American 1Cambria 8 PENN CAMBRIA SD Multi-ethnic 0Cambria 8 PENN CAMBRIA SD IEP 63 3.2 36.5 52.4 7.9Cambria 8 PENN CAMBRIA SD ELL 0Cambria 8 PENN CAMBRIA SD Economically Disadvantaged 129 3.1 67.4 27.9 1.6Cambria 8 PORTAGE AREA SD All students 181 30.9 48.6 18.2 2.2Cambria 8 PORTAGE AREA SD Male 88 23.9 51.1 20.5 4.5Cambria 8 PORTAGE AREA SD Female 92 37.0 46.7 16.3 0.0Cambria 8 PORTAGE AREA SD White 178 30.3 48.9 18.5 2.2Cambria 8 PORTAGE AREA SD Black 2Cambria 8 PORTAGE AREA SD Hispanic 0Cambria 8 PORTAGE AREA SD Asian 0Cambria 8 PORTAGE AREA SD Native American 0Cambria 8 PORTAGE AREA SD Multi-ethnic 0Cambria 8 PORTAGE AREA SD IEP 21 4.8 23.8 52.4 19.0Cambria 8 PORTAGE AREA SD ELL 0Cambria 8 PORTAGE AREA SD Economically Disadvantaged 76 19.7 51.3 25.0 3.9Cambria 8 RICHLAND SD All students 401 9.0 76.8 14.2 0.0Cambria 8 RICHLAND SD Male 224 7.6 74.1 18.3 0.0Cambria 8 RICHLAND SD Female 177 10.7 80.2 9.0 0.0Cambria 8 RICHLAND SD White 395 8.4 77.2 14.4 0.0Cambria 8 RICHLAND SD Black 2Cambria 8 RICHLAND SD Hispanic 2Cambria 8 RICHLAND SD Asian 2Cambria 8 RICHLAND SD Native American 0Cambria 8 RICHLAND SD Multi-ethnic 0Cambria 8 RICHLAND SD IEP 38 5.3 68.4 26.3 0.0Cambria 8 RICHLAND SD ELL 0Cambria 8 RICHLAND SD Economically Disadvantaged 66 9.1 69.7 21.2 0.0
*Full Academic Year Students. Data for groups with less than 10 students assessed were replaced by blanks.Percentages were rounded to the nearest one-tenth.Proficiency percentages may not add up to 100 due to rounding. 54

The 2010 PSSA Writing District Level Proficiency Results - District Totals*
CountyIU
Number District Group
Number Scored Writing
% Advanced
Writing
% Proficient
Writing% Basic Writing
% Below Basic
WritingCambria 8 WESTMONT HILLTOP SD All students 408 9.1 76.0 14.2 0.7Cambria 8 WESTMONT HILLTOP SD Male 220 6.8 70.9 21.4 0.9Cambria 8 WESTMONT HILLTOP SD Female 186 11.8 82.3 5.9 0.0Cambria 8 WESTMONT HILLTOP SD White 393 9.4 76.6 13.7 0.3Cambria 8 WESTMONT HILLTOP SD Black 3Cambria 8 WESTMONT HILLTOP SD Hispanic 4Cambria 8 WESTMONT HILLTOP SD Asian 4Cambria 8 WESTMONT HILLTOP SD Native American 1Cambria 8 WESTMONT HILLTOP SD Multi-ethnic 1Cambria 8 WESTMONT HILLTOP SD IEP 38 2.6 42.1 52.6 2.6Cambria 8 WESTMONT HILLTOP SD ELL 3Cambria 8 WESTMONT HILLTOP SD Economically Disadvantaged 85 3.5 69.4 25.9 1.2Cameron 9 CAMERON COUNTY SD All students 172 1.2 54.7 42.4 1.7Cameron 9 CAMERON COUNTY SD Male 75 0.0 37.3 58.7 4.0Cameron 9 CAMERON COUNTY SD Female 97 2.1 68.0 29.9 0.0Cameron 9 CAMERON COUNTY SD White 170 1.2 54.1 42.9 1.8Cameron 9 CAMERON COUNTY SD Black 2Cameron 9 CAMERON COUNTY SD Hispanic 0Cameron 9 CAMERON COUNTY SD Asian 0Cameron 9 CAMERON COUNTY SD Native American 0Cameron 9 CAMERON COUNTY SD Multi-ethnic 0Cameron 9 CAMERON COUNTY SD IEP 29 0.0 34.5 65.5 0.0Cameron 9 CAMERON COUNTY SD ELL 0Cameron 9 CAMERON COUNTY SD Economically Disadvantaged 63 0.0 50.8 46.0 3.2Carbon 21 JIM THORPE AREA SD All students 517 9.7 73.3 16.1 1.0Carbon 21 JIM THORPE AREA SD Male 285 5.3 70.5 22.8 1.4Carbon 21 JIM THORPE AREA SD Female 228 15.4 76.8 7.5 0.4Carbon 21 JIM THORPE AREA SD White 417 10.1 74.3 14.6 1.0Carbon 21 JIM THORPE AREA SD Black 45 11.1 66.7 22.2 0.0Carbon 21 JIM THORPE AREA SD Hispanic 44 0.0 72.7 25.0 2.3
*Full Academic Year Students. Data for groups with less than 10 students assessed were replaced by blanks.Percentages were rounded to the nearest one-tenth.Proficiency percentages may not add up to 100 due to rounding. 55

The 2010 PSSA Writing District Level Proficiency Results - District Totals*
CountyIU
Number District Group
Number Scored Writing
% Advanced
Writing
% Proficient
Writing% Basic Writing
% Below Basic
WritingCarbon 21 JIM THORPE AREA SD Asian 7Carbon 21 JIM THORPE AREA SD Native American 0Carbon 21 JIM THORPE AREA SD Multi-ethnic 0Carbon 21 JIM THORPE AREA SD IEP 91 1.1 48.4 46.2 4.4Carbon 21 JIM THORPE AREA SD ELL 0Carbon 21 JIM THORPE AREA SD Economically Disadvantaged 203 8.9 71.4 18.7 1.0Carbon 21 LEHIGHTON AREA SD All students 485 8.2 69.5 21.0 1.2Carbon 21 LEHIGHTON AREA SD Male 268 3.4 69.8 25.0 1.9Carbon 21 LEHIGHTON AREA SD Female 216 14.4 69.0 16.2 0.5Carbon 21 LEHIGHTON AREA SD White 464 8.2 69.8 20.9 1.1Carbon 21 LEHIGHTON AREA SD Black 9Carbon 21 LEHIGHTON AREA SD Hispanic 8Carbon 21 LEHIGHTON AREA SD Asian 2Carbon 21 LEHIGHTON AREA SD Native American 0Carbon 21 LEHIGHTON AREA SD Multi-ethnic 1Carbon 21 LEHIGHTON AREA SD IEP 75 1.3 33.3 60.0 5.3Carbon 21 LEHIGHTON AREA SD ELL 0Carbon 21 LEHIGHTON AREA SD Economically Disadvantaged 148 6.8 60.8 29.1 3.4Carbon 21 PALMERTON AREA SD All students 462 7.6 61.3 29.2 1.9Carbon 21 PALMERTON AREA SD Male 255 4.3 53.7 39.2 2.7Carbon 21 PALMERTON AREA SD Female 207 11.6 70.5 16.9 1.0Carbon 21 PALMERTON AREA SD White 446 7.6 61.7 28.7 2.0Carbon 21 PALMERTON AREA SD Black 3Carbon 21 PALMERTON AREA SD Hispanic 8Carbon 21 PALMERTON AREA SD Asian 1Carbon 21 PALMERTON AREA SD Native American 0Carbon 21 PALMERTON AREA SD Multi-ethnic 4Carbon 21 PALMERTON AREA SD IEP 77 0.0 32.5 55.8 11.7Carbon 21 PALMERTON AREA SD ELL 0Carbon 21 PALMERTON AREA SD Economically Disadvantaged 128 3.9 53.1 39.1 3.9
*Full Academic Year Students. Data for groups with less than 10 students assessed were replaced by blanks.Percentages were rounded to the nearest one-tenth.Proficiency percentages may not add up to 100 due to rounding. 56
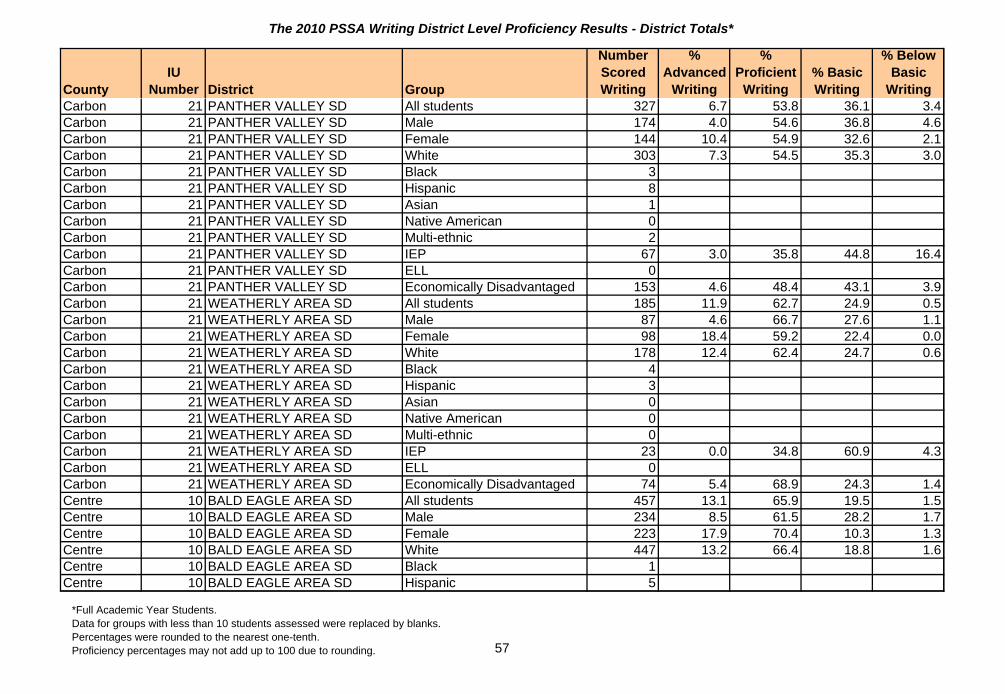
The 2010 PSSA Writing District Level Proficiency Results - District Totals*
CountyIU
Number District Group
Number Scored Writing
% Advanced
Writing
% Proficient
Writing% Basic Writing
% Below Basic
WritingCarbon 21 PANTHER VALLEY SD All students 327 6.7 53.8 36.1 3.4Carbon 21 PANTHER VALLEY SD Male 174 4.0 54.6 36.8 4.6Carbon 21 PANTHER VALLEY SD Female 144 10.4 54.9 32.6 2.1Carbon 21 PANTHER VALLEY SD White 303 7.3 54.5 35.3 3.0Carbon 21 PANTHER VALLEY SD Black 3Carbon 21 PANTHER VALLEY SD Hispanic 8Carbon 21 PANTHER VALLEY SD Asian 1Carbon 21 PANTHER VALLEY SD Native American 0Carbon 21 PANTHER VALLEY SD Multi-ethnic 2Carbon 21 PANTHER VALLEY SD IEP 67 3.0 35.8 44.8 16.4Carbon 21 PANTHER VALLEY SD ELL 0Carbon 21 PANTHER VALLEY SD Economically Disadvantaged 153 4.6 48.4 43.1 3.9Carbon 21 WEATHERLY AREA SD All students 185 11.9 62.7 24.9 0.5Carbon 21 WEATHERLY AREA SD Male 87 4.6 66.7 27.6 1.1Carbon 21 WEATHERLY AREA SD Female 98 18.4 59.2 22.4 0.0Carbon 21 WEATHERLY AREA SD White 178 12.4 62.4 24.7 0.6Carbon 21 WEATHERLY AREA SD Black 4Carbon 21 WEATHERLY AREA SD Hispanic 3Carbon 21 WEATHERLY AREA SD Asian 0Carbon 21 WEATHERLY AREA SD Native American 0Carbon 21 WEATHERLY AREA SD Multi-ethnic 0Carbon 21 WEATHERLY AREA SD IEP 23 0.0 34.8 60.9 4.3Carbon 21 WEATHERLY AREA SD ELL 0Carbon 21 WEATHERLY AREA SD Economically Disadvantaged 74 5.4 68.9 24.3 1.4Centre 10 BALD EAGLE AREA SD All students 457 13.1 65.9 19.5 1.5Centre 10 BALD EAGLE AREA SD Male 234 8.5 61.5 28.2 1.7Centre 10 BALD EAGLE AREA SD Female 223 17.9 70.4 10.3 1.3Centre 10 BALD EAGLE AREA SD White 447 13.2 66.4 18.8 1.6Centre 10 BALD EAGLE AREA SD Black 1Centre 10 BALD EAGLE AREA SD Hispanic 5
*Full Academic Year Students. Data for groups with less than 10 students assessed were replaced by blanks.Percentages were rounded to the nearest one-tenth.Proficiency percentages may not add up to 100 due to rounding. 57

The 2010 PSSA Writing District Level Proficiency Results - District Totals*
CountyIU
Number District Group
Number Scored Writing
% Advanced
Writing
% Proficient
Writing% Basic Writing
% Below Basic
WritingCentre 10 BALD EAGLE AREA SD Asian 2Centre 10 BALD EAGLE AREA SD Native American 2Centre 10 BALD EAGLE AREA SD Multi-ethnic 0Centre 10 BALD EAGLE AREA SD IEP 63 1.6 34.9 52.4 11.1Centre 10 BALD EAGLE AREA SD ELL 0Centre 10 BALD EAGLE AREA SD Economically Disadvantaged 169 8.9 62.7 26.6 1.8Centre 10 BELLEFONTE AREA SD All students 623 11.7 63.6 22.5 2.2Centre 10 BELLEFONTE AREA SD Male 288 6.9 56.9 33.3 2.8Centre 10 BELLEFONTE AREA SD Female 334 15.9 69.5 12.9 1.8Centre 10 BELLEFONTE AREA SD White 595 11.6 64.2 22.0 2.2Centre 10 BELLEFONTE AREA SD Black 11 18.2 54.5 18.2 9.1Centre 10 BELLEFONTE AREA SD Hispanic 5Centre 10 BELLEFONTE AREA SD Asian 6Centre 10 BELLEFONTE AREA SD Native American 1Centre 10 BELLEFONTE AREA SD Multi-ethnic 4Centre 10 BELLEFONTE AREA SD IEP 102 1.0 30.4 54.9 13.7Centre 10 BELLEFONTE AREA SD ELL 5Centre 10 BELLEFONTE AREA SD Economically Disadvantaged 182 6.6 54.4 34.1 4.9Centre 10 PENNS VALLEY AREA SD All students 348 9.2 69.0 21.6 0.3Centre 10 PENNS VALLEY AREA SD Male 173 5.2 67.6 26.6 0.6Centre 10 PENNS VALLEY AREA SD Female 174 13.2 70.7 16.1 0.0Centre 10 PENNS VALLEY AREA SD White 340 9.4 68.8 21.5 0.3Centre 10 PENNS VALLEY AREA SD Black 3Centre 10 PENNS VALLEY AREA SD Hispanic 2Centre 10 PENNS VALLEY AREA SD Asian 0Centre 10 PENNS VALLEY AREA SD Native American 2Centre 10 PENNS VALLEY AREA SD Multi-ethnic 0Centre 10 PENNS VALLEY AREA SD IEP 44 2.3 36.4 59.1 2.3Centre 10 PENNS VALLEY AREA SD ELL 0Centre 10 PENNS VALLEY AREA SD Economically Disadvantaged 81 6.2 67.9 24.7 1.2
*Full Academic Year Students. Data for groups with less than 10 students assessed were replaced by blanks.Percentages were rounded to the nearest one-tenth.Proficiency percentages may not add up to 100 due to rounding. 58

The 2010 PSSA Writing District Level Proficiency Results - District Totals*
CountyIU
Number District Group
Number Scored Writing
% Advanced
Writing
% Proficient
Writing% Basic Writing
% Below Basic
WritingCentre 10 STATE COLLEGE AREA SD All students 1,594 15.0 71.6 12.5 0.8Centre 10 STATE COLLEGE AREA SD Male 783 11.7 69.3 17.6 1.3Centre 10 STATE COLLEGE AREA SD Female 807 18.1 73.9 7.7 0.4Centre 10 STATE COLLEGE AREA SD White 1,382 14.5 72.0 12.6 0.9Centre 10 STATE COLLEGE AREA SD Black 45 8.9 66.7 24.4 0.0Centre 10 STATE COLLEGE AREA SD Hispanic 44 9.1 72.7 15.9 2.3Centre 10 STATE COLLEGE AREA SD Asian 88 30.7 62.5 6.8 0.0Centre 10 STATE COLLEGE AREA SD Native American 4Centre 10 STATE COLLEGE AREA SD Multi-ethnic 27 7.4 85.2 7.4 0.0Centre 10 STATE COLLEGE AREA SD IEP 185 3.2 50.8 39.5 6.5Centre 10 STATE COLLEGE AREA SD ELL 4Centre 10 STATE COLLEGE AREA SD Economically Disadvantaged 222 5.4 63.5 28.4 2.7Chester 24 AVON GROVE SD All students 1,347 14.3 70.9 14.3 0.6Chester 24 AVON GROVE SD Male 688 10.8 68.3 19.9 1.0Chester 24 AVON GROVE SD Female 657 18.0 73.7 8.2 0.2Chester 24 AVON GROVE SD White 1,075 15.3 72.7 11.5 0.5Chester 24 AVON GROVE SD Black 69 14.5 63.8 21.7 0.0Chester 24 AVON GROVE SD Hispanic 174 5.7 65.5 27.0 1.7Chester 24 AVON GROVE SD Asian 23 30.4 52.2 17.4 0.0Chester 24 AVON GROVE SD Native American 2Chester 24 AVON GROVE SD Multi-ethnic 1Chester 24 AVON GROVE SD IEP 169 1.2 45.6 50.9 2.4Chester 24 AVON GROVE SD ELL 29 0.0 41.4 48.3 10.3Chester 24 AVON GROVE SD Economically Disadvantaged 206 3.9 64.6 30.1 1.5Chester 24 COATESVILLE AREA SD All students 1,395 6.1 61.3 29.2 3.4Chester 24 COATESVILLE AREA SD Male 713 4.2 53.9 36.5 5.5Chester 24 COATESVILLE AREA SD Female 678 8.1 69.0 21.7 1.2Chester 24 COATESVILLE AREA SD White 760 7.6 66.8 23.8 1.7Chester 24 COATESVILLE AREA SD Black 465 4.1 53.8 35.7 6.5Chester 24 COATESVILLE AREA SD Hispanic 144 1.4 55.6 40.3 2.8
*Full Academic Year Students. Data for groups with less than 10 students assessed were replaced by blanks.Percentages were rounded to the nearest one-tenth.Proficiency percentages may not add up to 100 due to rounding. 59

The 2010 PSSA Writing District Level Proficiency Results - District Totals*
CountyIU
Number District Group
Number Scored Writing
% Advanced
Writing
% Proficient
Writing% Basic Writing
% Below Basic
WritingChester 24 COATESVILLE AREA SD Asian 20 30.0 60.0 10.0 0.0Chester 24 COATESVILLE AREA SD Native American 2Chester 24 COATESVILLE AREA SD Multi-ethnic 0Chester 24 COATESVILLE AREA SD IEP 237 1.3 30.0 51.5 17.3Chester 24 COATESVILLE AREA SD ELL 39 0.0 41.0 56.4 2.6Chester 24 COATESVILLE AREA SD Economically Disadvantaged 517 4.1 53.2 37.5 5.2Chester 24 DOWNINGTOWN AREA SD All students 2,799 17.5 68.3 13.1 1.0Chester 24 DOWNINGTOWN AREA SD Male 1,428 12.3 67.2 18.9 1.5Chester 24 DOWNINGTOWN AREA SD Female 1,369 22.9 69.5 7.1 0.5Chester 24 DOWNINGTOWN AREA SD White 2,423 18.0 69.2 12.0 0.8Chester 24 DOWNINGTOWN AREA SD Black 138 5.1 60.1 31.9 2.9Chester 24 DOWNINGTOWN AREA SD Hispanic 74 2.7 68.9 21.6 6.8Chester 24 DOWNINGTOWN AREA SD Asian 162 28.4 61.7 9.9 0.0Chester 24 DOWNINGTOWN AREA SD Native American 0Chester 24 DOWNINGTOWN AREA SD Multi-ethnic 0Chester 24 DOWNINGTOWN AREA SD IEP 481 5.0 53.8 35.3 5.8Chester 24 DOWNINGTOWN AREA SD ELL 21 0.0 52.4 42.9 4.8Chester 24 DOWNINGTOWN AREA SD Economically Disadvantaged 163 3.7 62.0 31.9 2.5Chester 24 GREAT VALLEY SD All students 923 23.6 67.2 8.9 0.3Chester 24 GREAT VALLEY SD Male 490 19.6 67.1 12.9 0.4Chester 24 GREAT VALLEY SD Female 433 28.2 67.2 4.4 0.2Chester 24 GREAT VALLEY SD White 772 23.2 68.5 8.2 0.1Chester 24 GREAT VALLEY SD Black 21 0.0 90.5 9.5 0.0Chester 24 GREAT VALLEY SD Hispanic 28 17.9 57.1 21.4 3.6Chester 24 GREAT VALLEY SD Asian 97 34.0 54.6 10.3 1.0Chester 24 GREAT VALLEY SD Native American 0Chester 24 GREAT VALLEY SD Multi-ethnic 5Chester 24 GREAT VALLEY SD IEP 151 4.6 59.6 34.4 1.3Chester 24 GREAT VALLEY SD ELL 8Chester 24 GREAT VALLEY SD Economically Disadvantaged 61 11.5 59.0 26.2 3.3
*Full Academic Year Students. Data for groups with less than 10 students assessed were replaced by blanks.Percentages were rounded to the nearest one-tenth.Proficiency percentages may not add up to 100 due to rounding. 60

The 2010 PSSA Writing District Level Proficiency Results - District Totals*
CountyIU
Number District Group
Number Scored Writing
% Advanced
Writing
% Proficient
Writing% Basic Writing
% Below Basic
WritingChester 24 KENNETT CONSOLIDATED SD All students 938 15.0 69.6 14.6 0.7Chester 24 KENNETT CONSOLIDATED SD Male 495 10.1 70.5 18.4 1.0Chester 24 KENNETT CONSOLIDATED SD Female 438 20.3 68.9 10.3 0.5Chester 24 KENNETT CONSOLIDATED SD White 542 20.3 73.1 6.5 0.2Chester 24 KENNETT CONSOLIDATED SD Black 34 2.9 73.5 17.6 5.9Chester 24 KENNETT CONSOLIDATED SD Hispanic 328 6.1 64.6 28.0 1.2Chester 24 KENNETT CONSOLIDATED SD Asian 29 27.6 62.1 10.3 0.0Chester 24 KENNETT CONSOLIDATED SD Native American 0Chester 24 KENNETT CONSOLIDATED SD Multi-ethnic 0Chester 24 KENNETT CONSOLIDATED SD IEP 153 2.6 57.5 35.9 3.9Chester 24 KENNETT CONSOLIDATED SD ELL 77 0.0 42.9 54.5 2.6Chester 24 KENNETT CONSOLIDATED SD Economically Disadvantaged 297 5.1 66.0 27.6 1.3Chester 24 OCTORARA AREA SD All students 607 4.9 63.1 30.1 1.8Chester 24 OCTORARA AREA SD Male 308 2.6 53.2 40.9 3.2Chester 24 OCTORARA AREA SD Female 298 7.4 73.5 19.1 0.0Chester 24 OCTORARA AREA SD White 536 5.2 65.3 28.2 1.3Chester 24 OCTORARA AREA SD Black 34 2.9 41.2 50.0 5.9Chester 24 OCTORARA AREA SD Hispanic 31 0.0 54.8 41.9 3.2Chester 24 OCTORARA AREA SD Asian 1Chester 24 OCTORARA AREA SD Native American 3Chester 24 OCTORARA AREA SD Multi-ethnic 1Chester 24 OCTORARA AREA SD IEP 97 0.0 35.1 55.7 9.3Chester 24 OCTORARA AREA SD ELL 1Chester 24 OCTORARA AREA SD Economically Disadvantaged 147 1.4 49.7 47.6 1.4Chester 24 OWEN J ROBERTS SD All students 1,179 17.4 64.8 17.0 0.8Chester 24 OWEN J ROBERTS SD Male 620 11.1 63.4 24.4 1.1Chester 24 OWEN J ROBERTS SD Female 559 24.3 66.4 8.9 0.4Chester 24 OWEN J ROBERTS SD White 1,115 17.8 64.6 16.9 0.8Chester 24 OWEN J ROBERTS SD Black 30 6.7 73.3 20.0 0.0Chester 24 OWEN J ROBERTS SD Hispanic 13 15.4 69.2 15.4 0.0
*Full Academic Year Students. Data for groups with less than 10 students assessed were replaced by blanks.Percentages were rounded to the nearest one-tenth.Proficiency percentages may not add up to 100 due to rounding. 61

The 2010 PSSA Writing District Level Proficiency Results - District Totals*
CountyIU
Number District Group
Number Scored Writing
% Advanced
Writing
% Proficient
Writing% Basic Writing
% Below Basic
WritingChester 24 OWEN J ROBERTS SD Asian 13 15.4 61.5 23.1 0.0Chester 24 OWEN J ROBERTS SD Native American 4Chester 24 OWEN J ROBERTS SD Multi-ethnic 4Chester 24 OWEN J ROBERTS SD IEP 221 1.8 51.6 43.0 3.6Chester 24 OWEN J ROBERTS SD ELL 3Chester 24 OWEN J ROBERTS SD Economically Disadvantaged 139 11.5 56.8 29.5 2.2Chester 24 OXFORD AREA SD All students 822 10.7 70.0 18.1 1.2Chester 24 OXFORD AREA SD Male 434 5.5 67.3 25.1 2.1Chester 24 OXFORD AREA SD Female 388 16.5 72.9 10.3 0.3Chester 24 OXFORD AREA SD White 621 13.0 71.0 15.1 0.8Chester 24 OXFORD AREA SD Black 54 7.4 64.8 24.1 3.7Chester 24 OXFORD AREA SD Hispanic 140 2.1 67.1 28.6 2.1Chester 24 OXFORD AREA SD Asian 4Chester 24 OXFORD AREA SD Native American 0Chester 24 OXFORD AREA SD Multi-ethnic 2Chester 24 OXFORD AREA SD IEP 131 1.5 44.3 49.6 4.6Chester 24 OXFORD AREA SD ELL 44 0.0 34.1 59.1 6.8Chester 24 OXFORD AREA SD Economically Disadvantaged 286 4.5 66.8 27.6 1.0Chester 24 PHOENIXVILLE AREA SD All students 753 10.6 67.2 20.5 1.7Chester 24 PHOENIXVILLE AREA SD Male 399 7.0 64.9 25.3 2.8Chester 24 PHOENIXVILLE AREA SD Female 352 14.8 70.2 14.5 0.6Chester 24 PHOENIXVILLE AREA SD White 623 11.7 70.9 16.1 1.3Chester 24 PHOENIXVILLE AREA SD Black 85 1.2 51.8 44.7 2.4Chester 24 PHOENIXVILLE AREA SD Hispanic 23 4.3 43.5 43.5 8.7Chester 24 PHOENIXVILLE AREA SD Asian 16 25.0 56.3 18.8 0.0Chester 24 PHOENIXVILLE AREA SD Native American 1Chester 24 PHOENIXVILLE AREA SD Multi-ethnic 3Chester 24 PHOENIXVILLE AREA SD IEP 149 2.0 53.7 38.3 6.0Chester 24 PHOENIXVILLE AREA SD ELL 8Chester 24 PHOENIXVILLE AREA SD Economically Disadvantaged 160 3.1 53.1 39.4 4.4
*Full Academic Year Students. Data for groups with less than 10 students assessed were replaced by blanks.Percentages were rounded to the nearest one-tenth.Proficiency percentages may not add up to 100 due to rounding. 62

The 2010 PSSA Writing District Level Proficiency Results - District Totals*
CountyIU
Number District Group
Number Scored Writing
% Advanced
Writing
% Proficient
Writing% Basic Writing
% Below Basic
WritingChester 24 TREDYFFRIN-EASTTOWN SD All students 1,459 24.1 69.4 6.4 0.1Chester 24 TREDYFFRIN-EASTTOWN SD Male 705 18.2 73.2 8.5 0.1Chester 24 TREDYFFRIN-EASTTOWN SD Female 754 29.6 65.9 4.5 0.0Chester 24 TREDYFFRIN-EASTTOWN SD White 1,196 23.8 69.9 6.2 0.1Chester 24 TREDYFFRIN-EASTTOWN SD Black 57 3.5 77.2 19.3 0.0Chester 24 TREDYFFRIN-EASTTOWN SD Hispanic 29 24.1 75.9 0.0 0.0Chester 24 TREDYFFRIN-EASTTOWN SD Asian 176 31.8 63.1 5.1 0.0Chester 24 TREDYFFRIN-EASTTOWN SD Native American 1Chester 24 TREDYFFRIN-EASTTOWN SD Multi-ethnic 0Chester 24 TREDYFFRIN-EASTTOWN SD IEP 204 10.8 65.2 24.0 0.0Chester 24 TREDYFFRIN-EASTTOWN SD ELL 8Chester 24 TREDYFFRIN-EASTTOWN SD Economically Disadvantaged 59 13.6 66.1 20.3 0.0Chester 24 UNIONVILLE-CHADDS FORD SDAll students 984 14.5 76.4 8.7 0.3Chester 24 UNIONVILLE-CHADDS FORD SDMale 523 9.2 77.2 13.0 0.6Chester 24 UNIONVILLE-CHADDS FORD SDFemale 461 20.6 75.5 3.9 0.0Chester 24 UNIONVILLE-CHADDS FORD SDWhite 907 14.2 76.8 8.6 0.3Chester 24 UNIONVILLE-CHADDS FORD SDBlack 13 7.7 69.2 23.1 0.0Chester 24 UNIONVILLE-CHADDS FORD SDHispanic 18 16.7 61.1 22.2 0.0Chester 24 UNIONVILLE-CHADDS FORD SDAsian 46 21.7 76.1 2.2 0.0Chester 24 UNIONVILLE-CHADDS FORD SDNative American 0Chester 24 UNIONVILLE-CHADDS FORD SDMulti-ethnic 0Chester 24 UNIONVILLE-CHADDS FORD SDIEP 160 4.4 66.3 27.5 1.9Chester 24 UNIONVILLE-CHADDS FORD SDELL 7Chester 24 UNIONVILLE-CHADDS FORD SDEconomically Disadvantaged 22 4.5 63.6 31.8 0.0Chester 24 WEST CHESTER AREA SD All students 2,785 16.1 68.5 14.3 1.1Chester 24 WEST CHESTER AREA SD Male 1,415 11.9 66.9 19.3 1.9Chester 24 WEST CHESTER AREA SD Female 1,364 20.4 70.4 8.9 0.4Chester 24 WEST CHESTER AREA SD White 2,314 16.9 70.0 12.4 0.7Chester 24 WEST CHESTER AREA SD Black 202 6.4 55.9 34.2 3.5Chester 24 WEST CHESTER AREA SD Hispanic 112 5.4 58.0 29.5 7.1
*Full Academic Year Students. Data for groups with less than 10 students assessed were replaced by blanks.Percentages were rounded to the nearest one-tenth.Proficiency percentages may not add up to 100 due to rounding. 63
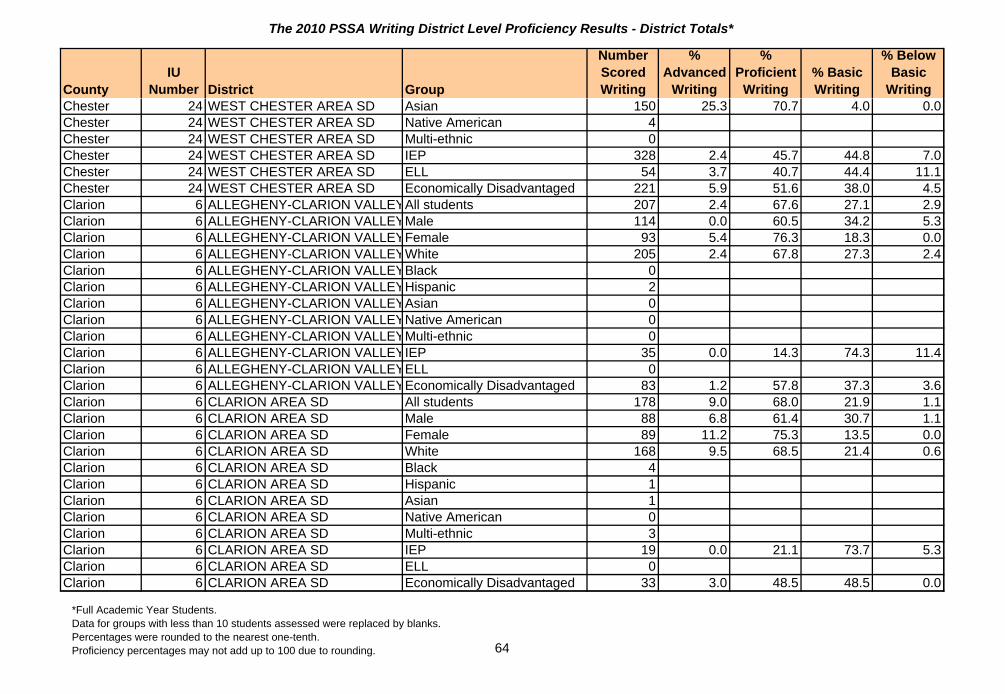
The 2010 PSSA Writing District Level Proficiency Results - District Totals*
CountyIU
Number District Group
Number Scored Writing
% Advanced
Writing
% Proficient
Writing% Basic Writing
% Below Basic
WritingChester 24 WEST CHESTER AREA SD Asian 150 25.3 70.7 4.0 0.0Chester 24 WEST CHESTER AREA SD Native American 4Chester 24 WEST CHESTER AREA SD Multi-ethnic 0Chester 24 WEST CHESTER AREA SD IEP 328 2.4 45.7 44.8 7.0Chester 24 WEST CHESTER AREA SD ELL 54 3.7 40.7 44.4 11.1Chester 24 WEST CHESTER AREA SD Economically Disadvantaged 221 5.9 51.6 38.0 4.5Clarion 6 ALLEGHENY-CLARION VALLEYAll students 207 2.4 67.6 27.1 2.9Clarion 6 ALLEGHENY-CLARION VALLEYMale 114 0.0 60.5 34.2 5.3Clarion 6 ALLEGHENY-CLARION VALLEYFemale 93 5.4 76.3 18.3 0.0Clarion 6 ALLEGHENY-CLARION VALLEYWhite 205 2.4 67.8 27.3 2.4Clarion 6 ALLEGHENY-CLARION VALLEYBlack 0Clarion 6 ALLEGHENY-CLARION VALLEYHispanic 2Clarion 6 ALLEGHENY-CLARION VALLEYAsian 0Clarion 6 ALLEGHENY-CLARION VALLEYNative American 0Clarion 6 ALLEGHENY-CLARION VALLEYMulti-ethnic 0Clarion 6 ALLEGHENY-CLARION VALLEYIEP 35 0.0 14.3 74.3 11.4Clarion 6 ALLEGHENY-CLARION VALLEYELL 0Clarion 6 ALLEGHENY-CLARION VALLEYEconomically Disadvantaged 83 1.2 57.8 37.3 3.6Clarion 6 CLARION AREA SD All students 178 9.0 68.0 21.9 1.1Clarion 6 CLARION AREA SD Male 88 6.8 61.4 30.7 1.1Clarion 6 CLARION AREA SD Female 89 11.2 75.3 13.5 0.0Clarion 6 CLARION AREA SD White 168 9.5 68.5 21.4 0.6Clarion 6 CLARION AREA SD Black 4Clarion 6 CLARION AREA SD Hispanic 1Clarion 6 CLARION AREA SD Asian 1Clarion 6 CLARION AREA SD Native American 0Clarion 6 CLARION AREA SD Multi-ethnic 3Clarion 6 CLARION AREA SD IEP 19 0.0 21.1 73.7 5.3Clarion 6 CLARION AREA SD ELL 0Clarion 6 CLARION AREA SD Economically Disadvantaged 33 3.0 48.5 48.5 0.0
*Full Academic Year Students. Data for groups with less than 10 students assessed were replaced by blanks.Percentages were rounded to the nearest one-tenth.Proficiency percentages may not add up to 100 due to rounding. 64

The 2010 PSSA Writing District Level Proficiency Results - District Totals*
CountyIU
Number District Group
Number Scored Writing
% Advanced
Writing
% Proficient
Writing% Basic Writing
% Below Basic
WritingClarion 6 CLARION-LIMESTONE AREA SDAll students 257 8.2 59.9 30.4 1.6Clarion 6 CLARION-LIMESTONE AREA SDMale 134 6.7 54.5 36.6 2.2Clarion 6 CLARION-LIMESTONE AREA SDFemale 123 9.8 65.9 23.6 0.8Clarion 6 CLARION-LIMESTONE AREA SDWhite 247 8.5 59.9 30.0 1.6Clarion 6 CLARION-LIMESTONE AREA SDBlack 6Clarion 6 CLARION-LIMESTONE AREA SDHispanic 3Clarion 6 CLARION-LIMESTONE AREA SDAsian 1Clarion 6 CLARION-LIMESTONE AREA SDNative American 0Clarion 6 CLARION-LIMESTONE AREA SDMulti-ethnic 0Clarion 6 CLARION-LIMESTONE AREA SDIEP 32 0.0 18.8 71.9 9.4Clarion 6 CLARION-LIMESTONE AREA SDELL 0Clarion 6 CLARION-LIMESTONE AREA SDEconomically Disadvantaged 81 3.7 56.8 35.8 3.7Clarion 6 KEYSTONE SD All students 244 4.5 62.3 32.0 1.2Clarion 6 KEYSTONE SD Male 121 0.8 54.5 42.1 2.5Clarion 6 KEYSTONE SD Female 123 8.1 69.9 22.0 0.0Clarion 6 KEYSTONE SD White 241 4.6 62.2 32.0 1.2Clarion 6 KEYSTONE SD Black 2Clarion 6 KEYSTONE SD Hispanic 0Clarion 6 KEYSTONE SD Asian 1Clarion 6 KEYSTONE SD Native American 0Clarion 6 KEYSTONE SD Multi-ethnic 0Clarion 6 KEYSTONE SD IEP 28 0.0 32.1 60.7 7.1Clarion 6 KEYSTONE SD ELL 0Clarion 6 KEYSTONE SD Economically Disadvantaged 86 0.0 62.8 37.2 0.0Clarion 6 NORTH CLARION COUNTY SD All students 153 13.1 68.0 18.3 0.7Clarion 6 NORTH CLARION COUNTY SD Male 79 5.1 72.2 21.5 1.3Clarion 6 NORTH CLARION COUNTY SD Female 74 21.6 63.5 14.9 0.0Clarion 6 NORTH CLARION COUNTY SD White 148 13.5 66.9 18.9 0.7Clarion 6 NORTH CLARION COUNTY SD Black 3Clarion 6 NORTH CLARION COUNTY SD Hispanic 0
*Full Academic Year Students. Data for groups with less than 10 students assessed were replaced by blanks.Percentages were rounded to the nearest one-tenth.Proficiency percentages may not add up to 100 due to rounding. 65

The 2010 PSSA Writing District Level Proficiency Results - District Totals*
CountyIU
Number District Group
Number Scored Writing
% Advanced
Writing
% Proficient
Writing% Basic Writing
% Below Basic
WritingClarion 6 NORTH CLARION COUNTY SD Asian 2Clarion 6 NORTH CLARION COUNTY SD Native American 0Clarion 6 NORTH CLARION COUNTY SD Multi-ethnic 0Clarion 6 NORTH CLARION COUNTY SD IEP 19 0.0 36.8 57.9 5.3Clarion 6 NORTH CLARION COUNTY SD ELL 0Clarion 6 NORTH CLARION COUNTY SD Economically Disadvantaged 53 7.5 69.8 20.8 1.9Clarion 6 REDBANK VALLEY SD All students 275 9.1 72.0 18.2 0.7Clarion 6 REDBANK VALLEY SD Male 134 6.7 67.9 23.9 1.5Clarion 6 REDBANK VALLEY SD Female 141 11.3 75.9 12.8 0.0Clarion 6 REDBANK VALLEY SD White 271 9.2 71.6 18.5 0.7Clarion 6 REDBANK VALLEY SD Black 3Clarion 6 REDBANK VALLEY SD Hispanic 0Clarion 6 REDBANK VALLEY SD Asian 1Clarion 6 REDBANK VALLEY SD Native American 0Clarion 6 REDBANK VALLEY SD Multi-ethnic 0Clarion 6 REDBANK VALLEY SD IEP 39 0.0 43.6 53.8 2.6Clarion 6 REDBANK VALLEY SD ELL 0Clarion 6 REDBANK VALLEY SD Economically Disadvantaged 109 4.6 67.9 26.6 0.9Clarion 6 UNION SD All students 149 10.1 69.1 18.8 2.0Clarion 6 UNION SD Male 69 2.9 60.9 33.3 2.9Clarion 6 UNION SD Female 80 16.3 76.3 6.3 1.3Clarion 6 UNION SD White 146 10.3 69.9 17.8 2.1Clarion 6 UNION SD Black 3Clarion 6 UNION SD Hispanic 0Clarion 6 UNION SD Asian 0Clarion 6 UNION SD Native American 0Clarion 6 UNION SD Multi-ethnic 0Clarion 6 UNION SD IEP 20 0.0 15.0 70.0 15.0Clarion 6 UNION SD ELL 0Clarion 6 UNION SD Economically Disadvantaged 72 4.2 65.3 26.4 4.2
*Full Academic Year Students. Data for groups with less than 10 students assessed were replaced by blanks.Percentages were rounded to the nearest one-tenth.Proficiency percentages may not add up to 100 due to rounding. 66

The 2010 PSSA Writing District Level Proficiency Results - District Totals*
CountyIU
Number District Group
Number Scored Writing
% Advanced
Writing
% Proficient
Writing% Basic Writing
% Below Basic
WritingClearfield 10 CLEARFIELD AREA SD All students 606 5.8 62.2 27.2 4.8Clearfield 10 CLEARFIELD AREA SD Male 323 3.4 57.0 31.6 8.0Clearfield 10 CLEARFIELD AREA SD Female 282 8.5 68.1 22.3 1.1Clearfield 10 CLEARFIELD AREA SD White 587 5.8 62.2 27.6 4.4Clearfield 10 CLEARFIELD AREA SD Black 5Clearfield 10 CLEARFIELD AREA SD Hispanic 0Clearfield 10 CLEARFIELD AREA SD Asian 4Clearfield 10 CLEARFIELD AREA SD Native American 1Clearfield 10 CLEARFIELD AREA SD Multi-ethnic 8Clearfield 10 CLEARFIELD AREA SD IEP 112 0.9 25.0 56.3 17.9Clearfield 10 CLEARFIELD AREA SD ELL 0Clearfield 10 CLEARFIELD AREA SD Economically Disadvantaged 309 3.2 51.8 37.5 7.4Clearfield 10 CURWENSVILLE AREA SD All students 278 6.5 70.9 19.8 2.9Clearfield 10 CURWENSVILLE AREA SD Male 142 3.5 68.3 23.2 4.9Clearfield 10 CURWENSVILLE AREA SD Female 136 9.6 73.5 16.2 0.7Clearfield 10 CURWENSVILLE AREA SD White 273 6.2 71.4 19.4 2.9Clearfield 10 CURWENSVILLE AREA SD Black 5Clearfield 10 CURWENSVILLE AREA SD Hispanic 0Clearfield 10 CURWENSVILLE AREA SD Asian 0Clearfield 10 CURWENSVILLE AREA SD Native American 0Clearfield 10 CURWENSVILLE AREA SD Multi-ethnic 0Clearfield 10 CURWENSVILLE AREA SD IEP 37 0.0 35.1 48.6 16.2Clearfield 10 CURWENSVILLE AREA SD ELL 0Clearfield 10 CURWENSVILLE AREA SD Economically Disadvantaged 109 9.2 63.3 22.9 4.6Clearfield 6 DUBOIS AREA SD All students 980 11.6 64.6 21.4 2.3Clearfield 6 DUBOIS AREA SD Male 515 8.9 61.9 26.0 3.1Clearfield 6 DUBOIS AREA SD Female 464 14.7 67.5 16.4 1.5Clearfield 6 DUBOIS AREA SD White 961 11.3 64.7 21.5 2.4Clearfield 6 DUBOIS AREA SD Black 1Clearfield 6 DUBOIS AREA SD Hispanic 3
*Full Academic Year Students. Data for groups with less than 10 students assessed were replaced by blanks.Percentages were rounded to the nearest one-tenth.Proficiency percentages may not add up to 100 due to rounding. 67
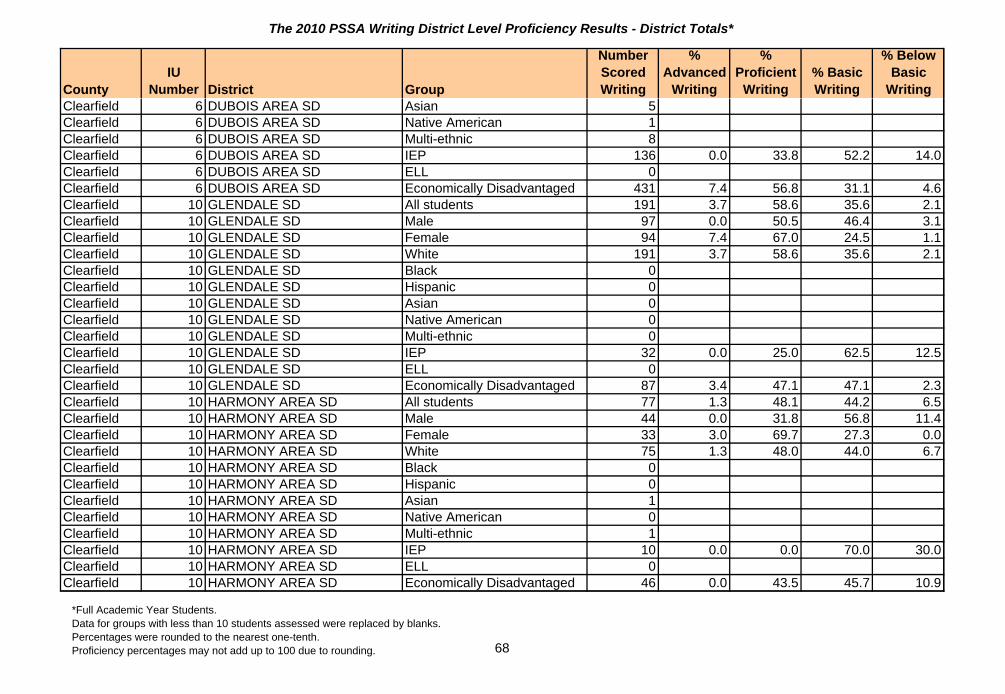
The 2010 PSSA Writing District Level Proficiency Results - District Totals*
CountyIU
Number District Group
Number Scored Writing
% Advanced
Writing
% Proficient
Writing% Basic Writing
% Below Basic
WritingClearfield 6 DUBOIS AREA SD Asian 5Clearfield 6 DUBOIS AREA SD Native American 1Clearfield 6 DUBOIS AREA SD Multi-ethnic 8Clearfield 6 DUBOIS AREA SD IEP 136 0.0 33.8 52.2 14.0Clearfield 6 DUBOIS AREA SD ELL 0Clearfield 6 DUBOIS AREA SD Economically Disadvantaged 431 7.4 56.8 31.1 4.6Clearfield 10 GLENDALE SD All students 191 3.7 58.6 35.6 2.1Clearfield 10 GLENDALE SD Male 97 0.0 50.5 46.4 3.1Clearfield 10 GLENDALE SD Female 94 7.4 67.0 24.5 1.1Clearfield 10 GLENDALE SD White 191 3.7 58.6 35.6 2.1Clearfield 10 GLENDALE SD Black 0Clearfield 10 GLENDALE SD Hispanic 0Clearfield 10 GLENDALE SD Asian 0Clearfield 10 GLENDALE SD Native American 0Clearfield 10 GLENDALE SD Multi-ethnic 0Clearfield 10 GLENDALE SD IEP 32 0.0 25.0 62.5 12.5Clearfield 10 GLENDALE SD ELL 0Clearfield 10 GLENDALE SD Economically Disadvantaged 87 3.4 47.1 47.1 2.3Clearfield 10 HARMONY AREA SD All students 77 1.3 48.1 44.2 6.5Clearfield 10 HARMONY AREA SD Male 44 0.0 31.8 56.8 11.4Clearfield 10 HARMONY AREA SD Female 33 3.0 69.7 27.3 0.0Clearfield 10 HARMONY AREA SD White 75 1.3 48.0 44.0 6.7Clearfield 10 HARMONY AREA SD Black 0Clearfield 10 HARMONY AREA SD Hispanic 0Clearfield 10 HARMONY AREA SD Asian 1Clearfield 10 HARMONY AREA SD Native American 0Clearfield 10 HARMONY AREA SD Multi-ethnic 1Clearfield 10 HARMONY AREA SD IEP 10 0.0 0.0 70.0 30.0Clearfield 10 HARMONY AREA SD ELL 0Clearfield 10 HARMONY AREA SD Economically Disadvantaged 46 0.0 43.5 45.7 10.9
*Full Academic Year Students. Data for groups with less than 10 students assessed were replaced by blanks.Percentages were rounded to the nearest one-tenth.Proficiency percentages may not add up to 100 due to rounding. 68

The 2010 PSSA Writing District Level Proficiency Results - District Totals*
CountyIU
Number District Group
Number Scored Writing
% Advanced
Writing
% Proficient
Writing% Basic Writing
% Below Basic
WritingClearfield 10 MOSHANNON VALLEY SD All students 224 6.3 65.6 25.9 2.2Clearfield 10 MOSHANNON VALLEY SD Male 121 3.3 59.5 33.1 4.1Clearfield 10 MOSHANNON VALLEY SD Female 103 9.7 72.8 17.5 0.0Clearfield 10 MOSHANNON VALLEY SD White 222 6.3 65.3 26.1 2.3Clearfield 10 MOSHANNON VALLEY SD Black 1Clearfield 10 MOSHANNON VALLEY SD Hispanic 0Clearfield 10 MOSHANNON VALLEY SD Asian 0Clearfield 10 MOSHANNON VALLEY SD Native American 0Clearfield 10 MOSHANNON VALLEY SD Multi-ethnic 1Clearfield 10 MOSHANNON VALLEY SD IEP 25 0.0 24.0 56.0 20.0Clearfield 10 MOSHANNON VALLEY SD ELL 0Clearfield 10 MOSHANNON VALLEY SD Economically Disadvantaged 87 1.1 57.5 40.2 1.1Clearfield 10 PHILIPSBURG-OSCEOLA AREAAll students 432 10.2 56.3 29.9 3.7Clearfield 10 PHILIPSBURG-OSCEOLA AREAMale 218 6.0 51.4 36.7 6.0Clearfield 10 PHILIPSBURG-OSCEOLA AREAFemale 212 14.6 61.8 22.6 0.9Clearfield 10 PHILIPSBURG-OSCEOLA AREAWhite 424 10.1 56.1 30.2 3.5Clearfield 10 PHILIPSBURG-OSCEOLA AREABlack 2Clearfield 10 PHILIPSBURG-OSCEOLA AREAHispanic 1Clearfield 10 PHILIPSBURG-OSCEOLA AREAAsian 3Clearfield 10 PHILIPSBURG-OSCEOLA AREANative American 0Clearfield 10 PHILIPSBURG-OSCEOLA AREAMulti-ethnic 0Clearfield 10 PHILIPSBURG-OSCEOLA AREAIEP 67 1.5 22.4 62.7 13.4Clearfield 10 PHILIPSBURG-OSCEOLA AREAELL 0Clearfield 10 PHILIPSBURG-OSCEOLA AREAEconomically Disadvantaged 191 2.6 52.4 38.7 6.3Clearfield 10 WEST BRANCH AREA SD All students 266 2.3 57.9 37.2 2.6Clearfield 10 WEST BRANCH AREA SD Male 137 2.2 48.9 45.3 3.6Clearfield 10 WEST BRANCH AREA SD Female 129 2.3 67.4 28.7 1.6Clearfield 10 WEST BRANCH AREA SD White 262 2.3 57.6 37.4 2.7Clearfield 10 WEST BRANCH AREA SD Black 2Clearfield 10 WEST BRANCH AREA SD Hispanic 1
*Full Academic Year Students. Data for groups with less than 10 students assessed were replaced by blanks.Percentages were rounded to the nearest one-tenth.Proficiency percentages may not add up to 100 due to rounding. 69

The 2010 PSSA Writing District Level Proficiency Results - District Totals*
CountyIU
Number District Group
Number Scored Writing
% Advanced
Writing
% Proficient
Writing% Basic Writing
% Below Basic
WritingClearfield 10 WEST BRANCH AREA SD Asian 0Clearfield 10 WEST BRANCH AREA SD Native American 1Clearfield 10 WEST BRANCH AREA SD Multi-ethnic 0Clearfield 10 WEST BRANCH AREA SD IEP 48 0.0 35.4 54.2 10.4Clearfield 10 WEST BRANCH AREA SD ELL 0Clearfield 10 WEST BRANCH AREA SD Economically Disadvantaged 128 0.8 51.6 43.8 3.9Clinton 10 KEYSTONE CENTRAL SD All students 1,016 4.3 53.1 38.9 3.7Clinton 10 KEYSTONE CENTRAL SD Male 534 3.0 44.4 46.6 6.0Clinton 10 KEYSTONE CENTRAL SD Female 482 5.8 62.7 30.3 1.2Clinton 10 KEYSTONE CENTRAL SD White 976 4.5 52.9 38.7 3.9Clinton 10 KEYSTONE CENTRAL SD Black 13 0.0 46.2 53.8 0.0Clinton 10 KEYSTONE CENTRAL SD Hispanic 7Clinton 10 KEYSTONE CENTRAL SD Asian 12 0.0 83.3 16.7 0.0Clinton 10 KEYSTONE CENTRAL SD Native American 4Clinton 10 KEYSTONE CENTRAL SD Multi-ethnic 4Clinton 10 KEYSTONE CENTRAL SD IEP 185 0.5 18.9 64.3 16.2Clinton 10 KEYSTONE CENTRAL SD ELL 1Clinton 10 KEYSTONE CENTRAL SD Economically Disadvantaged 413 2.9 42.9 48.7 5.6Columbia 16 BENTON AREA SD All students 159 3.1 74.2 22.0 0.6Columbia 16 BENTON AREA SD Male 85 2.4 72.9 23.5 1.2Columbia 16 BENTON AREA SD Female 73 4.1 75.3 20.5 0.0Columbia 16 BENTON AREA SD White 155 3.2 74.2 21.9 0.6Columbia 16 BENTON AREA SD Black 1Columbia 16 BENTON AREA SD Hispanic 2Columbia 16 BENTON AREA SD Asian 0Columbia 16 BENTON AREA SD Native American 0Columbia 16 BENTON AREA SD Multi-ethnic 0Columbia 16 BENTON AREA SD IEP 21 0.0 42.9 57.1 0.0Columbia 16 BENTON AREA SD ELL 0Columbia 16 BENTON AREA SD Economically Disadvantaged 58 1.7 75.9 20.7 1.7
*Full Academic Year Students. Data for groups with less than 10 students assessed were replaced by blanks.Percentages were rounded to the nearest one-tenth.Proficiency percentages may not add up to 100 due to rounding. 70
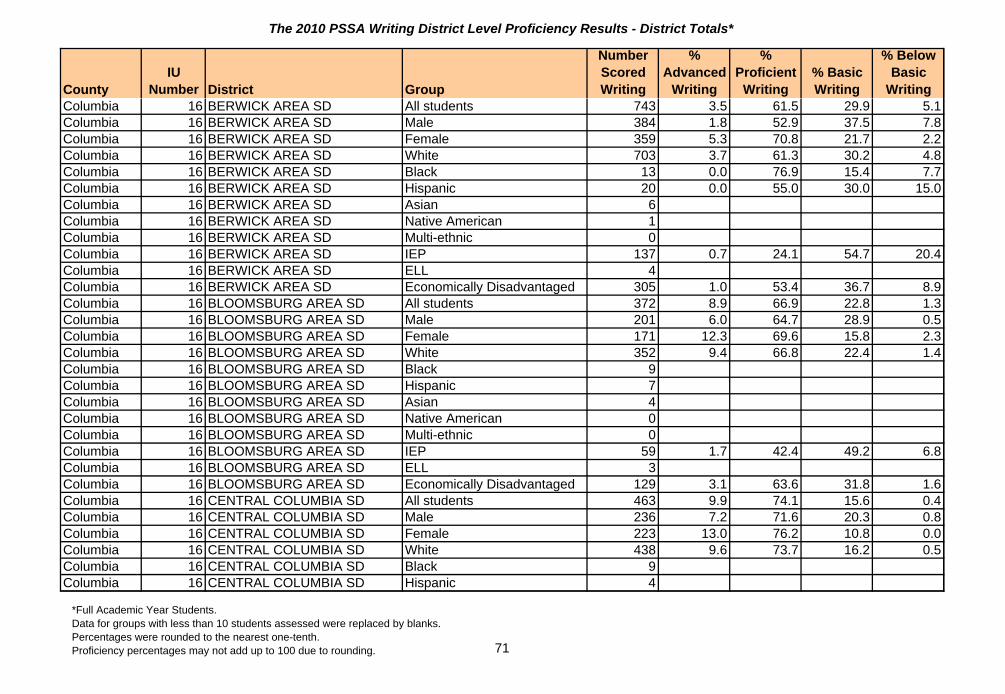
The 2010 PSSA Writing District Level Proficiency Results - District Totals*
CountyIU
Number District Group
Number Scored Writing
% Advanced
Writing
% Proficient
Writing% Basic Writing
% Below Basic
WritingColumbia 16 BERWICK AREA SD All students 743 3.5 61.5 29.9 5.1Columbia 16 BERWICK AREA SD Male 384 1.8 52.9 37.5 7.8Columbia 16 BERWICK AREA SD Female 359 5.3 70.8 21.7 2.2Columbia 16 BERWICK AREA SD White 703 3.7 61.3 30.2 4.8Columbia 16 BERWICK AREA SD Black 13 0.0 76.9 15.4 7.7Columbia 16 BERWICK AREA SD Hispanic 20 0.0 55.0 30.0 15.0Columbia 16 BERWICK AREA SD Asian 6Columbia 16 BERWICK AREA SD Native American 1Columbia 16 BERWICK AREA SD Multi-ethnic 0Columbia 16 BERWICK AREA SD IEP 137 0.7 24.1 54.7 20.4Columbia 16 BERWICK AREA SD ELL 4Columbia 16 BERWICK AREA SD Economically Disadvantaged 305 1.0 53.4 36.7 8.9Columbia 16 BLOOMSBURG AREA SD All students 372 8.9 66.9 22.8 1.3Columbia 16 BLOOMSBURG AREA SD Male 201 6.0 64.7 28.9 0.5Columbia 16 BLOOMSBURG AREA SD Female 171 12.3 69.6 15.8 2.3Columbia 16 BLOOMSBURG AREA SD White 352 9.4 66.8 22.4 1.4Columbia 16 BLOOMSBURG AREA SD Black 9Columbia 16 BLOOMSBURG AREA SD Hispanic 7Columbia 16 BLOOMSBURG AREA SD Asian 4Columbia 16 BLOOMSBURG AREA SD Native American 0Columbia 16 BLOOMSBURG AREA SD Multi-ethnic 0Columbia 16 BLOOMSBURG AREA SD IEP 59 1.7 42.4 49.2 6.8Columbia 16 BLOOMSBURG AREA SD ELL 3Columbia 16 BLOOMSBURG AREA SD Economically Disadvantaged 129 3.1 63.6 31.8 1.6Columbia 16 CENTRAL COLUMBIA SD All students 463 9.9 74.1 15.6 0.4Columbia 16 CENTRAL COLUMBIA SD Male 236 7.2 71.6 20.3 0.8Columbia 16 CENTRAL COLUMBIA SD Female 223 13.0 76.2 10.8 0.0Columbia 16 CENTRAL COLUMBIA SD White 438 9.6 73.7 16.2 0.5Columbia 16 CENTRAL COLUMBIA SD Black 9Columbia 16 CENTRAL COLUMBIA SD Hispanic 4
*Full Academic Year Students. Data for groups with less than 10 students assessed were replaced by blanks.Percentages were rounded to the nearest one-tenth.Proficiency percentages may not add up to 100 due to rounding. 71

The 2010 PSSA Writing District Level Proficiency Results - District Totals*
CountyIU
Number District Group
Number Scored Writing
% Advanced
Writing
% Proficient
Writing% Basic Writing
% Below Basic
WritingColumbia 16 CENTRAL COLUMBIA SD Asian 8Columbia 16 CENTRAL COLUMBIA SD Native American 0Columbia 16 CENTRAL COLUMBIA SD Multi-ethnic 0Columbia 16 CENTRAL COLUMBIA SD IEP 45 0.0 51.1 44.4 4.4Columbia 16 CENTRAL COLUMBIA SD ELL 0Columbia 16 CENTRAL COLUMBIA SD Economically Disadvantaged 93 3.2 72.0 24.7 0.0Columbia 16 MILLVILLE AREA SD All students 152 10.5 68.4 19.1 2.0Columbia 16 MILLVILLE AREA SD Male 77 7.8 61.0 27.3 3.9Columbia 16 MILLVILLE AREA SD Female 75 13.3 76.0 10.7 0.0Columbia 16 MILLVILLE AREA SD White 145 11.0 67.6 19.3 2.1Columbia 16 MILLVILLE AREA SD Black 5Columbia 16 MILLVILLE AREA SD Hispanic 2Columbia 16 MILLVILLE AREA SD Asian 0Columbia 16 MILLVILLE AREA SD Native American 0Columbia 16 MILLVILLE AREA SD Multi-ethnic 0Columbia 16 MILLVILLE AREA SD IEP 28 0.0 39.3 50.0 10.7Columbia 16 MILLVILLE AREA SD ELL 1Columbia 16 MILLVILLE AREA SD Economically Disadvantaged 55 5.5 65.5 25.5 3.6Columbia 16 SOUTHERN COLUMBIA AREA SAll students 330 12.7 72.4 13.0 1.8Columbia 16 SOUTHERN COLUMBIA AREA SMale 174 8.6 69.0 20.1 2.3Columbia 16 SOUTHERN COLUMBIA AREA SFemale 156 17.3 76.3 5.1 1.3Columbia 16 SOUTHERN COLUMBIA AREA SWhite 323 12.4 72.8 13.0 1.9Columbia 16 SOUTHERN COLUMBIA AREA SBlack 1Columbia 16 SOUTHERN COLUMBIA AREA SHispanic 3Columbia 16 SOUTHERN COLUMBIA AREA SAsian 3Columbia 16 SOUTHERN COLUMBIA AREA SNative American 0Columbia 16 SOUTHERN COLUMBIA AREA SMulti-ethnic 0Columbia 16 SOUTHERN COLUMBIA AREA SIEP 54 0.0 38.9 50.0 11.1Columbia 16 SOUTHERN COLUMBIA AREA SELL 0Columbia 16 SOUTHERN COLUMBIA AREA SEconomically Disadvantaged 70 7.1 64.3 27.1 1.4
*Full Academic Year Students. Data for groups with less than 10 students assessed were replaced by blanks.Percentages were rounded to the nearest one-tenth.Proficiency percentages may not add up to 100 due to rounding. 72

The 2010 PSSA Writing District Level Proficiency Results - District Totals*
CountyIU
Number District Group
Number Scored Writing
% Advanced
Writing
% Proficient
Writing% Basic Writing
% Below Basic
WritingCrawford 5 CONNEAUT SD All students 598 7.5 72.2 17.7 2.5Crawford 5 CONNEAUT SD Male 306 3.9 65.4 26.1 4.6Crawford 5 CONNEAUT SD Female 292 11.3 79.5 8.9 0.3Crawford 5 CONNEAUT SD White 584 7.7 72.1 17.6 2.6Crawford 5 CONNEAUT SD Black 6Crawford 5 CONNEAUT SD Hispanic 4Crawford 5 CONNEAUT SD Asian 1Crawford 5 CONNEAUT SD Native American 3Crawford 5 CONNEAUT SD Multi-ethnic 0Crawford 5 CONNEAUT SD IEP 97 0.0 32.0 53.6 14.4Crawford 5 CONNEAUT SD ELL 1Crawford 5 CONNEAUT SD Economically Disadvantaged 279 5.0 70.6 21.1 3.2Crawford 5 CRAWFORD CENTRAL SD All students 814 4.7 62.7 28.9 3.8Crawford 5 CRAWFORD CENTRAL SD Male 425 3.1 54.1 37.6 5.2Crawford 5 CRAWFORD CENTRAL SD Female 388 6.4 71.9 19.3 2.3Crawford 5 CRAWFORD CENTRAL SD White 714 5.2 63.4 27.3 4.1Crawford 5 CRAWFORD CENTRAL SD Black 72 0.0 50.0 48.6 1.4Crawford 5 CRAWFORD CENTRAL SD Hispanic 11 9.1 72.7 18.2 0.0Crawford 5 CRAWFORD CENTRAL SD Asian 6Crawford 5 CRAWFORD CENTRAL SD Native American 6Crawford 5 CRAWFORD CENTRAL SD Multi-ethnic 4Crawford 5 CRAWFORD CENTRAL SD IEP 140 0.7 26.4 57.1 15.7Crawford 5 CRAWFORD CENTRAL SD ELL 1Crawford 5 CRAWFORD CENTRAL SD Economically Disadvantaged 312 1.6 49.7 42.6 6.1Crawford 5 PENNCREST SD All students 832 9.0 70.8 19.2 1.0Crawford 5 PENNCREST SD Male 442 5.9 66.3 26.5 1.4Crawford 5 PENNCREST SD Female 390 12.6 75.9 11.0 0.5Crawford 5 PENNCREST SD White 817 9.1 71.1 19.0 0.9Crawford 5 PENNCREST SD Black 7Crawford 5 PENNCREST SD Hispanic 1
*Full Academic Year Students. Data for groups with less than 10 students assessed were replaced by blanks.Percentages were rounded to the nearest one-tenth.Proficiency percentages may not add up to 100 due to rounding. 73

The 2010 PSSA Writing District Level Proficiency Results - District Totals*
CountyIU
Number District Group
Number Scored Writing
% Advanced
Writing
% Proficient
Writing% Basic Writing
% Below Basic
WritingCrawford 5 PENNCREST SD Asian 2Crawford 5 PENNCREST SD Native American 2Crawford 5 PENNCREST SD Multi-ethnic 3Crawford 5 PENNCREST SD IEP 127 0.8 42.5 52.8 3.9Crawford 5 PENNCREST SD ELL 2Crawford 5 PENNCREST SD Economically Disadvantaged 339 4.1 64.6 29.8 1.5Cumberland 15 BIG SPRING SD All students 712 6.3 67.0 23.7 2.9Cumberland 15 BIG SPRING SD Male 331 3.6 58.9 32.6 4.8Cumberland 15 BIG SPRING SD Female 381 8.7 74.0 16.0 1.3Cumberland 15 BIG SPRING SD White 694 6.3 67.1 23.6 2.9Cumberland 15 BIG SPRING SD Black 6Cumberland 15 BIG SPRING SD Hispanic 7Cumberland 15 BIG SPRING SD Asian 3Cumberland 15 BIG SPRING SD Native American 0Cumberland 15 BIG SPRING SD Multi-ethnic 2Cumberland 15 BIG SPRING SD IEP 134 2.2 35.8 50.0 11.9Cumberland 15 BIG SPRING SD ELL 0Cumberland 15 BIG SPRING SD Economically Disadvantaged 164 4.3 56.7 31.7 7.3Cumberland 15 CAMP HILL SD All students 259 18.5 67.6 12.7 1.2Cumberland 15 CAMP HILL SD Male 126 16.7 65.1 16.7 1.6Cumberland 15 CAMP HILL SD Female 133 20.3 69.9 9.0 0.8Cumberland 15 CAMP HILL SD White 225 17.8 68.9 12.4 0.9Cumberland 15 CAMP HILL SD Black 6Cumberland 15 CAMP HILL SD Hispanic 7Cumberland 15 CAMP HILL SD Asian 21 28.6 57.1 9.5 4.8Cumberland 15 CAMP HILL SD Native American 0Cumberland 15 CAMP HILL SD Multi-ethnic 0Cumberland 15 CAMP HILL SD IEP 28 0.0 57.1 35.7 7.1Cumberland 15 CAMP HILL SD ELL 6Cumberland 15 CAMP HILL SD Economically Disadvantaged 21 0.0 57.1 38.1 4.8
*Full Academic Year Students. Data for groups with less than 10 students assessed were replaced by blanks.Percentages were rounded to the nearest one-tenth.Proficiency percentages may not add up to 100 due to rounding. 74

The 2010 PSSA Writing District Level Proficiency Results - District Totals*
CountyIU
Number District Group
Number Scored Writing
% Advanced
Writing
% Proficient
Writing% Basic Writing
% Below Basic
WritingCumberland 15 CARLISLE AREA SD All students 1,006 8.5 66.2 23.9 1.4Cumberland 15 CARLISLE AREA SD Male 521 6.9 62.0 29.2 1.9Cumberland 15 CARLISLE AREA SD Female 484 10.3 70.7 18.2 0.8Cumberland 15 CARLISLE AREA SD White 833 10.0 66.0 23.0 1.0Cumberland 15 CARLISLE AREA SD Black 103 1.0 65.0 30.1 3.9Cumberland 15 CARLISLE AREA SD Hispanic 35 5.7 68.6 20.0 5.7Cumberland 15 CARLISLE AREA SD Asian 24 0.0 66.7 33.3 0.0Cumberland 15 CARLISLE AREA SD Native American 1Cumberland 15 CARLISLE AREA SD Multi-ethnic 9Cumberland 15 CARLISLE AREA SD IEP 118 0.8 30.5 59.3 9.3Cumberland 15 CARLISLE AREA SD ELL 7Cumberland 15 CARLISLE AREA SD Economically Disadvantaged 253 2.8 55.3 39.9 2.0Cumberland 15 CUMBERLAND VALLEY SD All students 1,876 13.4 70.0 15.8 0.8Cumberland 15 CUMBERLAND VALLEY SD Male 959 10.8 67.4 20.4 1.4Cumberland 15 CUMBERLAND VALLEY SD Female 916 16.0 72.8 10.9 0.2Cumberland 15 CUMBERLAND VALLEY SD White 1,646 13.2 70.2 16.0 0.6Cumberland 15 CUMBERLAND VALLEY SD Black 54 3.7 70.4 20.4 5.6Cumberland 15 CUMBERLAND VALLEY SD Hispanic 35 17.1 65.7 17.1 0.0Cumberland 15 CUMBERLAND VALLEY SD Asian 132 18.9 71.2 9.8 0.0Cumberland 15 CUMBERLAND VALLEY SD Native American 8Cumberland 15 CUMBERLAND VALLEY SD Multi-ethnic 0Cumberland 15 CUMBERLAND VALLEY SD IEP 230 0.9 47.4 47.0 4.8Cumberland 15 CUMBERLAND VALLEY SD ELL 18 0.0 44.4 38.9 16.7Cumberland 15 CUMBERLAND VALLEY SD Economically Disadvantaged 198 3.5 66.7 27.3 2.5Cumberland 15 EAST PENNSBORO AREA SD All students 627 7.0 73.5 17.9 1.6Cumberland 15 EAST PENNSBORO AREA SD Male 330 6.1 69.4 22.4 2.1Cumberland 15 EAST PENNSBORO AREA SD Female 297 8.1 78.1 12.8 1.0Cumberland 15 EAST PENNSBORO AREA SD White 530 7.2 74.2 17.2 1.5Cumberland 15 EAST PENNSBORO AREA SD Black 35 0.0 65.7 31.4 2.9Cumberland 15 EAST PENNSBORO AREA SD Hispanic 22 4.5 68.2 27.3 0.0
*Full Academic Year Students. Data for groups with less than 10 students assessed were replaced by blanks.Percentages were rounded to the nearest one-tenth.Proficiency percentages may not add up to 100 due to rounding. 75

The 2010 PSSA Writing District Level Proficiency Results - District Totals*
CountyIU
Number District Group
Number Scored Writing
% Advanced
Writing
% Proficient
Writing% Basic Writing
% Below Basic
WritingCumberland 15 EAST PENNSBORO AREA SD Asian 35 14.3 77.1 8.6 0.0Cumberland 15 EAST PENNSBORO AREA SD Native American 4Cumberland 15 EAST PENNSBORO AREA SD Multi-ethnic 1Cumberland 15 EAST PENNSBORO AREA SD IEP 114 0.9 43.0 49.1 7.0Cumberland 15 EAST PENNSBORO AREA SD ELL 5Cumberland 15 EAST PENNSBORO AREA SD Economically Disadvantaged 150 3.3 72.0 20.7 4.0Cumberland 15 MECHANICSBURG AREA SD All students 861 13.6 69.7 15.9 0.8Cumberland 15 MECHANICSBURG AREA SD Male 439 10.5 67.9 20.3 1.4Cumberland 15 MECHANICSBURG AREA SD Female 419 16.9 71.8 11.0 0.2Cumberland 15 MECHANICSBURG AREA SD White 734 14.2 70.7 14.4 0.7Cumberland 15 MECHANICSBURG AREA SD Black 60 8.3 66.7 23.3 1.7Cumberland 15 MECHANICSBURG AREA SD Hispanic 33 6.1 63.6 30.3 0.0Cumberland 15 MECHANICSBURG AREA SD Asian 30 20.0 63.3 13.3 3.3Cumberland 15 MECHANICSBURG AREA SD Native American 1Cumberland 15 MECHANICSBURG AREA SD Multi-ethnic 0Cumberland 15 MECHANICSBURG AREA SD IEP 93 2.2 45.2 48.4 4.3Cumberland 15 MECHANICSBURG AREA SD ELL 12 0.0 50.0 33.3 16.7Cumberland 15 MECHANICSBURG AREA SD Economically Disadvantaged 189 4.2 63.0 30.2 2.6Cumberland 15 SHIPPENSBURG AREA SD All students 746 7.2 59.4 30.8 2.5Cumberland 15 SHIPPENSBURG AREA SD Male 396 4.8 52.5 39.6 3.0Cumberland 15 SHIPPENSBURG AREA SD Female 349 10.0 67.3 20.9 1.7Cumberland 15 SHIPPENSBURG AREA SD White 667 7.2 59.1 31.3 2.4Cumberland 15 SHIPPENSBURG AREA SD Black 33 6.1 60.6 30.3 3.0Cumberland 15 SHIPPENSBURG AREA SD Hispanic 14 7.1 71.4 21.4 0.0Cumberland 15 SHIPPENSBURG AREA SD Asian 8Cumberland 15 SHIPPENSBURG AREA SD Native American 1Cumberland 15 SHIPPENSBURG AREA SD Multi-ethnic 22 9.1 59.1 27.3 4.5Cumberland 15 SHIPPENSBURG AREA SD IEP 115 1.7 26.1 59.1 13.0Cumberland 15 SHIPPENSBURG AREA SD ELL 2Cumberland 15 SHIPPENSBURG AREA SD Economically Disadvantaged 206 3.4 53.4 39.3 3.9
*Full Academic Year Students. Data for groups with less than 10 students assessed were replaced by blanks.Percentages were rounded to the nearest one-tenth.Proficiency percentages may not add up to 100 due to rounding. 76

The 2010 PSSA Writing District Level Proficiency Results - District Totals*
CountyIU
Number District Group
Number Scored Writing
% Advanced
Writing
% Proficient
Writing% Basic Writing
% Below Basic
WritingCumberland 15 SOUTH MIDDLETON SD All students 516 8.7 68.2 22.1 1.0Cumberland 15 SOUTH MIDDLETON SD Male 271 7.0 59.4 32.1 1.5Cumberland 15 SOUTH MIDDLETON SD Female 245 10.6 78.0 11.0 0.4Cumberland 15 SOUTH MIDDLETON SD White 482 9.1 69.5 20.3 1.0Cumberland 15 SOUTH MIDDLETON SD Black 12 0.0 58.3 41.7 0.0Cumberland 15 SOUTH MIDDLETON SD Hispanic 9Cumberland 15 SOUTH MIDDLETON SD Asian 13 7.7 53.8 38.5 0.0Cumberland 15 SOUTH MIDDLETON SD Native American 0Cumberland 15 SOUTH MIDDLETON SD Multi-ethnic 0Cumberland 15 SOUTH MIDDLETON SD IEP 69 0.0 36.2 56.5 7.2Cumberland 15 SOUTH MIDDLETON SD ELL 4Cumberland 15 SOUTH MIDDLETON SD Economically Disadvantaged 61 4.9 62.3 31.1 1.6Dauphin 15 CENTRAL DAUPHIN SD All students 2,504 7.2 62.6 28.0 2.2Dauphin 15 CENTRAL DAUPHIN SD Male 1,270 4.1 57.1 35.3 3.5Dauphin 15 CENTRAL DAUPHIN SD Female 1,233 10.4 68.4 20.5 0.7Dauphin 15 CENTRAL DAUPHIN SD White 1,622 8.8 65.7 24.1 1.4Dauphin 15 CENTRAL DAUPHIN SD Black 506 3.0 54.5 38.7 3.8Dauphin 15 CENTRAL DAUPHIN SD Hispanic 172 2.9 54.1 37.8 5.2Dauphin 15 CENTRAL DAUPHIN SD Asian 129 10.1 70.5 18.6 0.8Dauphin 15 CENTRAL DAUPHIN SD Native American 4Dauphin 15 CENTRAL DAUPHIN SD Multi-ethnic 70 7.1 55.7 34.3 2.9Dauphin 15 CENTRAL DAUPHIN SD IEP 334 0.6 28.4 59.0 12.0Dauphin 15 CENTRAL DAUPHIN SD ELL 53 1.9 35.8 58.5 3.8Dauphin 15 CENTRAL DAUPHIN SD Economically Disadvantaged 682 3.1 50.9 40.3 5.7Dauphin 15 DERRY TOWNSHIP SD All students 829 13.6 66.2 18.0 2.2Dauphin 15 DERRY TOWNSHIP SD Male 424 9.7 63.2 23.6 3.5Dauphin 15 DERRY TOWNSHIP SD Female 403 17.9 69.5 11.9 0.7Dauphin 15 DERRY TOWNSHIP SD White 717 13.9 66.1 18.0 2.0Dauphin 15 DERRY TOWNSHIP SD Black 26 7.7 65.4 23.1 3.8Dauphin 15 DERRY TOWNSHIP SD Hispanic 22 0.0 59.1 27.3 13.6
*Full Academic Year Students. Data for groups with less than 10 students assessed were replaced by blanks.Percentages were rounded to the nearest one-tenth.Proficiency percentages may not add up to 100 due to rounding. 77

The 2010 PSSA Writing District Level Proficiency Results - District Totals*
CountyIU
Number District Group
Number Scored Writing
% Advanced
Writing
% Proficient
Writing% Basic Writing
% Below Basic
WritingDauphin 15 DERRY TOWNSHIP SD Asian 61 18.0 70.5 11.5 0.0Dauphin 15 DERRY TOWNSHIP SD Native American 0Dauphin 15 DERRY TOWNSHIP SD Multi-ethnic 1Dauphin 15 DERRY TOWNSHIP SD IEP 96 2.1 40.6 39.6 17.7Dauphin 15 DERRY TOWNSHIP SD ELL 1Dauphin 15 DERRY TOWNSHIP SD Economically Disadvantaged 89 3.4 49.4 39.3 7.9Dauphin 15 HALIFAX AREA SD All students 246 13.4 62.6 22.0 2.0Dauphin 15 HALIFAX AREA SD Male 121 9.1 60.3 26.4 4.1Dauphin 15 HALIFAX AREA SD Female 125 17.6 64.8 17.6 0.0Dauphin 15 HALIFAX AREA SD White 233 13.7 62.2 21.9 2.1Dauphin 15 HALIFAX AREA SD Black 1Dauphin 15 HALIFAX AREA SD Hispanic 4Dauphin 15 HALIFAX AREA SD Asian 1Dauphin 15 HALIFAX AREA SD Native American 0Dauphin 15 HALIFAX AREA SD Multi-ethnic 7Dauphin 15 HALIFAX AREA SD IEP 48 6.3 43.8 41.7 8.3Dauphin 15 HALIFAX AREA SD ELL 0Dauphin 15 HALIFAX AREA SD Economically Disadvantaged 58 3.4 53.4 36.2 6.9Dauphin 15 HARRISBURG CITY SD All students 1,326 3.0 41.9 48.0 7.1Dauphin 15 HARRISBURG CITY SD Male 608 2.5 31.4 54.8 11.3Dauphin 15 HARRISBURG CITY SD Female 712 3.5 51.0 42.3 3.2Dauphin 15 HARRISBURG CITY SD White 77 3.9 49.4 42.9 3.9Dauphin 15 HARRISBURG CITY SD Black 957 2.2 41.7 48.9 7.2Dauphin 15 HARRISBURG CITY SD Hispanic 245 4.9 36.7 50.6 7.8Dauphin 15 HARRISBURG CITY SD Asian 38 10.5 68.4 18.4 2.6Dauphin 15 HARRISBURG CITY SD Native American 1Dauphin 15 HARRISBURG CITY SD Multi-ethnic 1Dauphin 15 HARRISBURG CITY SD IEP 272 0.0 15.4 62.1 22.4Dauphin 15 HARRISBURG CITY SD ELL 99 0.0 32.3 54.5 13.1Dauphin 15 HARRISBURG CITY SD Economically Disadvantaged 1,107 2.4 39.7 50.8 7.1
*Full Academic Year Students. Data for groups with less than 10 students assessed were replaced by blanks.Percentages were rounded to the nearest one-tenth.Proficiency percentages may not add up to 100 due to rounding. 78

The 2010 PSSA Writing District Level Proficiency Results - District Totals*
CountyIU
Number District Group
Number Scored Writing
% Advanced
Writing
% Proficient
Writing% Basic Writing
% Below Basic
WritingDauphin 15 LOWER DAUPHIN SD All students 914 11.2 62.3 24.1 2.5Dauphin 15 LOWER DAUPHIN SD Male 471 7.2 59.0 30.1 3.6Dauphin 15 LOWER DAUPHIN SD Female 437 15.3 66.1 17.2 1.4Dauphin 15 LOWER DAUPHIN SD White 851 11.3 63.0 23.1 2.6Dauphin 15 LOWER DAUPHIN SD Black 11 9.1 63.6 27.3 0.0Dauphin 15 LOWER DAUPHIN SD Hispanic 21 4.8 57.1 33.3 4.8Dauphin 15 LOWER DAUPHIN SD Asian 15 20.0 33.3 46.7 0.0Dauphin 15 LOWER DAUPHIN SD Native American 0Dauphin 15 LOWER DAUPHIN SD Multi-ethnic 10 0.0 70.0 30.0 0.0Dauphin 15 LOWER DAUPHIN SD IEP 136 0.7 38.2 49.3 11.8Dauphin 15 LOWER DAUPHIN SD ELL 3Dauphin 15 LOWER DAUPHIN SD Economically Disadvantaged 152 2.0 57.2 34.9 5.9Dauphin 15 MIDDLETOWN AREA SD All students 571 2.5 58.0 38.2 1.4Dauphin 15 MIDDLETOWN AREA SD Male 312 1.0 48.7 48.1 2.2Dauphin 15 MIDDLETOWN AREA SD Female 259 4.2 69.1 26.3 0.4Dauphin 15 MIDDLETOWN AREA SD White 451 2.0 61.0 35.5 1.6Dauphin 15 MIDDLETOWN AREA SD Black 69 4.3 44.9 49.3 1.4Dauphin 15 MIDDLETOWN AREA SD Hispanic 37 5.4 40.5 54.1 0.0Dauphin 15 MIDDLETOWN AREA SD Asian 11 0.0 72.7 27.3 0.0Dauphin 15 MIDDLETOWN AREA SD Native American 3Dauphin 15 MIDDLETOWN AREA SD Multi-ethnic 0Dauphin 15 MIDDLETOWN AREA SD IEP 102 0.0 30.4 63.7 5.9Dauphin 15 MIDDLETOWN AREA SD ELL 0Dauphin 15 MIDDLETOWN AREA SD Economically Disadvantaged 171 0.6 39.2 58.5 1.8Dauphin 15 MILLERSBURG AREA SD All students 166 7.8 49.4 39.2 3.6Dauphin 15 MILLERSBURG AREA SD Male 83 2.4 37.3 53.0 7.2Dauphin 15 MILLERSBURG AREA SD Female 83 13.3 61.4 25.3 0.0Dauphin 15 MILLERSBURG AREA SD White 159 7.5 50.3 39.0 3.1Dauphin 15 MILLERSBURG AREA SD Black 5Dauphin 15 MILLERSBURG AREA SD Hispanic 0
*Full Academic Year Students. Data for groups with less than 10 students assessed were replaced by blanks.Percentages were rounded to the nearest one-tenth.Proficiency percentages may not add up to 100 due to rounding. 79

The 2010 PSSA Writing District Level Proficiency Results - District Totals*
CountyIU
Number District Group
Number Scored Writing
% Advanced
Writing
% Proficient
Writing% Basic Writing
% Below Basic
WritingDauphin 15 MILLERSBURG AREA SD Asian 2Dauphin 15 MILLERSBURG AREA SD Native American 0Dauphin 15 MILLERSBURG AREA SD Multi-ethnic 0Dauphin 15 MILLERSBURG AREA SD IEP 25 0.0 12.0 76.0 12.0Dauphin 15 MILLERSBURG AREA SD ELL 0Dauphin 15 MILLERSBURG AREA SD Economically Disadvantaged 34 2.9 29.4 55.9 11.8Dauphin 15 STEELTON-HIGHSPIRE SD All students 246 0.8 50.0 46.3 2.8Dauphin 15 STEELTON-HIGHSPIRE SD Male 120 0.0 37.5 58.3 4.2Dauphin 15 STEELTON-HIGHSPIRE SD Female 124 1.6 62.9 33.9 1.6Dauphin 15 STEELTON-HIGHSPIRE SD White 48 0.0 60.4 37.5 2.1Dauphin 15 STEELTON-HIGHSPIRE SD Black 112 0.9 50.0 44.6 4.5Dauphin 15 STEELTON-HIGHSPIRE SD Hispanic 41 2.4 36.6 61.0 0.0Dauphin 15 STEELTON-HIGHSPIRE SD Asian 2Dauphin 15 STEELTON-HIGHSPIRE SD Native American 0Dauphin 15 STEELTON-HIGHSPIRE SD Multi-ethnic 40 0.0 52.5 45.0 2.5Dauphin 15 STEELTON-HIGHSPIRE SD IEP 46 0.0 30.4 56.5 13.0Dauphin 15 STEELTON-HIGHSPIRE SD ELL 3Dauphin 15 STEELTON-HIGHSPIRE SD Economically Disadvantaged 173 1.2 49.1 47.4 2.3Dauphin 15 SUSQUEHANNA TOWNSHIP SDAll students 743 3.5 64.3 30.3 1.9Dauphin 15 SUSQUEHANNA TOWNSHIP SDMale 365 1.6 56.7 38.4 3.3Dauphin 15 SUSQUEHANNA TOWNSHIP SDFemale 378 5.3 71.7 22.5 0.5Dauphin 15 SUSQUEHANNA TOWNSHIP SDWhite 341 4.4 67.7 25.8 2.1Dauphin 15 SUSQUEHANNA TOWNSHIP SDBlack 299 2.3 60.2 35.8 1.7Dauphin 15 SUSQUEHANNA TOWNSHIP SDHispanic 48 2.1 56.3 37.5 4.2Dauphin 15 SUSQUEHANNA TOWNSHIP SDAsian 35 5.7 74.3 20.0 0.0Dauphin 15 SUSQUEHANNA TOWNSHIP SDNative American 2Dauphin 15 SUSQUEHANNA TOWNSHIP SDMulti-ethnic 18 5.6 66.7 27.8 0.0Dauphin 15 SUSQUEHANNA TOWNSHIP SDIEP 117 0.9 35.9 58.1 5.1Dauphin 15 SUSQUEHANNA TOWNSHIP SDELL 3Dauphin 15 SUSQUEHANNA TOWNSHIP SDEconomically Disadvantaged 209 1.0 52.6 43.5 2.9
*Full Academic Year Students. Data for groups with less than 10 students assessed were replaced by blanks.Percentages were rounded to the nearest one-tenth.Proficiency percentages may not add up to 100 due to rounding. 80

The 2010 PSSA Writing District Level Proficiency Results - District Totals*
CountyIU
Number District Group
Number Scored Writing
% Advanced
Writing
% Proficient
Writing% Basic Writing
% Below Basic
WritingDauphin 15 UPPER DAUPHIN AREA SD All students 271 2.6 67.5 26.2 3.7Dauphin 15 UPPER DAUPHIN AREA SD Male 141 2.8 56.7 34.0 6.4Dauphin 15 UPPER DAUPHIN AREA SD Female 130 2.3 79.2 17.7 0.8Dauphin 15 UPPER DAUPHIN AREA SD White 259 2.3 68.3 25.5 3.9Dauphin 15 UPPER DAUPHIN AREA SD Black 2Dauphin 15 UPPER DAUPHIN AREA SD Hispanic 7Dauphin 15 UPPER DAUPHIN AREA SD Asian 3Dauphin 15 UPPER DAUPHIN AREA SD Native American 0Dauphin 15 UPPER DAUPHIN AREA SD Multi-ethnic 0Dauphin 15 UPPER DAUPHIN AREA SD IEP 34 0.0 35.3 44.1 20.6Dauphin 15 UPPER DAUPHIN AREA SD ELL 2Dauphin 15 UPPER DAUPHIN AREA SD Economically Disadvantaged 64 3.1 56.3 39.1 1.6Delaware 25 CHESTER-UPLAND SD All students 724 0.4 43.0 48.9 7.7Delaware 25 CHESTER-UPLAND SD Male 325 0.0 33.8 53.5 12.6Delaware 25 CHESTER-UPLAND SD Female 386 0.8 51.3 44.0 3.9Delaware 25 CHESTER-UPLAND SD White 6Delaware 25 CHESTER-UPLAND SD Black 660 0.5 42.9 48.6 8.0Delaware 25 CHESTER-UPLAND SD Hispanic 44 0.0 45.5 47.7 6.8Delaware 25 CHESTER-UPLAND SD Asian 1Delaware 25 CHESTER-UPLAND SD Native American 0Delaware 25 CHESTER-UPLAND SD Multi-ethnic 0Delaware 25 CHESTER-UPLAND SD IEP 146 0.0 19.2 55.5 25.3Delaware 25 CHESTER-UPLAND SD ELL 35 2.9 37.1 54.3 5.7Delaware 25 CHESTER-UPLAND SD Economically Disadvantaged 596 0.3 42.6 49.0 8.1Delaware 25 CHICHESTER SD All students 734 4.9 62.0 29.6 3.5Delaware 25 CHICHESTER SD Male 363 2.2 55.1 38.0 4.7Delaware 25 CHICHESTER SD Female 370 7.6 68.6 21.4 2.4Delaware 25 CHICHESTER SD White 543 4.8 64.1 28.0 3.1Delaware 25 CHICHESTER SD Black 152 3.9 54.6 36.2 5.3Delaware 25 CHICHESTER SD Hispanic 16 0.0 68.8 25.0 6.3
*Full Academic Year Students. Data for groups with less than 10 students assessed were replaced by blanks.Percentages were rounded to the nearest one-tenth.Proficiency percentages may not add up to 100 due to rounding. 81
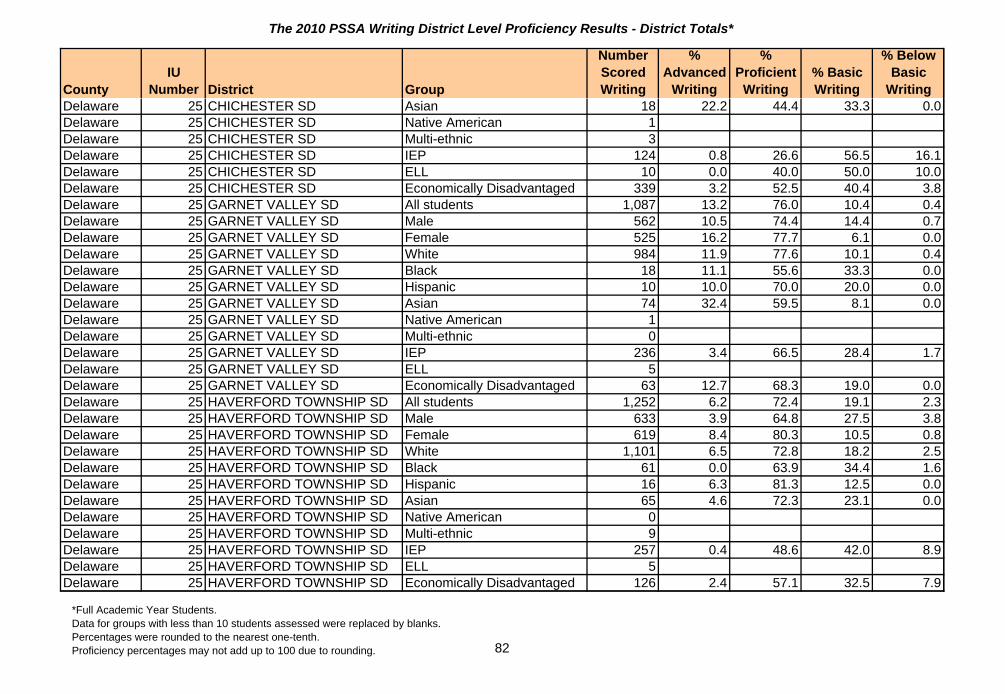
The 2010 PSSA Writing District Level Proficiency Results - District Totals*
CountyIU
Number District Group
Number Scored Writing
% Advanced
Writing
% Proficient
Writing% Basic Writing
% Below Basic
WritingDelaware 25 CHICHESTER SD Asian 18 22.2 44.4 33.3 0.0Delaware 25 CHICHESTER SD Native American 1Delaware 25 CHICHESTER SD Multi-ethnic 3Delaware 25 CHICHESTER SD IEP 124 0.8 26.6 56.5 16.1Delaware 25 CHICHESTER SD ELL 10 0.0 40.0 50.0 10.0Delaware 25 CHICHESTER SD Economically Disadvantaged 339 3.2 52.5 40.4 3.8Delaware 25 GARNET VALLEY SD All students 1,087 13.2 76.0 10.4 0.4Delaware 25 GARNET VALLEY SD Male 562 10.5 74.4 14.4 0.7Delaware 25 GARNET VALLEY SD Female 525 16.2 77.7 6.1 0.0Delaware 25 GARNET VALLEY SD White 984 11.9 77.6 10.1 0.4Delaware 25 GARNET VALLEY SD Black 18 11.1 55.6 33.3 0.0Delaware 25 GARNET VALLEY SD Hispanic 10 10.0 70.0 20.0 0.0Delaware 25 GARNET VALLEY SD Asian 74 32.4 59.5 8.1 0.0Delaware 25 GARNET VALLEY SD Native American 1Delaware 25 GARNET VALLEY SD Multi-ethnic 0Delaware 25 GARNET VALLEY SD IEP 236 3.4 66.5 28.4 1.7Delaware 25 GARNET VALLEY SD ELL 5Delaware 25 GARNET VALLEY SD Economically Disadvantaged 63 12.7 68.3 19.0 0.0Delaware 25 HAVERFORD TOWNSHIP SD All students 1,252 6.2 72.4 19.1 2.3Delaware 25 HAVERFORD TOWNSHIP SD Male 633 3.9 64.8 27.5 3.8Delaware 25 HAVERFORD TOWNSHIP SD Female 619 8.4 80.3 10.5 0.8Delaware 25 HAVERFORD TOWNSHIP SD White 1,101 6.5 72.8 18.2 2.5Delaware 25 HAVERFORD TOWNSHIP SD Black 61 0.0 63.9 34.4 1.6Delaware 25 HAVERFORD TOWNSHIP SD Hispanic 16 6.3 81.3 12.5 0.0Delaware 25 HAVERFORD TOWNSHIP SD Asian 65 4.6 72.3 23.1 0.0Delaware 25 HAVERFORD TOWNSHIP SD Native American 0Delaware 25 HAVERFORD TOWNSHIP SD Multi-ethnic 9Delaware 25 HAVERFORD TOWNSHIP SD IEP 257 0.4 48.6 42.0 8.9Delaware 25 HAVERFORD TOWNSHIP SD ELL 5Delaware 25 HAVERFORD TOWNSHIP SD Economically Disadvantaged 126 2.4 57.1 32.5 7.9
*Full Academic Year Students. Data for groups with less than 10 students assessed were replaced by blanks.Percentages were rounded to the nearest one-tenth.Proficiency percentages may not add up to 100 due to rounding. 82

The 2010 PSSA Writing District Level Proficiency Results - District Totals*
CountyIU
Number District Group
Number Scored Writing
% Advanced
Writing
% Proficient
Writing% Basic Writing
% Below Basic
WritingDelaware 25 INTERBORO SD All students 766 9.3 69.8 19.8 1.0Delaware 25 INTERBORO SD Male 394 6.1 64.7 27.4 1.8Delaware 25 INTERBORO SD Female 371 12.7 75.2 11.9 0.3Delaware 25 INTERBORO SD White 686 9.5 70.7 18.8 1.0Delaware 25 INTERBORO SD Black 37 8.1 64.9 27.0 0.0Delaware 25 INTERBORO SD Hispanic 20 5.0 65.0 30.0 0.0Delaware 25 INTERBORO SD Asian 14 14.3 50.0 28.6 7.1Delaware 25 INTERBORO SD Native American 1Delaware 25 INTERBORO SD Multi-ethnic 7Delaware 25 INTERBORO SD IEP 179 2.2 57.5 36.3 3.9Delaware 25 INTERBORO SD ELL 4Delaware 25 INTERBORO SD Economically Disadvantaged 232 6.9 66.8 25.4 0.9Delaware 25 MARPLE NEWTOWN SD All students 844 10.9 73.5 14.7 0.9Delaware 25 MARPLE NEWTOWN SD Male 456 9.2 69.1 20.0 1.8Delaware 25 MARPLE NEWTOWN SD Female 388 12.9 78.6 8.5 0.0Delaware 25 MARPLE NEWTOWN SD White 719 10.4 72.9 15.7 1.0Delaware 25 MARPLE NEWTOWN SD Black 21 14.3 71.4 14.3 0.0Delaware 25 MARPLE NEWTOWN SD Hispanic 11 0.0 72.7 27.3 0.0Delaware 25 MARPLE NEWTOWN SD Asian 91 15.4 78.0 5.5 1.1Delaware 25 MARPLE NEWTOWN SD Native American 1Delaware 25 MARPLE NEWTOWN SD Multi-ethnic 1Delaware 25 MARPLE NEWTOWN SD IEP 150 2.0 54.0 41.3 2.7Delaware 25 MARPLE NEWTOWN SD ELL 13 0.0 76.9 23.1 0.0Delaware 25 MARPLE NEWTOWN SD Economically Disadvantaged 83 6.0 74.7 16.9 2.4Delaware 25 PENN-DELCO SD All students 755 7.7 73.8 18.4 0.1Delaware 25 PENN-DELCO SD Male 401 5.2 68.8 25.7 0.2Delaware 25 PENN-DELCO SD Female 352 10.2 79.5 10.2 0.0Delaware 25 PENN-DELCO SD White 693 7.6 74.9 17.3 0.1Delaware 25 PENN-DELCO SD Black 36 5.6 55.6 38.9 0.0Delaware 25 PENN-DELCO SD Hispanic 10 10.0 60.0 30.0 0.0
*Full Academic Year Students. Data for groups with less than 10 students assessed were replaced by blanks.Percentages were rounded to the nearest one-tenth.Proficiency percentages may not add up to 100 due to rounding. 83

The 2010 PSSA Writing District Level Proficiency Results - District Totals*
CountyIU
Number District Group
Number Scored Writing
% Advanced
Writing
% Proficient
Writing% Basic Writing
% Below Basic
WritingDelaware 25 PENN-DELCO SD Asian 11 9.1 90.9 0.0 0.0Delaware 25 PENN-DELCO SD Native American 0Delaware 25 PENN-DELCO SD Multi-ethnic 3Delaware 25 PENN-DELCO SD IEP 122 0.0 50.8 49.2 0.0Delaware 25 PENN-DELCO SD ELL 2Delaware 25 PENN-DELCO SD Economically Disadvantaged 116 3.4 63.8 32.8 0.0Delaware 25 RADNOR TOWNSHIP SD All students 875 27.9 67.2 4.7 0.2Delaware 25 RADNOR TOWNSHIP SD Male 450 23.8 70.0 5.8 0.4Delaware 25 RADNOR TOWNSHIP SD Female 425 32.2 64.2 3.5 0.0Delaware 25 RADNOR TOWNSHIP SD White 709 28.2 68.3 3.2 0.3Delaware 25 RADNOR TOWNSHIP SD Black 39 15.4 48.7 35.9 0.0Delaware 25 RADNOR TOWNSHIP SD Hispanic 17 17.6 76.5 5.9 0.0Delaware 25 RADNOR TOWNSHIP SD Asian 110 31.8 65.5 2.7 0.0Delaware 25 RADNOR TOWNSHIP SD Native American 0Delaware 25 RADNOR TOWNSHIP SD Multi-ethnic 0Delaware 25 RADNOR TOWNSHIP SD IEP 149 12.1 67.8 18.8 1.3Delaware 25 RADNOR TOWNSHIP SD ELL 11 9.1 81.8 9.1 0.0Delaware 25 RADNOR TOWNSHIP SD Economically Disadvantaged 55 14.5 65.5 20.0 0.0Delaware 25 RIDLEY SD All students 1,282 10.5 64.4 23.2 2.0Delaware 25 RIDLEY SD Male 673 7.6 62.3 26.9 3.3Delaware 25 RIDLEY SD Female 607 13.7 66.7 18.9 0.7Delaware 25 RIDLEY SD White 1,150 10.3 65.1 22.6 1.9Delaware 25 RIDLEY SD Black 81 9.9 54.3 32.1 3.7Delaware 25 RIDLEY SD Hispanic 16 12.5 62.5 25.0 0.0Delaware 25 RIDLEY SD Asian 28 17.9 60.7 17.9 3.6Delaware 25 RIDLEY SD Native American 0Delaware 25 RIDLEY SD Multi-ethnic 5Delaware 25 RIDLEY SD IEP 258 2.3 36.8 52.3 8.5Delaware 25 RIDLEY SD ELL 4Delaware 25 RIDLEY SD Economically Disadvantaged 318 6.9 56.6 34.0 2.5
*Full Academic Year Students. Data for groups with less than 10 students assessed were replaced by blanks.Percentages were rounded to the nearest one-tenth.Proficiency percentages may not add up to 100 due to rounding. 84

The 2010 PSSA Writing District Level Proficiency Results - District Totals*
CountyIU
Number District Group
Number Scored Writing
% Advanced
Writing
% Proficient
Writing% Basic Writing
% Below Basic
WritingDelaware 25 ROSE TREE MEDIA SD All students 880 24.5 64.7 9.3 1.5Delaware 25 ROSE TREE MEDIA SD Male 469 18.8 65.2 13.6 2.3Delaware 25 ROSE TREE MEDIA SD Female 410 31.2 64.1 4.1 0.5Delaware 25 ROSE TREE MEDIA SD White 769 26.0 64.2 8.3 1.4Delaware 25 ROSE TREE MEDIA SD Black 68 10.3 67.6 19.1 2.9Delaware 25 ROSE TREE MEDIA SD Hispanic 9Delaware 25 ROSE TREE MEDIA SD Asian 32 25.0 65.6 9.4 0.0Delaware 25 ROSE TREE MEDIA SD Native American 1Delaware 25 ROSE TREE MEDIA SD Multi-ethnic 0Delaware 25 ROSE TREE MEDIA SD IEP 129 6.2 52.7 32.6 8.5Delaware 25 ROSE TREE MEDIA SD ELL 8Delaware 25 ROSE TREE MEDIA SD Economically Disadvantaged 92 12.0 71.7 14.1 2.2Delaware 25 SOUTHEAST DELCO SD All students 828 3.1 55.9 39.7 1.2Delaware 25 SOUTHEAST DELCO SD Male 409 2.0 48.9 47.2 2.0Delaware 25 SOUTHEAST DELCO SD Female 419 4.3 62.8 32.5 0.5Delaware 25 SOUTHEAST DELCO SD White 270 3.3 56.7 38.5 1.5Delaware 25 SOUTHEAST DELCO SD Black 527 3.0 55.8 40.0 1.1Delaware 25 SOUTHEAST DELCO SD Hispanic 13 7.7 53.8 38.5 0.0Delaware 25 SOUTHEAST DELCO SD Asian 16 0.0 50.0 50.0 0.0Delaware 25 SOUTHEAST DELCO SD Native American 0Delaware 25 SOUTHEAST DELCO SD Multi-ethnic 2Delaware 25 SOUTHEAST DELCO SD IEP 134 0.0 27.6 67.2 5.2Delaware 25 SOUTHEAST DELCO SD ELL 22 0.0 50.0 50.0 0.0Delaware 25 SOUTHEAST DELCO SD Economically Disadvantaged 544 3.5 52.0 43.4 1.1Delaware 25 SPRINGFIELD SD All students 850 15.3 72.8 11.2 0.7Delaware 25 SPRINGFIELD SD Male 443 10.4 74.5 13.8 1.4Delaware 25 SPRINGFIELD SD Female 407 20.6 71.0 8.4 0.0Delaware 25 SPRINGFIELD SD White 743 15.9 72.9 10.5 0.7Delaware 25 SPRINGFIELD SD Black 59 11.9 64.4 22.0 1.7Delaware 25 SPRINGFIELD SD Hispanic 8
*Full Academic Year Students. Data for groups with less than 10 students assessed were replaced by blanks.Percentages were rounded to the nearest one-tenth.Proficiency percentages may not add up to 100 due to rounding. 85

The 2010 PSSA Writing District Level Proficiency Results - District Totals*
CountyIU
Number District Group
Number Scored Writing
% Advanced
Writing
% Proficient
Writing% Basic Writing
% Below Basic
WritingDelaware 25 SPRINGFIELD SD Asian 40 12.5 77.5 10.0 0.0Delaware 25 SPRINGFIELD SD Native American 0Delaware 25 SPRINGFIELD SD Multi-ethnic 0Delaware 25 SPRINGFIELD SD IEP 138 1.4 56.5 38.4 3.6Delaware 25 SPRINGFIELD SD ELL 9Delaware 25 SPRINGFIELD SD Economically Disadvantaged 85 7.1 70.6 18.8 3.5Delaware 25 UPPER DARBY SD All students 2,590 3.9 55.1 37.6 3.5Delaware 25 UPPER DARBY SD Male 1,320 2.3 47.4 45.5 4.8Delaware 25 UPPER DARBY SD Female 1,270 5.4 63.0 29.4 2.2Delaware 25 UPPER DARBY SD White 1,094 3.5 55.7 37.8 3.0Delaware 25 UPPER DARBY SD Black 1,092 2.7 52.1 40.8 4.3Delaware 25 UPPER DARBY SD Hispanic 81 0.0 59.3 33.3 7.4Delaware 25 UPPER DARBY SD Asian 316 10.1 63.0 25.6 1.3Delaware 25 UPPER DARBY SD Native American 2Delaware 25 UPPER DARBY SD Multi-ethnic 5Delaware 25 UPPER DARBY SD IEP 398 0.0 19.6 63.8 16.6Delaware 25 UPPER DARBY SD ELL 109 0.9 40.4 55.0 3.7Delaware 25 UPPER DARBY SD Economically Disadvantaged 1,321 3.0 51.9 41.1 3.9Delaware 25 WALLINGFORD-SWARTHMOREAll students 755 18.5 68.7 12.5 0.3Delaware 25 WALLINGFORD-SWARTHMOREMale 394 14.0 69.8 16.0 0.3Delaware 25 WALLINGFORD-SWARTHMOREFemale 358 23.7 67.6 8.4 0.3Delaware 25 WALLINGFORD-SWARTHMOREWhite 628 18.0 70.1 11.6 0.3Delaware 25 WALLINGFORD-SWARTHMOREBlack 61 9.8 60.7 29.5 0.0Delaware 25 WALLINGFORD-SWARTHMOREHispanic 9Delaware 25 WALLINGFORD-SWARTHMOREAsian 43 41.9 53.5 4.7 0.0Delaware 25 WALLINGFORD-SWARTHMORENative American 0Delaware 25 WALLINGFORD-SWARTHMOREMulti-ethnic 11 18.2 81.8 0.0 0.0Delaware 25 WALLINGFORD-SWARTHMOREIEP 135 2.2 58.5 37.8 1.5Delaware 25 WALLINGFORD-SWARTHMOREELL 2Delaware 25 WALLINGFORD-SWARTHMOREEconomically Disadvantaged 70 4.3 61.4 34.3 0.0
*Full Academic Year Students. Data for groups with less than 10 students assessed were replaced by blanks.Percentages were rounded to the nearest one-tenth.Proficiency percentages may not add up to 100 due to rounding. 86

The 2010 PSSA Writing District Level Proficiency Results - District Totals*
CountyIU
Number District Group
Number Scored Writing
% Advanced
Writing
% Proficient
Writing% Basic Writing
% Below Basic
WritingDelaware 25 WILLIAM PENN SD All students 1,085 2.0 46.7 45.5 5.7Delaware 25 WILLIAM PENN SD Male 557 1.4 38.1 52.6 7.9Delaware 25 WILLIAM PENN SD Female 487 2.9 56.5 37.6 3.1Delaware 25 WILLIAM PENN SD White 55 7.3 34.5 50.9 7.3Delaware 25 WILLIAM PENN SD Black 963 1.9 46.8 45.7 5.6Delaware 25 WILLIAM PENN SD Hispanic 8Delaware 25 WILLIAM PENN SD Asian 9Delaware 25 WILLIAM PENN SD Native American 6Delaware 25 WILLIAM PENN SD Multi-ethnic 2Delaware 25 WILLIAM PENN SD IEP 173 0.0 15.0 64.7 20.2Delaware 25 WILLIAM PENN SD ELL 18 0.0 27.8 61.1 11.1Delaware 25 WILLIAM PENN SD Economically Disadvantaged 780 2.2 42.4 48.7 6.7Elk 9 JOHNSONBURG AREA SD All students 144 2.8 62.5 33.3 1.4Elk 9 JOHNSONBURG AREA SD Male 76 1.3 56.6 40.8 1.3Elk 9 JOHNSONBURG AREA SD Female 68 4.4 69.1 25.0 1.5Elk 9 JOHNSONBURG AREA SD White 139 2.9 61.9 33.8 1.4Elk 9 JOHNSONBURG AREA SD Black 3Elk 9 JOHNSONBURG AREA SD Hispanic 0Elk 9 JOHNSONBURG AREA SD Asian 0Elk 9 JOHNSONBURG AREA SD Native American 1Elk 9 JOHNSONBURG AREA SD Multi-ethnic 1Elk 9 JOHNSONBURG AREA SD IEP 20 0.0 30.0 60.0 10.0Elk 9 JOHNSONBURG AREA SD ELL 0Elk 9 JOHNSONBURG AREA SD Economically Disadvantaged 62 4.8 66.1 29.0 0.0Elk 9 RIDGWAY AREA SD All students 216 11.6 44.9 41.7 1.9Elk 9 RIDGWAY AREA SD Male 104 4.8 45.2 47.1 2.9Elk 9 RIDGWAY AREA SD Female 111 18.0 45.0 36.0 0.9Elk 9 RIDGWAY AREA SD White 206 11.2 45.6 41.3 1.9Elk 9 RIDGWAY AREA SD Black 4Elk 9 RIDGWAY AREA SD Hispanic 3
*Full Academic Year Students. Data for groups with less than 10 students assessed were replaced by blanks.Percentages were rounded to the nearest one-tenth.Proficiency percentages may not add up to 100 due to rounding. 87
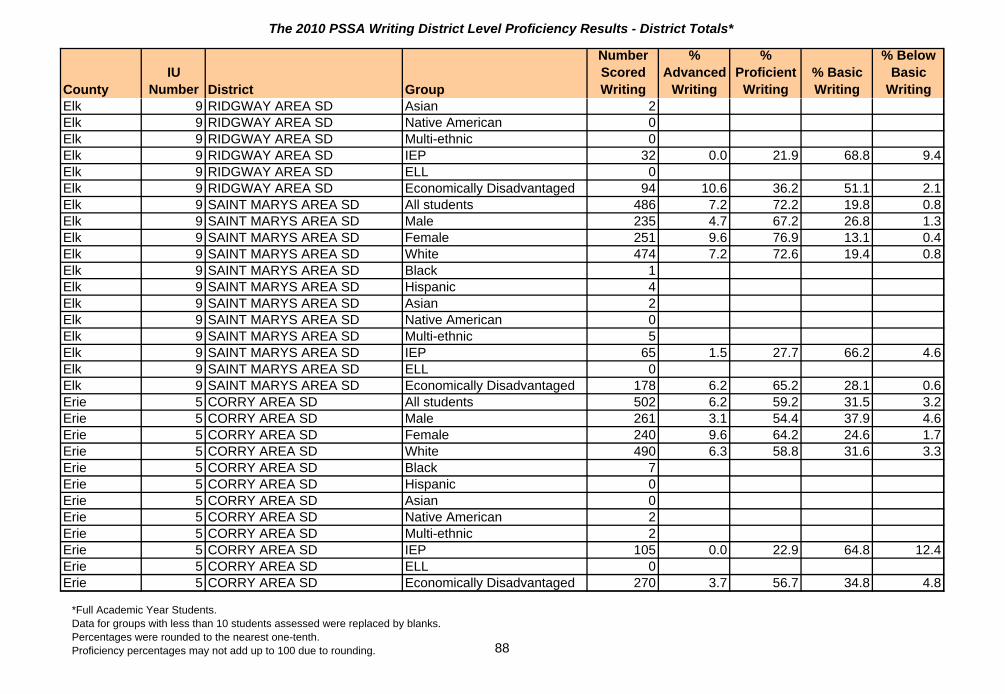
The 2010 PSSA Writing District Level Proficiency Results - District Totals*
CountyIU
Number District Group
Number Scored Writing
% Advanced
Writing
% Proficient
Writing% Basic Writing
% Below Basic
WritingElk 9 RIDGWAY AREA SD Asian 2Elk 9 RIDGWAY AREA SD Native American 0Elk 9 RIDGWAY AREA SD Multi-ethnic 0Elk 9 RIDGWAY AREA SD IEP 32 0.0 21.9 68.8 9.4Elk 9 RIDGWAY AREA SD ELL 0Elk 9 RIDGWAY AREA SD Economically Disadvantaged 94 10.6 36.2 51.1 2.1Elk 9 SAINT MARYS AREA SD All students 486 7.2 72.2 19.8 0.8Elk 9 SAINT MARYS AREA SD Male 235 4.7 67.2 26.8 1.3Elk 9 SAINT MARYS AREA SD Female 251 9.6 76.9 13.1 0.4Elk 9 SAINT MARYS AREA SD White 474 7.2 72.6 19.4 0.8Elk 9 SAINT MARYS AREA SD Black 1Elk 9 SAINT MARYS AREA SD Hispanic 4Elk 9 SAINT MARYS AREA SD Asian 2Elk 9 SAINT MARYS AREA SD Native American 0Elk 9 SAINT MARYS AREA SD Multi-ethnic 5Elk 9 SAINT MARYS AREA SD IEP 65 1.5 27.7 66.2 4.6Elk 9 SAINT MARYS AREA SD ELL 0Elk 9 SAINT MARYS AREA SD Economically Disadvantaged 178 6.2 65.2 28.1 0.6Erie 5 CORRY AREA SD All students 502 6.2 59.2 31.5 3.2Erie 5 CORRY AREA SD Male 261 3.1 54.4 37.9 4.6Erie 5 CORRY AREA SD Female 240 9.6 64.2 24.6 1.7Erie 5 CORRY AREA SD White 490 6.3 58.8 31.6 3.3Erie 5 CORRY AREA SD Black 7Erie 5 CORRY AREA SD Hispanic 0Erie 5 CORRY AREA SD Asian 0Erie 5 CORRY AREA SD Native American 2Erie 5 CORRY AREA SD Multi-ethnic 2Erie 5 CORRY AREA SD IEP 105 0.0 22.9 64.8 12.4Erie 5 CORRY AREA SD ELL 0Erie 5 CORRY AREA SD Economically Disadvantaged 270 3.7 56.7 34.8 4.8
*Full Academic Year Students. Data for groups with less than 10 students assessed were replaced by blanks.Percentages were rounded to the nearest one-tenth.Proficiency percentages may not add up to 100 due to rounding. 88

The 2010 PSSA Writing District Level Proficiency Results - District Totals*
CountyIU
Number District Group
Number Scored Writing
% Advanced
Writing
% Proficient
Writing% Basic Writing
% Below Basic
WritingErie 5 ERIE CITY SD All students 2,245 3.7 50.1 40.0 6.2Erie 5 ERIE CITY SD Male 1,128 2.5 41.6 47.0 9.0Erie 5 ERIE CITY SD Female 1,114 4.8 58.8 32.9 3.5Erie 5 ERIE CITY SD White 1,142 5.6 58.8 31.9 3.8Erie 5 ERIE CITY SD Black 724 0.8 40.6 48.9 9.7Erie 5 ERIE CITY SD Hispanic 207 2.9 40.1 48.3 8.7Erie 5 ERIE CITY SD Asian 42 4.8 47.6 35.7 11.9Erie 5 ERIE CITY SD Native American 4Erie 5 ERIE CITY SD Multi-ethnic 125 3.2 44.0 49.6 3.2Erie 5 ERIE CITY SD IEP 428 0.7 20.8 56.5 22.0Erie 5 ERIE CITY SD ELL 127 0.0 16.5 68.5 15.0Erie 5 ERIE CITY SD Economically Disadvantaged 1,702 2.0 44.8 46.0 7.2Erie 5 FAIRVIEW SD All students 384 20.6 69.3 9.6 0.5Erie 5 FAIRVIEW SD Male 196 15.8 68.9 14.8 0.5Erie 5 FAIRVIEW SD Female 188 25.5 69.7 4.3 0.5Erie 5 FAIRVIEW SD White 369 20.6 69.9 8.9 0.5Erie 5 FAIRVIEW SD Black 3Erie 5 FAIRVIEW SD Hispanic 9Erie 5 FAIRVIEW SD Asian 2Erie 5 FAIRVIEW SD Native American 1Erie 5 FAIRVIEW SD Multi-ethnic 0Erie 5 FAIRVIEW SD IEP 48 2.1 56.3 37.5 4.2Erie 5 FAIRVIEW SD ELL 0Erie 5 FAIRVIEW SD Economically Disadvantaged 69 13.0 63.8 23.2 0.0Erie 5 FORT LEBOEUF SD All students 512 13.1 66.4 19.7 0.8Erie 5 FORT LEBOEUF SD Male 277 8.7 66.1 23.8 1.4Erie 5 FORT LEBOEUF SD Female 234 18.4 67.1 14.5 0.0Erie 5 FORT LEBOEUF SD White 496 13.1 66.7 19.4 0.8Erie 5 FORT LEBOEUF SD Black 6Erie 5 FORT LEBOEUF SD Hispanic 3
*Full Academic Year Students. Data for groups with less than 10 students assessed were replaced by blanks.Percentages were rounded to the nearest one-tenth.Proficiency percentages may not add up to 100 due to rounding. 89

The 2010 PSSA Writing District Level Proficiency Results - District Totals*
CountyIU
Number District Group
Number Scored Writing
% Advanced
Writing
% Proficient
Writing% Basic Writing
% Below Basic
WritingErie 5 FORT LEBOEUF SD Asian 4Erie 5 FORT LEBOEUF SD Native American 0Erie 5 FORT LEBOEUF SD Multi-ethnic 2Erie 5 FORT LEBOEUF SD IEP 85 0.0 36.5 58.8 4.7Erie 5 FORT LEBOEUF SD ELL 0Erie 5 FORT LEBOEUF SD Economically Disadvantaged 202 8.4 65.3 25.7 0.5Erie 5 GENERAL MCLANE SD All students 508 8.9 66.7 22.2 2.2Erie 5 GENERAL MCLANE SD Male 276 5.8 63.8 27.5 2.9Erie 5 GENERAL MCLANE SD Female 231 12.6 70.6 15.6 1.3Erie 5 GENERAL MCLANE SD White 481 9.1 66.7 22.5 1.7Erie 5 GENERAL MCLANE SD Black 6Erie 5 GENERAL MCLANE SD Hispanic 3Erie 5 GENERAL MCLANE SD Asian 2Erie 5 GENERAL MCLANE SD Native American 5Erie 5 GENERAL MCLANE SD Multi-ethnic 10 10.0 70.0 20.0 0.0Erie 5 GENERAL MCLANE SD IEP 53 0.0 24.5 66.0 9.4Erie 5 GENERAL MCLANE SD ELL 2Erie 5 GENERAL MCLANE SD Economically Disadvantaged 127 4.7 52.0 38.6 4.7Erie 5 GIRARD SD All students 463 5.4 63.5 29.8 1.3Erie 5 GIRARD SD Male 239 2.9 59.8 36.0 1.3Erie 5 GIRARD SD Female 224 8.0 67.4 23.2 1.3Erie 5 GIRARD SD White 449 5.1 63.7 29.8 1.3Erie 5 GIRARD SD Black 7Erie 5 GIRARD SD Hispanic 3Erie 5 GIRARD SD Asian 0Erie 5 GIRARD SD Native American 3Erie 5 GIRARD SD Multi-ethnic 1Erie 5 GIRARD SD IEP 65 0.0 21.5 70.8 7.7Erie 5 GIRARD SD ELL 0Erie 5 GIRARD SD Economically Disadvantaged 189 2.1 55.6 40.7 1.6
*Full Academic Year Students. Data for groups with less than 10 students assessed were replaced by blanks.Percentages were rounded to the nearest one-tenth.Proficiency percentages may not add up to 100 due to rounding. 90

The 2010 PSSA Writing District Level Proficiency Results - District Totals*
CountyIU
Number District Group
Number Scored Writing
% Advanced
Writing
% Proficient
Writing% Basic Writing
% Below Basic
WritingErie 5 HARBOR CREEK SD All students 451 8.0 74.3 16.6 1.1Erie 5 HARBOR CREEK SD Male 229 5.2 73.4 19.7 1.7Erie 5 HARBOR CREEK SD Female 222 10.8 75.2 13.5 0.5Erie 5 HARBOR CREEK SD White 438 8.0 74.9 16.2 0.9Erie 5 HARBOR CREEK SD Black 7Erie 5 HARBOR CREEK SD Hispanic 3Erie 5 HARBOR CREEK SD Asian 2Erie 5 HARBOR CREEK SD Native American 0Erie 5 HARBOR CREEK SD Multi-ethnic 1Erie 5 HARBOR CREEK SD IEP 59 0.0 40.7 50.8 8.5Erie 5 HARBOR CREEK SD ELL 2Erie 5 HARBOR CREEK SD Economically Disadvantaged 124 3.2 66.1 30.6 0.0Erie 5 IROQUOIS SD All students 267 1.9 61.4 32.6 4.1Erie 5 IROQUOIS SD Male 142 2.1 51.4 40.8 5.6Erie 5 IROQUOIS SD Female 125 1.6 72.8 23.2 2.4Erie 5 IROQUOIS SD White 249 1.6 61.8 32.5 4.0Erie 5 IROQUOIS SD Black 13 7.7 53.8 38.5 0.0Erie 5 IROQUOIS SD Hispanic 5Erie 5 IROQUOIS SD Asian 0Erie 5 IROQUOIS SD Native American 0Erie 5 IROQUOIS SD Multi-ethnic 0Erie 5 IROQUOIS SD IEP 48 0.0 20.8 62.5 16.7Erie 5 IROQUOIS SD ELL 0Erie 5 IROQUOIS SD Economically Disadvantaged 132 1.5 50.8 40.9 6.8Erie 5 MILLCREEK TOWNSHIP SD All students 1,692 13.7 64.1 20.5 1.7Erie 5 MILLCREEK TOWNSHIP SD Male 879 8.8 61.0 27.3 3.0Erie 5 MILLCREEK TOWNSHIP SD Female 811 19.1 67.7 13.1 0.1Erie 5 MILLCREEK TOWNSHIP SD White 1,577 13.6 64.8 20.0 1.6Erie 5 MILLCREEK TOWNSHIP SD Black 41 4.9 56.1 34.1 4.9Erie 5 MILLCREEK TOWNSHIP SD Hispanic 36 11.1 52.8 36.1 0.0
*Full Academic Year Students. Data for groups with less than 10 students assessed were replaced by blanks.Percentages were rounded to the nearest one-tenth.Proficiency percentages may not add up to 100 due to rounding. 91

The 2010 PSSA Writing District Level Proficiency Results - District Totals*
CountyIU
Number District Group
Number Scored Writing
% Advanced
Writing
% Proficient
Writing% Basic Writing
% Below Basic
WritingErie 5 MILLCREEK TOWNSHIP SD Asian 35 31.4 57.1 11.4 0.0Erie 5 MILLCREEK TOWNSHIP SD Native American 1Erie 5 MILLCREEK TOWNSHIP SD Multi-ethnic 0Erie 5 MILLCREEK TOWNSHIP SD IEP 180 1.1 31.1 55.6 12.2Erie 5 MILLCREEK TOWNSHIP SD ELL 11 0.0 18.2 81.8 0.0Erie 5 MILLCREEK TOWNSHIP SD Economically Disadvantaged 450 4.9 58.7 34.4 2.0Erie 5 NORTH EAST SD All students 402 9.2 63.7 23.4 3.7Erie 5 NORTH EAST SD Male 197 6.6 54.8 31.5 7.1Erie 5 NORTH EAST SD Female 203 11.8 71.9 15.8 0.5Erie 5 NORTH EAST SD White 391 8.7 63.9 23.5 3.8Erie 5 NORTH EAST SD Black 2Erie 5 NORTH EAST SD Hispanic 3Erie 5 NORTH EAST SD Asian 4Erie 5 NORTH EAST SD Native American 0Erie 5 NORTH EAST SD Multi-ethnic 0Erie 5 NORTH EAST SD IEP 39 2.6 25.6 46.2 25.6Erie 5 NORTH EAST SD ELL 0Erie 5 NORTH EAST SD Economically Disadvantaged 142 4.2 57.0 33.1 5.6Erie 5 NORTHWESTERN SD All students 380 6.1 71.3 20.8 1.8Erie 5 NORTHWESTERN SD Male 186 5.4 61.3 30.6 2.7Erie 5 NORTHWESTERN SD Female 194 6.7 80.9 11.3 1.0Erie 5 NORTHWESTERN SD White 369 6.2 71.3 20.9 1.6Erie 5 NORTHWESTERN SD Black 10 0.0 70.0 20.0 10.0Erie 5 NORTHWESTERN SD Hispanic 1Erie 5 NORTHWESTERN SD Asian 0Erie 5 NORTHWESTERN SD Native American 0Erie 5 NORTHWESTERN SD Multi-ethnic 0Erie 5 NORTHWESTERN SD IEP 66 1.5 37.9 50.0 10.6Erie 5 NORTHWESTERN SD ELL 0Erie 5 NORTHWESTERN SD Economically Disadvantaged 174 3.4 66.7 27.6 2.3
*Full Academic Year Students. Data for groups with less than 10 students assessed were replaced by blanks.Percentages were rounded to the nearest one-tenth.Proficiency percentages may not add up to 100 due to rounding. 92
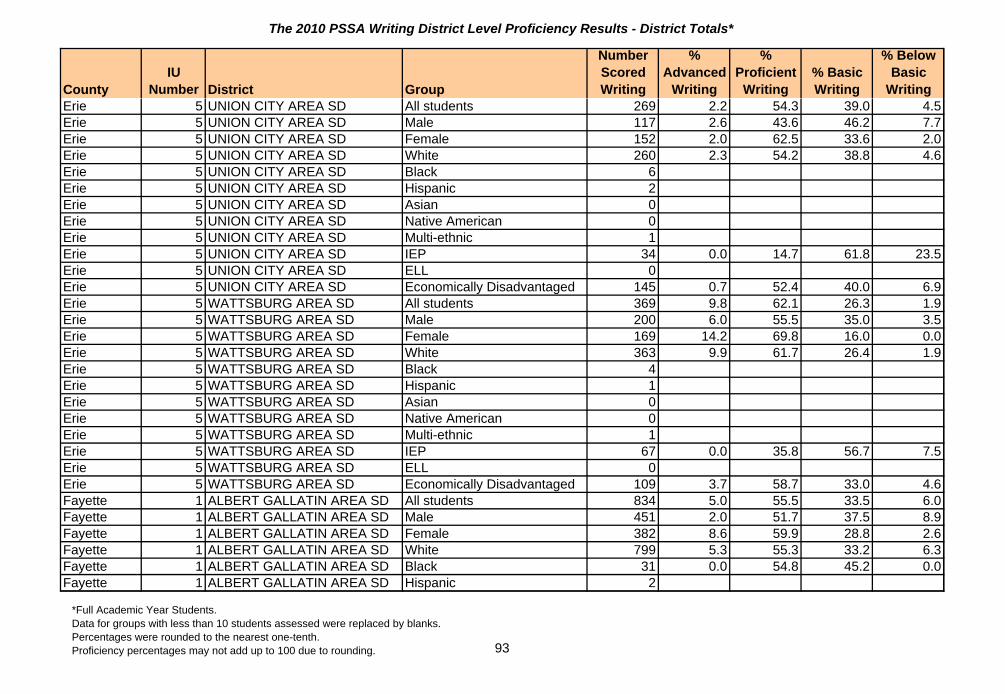
The 2010 PSSA Writing District Level Proficiency Results - District Totals*
CountyIU
Number District Group
Number Scored Writing
% Advanced
Writing
% Proficient
Writing% Basic Writing
% Below Basic
WritingErie 5 UNION CITY AREA SD All students 269 2.2 54.3 39.0 4.5Erie 5 UNION CITY AREA SD Male 117 2.6 43.6 46.2 7.7Erie 5 UNION CITY AREA SD Female 152 2.0 62.5 33.6 2.0Erie 5 UNION CITY AREA SD White 260 2.3 54.2 38.8 4.6Erie 5 UNION CITY AREA SD Black 6Erie 5 UNION CITY AREA SD Hispanic 2Erie 5 UNION CITY AREA SD Asian 0Erie 5 UNION CITY AREA SD Native American 0Erie 5 UNION CITY AREA SD Multi-ethnic 1Erie 5 UNION CITY AREA SD IEP 34 0.0 14.7 61.8 23.5Erie 5 UNION CITY AREA SD ELL 0Erie 5 UNION CITY AREA SD Economically Disadvantaged 145 0.7 52.4 40.0 6.9Erie 5 WATTSBURG AREA SD All students 369 9.8 62.1 26.3 1.9Erie 5 WATTSBURG AREA SD Male 200 6.0 55.5 35.0 3.5Erie 5 WATTSBURG AREA SD Female 169 14.2 69.8 16.0 0.0Erie 5 WATTSBURG AREA SD White 363 9.9 61.7 26.4 1.9Erie 5 WATTSBURG AREA SD Black 4Erie 5 WATTSBURG AREA SD Hispanic 1Erie 5 WATTSBURG AREA SD Asian 0Erie 5 WATTSBURG AREA SD Native American 0Erie 5 WATTSBURG AREA SD Multi-ethnic 1Erie 5 WATTSBURG AREA SD IEP 67 0.0 35.8 56.7 7.5Erie 5 WATTSBURG AREA SD ELL 0Erie 5 WATTSBURG AREA SD Economically Disadvantaged 109 3.7 58.7 33.0 4.6Fayette 1 ALBERT GALLATIN AREA SD All students 834 5.0 55.5 33.5 6.0Fayette 1 ALBERT GALLATIN AREA SD Male 451 2.0 51.7 37.5 8.9Fayette 1 ALBERT GALLATIN AREA SD Female 382 8.6 59.9 28.8 2.6Fayette 1 ALBERT GALLATIN AREA SD White 799 5.3 55.3 33.2 6.3Fayette 1 ALBERT GALLATIN AREA SD Black 31 0.0 54.8 45.2 0.0Fayette 1 ALBERT GALLATIN AREA SD Hispanic 2
*Full Academic Year Students. Data for groups with less than 10 students assessed were replaced by blanks.Percentages were rounded to the nearest one-tenth.Proficiency percentages may not add up to 100 due to rounding. 93
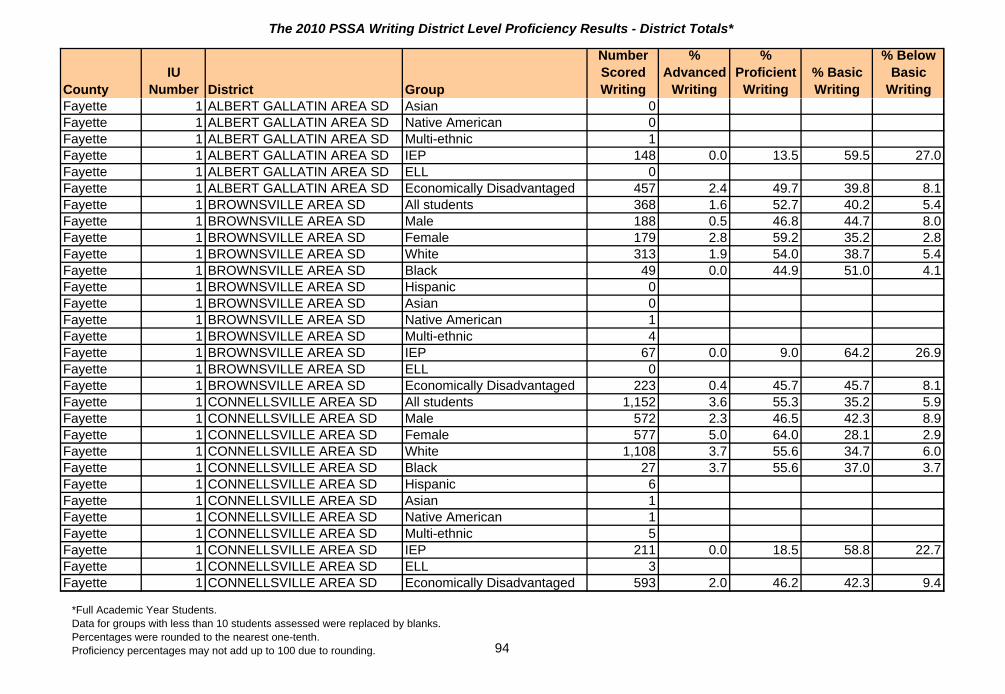
The 2010 PSSA Writing District Level Proficiency Results - District Totals*
CountyIU
Number District Group
Number Scored Writing
% Advanced
Writing
% Proficient
Writing% Basic Writing
% Below Basic
WritingFayette 1 ALBERT GALLATIN AREA SD Asian 0Fayette 1 ALBERT GALLATIN AREA SD Native American 0Fayette 1 ALBERT GALLATIN AREA SD Multi-ethnic 1Fayette 1 ALBERT GALLATIN AREA SD IEP 148 0.0 13.5 59.5 27.0Fayette 1 ALBERT GALLATIN AREA SD ELL 0Fayette 1 ALBERT GALLATIN AREA SD Economically Disadvantaged 457 2.4 49.7 39.8 8.1Fayette 1 BROWNSVILLE AREA SD All students 368 1.6 52.7 40.2 5.4Fayette 1 BROWNSVILLE AREA SD Male 188 0.5 46.8 44.7 8.0Fayette 1 BROWNSVILLE AREA SD Female 179 2.8 59.2 35.2 2.8Fayette 1 BROWNSVILLE AREA SD White 313 1.9 54.0 38.7 5.4Fayette 1 BROWNSVILLE AREA SD Black 49 0.0 44.9 51.0 4.1Fayette 1 BROWNSVILLE AREA SD Hispanic 0Fayette 1 BROWNSVILLE AREA SD Asian 0Fayette 1 BROWNSVILLE AREA SD Native American 1Fayette 1 BROWNSVILLE AREA SD Multi-ethnic 4Fayette 1 BROWNSVILLE AREA SD IEP 67 0.0 9.0 64.2 26.9Fayette 1 BROWNSVILLE AREA SD ELL 0Fayette 1 BROWNSVILLE AREA SD Economically Disadvantaged 223 0.4 45.7 45.7 8.1Fayette 1 CONNELLSVILLE AREA SD All students 1,152 3.6 55.3 35.2 5.9Fayette 1 CONNELLSVILLE AREA SD Male 572 2.3 46.5 42.3 8.9Fayette 1 CONNELLSVILLE AREA SD Female 577 5.0 64.0 28.1 2.9Fayette 1 CONNELLSVILLE AREA SD White 1,108 3.7 55.6 34.7 6.0Fayette 1 CONNELLSVILLE AREA SD Black 27 3.7 55.6 37.0 3.7Fayette 1 CONNELLSVILLE AREA SD Hispanic 6Fayette 1 CONNELLSVILLE AREA SD Asian 1Fayette 1 CONNELLSVILLE AREA SD Native American 1Fayette 1 CONNELLSVILLE AREA SD Multi-ethnic 5Fayette 1 CONNELLSVILLE AREA SD IEP 211 0.0 18.5 58.8 22.7Fayette 1 CONNELLSVILLE AREA SD ELL 3Fayette 1 CONNELLSVILLE AREA SD Economically Disadvantaged 593 2.0 46.2 42.3 9.4
*Full Academic Year Students. Data for groups with less than 10 students assessed were replaced by blanks.Percentages were rounded to the nearest one-tenth.Proficiency percentages may not add up to 100 due to rounding. 94

The 2010 PSSA Writing District Level Proficiency Results - District Totals*
CountyIU
Number District Group
Number Scored Writing
% Advanced
Writing
% Proficient
Writing% Basic Writing
% Below Basic
WritingFayette 1 FRAZIER SD All students 243 5.8 81.9 11.1 1.2Fayette 1 FRAZIER SD Male 121 4.1 81.0 13.2 1.7Fayette 1 FRAZIER SD Female 121 7.4 83.5 8.3 0.8Fayette 1 FRAZIER SD White 236 5.9 82.2 10.6 1.3Fayette 1 FRAZIER SD Black 6Fayette 1 FRAZIER SD Hispanic 0Fayette 1 FRAZIER SD Asian 0Fayette 1 FRAZIER SD Native American 0Fayette 1 FRAZIER SD Multi-ethnic 0Fayette 1 FRAZIER SD IEP 37 5.4 56.8 32.4 5.4Fayette 1 FRAZIER SD ELL 0Fayette 1 FRAZIER SD Economically Disadvantaged 94 2.1 81.9 14.9 1.1Fayette 1 LAUREL HIGHLANDS SD All students 725 7.4 60.4 29.4 2.8Fayette 1 LAUREL HIGHLANDS SD Male 353 4.2 51.3 39.9 4.5Fayette 1 LAUREL HIGHLANDS SD Female 370 10.5 68.9 19.5 1.1Fayette 1 LAUREL HIGHLANDS SD White 647 8.0 62.3 27.2 2.5Fayette 1 LAUREL HIGHLANDS SD Black 65 1.5 41.5 52.3 4.6Fayette 1 LAUREL HIGHLANDS SD Hispanic 2Fayette 1 LAUREL HIGHLANDS SD Asian 6Fayette 1 LAUREL HIGHLANDS SD Native American 1Fayette 1 LAUREL HIGHLANDS SD Multi-ethnic 1Fayette 1 LAUREL HIGHLANDS SD IEP 87 1.1 17.2 65.5 16.1Fayette 1 LAUREL HIGHLANDS SD ELL 0Fayette 1 LAUREL HIGHLANDS SD Economically Disadvantaged 343 4.4 51.6 39.1 5.0Fayette 1 UNIONTOWN AREA SD All students 693 4.9 64.5 28.3 2.3Fayette 1 UNIONTOWN AREA SD Male 348 4.0 58.6 33.0 4.3Fayette 1 UNIONTOWN AREA SD Female 345 5.8 70.4 23.5 0.3Fayette 1 UNIONTOWN AREA SD White 571 5.6 65.5 27.1 1.8Fayette 1 UNIONTOWN AREA SD Black 115 1.7 60.0 33.0 5.2Fayette 1 UNIONTOWN AREA SD Hispanic 3
*Full Academic Year Students. Data for groups with less than 10 students assessed were replaced by blanks.Percentages were rounded to the nearest one-tenth.Proficiency percentages may not add up to 100 due to rounding. 95
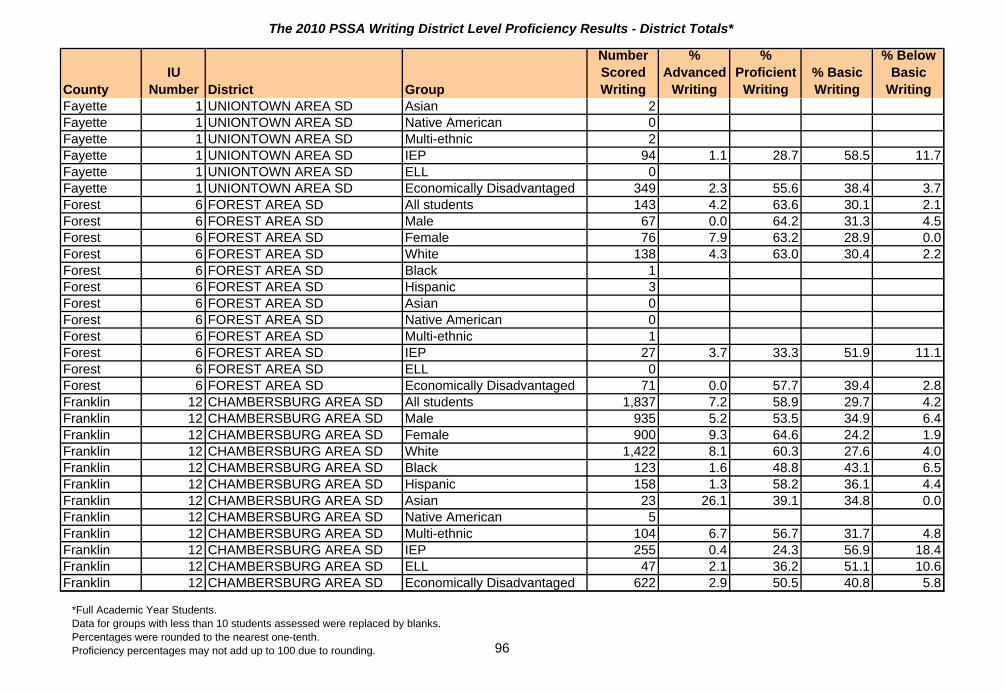
The 2010 PSSA Writing District Level Proficiency Results - District Totals*
CountyIU
Number District Group
Number Scored Writing
% Advanced
Writing
% Proficient
Writing% Basic Writing
% Below Basic
WritingFayette 1 UNIONTOWN AREA SD Asian 2Fayette 1 UNIONTOWN AREA SD Native American 0Fayette 1 UNIONTOWN AREA SD Multi-ethnic 2Fayette 1 UNIONTOWN AREA SD IEP 94 1.1 28.7 58.5 11.7Fayette 1 UNIONTOWN AREA SD ELL 0Fayette 1 UNIONTOWN AREA SD Economically Disadvantaged 349 2.3 55.6 38.4 3.7Forest 6 FOREST AREA SD All students 143 4.2 63.6 30.1 2.1Forest 6 FOREST AREA SD Male 67 0.0 64.2 31.3 4.5Forest 6 FOREST AREA SD Female 76 7.9 63.2 28.9 0.0Forest 6 FOREST AREA SD White 138 4.3 63.0 30.4 2.2Forest 6 FOREST AREA SD Black 1Forest 6 FOREST AREA SD Hispanic 3Forest 6 FOREST AREA SD Asian 0Forest 6 FOREST AREA SD Native American 0Forest 6 FOREST AREA SD Multi-ethnic 1Forest 6 FOREST AREA SD IEP 27 3.7 33.3 51.9 11.1Forest 6 FOREST AREA SD ELL 0Forest 6 FOREST AREA SD Economically Disadvantaged 71 0.0 57.7 39.4 2.8Franklin 12 CHAMBERSBURG AREA SD All students 1,837 7.2 58.9 29.7 4.2Franklin 12 CHAMBERSBURG AREA SD Male 935 5.2 53.5 34.9 6.4Franklin 12 CHAMBERSBURG AREA SD Female 900 9.3 64.6 24.2 1.9Franklin 12 CHAMBERSBURG AREA SD White 1,422 8.1 60.3 27.6 4.0Franklin 12 CHAMBERSBURG AREA SD Black 123 1.6 48.8 43.1 6.5Franklin 12 CHAMBERSBURG AREA SD Hispanic 158 1.3 58.2 36.1 4.4Franklin 12 CHAMBERSBURG AREA SD Asian 23 26.1 39.1 34.8 0.0Franklin 12 CHAMBERSBURG AREA SD Native American 5Franklin 12 CHAMBERSBURG AREA SD Multi-ethnic 104 6.7 56.7 31.7 4.8Franklin 12 CHAMBERSBURG AREA SD IEP 255 0.4 24.3 56.9 18.4Franklin 12 CHAMBERSBURG AREA SD ELL 47 2.1 36.2 51.1 10.6Franklin 12 CHAMBERSBURG AREA SD Economically Disadvantaged 622 2.9 50.5 40.8 5.8
*Full Academic Year Students. Data for groups with less than 10 students assessed were replaced by blanks.Percentages were rounded to the nearest one-tenth.Proficiency percentages may not add up to 100 due to rounding. 96

The 2010 PSSA Writing District Level Proficiency Results - District Totals*
CountyIU
Number District Group
Number Scored Writing
% Advanced
Writing
% Proficient
Writing% Basic Writing
% Below Basic
WritingFranklin 12 FANNETT-METAL SD All students 132 0.0 54.5 40.2 5.3Franklin 12 FANNETT-METAL SD Male 72 0.0 41.7 50.0 8.3Franklin 12 FANNETT-METAL SD Female 60 0.0 70.0 28.3 1.7Franklin 12 FANNETT-METAL SD White 130 0.0 55.4 39.2 5.4Franklin 12 FANNETT-METAL SD Black 1Franklin 12 FANNETT-METAL SD Hispanic 1Franklin 12 FANNETT-METAL SD Asian 0Franklin 12 FANNETT-METAL SD Native American 0Franklin 12 FANNETT-METAL SD Multi-ethnic 0Franklin 12 FANNETT-METAL SD IEP 21 0.0 14.3 52.4 33.3Franklin 12 FANNETT-METAL SD ELL 0Franklin 12 FANNETT-METAL SD Economically Disadvantaged 43 0.0 34.9 55.8 9.3Franklin 12 GREENCASTLE-ANTRIM SD All students 672 14.0 64.9 19.2 1.9Franklin 12 GREENCASTLE-ANTRIM SD Male 328 6.7 64.3 25.6 3.4Franklin 12 GREENCASTLE-ANTRIM SD Female 344 20.9 65.4 13.1 0.6Franklin 12 GREENCASTLE-ANTRIM SD White 612 13.9 64.9 19.1 2.1Franklin 12 GREENCASTLE-ANTRIM SD Black 16 0.0 68.8 31.3 0.0Franklin 12 GREENCASTLE-ANTRIM SD Hispanic 14 7.1 64.3 28.6 0.0Franklin 12 GREENCASTLE-ANTRIM SD Asian 11 36.4 63.6 0.0 0.0Franklin 12 GREENCASTLE-ANTRIM SD Native American 2Franklin 12 GREENCASTLE-ANTRIM SD Multi-ethnic 17 23.5 58.8 17.6 0.0Franklin 12 GREENCASTLE-ANTRIM SD IEP 84 0.0 27.4 58.3 14.3Franklin 12 GREENCASTLE-ANTRIM SD ELL 0Franklin 12 GREENCASTLE-ANTRIM SD Economically Disadvantaged 123 4.9 59.3 30.1 5.7Franklin 12 TUSCARORA SD All students 636 19.0 56.3 21.7 3.0Franklin 12 TUSCARORA SD Male 323 13.6 52.6 30.0 3.7Franklin 12 TUSCARORA SD Female 301 25.6 61.5 12.3 0.7Franklin 12 TUSCARORA SD White 590 19.2 57.3 21.2 2.4Franklin 12 TUSCARORA SD Black 16 25.0 50.0 25.0 0.0Franklin 12 TUSCARORA SD Hispanic 17 23.5 52.9 23.5 0.0
*Full Academic Year Students. Data for groups with less than 10 students assessed were replaced by blanks.Percentages were rounded to the nearest one-tenth.Proficiency percentages may not add up to 100 due to rounding. 97

The 2010 PSSA Writing District Level Proficiency Results - District Totals*
CountyIU
Number District Group
Number Scored Writing
% Advanced
Writing
% Proficient
Writing% Basic Writing
% Below Basic
WritingFranklin 12 TUSCARORA SD Asian 0Franklin 12 TUSCARORA SD Native American 0Franklin 12 TUSCARORA SD Multi-ethnic 1Franklin 12 TUSCARORA SD IEP 88 3.4 35.2 50.0 11.4Franklin 12 TUSCARORA SD ELL 5Franklin 12 TUSCARORA SD Economically Disadvantaged 210 14.8 53.3 27.6 4.3Franklin 12 WAYNESBORO AREA SD All students 913 7.0 66.4 24.9 1.8Franklin 12 WAYNESBORO AREA SD Male 433 4.2 60.0 32.8 3.0Franklin 12 WAYNESBORO AREA SD Female 478 9.6 72.4 17.4 0.6Franklin 12 WAYNESBORO AREA SD White 860 7.1 67.0 24.1 1.9Franklin 12 WAYNESBORO AREA SD Black 28 7.1 53.6 39.3 0.0Franklin 12 WAYNESBORO AREA SD Hispanic 10 0.0 70.0 30.0 0.0Franklin 12 WAYNESBORO AREA SD Asian 9Franklin 12 WAYNESBORO AREA SD Native American 1Franklin 12 WAYNESBORO AREA SD Multi-ethnic 2Franklin 12 WAYNESBORO AREA SD IEP 88 0.0 28.4 59.1 12.5Franklin 12 WAYNESBORO AREA SD ELL 1Franklin 12 WAYNESBORO AREA SD Economically Disadvantaged 298 2.7 58.7 35.9 2.7Fulton 11 CENTRAL FULTON SD All students 179 3.4 62.6 30.7 3.4Fulton 11 CENTRAL FULTON SD Male 97 2.1 52.6 39.2 6.2Fulton 11 CENTRAL FULTON SD Female 82 4.9 74.4 20.7 0.0Fulton 11 CENTRAL FULTON SD White 176 3.4 62.5 30.7 3.4Fulton 11 CENTRAL FULTON SD Black 3Fulton 11 CENTRAL FULTON SD Hispanic 0Fulton 11 CENTRAL FULTON SD Asian 0Fulton 11 CENTRAL FULTON SD Native American 0Fulton 11 CENTRAL FULTON SD Multi-ethnic 0Fulton 11 CENTRAL FULTON SD IEP 23 0.0 13.0 69.6 17.4Fulton 11 CENTRAL FULTON SD ELL 0Fulton 11 CENTRAL FULTON SD Economically Disadvantaged 60 1.7 55.0 38.3 5.0
*Full Academic Year Students. Data for groups with less than 10 students assessed were replaced by blanks.Percentages were rounded to the nearest one-tenth.Proficiency percentages may not add up to 100 due to rounding. 98

The 2010 PSSA Writing District Level Proficiency Results - District Totals*
CountyIU
Number District Group
Number Scored Writing
% Advanced
Writing
% Proficient
Writing% Basic Writing
% Below Basic
WritingFulton 11 FORBES ROAD SD All students 110 0.9 61.8 31.8 5.5Fulton 11 FORBES ROAD SD Male 60 1.7 70.0 21.7 6.7Fulton 11 FORBES ROAD SD Female 50 0.0 52.0 44.0 4.0Fulton 11 FORBES ROAD SD White 109 0.9 61.5 32.1 5.5Fulton 11 FORBES ROAD SD Black 0Fulton 11 FORBES ROAD SD Hispanic 0Fulton 11 FORBES ROAD SD Asian 0Fulton 11 FORBES ROAD SD Native American 0Fulton 11 FORBES ROAD SD Multi-ethnic 1Fulton 11 FORBES ROAD SD IEP 21 0.0 14.3 57.1 28.6Fulton 11 FORBES ROAD SD ELL 0Fulton 11 FORBES ROAD SD Economically Disadvantaged 46 2.2 43.5 45.7 8.7Fulton 11 SOUTHERN FULTON SD All students 198 11.1 80.3 8.6 0.0Fulton 11 SOUTHERN FULTON SD Male 97 7.2 81.4 11.3 0.0Fulton 11 SOUTHERN FULTON SD Female 101 14.9 79.2 5.9 0.0Fulton 11 SOUTHERN FULTON SD White 196 11.2 80.6 8.2 0.0Fulton 11 SOUTHERN FULTON SD Black 0Fulton 11 SOUTHERN FULTON SD Hispanic 1Fulton 11 SOUTHERN FULTON SD Asian 1Fulton 11 SOUTHERN FULTON SD Native American 0Fulton 11 SOUTHERN FULTON SD Multi-ethnic 0Fulton 11 SOUTHERN FULTON SD IEP 26 3.8 53.8 42.3 0.0Fulton 11 SOUTHERN FULTON SD ELL 1Fulton 11 SOUTHERN FULTON SD Economically Disadvantaged 88 8.0 79.5 12.5 0.0Greene 1 CARMICHAELS AREA SD All students 222 6.8 56.8 34.7 1.8Greene 1 CARMICHAELS AREA SD Male 115 1.7 53.9 40.9 3.5Greene 1 CARMICHAELS AREA SD Female 107 12.1 59.8 28.0 0.0Greene 1 CARMICHAELS AREA SD White 217 6.9 56.2 35.0 1.8Greene 1 CARMICHAELS AREA SD Black 2Greene 1 CARMICHAELS AREA SD Hispanic 2
*Full Academic Year Students. Data for groups with less than 10 students assessed were replaced by blanks.Percentages were rounded to the nearest one-tenth.Proficiency percentages may not add up to 100 due to rounding. 99

The 2010 PSSA Writing District Level Proficiency Results - District Totals*
CountyIU
Number District Group
Number Scored Writing
% Advanced
Writing
% Proficient
Writing% Basic Writing
% Below Basic
WritingGreene 1 CARMICHAELS AREA SD Asian 0Greene 1 CARMICHAELS AREA SD Native American 0Greene 1 CARMICHAELS AREA SD Multi-ethnic 0Greene 1 CARMICHAELS AREA SD IEP 34 2.9 20.6 64.7 11.8Greene 1 CARMICHAELS AREA SD ELL 0Greene 1 CARMICHAELS AREA SD Economically Disadvantaged 101 5.0 42.6 49.5 3.0Greene 1 CENTRAL GREENE SD All students 441 5.4 68.9 21.1 4.5Greene 1 CENTRAL GREENE SD Male 238 2.1 63.9 26.5 7.6Greene 1 CENTRAL GREENE SD Female 203 9.4 74.9 14.8 1.0Greene 1 CENTRAL GREENE SD White 427 5.6 68.9 20.8 4.7Greene 1 CENTRAL GREENE SD Black 8Greene 1 CENTRAL GREENE SD Hispanic 0Greene 1 CENTRAL GREENE SD Asian 3Greene 1 CENTRAL GREENE SD Native American 2Greene 1 CENTRAL GREENE SD Multi-ethnic 1Greene 1 CENTRAL GREENE SD IEP 87 0.0 26.4 50.6 23.0Greene 1 CENTRAL GREENE SD ELL 1Greene 1 CENTRAL GREENE SD Economically Disadvantaged 157 1.9 55.4 32.5 10.2Greene 1 JEFFERSON-MORGAN SD All students 200 4.5 41.5 50.0 4.0Greene 1 JEFFERSON-MORGAN SD Male 108 5.6 25.0 63.0 6.5Greene 1 JEFFERSON-MORGAN SD Female 92 3.3 60.9 34.8 1.1Greene 1 JEFFERSON-MORGAN SD White 192 4.7 42.2 49.0 4.2Greene 1 JEFFERSON-MORGAN SD Black 8Greene 1 JEFFERSON-MORGAN SD Hispanic 0Greene 1 JEFFERSON-MORGAN SD Asian 0Greene 1 JEFFERSON-MORGAN SD Native American 0Greene 1 JEFFERSON-MORGAN SD Multi-ethnic 0Greene 1 JEFFERSON-MORGAN SD IEP 36 2.8 11.1 75.0 11.1Greene 1 JEFFERSON-MORGAN SD ELL 0Greene 1 JEFFERSON-MORGAN SD Economically Disadvantaged 82 2.4 32.9 59.8 4.9
*Full Academic Year Students. Data for groups with less than 10 students assessed were replaced by blanks.Percentages were rounded to the nearest one-tenth.Proficiency percentages may not add up to 100 due to rounding. 100

The 2010 PSSA Writing District Level Proficiency Results - District Totals*
CountyIU
Number District Group
Number Scored Writing
% Advanced
Writing
% Proficient
Writing% Basic Writing
% Below Basic
WritingGreene 1 SOUTHEASTERN GREENE SD All students 156 1.3 62.2 32.1 4.5Greene 1 SOUTHEASTERN GREENE SD Male 85 1.2 49.4 43.5 5.9Greene 1 SOUTHEASTERN GREENE SD Female 71 1.4 77.5 18.3 2.8Greene 1 SOUTHEASTERN GREENE SD White 153 1.3 62.1 32.0 4.6Greene 1 SOUTHEASTERN GREENE SD Black 3Greene 1 SOUTHEASTERN GREENE SD Hispanic 0Greene 1 SOUTHEASTERN GREENE SD Asian 0Greene 1 SOUTHEASTERN GREENE SD Native American 0Greene 1 SOUTHEASTERN GREENE SD Multi-ethnic 0Greene 1 SOUTHEASTERN GREENE SD IEP 22 0.0 18.2 50.0 31.8Greene 1 SOUTHEASTERN GREENE SD ELL 0Greene 1 SOUTHEASTERN GREENE SD Economically Disadvantaged 71 1.4 52.1 42.3 4.2Greene 1 WEST GREENE SD All students 179 2.2 55.3 35.2 7.3Greene 1 WEST GREENE SD Male 88 1.1 44.3 46.6 8.0Greene 1 WEST GREENE SD Female 91 3.3 65.9 24.2 6.6Greene 1 WEST GREENE SD White 177 2.3 54.8 35.6 7.3Greene 1 WEST GREENE SD Black 0Greene 1 WEST GREENE SD Hispanic 0Greene 1 WEST GREENE SD Asian 2Greene 1 WEST GREENE SD Native American 0Greene 1 WEST GREENE SD Multi-ethnic 0Greene 1 WEST GREENE SD IEP 35 0.0 25.7 48.6 25.7Greene 1 WEST GREENE SD ELL 0Greene 1 WEST GREENE SD Economically Disadvantaged 88 0.0 48.9 38.6 12.5Huntingdon 11 HUNTINGDON AREA SD All students 459 5.4 63.4 28.1 3.1Huntingdon 11 HUNTINGDON AREA SD Male 241 2.9 56.8 34.9 5.4Huntingdon 11 HUNTINGDON AREA SD Female 217 8.3 71.0 20.3 0.5Huntingdon 11 HUNTINGDON AREA SD White 436 5.5 64.4 27.5 2.5Huntingdon 11 HUNTINGDON AREA SD Black 15 0.0 40.0 40.0 20.0Huntingdon 11 HUNTINGDON AREA SD Hispanic 4
*Full Academic Year Students. Data for groups with less than 10 students assessed were replaced by blanks.Percentages were rounded to the nearest one-tenth.Proficiency percentages may not add up to 100 due to rounding. 101
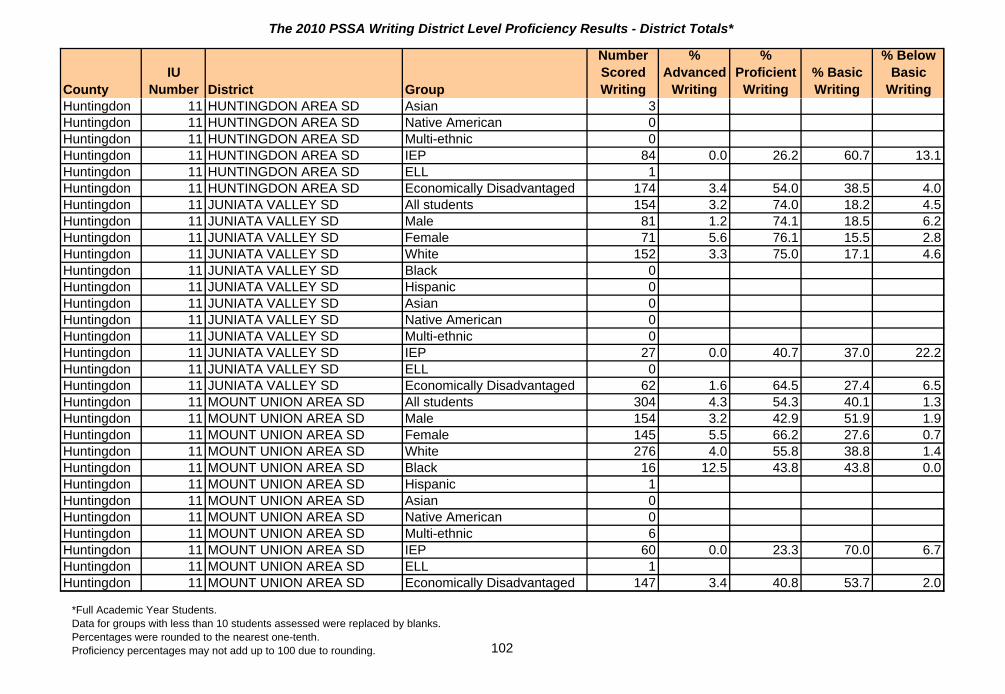
The 2010 PSSA Writing District Level Proficiency Results - District Totals*
CountyIU
Number District Group
Number Scored Writing
% Advanced
Writing
% Proficient
Writing% Basic Writing
% Below Basic
WritingHuntingdon 11 HUNTINGDON AREA SD Asian 3Huntingdon 11 HUNTINGDON AREA SD Native American 0Huntingdon 11 HUNTINGDON AREA SD Multi-ethnic 0Huntingdon 11 HUNTINGDON AREA SD IEP 84 0.0 26.2 60.7 13.1Huntingdon 11 HUNTINGDON AREA SD ELL 1Huntingdon 11 HUNTINGDON AREA SD Economically Disadvantaged 174 3.4 54.0 38.5 4.0Huntingdon 11 JUNIATA VALLEY SD All students 154 3.2 74.0 18.2 4.5Huntingdon 11 JUNIATA VALLEY SD Male 81 1.2 74.1 18.5 6.2Huntingdon 11 JUNIATA VALLEY SD Female 71 5.6 76.1 15.5 2.8Huntingdon 11 JUNIATA VALLEY SD White 152 3.3 75.0 17.1 4.6Huntingdon 11 JUNIATA VALLEY SD Black 0Huntingdon 11 JUNIATA VALLEY SD Hispanic 0Huntingdon 11 JUNIATA VALLEY SD Asian 0Huntingdon 11 JUNIATA VALLEY SD Native American 0Huntingdon 11 JUNIATA VALLEY SD Multi-ethnic 0Huntingdon 11 JUNIATA VALLEY SD IEP 27 0.0 40.7 37.0 22.2Huntingdon 11 JUNIATA VALLEY SD ELL 0Huntingdon 11 JUNIATA VALLEY SD Economically Disadvantaged 62 1.6 64.5 27.4 6.5Huntingdon 11 MOUNT UNION AREA SD All students 304 4.3 54.3 40.1 1.3Huntingdon 11 MOUNT UNION AREA SD Male 154 3.2 42.9 51.9 1.9Huntingdon 11 MOUNT UNION AREA SD Female 145 5.5 66.2 27.6 0.7Huntingdon 11 MOUNT UNION AREA SD White 276 4.0 55.8 38.8 1.4Huntingdon 11 MOUNT UNION AREA SD Black 16 12.5 43.8 43.8 0.0Huntingdon 11 MOUNT UNION AREA SD Hispanic 1Huntingdon 11 MOUNT UNION AREA SD Asian 0Huntingdon 11 MOUNT UNION AREA SD Native American 0Huntingdon 11 MOUNT UNION AREA SD Multi-ethnic 6Huntingdon 11 MOUNT UNION AREA SD IEP 60 0.0 23.3 70.0 6.7Huntingdon 11 MOUNT UNION AREA SD ELL 1Huntingdon 11 MOUNT UNION AREA SD Economically Disadvantaged 147 3.4 40.8 53.7 2.0
*Full Academic Year Students. Data for groups with less than 10 students assessed were replaced by blanks.Percentages were rounded to the nearest one-tenth.Proficiency percentages may not add up to 100 due to rounding. 102

The 2010 PSSA Writing District Level Proficiency Results - District Totals*
CountyIU
Number District Group
Number Scored Writing
% Advanced
Writing
% Proficient
Writing% Basic Writing
% Below Basic
WritingHuntingdon 11 SOUTHERN HUNTINGDON COUAll students 306 5.9 62.4 29.1 2.6Huntingdon 11 SOUTHERN HUNTINGDON COUMale 149 2.0 51.7 42.3 4.0Huntingdon 11 SOUTHERN HUNTINGDON COUFemale 154 9.7 73.4 15.6 1.3Huntingdon 11 SOUTHERN HUNTINGDON COUWhite 298 6.0 62.4 28.9 2.7Huntingdon 11 SOUTHERN HUNTINGDON COUBlack 5Huntingdon 11 SOUTHERN HUNTINGDON COUHispanic 0Huntingdon 11 SOUTHERN HUNTINGDON COUAsian 0Huntingdon 11 SOUTHERN HUNTINGDON COUNative American 0Huntingdon 11 SOUTHERN HUNTINGDON COUMulti-ethnic 0Huntingdon 11 SOUTHERN HUNTINGDON COUIEP 51 0.0 33.3 52.9 13.7Huntingdon 11 SOUTHERN HUNTINGDON COUELL 0Huntingdon 11 SOUTHERN HUNTINGDON COUEconomically Disadvantaged 113 2.7 61.9 32.7 2.7Indiana 28 BLAIRSVILLE-SALTSBURG SD All students 406 4.7 68.5 26.8 0.0Indiana 28 BLAIRSVILLE-SALTSBURG SD Male 199 3.0 61.3 35.7 0.0Indiana 28 BLAIRSVILLE-SALTSBURG SD Female 207 6.3 75.4 18.4 0.0Indiana 28 BLAIRSVILLE-SALTSBURG SD White 398 4.8 68.8 26.4 0.0Indiana 28 BLAIRSVILLE-SALTSBURG SD Black 7Indiana 28 BLAIRSVILLE-SALTSBURG SD Hispanic 1Indiana 28 BLAIRSVILLE-SALTSBURG SD Asian 0Indiana 28 BLAIRSVILLE-SALTSBURG SD Native American 0Indiana 28 BLAIRSVILLE-SALTSBURG SD Multi-ethnic 0Indiana 28 BLAIRSVILLE-SALTSBURG SD IEP 69 0.0 49.3 50.7 0.0Indiana 28 BLAIRSVILLE-SALTSBURG SD ELL 0Indiana 28 BLAIRSVILLE-SALTSBURG SD Economically Disadvantaged 165 2.4 63.0 34.5 0.0Indiana 28 HOMER-CENTER SD All students 189 7.9 60.8 30.7 0.5Indiana 28 HOMER-CENTER SD Male 92 3.3 57.6 39.1 0.0Indiana 28 HOMER-CENTER SD Female 97 12.4 63.9 22.7 1.0Indiana 28 HOMER-CENTER SD White 183 8.2 61.2 30.1 0.5Indiana 28 HOMER-CENTER SD Black 5Indiana 28 HOMER-CENTER SD Hispanic 1
*Full Academic Year Students. Data for groups with less than 10 students assessed were replaced by blanks.Percentages were rounded to the nearest one-tenth.Proficiency percentages may not add up to 100 due to rounding. 103

The 2010 PSSA Writing District Level Proficiency Results - District Totals*
CountyIU
Number District Group
Number Scored Writing
% Advanced
Writing
% Proficient
Writing% Basic Writing
% Below Basic
WritingIndiana 28 HOMER-CENTER SD Asian 0Indiana 28 HOMER-CENTER SD Native American 0Indiana 28 HOMER-CENTER SD Multi-ethnic 0Indiana 28 HOMER-CENTER SD IEP 26 0.0 26.9 69.2 3.8Indiana 28 HOMER-CENTER SD ELL 0Indiana 28 HOMER-CENTER SD Economically Disadvantaged 70 5.7 54.3 38.6 1.4Indiana 28 INDIANA AREA SD All students 622 18.3 66.2 13.2 2.3Indiana 28 INDIANA AREA SD Male 301 12.0 64.5 20.3 3.3Indiana 28 INDIANA AREA SD Female 321 24.3 67.9 6.5 1.2Indiana 28 INDIANA AREA SD White 557 18.5 66.1 13.3 2.2Indiana 28 INDIANA AREA SD Black 34 11.8 64.7 17.6 5.9Indiana 28 INDIANA AREA SD Hispanic 4Indiana 28 INDIANA AREA SD Asian 26 26.9 73.1 0.0 0.0Indiana 28 INDIANA AREA SD Native American 0Indiana 28 INDIANA AREA SD Multi-ethnic 0Indiana 28 INDIANA AREA SD IEP 80 6.3 37.5 43.8 12.5Indiana 28 INDIANA AREA SD ELL 3Indiana 28 INDIANA AREA SD Economically Disadvantaged 160 10.6 59.4 25.0 5.0Indiana 28 MARION CENTER AREA SD All students 343 12.0 69.1 17.2 1.7Indiana 28 MARION CENTER AREA SD Male 177 6.2 69.5 22.0 2.3Indiana 28 MARION CENTER AREA SD Female 166 18.1 68.7 12.0 1.2Indiana 28 MARION CENTER AREA SD White 340 12.1 69.4 16.8 1.8Indiana 28 MARION CENTER AREA SD Black 1Indiana 28 MARION CENTER AREA SD Hispanic 0Indiana 28 MARION CENTER AREA SD Asian 0Indiana 28 MARION CENTER AREA SD Native American 2Indiana 28 MARION CENTER AREA SD Multi-ethnic 0Indiana 28 MARION CENTER AREA SD IEP 74 10.8 37.8 43.2 8.1Indiana 28 MARION CENTER AREA SD ELL 0Indiana 28 MARION CENTER AREA SD Economically Disadvantaged 141 7.1 66.0 24.1 2.8
*Full Academic Year Students. Data for groups with less than 10 students assessed were replaced by blanks.Percentages were rounded to the nearest one-tenth.Proficiency percentages may not add up to 100 due to rounding. 104

The 2010 PSSA Writing District Level Proficiency Results - District Totals*
CountyIU
Number District Group
Number Scored Writing
% Advanced
Writing
% Proficient
Writing% Basic Writing
% Below Basic
WritingIndiana 28 PENNS MANOR AREA SD All students 222 2.7 58.1 37.4 1.8Indiana 28 PENNS MANOR AREA SD Male 110 0.9 45.5 50.0 3.6Indiana 28 PENNS MANOR AREA SD Female 112 4.5 70.5 25.0 0.0Indiana 28 PENNS MANOR AREA SD White 216 2.8 58.3 37.0 1.9Indiana 28 PENNS MANOR AREA SD Black 4Indiana 28 PENNS MANOR AREA SD Hispanic 1Indiana 28 PENNS MANOR AREA SD Asian 0Indiana 28 PENNS MANOR AREA SD Native American 0Indiana 28 PENNS MANOR AREA SD Multi-ethnic 1Indiana 28 PENNS MANOR AREA SD IEP 39 0.0 33.3 56.4 10.3Indiana 28 PENNS MANOR AREA SD ELL 0Indiana 28 PENNS MANOR AREA SD Economically Disadvantaged 113 2.7 45.1 48.7 3.5Indiana 28 PURCHASE LINE SD All students 241 9.1 56.0 32.8 2.1Indiana 28 PURCHASE LINE SD Male 121 5.8 51.2 38.8 4.1Indiana 28 PURCHASE LINE SD Female 120 12.5 60.8 26.7 0.0Indiana 28 PURCHASE LINE SD White 238 9.2 55.5 33.2 2.1Indiana 28 PURCHASE LINE SD Black 1Indiana 28 PURCHASE LINE SD Hispanic 2Indiana 28 PURCHASE LINE SD Asian 0Indiana 28 PURCHASE LINE SD Native American 0Indiana 28 PURCHASE LINE SD Multi-ethnic 0Indiana 28 PURCHASE LINE SD IEP 49 0.0 26.5 63.3 10.2Indiana 28 PURCHASE LINE SD ELL 0Indiana 28 PURCHASE LINE SD Economically Disadvantaged 134 5.2 48.5 42.5 3.7Indiana 28 UNITED SD All students 273 6.6 70.0 21.2 2.2Indiana 28 UNITED SD Male 138 3.6 71.0 22.5 2.9Indiana 28 UNITED SD Female 135 9.6 68.9 20.0 1.5Indiana 28 UNITED SD White 269 6.7 70.6 20.8 1.9Indiana 28 UNITED SD Black 2Indiana 28 UNITED SD Hispanic 0
*Full Academic Year Students. Data for groups with less than 10 students assessed were replaced by blanks.Percentages were rounded to the nearest one-tenth.Proficiency percentages may not add up to 100 due to rounding. 105

The 2010 PSSA Writing District Level Proficiency Results - District Totals*
CountyIU
Number District Group
Number Scored Writing
% Advanced
Writing
% Proficient
Writing% Basic Writing
% Below Basic
WritingIndiana 28 UNITED SD Asian 0Indiana 28 UNITED SD Native American 1Indiana 28 UNITED SD Multi-ethnic 1Indiana 28 UNITED SD IEP 41 0.0 31.7 53.7 14.6Indiana 28 UNITED SD ELL 0Indiana 28 UNITED SD Economically Disadvantaged 99 3.0 69.7 25.3 2.0Jefferson 6 BROCKWAY AREA SD All students 261 3.1 67.0 25.7 4.2Jefferson 6 BROCKWAY AREA SD Male 121 2.5 62.8 27.3 7.4Jefferson 6 BROCKWAY AREA SD Female 140 3.6 70.7 24.3 1.4Jefferson 6 BROCKWAY AREA SD White 258 3.1 67.1 25.6 4.3Jefferson 6 BROCKWAY AREA SD Black 1Jefferson 6 BROCKWAY AREA SD Hispanic 1Jefferson 6 BROCKWAY AREA SD Asian 1Jefferson 6 BROCKWAY AREA SD Native American 0Jefferson 6 BROCKWAY AREA SD Multi-ethnic 0Jefferson 6 BROCKWAY AREA SD IEP 33 0.0 21.2 54.5 24.2Jefferson 6 BROCKWAY AREA SD ELL 0Jefferson 6 BROCKWAY AREA SD Economically Disadvantaged 112 0.9 64.3 31.3 3.6Jefferson 6 BROOKVILLE AREA SD All students 359 5.8 67.7 23.7 2.8Jefferson 6 BROOKVILLE AREA SD Male 184 4.3 59.2 33.2 3.3Jefferson 6 BROOKVILLE AREA SD Female 175 7.4 76.6 13.7 2.3Jefferson 6 BROOKVILLE AREA SD White 351 5.7 67.5 23.9 2.8Jefferson 6 BROOKVILLE AREA SD Black 2Jefferson 6 BROOKVILLE AREA SD Hispanic 3Jefferson 6 BROOKVILLE AREA SD Asian 1Jefferson 6 BROOKVILLE AREA SD Native American 2Jefferson 6 BROOKVILLE AREA SD Multi-ethnic 0Jefferson 6 BROOKVILLE AREA SD IEP 56 0.0 19.6 66.1 14.3Jefferson 6 BROOKVILLE AREA SD ELL 0Jefferson 6 BROOKVILLE AREA SD Economically Disadvantaged 146 1.4 59.6 34.9 4.1
*Full Academic Year Students. Data for groups with less than 10 students assessed were replaced by blanks.Percentages were rounded to the nearest one-tenth.Proficiency percentages may not add up to 100 due to rounding. 106

The 2010 PSSA Writing District Level Proficiency Results - District Totals*
CountyIU
Number District Group
Number Scored Writing
% Advanced
Writing
% Proficient
Writing% Basic Writing
% Below Basic
WritingJefferson 6 PUNXSUTAWNEY AREA SD All students 646 6.0 56.8 33.3 3.9Jefferson 6 PUNXSUTAWNEY AREA SD Male 312 3.8 49.7 41.3 5.1Jefferson 6 PUNXSUTAWNEY AREA SD Female 334 8.1 63.5 25.7 2.7Jefferson 6 PUNXSUTAWNEY AREA SD White 636 6.0 56.8 33.3 3.9Jefferson 6 PUNXSUTAWNEY AREA SD Black 1Jefferson 6 PUNXSUTAWNEY AREA SD Hispanic 3Jefferson 6 PUNXSUTAWNEY AREA SD Asian 4Jefferson 6 PUNXSUTAWNEY AREA SD Native American 1Jefferson 6 PUNXSUTAWNEY AREA SD Multi-ethnic 1Jefferson 6 PUNXSUTAWNEY AREA SD IEP 105 0.0 23.8 57.1 19.0Jefferson 6 PUNXSUTAWNEY AREA SD ELL 0Jefferson 6 PUNXSUTAWNEY AREA SD Economically Disadvantaged 264 1.5 45.5 46.2 6.8Juniata 11 JUNIATA COUNTY SD All students 669 4.2 58.0 35.9 1.9Juniata 11 JUNIATA COUNTY SD Male 340 1.5 50.0 45.9 2.6Juniata 11 JUNIATA COUNTY SD Female 328 7.0 66.5 25.6 0.9Juniata 11 JUNIATA COUNTY SD White 625 4.3 58.9 35.0 1.8Juniata 11 JUNIATA COUNTY SD Black 7Juniata 11 JUNIATA COUNTY SD Hispanic 31 0.0 38.7 58.1 3.2Juniata 11 JUNIATA COUNTY SD Asian 4Juniata 11 JUNIATA COUNTY SD Native American 1Juniata 11 JUNIATA COUNTY SD Multi-ethnic 0Juniata 11 JUNIATA COUNTY SD IEP 73 0.0 27.4 60.3 12.3Juniata 11 JUNIATA COUNTY SD ELL 14 0.0 7.1 85.7 7.1Juniata 11 JUNIATA COUNTY SD Economically Disadvantaged 218 3.2 52.3 42.7 1.8Lackawanna 19 ABINGTON HEIGHTS SD All students 817 20.1 68.9 10.6 0.4Lackawanna 19 ABINGTON HEIGHTS SD Male 411 16.3 68.6 14.6 0.5Lackawanna 19 ABINGTON HEIGHTS SD Female 405 24.0 69.4 6.7 0.0Lackawanna 19 ABINGTON HEIGHTS SD White 753 20.3 69.1 10.4 0.3Lackawanna 19 ABINGTON HEIGHTS SD Black 13 23.1 61.5 15.4 0.0Lackawanna 19 ABINGTON HEIGHTS SD Hispanic 18 11.1 72.2 16.7 0.0
*Full Academic Year Students. Data for groups with less than 10 students assessed were replaced by blanks.Percentages were rounded to the nearest one-tenth.Proficiency percentages may not add up to 100 due to rounding. 107

The 2010 PSSA Writing District Level Proficiency Results - District Totals*
CountyIU
Number District Group
Number Scored Writing
% Advanced
Writing
% Proficient
Writing% Basic Writing
% Below Basic
WritingLackawanna 19 ABINGTON HEIGHTS SD Asian 31 19.4 71.0 9.7 0.0Lackawanna 19 ABINGTON HEIGHTS SD Native American 1Lackawanna 19 ABINGTON HEIGHTS SD Multi-ethnic 0Lackawanna 19 ABINGTON HEIGHTS SD IEP 93 0.0 53.8 43.0 3.2Lackawanna 19 ABINGTON HEIGHTS SD ELL 4Lackawanna 19 ABINGTON HEIGHTS SD Economically Disadvantaged 89 16.9 61.8 19.1 2.2Lackawanna 19 CARBONDALE AREA SD All students 324 6.2 65.1 25.6 3.1Lackawanna 19 CARBONDALE AREA SD Male 167 5.4 53.9 34.7 6.0Lackawanna 19 CARBONDALE AREA SD Female 157 7.0 77.1 15.9 0.0Lackawanna 19 CARBONDALE AREA SD White 307 6.5 64.5 25.7 3.3Lackawanna 19 CARBONDALE AREA SD Black 6Lackawanna 19 CARBONDALE AREA SD Hispanic 7Lackawanna 19 CARBONDALE AREA SD Asian 0Lackawanna 19 CARBONDALE AREA SD Native American 1Lackawanna 19 CARBONDALE AREA SD Multi-ethnic 0Lackawanna 19 CARBONDALE AREA SD IEP 63 0.0 23.8 61.9 14.3Lackawanna 19 CARBONDALE AREA SD ELL 0Lackawanna 19 CARBONDALE AREA SD Economically Disadvantaged 179 3.4 59.2 33.5 3.9Lackawanna 19 DUNMORE SD All students 382 10.2 69.1 20.2 0.5Lackawanna 19 DUNMORE SD Male 191 7.3 64.4 27.2 1.0Lackawanna 19 DUNMORE SD Female 191 13.1 73.8 13.1 0.0Lackawanna 19 DUNMORE SD White 359 10.9 70.5 18.1 0.6Lackawanna 19 DUNMORE SD Black 6Lackawanna 19 DUNMORE SD Hispanic 6Lackawanna 19 DUNMORE SD Asian 9Lackawanna 19 DUNMORE SD Native American 2Lackawanna 19 DUNMORE SD Multi-ethnic 0Lackawanna 19 DUNMORE SD IEP 59 0.0 52.5 44.1 3.4Lackawanna 19 DUNMORE SD ELL 3Lackawanna 19 DUNMORE SD Economically Disadvantaged 85 5.9 61.2 32.9 0.0
*Full Academic Year Students. Data for groups with less than 10 students assessed were replaced by blanks.Percentages were rounded to the nearest one-tenth.Proficiency percentages may not add up to 100 due to rounding. 108

The 2010 PSSA Writing District Level Proficiency Results - District Totals*
CountyIU
Number District Group
Number Scored Writing
% Advanced
Writing
% Proficient
Writing% Basic Writing
% Below Basic
WritingLackawanna 19 LAKELAND SD All students 352 24.4 58.8 13.4 3.4Lackawanna 19 LAKELAND SD Male 164 18.3 56.1 19.5 6.1Lackawanna 19 LAKELAND SD Female 188 29.8 61.2 8.0 1.1Lackawanna 19 LAKELAND SD White 343 24.5 58.6 13.4 3.5Lackawanna 19 LAKELAND SD Black 3Lackawanna 19 LAKELAND SD Hispanic 1Lackawanna 19 LAKELAND SD Asian 5Lackawanna 19 LAKELAND SD Native American 0Lackawanna 19 LAKELAND SD Multi-ethnic 0Lackawanna 19 LAKELAND SD IEP 53 5.7 39.6 37.7 17.0Lackawanna 19 LAKELAND SD ELL 0Lackawanna 19 LAKELAND SD Economically Disadvantaged 93 17.2 54.8 19.4 8.6Lackawanna 19 MID VALLEY SD All students 401 9.7 58.6 29.7 2.0Lackawanna 19 MID VALLEY SD Male 200 6.0 53.0 38.0 3.0Lackawanna 19 MID VALLEY SD Female 201 13.4 64.2 21.4 1.0Lackawanna 19 MID VALLEY SD White 365 9.9 60.3 28.2 1.6Lackawanna 19 MID VALLEY SD Black 7Lackawanna 19 MID VALLEY SD Hispanic 21 4.8 42.9 47.6 4.8Lackawanna 19 MID VALLEY SD Asian 4Lackawanna 19 MID VALLEY SD Native American 1Lackawanna 19 MID VALLEY SD Multi-ethnic 3Lackawanna 19 MID VALLEY SD IEP 60 1.7 26.7 60.0 11.7Lackawanna 19 MID VALLEY SD ELL 3Lackawanna 19 MID VALLEY SD Economically Disadvantaged 159 3.8 51.6 42.1 2.5Lackawanna 19 NORTH POCONO SD All students 737 11.3 65.0 21.8 1.9Lackawanna 19 NORTH POCONO SD Male 399 7.3 62.9 26.8 3.0Lackawanna 19 NORTH POCONO SD Female 338 16.0 67.5 16.0 0.6Lackawanna 19 NORTH POCONO SD White 715 11.3 64.9 21.8 2.0Lackawanna 19 NORTH POCONO SD Black 9Lackawanna 19 NORTH POCONO SD Hispanic 10 10.0 60.0 30.0 0.0
*Full Academic Year Students. Data for groups with less than 10 students assessed were replaced by blanks.Percentages were rounded to the nearest one-tenth.Proficiency percentages may not add up to 100 due to rounding. 109

The 2010 PSSA Writing District Level Proficiency Results - District Totals*
CountyIU
Number District Group
Number Scored Writing
% Advanced
Writing
% Proficient
Writing% Basic Writing
% Below Basic
WritingLackawanna 19 NORTH POCONO SD Asian 2Lackawanna 19 NORTH POCONO SD Native American 1Lackawanna 19 NORTH POCONO SD Multi-ethnic 0Lackawanna 19 NORTH POCONO SD IEP 95 0.0 38.9 48.4 12.6Lackawanna 19 NORTH POCONO SD ELL 0Lackawanna 19 NORTH POCONO SD Economically Disadvantaged 185 3.2 55.1 35.7 5.9Lackawanna 19 OLD FORGE SD All students 221 5.4 53.4 38.5 2.7Lackawanna 19 OLD FORGE SD Male 111 3.6 48.6 44.1 3.6Lackawanna 19 OLD FORGE SD Female 110 7.3 58.2 32.7 1.8Lackawanna 19 OLD FORGE SD White 208 5.3 53.4 38.9 2.4Lackawanna 19 OLD FORGE SD Black 8Lackawanna 19 OLD FORGE SD Hispanic 3Lackawanna 19 OLD FORGE SD Asian 2Lackawanna 19 OLD FORGE SD Native American 0Lackawanna 19 OLD FORGE SD Multi-ethnic 0Lackawanna 19 OLD FORGE SD IEP 33 0.0 30.3 54.5 15.2Lackawanna 19 OLD FORGE SD ELL 0Lackawanna 19 OLD FORGE SD Economically Disadvantaged 69 2.9 39.1 52.2 5.8Lackawanna 19 RIVERSIDE SD All students 343 4.7 67.3 25.1 2.9Lackawanna 19 RIVERSIDE SD Male 182 4.4 58.8 32.4 4.4Lackawanna 19 RIVERSIDE SD Female 160 5.0 77.5 16.3 1.3Lackawanna 19 RIVERSIDE SD White 304 5.3 68.8 23.0 3.0Lackawanna 19 RIVERSIDE SD Black 9Lackawanna 19 RIVERSIDE SD Hispanic 25 0.0 56.0 44.0 0.0Lackawanna 19 RIVERSIDE SD Asian 3Lackawanna 19 RIVERSIDE SD Native American 1Lackawanna 19 RIVERSIDE SD Multi-ethnic 0Lackawanna 19 RIVERSIDE SD IEP 65 1.5 33.8 50.8 13.8Lackawanna 19 RIVERSIDE SD ELL 2Lackawanna 19 RIVERSIDE SD Economically Disadvantaged 138 3.6 57.2 35.5 3.6
*Full Academic Year Students. Data for groups with less than 10 students assessed were replaced by blanks.Percentages were rounded to the nearest one-tenth.Proficiency percentages may not add up to 100 due to rounding. 110

The 2010 PSSA Writing District Level Proficiency Results - District Totals*
CountyIU
Number District Group
Number Scored Writing
% Advanced
Writing
% Proficient
Writing% Basic Writing
% Below Basic
WritingLackawanna 19 SCRANTON SD All students 2,003 9.2 63.6 25.3 2.0Lackawanna 19 SCRANTON SD Male 1,013 6.2 61.5 29.1 3.2Lackawanna 19 SCRANTON SD Female 979 12.4 66.0 20.9 0.7Lackawanna 19 SCRANTON SD White 1,392 10.5 65.7 22.1 1.8Lackawanna 19 SCRANTON SD Black 222 4.5 60.4 32.9 2.3Lackawanna 19 SCRANTON SD Hispanic 294 8.2 58.5 31.3 2.0Lackawanna 19 SCRANTON SD Asian 65 6.2 58.5 30.8 4.6Lackawanna 19 SCRANTON SD Native American 1Lackawanna 19 SCRANTON SD Multi-ethnic 18 0.0 55.6 44.4 0.0Lackawanna 19 SCRANTON SD IEP 331 0.6 40.5 51.4 7.6Lackawanna 19 SCRANTON SD ELL 12 0.0 66.7 25.0 8.3Lackawanna 19 SCRANTON SD Economically Disadvantaged 1,097 5.0 60.3 32.5 2.1Lackawanna 19 VALLEY VIEW SD All students 598 8.5 68.4 21.4 1.7Lackawanna 19 VALLEY VIEW SD Male 304 5.6 67.4 24.3 2.6Lackawanna 19 VALLEY VIEW SD Female 294 11.6 69.4 18.4 0.7Lackawanna 19 VALLEY VIEW SD White 577 8.5 69.0 21.0 1.6Lackawanna 19 VALLEY VIEW SD Black 9Lackawanna 19 VALLEY VIEW SD Hispanic 7Lackawanna 19 VALLEY VIEW SD Asian 4Lackawanna 19 VALLEY VIEW SD Native American 0Lackawanna 19 VALLEY VIEW SD Multi-ethnic 0Lackawanna 19 VALLEY VIEW SD IEP 87 1.1 39.1 49.4 10.3Lackawanna 19 VALLEY VIEW SD ELL 0Lackawanna 19 VALLEY VIEW SD Economically Disadvantaged 122 1.6 55.7 38.5 4.1Lancaster 13 COCALICO SD All students 745 12.3 70.6 16.6 0.4Lancaster 13 COCALICO SD Male 363 9.1 66.4 23.7 0.8Lancaster 13 COCALICO SD Female 378 15.6 74.3 10.1 0.0Lancaster 13 COCALICO SD White 667 12.7 70.3 16.9 0.0Lancaster 13 COCALICO SD Black 12 0.0 91.7 8.3 0.0Lancaster 13 COCALICO SD Hispanic 21 14.3 61.9 19.0 4.8
*Full Academic Year Students. Data for groups with less than 10 students assessed were replaced by blanks.Percentages were rounded to the nearest one-tenth.Proficiency percentages may not add up to 100 due to rounding. 111

The 2010 PSSA Writing District Level Proficiency Results - District Totals*
CountyIU
Number District Group
Number Scored Writing
% Advanced
Writing
% Proficient
Writing% Basic Writing
% Below Basic
WritingLancaster 13 COCALICO SD Asian 23 4.3 78.3 17.4 0.0Lancaster 13 COCALICO SD Native American 0Lancaster 13 COCALICO SD Multi-ethnic 18 16.7 61.1 11.1 11.1Lancaster 13 COCALICO SD IEP 116 6.0 50.0 41.4 2.6Lancaster 13 COCALICO SD ELL 8Lancaster 13 COCALICO SD Economically Disadvantaged 153 8.5 69.3 20.9 1.3Lancaster 13 COLUMBIA BOROUGH SD All students 274 2.2 57.3 36.1 4.4Lancaster 13 COLUMBIA BOROUGH SD Male 140 1.4 47.9 42.9 7.9Lancaster 13 COLUMBIA BOROUGH SD Female 126 3.2 70.6 26.2 0.0Lancaster 13 COLUMBIA BOROUGH SD White 196 2.6 63.3 29.6 4.6Lancaster 13 COLUMBIA BOROUGH SD Black 35 2.9 57.1 37.1 2.9Lancaster 13 COLUMBIA BOROUGH SD Hispanic 33 0.0 33.3 63.6 3.0Lancaster 13 COLUMBIA BOROUGH SD Asian 1Lancaster 13 COLUMBIA BOROUGH SD Native American 1Lancaster 13 COLUMBIA BOROUGH SD Multi-ethnic 0Lancaster 13 COLUMBIA BOROUGH SD IEP 52 0.0 25.0 57.7 17.3Lancaster 13 COLUMBIA BOROUGH SD ELL 9Lancaster 13 COLUMBIA BOROUGH SD Economically Disadvantaged 147 0.7 51.0 41.5 6.8Lancaster 13 CONESTOGA VALLEY SD All students 938 12.2 70.7 16.3 0.9Lancaster 13 CONESTOGA VALLEY SD Male 472 9.1 66.9 22.5 1.5Lancaster 13 CONESTOGA VALLEY SD Female 465 15.3 74.4 10.1 0.2Lancaster 13 CONESTOGA VALLEY SD White 709 14.0 70.8 14.5 0.7Lancaster 13 CONESTOGA VALLEY SD Black 75 1.3 81.3 17.3 0.0Lancaster 13 CONESTOGA VALLEY SD Hispanic 96 3.1 65.6 29.2 2.1Lancaster 13 CONESTOGA VALLEY SD Asian 57 19.3 63.2 15.8 1.8Lancaster 13 CONESTOGA VALLEY SD Native American 0Lancaster 13 CONESTOGA VALLEY SD Multi-ethnic 0Lancaster 13 CONESTOGA VALLEY SD IEP 105 1.0 46.7 50.5 1.9Lancaster 13 CONESTOGA VALLEY SD ELL 31 0.0 41.9 51.6 6.5Lancaster 13 CONESTOGA VALLEY SD Economically Disadvantaged 255 3.9 64.3 29.4 2.4
*Full Academic Year Students. Data for groups with less than 10 students assessed were replaced by blanks.Percentages were rounded to the nearest one-tenth.Proficiency percentages may not add up to 100 due to rounding. 112

The 2010 PSSA Writing District Level Proficiency Results - District Totals*
CountyIU
Number District Group
Number Scored Writing
% Advanced
Writing
% Proficient
Writing% Basic Writing
% Below Basic
WritingLancaster 13 DONEGAL SD All students 601 6.8 69.4 22.5 1.3Lancaster 13 DONEGAL SD Male 317 4.7 65.3 27.4 2.5Lancaster 13 DONEGAL SD Female 282 9.2 74.5 16.3 0.0Lancaster 13 DONEGAL SD White 519 7.3 70.5 21.0 1.2Lancaster 13 DONEGAL SD Black 23 4.3 65.2 30.4 0.0Lancaster 13 DONEGAL SD Hispanic 36 5.6 63.9 27.8 2.8Lancaster 13 DONEGAL SD Asian 9Lancaster 13 DONEGAL SD Native American 2Lancaster 13 DONEGAL SD Multi-ethnic 10 0.0 50.0 50.0 0.0Lancaster 13 DONEGAL SD IEP 89 0.0 41.6 50.6 7.9Lancaster 13 DONEGAL SD ELL 11 0.0 81.8 18.2 0.0Lancaster 13 DONEGAL SD Economically Disadvantaged 169 3.6 60.9 34.3 1.2Lancaster 13 EASTERN LANCASTER CO SD All students 692 7.1 69.8 22.1 1.0Lancaster 13 EASTERN LANCASTER CO SD Male 351 3.7 67.0 27.6 1.7Lancaster 13 EASTERN LANCASTER CO SD Female 341 10.6 72.7 16.4 0.3Lancaster 13 EASTERN LANCASTER CO SD White 629 7.0 71.5 20.3 1.1Lancaster 13 EASTERN LANCASTER CO SD Black 19 0.0 42.1 57.9 0.0Lancaster 13 EASTERN LANCASTER CO SD Hispanic 24 8.3 50.0 41.7 0.0Lancaster 13 EASTERN LANCASTER CO SD Asian 16 18.8 62.5 18.8 0.0Lancaster 13 EASTERN LANCASTER CO SD Native American 0Lancaster 13 EASTERN LANCASTER CO SD Multi-ethnic 4Lancaster 13 EASTERN LANCASTER CO SD IEP 63 0.0 38.1 55.6 6.3Lancaster 13 EASTERN LANCASTER CO SD ELL 9Lancaster 13 EASTERN LANCASTER CO SD Economically Disadvantaged 164 5.5 62.8 29.3 2.4Lancaster 13 ELIZABETHTOWN AREA SD All students 902 11.5 66.0 20.0 2.5Lancaster 13 ELIZABETHTOWN AREA SD Male 438 7.5 60.5 27.6 4.3Lancaster 13 ELIZABETHTOWN AREA SD Female 459 15.5 71.0 12.6 0.9Lancaster 13 ELIZABETHTOWN AREA SD White 847 11.8 65.6 20.0 2.6Lancaster 13 ELIZABETHTOWN AREA SD Black 18 11.1 50.0 33.3 5.6Lancaster 13 ELIZABETHTOWN AREA SD Hispanic 25 0.0 84.0 16.0 0.0
*Full Academic Year Students. Data for groups with less than 10 students assessed were replaced by blanks.Percentages were rounded to the nearest one-tenth.Proficiency percentages may not add up to 100 due to rounding. 113

The 2010 PSSA Writing District Level Proficiency Results - District Totals*
CountyIU
Number District Group
Number Scored Writing
% Advanced
Writing
% Proficient
Writing% Basic Writing
% Below Basic
WritingLancaster 13 ELIZABETHTOWN AREA SD Asian 7Lancaster 13 ELIZABETHTOWN AREA SD Native American 0Lancaster 13 ELIZABETHTOWN AREA SD Multi-ethnic 0Lancaster 13 ELIZABETHTOWN AREA SD IEP 139 2.2 35.3 47.5 15.1Lancaster 13 ELIZABETHTOWN AREA SD ELL 0Lancaster 13 ELIZABETHTOWN AREA SD Economically Disadvantaged 155 5.8 52.3 36.8 5.2Lancaster 13 EPHRATA AREA SD All students 901 12.0 65.7 20.0 2.3Lancaster 13 EPHRATA AREA SD Male 471 8.1 59.9 28.0 4.0Lancaster 13 EPHRATA AREA SD Female 430 16.3 72.1 11.2 0.5Lancaster 13 EPHRATA AREA SD White 809 12.1 66.1 19.3 2.5Lancaster 13 EPHRATA AREA SD Black 22 18.2 59.1 22.7 0.0Lancaster 13 EPHRATA AREA SD Hispanic 55 5.5 63.6 29.1 1.8Lancaster 13 EPHRATA AREA SD Asian 13 23.1 61.5 15.4 0.0Lancaster 13 EPHRATA AREA SD Native American 2Lancaster 13 EPHRATA AREA SD Multi-ethnic 0Lancaster 13 EPHRATA AREA SD IEP 110 0.0 38.2 47.3 14.5Lancaster 13 EPHRATA AREA SD ELL 13 0.0 69.2 30.8 0.0Lancaster 13 EPHRATA AREA SD Economically Disadvantaged 226 6.2 61.5 29.6 2.7Lancaster 13 HEMPFIELD SD All students 1,594 14.1 65.9 18.8 1.2Lancaster 13 HEMPFIELD SD Male 818 10.0 63.4 24.3 2.2Lancaster 13 HEMPFIELD SD Female 775 18.2 68.6 13.0 0.1Lancaster 13 HEMPFIELD SD White 1,260 15.0 67.6 16.5 0.9Lancaster 13 HEMPFIELD SD Black 61 9.8 63.9 26.2 0.0Lancaster 13 HEMPFIELD SD Hispanic 171 5.3 56.7 33.9 4.1Lancaster 13 HEMPFIELD SD Asian 60 25.0 61.7 11.7 1.7Lancaster 13 HEMPFIELD SD Native American 5Lancaster 13 HEMPFIELD SD Multi-ethnic 36 11.1 63.9 25.0 0.0Lancaster 13 HEMPFIELD SD IEP 244 0.8 41.4 52.0 5.7Lancaster 13 HEMPFIELD SD ELL 38 5.3 39.5 39.5 15.8Lancaster 13 HEMPFIELD SD Economically Disadvantaged 360 6.9 57.2 33.1 2.8
*Full Academic Year Students. Data for groups with less than 10 students assessed were replaced by blanks.Percentages were rounded to the nearest one-tenth.Proficiency percentages may not add up to 100 due to rounding. 114

The 2010 PSSA Writing District Level Proficiency Results - District Totals*
CountyIU
Number District Group
Number Scored Writing
% Advanced
Writing
% Proficient
Writing% Basic Writing
% Below Basic
WritingLancaster 13 LAMPETER-STRASBURG SD All students 744 11.6 72.7 14.5 1.2Lancaster 13 LAMPETER-STRASBURG SD Male 386 8.8 68.9 20.7 1.6Lancaster 13 LAMPETER-STRASBURG SD Female 358 14.5 76.8 7.8 0.8Lancaster 13 LAMPETER-STRASBURG SD White 687 11.8 73.5 13.8 0.9Lancaster 13 LAMPETER-STRASBURG SD Black 5Lancaster 13 LAMPETER-STRASBURG SD Hispanic 25 4.0 56.0 32.0 8.0Lancaster 13 LAMPETER-STRASBURG SD Asian 21 14.3 76.2 9.5 0.0Lancaster 13 LAMPETER-STRASBURG SD Native American 3Lancaster 13 LAMPETER-STRASBURG SD Multi-ethnic 2Lancaster 13 LAMPETER-STRASBURG SD IEP 102 2.0 51.0 38.2 8.8Lancaster 13 LAMPETER-STRASBURG SD ELL 4Lancaster 13 LAMPETER-STRASBURG SD Economically Disadvantaged 103 6.8 60.2 29.1 3.9Lancaster 13 LANCASTER SD All students 2,031 2.0 39.6 50.5 7.9Lancaster 13 LANCASTER SD Male 1,021 1.3 32.1 55.4 11.2Lancaster 13 LANCASTER SD Female 1,006 2.8 47.3 45.3 4.6Lancaster 13 LANCASTER SD White 377 5.3 49.9 39.5 5.3Lancaster 13 LANCASTER SD Black 481 1.0 40.1 50.5 8.3Lancaster 13 LANCASTER SD Hispanic 1,111 0.9 35.9 54.5 8.7Lancaster 13 LANCASTER SD Asian 53 11.3 43.4 43.4 1.9Lancaster 13 LANCASTER SD Native American 1Lancaster 13 LANCASTER SD Multi-ethnic 4Lancaster 13 LANCASTER SD IEP 365 0.3 13.7 57.8 28.2Lancaster 13 LANCASTER SD ELL 316 0.6 20.3 64.2 14.9Lancaster 13 LANCASTER SD Economically Disadvantaged 1,528 1.1 35.9 53.9 9.1Lancaster 13 MANHEIM CENTRAL SD All students 693 10.2 72.9 16.2 0.7Lancaster 13 MANHEIM CENTRAL SD Male 349 6.9 69.9 21.8 1.4Lancaster 13 MANHEIM CENTRAL SD Female 344 13.7 75.9 10.5 0.0Lancaster 13 MANHEIM CENTRAL SD White 654 10.7 73.5 15.0 0.8Lancaster 13 MANHEIM CENTRAL SD Black 9Lancaster 13 MANHEIM CENTRAL SD Hispanic 20 5.0 65.0 30.0 0.0
*Full Academic Year Students. Data for groups with less than 10 students assessed were replaced by blanks.Percentages were rounded to the nearest one-tenth.Proficiency percentages may not add up to 100 due to rounding. 115

The 2010 PSSA Writing District Level Proficiency Results - District Totals*
CountyIU
Number District Group
Number Scored Writing
% Advanced
Writing
% Proficient
Writing% Basic Writing
% Below Basic
WritingLancaster 13 MANHEIM CENTRAL SD Asian 6Lancaster 13 MANHEIM CENTRAL SD Native American 0Lancaster 13 MANHEIM CENTRAL SD Multi-ethnic 4Lancaster 13 MANHEIM CENTRAL SD IEP 88 2.3 38.6 53.4 5.7Lancaster 13 MANHEIM CENTRAL SD ELL 7Lancaster 13 MANHEIM CENTRAL SD Economically Disadvantaged 159 3.8 67.9 25.2 3.1Lancaster 13 MANHEIM TOWNSHIP SD All students 1,306 15.3 69.1 14.9 0.7Lancaster 13 MANHEIM TOWNSHIP SD Male 672 12.5 65.6 21.1 0.7Lancaster 13 MANHEIM TOWNSHIP SD Female 634 18.3 72.9 8.2 0.6Lancaster 13 MANHEIM TOWNSHIP SD White 984 17.3 71.3 11.0 0.4Lancaster 13 MANHEIM TOWNSHIP SD Black 56 3.6 50.0 42.9 3.6Lancaster 13 MANHEIM TOWNSHIP SD Hispanic 121 5.0 58.7 34.7 1.7Lancaster 13 MANHEIM TOWNSHIP SD Asian 96 19.8 68.8 10.4 1.0Lancaster 13 MANHEIM TOWNSHIP SD Native American 0Lancaster 13 MANHEIM TOWNSHIP SD Multi-ethnic 49 6.1 73.5 20.4 0.0Lancaster 13 MANHEIM TOWNSHIP SD IEP 132 3.0 39.4 54.5 3.0Lancaster 13 MANHEIM TOWNSHIP SD ELL 35 0.0 42.9 45.7 11.4Lancaster 13 MANHEIM TOWNSHIP SD Economically Disadvantaged 227 7.5 55.1 34.8 2.6Lancaster 13 PENN MANOR SD All students 1,279 8.3 72.7 17.7 1.3Lancaster 13 PENN MANOR SD Male 638 3.0 70.4 24.3 2.4Lancaster 13 PENN MANOR SD Female 641 13.6 75.0 11.1 0.3Lancaster 13 PENN MANOR SD White 1,120 8.6 73.8 16.3 1.3Lancaster 13 PENN MANOR SD Black 38 7.9 52.6 31.6 7.9Lancaster 13 PENN MANOR SD Hispanic 80 1.3 68.8 30.0 0.0Lancaster 13 PENN MANOR SD Asian 26 23.1 65.4 11.5 0.0Lancaster 13 PENN MANOR SD Native American 1Lancaster 13 PENN MANOR SD Multi-ethnic 14 0.0 71.4 28.6 0.0Lancaster 13 PENN MANOR SD IEP 213 0.5 44.1 47.4 8.0Lancaster 13 PENN MANOR SD ELL 11 0.0 36.4 63.6 0.0Lancaster 13 PENN MANOR SD Economically Disadvantaged 314 2.5 64.0 30.9 2.5
*Full Academic Year Students. Data for groups with less than 10 students assessed were replaced by blanks.Percentages were rounded to the nearest one-tenth.Proficiency percentages may not add up to 100 due to rounding. 116
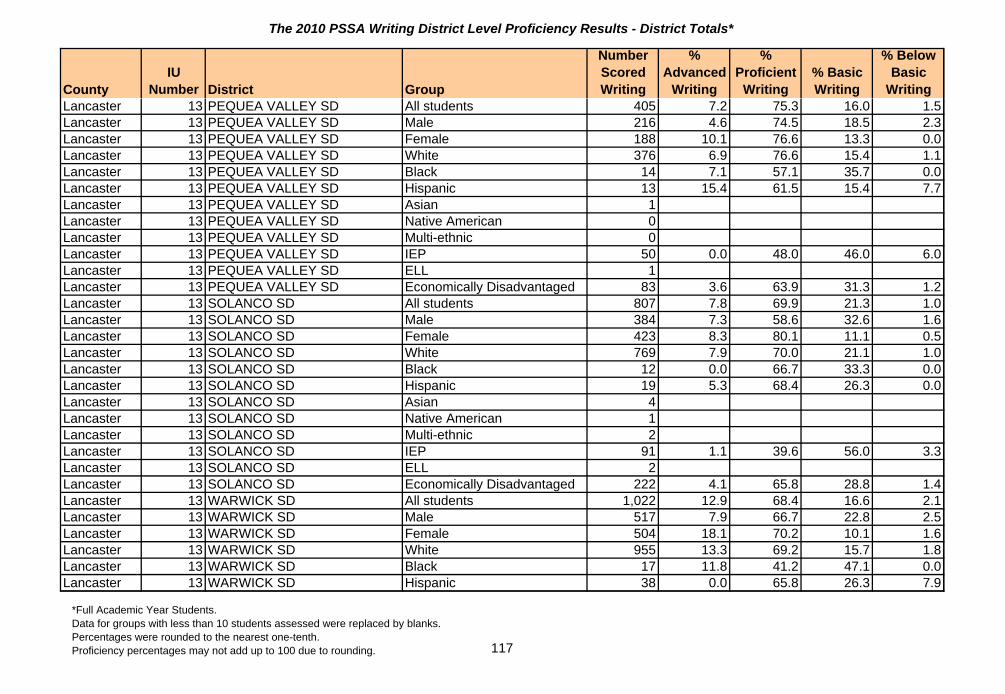
The 2010 PSSA Writing District Level Proficiency Results - District Totals*
CountyIU
Number District Group
Number Scored Writing
% Advanced
Writing
% Proficient
Writing% Basic Writing
% Below Basic
WritingLancaster 13 PEQUEA VALLEY SD All students 405 7.2 75.3 16.0 1.5Lancaster 13 PEQUEA VALLEY SD Male 216 4.6 74.5 18.5 2.3Lancaster 13 PEQUEA VALLEY SD Female 188 10.1 76.6 13.3 0.0Lancaster 13 PEQUEA VALLEY SD White 376 6.9 76.6 15.4 1.1Lancaster 13 PEQUEA VALLEY SD Black 14 7.1 57.1 35.7 0.0Lancaster 13 PEQUEA VALLEY SD Hispanic 13 15.4 61.5 15.4 7.7Lancaster 13 PEQUEA VALLEY SD Asian 1Lancaster 13 PEQUEA VALLEY SD Native American 0Lancaster 13 PEQUEA VALLEY SD Multi-ethnic 0Lancaster 13 PEQUEA VALLEY SD IEP 50 0.0 48.0 46.0 6.0Lancaster 13 PEQUEA VALLEY SD ELL 1Lancaster 13 PEQUEA VALLEY SD Economically Disadvantaged 83 3.6 63.9 31.3 1.2Lancaster 13 SOLANCO SD All students 807 7.8 69.9 21.3 1.0Lancaster 13 SOLANCO SD Male 384 7.3 58.6 32.6 1.6Lancaster 13 SOLANCO SD Female 423 8.3 80.1 11.1 0.5Lancaster 13 SOLANCO SD White 769 7.9 70.0 21.1 1.0Lancaster 13 SOLANCO SD Black 12 0.0 66.7 33.3 0.0Lancaster 13 SOLANCO SD Hispanic 19 5.3 68.4 26.3 0.0Lancaster 13 SOLANCO SD Asian 4Lancaster 13 SOLANCO SD Native American 1Lancaster 13 SOLANCO SD Multi-ethnic 2Lancaster 13 SOLANCO SD IEP 91 1.1 39.6 56.0 3.3Lancaster 13 SOLANCO SD ELL 2Lancaster 13 SOLANCO SD Economically Disadvantaged 222 4.1 65.8 28.8 1.4Lancaster 13 WARWICK SD All students 1,022 12.9 68.4 16.6 2.1Lancaster 13 WARWICK SD Male 517 7.9 66.7 22.8 2.5Lancaster 13 WARWICK SD Female 504 18.1 70.2 10.1 1.6Lancaster 13 WARWICK SD White 955 13.3 69.2 15.7 1.8Lancaster 13 WARWICK SD Black 17 11.8 41.2 47.1 0.0Lancaster 13 WARWICK SD Hispanic 38 0.0 65.8 26.3 7.9
*Full Academic Year Students. Data for groups with less than 10 students assessed were replaced by blanks.Percentages were rounded to the nearest one-tenth.Proficiency percentages may not add up to 100 due to rounding. 117

The 2010 PSSA Writing District Level Proficiency Results - District Totals*
CountyIU
Number District Group
Number Scored Writing
% Advanced
Writing
% Proficient
Writing% Basic Writing
% Below Basic
WritingLancaster 13 WARWICK SD Asian 11 27.3 54.5 9.1 9.1Lancaster 13 WARWICK SD Native American 0Lancaster 13 WARWICK SD Multi-ethnic 0Lancaster 13 WARWICK SD IEP 129 1.6 39.5 46.5 12.4Lancaster 13 WARWICK SD ELL 7Lancaster 13 WARWICK SD Economically Disadvantaged 179 10.1 63.7 22.3 3.9Lawrence 4 ELLWOOD CITY AREA SD All students 464 3.0 75.2 19.8 1.9Lawrence 4 ELLWOOD CITY AREA SD Male 246 2.8 68.3 26.0 2.8Lawrence 4 ELLWOOD CITY AREA SD Female 218 3.2 83.0 12.8 0.9Lawrence 4 ELLWOOD CITY AREA SD White 443 3.2 75.2 19.6 2.0Lawrence 4 ELLWOOD CITY AREA SD Black 9Lawrence 4 ELLWOOD CITY AREA SD Hispanic 3Lawrence 4 ELLWOOD CITY AREA SD Asian 2Lawrence 4 ELLWOOD CITY AREA SD Native American 0Lawrence 4 ELLWOOD CITY AREA SD Multi-ethnic 7Lawrence 4 ELLWOOD CITY AREA SD IEP 66 0.0 40.9 50.0 9.1Lawrence 4 ELLWOOD CITY AREA SD ELL 0Lawrence 4 ELLWOOD CITY AREA SD Economically Disadvantaged 172 1.2 69.8 25.6 3.5Lawrence 4 LAUREL SD All students 352 8.2 73.9 16.8 1.1Lawrence 4 LAUREL SD Male 182 7.7 66.5 24.2 1.6Lawrence 4 LAUREL SD Female 170 8.8 81.8 8.8 0.6Lawrence 4 LAUREL SD White 344 8.4 73.5 16.9 1.2Lawrence 4 LAUREL SD Black 4Lawrence 4 LAUREL SD Hispanic 1Lawrence 4 LAUREL SD Asian 3Lawrence 4 LAUREL SD Native American 0Lawrence 4 LAUREL SD Multi-ethnic 0Lawrence 4 LAUREL SD IEP 31 0.0 41.9 45.2 12.9Lawrence 4 LAUREL SD ELL 1Lawrence 4 LAUREL SD Economically Disadvantaged 110 4.5 69.1 24.5 1.8
*Full Academic Year Students. Data for groups with less than 10 students assessed were replaced by blanks.Percentages were rounded to the nearest one-tenth.Proficiency percentages may not add up to 100 due to rounding. 118

The 2010 PSSA Writing District Level Proficiency Results - District Totals*
CountyIU
Number District Group
Number Scored Writing
% Advanced
Writing
% Proficient
Writing% Basic Writing
% Below Basic
WritingLawrence 4 MOHAWK AREA SD All students 374 8.3 69.3 20.3 2.1Lawrence 4 MOHAWK AREA SD Male 215 2.8 67.4 26.0 3.7Lawrence 4 MOHAWK AREA SD Female 159 15.7 71.7 12.6 0.0Lawrence 4 MOHAWK AREA SD White 365 8.5 68.8 20.5 2.2Lawrence 4 MOHAWK AREA SD Black 2Lawrence 4 MOHAWK AREA SD Hispanic 2Lawrence 4 MOHAWK AREA SD Asian 4Lawrence 4 MOHAWK AREA SD Native American 0Lawrence 4 MOHAWK AREA SD Multi-ethnic 1Lawrence 4 MOHAWK AREA SD IEP 32 0.0 53.1 37.5 9.4Lawrence 4 MOHAWK AREA SD ELL 0Lawrence 4 MOHAWK AREA SD Economically Disadvantaged 138 5.1 62.3 28.3 4.3Lawrence 4 NESHANNOCK TOWNSHIP SD All students 308 14.3 74.0 10.1 1.6Lawrence 4 NESHANNOCK TOWNSHIP SD Male 140 10.7 72.1 13.6 3.6Lawrence 4 NESHANNOCK TOWNSHIP SD Female 167 17.4 76.0 6.6 0.0Lawrence 4 NESHANNOCK TOWNSHIP SD White 292 15.1 74.0 9.2 1.7Lawrence 4 NESHANNOCK TOWNSHIP SD Black 11 0.0 81.8 18.2 0.0Lawrence 4 NESHANNOCK TOWNSHIP SD Hispanic 3Lawrence 4 NESHANNOCK TOWNSHIP SD Asian 1Lawrence 4 NESHANNOCK TOWNSHIP SD Native American 0Lawrence 4 NESHANNOCK TOWNSHIP SD Multi-ethnic 0Lawrence 4 NESHANNOCK TOWNSHIP SD IEP 25 4.0 60.0 28.0 8.0Lawrence 4 NESHANNOCK TOWNSHIP SD ELL 0Lawrence 4 NESHANNOCK TOWNSHIP SD Economically Disadvantaged 54 14.8 63.0 20.4 1.9Lawrence 4 NEW CASTLE AREA SD All students 677 3.5 60.1 32.2 4.1Lawrence 4 NEW CASTLE AREA SD Male 357 2.8 54.3 37.3 5.6Lawrence 4 NEW CASTLE AREA SD Female 320 4.4 66.6 26.6 2.5Lawrence 4 NEW CASTLE AREA SD White 480 4.2 64.4 27.5 4.0Lawrence 4 NEW CASTLE AREA SD Black 157 1.9 54.1 40.8 3.2Lawrence 4 NEW CASTLE AREA SD Hispanic 10 10.0 70.0 20.0 0.0
*Full Academic Year Students. Data for groups with less than 10 students assessed were replaced by blanks.Percentages were rounded to the nearest one-tenth.Proficiency percentages may not add up to 100 due to rounding. 119

The 2010 PSSA Writing District Level Proficiency Results - District Totals*
CountyIU
Number District Group
Number Scored Writing
% Advanced
Writing
% Proficient
Writing% Basic Writing
% Below Basic
WritingLawrence 4 NEW CASTLE AREA SD Asian 2Lawrence 4 NEW CASTLE AREA SD Native American 0Lawrence 4 NEW CASTLE AREA SD Multi-ethnic 28 0.0 17.9 67.9 14.3Lawrence 4 NEW CASTLE AREA SD IEP 125 1.6 28.8 53.6 16.0Lawrence 4 NEW CASTLE AREA SD ELL 1Lawrence 4 NEW CASTLE AREA SD Economically Disadvantaged 384 1.8 51.0 41.9 5.2Lawrence 4 SHENANGO AREA SD All students 322 15.5 66.1 14.3 4.0Lawrence 4 SHENANGO AREA SD Male 166 10.8 68.7 15.7 4.8Lawrence 4 SHENANGO AREA SD Female 154 20.8 63.6 12.3 3.2Lawrence 4 SHENANGO AREA SD White 311 15.8 66.6 13.8 3.9Lawrence 4 SHENANGO AREA SD Black 4Lawrence 4 SHENANGO AREA SD Hispanic 2Lawrence 4 SHENANGO AREA SD Asian 1Lawrence 4 SHENANGO AREA SD Native American 0Lawrence 4 SHENANGO AREA SD Multi-ethnic 2Lawrence 4 SHENANGO AREA SD IEP 36 0.0 30.6 44.4 25.0Lawrence 4 SHENANGO AREA SD ELL 2Lawrence 4 SHENANGO AREA SD Economically Disadvantaged 82 9.8 61.0 20.7 8.5Lawrence 4 UNION AREA SD All students 194 6.2 68.0 23.2 2.6Lawrence 4 UNION AREA SD Male 98 4.1 62.2 29.6 4.1Lawrence 4 UNION AREA SD Female 96 8.3 74.0 16.7 1.0Lawrence 4 UNION AREA SD White 162 6.8 68.5 21.6 3.1Lawrence 4 UNION AREA SD Black 26 3.8 69.2 26.9 0.0Lawrence 4 UNION AREA SD Hispanic 2Lawrence 4 UNION AREA SD Asian 0Lawrence 4 UNION AREA SD Native American 0Lawrence 4 UNION AREA SD Multi-ethnic 4Lawrence 4 UNION AREA SD IEP 31 0.0 38.7 45.2 16.1Lawrence 4 UNION AREA SD ELL 0Lawrence 4 UNION AREA SD Economically Disadvantaged 63 6.3 55.6 33.3 4.8
*Full Academic Year Students. Data for groups with less than 10 students assessed were replaced by blanks.Percentages were rounded to the nearest one-tenth.Proficiency percentages may not add up to 100 due to rounding. 120

The 2010 PSSA Writing District Level Proficiency Results - District Totals*
CountyIU
Number District Group
Number Scored Writing
% Advanced
Writing
% Proficient
Writing% Basic Writing
% Below Basic
WritingLawrence 4 WILMINGTON AREA SD All students 349 4.6 76.5 17.5 1.4Lawrence 4 WILMINGTON AREA SD Male 166 2.4 70.5 25.3 1.8Lawrence 4 WILMINGTON AREA SD Female 182 6.6 81.9 10.4 1.1Lawrence 4 WILMINGTON AREA SD White 335 4.8 76.4 17.3 1.5Lawrence 4 WILMINGTON AREA SD Black 7Lawrence 4 WILMINGTON AREA SD Hispanic 3Lawrence 4 WILMINGTON AREA SD Asian 1Lawrence 4 WILMINGTON AREA SD Native American 1Lawrence 4 WILMINGTON AREA SD Multi-ethnic 1Lawrence 4 WILMINGTON AREA SD IEP 56 1.8 51.8 42.9 3.6Lawrence 4 WILMINGTON AREA SD ELL 0Lawrence 4 WILMINGTON AREA SD Economically Disadvantaged 91 1.1 72.5 23.1 3.3Lebanon 13 ANNVILLE-CLEONA SD All students 369 8.1 61.5 28.7 1.6Lebanon 13 ANNVILLE-CLEONA SD Male 212 5.7 57.1 35.4 1.9Lebanon 13 ANNVILLE-CLEONA SD Female 157 11.5 67.5 19.7 1.3Lebanon 13 ANNVILLE-CLEONA SD White 347 8.6 61.4 28.2 1.7Lebanon 13 ANNVILLE-CLEONA SD Black 10 0.0 40.0 60.0 0.0Lebanon 13 ANNVILLE-CLEONA SD Hispanic 7Lebanon 13 ANNVILLE-CLEONA SD Asian 5Lebanon 13 ANNVILLE-CLEONA SD Native American 0Lebanon 13 ANNVILLE-CLEONA SD Multi-ethnic 0Lebanon 13 ANNVILLE-CLEONA SD IEP 56 0.0 30.4 58.9 10.7Lebanon 13 ANNVILLE-CLEONA SD ELL 0Lebanon 13 ANNVILLE-CLEONA SD Economically Disadvantaged 70 0.0 50.0 44.3 5.7Lebanon 13 CORNWALL-LEBANON SD All students 1,077 14.9 68.0 15.8 1.4Lebanon 13 CORNWALL-LEBANON SD Male 540 10.7 68.5 19.1 1.7Lebanon 13 CORNWALL-LEBANON SD Female 537 19.0 67.4 12.5 1.1Lebanon 13 CORNWALL-LEBANON SD White 887 16.3 68.9 14.0 0.8Lebanon 13 CORNWALL-LEBANON SD Black 21 0.0 61.9 23.8 14.3Lebanon 13 CORNWALL-LEBANON SD Hispanic 101 8.9 59.4 27.7 4.0
*Full Academic Year Students. Data for groups with less than 10 students assessed were replaced by blanks.Percentages were rounded to the nearest one-tenth.Proficiency percentages may not add up to 100 due to rounding. 121
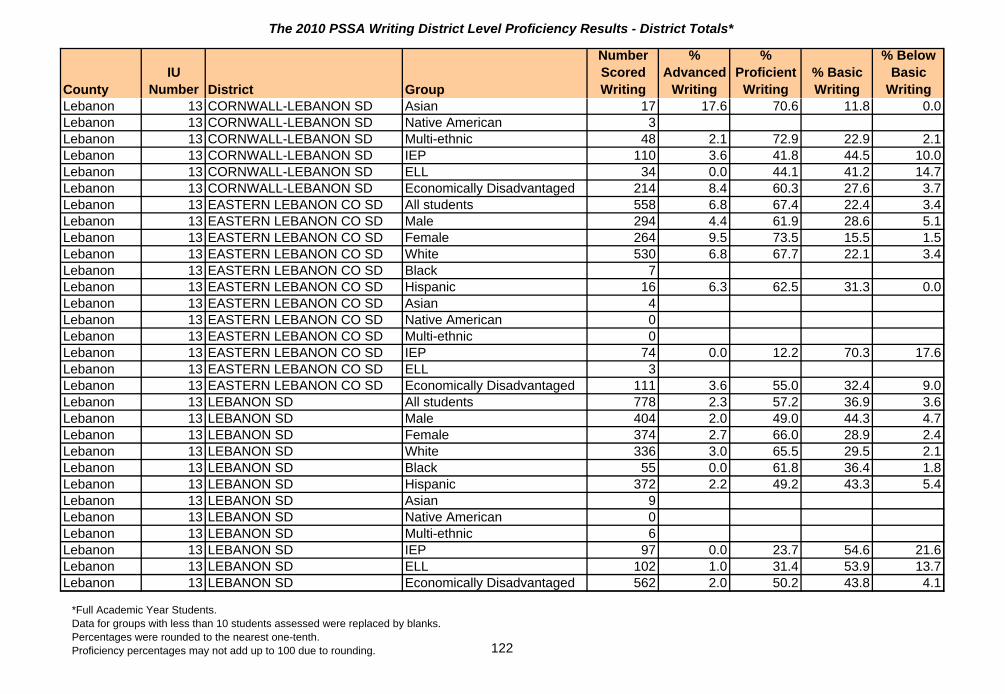
The 2010 PSSA Writing District Level Proficiency Results - District Totals*
CountyIU
Number District Group
Number Scored Writing
% Advanced
Writing
% Proficient
Writing% Basic Writing
% Below Basic
WritingLebanon 13 CORNWALL-LEBANON SD Asian 17 17.6 70.6 11.8 0.0Lebanon 13 CORNWALL-LEBANON SD Native American 3Lebanon 13 CORNWALL-LEBANON SD Multi-ethnic 48 2.1 72.9 22.9 2.1Lebanon 13 CORNWALL-LEBANON SD IEP 110 3.6 41.8 44.5 10.0Lebanon 13 CORNWALL-LEBANON SD ELL 34 0.0 44.1 41.2 14.7Lebanon 13 CORNWALL-LEBANON SD Economically Disadvantaged 214 8.4 60.3 27.6 3.7Lebanon 13 EASTERN LEBANON CO SD All students 558 6.8 67.4 22.4 3.4Lebanon 13 EASTERN LEBANON CO SD Male 294 4.4 61.9 28.6 5.1Lebanon 13 EASTERN LEBANON CO SD Female 264 9.5 73.5 15.5 1.5Lebanon 13 EASTERN LEBANON CO SD White 530 6.8 67.7 22.1 3.4Lebanon 13 EASTERN LEBANON CO SD Black 7Lebanon 13 EASTERN LEBANON CO SD Hispanic 16 6.3 62.5 31.3 0.0Lebanon 13 EASTERN LEBANON CO SD Asian 4Lebanon 13 EASTERN LEBANON CO SD Native American 0Lebanon 13 EASTERN LEBANON CO SD Multi-ethnic 0Lebanon 13 EASTERN LEBANON CO SD IEP 74 0.0 12.2 70.3 17.6Lebanon 13 EASTERN LEBANON CO SD ELL 3Lebanon 13 EASTERN LEBANON CO SD Economically Disadvantaged 111 3.6 55.0 32.4 9.0Lebanon 13 LEBANON SD All students 778 2.3 57.2 36.9 3.6Lebanon 13 LEBANON SD Male 404 2.0 49.0 44.3 4.7Lebanon 13 LEBANON SD Female 374 2.7 66.0 28.9 2.4Lebanon 13 LEBANON SD White 336 3.0 65.5 29.5 2.1Lebanon 13 LEBANON SD Black 55 0.0 61.8 36.4 1.8Lebanon 13 LEBANON SD Hispanic 372 2.2 49.2 43.3 5.4Lebanon 13 LEBANON SD Asian 9Lebanon 13 LEBANON SD Native American 0Lebanon 13 LEBANON SD Multi-ethnic 6Lebanon 13 LEBANON SD IEP 97 0.0 23.7 54.6 21.6Lebanon 13 LEBANON SD ELL 102 1.0 31.4 53.9 13.7Lebanon 13 LEBANON SD Economically Disadvantaged 562 2.0 50.2 43.8 4.1
*Full Academic Year Students. Data for groups with less than 10 students assessed were replaced by blanks.Percentages were rounded to the nearest one-tenth.Proficiency percentages may not add up to 100 due to rounding. 122

The 2010 PSSA Writing District Level Proficiency Results - District Totals*
CountyIU
Number District Group
Number Scored Writing
% Advanced
Writing
% Proficient
Writing% Basic Writing
% Below Basic
WritingLebanon 13 NORTHERN LEBANON SD All students 529 9.1 65.6 23.4 1.9Lebanon 13 NORTHERN LEBANON SD Male 273 5.5 61.5 30.0 2.9Lebanon 13 NORTHERN LEBANON SD Female 256 12.9 69.9 16.4 0.8Lebanon 13 NORTHERN LEBANON SD White 494 9.3 64.2 24.5 2.0Lebanon 13 NORTHERN LEBANON SD Black 4Lebanon 13 NORTHERN LEBANON SD Hispanic 20 5.0 80.0 15.0 0.0Lebanon 13 NORTHERN LEBANON SD Asian 7Lebanon 13 NORTHERN LEBANON SD Native American 0Lebanon 13 NORTHERN LEBANON SD Multi-ethnic 4Lebanon 13 NORTHERN LEBANON SD IEP 74 2.7 39.2 48.6 9.5Lebanon 13 NORTHERN LEBANON SD ELL 8Lebanon 13 NORTHERN LEBANON SD Economically Disadvantaged 95 6.3 53.7 35.8 4.2Lebanon 13 PALMYRA AREA SD All students 670 7.8 69.4 20.9 1.9Lebanon 13 PALMYRA AREA SD Male 342 5.8 61.7 29.2 3.2Lebanon 13 PALMYRA AREA SD Female 328 9.8 77.4 12.2 0.6Lebanon 13 PALMYRA AREA SD White 626 7.3 70.0 20.6 2.1Lebanon 13 PALMYRA AREA SD Black 7Lebanon 13 PALMYRA AREA SD Hispanic 8Lebanon 13 PALMYRA AREA SD Asian 18 22.2 50.0 27.8 0.0Lebanon 13 PALMYRA AREA SD Native American 0Lebanon 13 PALMYRA AREA SD Multi-ethnic 11 9.1 72.7 18.2 0.0Lebanon 13 PALMYRA AREA SD IEP 86 1.2 38.4 50.0 10.5Lebanon 13 PALMYRA AREA SD ELL 3Lebanon 13 PALMYRA AREA SD Economically Disadvantaged 80 0.0 65.0 32.5 2.5Lehigh 21 ALLENTOWN CITY SD All students 3,464 2.3 49.4 43.8 4.5Lehigh 21 ALLENTOWN CITY SD Male 1,736 1.7 43.6 48.5 6.2Lehigh 21 ALLENTOWN CITY SD Female 1,718 2.9 55.5 38.9 2.7Lehigh 21 ALLENTOWN CITY SD White 622 4.5 60.5 33.1 1.9Lehigh 21 ALLENTOWN CITY SD Black 611 1.8 49.8 44.5 3.9Lehigh 21 ALLENTOWN CITY SD Hispanic 2,157 1.6 46.2 46.8 5.4
*Full Academic Year Students. Data for groups with less than 10 students assessed were replaced by blanks.Percentages were rounded to the nearest one-tenth.Proficiency percentages may not add up to 100 due to rounding. 123

The 2010 PSSA Writing District Level Proficiency Results - District Totals*
CountyIU
Number District Group
Number Scored Writing
% Advanced
Writing
% Proficient
Writing% Basic Writing
% Below Basic
WritingLehigh 21 ALLENTOWN CITY SD Asian 58 8.6 56.9 34.5 0.0Lehigh 21 ALLENTOWN CITY SD Native American 4Lehigh 21 ALLENTOWN CITY SD Multi-ethnic 2Lehigh 21 ALLENTOWN CITY SD IEP 495 0.2 16.6 66.9 16.4Lehigh 21 ALLENTOWN CITY SD ELL 398 0.0 16.1 66.8 17.1Lehigh 21 ALLENTOWN CITY SD Economically Disadvantaged 2,781 1.7 46.6 46.8 5.0Lehigh 21 CATASAUQUA AREA SD All students 377 8.8 70.8 19.6 0.8Lehigh 21 CATASAUQUA AREA SD Male 184 7.1 67.4 24.5 1.1Lehigh 21 CATASAUQUA AREA SD Female 193 10.4 74.1 15.0 0.5Lehigh 21 CATASAUQUA AREA SD White 279 7.9 72.8 18.6 0.7Lehigh 21 CATASAUQUA AREA SD Black 24 16.7 66.7 16.7 0.0Lehigh 21 CATASAUQUA AREA SD Hispanic 49 8.2 65.3 24.5 2.0Lehigh 21 CATASAUQUA AREA SD Asian 8Lehigh 21 CATASAUQUA AREA SD Native American 1Lehigh 21 CATASAUQUA AREA SD Multi-ethnic 16 0.0 75.0 25.0 0.0Lehigh 21 CATASAUQUA AREA SD IEP 53 0.0 37.7 56.6 5.7Lehigh 21 CATASAUQUA AREA SD ELL 8Lehigh 21 CATASAUQUA AREA SD Economically Disadvantaged 151 6.0 70.2 21.9 2.0Lehigh 21 EAST PENN SD All students 1,892 12.3 70.6 16.6 0.6Lehigh 21 EAST PENN SD Male 975 9.1 68.2 21.6 1.0Lehigh 21 EAST PENN SD Female 917 15.6 73.1 11.2 0.1Lehigh 21 EAST PENN SD White 1,586 12.5 70.9 16.1 0.4Lehigh 21 EAST PENN SD Black 76 6.6 75.0 17.1 1.3Lehigh 21 EAST PENN SD Hispanic 119 4.2 66.4 28.6 0.8Lehigh 21 EAST PENN SD Asian 107 22.4 68.2 9.3 0.0Lehigh 21 EAST PENN SD Native American 4Lehigh 21 EAST PENN SD Multi-ethnic 0Lehigh 21 EAST PENN SD IEP 231 2.2 45.9 48.5 3.5Lehigh 21 EAST PENN SD ELL 13 0.0 30.8 61.5 7.7Lehigh 21 EAST PENN SD Economically Disadvantaged 306 5.9 62.4 30.7 1.0
*Full Academic Year Students. Data for groups with less than 10 students assessed were replaced by blanks.Percentages were rounded to the nearest one-tenth.Proficiency percentages may not add up to 100 due to rounding. 124

The 2010 PSSA Writing District Level Proficiency Results - District Totals*
CountyIU
Number District Group
Number Scored Writing
% Advanced
Writing
% Proficient
Writing% Basic Writing
% Below Basic
WritingLehigh 21 NORTHERN LEHIGH SD All students 456 7.7 73.0 18.6 0.7Lehigh 21 NORTHERN LEHIGH SD Male 227 5.7 70.5 22.5 1.3Lehigh 21 NORTHERN LEHIGH SD Female 229 9.6 75.5 14.8 0.0Lehigh 21 NORTHERN LEHIGH SD White 420 8.1 73.3 17.9 0.7Lehigh 21 NORTHERN LEHIGH SD Black 11 9.1 72.7 18.2 0.0Lehigh 21 NORTHERN LEHIGH SD Hispanic 18 0.0 61.1 38.9 0.0Lehigh 21 NORTHERN LEHIGH SD Asian 4Lehigh 21 NORTHERN LEHIGH SD Native American 0Lehigh 21 NORTHERN LEHIGH SD Multi-ethnic 3Lehigh 21 NORTHERN LEHIGH SD IEP 68 1.5 45.6 50.0 2.9Lehigh 21 NORTHERN LEHIGH SD ELL 2Lehigh 21 NORTHERN LEHIGH SD Economically Disadvantaged 148 4.1 62.8 31.8 1.4Lehigh 21 NORTHWESTERN LEHIGH SD All students 554 14.1 58.5 27.1 0.4Lehigh 21 NORTHWESTERN LEHIGH SD Male 283 9.5 53.4 36.7 0.4Lehigh 21 NORTHWESTERN LEHIGH SD Female 271 18.8 63.8 17.0 0.4Lehigh 21 NORTHWESTERN LEHIGH SD White 521 14.8 58.5 26.3 0.4Lehigh 21 NORTHWESTERN LEHIGH SD Black 2Lehigh 21 NORTHWESTERN LEHIGH SD Hispanic 20 0.0 60.0 40.0 0.0Lehigh 21 NORTHWESTERN LEHIGH SD Asian 7Lehigh 21 NORTHWESTERN LEHIGH SD Native American 3Lehigh 21 NORTHWESTERN LEHIGH SD Multi-ethnic 1Lehigh 21 NORTHWESTERN LEHIGH SD IEP 112 1.8 36.6 59.8 1.8Lehigh 21 NORTHWESTERN LEHIGH SD ELL 2Lehigh 21 NORTHWESTERN LEHIGH SD Economically Disadvantaged 83 6.0 57.8 36.1 0.0Lehigh 21 PARKLAND SD All students 2,242 19.8 71.6 8.3 0.3Lehigh 21 PARKLAND SD Male 1,143 14.2 73.9 11.4 0.5Lehigh 21 PARKLAND SD Female 1,099 25.6 69.2 5.2 0.1Lehigh 21 PARKLAND SD White 1,829 19.8 71.9 8.0 0.3Lehigh 21 PARKLAND SD Black 106 15.1 72.6 11.3 0.9Lehigh 21 PARKLAND SD Hispanic 132 10.6 72.0 16.7 0.8
*Full Academic Year Students. Data for groups with less than 10 students assessed were replaced by blanks.Percentages were rounded to the nearest one-tenth.Proficiency percentages may not add up to 100 due to rounding. 125

The 2010 PSSA Writing District Level Proficiency Results - District Totals*
CountyIU
Number District Group
Number Scored Writing
% Advanced
Writing
% Proficient
Writing% Basic Writing
% Below Basic
WritingLehigh 21 PARKLAND SD Asian 174 28.7 67.2 4.0 0.0Lehigh 21 PARKLAND SD Native American 1Lehigh 21 PARKLAND SD Multi-ethnic 0Lehigh 21 PARKLAND SD IEP 311 2.6 68.8 26.7 1.9Lehigh 21 PARKLAND SD ELL 34 2.9 70.6 26.5 0.0Lehigh 21 PARKLAND SD Economically Disadvantaged 279 6.8 76.3 15.4 1.4Lehigh 21 SALISBURY TOWNSHIP SD All students 402 23.6 63.7 12.4 0.2Lehigh 21 SALISBURY TOWNSHIP SD Male 213 18.3 66.2 15.0 0.5Lehigh 21 SALISBURY TOWNSHIP SD Female 189 29.6 60.8 9.5 0.0Lehigh 21 SALISBURY TOWNSHIP SD White 328 26.2 62.8 10.7 0.3Lehigh 21 SALISBURY TOWNSHIP SD Black 17 23.5 58.8 17.6 0.0Lehigh 21 SALISBURY TOWNSHIP SD Hispanic 39 2.6 74.4 23.1 0.0Lehigh 21 SALISBURY TOWNSHIP SD Asian 10 30.0 50.0 20.0 0.0Lehigh 21 SALISBURY TOWNSHIP SD Native American 0Lehigh 21 SALISBURY TOWNSHIP SD Multi-ethnic 8Lehigh 21 SALISBURY TOWNSHIP SD IEP 71 5.6 62.0 31.0 1.4Lehigh 21 SALISBURY TOWNSHIP SD ELL 13 0.0 46.2 53.8 0.0Lehigh 21 SALISBURY TOWNSHIP SD Economically Disadvantaged 66 12.1 59.1 28.8 0.0Lehigh 21 SOUTHERN LEHIGH SD All students 752 12.6 73.1 13.4 0.8Lehigh 21 SOUTHERN LEHIGH SD Male 399 7.8 71.4 19.5 1.3Lehigh 21 SOUTHERN LEHIGH SD Female 353 18.1 75.1 6.5 0.3Lehigh 21 SOUTHERN LEHIGH SD White 682 12.5 74.3 12.5 0.7Lehigh 21 SOUTHERN LEHIGH SD Black 14 7.1 64.3 21.4 7.1Lehigh 21 SOUTHERN LEHIGH SD Hispanic 24 12.5 41.7 45.8 0.0Lehigh 21 SOUTHERN LEHIGH SD Asian 29 20.7 75.9 3.4 0.0Lehigh 21 SOUTHERN LEHIGH SD Native American 2Lehigh 21 SOUTHERN LEHIGH SD Multi-ethnic 1Lehigh 21 SOUTHERN LEHIGH SD IEP 91 1.1 49.5 45.1 4.4Lehigh 21 SOUTHERN LEHIGH SD ELL 4Lehigh 21 SOUTHERN LEHIGH SD Economically Disadvantaged 69 0.0 71.0 27.5 1.4
*Full Academic Year Students. Data for groups with less than 10 students assessed were replaced by blanks.Percentages were rounded to the nearest one-tenth.Proficiency percentages may not add up to 100 due to rounding. 126

The 2010 PSSA Writing District Level Proficiency Results - District Totals*
CountyIU
Number District Group
Number Scored Writing
% Advanced
Writing
% Proficient
Writing% Basic Writing
% Below Basic
WritingLehigh 21 WHITEHALL-COPLAY SD All students 977 7.7 66.0 25.5 0.8Lehigh 21 WHITEHALL-COPLAY SD Male 495 4.8 61.6 32.1 1.4Lehigh 21 WHITEHALL-COPLAY SD Female 477 10.7 70.6 18.4 0.2Lehigh 21 WHITEHALL-COPLAY SD White 652 7.7 67.9 23.8 0.6Lehigh 21 WHITEHALL-COPLAY SD Black 61 3.3 60.7 36.1 0.0Lehigh 21 WHITEHALL-COPLAY SD Hispanic 148 5.4 60.1 32.4 2.0Lehigh 21 WHITEHALL-COPLAY SD Asian 42 19.0 61.9 19.0 0.0Lehigh 21 WHITEHALL-COPLAY SD Native American 3Lehigh 21 WHITEHALL-COPLAY SD Multi-ethnic 66 10.6 68.2 19.7 1.5Lehigh 21 WHITEHALL-COPLAY SD IEP 143 1.4 37.1 57.3 4.2Lehigh 21 WHITEHALL-COPLAY SD ELL 31 0.0 41.9 54.8 3.2Lehigh 21 WHITEHALL-COPLAY SD Economically Disadvantaged 352 6.8 57.7 34.7 0.9Luzerne 18 CRESTWOOD SD All students 675 7.3 72.1 19.6 1.0Luzerne 18 CRESTWOOD SD Male 336 4.5 66.1 27.4 2.1Luzerne 18 CRESTWOOD SD Female 339 10.0 78.2 11.8 0.0Luzerne 18 CRESTWOOD SD White 639 7.2 72.9 18.9 0.9Luzerne 18 CRESTWOOD SD Black 6Luzerne 18 CRESTWOOD SD Hispanic 13 0.0 76.9 23.1 0.0Luzerne 18 CRESTWOOD SD Asian 17 17.6 47.1 35.3 0.0Luzerne 18 CRESTWOOD SD Native American 0Luzerne 18 CRESTWOOD SD Multi-ethnic 0Luzerne 18 CRESTWOOD SD IEP 72 0.0 34.7 58.3 6.9Luzerne 18 CRESTWOOD SD ELL 6Luzerne 18 CRESTWOOD SD Economically Disadvantaged 127 3.9 64.6 28.3 3.1Luzerne 18 DALLAS SD All students 635 12.9 74.3 12.6 0.2Luzerne 18 DALLAS SD Male 336 9.5 73.5 16.7 0.3Luzerne 18 DALLAS SD Female 298 16.8 75.5 7.7 0.0Luzerne 18 DALLAS SD White 620 13.1 74.7 12.1 0.2Luzerne 18 DALLAS SD Black 6Luzerne 18 DALLAS SD Hispanic 1
*Full Academic Year Students. Data for groups with less than 10 students assessed were replaced by blanks.Percentages were rounded to the nearest one-tenth.Proficiency percentages may not add up to 100 due to rounding. 127

The 2010 PSSA Writing District Level Proficiency Results - District Totals*
CountyIU
Number District Group
Number Scored Writing
% Advanced
Writing
% Proficient
Writing% Basic Writing
% Below Basic
WritingLuzerne 18 DALLAS SD Asian 5Luzerne 18 DALLAS SD Native American 0Luzerne 18 DALLAS SD Multi-ethnic 0Luzerne 18 DALLAS SD IEP 70 1.4 48.6 50.0 0.0Luzerne 18 DALLAS SD ELL 0Luzerne 18 DALLAS SD Economically Disadvantaged 94 4.3 71.3 24.5 0.0Luzerne 18 GREATER NANTICOKE AREA SAll students 459 3.1 61.9 32.7 2.4Luzerne 18 GREATER NANTICOKE AREA SMale 237 1.7 56.5 37.6 4.2Luzerne 18 GREATER NANTICOKE AREA SFemale 221 4.5 67.9 27.1 0.5Luzerne 18 GREATER NANTICOKE AREA SWhite 428 3.0 62.4 32.2 2.3Luzerne 18 GREATER NANTICOKE AREA SBlack 12 0.0 75.0 25.0 0.0Luzerne 18 GREATER NANTICOKE AREA SHispanic 17 5.9 41.2 47.1 5.9Luzerne 18 GREATER NANTICOKE AREA SAsian 1Luzerne 18 GREATER NANTICOKE AREA SNative American 0Luzerne 18 GREATER NANTICOKE AREA SMulti-ethnic 0Luzerne 18 GREATER NANTICOKE AREA SIEP 70 0.0 24.3 61.4 14.3Luzerne 18 GREATER NANTICOKE AREA SELL 6Luzerne 18 GREATER NANTICOKE AREA SEconomically Disadvantaged 204 1.0 55.4 40.2 3.4Luzerne 18 HANOVER AREA SD All students 432 11.1 69.7 18.8 0.5Luzerne 18 HANOVER AREA SD Male 222 9.0 67.1 23.0 0.9Luzerne 18 HANOVER AREA SD Female 209 13.4 72.2 14.4 0.0Luzerne 18 HANOVER AREA SD White 380 11.8 70.3 17.4 0.5Luzerne 18 HANOVER AREA SD Black 27 3.7 63.0 33.3 0.0Luzerne 18 HANOVER AREA SD Hispanic 16 0.0 62.5 37.5 0.0Luzerne 18 HANOVER AREA SD Asian 4Luzerne 18 HANOVER AREA SD Native American 4Luzerne 18 HANOVER AREA SD Multi-ethnic 0Luzerne 18 HANOVER AREA SD IEP 73 4.1 47.9 45.2 2.7Luzerne 18 HANOVER AREA SD ELL 4Luzerne 18 HANOVER AREA SD Economically Disadvantaged 226 8.0 66.8 24.8 0.4
*Full Academic Year Students. Data for groups with less than 10 students assessed were replaced by blanks.Percentages were rounded to the nearest one-tenth.Proficiency percentages may not add up to 100 due to rounding. 128

The 2010 PSSA Writing District Level Proficiency Results - District Totals*
CountyIU
Number District Group
Number Scored Writing
% Advanced
Writing
% Proficient
Writing% Basic Writing
% Below Basic
WritingLuzerne 18 HAZLETON AREA SD All students 2,130 5.8 65.7 25.8 2.7Luzerne 18 HAZLETON AREA SD Male 1,074 4.1 61.7 30.2 4.0Luzerne 18 HAZLETON AREA SD Female 1,055 7.5 69.9 21.2 1.4Luzerne 18 HAZLETON AREA SD White 1,419 7.3 70.9 20.3 1.6Luzerne 18 HAZLETON AREA SD Black 33 12.1 63.6 21.2 3.0Luzerne 18 HAZLETON AREA SD Hispanic 651 2.3 54.1 38.2 5.4Luzerne 18 HAZLETON AREA SD Asian 13 7.7 84.6 7.7 0.0Luzerne 18 HAZLETON AREA SD Native American 1Luzerne 18 HAZLETON AREA SD Multi-ethnic 12 0.0 75.0 25.0 0.0Luzerne 18 HAZLETON AREA SD IEP 271 0.0 34.7 51.3 14.0Luzerne 18 HAZLETON AREA SD ELL 190 0.0 27.4 59.5 13.2Luzerne 18 HAZLETON AREA SD Economically Disadvantaged 1,225 3.3 58.0 34.3 4.4Luzerne 18 LAKE-LEHMAN SD All students 491 6.1 59.7 31.6 2.6Luzerne 18 LAKE-LEHMAN SD Male 260 3.1 54.2 38.1 4.6Luzerne 18 LAKE-LEHMAN SD Female 231 9.5 65.8 24.2 0.4Luzerne 18 LAKE-LEHMAN SD White 482 5.8 59.8 31.7 2.7Luzerne 18 LAKE-LEHMAN SD Black 4Luzerne 18 LAKE-LEHMAN SD Hispanic 3Luzerne 18 LAKE-LEHMAN SD Asian 2Luzerne 18 LAKE-LEHMAN SD Native American 0Luzerne 18 LAKE-LEHMAN SD Multi-ethnic 0Luzerne 18 LAKE-LEHMAN SD IEP 78 1.3 23.1 66.7 9.0Luzerne 18 LAKE-LEHMAN SD ELL 0Luzerne 18 LAKE-LEHMAN SD Economically Disadvantaged 130 0.8 52.3 42.3 4.6Luzerne 18 NORTHWEST AREA SD All students 304 13.8 61.2 22.4 2.6Luzerne 18 NORTHWEST AREA SD Male 153 7.2 58.2 32.0 2.6Luzerne 18 NORTHWEST AREA SD Female 151 20.5 64.2 12.6 2.6Luzerne 18 NORTHWEST AREA SD White 295 14.2 60.7 22.4 2.7Luzerne 18 NORTHWEST AREA SD Black 7Luzerne 18 NORTHWEST AREA SD Hispanic 1
*Full Academic Year Students. Data for groups with less than 10 students assessed were replaced by blanks.Percentages were rounded to the nearest one-tenth.Proficiency percentages may not add up to 100 due to rounding. 129
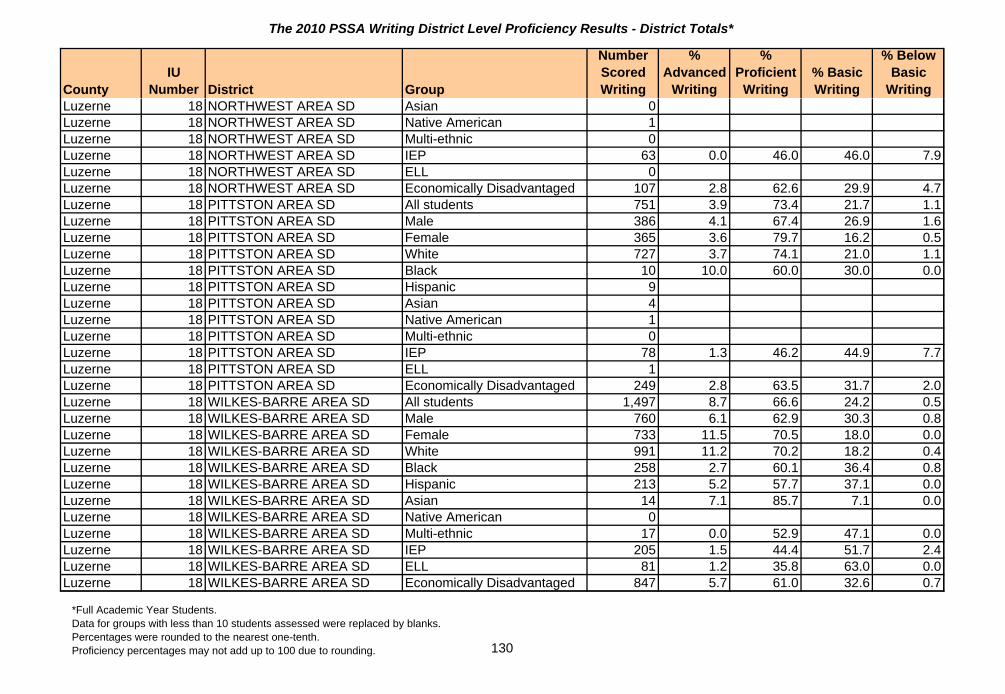
The 2010 PSSA Writing District Level Proficiency Results - District Totals*
CountyIU
Number District Group
Number Scored Writing
% Advanced
Writing
% Proficient
Writing% Basic Writing
% Below Basic
WritingLuzerne 18 NORTHWEST AREA SD Asian 0Luzerne 18 NORTHWEST AREA SD Native American 1Luzerne 18 NORTHWEST AREA SD Multi-ethnic 0Luzerne 18 NORTHWEST AREA SD IEP 63 0.0 46.0 46.0 7.9Luzerne 18 NORTHWEST AREA SD ELL 0Luzerne 18 NORTHWEST AREA SD Economically Disadvantaged 107 2.8 62.6 29.9 4.7Luzerne 18 PITTSTON AREA SD All students 751 3.9 73.4 21.7 1.1Luzerne 18 PITTSTON AREA SD Male 386 4.1 67.4 26.9 1.6Luzerne 18 PITTSTON AREA SD Female 365 3.6 79.7 16.2 0.5Luzerne 18 PITTSTON AREA SD White 727 3.7 74.1 21.0 1.1Luzerne 18 PITTSTON AREA SD Black 10 10.0 60.0 30.0 0.0Luzerne 18 PITTSTON AREA SD Hispanic 9Luzerne 18 PITTSTON AREA SD Asian 4Luzerne 18 PITTSTON AREA SD Native American 1Luzerne 18 PITTSTON AREA SD Multi-ethnic 0Luzerne 18 PITTSTON AREA SD IEP 78 1.3 46.2 44.9 7.7Luzerne 18 PITTSTON AREA SD ELL 1Luzerne 18 PITTSTON AREA SD Economically Disadvantaged 249 2.8 63.5 31.7 2.0Luzerne 18 WILKES-BARRE AREA SD All students 1,497 8.7 66.6 24.2 0.5Luzerne 18 WILKES-BARRE AREA SD Male 760 6.1 62.9 30.3 0.8Luzerne 18 WILKES-BARRE AREA SD Female 733 11.5 70.5 18.0 0.0Luzerne 18 WILKES-BARRE AREA SD White 991 11.2 70.2 18.2 0.4Luzerne 18 WILKES-BARRE AREA SD Black 258 2.7 60.1 36.4 0.8Luzerne 18 WILKES-BARRE AREA SD Hispanic 213 5.2 57.7 37.1 0.0Luzerne 18 WILKES-BARRE AREA SD Asian 14 7.1 85.7 7.1 0.0Luzerne 18 WILKES-BARRE AREA SD Native American 0Luzerne 18 WILKES-BARRE AREA SD Multi-ethnic 17 0.0 52.9 47.1 0.0Luzerne 18 WILKES-BARRE AREA SD IEP 205 1.5 44.4 51.7 2.4Luzerne 18 WILKES-BARRE AREA SD ELL 81 1.2 35.8 63.0 0.0Luzerne 18 WILKES-BARRE AREA SD Economically Disadvantaged 847 5.7 61.0 32.6 0.7
*Full Academic Year Students. Data for groups with less than 10 students assessed were replaced by blanks.Percentages were rounded to the nearest one-tenth.Proficiency percentages may not add up to 100 due to rounding. 130

The 2010 PSSA Writing District Level Proficiency Results - District Totals*
CountyIU
Number District Group
Number Scored Writing
% Advanced
Writing
% Proficient
Writing% Basic Writing
% Below Basic
WritingLuzerne 18 WYOMING AREA SD All students 569 11.6 73.3 14.4 0.7Luzerne 18 WYOMING AREA SD Male 289 8.3 69.9 20.8 1.0Luzerne 18 WYOMING AREA SD Female 280 15.0 76.8 7.9 0.4Luzerne 18 WYOMING AREA SD White 549 11.8 73.8 13.7 0.7Luzerne 18 WYOMING AREA SD Black 11 0.0 54.5 45.5 0.0Luzerne 18 WYOMING AREA SD Hispanic 7Luzerne 18 WYOMING AREA SD Asian 1Luzerne 18 WYOMING AREA SD Native American 0Luzerne 18 WYOMING AREA SD Multi-ethnic 0Luzerne 18 WYOMING AREA SD IEP 55 0.0 41.8 54.5 3.6Luzerne 18 WYOMING AREA SD ELL 1Luzerne 18 WYOMING AREA SD Economically Disadvantaged 176 5.1 70.5 23.9 0.6Luzerne 18 WYOMING VALLEY WEST SD All students 1,174 6.6 65.5 25.0 3.0Luzerne 18 WYOMING VALLEY WEST SD Male 598 4.2 58.2 32.6 5.0Luzerne 18 WYOMING VALLEY WEST SD Female 573 8.9 73.5 16.8 0.9Luzerne 18 WYOMING VALLEY WEST SD White 1,010 6.7 67.1 23.4 2.8Luzerne 18 WYOMING VALLEY WEST SD Black 68 7.4 47.1 44.1 1.5Luzerne 18 WYOMING VALLEY WEST SD Hispanic 48 2.1 68.8 27.1 2.1Luzerne 18 WYOMING VALLEY WEST SD Asian 16 12.5 81.3 6.3 0.0Luzerne 18 WYOMING VALLEY WEST SD Native American 4Luzerne 18 WYOMING VALLEY WEST SD Multi-ethnic 10 0.0 70.0 20.0 10.0Luzerne 18 WYOMING VALLEY WEST SD IEP 51 0.0 25.5 52.9 21.6Luzerne 18 WYOMING VALLEY WEST SD ELL 7Luzerne 18 WYOMING VALLEY WEST SD Economically Disadvantaged 586 3.9 61.1 31.7 3.2Lycoming 17 EAST LYCOMING SD All students 383 18.3 64.0 17.5 0.3Lycoming 17 EAST LYCOMING SD Male 195 15.9 60.5 23.1 0.5Lycoming 17 EAST LYCOMING SD Female 188 20.7 67.6 11.7 0.0Lycoming 17 EAST LYCOMING SD White 374 17.4 64.4 17.9 0.3Lycoming 17 EAST LYCOMING SD Black 5Lycoming 17 EAST LYCOMING SD Hispanic 3
*Full Academic Year Students. Data for groups with less than 10 students assessed were replaced by blanks.Percentages were rounded to the nearest one-tenth.Proficiency percentages may not add up to 100 due to rounding. 131

The 2010 PSSA Writing District Level Proficiency Results - District Totals*
CountyIU
Number District Group
Number Scored Writing
% Advanced
Writing
% Proficient
Writing% Basic Writing
% Below Basic
WritingLycoming 17 EAST LYCOMING SD Asian 0Lycoming 17 EAST LYCOMING SD Native American 1Lycoming 17 EAST LYCOMING SD Multi-ethnic 0Lycoming 17 EAST LYCOMING SD IEP 28 7.1 46.4 46.4 0.0Lycoming 17 EAST LYCOMING SD ELL 0Lycoming 17 EAST LYCOMING SD Economically Disadvantaged 118 11.0 63.6 25.4 0.0Lycoming 17 JERSEY SHORE AREA SD All students 568 7.4 71.0 19.5 2.1Lycoming 17 JERSEY SHORE AREA SD Male 281 6.0 62.3 27.8 3.9Lycoming 17 JERSEY SHORE AREA SD Female 285 8.8 79.6 11.2 0.4Lycoming 17 JERSEY SHORE AREA SD White 557 7.5 71.3 19.4 1.8Lycoming 17 JERSEY SHORE AREA SD Black 3Lycoming 17 JERSEY SHORE AREA SD Hispanic 0Lycoming 17 JERSEY SHORE AREA SD Asian 4Lycoming 17 JERSEY SHORE AREA SD Native American 0Lycoming 17 JERSEY SHORE AREA SD Multi-ethnic 2Lycoming 17 JERSEY SHORE AREA SD IEP 79 0.0 43.0 46.8 10.1Lycoming 17 JERSEY SHORE AREA SD ELL 1Lycoming 17 JERSEY SHORE AREA SD Economically Disadvantaged 179 5.6 65.9 26.3 2.2Lycoming 17 LOYALSOCK TOWNSHIP SD All students 292 8.2 69.5 22.3 0.0Lycoming 17 LOYALSOCK TOWNSHIP SD Male 156 3.2 67.9 28.8 0.0Lycoming 17 LOYALSOCK TOWNSHIP SD Female 136 14.0 71.3 14.7 0.0Lycoming 17 LOYALSOCK TOWNSHIP SD White 262 8.0 70.6 21.4 0.0Lycoming 17 LOYALSOCK TOWNSHIP SD Black 20 10.0 55.0 35.0 0.0Lycoming 17 LOYALSOCK TOWNSHIP SD Hispanic 5Lycoming 17 LOYALSOCK TOWNSHIP SD Asian 5Lycoming 17 LOYALSOCK TOWNSHIP SD Native American 0Lycoming 17 LOYALSOCK TOWNSHIP SD Multi-ethnic 0Lycoming 17 LOYALSOCK TOWNSHIP SD IEP 36 0.0 38.9 61.1 0.0Lycoming 17 LOYALSOCK TOWNSHIP SD ELL 2Lycoming 17 LOYALSOCK TOWNSHIP SD Economically Disadvantaged 66 7.6 69.7 22.7 0.0
*Full Academic Year Students. Data for groups with less than 10 students assessed were replaced by blanks.Percentages were rounded to the nearest one-tenth.Proficiency percentages may not add up to 100 due to rounding. 132

The 2010 PSSA Writing District Level Proficiency Results - District Totals*
CountyIU
Number District Group
Number Scored Writing
% Advanced
Writing
% Proficient
Writing% Basic Writing
% Below Basic
WritingLycoming 17 MONTGOMERY AREA SD All students 184 10.3 65.8 20.7 3.3Lycoming 17 MONTGOMERY AREA SD Male 88 3.4 61.4 29.5 5.7Lycoming 17 MONTGOMERY AREA SD Female 96 16.7 69.8 12.5 1.0Lycoming 17 MONTGOMERY AREA SD White 178 10.7 65.7 20.2 3.4Lycoming 17 MONTGOMERY AREA SD Black 3Lycoming 17 MONTGOMERY AREA SD Hispanic 1Lycoming 17 MONTGOMERY AREA SD Asian 2Lycoming 17 MONTGOMERY AREA SD Native American 0Lycoming 17 MONTGOMERY AREA SD Multi-ethnic 0Lycoming 17 MONTGOMERY AREA SD IEP 24 4.2 45.8 33.3 16.7Lycoming 17 MONTGOMERY AREA SD ELL 0Lycoming 17 MONTGOMERY AREA SD Economically Disadvantaged 62 6.5 66.1 24.2 3.2Lycoming 17 MONTOURSVILLE AREA SD All students 440 8.9 69.5 20.9 0.7Lycoming 17 MONTOURSVILLE AREA SD Male 221 6.8 67.9 24.4 0.9Lycoming 17 MONTOURSVILLE AREA SD Female 219 11.0 71.2 17.4 0.5Lycoming 17 MONTOURSVILLE AREA SD White 428 8.9 69.4 21.0 0.7Lycoming 17 MONTOURSVILLE AREA SD Black 7Lycoming 17 MONTOURSVILLE AREA SD Hispanic 1Lycoming 17 MONTOURSVILLE AREA SD Asian 4Lycoming 17 MONTOURSVILLE AREA SD Native American 0Lycoming 17 MONTOURSVILLE AREA SD Multi-ethnic 0Lycoming 17 MONTOURSVILLE AREA SD IEP 41 0.0 58.5 36.6 4.9Lycoming 17 MONTOURSVILLE AREA SD ELL 0Lycoming 17 MONTOURSVILLE AREA SD Economically Disadvantaged 90 3.3 57.8 37.8 1.1Lycoming 17 MUNCY SD All students 258 16.7 72.5 10.5 0.4Lycoming 17 MUNCY SD Male 126 13.5 73.8 11.9 0.8Lycoming 17 MUNCY SD Female 132 19.7 71.2 9.1 0.0Lycoming 17 MUNCY SD White 247 17.4 72.9 9.3 0.4Lycoming 17 MUNCY SD Black 1Lycoming 17 MUNCY SD Hispanic 5
*Full Academic Year Students. Data for groups with less than 10 students assessed were replaced by blanks.Percentages were rounded to the nearest one-tenth.Proficiency percentages may not add up to 100 due to rounding. 133

The 2010 PSSA Writing District Level Proficiency Results - District Totals*
CountyIU
Number District Group
Number Scored Writing
% Advanced
Writing
% Proficient
Writing% Basic Writing
% Below Basic
WritingLycoming 17 MUNCY SD Asian 1Lycoming 17 MUNCY SD Native American 2Lycoming 17 MUNCY SD Multi-ethnic 2Lycoming 17 MUNCY SD IEP 39 0.0 59.0 38.5 2.6Lycoming 17 MUNCY SD ELL 0Lycoming 17 MUNCY SD Economically Disadvantaged 80 11.3 71.3 17.5 0.0Lycoming 17 SOUTH WILLIAMSPORT AREA All students 299 8.0 70.9 20.4 0.7Lycoming 17 SOUTH WILLIAMSPORT AREA Male 152 2.6 68.4 28.3 0.7Lycoming 17 SOUTH WILLIAMSPORT AREA Female 147 13.6 73.5 12.2 0.7Lycoming 17 SOUTH WILLIAMSPORT AREA White 288 8.0 72.2 19.1 0.7Lycoming 17 SOUTH WILLIAMSPORT AREA Black 5Lycoming 17 SOUTH WILLIAMSPORT AREA Hispanic 4Lycoming 17 SOUTH WILLIAMSPORT AREA Asian 1Lycoming 17 SOUTH WILLIAMSPORT AREA Native American 1Lycoming 17 SOUTH WILLIAMSPORT AREA Multi-ethnic 0Lycoming 17 SOUTH WILLIAMSPORT AREA IEP 39 0.0 41.0 56.4 2.6Lycoming 17 SOUTH WILLIAMSPORT AREA ELL 2Lycoming 17 SOUTH WILLIAMSPORT AREA Economically Disadvantaged 95 2.1 64.2 32.6 1.1Lycoming 17 WILLIAMSPORT AREA SD All students 1,081 5.2 65.7 26.5 2.6Lycoming 17 WILLIAMSPORT AREA SD Male 556 4.0 59.5 32.9 3.6Lycoming 17 WILLIAMSPORT AREA SD Female 524 6.5 72.3 19.8 1.3Lycoming 17 WILLIAMSPORT AREA SD White 779 6.2 67.9 23.9 2.1Lycoming 17 WILLIAMSPORT AREA SD Black 219 0.9 57.5 36.5 5.0Lycoming 17 WILLIAMSPORT AREA SD Hispanic 17 5.9 52.9 41.2 0.0Lycoming 17 WILLIAMSPORT AREA SD Asian 6Lycoming 17 WILLIAMSPORT AREA SD Native American 1Lycoming 17 WILLIAMSPORT AREA SD Multi-ethnic 58 6.9 70.7 22.4 0.0Lycoming 17 WILLIAMSPORT AREA SD IEP 219 0.9 34.2 54.3 10.5Lycoming 17 WILLIAMSPORT AREA SD ELL 3Lycoming 17 WILLIAMSPORT AREA SD Economically Disadvantaged 590 1.2 59.8 35.6 3.4
*Full Academic Year Students. Data for groups with less than 10 students assessed were replaced by blanks.Percentages were rounded to the nearest one-tenth.Proficiency percentages may not add up to 100 due to rounding. 134

The 2010 PSSA Writing District Level Proficiency Results - District Totals*
CountyIU
Number District Group
Number Scored Writing
% Advanced
Writing
% Proficient
Writing% Basic Writing
% Below Basic
WritingMckean 9 BRADFORD AREA SD All students 570 10.4 64.2 23.3 2.1Mckean 9 BRADFORD AREA SD Male 278 6.5 57.2 32.7 3.6Mckean 9 BRADFORD AREA SD Female 292 14.0 70.9 14.4 0.7Mckean 9 BRADFORD AREA SD White 546 10.3 64.7 23.1 2.0Mckean 9 BRADFORD AREA SD Black 7Mckean 9 BRADFORD AREA SD Hispanic 9Mckean 9 BRADFORD AREA SD Asian 5Mckean 9 BRADFORD AREA SD Native American 3Mckean 9 BRADFORD AREA SD Multi-ethnic 0Mckean 9 BRADFORD AREA SD IEP 55 1.8 21.8 61.8 14.5Mckean 9 BRADFORD AREA SD ELL 0Mckean 9 BRADFORD AREA SD Economically Disadvantaged 225 0.4 62.2 33.3 4.0Mckean 9 KANE AREA SD All students 283 3.5 61.5 31.8 3.2Mckean 9 KANE AREA SD Male 144 0.7 52.8 41.7 4.9Mckean 9 KANE AREA SD Female 139 6.5 70.5 21.6 1.4Mckean 9 KANE AREA SD White 276 3.3 60.9 32.6 3.3Mckean 9 KANE AREA SD Black 3Mckean 9 KANE AREA SD Hispanic 1Mckean 9 KANE AREA SD Asian 3Mckean 9 KANE AREA SD Native American 0Mckean 9 KANE AREA SD Multi-ethnic 0Mckean 9 KANE AREA SD IEP 55 0.0 12.7 74.5 12.7Mckean 9 KANE AREA SD ELL 0Mckean 9 KANE AREA SD Economically Disadvantaged 84 2.4 64.3 31.0 2.4Mckean 9 OTTO-ELDRED SD All students 153 4.6 62.1 28.8 4.6Mckean 9 OTTO-ELDRED SD Male 72 1.4 52.8 36.1 9.7Mckean 9 OTTO-ELDRED SD Female 81 7.4 70.4 22.2 0.0Mckean 9 OTTO-ELDRED SD White 152 4.6 61.8 28.9 4.6Mckean 9 OTTO-ELDRED SD Black 1Mckean 9 OTTO-ELDRED SD Hispanic 0
*Full Academic Year Students. Data for groups with less than 10 students assessed were replaced by blanks.Percentages were rounded to the nearest one-tenth.Proficiency percentages may not add up to 100 due to rounding. 135
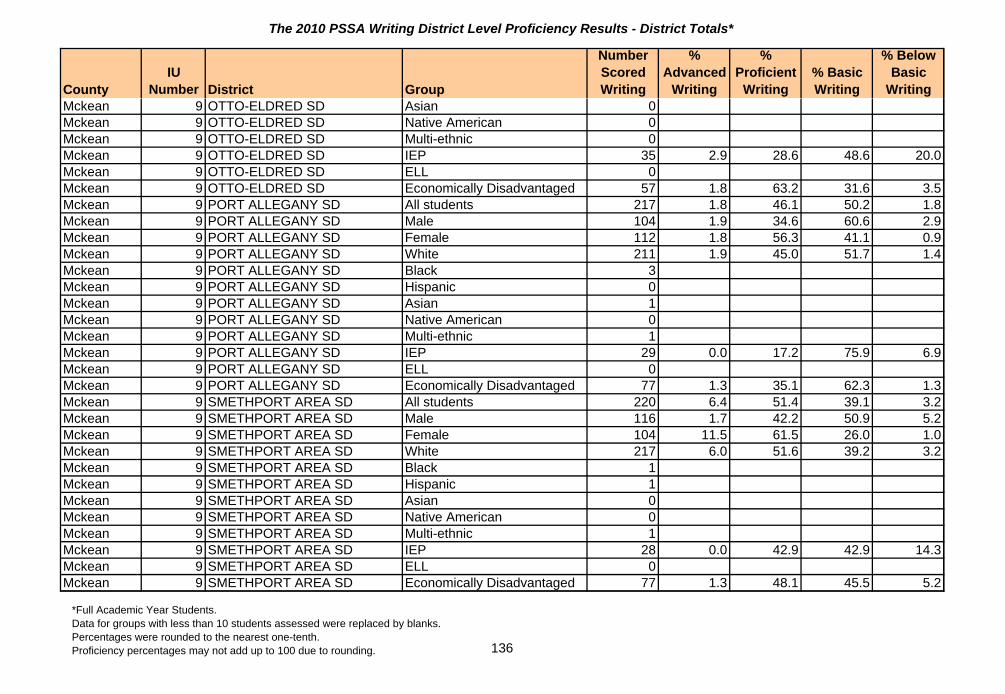
The 2010 PSSA Writing District Level Proficiency Results - District Totals*
CountyIU
Number District Group
Number Scored Writing
% Advanced
Writing
% Proficient
Writing% Basic Writing
% Below Basic
WritingMckean 9 OTTO-ELDRED SD Asian 0Mckean 9 OTTO-ELDRED SD Native American 0Mckean 9 OTTO-ELDRED SD Multi-ethnic 0Mckean 9 OTTO-ELDRED SD IEP 35 2.9 28.6 48.6 20.0Mckean 9 OTTO-ELDRED SD ELL 0Mckean 9 OTTO-ELDRED SD Economically Disadvantaged 57 1.8 63.2 31.6 3.5Mckean 9 PORT ALLEGANY SD All students 217 1.8 46.1 50.2 1.8Mckean 9 PORT ALLEGANY SD Male 104 1.9 34.6 60.6 2.9Mckean 9 PORT ALLEGANY SD Female 112 1.8 56.3 41.1 0.9Mckean 9 PORT ALLEGANY SD White 211 1.9 45.0 51.7 1.4Mckean 9 PORT ALLEGANY SD Black 3Mckean 9 PORT ALLEGANY SD Hispanic 0Mckean 9 PORT ALLEGANY SD Asian 1Mckean 9 PORT ALLEGANY SD Native American 0Mckean 9 PORT ALLEGANY SD Multi-ethnic 1Mckean 9 PORT ALLEGANY SD IEP 29 0.0 17.2 75.9 6.9Mckean 9 PORT ALLEGANY SD ELL 0Mckean 9 PORT ALLEGANY SD Economically Disadvantaged 77 1.3 35.1 62.3 1.3Mckean 9 SMETHPORT AREA SD All students 220 6.4 51.4 39.1 3.2Mckean 9 SMETHPORT AREA SD Male 116 1.7 42.2 50.9 5.2Mckean 9 SMETHPORT AREA SD Female 104 11.5 61.5 26.0 1.0Mckean 9 SMETHPORT AREA SD White 217 6.0 51.6 39.2 3.2Mckean 9 SMETHPORT AREA SD Black 1Mckean 9 SMETHPORT AREA SD Hispanic 1Mckean 9 SMETHPORT AREA SD Asian 0Mckean 9 SMETHPORT AREA SD Native American 0Mckean 9 SMETHPORT AREA SD Multi-ethnic 1Mckean 9 SMETHPORT AREA SD IEP 28 0.0 42.9 42.9 14.3Mckean 9 SMETHPORT AREA SD ELL 0Mckean 9 SMETHPORT AREA SD Economically Disadvantaged 77 1.3 48.1 45.5 5.2
*Full Academic Year Students. Data for groups with less than 10 students assessed were replaced by blanks.Percentages were rounded to the nearest one-tenth.Proficiency percentages may not add up to 100 due to rounding. 136
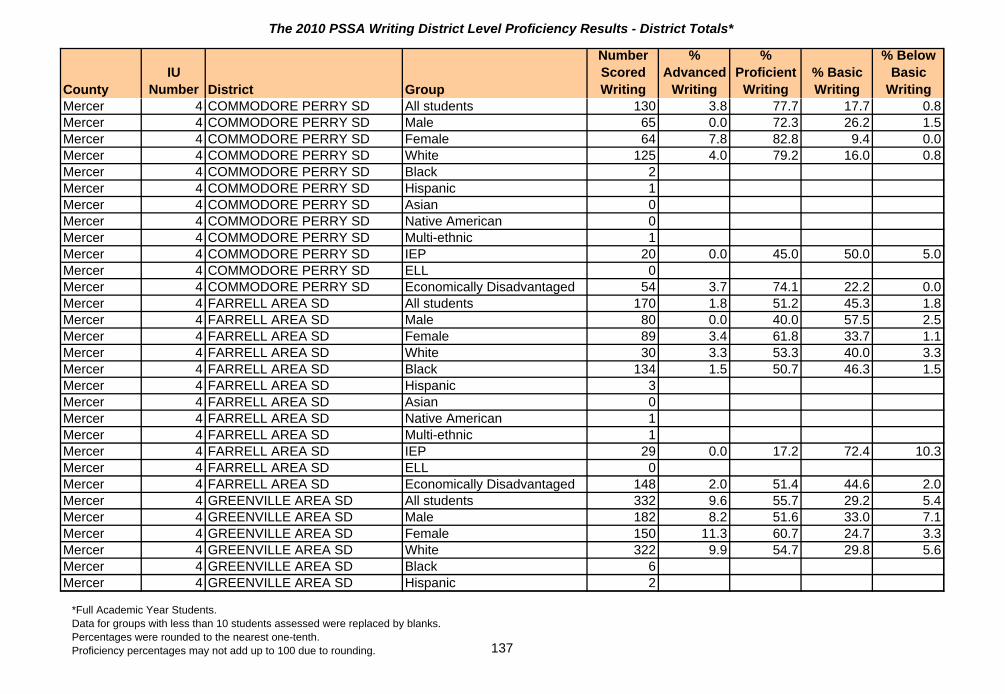
The 2010 PSSA Writing District Level Proficiency Results - District Totals*
CountyIU
Number District Group
Number Scored Writing
% Advanced
Writing
% Proficient
Writing% Basic Writing
% Below Basic
WritingMercer 4 COMMODORE PERRY SD All students 130 3.8 77.7 17.7 0.8Mercer 4 COMMODORE PERRY SD Male 65 0.0 72.3 26.2 1.5Mercer 4 COMMODORE PERRY SD Female 64 7.8 82.8 9.4 0.0Mercer 4 COMMODORE PERRY SD White 125 4.0 79.2 16.0 0.8Mercer 4 COMMODORE PERRY SD Black 2Mercer 4 COMMODORE PERRY SD Hispanic 1Mercer 4 COMMODORE PERRY SD Asian 0Mercer 4 COMMODORE PERRY SD Native American 0Mercer 4 COMMODORE PERRY SD Multi-ethnic 1Mercer 4 COMMODORE PERRY SD IEP 20 0.0 45.0 50.0 5.0Mercer 4 COMMODORE PERRY SD ELL 0Mercer 4 COMMODORE PERRY SD Economically Disadvantaged 54 3.7 74.1 22.2 0.0Mercer 4 FARRELL AREA SD All students 170 1.8 51.2 45.3 1.8Mercer 4 FARRELL AREA SD Male 80 0.0 40.0 57.5 2.5Mercer 4 FARRELL AREA SD Female 89 3.4 61.8 33.7 1.1Mercer 4 FARRELL AREA SD White 30 3.3 53.3 40.0 3.3Mercer 4 FARRELL AREA SD Black 134 1.5 50.7 46.3 1.5Mercer 4 FARRELL AREA SD Hispanic 3Mercer 4 FARRELL AREA SD Asian 0Mercer 4 FARRELL AREA SD Native American 1Mercer 4 FARRELL AREA SD Multi-ethnic 1Mercer 4 FARRELL AREA SD IEP 29 0.0 17.2 72.4 10.3Mercer 4 FARRELL AREA SD ELL 0Mercer 4 FARRELL AREA SD Economically Disadvantaged 148 2.0 51.4 44.6 2.0Mercer 4 GREENVILLE AREA SD All students 332 9.6 55.7 29.2 5.4Mercer 4 GREENVILLE AREA SD Male 182 8.2 51.6 33.0 7.1Mercer 4 GREENVILLE AREA SD Female 150 11.3 60.7 24.7 3.3Mercer 4 GREENVILLE AREA SD White 322 9.9 54.7 29.8 5.6Mercer 4 GREENVILLE AREA SD Black 6Mercer 4 GREENVILLE AREA SD Hispanic 2
*Full Academic Year Students. Data for groups with less than 10 students assessed were replaced by blanks.Percentages were rounded to the nearest one-tenth.Proficiency percentages may not add up to 100 due to rounding. 137

The 2010 PSSA Writing District Level Proficiency Results - District Totals*
CountyIU
Number District Group
Number Scored Writing
% Advanced
Writing
% Proficient
Writing% Basic Writing
% Below Basic
WritingMercer 4 GREENVILLE AREA SD Asian 2Mercer 4 GREENVILLE AREA SD Native American 0Mercer 4 GREENVILLE AREA SD Multi-ethnic 0Mercer 4 GREENVILLE AREA SD IEP 37 0.0 29.7 37.8 32.4Mercer 4 GREENVILLE AREA SD ELL 0Mercer 4 GREENVILLE AREA SD Economically Disadvantaged 119 5.0 48.7 33.6 12.6Mercer 4 GROVE CITY AREA SD All students 518 9.1 72.2 17.6 1.2Mercer 4 GROVE CITY AREA SD Male 276 4.7 72.8 21.0 1.4Mercer 4 GROVE CITY AREA SD Female 242 14.0 71.5 13.6 0.8Mercer 4 GROVE CITY AREA SD White 498 8.6 72.7 17.5 1.2Mercer 4 GROVE CITY AREA SD Black 8Mercer 4 GROVE CITY AREA SD Hispanic 5Mercer 4 GROVE CITY AREA SD Asian 5Mercer 4 GROVE CITY AREA SD Native American 1Mercer 4 GROVE CITY AREA SD Multi-ethnic 1Mercer 4 GROVE CITY AREA SD IEP 46 0.0 45.7 52.2 2.2Mercer 4 GROVE CITY AREA SD ELL 0Mercer 4 GROVE CITY AREA SD Economically Disadvantaged 138 3.6 66.7 28.3 1.4Mercer 4 HERMITAGE SD All students 468 8.1 66.9 25.0 0.0Mercer 4 HERMITAGE SD Male 235 3.0 62.6 34.5 0.0Mercer 4 HERMITAGE SD Female 228 13.6 72.4 14.0 0.0Mercer 4 HERMITAGE SD White 403 8.9 69.5 21.6 0.0Mercer 4 HERMITAGE SD Black 42 0.0 50.0 50.0 0.0Mercer 4 HERMITAGE SD Hispanic 5Mercer 4 HERMITAGE SD Asian 13 7.7 61.5 30.8 0.0Mercer 4 HERMITAGE SD Native American 0Mercer 4 HERMITAGE SD Multi-ethnic 0Mercer 4 HERMITAGE SD IEP 41 0.0 22.0 78.0 0.0Mercer 4 HERMITAGE SD ELL 3Mercer 4 HERMITAGE SD Economically Disadvantaged 111 1.8 55.9 42.3 0.0
*Full Academic Year Students. Data for groups with less than 10 students assessed were replaced by blanks.Percentages were rounded to the nearest one-tenth.Proficiency percentages may not add up to 100 due to rounding. 138

The 2010 PSSA Writing District Level Proficiency Results - District Totals*
CountyIU
Number District Group
Number Scored Writing
% Advanced
Writing
% Proficient
Writing% Basic Writing
% Below Basic
WritingMercer 4 JAMESTOWN AREA SD All students 147 8.8 75.5 15.6 0.0Mercer 4 JAMESTOWN AREA SD Male 73 4.1 76.7 19.2 0.0Mercer 4 JAMESTOWN AREA SD Female 74 13.5 74.3 12.2 0.0Mercer 4 JAMESTOWN AREA SD White 147 8.8 75.5 15.6 0.0Mercer 4 JAMESTOWN AREA SD Black 0Mercer 4 JAMESTOWN AREA SD Hispanic 0Mercer 4 JAMESTOWN AREA SD Asian 0Mercer 4 JAMESTOWN AREA SD Native American 0Mercer 4 JAMESTOWN AREA SD Multi-ethnic 0Mercer 4 JAMESTOWN AREA SD IEP 19 0.0 63.2 36.8 0.0Mercer 4 JAMESTOWN AREA SD ELL 0Mercer 4 JAMESTOWN AREA SD Economically Disadvantaged 44 9.1 75.0 15.9 0.0Mercer 4 LAKEVIEW SD All students 292 11.3 75.0 13.4 0.3Mercer 4 LAKEVIEW SD Male 147 6.1 74.1 19.0 0.7Mercer 4 LAKEVIEW SD Female 145 16.6 75.9 7.6 0.0Mercer 4 LAKEVIEW SD White 288 11.5 75.0 13.2 0.3Mercer 4 LAKEVIEW SD Black 2Mercer 4 LAKEVIEW SD Hispanic 1Mercer 4 LAKEVIEW SD Asian 1Mercer 4 LAKEVIEW SD Native American 0Mercer 4 LAKEVIEW SD Multi-ethnic 0Mercer 4 LAKEVIEW SD IEP 34 5.9 44.1 47.1 2.9Mercer 4 LAKEVIEW SD ELL 0Mercer 4 LAKEVIEW SD Economically Disadvantaged 87 5.7 78.2 16.1 0.0Mercer 4 MERCER AREA SD All students 301 8.3 77.1 13.6 1.0Mercer 4 MERCER AREA SD Male 134 4.5 76.1 17.9 1.5Mercer 4 MERCER AREA SD Female 166 11.4 78.3 10.2 0.0Mercer 4 MERCER AREA SD White 284 8.5 77.5 13.4 0.7Mercer 4 MERCER AREA SD Black 8Mercer 4 MERCER AREA SD Hispanic 0
*Full Academic Year Students. Data for groups with less than 10 students assessed were replaced by blanks.Percentages were rounded to the nearest one-tenth.Proficiency percentages may not add up to 100 due to rounding. 139

The 2010 PSSA Writing District Level Proficiency Results - District Totals*
CountyIU
Number District Group
Number Scored Writing
% Advanced
Writing
% Proficient
Writing% Basic Writing
% Below Basic
WritingMercer 4 MERCER AREA SD Asian 7Mercer 4 MERCER AREA SD Native American 1Mercer 4 MERCER AREA SD Multi-ethnic 0Mercer 4 MERCER AREA SD IEP 57 0.0 47.4 49.1 3.5Mercer 4 MERCER AREA SD ELL 0Mercer 4 MERCER AREA SD Economically Disadvantaged 91 4.4 72.5 20.9 2.2Mercer 4 REYNOLDS SD All students 291 9.3 68.0 20.3 2.4Mercer 4 REYNOLDS SD Male 161 7.5 64.6 23.6 4.3Mercer 4 REYNOLDS SD Female 130 11.5 72.3 16.2 0.0Mercer 4 REYNOLDS SD White 285 9.5 67.7 20.7 2.1Mercer 4 REYNOLDS SD Black 4Mercer 4 REYNOLDS SD Hispanic 1Mercer 4 REYNOLDS SD Asian 1Mercer 4 REYNOLDS SD Native American 0Mercer 4 REYNOLDS SD Multi-ethnic 0Mercer 4 REYNOLDS SD IEP 35 0.0 22.9 60.0 17.1Mercer 4 REYNOLDS SD ELL 0Mercer 4 REYNOLDS SD Economically Disadvantaged 142 5.6 61.3 30.3 2.8Mercer 4 SHARON CITY SD All students 395 1.8 46.1 48.4 3.8Mercer 4 SHARON CITY SD Male 220 1.4 40.5 52.7 5.5Mercer 4 SHARON CITY SD Female 173 2.3 53.2 42.8 1.7Mercer 4 SHARON CITY SD White 285 2.5 50.5 42.5 4.6Mercer 4 SHARON CITY SD Black 87 0.0 34.5 64.4 1.1Mercer 4 SHARON CITY SD Hispanic 2Mercer 4 SHARON CITY SD Asian 2Mercer 4 SHARON CITY SD Native American 0Mercer 4 SHARON CITY SD Multi-ethnic 17 0.0 17.6 76.5 5.9Mercer 4 SHARON CITY SD IEP 74 0.0 10.8 71.6 17.6Mercer 4 SHARON CITY SD ELL 3Mercer 4 SHARON CITY SD Economically Disadvantaged 236 0.4 33.9 60.2 5.5
*Full Academic Year Students. Data for groups with less than 10 students assessed were replaced by blanks.Percentages were rounded to the nearest one-tenth.Proficiency percentages may not add up to 100 due to rounding. 140

The 2010 PSSA Writing District Level Proficiency Results - District Totals*
CountyIU
Number District Group
Number Scored Writing
% Advanced
Writing
% Proficient
Writing% Basic Writing
% Below Basic
WritingMercer 4 SHARPSVILLE AREA SD All students 285 8.8 76.8 11.9 2.5Mercer 4 SHARPSVILLE AREA SD Male 154 7.1 76.0 13.6 3.2Mercer 4 SHARPSVILLE AREA SD Female 131 10.7 77.9 9.9 1.5Mercer 4 SHARPSVILLE AREA SD White 279 9.0 77.1 11.5 2.5Mercer 4 SHARPSVILLE AREA SD Black 6Mercer 4 SHARPSVILLE AREA SD Hispanic 0Mercer 4 SHARPSVILLE AREA SD Asian 0Mercer 4 SHARPSVILLE AREA SD Native American 0Mercer 4 SHARPSVILLE AREA SD Multi-ethnic 0Mercer 4 SHARPSVILLE AREA SD IEP 25 0.0 32.0 40.0 28.0Mercer 4 SHARPSVILLE AREA SD ELL 0Mercer 4 SHARPSVILLE AREA SD Economically Disadvantaged 81 1.2 74.1 16.0 8.6Mercer 4 WEST MIDDLESEX AREA SD All students 265 2.3 66.0 30.2 1.5Mercer 4 WEST MIDDLESEX AREA SD Male 135 0.7 54.8 42.2 2.2Mercer 4 WEST MIDDLESEX AREA SD Female 129 3.9 77.5 17.8 0.8Mercer 4 WEST MIDDLESEX AREA SD White 252 2.4 65.1 31.0 1.6Mercer 4 WEST MIDDLESEX AREA SD Black 5Mercer 4 WEST MIDDLESEX AREA SD Hispanic 1Mercer 4 WEST MIDDLESEX AREA SD Asian 2Mercer 4 WEST MIDDLESEX AREA SD Native American 4Mercer 4 WEST MIDDLESEX AREA SD Multi-ethnic 0Mercer 4 WEST MIDDLESEX AREA SD IEP 49 4.1 42.9 44.9 8.2Mercer 4 WEST MIDDLESEX AREA SD ELL 0Mercer 4 WEST MIDDLESEX AREA SD Economically Disadvantaged 88 2.3 51.1 45.5 1.1Mifflin 11 MIFFLIN COUNTY SD All students 1,206 3.2 53.1 39.3 4.5Mifflin 11 MIFFLIN COUNTY SD Male 619 1.1 43.6 48.8 6.5Mifflin 11 MIFFLIN COUNTY SD Female 583 5.3 63.1 29.3 2.2Mifflin 11 MIFFLIN COUNTY SD White 1,146 3.1 54.2 38.9 3.8Mifflin 11 MIFFLIN COUNTY SD Black 32 6.3 25.0 50.0 18.8Mifflin 11 MIFFLIN COUNTY SD Hispanic 16 0.0 25.0 62.5 12.5
*Full Academic Year Students. Data for groups with less than 10 students assessed were replaced by blanks.Percentages were rounded to the nearest one-tenth.Proficiency percentages may not add up to 100 due to rounding. 141

The 2010 PSSA Writing District Level Proficiency Results - District Totals*
CountyIU
Number District Group
Number Scored Writing
% Advanced
Writing
% Proficient
Writing% Basic Writing
% Below Basic
WritingMifflin 11 MIFFLIN COUNTY SD Asian 8Mifflin 11 MIFFLIN COUNTY SD Native American 0Mifflin 11 MIFFLIN COUNTY SD Multi-ethnic 0Mifflin 11 MIFFLIN COUNTY SD IEP 142 0.0 20.4 60.6 19.0Mifflin 11 MIFFLIN COUNTY SD ELL 4Mifflin 11 MIFFLIN COUNTY SD Economically Disadvantaged 522 2.1 40.8 50.0 7.1Monroe 20 EAST STROUDSBURG AREA S All students 1,754 10.1 65.4 22.6 1.8Monroe 20 EAST STROUDSBURG AREA S Male 952 7.2 61.8 28.4 2.6Monroe 20 EAST STROUDSBURG AREA S Female 802 13.6 69.7 15.8 0.9Monroe 20 EAST STROUDSBURG AREA S White 954 12.9 64.7 21.2 1.3Monroe 20 EAST STROUDSBURG AREA S Black 398 5.5 67.8 24.1 2.5Monroe 20 EAST STROUDSBURG AREA S Hispanic 361 6.9 64.3 26.0 2.8Monroe 20 EAST STROUDSBURG AREA S Asian 36 19.4 69.4 11.1 0.0Monroe 20 EAST STROUDSBURG AREA S Native American 3Monroe 20 EAST STROUDSBURG AREA S Multi-ethnic 2Monroe 20 EAST STROUDSBURG AREA S IEP 349 1.1 39.8 50.4 8.6Monroe 20 EAST STROUDSBURG AREA S ELL 10 0.0 30.0 60.0 10.0Monroe 20 EAST STROUDSBURG AREA S Economically Disadvantaged 815 5.8 64.5 27.7 2.0Monroe 20 PLEASANT VALLEY SD All students 1,383 4.0 62.3 31.7 2.0Monroe 20 PLEASANT VALLEY SD Male 722 2.9 52.8 41.1 3.2Monroe 20 PLEASANT VALLEY SD Female 659 5.3 72.8 21.2 0.6Monroe 20 PLEASANT VALLEY SD White 1,103 4.5 61.7 31.8 1.9Monroe 20 PLEASANT VALLEY SD Black 116 0.9 61.2 35.3 2.6Monroe 20 PLEASANT VALLEY SD Hispanic 130 3.1 63.8 31.5 1.5Monroe 20 PLEASANT VALLEY SD Asian 22 0.0 90.9 4.5 4.5Monroe 20 PLEASANT VALLEY SD Native American 5Monroe 20 PLEASANT VALLEY SD Multi-ethnic 3Monroe 20 PLEASANT VALLEY SD IEP 173 0.0 28.3 61.8 9.8Monroe 20 PLEASANT VALLEY SD ELL 9Monroe 20 PLEASANT VALLEY SD Economically Disadvantaged 415 2.2 53.7 39.8 4.3
*Full Academic Year Students. Data for groups with less than 10 students assessed were replaced by blanks.Percentages were rounded to the nearest one-tenth.Proficiency percentages may not add up to 100 due to rounding. 142

The 2010 PSSA Writing District Level Proficiency Results - District Totals*
CountyIU
Number District Group
Number Scored Writing
% Advanced
Writing
% Proficient
Writing% Basic Writing
% Below Basic
WritingMonroe 20 POCONO MOUNTAIN SD All students 2,591 4.8 60.4 32.2 2.6Monroe 20 POCONO MOUNTAIN SD Male 1,326 3.1 52.6 40.2 4.1Monroe 20 POCONO MOUNTAIN SD Female 1,248 6.6 68.8 23.6 1.0Monroe 20 POCONO MOUNTAIN SD White 1,349 5.6 64.7 27.0 2.7Monroe 20 POCONO MOUNTAIN SD Black 619 3.2 53.6 40.7 2.4Monroe 20 POCONO MOUNTAIN SD Hispanic 536 3.7 56.7 36.8 2.8Monroe 20 POCONO MOUNTAIN SD Asian 62 12.9 66.1 19.4 1.6Monroe 20 POCONO MOUNTAIN SD Native American 8Monroe 20 POCONO MOUNTAIN SD Multi-ethnic 0Monroe 20 POCONO MOUNTAIN SD IEP 418 0.0 27.3 61.5 11.2Monroe 20 POCONO MOUNTAIN SD ELL 55 0.0 25.5 70.9 3.6Monroe 20 POCONO MOUNTAIN SD Economically Disadvantaged 1,195 2.7 56.3 38.2 2.8Monroe 20 STROUDSBURG AREA SD All students 1,256 14.3 70.1 14.5 1.0Monroe 20 STROUDSBURG AREA SD Male 637 11.0 67.5 19.8 1.7Monroe 20 STROUDSBURG AREA SD Female 617 17.8 72.9 8.9 0.3Monroe 20 STROUDSBURG AREA SD White 802 16.6 69.6 12.8 1.0Monroe 20 STROUDSBURG AREA SD Black 231 11.3 68.8 19.0 0.9Monroe 20 STROUDSBURG AREA SD Hispanic 180 8.3 73.3 17.2 1.1Monroe 20 STROUDSBURG AREA SD Asian 37 13.5 78.4 5.4 2.7Monroe 20 STROUDSBURG AREA SD Native American 2Monroe 20 STROUDSBURG AREA SD Multi-ethnic 2Monroe 20 STROUDSBURG AREA SD IEP 181 1.1 47.0 46.4 5.5Monroe 20 STROUDSBURG AREA SD ELL 13 0.0 61.5 30.8 7.7Monroe 20 STROUDSBURG AREA SD Economically Disadvantaged 399 11.0 66.4 20.3 2.3Montgomery 23 ABINGTON SD All students 1,647 11.8 72.9 14.9 0.4Montgomery 23 ABINGTON SD Male 871 6.8 72.4 20.1 0.7Montgomery 23 ABINGTON SD Female 774 17.4 73.5 9.0 0.0Montgomery 23 ABINGTON SD White 1,125 13.2 74.6 11.7 0.4Montgomery 23 ABINGTON SD Black 366 7.4 69.4 23.2 0.0Montgomery 23 ABINGTON SD Hispanic 66 7.6 63.6 28.8 0.0
*Full Academic Year Students. Data for groups with less than 10 students assessed were replaced by blanks.Percentages were rounded to the nearest one-tenth.Proficiency percentages may not add up to 100 due to rounding. 143
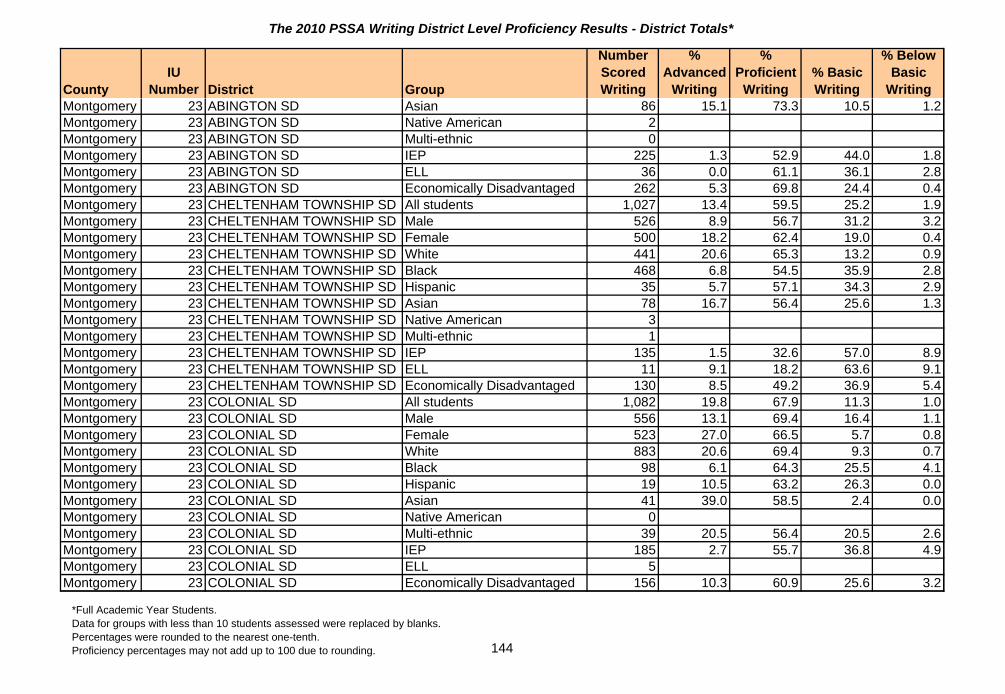
The 2010 PSSA Writing District Level Proficiency Results - District Totals*
CountyIU
Number District Group
Number Scored Writing
% Advanced
Writing
% Proficient
Writing% Basic Writing
% Below Basic
WritingMontgomery 23 ABINGTON SD Asian 86 15.1 73.3 10.5 1.2Montgomery 23 ABINGTON SD Native American 2Montgomery 23 ABINGTON SD Multi-ethnic 0Montgomery 23 ABINGTON SD IEP 225 1.3 52.9 44.0 1.8Montgomery 23 ABINGTON SD ELL 36 0.0 61.1 36.1 2.8Montgomery 23 ABINGTON SD Economically Disadvantaged 262 5.3 69.8 24.4 0.4Montgomery 23 CHELTENHAM TOWNSHIP SD All students 1,027 13.4 59.5 25.2 1.9Montgomery 23 CHELTENHAM TOWNSHIP SD Male 526 8.9 56.7 31.2 3.2Montgomery 23 CHELTENHAM TOWNSHIP SD Female 500 18.2 62.4 19.0 0.4Montgomery 23 CHELTENHAM TOWNSHIP SD White 441 20.6 65.3 13.2 0.9Montgomery 23 CHELTENHAM TOWNSHIP SD Black 468 6.8 54.5 35.9 2.8Montgomery 23 CHELTENHAM TOWNSHIP SD Hispanic 35 5.7 57.1 34.3 2.9Montgomery 23 CHELTENHAM TOWNSHIP SD Asian 78 16.7 56.4 25.6 1.3Montgomery 23 CHELTENHAM TOWNSHIP SD Native American 3Montgomery 23 CHELTENHAM TOWNSHIP SD Multi-ethnic 1Montgomery 23 CHELTENHAM TOWNSHIP SD IEP 135 1.5 32.6 57.0 8.9Montgomery 23 CHELTENHAM TOWNSHIP SD ELL 11 9.1 18.2 63.6 9.1Montgomery 23 CHELTENHAM TOWNSHIP SD Economically Disadvantaged 130 8.5 49.2 36.9 5.4Montgomery 23 COLONIAL SD All students 1,082 19.8 67.9 11.3 1.0Montgomery 23 COLONIAL SD Male 556 13.1 69.4 16.4 1.1Montgomery 23 COLONIAL SD Female 523 27.0 66.5 5.7 0.8Montgomery 23 COLONIAL SD White 883 20.6 69.4 9.3 0.7Montgomery 23 COLONIAL SD Black 98 6.1 64.3 25.5 4.1Montgomery 23 COLONIAL SD Hispanic 19 10.5 63.2 26.3 0.0Montgomery 23 COLONIAL SD Asian 41 39.0 58.5 2.4 0.0Montgomery 23 COLONIAL SD Native American 0Montgomery 23 COLONIAL SD Multi-ethnic 39 20.5 56.4 20.5 2.6Montgomery 23 COLONIAL SD IEP 185 2.7 55.7 36.8 4.9Montgomery 23 COLONIAL SD ELL 5Montgomery 23 COLONIAL SD Economically Disadvantaged 156 10.3 60.9 25.6 3.2
*Full Academic Year Students. Data for groups with less than 10 students assessed were replaced by blanks.Percentages were rounded to the nearest one-tenth.Proficiency percentages may not add up to 100 due to rounding. 144
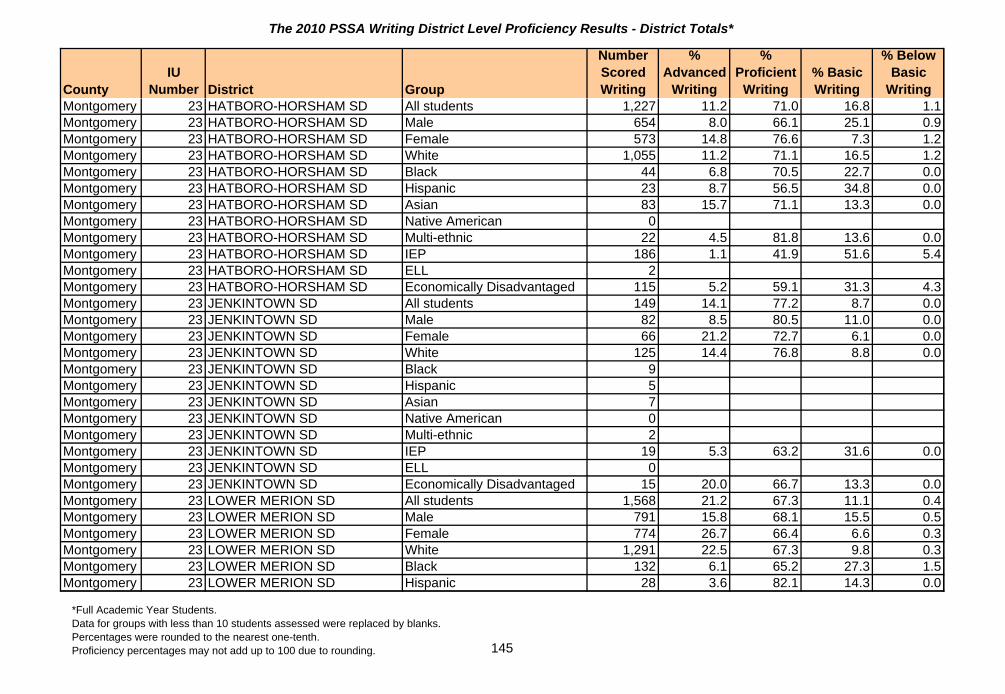
The 2010 PSSA Writing District Level Proficiency Results - District Totals*
CountyIU
Number District Group
Number Scored Writing
% Advanced
Writing
% Proficient
Writing% Basic Writing
% Below Basic
WritingMontgomery 23 HATBORO-HORSHAM SD All students 1,227 11.2 71.0 16.8 1.1Montgomery 23 HATBORO-HORSHAM SD Male 654 8.0 66.1 25.1 0.9Montgomery 23 HATBORO-HORSHAM SD Female 573 14.8 76.6 7.3 1.2Montgomery 23 HATBORO-HORSHAM SD White 1,055 11.2 71.1 16.5 1.2Montgomery 23 HATBORO-HORSHAM SD Black 44 6.8 70.5 22.7 0.0Montgomery 23 HATBORO-HORSHAM SD Hispanic 23 8.7 56.5 34.8 0.0Montgomery 23 HATBORO-HORSHAM SD Asian 83 15.7 71.1 13.3 0.0Montgomery 23 HATBORO-HORSHAM SD Native American 0Montgomery 23 HATBORO-HORSHAM SD Multi-ethnic 22 4.5 81.8 13.6 0.0Montgomery 23 HATBORO-HORSHAM SD IEP 186 1.1 41.9 51.6 5.4Montgomery 23 HATBORO-HORSHAM SD ELL 2Montgomery 23 HATBORO-HORSHAM SD Economically Disadvantaged 115 5.2 59.1 31.3 4.3Montgomery 23 JENKINTOWN SD All students 149 14.1 77.2 8.7 0.0Montgomery 23 JENKINTOWN SD Male 82 8.5 80.5 11.0 0.0Montgomery 23 JENKINTOWN SD Female 66 21.2 72.7 6.1 0.0Montgomery 23 JENKINTOWN SD White 125 14.4 76.8 8.8 0.0Montgomery 23 JENKINTOWN SD Black 9Montgomery 23 JENKINTOWN SD Hispanic 5Montgomery 23 JENKINTOWN SD Asian 7Montgomery 23 JENKINTOWN SD Native American 0Montgomery 23 JENKINTOWN SD Multi-ethnic 2Montgomery 23 JENKINTOWN SD IEP 19 5.3 63.2 31.6 0.0Montgomery 23 JENKINTOWN SD ELL 0Montgomery 23 JENKINTOWN SD Economically Disadvantaged 15 20.0 66.7 13.3 0.0Montgomery 23 LOWER MERION SD All students 1,568 21.2 67.3 11.1 0.4Montgomery 23 LOWER MERION SD Male 791 15.8 68.1 15.5 0.5Montgomery 23 LOWER MERION SD Female 774 26.7 66.4 6.6 0.3Montgomery 23 LOWER MERION SD White 1,291 22.5 67.3 9.8 0.3Montgomery 23 LOWER MERION SD Black 132 6.1 65.2 27.3 1.5Montgomery 23 LOWER MERION SD Hispanic 28 3.6 82.1 14.3 0.0
*Full Academic Year Students. Data for groups with less than 10 students assessed were replaced by blanks.Percentages were rounded to the nearest one-tenth.Proficiency percentages may not add up to 100 due to rounding. 145
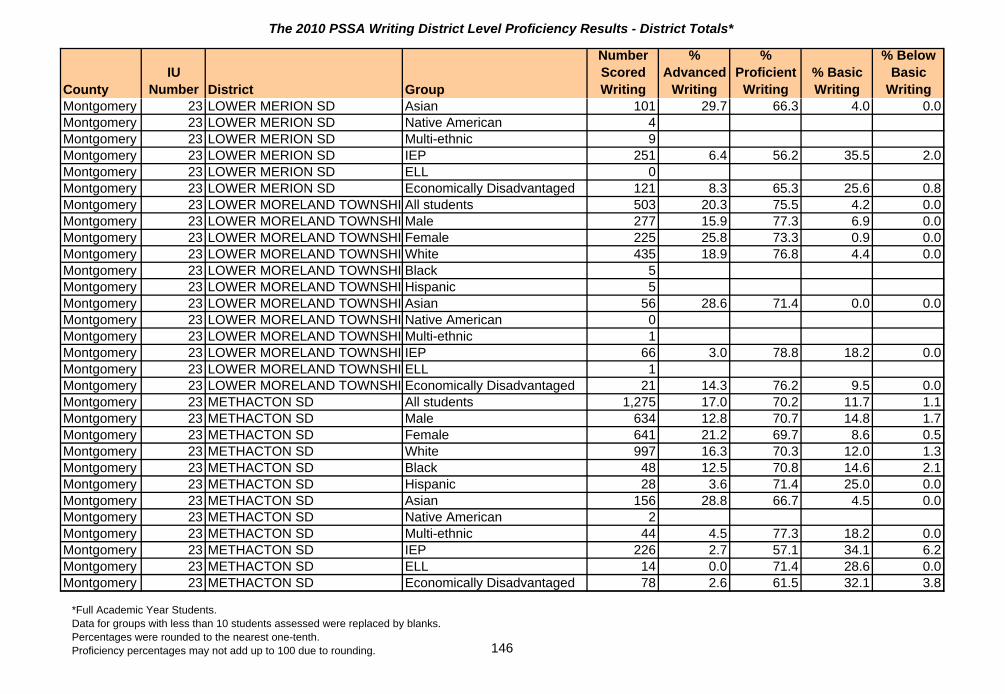
The 2010 PSSA Writing District Level Proficiency Results - District Totals*
CountyIU
Number District Group
Number Scored Writing
% Advanced
Writing
% Proficient
Writing% Basic Writing
% Below Basic
WritingMontgomery 23 LOWER MERION SD Asian 101 29.7 66.3 4.0 0.0Montgomery 23 LOWER MERION SD Native American 4Montgomery 23 LOWER MERION SD Multi-ethnic 9Montgomery 23 LOWER MERION SD IEP 251 6.4 56.2 35.5 2.0Montgomery 23 LOWER MERION SD ELL 0Montgomery 23 LOWER MERION SD Economically Disadvantaged 121 8.3 65.3 25.6 0.8Montgomery 23 LOWER MORELAND TOWNSHI All students 503 20.3 75.5 4.2 0.0Montgomery 23 LOWER MORELAND TOWNSHI Male 277 15.9 77.3 6.9 0.0Montgomery 23 LOWER MORELAND TOWNSHI Female 225 25.8 73.3 0.9 0.0Montgomery 23 LOWER MORELAND TOWNSHI White 435 18.9 76.8 4.4 0.0Montgomery 23 LOWER MORELAND TOWNSHI Black 5Montgomery 23 LOWER MORELAND TOWNSHI Hispanic 5Montgomery 23 LOWER MORELAND TOWNSHI Asian 56 28.6 71.4 0.0 0.0Montgomery 23 LOWER MORELAND TOWNSHI Native American 0Montgomery 23 LOWER MORELAND TOWNSHI Multi-ethnic 1Montgomery 23 LOWER MORELAND TOWNSHI IEP 66 3.0 78.8 18.2 0.0Montgomery 23 LOWER MORELAND TOWNSHI ELL 1Montgomery 23 LOWER MORELAND TOWNSHI Economically Disadvantaged 21 14.3 76.2 9.5 0.0Montgomery 23 METHACTON SD All students 1,275 17.0 70.2 11.7 1.1Montgomery 23 METHACTON SD Male 634 12.8 70.7 14.8 1.7Montgomery 23 METHACTON SD Female 641 21.2 69.7 8.6 0.5Montgomery 23 METHACTON SD White 997 16.3 70.3 12.0 1.3Montgomery 23 METHACTON SD Black 48 12.5 70.8 14.6 2.1Montgomery 23 METHACTON SD Hispanic 28 3.6 71.4 25.0 0.0Montgomery 23 METHACTON SD Asian 156 28.8 66.7 4.5 0.0Montgomery 23 METHACTON SD Native American 2Montgomery 23 METHACTON SD Multi-ethnic 44 4.5 77.3 18.2 0.0Montgomery 23 METHACTON SD IEP 226 2.7 57.1 34.1 6.2Montgomery 23 METHACTON SD ELL 14 0.0 71.4 28.6 0.0Montgomery 23 METHACTON SD Economically Disadvantaged 78 2.6 61.5 32.1 3.8
*Full Academic Year Students. Data for groups with less than 10 students assessed were replaced by blanks.Percentages were rounded to the nearest one-tenth.Proficiency percentages may not add up to 100 due to rounding. 146

The 2010 PSSA Writing District Level Proficiency Results - District Totals*
CountyIU
Number District Group
Number Scored Writing
% Advanced
Writing
% Proficient
Writing% Basic Writing
% Below Basic
WritingMontgomery 23 NORRISTOWN SD All students 1,346 2.8 46.6 45.3 5.3Montgomery 23 NORRISTOWN SD Male 682 1.2 40.0 50.4 8.4Montgomery 23 NORRISTOWN SD Female 661 4.5 53.4 39.9 2.1Montgomery 23 NORRISTOWN SD White 389 3.9 58.6 34.4 3.1Montgomery 23 NORRISTOWN SD Black 662 2.3 40.8 50.5 6.5Montgomery 23 NORRISTOWN SD Hispanic 251 2.0 43.0 49.4 5.6Montgomery 23 NORRISTOWN SD Asian 26 11.5 57.7 26.9 3.8Montgomery 23 NORRISTOWN SD Native American 1Montgomery 23 NORRISTOWN SD Multi-ethnic 13 0.0 38.5 53.8 7.7Montgomery 23 NORRISTOWN SD IEP 263 0.0 18.6 62.0 19.4Montgomery 23 NORRISTOWN SD ELL 89 0.0 21.3 66.3 12.4Montgomery 23 NORRISTOWN SD Economically Disadvantaged 872 1.4 42.4 49.5 6.7Montgomery 23 NORTH PENN SD All students 2,898 15.0 74.1 10.4 0.6Montgomery 23 NORTH PENN SD Male 1,479 10.7 73.4 15.0 0.9Montgomery 23 NORTH PENN SD Female 1,405 19.5 74.9 5.4 0.2Montgomery 23 NORTH PENN SD White 2,079 15.0 74.6 10.0 0.5Montgomery 23 NORTH PENN SD Black 210 8.1 72.4 18.1 1.4Montgomery 23 NORTH PENN SD Hispanic 85 14.1 68.2 16.5 1.2Montgomery 23 NORTH PENN SD Asian 510 18.0 73.9 7.5 0.6Montgomery 23 NORTH PENN SD Native American 0Montgomery 23 NORTH PENN SD Multi-ethnic 0Montgomery 23 NORTH PENN SD IEP 521 5.2 61.8 30.7 2.3Montgomery 23 NORTH PENN SD ELL 52 1.9 71.2 21.2 5.8Montgomery 23 NORTH PENN SD Economically Disadvantaged 503 8.2 68.4 21.3 2.2Montgomery 23 PERKIOMEN VALLEY SD All students 1,300 11.6 68.9 18.9 0.5Montgomery 23 PERKIOMEN VALLEY SD Male 676 7.5 66.1 25.4 0.9Montgomery 23 PERKIOMEN VALLEY SD Female 624 16.0 72.0 11.9 0.2Montgomery 23 PERKIOMEN VALLEY SD White 1,129 11.2 69.0 19.2 0.5Montgomery 23 PERKIOMEN VALLEY SD Black 64 10.9 67.2 20.3 1.6Montgomery 23 PERKIOMEN VALLEY SD Hispanic 27 11.1 66.7 22.2 0.0
*Full Academic Year Students. Data for groups with less than 10 students assessed were replaced by blanks.Percentages were rounded to the nearest one-tenth.Proficiency percentages may not add up to 100 due to rounding. 147
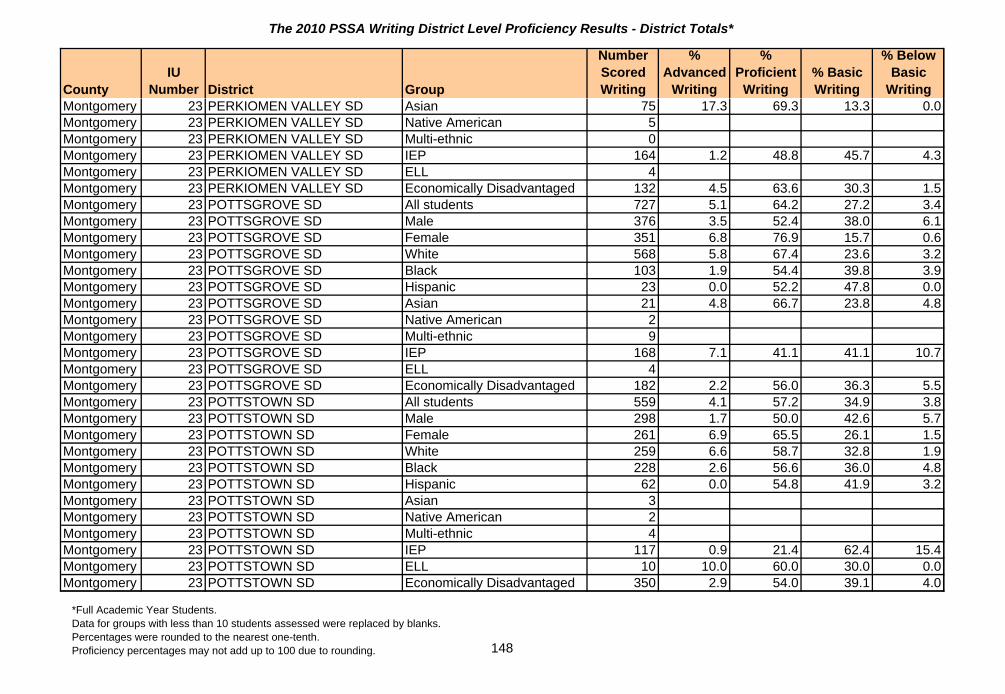
The 2010 PSSA Writing District Level Proficiency Results - District Totals*
CountyIU
Number District Group
Number Scored Writing
% Advanced
Writing
% Proficient
Writing% Basic Writing
% Below Basic
WritingMontgomery 23 PERKIOMEN VALLEY SD Asian 75 17.3 69.3 13.3 0.0Montgomery 23 PERKIOMEN VALLEY SD Native American 5Montgomery 23 PERKIOMEN VALLEY SD Multi-ethnic 0Montgomery 23 PERKIOMEN VALLEY SD IEP 164 1.2 48.8 45.7 4.3Montgomery 23 PERKIOMEN VALLEY SD ELL 4Montgomery 23 PERKIOMEN VALLEY SD Economically Disadvantaged 132 4.5 63.6 30.3 1.5Montgomery 23 POTTSGROVE SD All students 727 5.1 64.2 27.2 3.4Montgomery 23 POTTSGROVE SD Male 376 3.5 52.4 38.0 6.1Montgomery 23 POTTSGROVE SD Female 351 6.8 76.9 15.7 0.6Montgomery 23 POTTSGROVE SD White 568 5.8 67.4 23.6 3.2Montgomery 23 POTTSGROVE SD Black 103 1.9 54.4 39.8 3.9Montgomery 23 POTTSGROVE SD Hispanic 23 0.0 52.2 47.8 0.0Montgomery 23 POTTSGROVE SD Asian 21 4.8 66.7 23.8 4.8Montgomery 23 POTTSGROVE SD Native American 2Montgomery 23 POTTSGROVE SD Multi-ethnic 9Montgomery 23 POTTSGROVE SD IEP 168 7.1 41.1 41.1 10.7Montgomery 23 POTTSGROVE SD ELL 4Montgomery 23 POTTSGROVE SD Economically Disadvantaged 182 2.2 56.0 36.3 5.5Montgomery 23 POTTSTOWN SD All students 559 4.1 57.2 34.9 3.8Montgomery 23 POTTSTOWN SD Male 298 1.7 50.0 42.6 5.7Montgomery 23 POTTSTOWN SD Female 261 6.9 65.5 26.1 1.5Montgomery 23 POTTSTOWN SD White 259 6.6 58.7 32.8 1.9Montgomery 23 POTTSTOWN SD Black 228 2.6 56.6 36.0 4.8Montgomery 23 POTTSTOWN SD Hispanic 62 0.0 54.8 41.9 3.2Montgomery 23 POTTSTOWN SD Asian 3Montgomery 23 POTTSTOWN SD Native American 2Montgomery 23 POTTSTOWN SD Multi-ethnic 4Montgomery 23 POTTSTOWN SD IEP 117 0.9 21.4 62.4 15.4Montgomery 23 POTTSTOWN SD ELL 10 10.0 60.0 30.0 0.0Montgomery 23 POTTSTOWN SD Economically Disadvantaged 350 2.9 54.0 39.1 4.0
*Full Academic Year Students. Data for groups with less than 10 students assessed were replaced by blanks.Percentages were rounded to the nearest one-tenth.Proficiency percentages may not add up to 100 due to rounding. 148

The 2010 PSSA Writing District Level Proficiency Results - District Totals*
CountyIU
Number District Group
Number Scored Writing
% Advanced
Writing
% Proficient
Writing% Basic Writing
% Below Basic
WritingMontgomery 23 SOUDERTON AREA SD All students 1,532 9.9 77.0 12.4 0.7Montgomery 23 SOUDERTON AREA SD Male 800 7.0 74.1 17.8 1.1Montgomery 23 SOUDERTON AREA SD Female 732 13.1 80.1 6.6 0.3Montgomery 23 SOUDERTON AREA SD White 1,339 10.5 77.8 11.2 0.4Montgomery 23 SOUDERTON AREA SD Black 55 1.8 67.3 27.3 3.6Montgomery 23 SOUDERTON AREA SD Hispanic 50 2.0 58.0 36.0 4.0Montgomery 23 SOUDERTON AREA SD Asian 81 8.6 82.7 7.4 1.2Montgomery 23 SOUDERTON AREA SD Native American 4Montgomery 23 SOUDERTON AREA SD Multi-ethnic 3Montgomery 23 SOUDERTON AREA SD IEP 221 0.9 62.4 33.5 3.2Montgomery 23 SOUDERTON AREA SD ELL 34 0.0 61.8 32.4 5.9Montgomery 23 SOUDERTON AREA SD Economically Disadvantaged 189 5.3 67.7 25.4 1.6Montgomery 23 SPRINGFIELD TOWNSHIP SD All students 435 19.5 65.7 14.3 0.5Montgomery 23 SPRINGFIELD TOWNSHIP SD Male 222 12.2 67.1 20.3 0.5Montgomery 23 SPRINGFIELD TOWNSHIP SD Female 212 27.4 64.6 7.5 0.5Montgomery 23 SPRINGFIELD TOWNSHIP SD White 332 18.7 68.7 12.7 0.0Montgomery 23 SPRINGFIELD TOWNSHIP SD Black 81 19.8 58.0 19.8 2.5Montgomery 23 SPRINGFIELD TOWNSHIP SD Hispanic 8Montgomery 23 SPRINGFIELD TOWNSHIP SD Asian 13 30.8 53.8 15.4 0.0Montgomery 23 SPRINGFIELD TOWNSHIP SD Native American 0Montgomery 23 SPRINGFIELD TOWNSHIP SD Multi-ethnic 0Montgomery 23 SPRINGFIELD TOWNSHIP SD IEP 86 4.7 47.7 45.3 2.3Montgomery 23 SPRINGFIELD TOWNSHIP SD ELL 3Montgomery 23 SPRINGFIELD TOWNSHIP SD Economically Disadvantaged 43 9.3 67.4 20.9 2.3Montgomery 23 SPRING-FORD AREA SD All students 1,653 11.9 73.6 13.7 0.8Montgomery 23 SPRING-FORD AREA SD Male 857 8.4 71.6 18.6 1.4Montgomery 23 SPRING-FORD AREA SD Female 796 15.6 75.6 8.5 0.3Montgomery 23 SPRING-FORD AREA SD White 1,450 11.9 73.9 13.4 0.8Montgomery 23 SPRING-FORD AREA SD Black 75 9.3 66.7 21.3 2.7Montgomery 23 SPRING-FORD AREA SD Hispanic 38 7.9 65.8 23.7 2.6
*Full Academic Year Students. Data for groups with less than 10 students assessed were replaced by blanks.Percentages were rounded to the nearest one-tenth.Proficiency percentages may not add up to 100 due to rounding. 149

The 2010 PSSA Writing District Level Proficiency Results - District Totals*
CountyIU
Number District Group
Number Scored Writing
% Advanced
Writing
% Proficient
Writing% Basic Writing
% Below Basic
WritingMontgomery 23 SPRING-FORD AREA SD Asian 67 16.4 77.6 6.0 0.0Montgomery 23 SPRING-FORD AREA SD Native American 3Montgomery 23 SPRING-FORD AREA SD Multi-ethnic 20 10.0 75.0 15.0 0.0Montgomery 23 SPRING-FORD AREA SD IEP 239 2.9 56.9 35.1 5.0Montgomery 23 SPRING-FORD AREA SD ELL 2Montgomery 23 SPRING-FORD AREA SD Economically Disadvantaged 174 5.2 63.2 29.9 1.7Montgomery 23 UPPER DUBLIN SD All students 977 18.2 71.8 9.2 0.8Montgomery 23 UPPER DUBLIN SD Male 505 14.7 71.1 13.3 1.0Montgomery 23 UPPER DUBLIN SD Female 471 22.1 72.6 4.9 0.4Montgomery 23 UPPER DUBLIN SD White 725 18.5 72.8 8.4 0.3Montgomery 23 UPPER DUBLIN SD Black 98 6.1 72.4 18.4 3.1Montgomery 23 UPPER DUBLIN SD Hispanic 18 11.1 77.8 5.6 5.6Montgomery 23 UPPER DUBLIN SD Asian 123 29.3 64.2 6.5 0.0Montgomery 23 UPPER DUBLIN SD Native American 1Montgomery 23 UPPER DUBLIN SD Multi-ethnic 11 0.0 81.8 18.2 0.0Montgomery 23 UPPER DUBLIN SD IEP 102 3.9 53.9 39.2 2.9Montgomery 23 UPPER DUBLIN SD ELL 15 0.0 73.3 20.0 6.7Montgomery 23 UPPER DUBLIN SD Economically Disadvantaged 97 7.2 69.1 21.6 2.1Montgomery 23 UPPER MERION AREA SD All students 824 10.9 73.2 15.4 0.5Montgomery 23 UPPER MERION AREA SD Male 422 7.3 70.6 21.1 0.9Montgomery 23 UPPER MERION AREA SD Female 402 14.7 75.9 9.5 0.0Montgomery 23 UPPER MERION AREA SD White 581 10.7 75.6 13.4 0.3Montgomery 23 UPPER MERION AREA SD Black 77 7.8 66.2 23.4 2.6Montgomery 23 UPPER MERION AREA SD Hispanic 60 5.0 63.3 31.7 0.0Montgomery 23 UPPER MERION AREA SD Asian 100 18.0 70.0 12.0 0.0Montgomery 23 UPPER MERION AREA SD Native American 0Montgomery 23 UPPER MERION AREA SD Multi-ethnic 6Montgomery 23 UPPER MERION AREA SD IEP 123 0.8 53.7 43.1 2.4Montgomery 23 UPPER MERION AREA SD ELL 11 0.0 36.4 63.6 0.0Montgomery 23 UPPER MERION AREA SD Economically Disadvantaged 156 6.4 62.2 30.1 1.3
*Full Academic Year Students. Data for groups with less than 10 students assessed were replaced by blanks.Percentages were rounded to the nearest one-tenth.Proficiency percentages may not add up to 100 due to rounding. 150
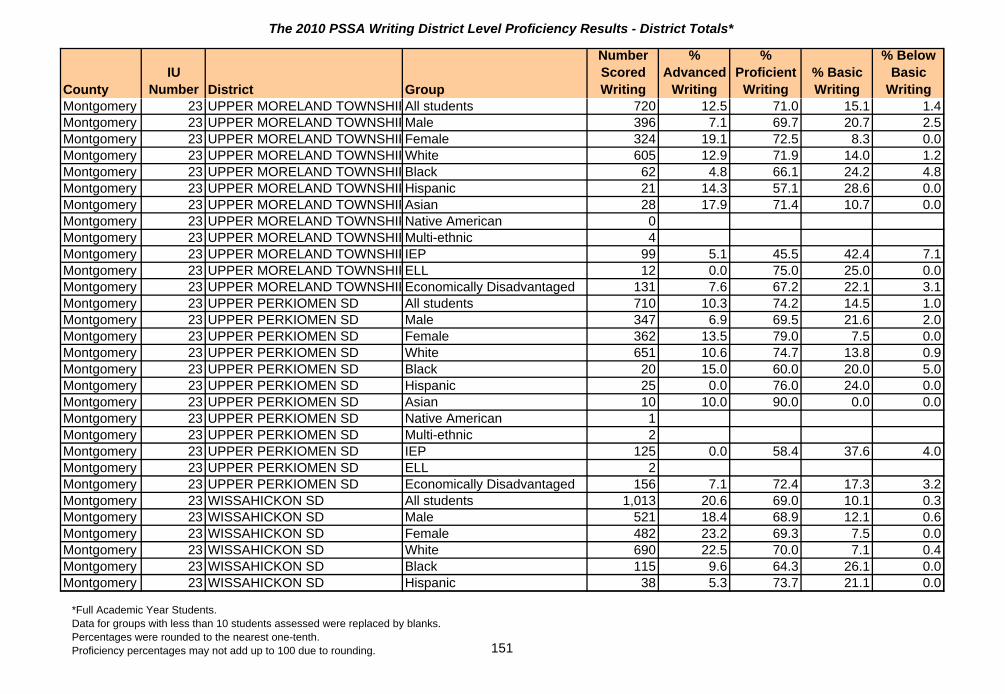
The 2010 PSSA Writing District Level Proficiency Results - District Totals*
CountyIU
Number District Group
Number Scored Writing
% Advanced
Writing
% Proficient
Writing% Basic Writing
% Below Basic
WritingMontgomery 23 UPPER MORELAND TOWNSHIPAll students 720 12.5 71.0 15.1 1.4Montgomery 23 UPPER MORELAND TOWNSHIPMale 396 7.1 69.7 20.7 2.5Montgomery 23 UPPER MORELAND TOWNSHIPFemale 324 19.1 72.5 8.3 0.0Montgomery 23 UPPER MORELAND TOWNSHIPWhite 605 12.9 71.9 14.0 1.2Montgomery 23 UPPER MORELAND TOWNSHIPBlack 62 4.8 66.1 24.2 4.8Montgomery 23 UPPER MORELAND TOWNSHIPHispanic 21 14.3 57.1 28.6 0.0Montgomery 23 UPPER MORELAND TOWNSHIPAsian 28 17.9 71.4 10.7 0.0Montgomery 23 UPPER MORELAND TOWNSHIPNative American 0Montgomery 23 UPPER MORELAND TOWNSHIPMulti-ethnic 4Montgomery 23 UPPER MORELAND TOWNSHIPIEP 99 5.1 45.5 42.4 7.1Montgomery 23 UPPER MORELAND TOWNSHIPELL 12 0.0 75.0 25.0 0.0Montgomery 23 UPPER MORELAND TOWNSHIPEconomically Disadvantaged 131 7.6 67.2 22.1 3.1Montgomery 23 UPPER PERKIOMEN SD All students 710 10.3 74.2 14.5 1.0Montgomery 23 UPPER PERKIOMEN SD Male 347 6.9 69.5 21.6 2.0Montgomery 23 UPPER PERKIOMEN SD Female 362 13.5 79.0 7.5 0.0Montgomery 23 UPPER PERKIOMEN SD White 651 10.6 74.7 13.8 0.9Montgomery 23 UPPER PERKIOMEN SD Black 20 15.0 60.0 20.0 5.0Montgomery 23 UPPER PERKIOMEN SD Hispanic 25 0.0 76.0 24.0 0.0Montgomery 23 UPPER PERKIOMEN SD Asian 10 10.0 90.0 0.0 0.0Montgomery 23 UPPER PERKIOMEN SD Native American 1Montgomery 23 UPPER PERKIOMEN SD Multi-ethnic 2Montgomery 23 UPPER PERKIOMEN SD IEP 125 0.0 58.4 37.6 4.0Montgomery 23 UPPER PERKIOMEN SD ELL 2Montgomery 23 UPPER PERKIOMEN SD Economically Disadvantaged 156 7.1 72.4 17.3 3.2Montgomery 23 WISSAHICKON SD All students 1,013 20.6 69.0 10.1 0.3Montgomery 23 WISSAHICKON SD Male 521 18.4 68.9 12.1 0.6Montgomery 23 WISSAHICKON SD Female 482 23.2 69.3 7.5 0.0Montgomery 23 WISSAHICKON SD White 690 22.5 70.0 7.1 0.4Montgomery 23 WISSAHICKON SD Black 115 9.6 64.3 26.1 0.0Montgomery 23 WISSAHICKON SD Hispanic 38 5.3 73.7 21.1 0.0
*Full Academic Year Students. Data for groups with less than 10 students assessed were replaced by blanks.Percentages were rounded to the nearest one-tenth.Proficiency percentages may not add up to 100 due to rounding. 151

The 2010 PSSA Writing District Level Proficiency Results - District Totals*
CountyIU
Number District Group
Number Scored Writing
% Advanced
Writing
% Proficient
Writing% Basic Writing
% Below Basic
WritingMontgomery 23 WISSAHICKON SD Asian 151 25.8 67.5 6.6 0.0Montgomery 23 WISSAHICKON SD Native American 5Montgomery 23 WISSAHICKON SD Multi-ethnic 4Montgomery 23 WISSAHICKON SD IEP 172 4.7 61.6 32.0 1.7Montgomery 23 WISSAHICKON SD ELL 26 0.0 65.4 34.6 0.0Montgomery 23 WISSAHICKON SD Economically Disadvantaged 112 8.9 65.2 25.0 0.9Montour 16 DANVILLE AREA SD All students 538 12.8 69.0 17.1 1.1Montour 16 DANVILLE AREA SD Male 287 11.5 67.6 19.5 1.4Montour 16 DANVILLE AREA SD Female 251 14.3 70.5 14.3 0.8Montour 16 DANVILLE AREA SD White 508 12.6 68.9 17.5 1.0Montour 16 DANVILLE AREA SD Black 6Montour 16 DANVILLE AREA SD Hispanic 5Montour 16 DANVILLE AREA SD Asian 17 17.6 82.4 0.0 0.0Montour 16 DANVILLE AREA SD Native American 2Montour 16 DANVILLE AREA SD Multi-ethnic 0Montour 16 DANVILLE AREA SD IEP 64 3.1 40.6 48.4 7.8Montour 16 DANVILLE AREA SD ELL 1Montour 16 DANVILLE AREA SD Economically Disadvantaged 114 7.0 61.4 28.9 2.6Northampton 20 BANGOR AREA SD All students 772 3.8 60.8 31.9 3.6Northampton 20 BANGOR AREA SD Male 414 2.9 48.6 42.3 6.3Northampton 20 BANGOR AREA SD Female 357 4.8 75.1 19.6 0.6Northampton 20 BANGOR AREA SD White 715 3.9 60.6 32.3 3.2Northampton 20 BANGOR AREA SD Black 17 0.0 52.9 41.2 5.9Northampton 20 BANGOR AREA SD Hispanic 32 3.1 65.6 18.8 12.5Northampton 20 BANGOR AREA SD Asian 3Northampton 20 BANGOR AREA SD Native American 1Northampton 20 BANGOR AREA SD Multi-ethnic 3Northampton 20 BANGOR AREA SD IEP 117 0.0 14.5 67.5 17.9Northampton 20 BANGOR AREA SD ELL 4Northampton 20 BANGOR AREA SD Economically Disadvantaged 255 2.4 49.0 42.0 6.7
*Full Academic Year Students. Data for groups with less than 10 students assessed were replaced by blanks.Percentages were rounded to the nearest one-tenth.Proficiency percentages may not add up to 100 due to rounding. 152

The 2010 PSSA Writing District Level Proficiency Results - District Totals*
CountyIU
Number District Group
Number Scored Writing
% Advanced
Writing
% Proficient
Writing% Basic Writing
% Below Basic
WritingNorthampton 20 BETHLEHEM AREA SD All students 3,301 10.7 63.9 23.7 1.7Northampton 20 BETHLEHEM AREA SD Male 1,723 7.8 59.6 30.1 2.6Northampton 20 BETHLEHEM AREA SD Female 1,575 13.8 68.6 16.7 0.8Northampton 20 BETHLEHEM AREA SD White 1,800 13.9 69.2 15.9 1.1Northampton 20 BETHLEHEM AREA SD Black 323 8.0 60.1 31.3 0.6Northampton 20 BETHLEHEM AREA SD Hispanic 1,030 4.3 56.9 35.5 3.3Northampton 20 BETHLEHEM AREA SD Asian 106 25.5 59.4 13.2 1.9Northampton 20 BETHLEHEM AREA SD Native American 4Northampton 20 BETHLEHEM AREA SD Multi-ethnic 35 11.4 51.4 37.1 0.0Northampton 20 BETHLEHEM AREA SD IEP 458 0.9 37.1 51.5 10.5Northampton 20 BETHLEHEM AREA SD ELL 202 1.0 33.2 61.4 4.5Northampton 20 BETHLEHEM AREA SD Economically Disadvantaged 1,405 4.3 59.4 33.5 2.8Northampton 20 EASTON AREA SD All students 2,031 6.6 71.4 20.3 1.6Northampton 20 EASTON AREA SD Male 1,044 3.8 67.4 26.1 2.6Northampton 20 EASTON AREA SD Female 987 9.6 75.6 14.2 0.6Northampton 20 EASTON AREA SD White 1,233 7.9 74.6 16.1 1.5Northampton 20 EASTON AREA SD Black 403 3.5 64.5 29.8 2.2Northampton 20 EASTON AREA SD Hispanic 309 4.2 66.7 27.2 1.9Northampton 20 EASTON AREA SD Asian 78 10.3 76.9 12.8 0.0Northampton 20 EASTON AREA SD Native American 2Northampton 20 EASTON AREA SD Multi-ethnic 6Northampton 20 EASTON AREA SD IEP 300 0.7 35.3 55.0 9.0Northampton 20 EASTON AREA SD ELL 39 0.0 43.6 51.3 5.1Northampton 20 EASTON AREA SD Economically Disadvantaged 718 2.5 64.6 29.8 3.1Northampton 20 NAZARETH AREA SD All students 1,103 11.3 72.3 15.5 0.9Northampton 20 NAZARETH AREA SD Male 588 8.0 70.9 19.7 1.4Northampton 20 NAZARETH AREA SD Female 514 15.2 73.9 10.7 0.2Northampton 20 NAZARETH AREA SD White 1,033 11.5 72.3 15.3 0.9Northampton 20 NAZARETH AREA SD Black 28 7.1 82.1 10.7 0.0Northampton 20 NAZARETH AREA SD Hispanic 25 8.0 64.0 28.0 0.0
*Full Academic Year Students. Data for groups with less than 10 students assessed were replaced by blanks.Percentages were rounded to the nearest one-tenth.Proficiency percentages may not add up to 100 due to rounding. 153

The 2010 PSSA Writing District Level Proficiency Results - District Totals*
CountyIU
Number District Group
Number Scored Writing
% Advanced
Writing
% Proficient
Writing% Basic Writing
% Below Basic
WritingNorthampton 20 NAZARETH AREA SD Asian 16 12.5 68.8 18.8 0.0Northampton 20 NAZARETH AREA SD Native American 0Northampton 20 NAZARETH AREA SD Multi-ethnic 0Northampton 20 NAZARETH AREA SD IEP 141 0.0 47.5 47.5 5.0Northampton 20 NAZARETH AREA SD ELL 1Northampton 20 NAZARETH AREA SD Economically Disadvantaged 125 2.4 66.4 31.2 0.0Northampton 20 NORTHAMPTON AREA SD All students 1,278 7.4 64.9 25.7 2.0Northampton 20 NORTHAMPTON AREA SD Male 683 5.3 58.3 33.7 2.8Northampton 20 NORTHAMPTON AREA SD Female 593 9.8 72.8 16.4 1.0Northampton 20 NORTHAMPTON AREA SD White 1,200 7.7 65.0 25.6 1.8Northampton 20 NORTHAMPTON AREA SD Black 24 4.2 58.3 33.3 4.2Northampton 20 NORTHAMPTON AREA SD Hispanic 37 0.0 70.3 27.0 2.7Northampton 20 NORTHAMPTON AREA SD Asian 7Northampton 20 NORTHAMPTON AREA SD Native American 1Northampton 20 NORTHAMPTON AREA SD Multi-ethnic 7Northampton 20 NORTHAMPTON AREA SD IEP 210 0.5 37.1 51.4 11.0Northampton 20 NORTHAMPTON AREA SD ELL 1Northampton 20 NORTHAMPTON AREA SD Economically Disadvantaged 220 1.4 59.1 36.4 3.2Northampton 20 PEN ARGYL AREA SD All students 391 14.3 67.8 16.1 1.8Northampton 20 PEN ARGYL AREA SD Male 195 11.3 63.6 22.1 3.1Northampton 20 PEN ARGYL AREA SD Female 196 17.3 71.9 10.2 0.5Northampton 20 PEN ARGYL AREA SD White 368 14.7 67.1 16.6 1.6Northampton 20 PEN ARGYL AREA SD Black 4Northampton 20 PEN ARGYL AREA SD Hispanic 13 7.7 69.2 15.4 7.7Northampton 20 PEN ARGYL AREA SD Asian 4Northampton 20 PEN ARGYL AREA SD Native American 0Northampton 20 PEN ARGYL AREA SD Multi-ethnic 2Northampton 20 PEN ARGYL AREA SD IEP 59 1.7 35.6 52.5 10.2Northampton 20 PEN ARGYL AREA SD ELL 0Northampton 20 PEN ARGYL AREA SD Economically Disadvantaged 91 5.5 67.0 24.2 3.3
*Full Academic Year Students. Data for groups with less than 10 students assessed were replaced by blanks.Percentages were rounded to the nearest one-tenth.Proficiency percentages may not add up to 100 due to rounding. 154

The 2010 PSSA Writing District Level Proficiency Results - District Totals*
CountyIU
Number District Group
Number Scored Writing
% Advanced
Writing
% Proficient
Writing% Basic Writing
% Below Basic
WritingNorthampton 20 SAUCON VALLEY SD All students 547 15.7 70.7 13.3 0.2Northampton 20 SAUCON VALLEY SD Male 272 9.6 72.4 18.0 0.0Northampton 20 SAUCON VALLEY SD Female 275 21.8 69.1 8.7 0.4Northampton 20 SAUCON VALLEY SD White 499 15.6 71.1 13.0 0.2Northampton 20 SAUCON VALLEY SD Black 18 5.6 83.3 11.1 0.0Northampton 20 SAUCON VALLEY SD Hispanic 17 11.8 52.9 35.3 0.0Northampton 20 SAUCON VALLEY SD Asian 11 45.5 54.5 0.0 0.0Northampton 20 SAUCON VALLEY SD Native American 0Northampton 20 SAUCON VALLEY SD Multi-ethnic 2Northampton 20 SAUCON VALLEY SD IEP 65 3.1 44.6 50.8 1.5Northampton 20 SAUCON VALLEY SD ELL 1Northampton 20 SAUCON VALLEY SD Economically Disadvantaged 73 13.7 67.1 19.2 0.0Northampton 20 WILSON AREA SD All students 498 16.1 61.0 21.3 1.6Northampton 20 WILSON AREA SD Male 281 13.2 57.3 27.8 1.8Northampton 20 WILSON AREA SD Female 217 19.8 65.9 12.9 1.4Northampton 20 WILSON AREA SD White 406 17.5 59.6 21.7 1.2Northampton 20 WILSON AREA SD Black 47 4.3 72.3 21.3 2.1Northampton 20 WILSON AREA SD Hispanic 32 9.4 62.5 21.9 6.3Northampton 20 WILSON AREA SD Asian 12 33.3 66.7 0.0 0.0Northampton 20 WILSON AREA SD Native American 1Northampton 20 WILSON AREA SD Multi-ethnic 0Northampton 20 WILSON AREA SD IEP 84 1.2 34.5 54.8 9.5Northampton 20 WILSON AREA SD ELL 10 0.0 40.0 50.0 10.0Northampton 20 WILSON AREA SD Economically Disadvantaged 138 8.0 56.5 32.6 2.9Northumberla 16 LINE MOUNTAIN SD All students 235 6.8 71.1 20.0 2.1Northumberla 16 LINE MOUNTAIN SD Male 118 4.2 63.6 28.0 4.2Northumberla 16 LINE MOUNTAIN SD Female 117 9.4 78.6 12.0 0.0Northumberla 16 LINE MOUNTAIN SD White 230 7.0 71.3 20.0 1.7Northumberla 16 LINE MOUNTAIN SD Black 2Northumberla 16 LINE MOUNTAIN SD Hispanic 3
*Full Academic Year Students. Data for groups with less than 10 students assessed were replaced by blanks.Percentages were rounded to the nearest one-tenth.Proficiency percentages may not add up to 100 due to rounding. 155

The 2010 PSSA Writing District Level Proficiency Results - District Totals*
CountyIU
Number District Group
Number Scored Writing
% Advanced
Writing
% Proficient
Writing% Basic Writing
% Below Basic
WritingNorthumberla 16 LINE MOUNTAIN SD Asian 0Northumberla 16 LINE MOUNTAIN SD Native American 0Northumberla 16 LINE MOUNTAIN SD Multi-ethnic 0Northumberla 16 LINE MOUNTAIN SD IEP 30 0.0 26.7 56.7 16.7Northumberla 16 LINE MOUNTAIN SD ELL 0Northumberla 16 LINE MOUNTAIN SD Economically Disadvantaged 70 1.4 62.9 32.9 2.9Northumberla 16 MILTON AREA SD All students 497 7.6 64.8 24.7 2.8Northumberla 16 MILTON AREA SD Male 269 5.2 58.4 31.6 4.8Northumberla 16 MILTON AREA SD Female 227 10.6 72.2 16.7 0.4Northumberla 16 MILTON AREA SD White 442 8.4 66.1 22.6 2.9Northumberla 16 MILTON AREA SD Black 27 3.7 48.1 44.4 3.7Northumberla 16 MILTON AREA SD Hispanic 21 0.0 57.1 42.9 0.0Northumberla 16 MILTON AREA SD Asian 2Northumberla 16 MILTON AREA SD Native American 2Northumberla 16 MILTON AREA SD Multi-ethnic 0Northumberla 16 MILTON AREA SD IEP 64 0.0 18.8 67.2 14.1Northumberla 16 MILTON AREA SD ELL 11 0.0 36.4 63.6 0.0Northumberla 16 MILTON AREA SD Economically Disadvantaged 236 4.2 58.1 35.2 2.5Northumberla 16 MOUNT CARMEL AREA SD All students 377 6.1 65.3 25.5 3.2Northumberla 16 MOUNT CARMEL AREA SD Male 197 6.1 56.3 32.5 5.1Northumberla 16 MOUNT CARMEL AREA SD Female 179 6.1 75.4 17.3 1.1Northumberla 16 MOUNT CARMEL AREA SD White 369 6.2 65.0 25.5 3.3Northumberla 16 MOUNT CARMEL AREA SD Black 5Northumberla 16 MOUNT CARMEL AREA SD Hispanic 1Northumberla 16 MOUNT CARMEL AREA SD Asian 1Northumberla 16 MOUNT CARMEL AREA SD Native American 0Northumberla 16 MOUNT CARMEL AREA SD Multi-ethnic 0Northumberla 16 MOUNT CARMEL AREA SD IEP 48 0.0 29.2 50.0 20.8Northumberla 16 MOUNT CARMEL AREA SD ELL 0Northumberla 16 MOUNT CARMEL AREA SD Economically Disadvantaged 176 3.4 56.8 33.0 6.8
*Full Academic Year Students. Data for groups with less than 10 students assessed were replaced by blanks.Percentages were rounded to the nearest one-tenth.Proficiency percentages may not add up to 100 due to rounding. 156

The 2010 PSSA Writing District Level Proficiency Results - District Totals*
CountyIU
Number District Group
Number Scored Writing
% Advanced
Writing
% Proficient
Writing% Basic Writing
% Below Basic
WritingNorthumberla 16 SHAMOKIN AREA SD All students 494 6.3 72.9 18.4 2.4Northumberla 16 SHAMOKIN AREA SD Male 241 4.6 67.2 24.9 3.3Northumberla 16 SHAMOKIN AREA SD Female 252 7.9 78.6 11.9 1.6Northumberla 16 SHAMOKIN AREA SD White 471 6.6 72.8 18.0 2.5Northumberla 16 SHAMOKIN AREA SD Black 10 0.0 80.0 20.0 0.0Northumberla 16 SHAMOKIN AREA SD Hispanic 8Northumberla 16 SHAMOKIN AREA SD Asian 1Northumberla 16 SHAMOKIN AREA SD Native American 3Northumberla 16 SHAMOKIN AREA SD Multi-ethnic 0Northumberla 16 SHAMOKIN AREA SD IEP 60 1.7 51.7 31.7 15.0Northumberla 16 SHAMOKIN AREA SD ELL 1Northumberla 16 SHAMOKIN AREA SD Economically Disadvantaged 257 3.5 70.4 22.6 3.5Northumberla 16 SHIKELLAMY SD All students 607 9.1 73.3 17.3 0.3Northumberla 16 SHIKELLAMY SD Male 302 5.6 68.9 24.8 0.7Northumberla 16 SHIKELLAMY SD Female 305 12.5 77.7 9.8 0.0Northumberla 16 SHIKELLAMY SD White 549 9.3 74.1 16.2 0.4Northumberla 16 SHIKELLAMY SD Black 20 0.0 75.0 25.0 0.0Northumberla 16 SHIKELLAMY SD Hispanic 26 11.5 57.7 30.8 0.0Northumberla 16 SHIKELLAMY SD Asian 5Northumberla 16 SHIKELLAMY SD Native American 1Northumberla 16 SHIKELLAMY SD Multi-ethnic 6Northumberla 16 SHIKELLAMY SD IEP 69 2.9 49.3 46.4 1.4Northumberla 16 SHIKELLAMY SD ELL 4Northumberla 16 SHIKELLAMY SD Economically Disadvantaged 244 5.3 69.3 25.4 0.0Northumberla 16 WARRIOR RUN SD All students 352 11.6 68.8 17.9 1.7Northumberla 16 WARRIOR RUN SD Male 180 8.9 67.2 20.6 3.3Northumberla 16 WARRIOR RUN SD Female 172 14.5 70.3 15.1 0.0Northumberla 16 WARRIOR RUN SD White 344 11.9 68.3 18.3 1.5Northumberla 16 WARRIOR RUN SD Black 4Northumberla 16 WARRIOR RUN SD Hispanic 3
*Full Academic Year Students. Data for groups with less than 10 students assessed were replaced by blanks.Percentages were rounded to the nearest one-tenth.Proficiency percentages may not add up to 100 due to rounding. 157

The 2010 PSSA Writing District Level Proficiency Results - District Totals*
CountyIU
Number District Group
Number Scored Writing
% Advanced
Writing
% Proficient
Writing% Basic Writing
% Below Basic
WritingNorthumberla 16 WARRIOR RUN SD Asian 1Northumberla 16 WARRIOR RUN SD Native American 0Northumberla 16 WARRIOR RUN SD Multi-ethnic 0Northumberla 16 WARRIOR RUN SD IEP 38 2.6 36.8 44.7 15.8Northumberla 16 WARRIOR RUN SD ELL 0Northumberla 16 WARRIOR RUN SD Economically Disadvantaged 91 9.9 60.4 28.6 1.1Perry 15 GREENWOOD SD All students 181 7.7 86.7 5.5 0.0Perry 15 GREENWOOD SD Male 87 8.0 87.4 4.6 0.0Perry 15 GREENWOOD SD Female 94 7.4 86.2 6.4 0.0Perry 15 GREENWOOD SD White 176 8.0 86.4 5.7 0.0Perry 15 GREENWOOD SD Black 0Perry 15 GREENWOOD SD Hispanic 1Perry 15 GREENWOOD SD Asian 2Perry 15 GREENWOOD SD Native American 2Perry 15 GREENWOOD SD Multi-ethnic 0Perry 15 GREENWOOD SD IEP 23 0.0 69.6 30.4 0.0Perry 15 GREENWOOD SD ELL 0Perry 15 GREENWOOD SD Economically Disadvantaged 38 2.6 89.5 7.9 0.0Perry 15 NEWPORT SD All students 241 4.1 51.5 41.5 2.9Perry 15 NEWPORT SD Male 121 3.3 45.5 47.1 4.1Perry 15 NEWPORT SD Female 120 5.0 57.5 35.8 1.7Perry 15 NEWPORT SD White 235 4.3 51.9 40.9 3.0Perry 15 NEWPORT SD Black 2Perry 15 NEWPORT SD Hispanic 4Perry 15 NEWPORT SD Asian 0Perry 15 NEWPORT SD Native American 0Perry 15 NEWPORT SD Multi-ethnic 0Perry 15 NEWPORT SD IEP 52 0.0 15.4 71.2 13.5Perry 15 NEWPORT SD ELL 0Perry 15 NEWPORT SD Economically Disadvantaged 82 4.9 30.5 59.8 4.9
*Full Academic Year Students. Data for groups with less than 10 students assessed were replaced by blanks.Percentages were rounded to the nearest one-tenth.Proficiency percentages may not add up to 100 due to rounding. 158

The 2010 PSSA Writing District Level Proficiency Results - District Totals*
CountyIU
Number District Group
Number Scored Writing
% Advanced
Writing
% Proficient
Writing% Basic Writing
% Below Basic
WritingPerry 15 SUSQUENITA SD All students 443 5.6 62.1 29.8 2.5Perry 15 SUSQUENITA SD Male 240 2.5 56.7 37.9 2.9Perry 15 SUSQUENITA SD Female 203 9.4 68.5 20.2 2.0Perry 15 SUSQUENITA SD White 430 5.8 62.6 29.1 2.6Perry 15 SUSQUENITA SD Black 3Perry 15 SUSQUENITA SD Hispanic 7Perry 15 SUSQUENITA SD Asian 1Perry 15 SUSQUENITA SD Native American 0Perry 15 SUSQUENITA SD Multi-ethnic 2Perry 15 SUSQUENITA SD IEP 85 0.0 37.6 54.1 8.2Perry 15 SUSQUENITA SD ELL 0Perry 15 SUSQUENITA SD Economically Disadvantaged 129 0.8 53.5 38.8 7.0Perry 15 WEST PERRY SD All students 630 8.6 62.4 28.4 0.6Perry 15 WEST PERRY SD Male 315 6.0 54.9 38.4 0.6Perry 15 WEST PERRY SD Female 314 11.1 69.7 18.5 0.6Perry 15 WEST PERRY SD White 618 8.6 62.3 28.5 0.6Perry 15 WEST PERRY SD Black 9Perry 15 WEST PERRY SD Hispanic 2Perry 15 WEST PERRY SD Asian 0Perry 15 WEST PERRY SD Native American 0Perry 15 WEST PERRY SD Multi-ethnic 0Perry 15 WEST PERRY SD IEP 109 1.8 36.7 58.7 2.8Perry 15 WEST PERRY SD ELL 0Perry 15 WEST PERRY SD Economically Disadvantaged 188 3.2 54.3 40.4 2.1Philadelphia 26 PHILADELPHIA CITY SD All students 30,685 3.6 45.5 45.0 5.9Philadelphia 26 PHILADELPHIA CITY SD Male 15,155 2.4 38.6 50.6 8.4Philadelphia 26 PHILADELPHIA CITY SD Female 15,405 4.8 52.4 39.4 3.4Philadelphia 26 PHILADELPHIA CITY SD White 4,167 7.0 54.3 34.6 4.1Philadelphia 26 PHILADELPHIA CITY SD Black 18,657 2.5 43.3 48.0 6.3Philadelphia 26 PHILADELPHIA CITY SD Hispanic 5,190 2.0 40.3 49.9 7.8
*Full Academic Year Students. Data for groups with less than 10 students assessed were replaced by blanks.Percentages were rounded to the nearest one-tenth.Proficiency percentages may not add up to 100 due to rounding. 159

The 2010 PSSA Writing District Level Proficiency Results - District Totals*
CountyIU
Number District Group
Number Scored Writing
% Advanced
Writing
% Proficient
Writing% Basic Writing
% Below Basic
WritingPhiladelphia 26 PHILADELPHIA CITY SD Asian 2,066 10.8 60.8 26.5 1.9Philadelphia 26 PHILADELPHIA CITY SD Native American 54 3.7 59.3 35.2 1.9Philadelphia 26 PHILADELPHIA CITY SD Multi-ethnic 411 4.1 49.9 42.6 3.4Philadelphia 26 PHILADELPHIA CITY SD IEP 4,313 0.2 14.5 61.5 23.8Philadelphia 26 PHILADELPHIA CITY SD ELL 1,887 0.5 30.1 57.8 11.6Philadelphia 26 PHILADELPHIA CITY SD Economically Disadvantaged 24,442 2.2 42.9 48.4 6.4Pike 20 DELAWARE VALLEY SD All students 1,259 12.3 67.0 20.3 0.4Pike 20 DELAWARE VALLEY SD Male 637 7.7 64.7 27.2 0.5Pike 20 DELAWARE VALLEY SD Female 622 17.0 69.3 13.3 0.3Pike 20 DELAWARE VALLEY SD White 1,096 12.4 67.2 20.1 0.4Pike 20 DELAWARE VALLEY SD Black 48 8.3 72.9 18.8 0.0Pike 20 DELAWARE VALLEY SD Hispanic 87 11.5 64.4 23.0 1.1Pike 20 DELAWARE VALLEY SD Asian 11 27.3 63.6 9.1 0.0Pike 20 DELAWARE VALLEY SD Native American 1Pike 20 DELAWARE VALLEY SD Multi-ethnic 16 12.5 50.0 37.5 0.0Pike 20 DELAWARE VALLEY SD IEP 168 0.0 51.8 45.8 2.4Pike 20 DELAWARE VALLEY SD ELL 3Pike 20 DELAWARE VALLEY SD Economically Disadvantaged 320 8.1 63.8 27.2 0.9Potter 9 AUSTIN AREA SD All students 46 2.2 58.7 39.1 0.0Potter 9 AUSTIN AREA SD Male 25 4.0 48.0 48.0 0.0Potter 9 AUSTIN AREA SD Female 21 0.0 71.4 28.6 0.0Potter 9 AUSTIN AREA SD White 45 2.2 57.8 40.0 0.0Potter 9 AUSTIN AREA SD Black 1Potter 9 AUSTIN AREA SD Hispanic 0Potter 9 AUSTIN AREA SD Asian 0Potter 9 AUSTIN AREA SD Native American 0Potter 9 AUSTIN AREA SD Multi-ethnic 0Potter 9 AUSTIN AREA SD IEP 13 0.0 23.1 76.9 0.0Potter 9 AUSTIN AREA SD ELL 0Potter 9 AUSTIN AREA SD Economically Disadvantaged 11 0.0 36.4 63.6 0.0
*Full Academic Year Students. Data for groups with less than 10 students assessed were replaced by blanks.Percentages were rounded to the nearest one-tenth.Proficiency percentages may not add up to 100 due to rounding. 160

The 2010 PSSA Writing District Level Proficiency Results - District Totals*
CountyIU
Number District Group
Number Scored Writing
% Advanced
Writing
% Proficient
Writing% Basic Writing
% Below Basic
WritingPotter 9 COUDERSPORT AREA SD All students 209 2.9 67.5 27.8 1.9Potter 9 COUDERSPORT AREA SD Male 106 2.8 61.3 32.1 3.8Potter 9 COUDERSPORT AREA SD Female 103 2.9 73.8 23.3 0.0Potter 9 COUDERSPORT AREA SD White 190 3.2 66.8 27.9 2.1Potter 9 COUDERSPORT AREA SD Black 3Potter 9 COUDERSPORT AREA SD Hispanic 7Potter 9 COUDERSPORT AREA SD Asian 7Potter 9 COUDERSPORT AREA SD Native American 2Potter 9 COUDERSPORT AREA SD Multi-ethnic 0Potter 9 COUDERSPORT AREA SD IEP 24 0.0 12.5 70.8 16.7Potter 9 COUDERSPORT AREA SD ELL 0Potter 9 COUDERSPORT AREA SD Economically Disadvantaged 57 0.0 59.6 38.6 1.8Potter 9 GALETON AREA SD All students 86 1.2 58.1 38.4 2.3Potter 9 GALETON AREA SD Male 38 2.6 60.5 36.8 0.0Potter 9 GALETON AREA SD Female 48 0.0 56.3 39.6 4.2Potter 9 GALETON AREA SD White 78 1.3 57.7 38.5 2.6Potter 9 GALETON AREA SD Black 3Potter 9 GALETON AREA SD Hispanic 1Potter 9 GALETON AREA SD Asian 4Potter 9 GALETON AREA SD Native American 0Potter 9 GALETON AREA SD Multi-ethnic 0Potter 9 GALETON AREA SD IEP 11 0.0 27.3 63.6 9.1Potter 9 GALETON AREA SD ELL 0Potter 9 GALETON AREA SD Economically Disadvantaged 52 0.0 55.8 40.4 3.8Potter 9 NORTHERN POTTER SD All students 116 9.5 57.8 29.3 3.4Potter 9 NORTHERN POTTER SD Male 54 14.8 44.4 35.2 5.6Potter 9 NORTHERN POTTER SD Female 61 4.9 68.9 24.6 1.6Potter 9 NORTHERN POTTER SD White 115 9.6 57.4 29.6 3.5Potter 9 NORTHERN POTTER SD Black 0Potter 9 NORTHERN POTTER SD Hispanic 0
*Full Academic Year Students. Data for groups with less than 10 students assessed were replaced by blanks.Percentages were rounded to the nearest one-tenth.Proficiency percentages may not add up to 100 due to rounding. 161

The 2010 PSSA Writing District Level Proficiency Results - District Totals*
CountyIU
Number District Group
Number Scored Writing
% Advanced
Writing
% Proficient
Writing% Basic Writing
% Below Basic
WritingPotter 9 NORTHERN POTTER SD Asian 0Potter 9 NORTHERN POTTER SD Native American 0Potter 9 NORTHERN POTTER SD Multi-ethnic 0Potter 9 NORTHERN POTTER SD IEP 16 0.0 25.0 56.3 18.8Potter 9 NORTHERN POTTER SD ELL 0Potter 9 NORTHERN POTTER SD Economically Disadvantaged 51 7.8 60.8 27.5 3.9Potter 9 OSWAYO VALLEY SD All students 122 8.2 50.8 40.2 0.8Potter 9 OSWAYO VALLEY SD Male 61 9.8 42.6 45.9 1.6Potter 9 OSWAYO VALLEY SD Female 61 6.6 59.0 34.4 0.0Potter 9 OSWAYO VALLEY SD White 122 8.2 50.8 40.2 0.8Potter 9 OSWAYO VALLEY SD Black 0Potter 9 OSWAYO VALLEY SD Hispanic 0Potter 9 OSWAYO VALLEY SD Asian 0Potter 9 OSWAYO VALLEY SD Native American 0Potter 9 OSWAYO VALLEY SD Multi-ethnic 0Potter 9 OSWAYO VALLEY SD IEP 15 0.0 20.0 73.3 6.7Potter 9 OSWAYO VALLEY SD ELL 0Potter 9 OSWAYO VALLEY SD Economically Disadvantaged 53 1.9 49.1 49.1 0.0Schuylkill 29 BLUE MOUNTAIN SD All students 662 11.2 71.3 16.2 1.4Schuylkill 29 BLUE MOUNTAIN SD Male 340 7.1 69.1 21.8 2.1Schuylkill 29 BLUE MOUNTAIN SD Female 322 15.5 73.6 10.2 0.6Schuylkill 29 BLUE MOUNTAIN SD White 628 11.1 71.7 15.9 1.3Schuylkill 29 BLUE MOUNTAIN SD Black 4Schuylkill 29 BLUE MOUNTAIN SD Hispanic 19 15.8 52.6 26.3 5.3Schuylkill 29 BLUE MOUNTAIN SD Asian 4Schuylkill 29 BLUE MOUNTAIN SD Native American 0Schuylkill 29 BLUE MOUNTAIN SD Multi-ethnic 7Schuylkill 29 BLUE MOUNTAIN SD IEP 101 2.0 41.6 50.5 5.9Schuylkill 29 BLUE MOUNTAIN SD ELL 1Schuylkill 29 BLUE MOUNTAIN SD Economically Disadvantaged 131 6.1 65.6 26.0 2.3
*Full Academic Year Students. Data for groups with less than 10 students assessed were replaced by blanks.Percentages were rounded to the nearest one-tenth.Proficiency percentages may not add up to 100 due to rounding. 162
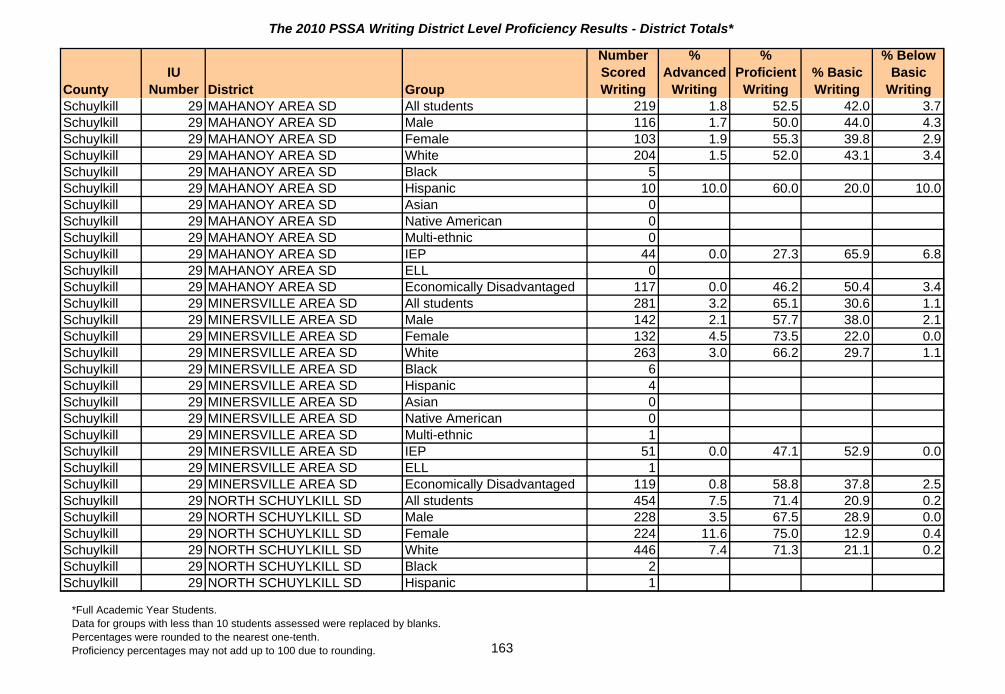
The 2010 PSSA Writing District Level Proficiency Results - District Totals*
CountyIU
Number District Group
Number Scored Writing
% Advanced
Writing
% Proficient
Writing% Basic Writing
% Below Basic
WritingSchuylkill 29 MAHANOY AREA SD All students 219 1.8 52.5 42.0 3.7Schuylkill 29 MAHANOY AREA SD Male 116 1.7 50.0 44.0 4.3Schuylkill 29 MAHANOY AREA SD Female 103 1.9 55.3 39.8 2.9Schuylkill 29 MAHANOY AREA SD White 204 1.5 52.0 43.1 3.4Schuylkill 29 MAHANOY AREA SD Black 5Schuylkill 29 MAHANOY AREA SD Hispanic 10 10.0 60.0 20.0 10.0Schuylkill 29 MAHANOY AREA SD Asian 0Schuylkill 29 MAHANOY AREA SD Native American 0Schuylkill 29 MAHANOY AREA SD Multi-ethnic 0Schuylkill 29 MAHANOY AREA SD IEP 44 0.0 27.3 65.9 6.8Schuylkill 29 MAHANOY AREA SD ELL 0Schuylkill 29 MAHANOY AREA SD Economically Disadvantaged 117 0.0 46.2 50.4 3.4Schuylkill 29 MINERSVILLE AREA SD All students 281 3.2 65.1 30.6 1.1Schuylkill 29 MINERSVILLE AREA SD Male 142 2.1 57.7 38.0 2.1Schuylkill 29 MINERSVILLE AREA SD Female 132 4.5 73.5 22.0 0.0Schuylkill 29 MINERSVILLE AREA SD White 263 3.0 66.2 29.7 1.1Schuylkill 29 MINERSVILLE AREA SD Black 6Schuylkill 29 MINERSVILLE AREA SD Hispanic 4Schuylkill 29 MINERSVILLE AREA SD Asian 0Schuylkill 29 MINERSVILLE AREA SD Native American 0Schuylkill 29 MINERSVILLE AREA SD Multi-ethnic 1Schuylkill 29 MINERSVILLE AREA SD IEP 51 0.0 47.1 52.9 0.0Schuylkill 29 MINERSVILLE AREA SD ELL 1Schuylkill 29 MINERSVILLE AREA SD Economically Disadvantaged 119 0.8 58.8 37.8 2.5Schuylkill 29 NORTH SCHUYLKILL SD All students 454 7.5 71.4 20.9 0.2Schuylkill 29 NORTH SCHUYLKILL SD Male 228 3.5 67.5 28.9 0.0Schuylkill 29 NORTH SCHUYLKILL SD Female 224 11.6 75.0 12.9 0.4Schuylkill 29 NORTH SCHUYLKILL SD White 446 7.4 71.3 21.1 0.2Schuylkill 29 NORTH SCHUYLKILL SD Black 2Schuylkill 29 NORTH SCHUYLKILL SD Hispanic 1
*Full Academic Year Students. Data for groups with less than 10 students assessed were replaced by blanks.Percentages were rounded to the nearest one-tenth.Proficiency percentages may not add up to 100 due to rounding. 163

The 2010 PSSA Writing District Level Proficiency Results - District Totals*
CountyIU
Number District Group
Number Scored Writing
% Advanced
Writing
% Proficient
Writing% Basic Writing
% Below Basic
WritingSchuylkill 29 NORTH SCHUYLKILL SD Asian 3Schuylkill 29 NORTH SCHUYLKILL SD Native American 0Schuylkill 29 NORTH SCHUYLKILL SD Multi-ethnic 0Schuylkill 29 NORTH SCHUYLKILL SD IEP 63 0.0 54.0 44.4 1.6Schuylkill 29 NORTH SCHUYLKILL SD ELL 1Schuylkill 29 NORTH SCHUYLKILL SD Economically Disadvantaged 167 6.6 68.9 24.0 0.6Schuylkill 29 PINE GROVE AREA SD All students 362 6.1 66.6 24.0 3.3Schuylkill 29 PINE GROVE AREA SD Male 194 3.1 60.3 30.4 6.2Schuylkill 29 PINE GROVE AREA SD Female 168 9.5 73.8 16.7 0.0Schuylkill 29 PINE GROVE AREA SD White 355 5.9 67.0 23.7 3.4Schuylkill 29 PINE GROVE AREA SD Black 3Schuylkill 29 PINE GROVE AREA SD Hispanic 2Schuylkill 29 PINE GROVE AREA SD Asian 1Schuylkill 29 PINE GROVE AREA SD Native American 1Schuylkill 29 PINE GROVE AREA SD Multi-ethnic 0Schuylkill 29 PINE GROVE AREA SD IEP 49 2.0 32.7 51.0 14.3Schuylkill 29 PINE GROVE AREA SD ELL 0Schuylkill 29 PINE GROVE AREA SD Economically Disadvantaged 84 3.6 48.8 41.7 6.0Schuylkill 29 POTTSVILLE AREA SD All students 628 8.8 65.6 24.0 1.6Schuylkill 29 POTTSVILLE AREA SD Male 304 6.3 62.2 28.9 2.6Schuylkill 29 POTTSVILLE AREA SD Female 320 11.3 68.4 19.7 0.6Schuylkill 29 POTTSVILLE AREA SD White 576 9.4 66.0 23.3 1.4Schuylkill 29 POTTSVILLE AREA SD Black 32 0.0 56.3 40.6 3.1Schuylkill 29 POTTSVILLE AREA SD Hispanic 10 0.0 60.0 30.0 10.0Schuylkill 29 POTTSVILLE AREA SD Asian 6Schuylkill 29 POTTSVILLE AREA SD Native American 0Schuylkill 29 POTTSVILLE AREA SD Multi-ethnic 0Schuylkill 29 POTTSVILLE AREA SD IEP 79 1.3 35.4 51.9 11.4Schuylkill 29 POTTSVILLE AREA SD ELL 2Schuylkill 29 POTTSVILLE AREA SD Economically Disadvantaged 297 4.7 57.6 35.0 2.7
*Full Academic Year Students. Data for groups with less than 10 students assessed were replaced by blanks.Percentages were rounded to the nearest one-tenth.Proficiency percentages may not add up to 100 due to rounding. 164

The 2010 PSSA Writing District Level Proficiency Results - District Totals*
CountyIU
Number District Group
Number Scored Writing
% Advanced
Writing
% Proficient
Writing% Basic Writing
% Below Basic
WritingSchuylkill 29 SAINT CLAIR AREA SD All students 100 2.0 49.0 47.0 2.0Schuylkill 29 SAINT CLAIR AREA SD Male 43 2.3 34.9 58.1 4.7Schuylkill 29 SAINT CLAIR AREA SD Female 57 1.8 59.6 38.6 0.0Schuylkill 29 SAINT CLAIR AREA SD White 97 2.1 48.5 47.4 2.1Schuylkill 29 SAINT CLAIR AREA SD Black 0Schuylkill 29 SAINT CLAIR AREA SD Hispanic 3Schuylkill 29 SAINT CLAIR AREA SD Asian 0Schuylkill 29 SAINT CLAIR AREA SD Native American 0Schuylkill 29 SAINT CLAIR AREA SD Multi-ethnic 0Schuylkill 29 SAINT CLAIR AREA SD IEP 17 0.0 17.6 70.6 11.8Schuylkill 29 SAINT CLAIR AREA SD ELL 0Schuylkill 29 SAINT CLAIR AREA SD Economically Disadvantaged 45 0.0 37.8 57.8 4.4Schuylkill 29 SCHUYLKILL HAVEN AREA SD All students 296 12.2 60.8 23.3 3.7Schuylkill 29 SCHUYLKILL HAVEN AREA SD Male 141 8.5 52.5 33.3 5.7Schuylkill 29 SCHUYLKILL HAVEN AREA SD Female 155 15.5 68.4 14.2 1.9Schuylkill 29 SCHUYLKILL HAVEN AREA SD White 288 12.2 61.1 22.9 3.8Schuylkill 29 SCHUYLKILL HAVEN AREA SD Black 5Schuylkill 29 SCHUYLKILL HAVEN AREA SD Hispanic 2Schuylkill 29 SCHUYLKILL HAVEN AREA SD Asian 1Schuylkill 29 SCHUYLKILL HAVEN AREA SD Native American 0Schuylkill 29 SCHUYLKILL HAVEN AREA SD Multi-ethnic 0Schuylkill 29 SCHUYLKILL HAVEN AREA SD IEP 56 0.0 30.4 53.6 16.1Schuylkill 29 SCHUYLKILL HAVEN AREA SD ELL 1Schuylkill 29 SCHUYLKILL HAVEN AREA SD Economically Disadvantaged 89 9.0 59.6 28.1 3.4Schuylkill 29 SHENANDOAH VALLEY SD All students 233 3.0 71.2 23.2 2.6Schuylkill 29 SHENANDOAH VALLEY SD Male 115 0.0 62.6 34.8 2.6Schuylkill 29 SHENANDOAH VALLEY SD Female 117 6.0 80.3 11.1 2.6Schuylkill 29 SHENANDOAH VALLEY SD White 195 3.6 72.8 21.0 2.6Schuylkill 29 SHENANDOAH VALLEY SD Black 6Schuylkill 29 SHENANDOAH VALLEY SD Hispanic 30 0.0 63.3 36.7 0.0
*Full Academic Year Students. Data for groups with less than 10 students assessed were replaced by blanks.Percentages were rounded to the nearest one-tenth.Proficiency percentages may not add up to 100 due to rounding. 165
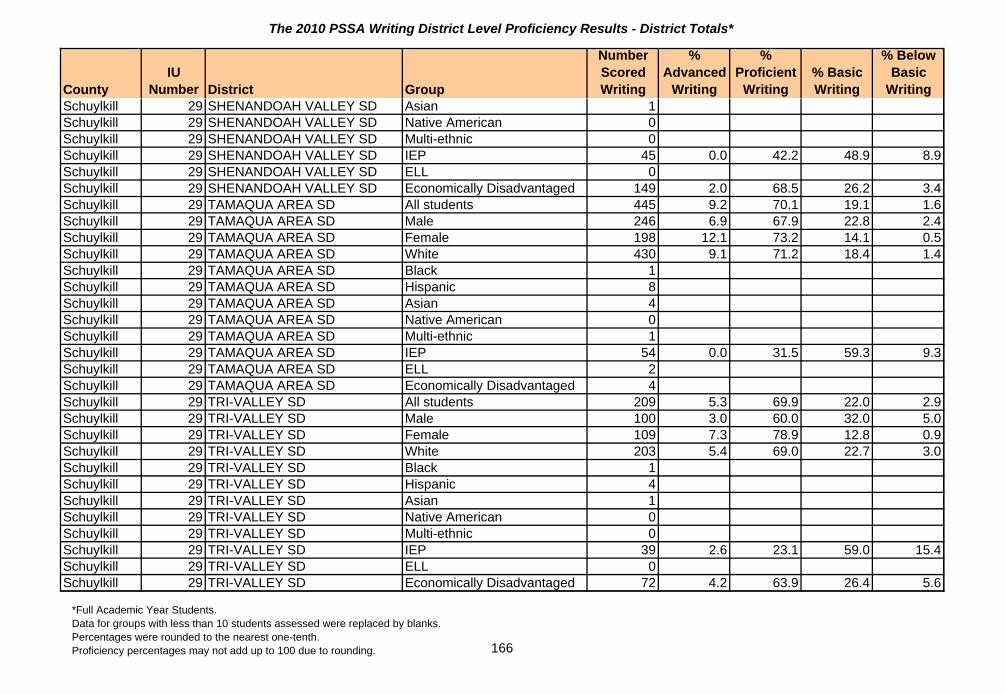
The 2010 PSSA Writing District Level Proficiency Results - District Totals*
CountyIU
Number District Group
Number Scored Writing
% Advanced
Writing
% Proficient
Writing% Basic Writing
% Below Basic
WritingSchuylkill 29 SHENANDOAH VALLEY SD Asian 1Schuylkill 29 SHENANDOAH VALLEY SD Native American 0Schuylkill 29 SHENANDOAH VALLEY SD Multi-ethnic 0Schuylkill 29 SHENANDOAH VALLEY SD IEP 45 0.0 42.2 48.9 8.9Schuylkill 29 SHENANDOAH VALLEY SD ELL 0Schuylkill 29 SHENANDOAH VALLEY SD Economically Disadvantaged 149 2.0 68.5 26.2 3.4Schuylkill 29 TAMAQUA AREA SD All students 445 9.2 70.1 19.1 1.6Schuylkill 29 TAMAQUA AREA SD Male 246 6.9 67.9 22.8 2.4Schuylkill 29 TAMAQUA AREA SD Female 198 12.1 73.2 14.1 0.5Schuylkill 29 TAMAQUA AREA SD White 430 9.1 71.2 18.4 1.4Schuylkill 29 TAMAQUA AREA SD Black 1Schuylkill 29 TAMAQUA AREA SD Hispanic 8Schuylkill 29 TAMAQUA AREA SD Asian 4Schuylkill 29 TAMAQUA AREA SD Native American 0Schuylkill 29 TAMAQUA AREA SD Multi-ethnic 1Schuylkill 29 TAMAQUA AREA SD IEP 54 0.0 31.5 59.3 9.3Schuylkill 29 TAMAQUA AREA SD ELL 2Schuylkill 29 TAMAQUA AREA SD Economically Disadvantaged 4Schuylkill 29 TRI-VALLEY SD All students 209 5.3 69.9 22.0 2.9Schuylkill 29 TRI-VALLEY SD Male 100 3.0 60.0 32.0 5.0Schuylkill 29 TRI-VALLEY SD Female 109 7.3 78.9 12.8 0.9Schuylkill 29 TRI-VALLEY SD White 203 5.4 69.0 22.7 3.0Schuylkill 29 TRI-VALLEY SD Black 1Schuylkill 29 TRI-VALLEY SD Hispanic 4Schuylkill 29 TRI-VALLEY SD Asian 1Schuylkill 29 TRI-VALLEY SD Native American 0Schuylkill 29 TRI-VALLEY SD Multi-ethnic 0Schuylkill 29 TRI-VALLEY SD IEP 39 2.6 23.1 59.0 15.4Schuylkill 29 TRI-VALLEY SD ELL 0Schuylkill 29 TRI-VALLEY SD Economically Disadvantaged 72 4.2 63.9 26.4 5.6
*Full Academic Year Students. Data for groups with less than 10 students assessed were replaced by blanks.Percentages were rounded to the nearest one-tenth.Proficiency percentages may not add up to 100 due to rounding. 166

The 2010 PSSA Writing District Level Proficiency Results - District Totals*
CountyIU
Number District Group
Number Scored Writing
% Advanced
Writing
% Proficient
Writing% Basic Writing
% Below Basic
WritingSchuylkill 29 WILLIAMS VALLEY SD All students 229 2.6 59.4 34.9 3.1Schuylkill 29 WILLIAMS VALLEY SD Male 118 0.8 52.5 41.5 5.1Schuylkill 29 WILLIAMS VALLEY SD Female 110 4.5 67.3 27.3 0.9Schuylkill 29 WILLIAMS VALLEY SD White 222 2.7 59.5 34.7 3.2Schuylkill 29 WILLIAMS VALLEY SD Black 1Schuylkill 29 WILLIAMS VALLEY SD Hispanic 4Schuylkill 29 WILLIAMS VALLEY SD Asian 0Schuylkill 29 WILLIAMS VALLEY SD Native American 0Schuylkill 29 WILLIAMS VALLEY SD Multi-ethnic 1Schuylkill 29 WILLIAMS VALLEY SD IEP 54 0.0 22.2 66.7 11.1Schuylkill 29 WILLIAMS VALLEY SD ELL 0Schuylkill 29 WILLIAMS VALLEY SD Economically Disadvantaged 84 0.0 47.6 47.6 4.8Snyder 16 MIDD-WEST SD All students 510 4.1 71.0 23.7 1.2Snyder 16 MIDD-WEST SD Male 259 3.9 64.9 29.7 1.5Snyder 16 MIDD-WEST SD Female 251 4.4 77.3 17.5 0.8Snyder 16 MIDD-WEST SD White 495 4.0 71.1 23.6 1.2Snyder 16 MIDD-WEST SD Black 9Snyder 16 MIDD-WEST SD Hispanic 3Snyder 16 MIDD-WEST SD Asian 2Snyder 16 MIDD-WEST SD Native American 0Snyder 16 MIDD-WEST SD Multi-ethnic 0Snyder 16 MIDD-WEST SD IEP 70 0.0 24.3 68.6 7.1Snyder 16 MIDD-WEST SD ELL 0Snyder 16 MIDD-WEST SD Economically Disadvantaged 205 3.4 62.0 32.7 2.0Snyder 16 SELINSGROVE AREA SD All students 568 16.4 62.7 19.5 1.4Snyder 16 SELINSGROVE AREA SD Male 286 9.4 61.5 26.9 2.1Snyder 16 SELINSGROVE AREA SD Female 281 23.5 63.7 12.1 0.7Snyder 16 SELINSGROVE AREA SD White 536 17.0 62.9 18.8 1.3Snyder 16 SELINSGROVE AREA SD Black 10 10.0 60.0 30.0 0.0Snyder 16 SELINSGROVE AREA SD Hispanic 12 0.0 41.7 50.0 8.3
*Full Academic Year Students. Data for groups with less than 10 students assessed were replaced by blanks.Percentages were rounded to the nearest one-tenth.Proficiency percentages may not add up to 100 due to rounding. 167
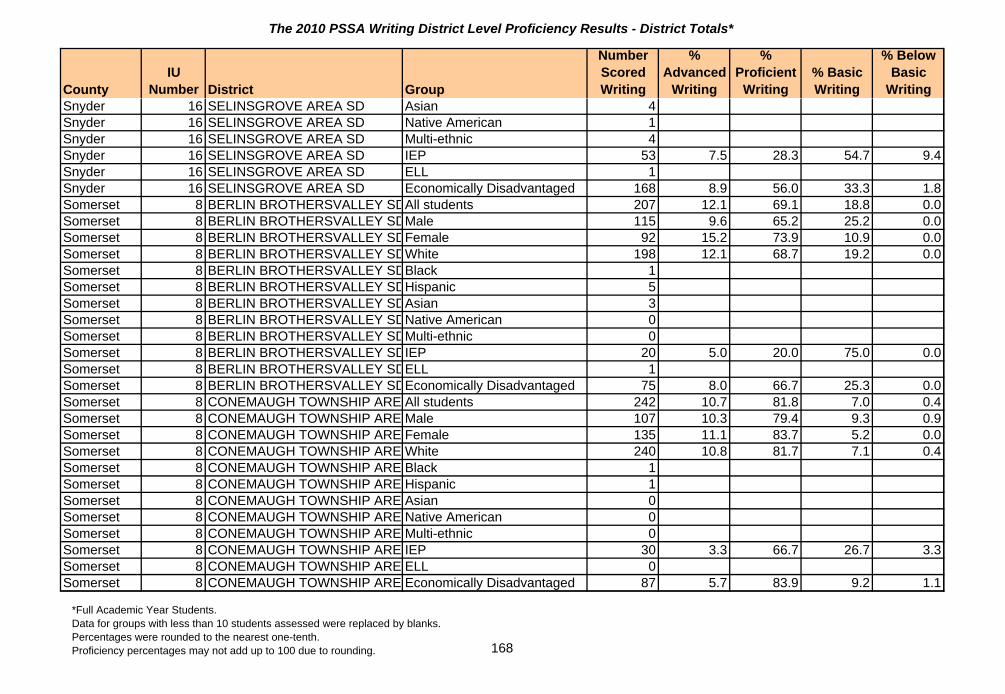
The 2010 PSSA Writing District Level Proficiency Results - District Totals*
CountyIU
Number District Group
Number Scored Writing
% Advanced
Writing
% Proficient
Writing% Basic Writing
% Below Basic
WritingSnyder 16 SELINSGROVE AREA SD Asian 4Snyder 16 SELINSGROVE AREA SD Native American 1Snyder 16 SELINSGROVE AREA SD Multi-ethnic 4Snyder 16 SELINSGROVE AREA SD IEP 53 7.5 28.3 54.7 9.4Snyder 16 SELINSGROVE AREA SD ELL 1Snyder 16 SELINSGROVE AREA SD Economically Disadvantaged 168 8.9 56.0 33.3 1.8Somerset 8 BERLIN BROTHERSVALLEY SDAll students 207 12.1 69.1 18.8 0.0Somerset 8 BERLIN BROTHERSVALLEY SDMale 115 9.6 65.2 25.2 0.0Somerset 8 BERLIN BROTHERSVALLEY SDFemale 92 15.2 73.9 10.9 0.0Somerset 8 BERLIN BROTHERSVALLEY SDWhite 198 12.1 68.7 19.2 0.0Somerset 8 BERLIN BROTHERSVALLEY SDBlack 1Somerset 8 BERLIN BROTHERSVALLEY SDHispanic 5Somerset 8 BERLIN BROTHERSVALLEY SDAsian 3Somerset 8 BERLIN BROTHERSVALLEY SDNative American 0Somerset 8 BERLIN BROTHERSVALLEY SDMulti-ethnic 0Somerset 8 BERLIN BROTHERSVALLEY SDIEP 20 5.0 20.0 75.0 0.0Somerset 8 BERLIN BROTHERSVALLEY SDELL 1Somerset 8 BERLIN BROTHERSVALLEY SDEconomically Disadvantaged 75 8.0 66.7 25.3 0.0Somerset 8 CONEMAUGH TOWNSHIP AREAAll students 242 10.7 81.8 7.0 0.4Somerset 8 CONEMAUGH TOWNSHIP AREAMale 107 10.3 79.4 9.3 0.9Somerset 8 CONEMAUGH TOWNSHIP AREAFemale 135 11.1 83.7 5.2 0.0Somerset 8 CONEMAUGH TOWNSHIP AREAWhite 240 10.8 81.7 7.1 0.4Somerset 8 CONEMAUGH TOWNSHIP AREABlack 1Somerset 8 CONEMAUGH TOWNSHIP AREAHispanic 1Somerset 8 CONEMAUGH TOWNSHIP AREAAsian 0Somerset 8 CONEMAUGH TOWNSHIP AREANative American 0Somerset 8 CONEMAUGH TOWNSHIP AREAMulti-ethnic 0Somerset 8 CONEMAUGH TOWNSHIP AREAIEP 30 3.3 66.7 26.7 3.3Somerset 8 CONEMAUGH TOWNSHIP AREAELL 0Somerset 8 CONEMAUGH TOWNSHIP AREAEconomically Disadvantaged 87 5.7 83.9 9.2 1.1
*Full Academic Year Students. Data for groups with less than 10 students assessed were replaced by blanks.Percentages were rounded to the nearest one-tenth.Proficiency percentages may not add up to 100 due to rounding. 168

The 2010 PSSA Writing District Level Proficiency Results - District Totals*
CountyIU
Number District Group
Number Scored Writing
% Advanced
Writing
% Proficient
Writing% Basic Writing
% Below Basic
WritingSomerset 8 MEYERSDALE AREA SD All students 224 11.2 54.9 32.1 1.8Somerset 8 MEYERSDALE AREA SD Male 101 11.9 47.5 38.6 2.0Somerset 8 MEYERSDALE AREA SD Female 122 10.7 61.5 27.0 0.8Somerset 8 MEYERSDALE AREA SD White 221 11.3 54.8 32.6 1.4Somerset 8 MEYERSDALE AREA SD Black 1Somerset 8 MEYERSDALE AREA SD Hispanic 0Somerset 8 MEYERSDALE AREA SD Asian 1Somerset 8 MEYERSDALE AREA SD Native American 0Somerset 8 MEYERSDALE AREA SD Multi-ethnic 0Somerset 8 MEYERSDALE AREA SD IEP 34 0.0 20.6 70.6 8.8Somerset 8 MEYERSDALE AREA SD ELL 0Somerset 8 MEYERSDALE AREA SD Economically Disadvantaged 99 4.0 45.5 49.5 1.0Somerset 8 NORTH STAR SD All students 298 4.7 67.4 26.5 1.3Somerset 8 NORTH STAR SD Male 154 1.3 59.7 36.4 2.6Somerset 8 NORTH STAR SD Female 144 8.3 75.7 16.0 0.0Somerset 8 NORTH STAR SD White 295 4.7 67.5 26.4 1.4Somerset 8 NORTH STAR SD Black 3Somerset 8 NORTH STAR SD Hispanic 0Somerset 8 NORTH STAR SD Asian 0Somerset 8 NORTH STAR SD Native American 0Somerset 8 NORTH STAR SD Multi-ethnic 0Somerset 8 NORTH STAR SD IEP 52 1.9 28.8 61.5 7.7Somerset 8 NORTH STAR SD ELL 0Somerset 8 NORTH STAR SD Economically Disadvantaged 136 4.4 54.4 39.7 1.5Somerset 8 ROCKWOOD AREA SD All students 191 2.6 65.4 29.3 2.6Somerset 8 ROCKWOOD AREA SD Male 94 2.1 58.5 36.2 3.2Somerset 8 ROCKWOOD AREA SD Female 97 3.1 72.2 22.7 2.1Somerset 8 ROCKWOOD AREA SD White 191 2.6 65.4 29.3 2.6Somerset 8 ROCKWOOD AREA SD Black 0Somerset 8 ROCKWOOD AREA SD Hispanic 0
*Full Academic Year Students. Data for groups with less than 10 students assessed were replaced by blanks.Percentages were rounded to the nearest one-tenth.Proficiency percentages may not add up to 100 due to rounding. 169
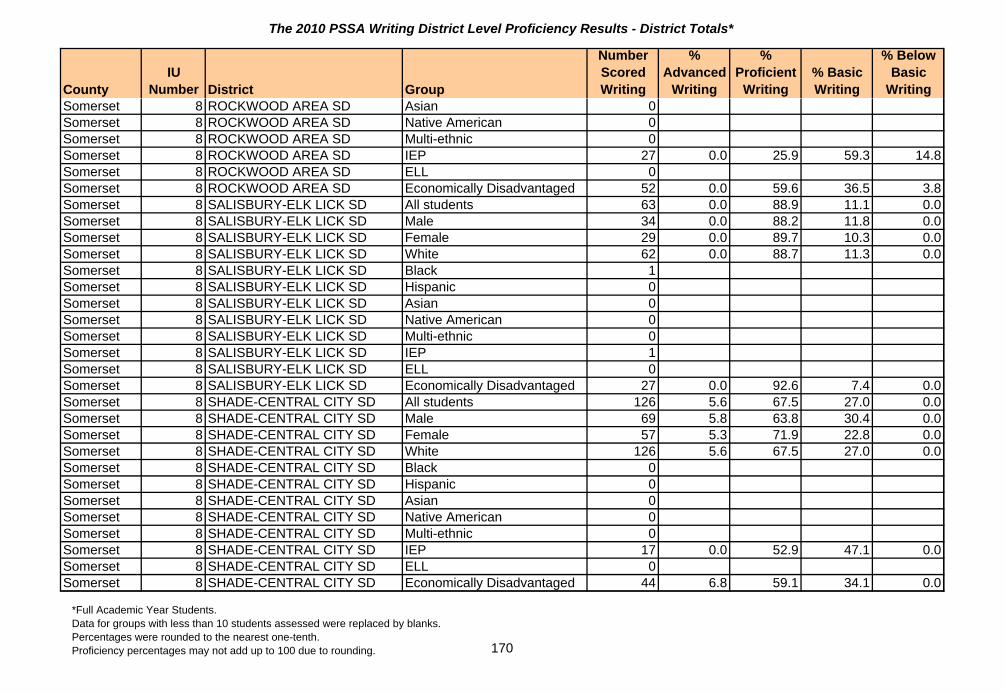
The 2010 PSSA Writing District Level Proficiency Results - District Totals*
CountyIU
Number District Group
Number Scored Writing
% Advanced
Writing
% Proficient
Writing% Basic Writing
% Below Basic
WritingSomerset 8 ROCKWOOD AREA SD Asian 0Somerset 8 ROCKWOOD AREA SD Native American 0Somerset 8 ROCKWOOD AREA SD Multi-ethnic 0Somerset 8 ROCKWOOD AREA SD IEP 27 0.0 25.9 59.3 14.8Somerset 8 ROCKWOOD AREA SD ELL 0Somerset 8 ROCKWOOD AREA SD Economically Disadvantaged 52 0.0 59.6 36.5 3.8Somerset 8 SALISBURY-ELK LICK SD All students 63 0.0 88.9 11.1 0.0Somerset 8 SALISBURY-ELK LICK SD Male 34 0.0 88.2 11.8 0.0Somerset 8 SALISBURY-ELK LICK SD Female 29 0.0 89.7 10.3 0.0Somerset 8 SALISBURY-ELK LICK SD White 62 0.0 88.7 11.3 0.0Somerset 8 SALISBURY-ELK LICK SD Black 1Somerset 8 SALISBURY-ELK LICK SD Hispanic 0Somerset 8 SALISBURY-ELK LICK SD Asian 0Somerset 8 SALISBURY-ELK LICK SD Native American 0Somerset 8 SALISBURY-ELK LICK SD Multi-ethnic 0Somerset 8 SALISBURY-ELK LICK SD IEP 1Somerset 8 SALISBURY-ELK LICK SD ELL 0Somerset 8 SALISBURY-ELK LICK SD Economically Disadvantaged 27 0.0 92.6 7.4 0.0Somerset 8 SHADE-CENTRAL CITY SD All students 126 5.6 67.5 27.0 0.0Somerset 8 SHADE-CENTRAL CITY SD Male 69 5.8 63.8 30.4 0.0Somerset 8 SHADE-CENTRAL CITY SD Female 57 5.3 71.9 22.8 0.0Somerset 8 SHADE-CENTRAL CITY SD White 126 5.6 67.5 27.0 0.0Somerset 8 SHADE-CENTRAL CITY SD Black 0Somerset 8 SHADE-CENTRAL CITY SD Hispanic 0Somerset 8 SHADE-CENTRAL CITY SD Asian 0Somerset 8 SHADE-CENTRAL CITY SD Native American 0Somerset 8 SHADE-CENTRAL CITY SD Multi-ethnic 0Somerset 8 SHADE-CENTRAL CITY SD IEP 17 0.0 52.9 47.1 0.0Somerset 8 SHADE-CENTRAL CITY SD ELL 0Somerset 8 SHADE-CENTRAL CITY SD Economically Disadvantaged 44 6.8 59.1 34.1 0.0
*Full Academic Year Students. Data for groups with less than 10 students assessed were replaced by blanks.Percentages were rounded to the nearest one-tenth.Proficiency percentages may not add up to 100 due to rounding. 170

The 2010 PSSA Writing District Level Proficiency Results - District Totals*
CountyIU
Number District Group
Number Scored Writing
% Advanced
Writing
% Proficient
Writing% Basic Writing
% Below Basic
WritingSomerset 8 SHANKSVILLE-STONYCREEK SAll students 91 9.9 56.0 31.9 2.2Somerset 8 SHANKSVILLE-STONYCREEK SMale 48 2.1 45.8 47.9 4.2Somerset 8 SHANKSVILLE-STONYCREEK SFemale 43 18.6 67.4 14.0 0.0Somerset 8 SHANKSVILLE-STONYCREEK SWhite 91 9.9 56.0 31.9 2.2Somerset 8 SHANKSVILLE-STONYCREEK SBlack 0Somerset 8 SHANKSVILLE-STONYCREEK SHispanic 0Somerset 8 SHANKSVILLE-STONYCREEK SAsian 0Somerset 8 SHANKSVILLE-STONYCREEK SNative American 0Somerset 8 SHANKSVILLE-STONYCREEK SMulti-ethnic 0Somerset 8 SHANKSVILLE-STONYCREEK SIEP 16 0.0 25.0 68.8 6.3Somerset 8 SHANKSVILLE-STONYCREEK SELL 0Somerset 8 SHANKSVILLE-STONYCREEK SEconomically Disadvantaged 32 3.1 50.0 43.8 3.1Somerset 8 SOMERSET AREA SD All students 566 6.0 53.5 37.5 3.0Somerset 8 SOMERSET AREA SD Male 321 3.4 46.7 45.2 4.7Somerset 8 SOMERSET AREA SD Female 244 9.4 62.7 27.0 0.8Somerset 8 SOMERSET AREA SD White 540 5.6 53.5 37.8 3.1Somerset 8 SOMERSET AREA SD Black 9Somerset 8 SOMERSET AREA SD Hispanic 5Somerset 8 SOMERSET AREA SD Asian 10 30.0 60.0 10.0 0.0Somerset 8 SOMERSET AREA SD Native American 1Somerset 8 SOMERSET AREA SD Multi-ethnic 0Somerset 8 SOMERSET AREA SD IEP 101 1.0 16.8 67.3 14.9Somerset 8 SOMERSET AREA SD ELL 5Somerset 8 SOMERSET AREA SD Economically Disadvantaged 189 3.7 41.8 49.7 4.8Somerset 8 TURKEYFOOT VALLEY AREA SAll students 83 0.0 32.5 59.0 8.4Somerset 8 TURKEYFOOT VALLEY AREA SMale 44 0.0 25.0 61.4 13.6Somerset 8 TURKEYFOOT VALLEY AREA SFemale 39 0.0 41.0 56.4 2.6Somerset 8 TURKEYFOOT VALLEY AREA SWhite 82 0.0 32.9 58.5 8.5Somerset 8 TURKEYFOOT VALLEY AREA SBlack 0Somerset 8 TURKEYFOOT VALLEY AREA SHispanic 0
*Full Academic Year Students. Data for groups with less than 10 students assessed were replaced by blanks.Percentages were rounded to the nearest one-tenth.Proficiency percentages may not add up to 100 due to rounding. 171

The 2010 PSSA Writing District Level Proficiency Results - District Totals*
CountyIU
Number District Group
Number Scored Writing
% Advanced
Writing
% Proficient
Writing% Basic Writing
% Below Basic
WritingSomerset 8 TURKEYFOOT VALLEY AREA SAsian 0Somerset 8 TURKEYFOOT VALLEY AREA SNative American 1Somerset 8 TURKEYFOOT VALLEY AREA SMulti-ethnic 0Somerset 8 TURKEYFOOT VALLEY AREA SIEP 11 0.0 9.1 90.9 0.0Somerset 8 TURKEYFOOT VALLEY AREA SELL 0Somerset 8 TURKEYFOOT VALLEY AREA SEconomically Disadvantaged 32 0.0 18.8 75.0 6.3Somerset 8 WINDBER AREA SD All students 266 17.7 73.3 6.0 3.0Somerset 8 WINDBER AREA SD Male 132 9.1 78.8 7.6 4.5Somerset 8 WINDBER AREA SD Female 133 26.3 68.4 4.5 0.8Somerset 8 WINDBER AREA SD White 262 17.9 72.9 6.1 3.1Somerset 8 WINDBER AREA SD Black 1Somerset 8 WINDBER AREA SD Hispanic 1Somerset 8 WINDBER AREA SD Asian 2Somerset 8 WINDBER AREA SD Native American 0Somerset 8 WINDBER AREA SD Multi-ethnic 0Somerset 8 WINDBER AREA SD IEP 37 0.0 51.4 27.0 21.6Somerset 8 WINDBER AREA SD ELL 0Somerset 8 WINDBER AREA SD Economically Disadvantaged 98 8.2 74.5 11.2 6.1Sullivan 17 SULLIVAN COUNTY SD All students 136 10.3 68.4 20.6 0.7Sullivan 17 SULLIVAN COUNTY SD Male 65 4.6 69.2 26.2 0.0Sullivan 17 SULLIVAN COUNTY SD Female 69 15.9 68.1 14.5 1.4Sullivan 17 SULLIVAN COUNTY SD White 132 10.6 68.9 19.7 0.8Sullivan 17 SULLIVAN COUNTY SD Black 0Sullivan 17 SULLIVAN COUNTY SD Hispanic 2Sullivan 17 SULLIVAN COUNTY SD Asian 0Sullivan 17 SULLIVAN COUNTY SD Native American 0Sullivan 17 SULLIVAN COUNTY SD Multi-ethnic 0Sullivan 17 SULLIVAN COUNTY SD IEP 16 0.0 31.3 62.5 6.3Sullivan 17 SULLIVAN COUNTY SD ELL 0Sullivan 17 SULLIVAN COUNTY SD Economically Disadvantaged 42 7.1 54.8 38.1 0.0
*Full Academic Year Students. Data for groups with less than 10 students assessed were replaced by blanks.Percentages were rounded to the nearest one-tenth.Proficiency percentages may not add up to 100 due to rounding. 172

The 2010 PSSA Writing District Level Proficiency Results - District Totals*
CountyIU
Number District Group
Number Scored Writing
% Advanced
Writing
% Proficient
Writing% Basic Writing
% Below Basic
WritingSusquehanna 19 BLUE RIDGE SD All students 251 8.8 76.9 13.9 0.4Susquehanna 19 BLUE RIDGE SD Male 131 1.5 76.3 22.1 0.0Susquehanna 19 BLUE RIDGE SD Female 120 16.7 77.5 5.0 0.8Susquehanna 19 BLUE RIDGE SD White 240 9.2 76.7 13.8 0.4Susquehanna 19 BLUE RIDGE SD Black 2Susquehanna 19 BLUE RIDGE SD Hispanic 7Susquehanna 19 BLUE RIDGE SD Asian 0Susquehanna 19 BLUE RIDGE SD Native American 2Susquehanna 19 BLUE RIDGE SD Multi-ethnic 0Susquehanna 19 BLUE RIDGE SD IEP 50 4.0 66.0 28.0 2.0Susquehanna 19 BLUE RIDGE SD ELL 0Susquehanna 19 BLUE RIDGE SD Economically Disadvantaged 115 5.2 78.3 16.5 0.0Susquehanna 19 ELK LAKE SD All students 319 5.0 68.0 25.7 1.3Susquehanna 19 ELK LAKE SD Male 157 5.1 55.4 36.9 2.5Susquehanna 19 ELK LAKE SD Female 162 4.9 80.2 14.8 0.0Susquehanna 19 ELK LAKE SD White 310 4.8 68.4 25.5 1.3Susquehanna 19 ELK LAKE SD Black 2Susquehanna 19 ELK LAKE SD Hispanic 6Susquehanna 19 ELK LAKE SD Asian 0Susquehanna 19 ELK LAKE SD Native American 1Susquehanna 19 ELK LAKE SD Multi-ethnic 0Susquehanna 19 ELK LAKE SD IEP 48 0.0 33.3 58.3 8.3Susquehanna 19 ELK LAKE SD ELL 3Susquehanna 19 ELK LAKE SD Economically Disadvantaged 119 1.7 61.3 35.3 1.7Susquehanna 19 FOREST CITY REGIONAL SD All students 198 5.6 68.7 25.3 0.5Susquehanna 19 FOREST CITY REGIONAL SD Male 98 3.1 59.2 36.7 1.0Susquehanna 19 FOREST CITY REGIONAL SD Female 100 8.0 78.0 14.0 0.0Susquehanna 19 FOREST CITY REGIONAL SD White 188 5.3 69.1 25.0 0.5Susquehanna 19 FOREST CITY REGIONAL SD Black 2Susquehanna 19 FOREST CITY REGIONAL SD Hispanic 5
*Full Academic Year Students. Data for groups with less than 10 students assessed were replaced by blanks.Percentages were rounded to the nearest one-tenth.Proficiency percentages may not add up to 100 due to rounding. 173

The 2010 PSSA Writing District Level Proficiency Results - District Totals*
CountyIU
Number District Group
Number Scored Writing
% Advanced
Writing
% Proficient
Writing% Basic Writing
% Below Basic
WritingSusquehanna 19 FOREST CITY REGIONAL SD Asian 3Susquehanna 19 FOREST CITY REGIONAL SD Native American 0Susquehanna 19 FOREST CITY REGIONAL SD Multi-ethnic 0Susquehanna 19 FOREST CITY REGIONAL SD IEP 33 3.0 39.4 54.5 3.0Susquehanna 19 FOREST CITY REGIONAL SD ELL 0Susquehanna 19 FOREST CITY REGIONAL SD Economically Disadvantaged 96 3.1 64.6 31.3 1.0Susquehanna 19 MONTROSE AREA SD All students 405 4.9 65.7 28.1 1.2Susquehanna 19 MONTROSE AREA SD Male 205 1.0 57.6 39.5 2.0Susquehanna 19 MONTROSE AREA SD Female 200 9.0 74.0 16.5 0.5Susquehanna 19 MONTROSE AREA SD White 399 5.0 65.4 28.3 1.3Susquehanna 19 MONTROSE AREA SD Black 2Susquehanna 19 MONTROSE AREA SD Hispanic 4Susquehanna 19 MONTROSE AREA SD Asian 0Susquehanna 19 MONTROSE AREA SD Native American 0Susquehanna 19 MONTROSE AREA SD Multi-ethnic 0Susquehanna 19 MONTROSE AREA SD IEP 72 0.0 29.2 63.9 6.9Susquehanna 19 MONTROSE AREA SD ELL 1Susquehanna 19 MONTROSE AREA SD Economically Disadvantaged 105 1.0 52.4 43.8 2.9Susquehanna 19 MOUNTAIN VIEW SD All students 287 5.6 48.8 39.0 6.6Susquehanna 19 MOUNTAIN VIEW SD Male 165 5.5 37.6 47.9 9.1Susquehanna 19 MOUNTAIN VIEW SD Female 122 5.7 63.9 27.0 3.3Susquehanna 19 MOUNTAIN VIEW SD White 275 5.1 49.5 38.5 6.9Susquehanna 19 MOUNTAIN VIEW SD Black 6Susquehanna 19 MOUNTAIN VIEW SD Hispanic 4Susquehanna 19 MOUNTAIN VIEW SD Asian 2Susquehanna 19 MOUNTAIN VIEW SD Native American 0Susquehanna 19 MOUNTAIN VIEW SD Multi-ethnic 0Susquehanna 19 MOUNTAIN VIEW SD IEP 39 0.0 5.1 71.8 23.1Susquehanna 19 MOUNTAIN VIEW SD ELL 0Susquehanna 19 MOUNTAIN VIEW SD Economically Disadvantaged 126 4.8 43.7 43.7 7.9
*Full Academic Year Students. Data for groups with less than 10 students assessed were replaced by blanks.Percentages were rounded to the nearest one-tenth.Proficiency percentages may not add up to 100 due to rounding. 174

The 2010 PSSA Writing District Level Proficiency Results - District Totals*
CountyIU
Number District Group
Number Scored Writing
% Advanced
Writing
% Proficient
Writing% Basic Writing
% Below Basic
WritingSusquehanna 19 SUSQUEHANNA COMM SD All students 189 6.3 55.6 37.0 1.1Susquehanna 19 SUSQUEHANNA COMM SD Male 105 4.8 52.4 41.0 1.9Susquehanna 19 SUSQUEHANNA COMM SD Female 84 8.3 59.5 32.1 0.0Susquehanna 19 SUSQUEHANNA COMM SD White 183 6.0 54.6 38.3 1.1Susquehanna 19 SUSQUEHANNA COMM SD Black 3Susquehanna 19 SUSQUEHANNA COMM SD Hispanic 1Susquehanna 19 SUSQUEHANNA COMM SD Asian 2Susquehanna 19 SUSQUEHANNA COMM SD Native American 0Susquehanna 19 SUSQUEHANNA COMM SD Multi-ethnic 0Susquehanna 19 SUSQUEHANNA COMM SD IEP 46 0.0 37.0 58.7 4.3Susquehanna 19 SUSQUEHANNA COMM SD ELL 0Susquehanna 19 SUSQUEHANNA COMM SD Economically Disadvantaged 102 2.0 49.0 47.1 2.0Tioga 17 NORTHERN TIOGA SD All students 490 5.9 52.9 39.4 1.8Tioga 17 NORTHERN TIOGA SD Male 246 2.8 38.2 56.1 2.8Tioga 17 NORTHERN TIOGA SD Female 244 9.0 67.6 22.5 0.8Tioga 17 NORTHERN TIOGA SD White 477 6.1 52.0 40.0 1.9Tioga 17 NORTHERN TIOGA SD Black 7Tioga 17 NORTHERN TIOGA SD Hispanic 4Tioga 17 NORTHERN TIOGA SD Asian 1Tioga 17 NORTHERN TIOGA SD Native American 0Tioga 17 NORTHERN TIOGA SD Multi-ethnic 0Tioga 17 NORTHERN TIOGA SD IEP 71 1.4 16.9 71.8 9.9Tioga 17 NORTHERN TIOGA SD ELL 0Tioga 17 NORTHERN TIOGA SD Economically Disadvantaged 236 2.5 43.6 51.3 2.5Tioga 17 SOUTHERN TIOGA SD All students 456 8.6 56.8 30.9 3.7Tioga 17 SOUTHERN TIOGA SD Male 243 4.1 49.4 39.9 6.6Tioga 17 SOUTHERN TIOGA SD Female 213 13.6 65.3 20.7 0.5Tioga 17 SOUTHERN TIOGA SD White 439 8.0 57.4 31.2 3.4Tioga 17 SOUTHERN TIOGA SD Black 3Tioga 17 SOUTHERN TIOGA SD Hispanic 4
*Full Academic Year Students. Data for groups with less than 10 students assessed were replaced by blanks.Percentages were rounded to the nearest one-tenth.Proficiency percentages may not add up to 100 due to rounding. 175

The 2010 PSSA Writing District Level Proficiency Results - District Totals*
CountyIU
Number District Group
Number Scored Writing
% Advanced
Writing
% Proficient
Writing% Basic Writing
% Below Basic
WritingTioga 17 SOUTHERN TIOGA SD Asian 4Tioga 17 SOUTHERN TIOGA SD Native American 6Tioga 17 SOUTHERN TIOGA SD Multi-ethnic 0Tioga 17 SOUTHERN TIOGA SD IEP 85 1.2 25.9 61.2 11.8Tioga 17 SOUTHERN TIOGA SD ELL 1Tioga 17 SOUTHERN TIOGA SD Economically Disadvantaged 183 5.5 55.2 33.9 5.5Tioga 17 WELLSBORO AREA SD All students 322 5.6 56.5 36.0 1.9Tioga 17 WELLSBORO AREA SD Male 159 1.9 52.2 43.4 2.5Tioga 17 WELLSBORO AREA SD Female 163 9.2 60.7 28.8 1.2Tioga 17 WELLSBORO AREA SD White 308 5.5 55.8 36.7 1.9Tioga 17 WELLSBORO AREA SD Black 6Tioga 17 WELLSBORO AREA SD Hispanic 7Tioga 17 WELLSBORO AREA SD Asian 0Tioga 17 WELLSBORO AREA SD Native American 1Tioga 17 WELLSBORO AREA SD Multi-ethnic 0Tioga 17 WELLSBORO AREA SD IEP 57 1.8 26.3 61.4 10.5Tioga 17 WELLSBORO AREA SD ELL 0Tioga 17 WELLSBORO AREA SD Economically Disadvantaged 118 0.8 53.4 43.2 2.5Union 16 LEWISBURG AREA SD All students 410 17.3 71.7 10.5 0.5Union 16 LEWISBURG AREA SD Male 217 14.7 71.0 13.4 0.9Union 16 LEWISBURG AREA SD Female 193 20.2 72.5 7.3 0.0Union 16 LEWISBURG AREA SD White 356 18.0 72.2 9.3 0.6Union 16 LEWISBURG AREA SD Black 26 11.5 61.5 26.9 0.0Union 16 LEWISBURG AREA SD Hispanic 14 0.0 92.9 7.1 0.0Union 16 LEWISBURG AREA SD Asian 11 36.4 54.5 9.1 0.0Union 16 LEWISBURG AREA SD Native American 1Union 16 LEWISBURG AREA SD Multi-ethnic 2Union 16 LEWISBURG AREA SD IEP 46 0.0 43.5 52.2 4.3Union 16 LEWISBURG AREA SD ELL 5Union 16 LEWISBURG AREA SD Economically Disadvantaged 87 10.3 64.4 24.1 1.1
*Full Academic Year Students. Data for groups with less than 10 students assessed were replaced by blanks.Percentages were rounded to the nearest one-tenth.Proficiency percentages may not add up to 100 due to rounding. 176

The 2010 PSSA Writing District Level Proficiency Results - District Totals*
CountyIU
Number District Group
Number Scored Writing
% Advanced
Writing
% Proficient
Writing% Basic Writing
% Below Basic
WritingUnion 16 MIFFLINBURG AREA SD All students 525 11.6 67.4 18.9 2.1Union 16 MIFFLINBURG AREA SD Male 279 6.8 64.2 26.2 2.9Union 16 MIFFLINBURG AREA SD Female 246 17.1 71.1 10.6 1.2Union 16 MIFFLINBURG AREA SD White 507 11.8 68.2 18.3 1.6Union 16 MIFFLINBURG AREA SD Black 14 0.0 35.7 42.9 21.4Union 16 MIFFLINBURG AREA SD Hispanic 0Union 16 MIFFLINBURG AREA SD Asian 1Union 16 MIFFLINBURG AREA SD Native American 2Union 16 MIFFLINBURG AREA SD Multi-ethnic 1Union 16 MIFFLINBURG AREA SD IEP 82 1.2 26.8 61.0 11.0Union 16 MIFFLINBURG AREA SD ELL 0Union 16 MIFFLINBURG AREA SD Economically Disadvantaged 162 5.6 64.8 26.5 3.1Venango 6 CRANBERRY AREA SD All students 259 5.4 66.4 26.3 1.9Venango 6 CRANBERRY AREA SD Male 123 4.9 56.9 34.1 4.1Venango 6 CRANBERRY AREA SD Female 136 5.9 75.0 19.1 0.0Venango 6 CRANBERRY AREA SD White 254 5.1 66.9 26.0 2.0Venango 6 CRANBERRY AREA SD Black 1Venango 6 CRANBERRY AREA SD Hispanic 0Venango 6 CRANBERRY AREA SD Asian 4Venango 6 CRANBERRY AREA SD Native American 0Venango 6 CRANBERRY AREA SD Multi-ethnic 0Venango 6 CRANBERRY AREA SD IEP 43 2.3 41.9 46.5 9.3Venango 6 CRANBERRY AREA SD ELL 0Venango 6 CRANBERRY AREA SD Economically Disadvantaged 81 4.9 55.6 35.8 3.7Venango 6 FRANKLIN AREA SD All students 465 6.2 61.9 27.3 4.5Venango 6 FRANKLIN AREA SD Male 226 3.1 57.5 33.2 6.2Venango 6 FRANKLIN AREA SD Female 239 9.2 66.1 21.8 2.9Venango 6 FRANKLIN AREA SD White 421 6.4 62.5 26.8 4.3Venango 6 FRANKLIN AREA SD Black 29 3.4 58.6 31.0 6.9Venango 6 FRANKLIN AREA SD Hispanic 4
*Full Academic Year Students. Data for groups with less than 10 students assessed were replaced by blanks.Percentages were rounded to the nearest one-tenth.Proficiency percentages may not add up to 100 due to rounding. 177

The 2010 PSSA Writing District Level Proficiency Results - District Totals*
CountyIU
Number District Group
Number Scored Writing
% Advanced
Writing
% Proficient
Writing% Basic Writing
% Below Basic
WritingVenango 6 FRANKLIN AREA SD Asian 6Venango 6 FRANKLIN AREA SD Native American 4Venango 6 FRANKLIN AREA SD Multi-ethnic 1Venango 6 FRANKLIN AREA SD IEP 138 0.7 35.5 50.0 13.8Venango 6 FRANKLIN AREA SD ELL 1Venango 6 FRANKLIN AREA SD Economically Disadvantaged 232 3.0 55.6 34.5 6.9Venango 6 OIL CITY AREA SD All students 516 0.8 53.5 42.4 3.3Venango 6 OIL CITY AREA SD Male 257 0.4 44.4 50.2 5.1Venango 6 OIL CITY AREA SD Female 259 1.2 62.5 34.7 1.5Venango 6 OIL CITY AREA SD White 496 0.8 53.4 42.3 3.4Venango 6 OIL CITY AREA SD Black 14 0.0 57.1 42.9 0.0Venango 6 OIL CITY AREA SD Hispanic 3Venango 6 OIL CITY AREA SD Asian 0Venango 6 OIL CITY AREA SD Native American 2Venango 6 OIL CITY AREA SD Multi-ethnic 1Venango 6 OIL CITY AREA SD IEP 122 0.0 23.0 66.4 10.7Venango 6 OIL CITY AREA SD ELL 0Venango 6 OIL CITY AREA SD Economically Disadvantaged 247 0.8 38.5 54.7 6.1Venango 6 TITUSVILLE AREA SD All students 445 7.0 77.3 15.3 0.4Venango 6 TITUSVILLE AREA SD Male 214 2.3 75.7 21.0 0.9Venango 6 TITUSVILLE AREA SD Female 231 11.3 78.8 10.0 0.0Venango 6 TITUSVILLE AREA SD White 427 7.3 77.8 14.5 0.5Venango 6 TITUSVILLE AREA SD Black 4Venango 6 TITUSVILLE AREA SD Hispanic 7Venango 6 TITUSVILLE AREA SD Asian 2Venango 6 TITUSVILLE AREA SD Native American 2Venango 6 TITUSVILLE AREA SD Multi-ethnic 3Venango 6 TITUSVILLE AREA SD IEP 71 1.4 56.3 39.4 2.8Venango 6 TITUSVILLE AREA SD ELL 1Venango 6 TITUSVILLE AREA SD Economically Disadvantaged 223 4.5 74.0 21.1 0.4
*Full Academic Year Students. Data for groups with less than 10 students assessed were replaced by blanks.Percentages were rounded to the nearest one-tenth.Proficiency percentages may not add up to 100 due to rounding. 178

The 2010 PSSA Writing District Level Proficiency Results - District Totals*
CountyIU
Number District Group
Number Scored Writing
% Advanced
Writing
% Proficient
Writing% Basic Writing
% Below Basic
WritingVenango 6 VALLEY GROVE SD All students 216 0.0 31.5 57.9 10.6Venango 6 VALLEY GROVE SD Male 121 0.0 24.0 61.2 14.9Venango 6 VALLEY GROVE SD Female 94 0.0 40.4 54.3 5.3Venango 6 VALLEY GROVE SD White 212 0.0 31.1 58.0 10.8Venango 6 VALLEY GROVE SD Black 2Venango 6 VALLEY GROVE SD Hispanic 0Venango 6 VALLEY GROVE SD Asian 1Venango 6 VALLEY GROVE SD Native American 0Venango 6 VALLEY GROVE SD Multi-ethnic 0Venango 6 VALLEY GROVE SD IEP 29 0.0 6.9 48.3 44.8Venango 6 VALLEY GROVE SD ELL 0Venango 6 VALLEY GROVE SD Economically Disadvantaged 109 0.0 18.3 67.0 14.7Warren 5 WARREN COUNTY SD All students 1,152 5.8 59.4 31.9 3.0Warren 5 WARREN COUNTY SD Male 585 3.9 49.4 41.7 5.0Warren 5 WARREN COUNTY SD Female 563 7.8 69.6 21.7 0.9Warren 5 WARREN COUNTY SD White 1,124 5.9 59.5 31.6 3.0Warren 5 WARREN COUNTY SD Black 13 0.0 30.8 69.2 0.0Warren 5 WARREN COUNTY SD Hispanic 3Warren 5 WARREN COUNTY SD Asian 7Warren 5 WARREN COUNTY SD Native American 1Warren 5 WARREN COUNTY SD Multi-ethnic 0Warren 5 WARREN COUNTY SD IEP 204 0.5 32.4 54.9 12.3Warren 5 WARREN COUNTY SD ELL 1Warren 5 WARREN COUNTY SD Economically Disadvantaged 441 2.9 49.2 44.7 3.2Washington 1 AVELLA AREA SD All students 146 3.4 55.5 39.0 2.1Washington 1 AVELLA AREA SD Male 77 0.0 42.9 53.2 3.9Washington 1 AVELLA AREA SD Female 67 6.0 71.6 22.4 0.0Washington 1 AVELLA AREA SD White 137 2.2 56.9 38.7 2.2Washington 1 AVELLA AREA SD Black 5Washington 1 AVELLA AREA SD Hispanic 0
*Full Academic Year Students. Data for groups with less than 10 students assessed were replaced by blanks.Percentages were rounded to the nearest one-tenth.Proficiency percentages may not add up to 100 due to rounding. 179
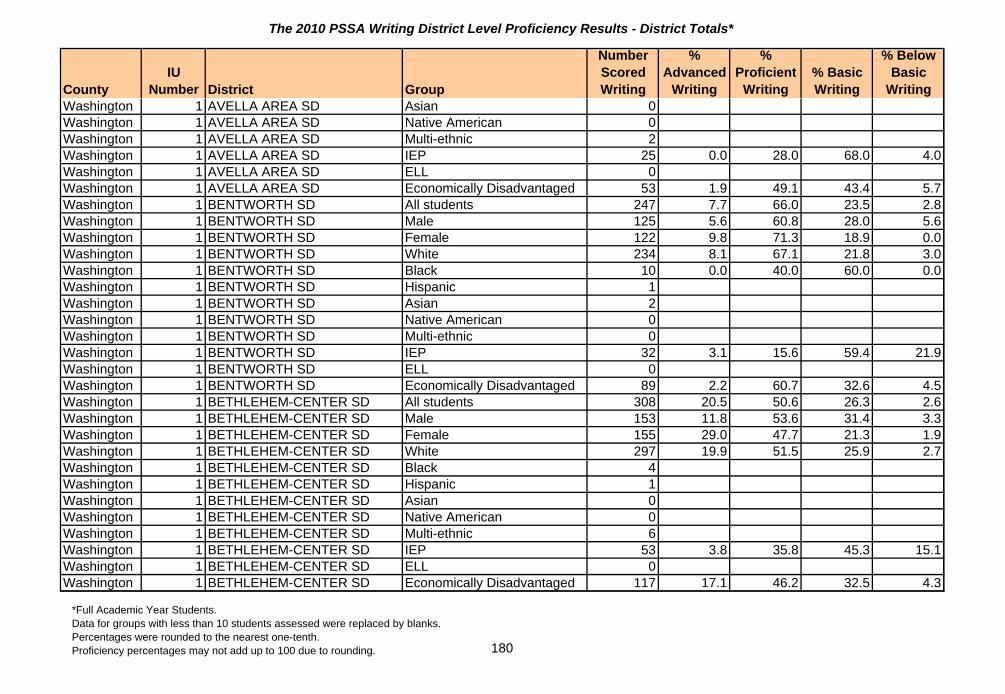
The 2010 PSSA Writing District Level Proficiency Results - District Totals*
CountyIU
Number District Group
Number Scored Writing
% Advanced
Writing
% Proficient
Writing% Basic Writing
% Below Basic
WritingWashington 1 AVELLA AREA SD Asian 0Washington 1 AVELLA AREA SD Native American 0Washington 1 AVELLA AREA SD Multi-ethnic 2Washington 1 AVELLA AREA SD IEP 25 0.0 28.0 68.0 4.0Washington 1 AVELLA AREA SD ELL 0Washington 1 AVELLA AREA SD Economically Disadvantaged 53 1.9 49.1 43.4 5.7Washington 1 BENTWORTH SD All students 247 7.7 66.0 23.5 2.8Washington 1 BENTWORTH SD Male 125 5.6 60.8 28.0 5.6Washington 1 BENTWORTH SD Female 122 9.8 71.3 18.9 0.0Washington 1 BENTWORTH SD White 234 8.1 67.1 21.8 3.0Washington 1 BENTWORTH SD Black 10 0.0 40.0 60.0 0.0Washington 1 BENTWORTH SD Hispanic 1Washington 1 BENTWORTH SD Asian 2Washington 1 BENTWORTH SD Native American 0Washington 1 BENTWORTH SD Multi-ethnic 0Washington 1 BENTWORTH SD IEP 32 3.1 15.6 59.4 21.9Washington 1 BENTWORTH SD ELL 0Washington 1 BENTWORTH SD Economically Disadvantaged 89 2.2 60.7 32.6 4.5Washington 1 BETHLEHEM-CENTER SD All students 308 20.5 50.6 26.3 2.6Washington 1 BETHLEHEM-CENTER SD Male 153 11.8 53.6 31.4 3.3Washington 1 BETHLEHEM-CENTER SD Female 155 29.0 47.7 21.3 1.9Washington 1 BETHLEHEM-CENTER SD White 297 19.9 51.5 25.9 2.7Washington 1 BETHLEHEM-CENTER SD Black 4Washington 1 BETHLEHEM-CENTER SD Hispanic 1Washington 1 BETHLEHEM-CENTER SD Asian 0Washington 1 BETHLEHEM-CENTER SD Native American 0Washington 1 BETHLEHEM-CENTER SD Multi-ethnic 6Washington 1 BETHLEHEM-CENTER SD IEP 53 3.8 35.8 45.3 15.1Washington 1 BETHLEHEM-CENTER SD ELL 0Washington 1 BETHLEHEM-CENTER SD Economically Disadvantaged 117 17.1 46.2 32.5 4.3
*Full Academic Year Students. Data for groups with less than 10 students assessed were replaced by blanks.Percentages were rounded to the nearest one-tenth.Proficiency percentages may not add up to 100 due to rounding. 180
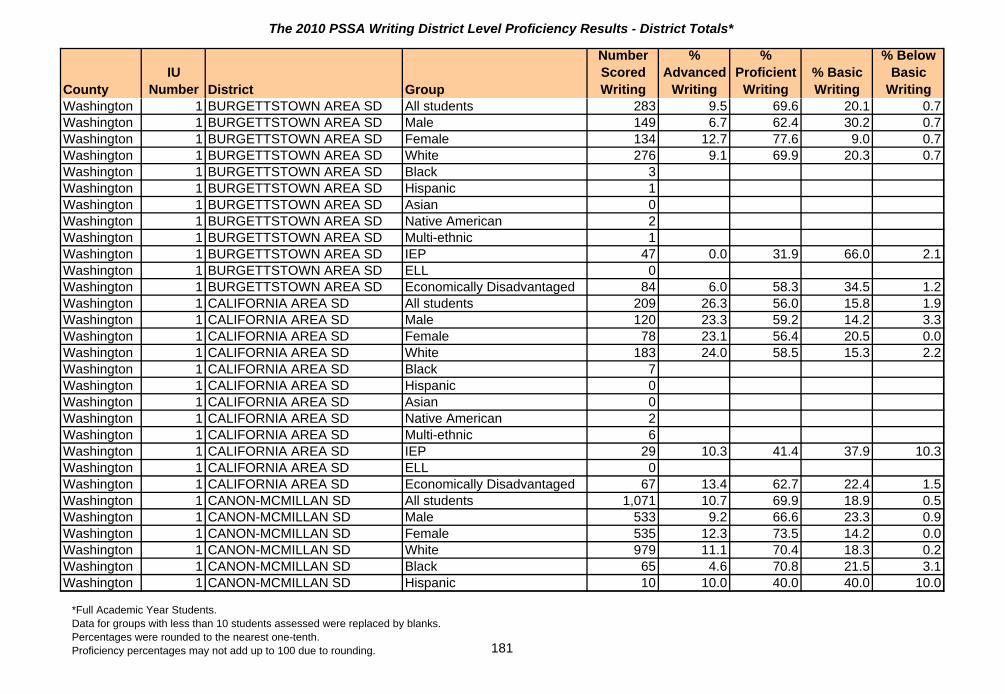
The 2010 PSSA Writing District Level Proficiency Results - District Totals*
CountyIU
Number District Group
Number Scored Writing
% Advanced
Writing
% Proficient
Writing% Basic Writing
% Below Basic
WritingWashington 1 BURGETTSTOWN AREA SD All students 283 9.5 69.6 20.1 0.7Washington 1 BURGETTSTOWN AREA SD Male 149 6.7 62.4 30.2 0.7Washington 1 BURGETTSTOWN AREA SD Female 134 12.7 77.6 9.0 0.7Washington 1 BURGETTSTOWN AREA SD White 276 9.1 69.9 20.3 0.7Washington 1 BURGETTSTOWN AREA SD Black 3Washington 1 BURGETTSTOWN AREA SD Hispanic 1Washington 1 BURGETTSTOWN AREA SD Asian 0Washington 1 BURGETTSTOWN AREA SD Native American 2Washington 1 BURGETTSTOWN AREA SD Multi-ethnic 1Washington 1 BURGETTSTOWN AREA SD IEP 47 0.0 31.9 66.0 2.1Washington 1 BURGETTSTOWN AREA SD ELL 0Washington 1 BURGETTSTOWN AREA SD Economically Disadvantaged 84 6.0 58.3 34.5 1.2Washington 1 CALIFORNIA AREA SD All students 209 26.3 56.0 15.8 1.9Washington 1 CALIFORNIA AREA SD Male 120 23.3 59.2 14.2 3.3Washington 1 CALIFORNIA AREA SD Female 78 23.1 56.4 20.5 0.0Washington 1 CALIFORNIA AREA SD White 183 24.0 58.5 15.3 2.2Washington 1 CALIFORNIA AREA SD Black 7Washington 1 CALIFORNIA AREA SD Hispanic 0Washington 1 CALIFORNIA AREA SD Asian 0Washington 1 CALIFORNIA AREA SD Native American 2Washington 1 CALIFORNIA AREA SD Multi-ethnic 6Washington 1 CALIFORNIA AREA SD IEP 29 10.3 41.4 37.9 10.3Washington 1 CALIFORNIA AREA SD ELL 0Washington 1 CALIFORNIA AREA SD Economically Disadvantaged 67 13.4 62.7 22.4 1.5Washington 1 CANON-MCMILLAN SD All students 1,071 10.7 69.9 18.9 0.5Washington 1 CANON-MCMILLAN SD Male 533 9.2 66.6 23.3 0.9Washington 1 CANON-MCMILLAN SD Female 535 12.3 73.5 14.2 0.0Washington 1 CANON-MCMILLAN SD White 979 11.1 70.4 18.3 0.2Washington 1 CANON-MCMILLAN SD Black 65 4.6 70.8 21.5 3.1Washington 1 CANON-MCMILLAN SD Hispanic 10 10.0 40.0 40.0 10.0
*Full Academic Year Students. Data for groups with less than 10 students assessed were replaced by blanks.Percentages were rounded to the nearest one-tenth.Proficiency percentages may not add up to 100 due to rounding. 181

The 2010 PSSA Writing District Level Proficiency Results - District Totals*
CountyIU
Number District Group
Number Scored Writing
% Advanced
Writing
% Proficient
Writing% Basic Writing
% Below Basic
WritingWashington 1 CANON-MCMILLAN SD Asian 10 20.0 50.0 30.0 0.0Washington 1 CANON-MCMILLAN SD Native American 1Washington 1 CANON-MCMILLAN SD Multi-ethnic 3Washington 1 CANON-MCMILLAN SD IEP 122 0.8 39.3 56.6 3.3Washington 1 CANON-MCMILLAN SD ELL 2Washington 1 CANON-MCMILLAN SD Economically Disadvantaged 221 5.9 62.9 30.3 0.9Washington 1 CHARLEROI SD All students 377 7.7 62.3 26.5 3.4Washington 1 CHARLEROI SD Male 181 2.2 60.8 32.6 4.4Washington 1 CHARLEROI SD Female 196 12.8 63.8 20.9 2.6Washington 1 CHARLEROI SD White 344 7.8 64.5 25.0 2.6Washington 1 CHARLEROI SD Black 28 7.1 39.3 39.3 14.3Washington 1 CHARLEROI SD Hispanic 1Washington 1 CHARLEROI SD Asian 1Washington 1 CHARLEROI SD Native American 1Washington 1 CHARLEROI SD Multi-ethnic 2Washington 1 CHARLEROI SD IEP 70 0.0 30.0 55.7 14.3Washington 1 CHARLEROI SD ELL 2Washington 1 CHARLEROI SD Economically Disadvantaged 174 4.6 59.2 32.2 4.0Washington 1 CHARTIERS-HOUSTON SD All students 223 13.5 67.7 17.0 1.8Washington 1 CHARTIERS-HOUSTON SD Male 121 9.1 66.1 22.3 2.5Washington 1 CHARTIERS-HOUSTON SD Female 102 18.6 69.6 10.8 1.0Washington 1 CHARTIERS-HOUSTON SD White 201 12.4 70.1 15.4 2.0Washington 1 CHARTIERS-HOUSTON SD Black 12 25.0 25.0 50.0 0.0Washington 1 CHARTIERS-HOUSTON SD Hispanic 1Washington 1 CHARTIERS-HOUSTON SD Asian 1Washington 1 CHARTIERS-HOUSTON SD Native American 0Washington 1 CHARTIERS-HOUSTON SD Multi-ethnic 8Washington 1 CHARTIERS-HOUSTON SD IEP 34 0.0 29.4 58.8 11.8Washington 1 CHARTIERS-HOUSTON SD ELL 0Washington 1 CHARTIERS-HOUSTON SD Economically Disadvantaged 70 4.3 60.0 34.3 1.4
*Full Academic Year Students. Data for groups with less than 10 students assessed were replaced by blanks.Percentages were rounded to the nearest one-tenth.Proficiency percentages may not add up to 100 due to rounding. 182

The 2010 PSSA Writing District Level Proficiency Results - District Totals*
CountyIU
Number District Group
Number Scored Writing
% Advanced
Writing
% Proficient
Writing% Basic Writing
% Below Basic
WritingWashington 1 FORT CHERRY SD All students 243 11.1 65.4 22.2 1.2Washington 1 FORT CHERRY SD Male 135 7.4 64.4 25.9 2.2Washington 1 FORT CHERRY SD Female 108 15.7 66.7 17.6 0.0Washington 1 FORT CHERRY SD White 236 11.4 66.1 21.6 0.8Washington 1 FORT CHERRY SD Black 5Washington 1 FORT CHERRY SD Hispanic 1Washington 1 FORT CHERRY SD Asian 1Washington 1 FORT CHERRY SD Native American 0Washington 1 FORT CHERRY SD Multi-ethnic 0Washington 1 FORT CHERRY SD IEP 37 0.0 51.4 43.2 5.4Washington 1 FORT CHERRY SD ELL 2Washington 1 FORT CHERRY SD Economically Disadvantaged 71 4.2 60.6 33.8 1.4Washington 1 MCGUFFEY SD All students 500 6.4 70.6 20.6 2.4Washington 1 MCGUFFEY SD Male 262 6.5 61.5 29.0 3.1Washington 1 MCGUFFEY SD Female 237 6.3 81.0 11.4 1.3Washington 1 MCGUFFEY SD White 491 6.1 71.5 20.2 2.2Washington 1 MCGUFFEY SD Black 2Washington 1 MCGUFFEY SD Hispanic 4Washington 1 MCGUFFEY SD Asian 1Washington 1 MCGUFFEY SD Native American 0Washington 1 MCGUFFEY SD Multi-ethnic 1Washington 1 MCGUFFEY SD IEP 61 0.0 41.0 44.3 14.8Washington 1 MCGUFFEY SD ELL 1Washington 1 MCGUFFEY SD Economically Disadvantaged 173 2.3 68.8 24.9 4.0Washington 1 PETERS TOWNSHIP SD All students 1,009 22.8 71.0 6.1 0.1Washington 1 PETERS TOWNSHIP SD Male 514 20.6 71.6 7.8 0.0Washington 1 PETERS TOWNSHIP SD Female 494 25.1 70.4 4.3 0.2Washington 1 PETERS TOWNSHIP SD White 951 22.4 71.5 6.0 0.1Washington 1 PETERS TOWNSHIP SD Black 6Washington 1 PETERS TOWNSHIP SD Hispanic 11 9.1 81.8 9.1 0.0
*Full Academic Year Students. Data for groups with less than 10 students assessed were replaced by blanks.Percentages were rounded to the nearest one-tenth.Proficiency percentages may not add up to 100 due to rounding. 183

The 2010 PSSA Writing District Level Proficiency Results - District Totals*
CountyIU
Number District Group
Number Scored Writing
% Advanced
Writing
% Proficient
Writing% Basic Writing
% Below Basic
WritingWashington 1 PETERS TOWNSHIP SD Asian 33 36.4 63.6 0.0 0.0Washington 1 PETERS TOWNSHIP SD Native American 0Washington 1 PETERS TOWNSHIP SD Multi-ethnic 7Washington 1 PETERS TOWNSHIP SD IEP 93 1.1 66.7 31.2 1.1Washington 1 PETERS TOWNSHIP SD ELL 0Washington 1 PETERS TOWNSHIP SD Economically Disadvantaged 31 6.5 74.2 19.4 0.0Washington 1 RINGGOLD SD All students 681 4.7 48.9 43.5 2.9Washington 1 RINGGOLD SD Male 342 1.8 39.5 54.1 4.7Washington 1 RINGGOLD SD Female 338 7.7 58.6 32.8 0.9Washington 1 RINGGOLD SD White 596 5.2 49.8 42.8 2.2Washington 1 RINGGOLD SD Black 58 0.0 46.6 44.8 8.6Washington 1 RINGGOLD SD Hispanic 2Washington 1 RINGGOLD SD Asian 2Washington 1 RINGGOLD SD Native American 0Washington 1 RINGGOLD SD Multi-ethnic 22 0.0 31.8 63.6 4.5Washington 1 RINGGOLD SD IEP 98 0.0 13.3 74.5 12.2Washington 1 RINGGOLD SD ELL 0Washington 1 RINGGOLD SD Economically Disadvantaged 266 1.9 42.1 52.3 3.8Washington 1 TRINITY AREA SD All students 826 9.6 67.1 21.4 1.9Washington 1 TRINITY AREA SD Male 398 7.8 61.3 28.1 2.8Washington 1 TRINITY AREA SD Female 427 11.2 72.4 15.2 1.2Washington 1 TRINITY AREA SD White 787 9.7 67.1 21.3 1.9Washington 1 TRINITY AREA SD Black 22 9.1 63.6 27.3 0.0Washington 1 TRINITY AREA SD Hispanic 3Washington 1 TRINITY AREA SD Asian 9Washington 1 TRINITY AREA SD Native American 0Washington 1 TRINITY AREA SD Multi-ethnic 3Washington 1 TRINITY AREA SD IEP 105 0.0 31.4 55.2 13.3Washington 1 TRINITY AREA SD ELL 0Washington 1 TRINITY AREA SD Economically Disadvantaged 181 2.8 64.6 28.7 3.9
*Full Academic Year Students. Data for groups with less than 10 students assessed were replaced by blanks.Percentages were rounded to the nearest one-tenth.Proficiency percentages may not add up to 100 due to rounding. 184

The 2010 PSSA Writing District Level Proficiency Results - District Totals*
CountyIU
Number District Group
Number Scored Writing
% Advanced
Writing
% Proficient
Writing% Basic Writing
% Below Basic
WritingWashington 1 WASHINGTON SD All students 348 8.6 54.3 33.0 4.0Washington 1 WASHINGTON SD Male 183 8.2 48.6 39.3 3.8Washington 1 WASHINGTON SD Female 164 9.1 61.0 25.6 4.3Washington 1 WASHINGTON SD White 206 8.3 53.4 33.0 5.3Washington 1 WASHINGTON SD Black 109 10.1 54.1 33.0 2.8Washington 1 WASHINGTON SD Hispanic 3Washington 1 WASHINGTON SD Asian 2Washington 1 WASHINGTON SD Native American 2Washington 1 WASHINGTON SD Multi-ethnic 25 4.0 60.0 36.0 0.0Washington 1 WASHINGTON SD IEP 71 1.4 29.6 54.9 14.1Washington 1 WASHINGTON SD ELL 3Washington 1 WASHINGTON SD Economically Disadvantaged 226 5.3 46.9 43.4 4.4Wayne 19 WALLENPAUPACK AREA SD All students 856 11.3 66.0 20.7 2.0Wayne 19 WALLENPAUPACK AREA SD Male 419 6.4 60.6 30.5 2.4Wayne 19 WALLENPAUPACK AREA SD Female 437 16.0 71.2 11.2 1.6Wayne 19 WALLENPAUPACK AREA SD White 786 11.5 66.5 20.1 1.9Wayne 19 WALLENPAUPACK AREA SD Black 25 12.0 60.0 24.0 4.0Wayne 19 WALLENPAUPACK AREA SD Hispanic 33 9.1 57.6 33.3 0.0Wayne 19 WALLENPAUPACK AREA SD Asian 9Wayne 19 WALLENPAUPACK AREA SD Native American 2Wayne 19 WALLENPAUPACK AREA SD Multi-ethnic 1Wayne 19 WALLENPAUPACK AREA SD IEP 131 2.3 34.4 52.7 10.7Wayne 19 WALLENPAUPACK AREA SD ELL 0Wayne 19 WALLENPAUPACK AREA SD Economically Disadvantaged 382 7.6 61.3 28.5 2.6Wayne 19 WAYNE HIGHLANDS SD All students 699 7.7 71.7 20.0 0.6Wayne 19 WAYNE HIGHLANDS SD Male 351 5.1 65.2 28.8 0.9Wayne 19 WAYNE HIGHLANDS SD Female 348 10.3 78.2 11.2 0.3Wayne 19 WAYNE HIGHLANDS SD White 671 7.6 72.3 19.5 0.6Wayne 19 WAYNE HIGHLANDS SD Black 11 9.1 63.6 27.3 0.0Wayne 19 WAYNE HIGHLANDS SD Hispanic 14 14.3 42.9 42.9 0.0
*Full Academic Year Students. Data for groups with less than 10 students assessed were replaced by blanks.Percentages were rounded to the nearest one-tenth.Proficiency percentages may not add up to 100 due to rounding. 185

The 2010 PSSA Writing District Level Proficiency Results - District Totals*
CountyIU
Number District Group
Number Scored Writing
% Advanced
Writing
% Proficient
Writing% Basic Writing
% Below Basic
WritingWayne 19 WAYNE HIGHLANDS SD Asian 3Wayne 19 WAYNE HIGHLANDS SD Native American 0Wayne 19 WAYNE HIGHLANDS SD Multi-ethnic 0Wayne 19 WAYNE HIGHLANDS SD IEP 106 0.9 38.7 56.6 3.8Wayne 19 WAYNE HIGHLANDS SD ELL 0Wayne 19 WAYNE HIGHLANDS SD Economically Disadvantaged 261 7.7 60.9 30.3 1.1Wayne 19 WESTERN WAYNE SD All students 480 10.0 66.5 21.7 1.9Wayne 19 WESTERN WAYNE SD Male 250 5.6 63.2 28.0 3.2Wayne 19 WESTERN WAYNE SD Female 229 14.8 70.3 14.8 0.0Wayne 19 WESTERN WAYNE SD White 451 10.4 67.0 20.8 1.8Wayne 19 WESTERN WAYNE SD Black 8Wayne 19 WESTERN WAYNE SD Hispanic 18 5.6 61.1 33.3 0.0Wayne 19 WESTERN WAYNE SD Asian 2Wayne 19 WESTERN WAYNE SD Native American 0Wayne 19 WESTERN WAYNE SD Multi-ethnic 0Wayne 19 WESTERN WAYNE SD IEP 67 0.0 25.4 65.7 9.0Wayne 19 WESTERN WAYNE SD ELL 0Wayne 19 WESTERN WAYNE SD Economically Disadvantaged 207 7.7 61.8 28.0 2.4Westmorelan 7 BELLE VERNON AREA SD All students 606 8.3 70.1 20.3 1.3Westmorelan 7 BELLE VERNON AREA SD Male 308 5.8 64.9 26.9 2.3Westmorelan 7 BELLE VERNON AREA SD Female 296 10.8 75.7 13.2 0.3Westmorelan 7 BELLE VERNON AREA SD White 575 8.3 71.0 19.7 1.0Westmorelan 7 BELLE VERNON AREA SD Black 15 6.7 53.3 26.7 13.3Westmorelan 7 BELLE VERNON AREA SD Hispanic 4Westmorelan 7 BELLE VERNON AREA SD Asian 5Westmorelan 7 BELLE VERNON AREA SD Native American 0Westmorelan 7 BELLE VERNON AREA SD Multi-ethnic 5Westmorelan 7 BELLE VERNON AREA SD IEP 81 0.0 32.1 58.0 9.9Westmorelan 7 BELLE VERNON AREA SD ELL 4Westmorelan 7 BELLE VERNON AREA SD Economically Disadvantaged 178 2.8 62.9 32.0 2.2
*Full Academic Year Students. Data for groups with less than 10 students assessed were replaced by blanks.Percentages were rounded to the nearest one-tenth.Proficiency percentages may not add up to 100 due to rounding. 186

The 2010 PSSA Writing District Level Proficiency Results - District Totals*
CountyIU
Number District Group
Number Scored Writing
% Advanced
Writing
% Proficient
Writing% Basic Writing
% Below Basic
WritingWestmorelan 7 BURRELL SD All students 431 8.8 68.9 22.0 0.2Westmorelan 7 BURRELL SD Male 209 8.1 60.3 31.1 0.5Westmorelan 7 BURRELL SD Female 222 9.5 77.0 13.5 0.0Westmorelan 7 BURRELL SD White 408 9.1 68.6 22.1 0.2Westmorelan 7 BURRELL SD Black 10 10.0 80.0 10.0 0.0Westmorelan 7 BURRELL SD Hispanic 3Westmorelan 7 BURRELL SD Asian 5Westmorelan 7 BURRELL SD Native American 0Westmorelan 7 BURRELL SD Multi-ethnic 5Westmorelan 7 BURRELL SD IEP 55 0.0 50.9 47.3 1.8Westmorelan 7 BURRELL SD ELL 3Westmorelan 7 BURRELL SD Economically Disadvantaged 99 2.0 63.6 34.3 0.0Westmorelan 7 DERRY AREA SD All students 582 13.6 65.3 20.4 0.7Westmorelan 7 DERRY AREA SD Male 301 9.0 63.8 25.9 1.3Westmorelan 7 DERRY AREA SD Female 280 18.6 67.1 14.3 0.0Westmorelan 7 DERRY AREA SD White 565 13.6 65.5 20.2 0.7Westmorelan 7 DERRY AREA SD Black 4Westmorelan 7 DERRY AREA SD Hispanic 0Westmorelan 7 DERRY AREA SD Asian 0Westmorelan 7 DERRY AREA SD Native American 0Westmorelan 7 DERRY AREA SD Multi-ethnic 12 8.3 58.3 33.3 0.0Westmorelan 7 DERRY AREA SD IEP 45 0.0 35.6 57.8 6.7Westmorelan 7 DERRY AREA SD ELL 0Westmorelan 7 DERRY AREA SD Economically Disadvantaged 242 6.6 68.6 24.0 0.8Westmorelan 7 FRANKLIN REGIONAL SD All students 873 20.5 68.5 11.0 0.0Westmorelan 7 FRANKLIN REGIONAL SD Male 457 15.3 69.6 15.1 0.0Westmorelan 7 FRANKLIN REGIONAL SD Female 414 26.3 67.6 6.0 0.0Westmorelan 7 FRANKLIN REGIONAL SD White 818 20.3 68.9 10.8 0.0Westmorelan 7 FRANKLIN REGIONAL SD Black 8Westmorelan 7 FRANKLIN REGIONAL SD Hispanic 7
*Full Academic Year Students. Data for groups with less than 10 students assessed were replaced by blanks.Percentages were rounded to the nearest one-tenth.Proficiency percentages may not add up to 100 due to rounding. 187

The 2010 PSSA Writing District Level Proficiency Results - District Totals*
CountyIU
Number District Group
Number Scored Writing
% Advanced
Writing
% Proficient
Writing% Basic Writing
% Below Basic
WritingWestmorelan 7 FRANKLIN REGIONAL SD Asian 32 31.3 65.6 3.1 0.0Westmorelan 7 FRANKLIN REGIONAL SD Native American 6Westmorelan 7 FRANKLIN REGIONAL SD Multi-ethnic 0Westmorelan 7 FRANKLIN REGIONAL SD IEP 113 4.4 57.5 38.1 0.0Westmorelan 7 FRANKLIN REGIONAL SD ELL 1Westmorelan 7 FRANKLIN REGIONAL SD Economically Disadvantaged 97 11.3 61.9 26.8 0.0Westmorelan 7 GREATER LATROBE SD All students 973 16.6 71.6 11.3 0.4Westmorelan 7 GREATER LATROBE SD Male 505 12.9 70.5 16.0 0.6Westmorelan 7 GREATER LATROBE SD Female 465 20.9 73.1 6.0 0.0Westmorelan 7 GREATER LATROBE SD White 947 16.7 72.0 11.0 0.3Westmorelan 7 GREATER LATROBE SD Black 4Westmorelan 7 GREATER LATROBE SD Hispanic 1Westmorelan 7 GREATER LATROBE SD Asian 9Westmorelan 7 GREATER LATROBE SD Native American 0Westmorelan 7 GREATER LATROBE SD Multi-ethnic 9Westmorelan 7 GREATER LATROBE SD IEP 87 1.1 52.9 42.5 3.4Westmorelan 7 GREATER LATROBE SD ELL 0Westmorelan 7 GREATER LATROBE SD Economically Disadvantaged 223 7.6 73.1 18.4 0.9Westmorelan 7 GREENSBURG SALEM SD All students 667 9.3 78.4 12.0 0.3Westmorelan 7 GREENSBURG SALEM SD Male 325 5.8 78.8 15.1 0.3Westmorelan 7 GREENSBURG SALEM SD Female 340 12.6 78.5 8.8 0.0Westmorelan 7 GREENSBURG SALEM SD White 598 9.7 78.6 11.5 0.2Westmorelan 7 GREENSBURG SALEM SD Black 35 5.7 80.0 14.3 0.0Westmorelan 7 GREENSBURG SALEM SD Hispanic 5Westmorelan 7 GREENSBURG SALEM SD Asian 9Westmorelan 7 GREENSBURG SALEM SD Native American 0Westmorelan 7 GREENSBURG SALEM SD Multi-ethnic 18 11.1 66.7 22.2 0.0Westmorelan 7 GREENSBURG SALEM SD IEP 79 2.5 57.0 40.5 0.0Westmorelan 7 GREENSBURG SALEM SD ELL 0Westmorelan 7 GREENSBURG SALEM SD Economically Disadvantaged 241 4.6 76.3 19.1 0.0
*Full Academic Year Students. Data for groups with less than 10 students assessed were replaced by blanks.Percentages were rounded to the nearest one-tenth.Proficiency percentages may not add up to 100 due to rounding. 188

The 2010 PSSA Writing District Level Proficiency Results - District Totals*
CountyIU
Number District Group
Number Scored Writing
% Advanced
Writing
% Proficient
Writing% Basic Writing
% Below Basic
WritingWestmorelan 7 HEMPFIELD AREA SD All students 1,433 11.2 73.7 14.7 0.5Westmorelan 7 HEMPFIELD AREA SD Male 751 6.7 71.6 20.9 0.8Westmorelan 7 HEMPFIELD AREA SD Female 682 16.1 76.0 7.8 0.1Westmorelan 7 HEMPFIELD AREA SD White 1,374 11.1 73.9 14.5 0.5Westmorelan 7 HEMPFIELD AREA SD Black 23 8.7 65.2 26.1 0.0Westmorelan 7 HEMPFIELD AREA SD Hispanic 3Westmorelan 7 HEMPFIELD AREA SD Asian 18 22.2 61.1 16.7 0.0Westmorelan 7 HEMPFIELD AREA SD Native American 4Westmorelan 7 HEMPFIELD AREA SD Multi-ethnic 11 9.1 81.8 9.1 0.0Westmorelan 7 HEMPFIELD AREA SD IEP 152 1.3 55.3 40.1 3.3Westmorelan 7 HEMPFIELD AREA SD ELL 3Westmorelan 7 HEMPFIELD AREA SD Economically Disadvantaged 279 6.5 67.7 24.7 1.1Westmorelan 7 JEANNETTE CITY SD All students 274 5.1 70.1 21.9 2.9Westmorelan 7 JEANNETTE CITY SD Male 133 3.8 60.9 30.8 4.5Westmorelan 7 JEANNETTE CITY SD Female 140 6.4 79.3 13.6 0.7Westmorelan 7 JEANNETTE CITY SD White 212 5.7 72.6 19.3 2.4Westmorelan 7 JEANNETTE CITY SD Black 59 3.4 61.0 32.2 3.4Westmorelan 7 JEANNETTE CITY SD Hispanic 1Westmorelan 7 JEANNETTE CITY SD Asian 1Westmorelan 7 JEANNETTE CITY SD Native American 0Westmorelan 7 JEANNETTE CITY SD Multi-ethnic 0Westmorelan 7 JEANNETTE CITY SD IEP 38 0.0 23.7 57.9 18.4Westmorelan 7 JEANNETTE CITY SD ELL 0Westmorelan 7 JEANNETTE CITY SD Economically Disadvantaged 176 2.3 67.0 26.7 4.0Westmorelan 7 KISKI AREA SD All students 940 11.1 74.0 14.1 0.7Westmorelan 7 KISKI AREA SD Male 483 8.3 70.8 19.7 1.2Westmorelan 7 KISKI AREA SD Female 457 14.0 77.5 8.3 0.2Westmorelan 7 KISKI AREA SD White 893 11.1 74.0 14.2 0.7Westmorelan 7 KISKI AREA SD Black 37 10.8 73.0 13.5 2.7Westmorelan 7 KISKI AREA SD Hispanic 2
*Full Academic Year Students. Data for groups with less than 10 students assessed were replaced by blanks.Percentages were rounded to the nearest one-tenth.Proficiency percentages may not add up to 100 due to rounding. 189

The 2010 PSSA Writing District Level Proficiency Results - District Totals*
CountyIU
Number District Group
Number Scored Writing
% Advanced
Writing
% Proficient
Writing% Basic Writing
% Below Basic
WritingWestmorelan 7 KISKI AREA SD Asian 2Westmorelan 7 KISKI AREA SD Native American 4Westmorelan 7 KISKI AREA SD Multi-ethnic 2Westmorelan 7 KISKI AREA SD IEP 127 1.6 54.3 40.2 3.9Westmorelan 7 KISKI AREA SD ELL 0Westmorelan 7 KISKI AREA SD Economically Disadvantaged 304 6.9 71.1 21.4 0.7Westmorelan 7 LIGONIER VALLEY SD All students 405 15.1 64.2 20.5 0.2Westmorelan 7 LIGONIER VALLEY SD Male 222 10.4 58.1 31.1 0.5Westmorelan 7 LIGONIER VALLEY SD Female 183 20.8 71.6 7.7 0.0Westmorelan 7 LIGONIER VALLEY SD White 400 15.3 63.8 20.8 0.3Westmorelan 7 LIGONIER VALLEY SD Black 0Westmorelan 7 LIGONIER VALLEY SD Hispanic 2Westmorelan 7 LIGONIER VALLEY SD Asian 1Westmorelan 7 LIGONIER VALLEY SD Native American 0Westmorelan 7 LIGONIER VALLEY SD Multi-ethnic 2Westmorelan 7 LIGONIER VALLEY SD IEP 32 0.0 31.3 68.8 0.0Westmorelan 7 LIGONIER VALLEY SD ELL 0Westmorelan 7 LIGONIER VALLEY SD Economically Disadvantaged 143 9.1 64.3 26.6 0.0Westmorelan 7 MONESSEN CITY SD All students 190 1.6 66.3 28.9 3.2Westmorelan 7 MONESSEN CITY SD Male 89 1.1 65.2 29.2 4.5Westmorelan 7 MONESSEN CITY SD Female 101 2.0 67.3 28.7 2.0Westmorelan 7 MONESSEN CITY SD White 104 2.9 76.0 17.3 3.8Westmorelan 7 MONESSEN CITY SD Black 58 0.0 56.9 39.7 3.4Westmorelan 7 MONESSEN CITY SD Hispanic 1Westmorelan 7 MONESSEN CITY SD Asian 0Westmorelan 7 MONESSEN CITY SD Native American 0Westmorelan 7 MONESSEN CITY SD Multi-ethnic 27 0.0 51.9 48.1 0.0Westmorelan 7 MONESSEN CITY SD IEP 26 0.0 15.4 61.5 23.1Westmorelan 7 MONESSEN CITY SD ELL 0Westmorelan 7 MONESSEN CITY SD Economically Disadvantaged 124 2.4 58.1 35.5 4.0
*Full Academic Year Students. Data for groups with less than 10 students assessed were replaced by blanks.Percentages were rounded to the nearest one-tenth.Proficiency percentages may not add up to 100 due to rounding. 190

The 2010 PSSA Writing District Level Proficiency Results - District Totals*
CountyIU
Number District Group
Number Scored Writing
% Advanced
Writing
% Proficient
Writing% Basic Writing
% Below Basic
WritingWestmorelan 7 MOUNT PLEASANT AREA SD All students 520 20.8 61.2 16.3 1.7Westmorelan 7 MOUNT PLEASANT AREA SD Male 276 14.9 62.7 20.7 1.8Westmorelan 7 MOUNT PLEASANT AREA SD Female 243 27.6 59.7 11.5 1.2Westmorelan 7 MOUNT PLEASANT AREA SD White 500 21.4 60.8 16.2 1.6Westmorelan 7 MOUNT PLEASANT AREA SD Black 10 10.0 70.0 20.0 0.0Westmorelan 7 MOUNT PLEASANT AREA SD Hispanic 1Westmorelan 7 MOUNT PLEASANT AREA SD Asian 2Westmorelan 7 MOUNT PLEASANT AREA SD Native American 0Westmorelan 7 MOUNT PLEASANT AREA SD Multi-ethnic 6Westmorelan 7 MOUNT PLEASANT AREA SD IEP 68 5.9 38.2 51.5 4.4Westmorelan 7 MOUNT PLEASANT AREA SD ELL 0Westmorelan 7 MOUNT PLEASANT AREA SD Economically Disadvantaged 180 12.8 60.6 24.4 2.2Westmorelan 7 NEW KENSINGTON-ARNOLD S All students 468 8.5 51.3 37.6 2.6Westmorelan 7 NEW KENSINGTON-ARNOLD S Male 240 6.3 45.4 45.0 3.3Westmorelan 7 NEW KENSINGTON-ARNOLD S Female 228 11.0 57.5 29.8 1.8Westmorelan 7 NEW KENSINGTON-ARNOLD S White 289 10.0 56.7 30.4 2.8Westmorelan 7 NEW KENSINGTON-ARNOLD S Black 141 7.8 42.6 48.2 1.4Westmorelan 7 NEW KENSINGTON-ARNOLD S Hispanic 10 0.0 60.0 30.0 10.0Westmorelan 7 NEW KENSINGTON-ARNOLD S Asian 3Westmorelan 7 NEW KENSINGTON-ARNOLD S Native American 0Westmorelan 7 NEW KENSINGTON-ARNOLD S Multi-ethnic 25 0.0 32.0 64.0 4.0Westmorelan 7 NEW KENSINGTON-ARNOLD S IEP 94 1.1 34.0 55.3 9.6Westmorelan 7 NEW KENSINGTON-ARNOLD S ELL 3Westmorelan 7 NEW KENSINGTON-ARNOLD S Economically Disadvantaged 249 5.6 47.8 44.2 2.4Westmorelan 7 NORWIN SD All students 1,256 18.5 69.8 11.0 0.7Westmorelan 7 NORWIN SD Male 636 15.3 70.6 12.9 1.3Westmorelan 7 NORWIN SD Female 620 21.8 69.0 9.0 0.2Westmorelan 7 NORWIN SD White 1,227 18.6 69.7 11.0 0.7Westmorelan 7 NORWIN SD Black 11 0.0 90.9 9.1 0.0Westmorelan 7 NORWIN SD Hispanic 1
*Full Academic Year Students. Data for groups with less than 10 students assessed were replaced by blanks.Percentages were rounded to the nearest one-tenth.Proficiency percentages may not add up to 100 due to rounding. 191

The 2010 PSSA Writing District Level Proficiency Results - District Totals*
CountyIU
Number District Group
Number Scored Writing
% Advanced
Writing
% Proficient
Writing% Basic Writing
% Below Basic
WritingWestmorelan 7 NORWIN SD Asian 14 21.4 64.3 14.3 0.0Westmorelan 7 NORWIN SD Native American 2Westmorelan 7 NORWIN SD Multi-ethnic 1Westmorelan 7 NORWIN SD IEP 116 1.7 47.4 43.1 7.8Westmorelan 7 NORWIN SD ELL 3Westmorelan 7 NORWIN SD Economically Disadvantaged 222 13.1 63.5 22.5 0.9Westmorelan 7 PENN-TRAFFORD SD All students 1,016 13.2 73.2 13.0 0.6Westmorelan 7 PENN-TRAFFORD SD Male 519 7.1 74.6 17.1 1.2Westmorelan 7 PENN-TRAFFORD SD Female 497 19.5 71.8 8.7 0.0Westmorelan 7 PENN-TRAFFORD SD White 998 13.4 73.0 12.9 0.6Westmorelan 7 PENN-TRAFFORD SD Black 9Westmorelan 7 PENN-TRAFFORD SD Hispanic 2Westmorelan 7 PENN-TRAFFORD SD Asian 5Westmorelan 7 PENN-TRAFFORD SD Native American 1Westmorelan 7 PENN-TRAFFORD SD Multi-ethnic 0Westmorelan 7 PENN-TRAFFORD SD IEP 64 1.6 31.3 60.9 6.3Westmorelan 7 PENN-TRAFFORD SD ELL 0Westmorelan 7 PENN-TRAFFORD SD Economically Disadvantaged 136 2.9 72.8 21.3 2.9Westmorelan 7 SOUTHMORELAND SD All students 455 11.2 64.6 22.6 1.5Westmorelan 7 SOUTHMORELAND SD Male 230 8.3 60.9 28.7 2.2Westmorelan 7 SOUTHMORELAND SD Female 225 14.2 68.4 16.4 0.9Westmorelan 7 SOUTHMORELAND SD White 434 11.3 65.0 22.1 1.6Westmorelan 7 SOUTHMORELAND SD Black 12 8.3 58.3 33.3 0.0Westmorelan 7 SOUTHMORELAND SD Hispanic 2Westmorelan 7 SOUTHMORELAND SD Asian 4Westmorelan 7 SOUTHMORELAND SD Native American 3Westmorelan 7 SOUTHMORELAND SD Multi-ethnic 0Westmorelan 7 SOUTHMORELAND SD IEP 61 0.0 36.1 54.1 9.8Westmorelan 7 SOUTHMORELAND SD ELL 1Westmorelan 7 SOUTHMORELAND SD Economically Disadvantaged 201 8.5 60.2 29.4 2.0
*Full Academic Year Students. Data for groups with less than 10 students assessed were replaced by blanks.Percentages were rounded to the nearest one-tenth.Proficiency percentages may not add up to 100 due to rounding. 192
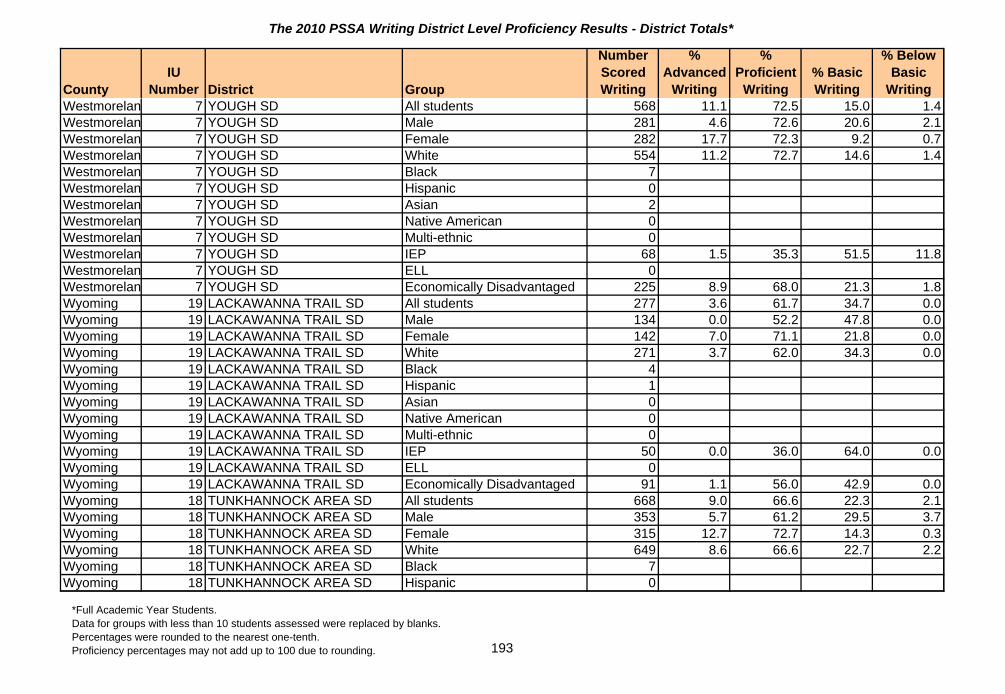
The 2010 PSSA Writing District Level Proficiency Results - District Totals*
CountyIU
Number District Group
Number Scored Writing
% Advanced
Writing
% Proficient
Writing% Basic Writing
% Below Basic
WritingWestmorelan 7 YOUGH SD All students 568 11.1 72.5 15.0 1.4Westmorelan 7 YOUGH SD Male 281 4.6 72.6 20.6 2.1Westmorelan 7 YOUGH SD Female 282 17.7 72.3 9.2 0.7Westmorelan 7 YOUGH SD White 554 11.2 72.7 14.6 1.4Westmorelan 7 YOUGH SD Black 7Westmorelan 7 YOUGH SD Hispanic 0Westmorelan 7 YOUGH SD Asian 2Westmorelan 7 YOUGH SD Native American 0Westmorelan 7 YOUGH SD Multi-ethnic 0Westmorelan 7 YOUGH SD IEP 68 1.5 35.3 51.5 11.8Westmorelan 7 YOUGH SD ELL 0Westmorelan 7 YOUGH SD Economically Disadvantaged 225 8.9 68.0 21.3 1.8Wyoming 19 LACKAWANNA TRAIL SD All students 277 3.6 61.7 34.7 0.0Wyoming 19 LACKAWANNA TRAIL SD Male 134 0.0 52.2 47.8 0.0Wyoming 19 LACKAWANNA TRAIL SD Female 142 7.0 71.1 21.8 0.0Wyoming 19 LACKAWANNA TRAIL SD White 271 3.7 62.0 34.3 0.0Wyoming 19 LACKAWANNA TRAIL SD Black 4Wyoming 19 LACKAWANNA TRAIL SD Hispanic 1Wyoming 19 LACKAWANNA TRAIL SD Asian 0Wyoming 19 LACKAWANNA TRAIL SD Native American 0Wyoming 19 LACKAWANNA TRAIL SD Multi-ethnic 0Wyoming 19 LACKAWANNA TRAIL SD IEP 50 0.0 36.0 64.0 0.0Wyoming 19 LACKAWANNA TRAIL SD ELL 0Wyoming 19 LACKAWANNA TRAIL SD Economically Disadvantaged 91 1.1 56.0 42.9 0.0Wyoming 18 TUNKHANNOCK AREA SD All students 668 9.0 66.6 22.3 2.1Wyoming 18 TUNKHANNOCK AREA SD Male 353 5.7 61.2 29.5 3.7Wyoming 18 TUNKHANNOCK AREA SD Female 315 12.7 72.7 14.3 0.3Wyoming 18 TUNKHANNOCK AREA SD White 649 8.6 66.6 22.7 2.2Wyoming 18 TUNKHANNOCK AREA SD Black 7Wyoming 18 TUNKHANNOCK AREA SD Hispanic 0
*Full Academic Year Students. Data for groups with less than 10 students assessed were replaced by blanks.Percentages were rounded to the nearest one-tenth.Proficiency percentages may not add up to 100 due to rounding. 193
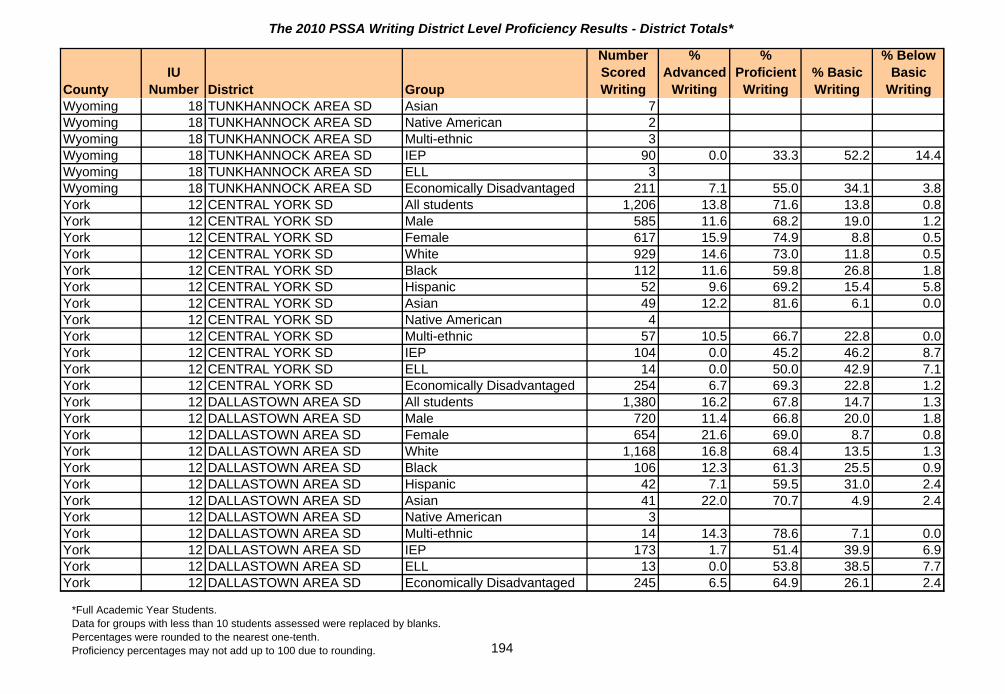
The 2010 PSSA Writing District Level Proficiency Results - District Totals*
CountyIU
Number District Group
Number Scored Writing
% Advanced
Writing
% Proficient
Writing% Basic Writing
% Below Basic
WritingWyoming 18 TUNKHANNOCK AREA SD Asian 7Wyoming 18 TUNKHANNOCK AREA SD Native American 2Wyoming 18 TUNKHANNOCK AREA SD Multi-ethnic 3Wyoming 18 TUNKHANNOCK AREA SD IEP 90 0.0 33.3 52.2 14.4Wyoming 18 TUNKHANNOCK AREA SD ELL 3Wyoming 18 TUNKHANNOCK AREA SD Economically Disadvantaged 211 7.1 55.0 34.1 3.8York 12 CENTRAL YORK SD All students 1,206 13.8 71.6 13.8 0.8York 12 CENTRAL YORK SD Male 585 11.6 68.2 19.0 1.2York 12 CENTRAL YORK SD Female 617 15.9 74.9 8.8 0.5York 12 CENTRAL YORK SD White 929 14.6 73.0 11.8 0.5York 12 CENTRAL YORK SD Black 112 11.6 59.8 26.8 1.8York 12 CENTRAL YORK SD Hispanic 52 9.6 69.2 15.4 5.8York 12 CENTRAL YORK SD Asian 49 12.2 81.6 6.1 0.0York 12 CENTRAL YORK SD Native American 4York 12 CENTRAL YORK SD Multi-ethnic 57 10.5 66.7 22.8 0.0York 12 CENTRAL YORK SD IEP 104 0.0 45.2 46.2 8.7York 12 CENTRAL YORK SD ELL 14 0.0 50.0 42.9 7.1York 12 CENTRAL YORK SD Economically Disadvantaged 254 6.7 69.3 22.8 1.2York 12 DALLASTOWN AREA SD All students 1,380 16.2 67.8 14.7 1.3York 12 DALLASTOWN AREA SD Male 720 11.4 66.8 20.0 1.8York 12 DALLASTOWN AREA SD Female 654 21.6 69.0 8.7 0.8York 12 DALLASTOWN AREA SD White 1,168 16.8 68.4 13.5 1.3York 12 DALLASTOWN AREA SD Black 106 12.3 61.3 25.5 0.9York 12 DALLASTOWN AREA SD Hispanic 42 7.1 59.5 31.0 2.4York 12 DALLASTOWN AREA SD Asian 41 22.0 70.7 4.9 2.4York 12 DALLASTOWN AREA SD Native American 3York 12 DALLASTOWN AREA SD Multi-ethnic 14 14.3 78.6 7.1 0.0York 12 DALLASTOWN AREA SD IEP 173 1.7 51.4 39.9 6.9York 12 DALLASTOWN AREA SD ELL 13 0.0 53.8 38.5 7.7York 12 DALLASTOWN AREA SD Economically Disadvantaged 245 6.5 64.9 26.1 2.4
*Full Academic Year Students. Data for groups with less than 10 students assessed were replaced by blanks.Percentages were rounded to the nearest one-tenth.Proficiency percentages may not add up to 100 due to rounding. 194

The 2010 PSSA Writing District Level Proficiency Results - District Totals*
CountyIU
Number District Group
Number Scored Writing
% Advanced
Writing
% Proficient
Writing% Basic Writing
% Below Basic
WritingYork 12 DOVER AREA SD All students 773 5.6 61.3 29.9 3.2York 12 DOVER AREA SD Male 411 2.4 54.7 38.7 4.1York 12 DOVER AREA SD Female 361 9.1 68.7 19.9 2.2York 12 DOVER AREA SD White 706 5.4 62.7 29.2 2.7York 12 DOVER AREA SD Black 33 12.1 33.3 39.4 15.2York 12 DOVER AREA SD Hispanic 18 5.6 44.4 50.0 0.0York 12 DOVER AREA SD Asian 6York 12 DOVER AREA SD Native American 2York 12 DOVER AREA SD Multi-ethnic 7York 12 DOVER AREA SD IEP 112 0.9 25.0 57.1 17.0York 12 DOVER AREA SD ELL 5York 12 DOVER AREA SD Economically Disadvantaged 208 3.8 49.0 42.3 4.8York 12 EASTERN YORK SD All students 586 4.1 62.6 29.9 3.4York 12 EASTERN YORK SD Male 308 2.9 54.2 38.0 4.9York 12 EASTERN YORK SD Female 274 5.5 72.3 20.4 1.8York 12 EASTERN YORK SD White 555 4.1 62.3 29.9 3.6York 12 EASTERN YORK SD Black 8York 12 EASTERN YORK SD Hispanic 13 7.7 69.2 23.1 0.0York 12 EASTERN YORK SD Asian 4York 12 EASTERN YORK SD Native American 1York 12 EASTERN YORK SD Multi-ethnic 1York 12 EASTERN YORK SD IEP 96 2.1 36.5 43.8 17.7York 12 EASTERN YORK SD ELL 0York 12 EASTERN YORK SD Economically Disadvantaged 131 2.3 53.4 38.2 6.1York 12 HANOVER PUBLIC SD All students 334 6.0 67.1 25.1 1.8York 12 HANOVER PUBLIC SD Male 156 1.9 68.6 26.9 2.6York 12 HANOVER PUBLIC SD Female 172 9.9 67.4 21.5 1.2York 12 HANOVER PUBLIC SD White 268 6.3 70.9 21.6 1.1York 12 HANOVER PUBLIC SD Black 12 0.0 58.3 41.7 0.0York 12 HANOVER PUBLIC SD Hispanic 36 0.0 58.3 36.1 5.6
*Full Academic Year Students. Data for groups with less than 10 students assessed were replaced by blanks.Percentages were rounded to the nearest one-tenth.Proficiency percentages may not add up to 100 due to rounding. 195

The 2010 PSSA Writing District Level Proficiency Results - District Totals*
CountyIU
Number District Group
Number Scored Writing
% Advanced
Writing
% Proficient
Writing% Basic Writing
% Below Basic
WritingYork 12 HANOVER PUBLIC SD Asian 7York 12 HANOVER PUBLIC SD Native American 0York 12 HANOVER PUBLIC SD Multi-ethnic 5York 12 HANOVER PUBLIC SD IEP 46 0.0 26.1 67.4 6.5York 12 HANOVER PUBLIC SD ELL 8York 12 HANOVER PUBLIC SD Economically Disadvantaged 143 1.4 56.6 38.5 3.5York 12 NORTHEASTERN YORK SD All students 792 7.8 73.0 18.2 1.0York 12 NORTHEASTERN YORK SD Male 392 5.9 67.6 25.3 1.3York 12 NORTHEASTERN YORK SD Female 399 9.8 78.2 11.3 0.8York 12 NORTHEASTERN YORK SD White 648 7.9 74.4 17.1 0.6York 12 NORTHEASTERN YORK SD Black 102 4.9 70.6 21.6 2.9York 12 NORTHEASTERN YORK SD Hispanic 29 17.2 51.7 31.0 0.0York 12 NORTHEASTERN YORK SD Asian 10 10.0 60.0 20.0 10.0York 12 NORTHEASTERN YORK SD Native American 1York 12 NORTHEASTERN YORK SD Multi-ethnic 1York 12 NORTHEASTERN YORK SD IEP 128 0.0 44.5 49.2 6.3York 12 NORTHEASTERN YORK SD ELL 1York 12 NORTHEASTERN YORK SD Economically Disadvantaged 277 6.5 69.0 23.5 1.1York 15 NORTHERN YORK CO SD All students 728 9.6 75.8 13.6 1.0York 15 NORTHERN YORK CO SD Male 374 7.5 73.3 17.4 1.9York 15 NORTHERN YORK CO SD Female 354 11.9 78.5 9.6 0.0York 15 NORTHERN YORK CO SD White 691 9.7 76.0 13.3 1.0York 15 NORTHERN YORK CO SD Black 7York 15 NORTHERN YORK CO SD Hispanic 12 16.7 75.0 8.3 0.0York 15 NORTHERN YORK CO SD Asian 10 0.0 90.0 10.0 0.0York 15 NORTHERN YORK CO SD Native American 3York 15 NORTHERN YORK CO SD Multi-ethnic 5York 15 NORTHERN YORK CO SD IEP 83 2.4 51.8 42.2 3.6York 15 NORTHERN YORK CO SD ELL 1York 15 NORTHERN YORK CO SD Economically Disadvantaged 90 3.3 68.9 27.8 0.0
*Full Academic Year Students. Data for groups with less than 10 students assessed were replaced by blanks.Percentages were rounded to the nearest one-tenth.Proficiency percentages may not add up to 100 due to rounding. 196

The 2010 PSSA Writing District Level Proficiency Results - District Totals*
CountyIU
Number District Group
Number Scored Writing
% Advanced
Writing
% Proficient
Writing% Basic Writing
% Below Basic
WritingYork 12 RED LION AREA SD All students 1,321 6.8 57.9 32.2 3.0York 12 RED LION AREA SD Male 680 5.0 49.0 40.7 5.3York 12 RED LION AREA SD Female 637 8.8 67.5 23.1 0.6York 12 RED LION AREA SD White 1,212 6.8 57.4 32.5 3.3York 12 RED LION AREA SD Black 51 2.0 66.7 31.4 0.0York 12 RED LION AREA SD Hispanic 25 16.0 60.0 24.0 0.0York 12 RED LION AREA SD Asian 16 12.5 62.5 25.0 0.0York 12 RED LION AREA SD Native American 1York 12 RED LION AREA SD Multi-ethnic 12 0.0 66.7 33.3 0.0York 12 RED LION AREA SD IEP 199 0.0 23.6 63.8 12.6York 12 RED LION AREA SD ELL 6York 12 RED LION AREA SD Economically Disadvantaged 328 3.0 51.5 40.9 4.6York 12 SOUTH EASTERN SD All students 738 6.5 71.5 20.7 1.2York 12 SOUTH EASTERN SD Male 378 2.4 68.3 27.2 2.1York 12 SOUTH EASTERN SD Female 358 10.9 75.1 13.7 0.3York 12 SOUTH EASTERN SD White 713 6.6 71.8 20.3 1.3York 12 SOUTH EASTERN SD Black 8York 12 SOUTH EASTERN SD Hispanic 4York 12 SOUTH EASTERN SD Asian 4York 12 SOUTH EASTERN SD Native American 4York 12 SOUTH EASTERN SD Multi-ethnic 3York 12 SOUTH EASTERN SD IEP 99 0.0 39.4 54.5 6.1York 12 SOUTH EASTERN SD ELL 0York 12 SOUTH EASTERN SD Economically Disadvantaged 127 4.7 66.9 28.3 0.0York 12 SOUTH WESTERN SD All students 892 7.8 69.4 20.9 1.9York 12 SOUTH WESTERN SD Male 470 3.0 64.5 28.9 3.6York 12 SOUTH WESTERN SD Female 421 13.3 74.8 11.9 0.0York 12 SOUTH WESTERN SD White 826 8.0 69.4 20.8 1.8York 12 SOUTH WESTERN SD Black 32 3.1 65.6 25.0 6.3York 12 SOUTH WESTERN SD Hispanic 13 0.0 61.5 38.5 0.0
*Full Academic Year Students. Data for groups with less than 10 students assessed were replaced by blanks.Percentages were rounded to the nearest one-tenth.Proficiency percentages may not add up to 100 due to rounding. 197

The 2010 PSSA Writing District Level Proficiency Results - District Totals*
CountyIU
Number District Group
Number Scored Writing
% Advanced
Writing
% Proficient
Writing% Basic Writing
% Below Basic
WritingYork 12 SOUTH WESTERN SD Asian 18 16.7 77.8 5.6 0.0York 12 SOUTH WESTERN SD Native American 1York 12 SOUTH WESTERN SD Multi-ethnic 1York 12 SOUTH WESTERN SD IEP 114 1.8 36.8 49.1 12.3York 12 SOUTH WESTERN SD ELL 0York 12 SOUTH WESTERN SD Economically Disadvantaged 173 5.8 64.7 27.7 1.7York 12 SOUTHERN YORK CO SD All students 709 23.0 59.9 16.4 0.7York 12 SOUTHERN YORK CO SD Male 367 14.2 63.5 21.3 1.1York 12 SOUTHERN YORK CO SD Female 341 32.6 56.0 11.1 0.3York 12 SOUTHERN YORK CO SD White 670 23.0 60.1 16.1 0.7York 12 SOUTHERN YORK CO SD Black 23 26.1 60.9 13.0 0.0York 12 SOUTHERN YORK CO SD Hispanic 9York 12 SOUTHERN YORK CO SD Asian 6York 12 SOUTHERN YORK CO SD Native American 0York 12 SOUTHERN YORK CO SD Multi-ethnic 0York 12 SOUTHERN YORK CO SD IEP 112 4.5 55.4 37.5 2.7York 12 SOUTHERN YORK CO SD ELL 2York 12 SOUTHERN YORK CO SD Economically Disadvantaged 109 11.0 53.2 33.0 2.8York 12 SPRING GROVE AREA SD All students 928 6.5 66.5 24.5 2.6York 12 SPRING GROVE AREA SD Male 510 3.9 59.2 33.1 3.7York 12 SPRING GROVE AREA SD Female 417 9.6 75.3 13.9 1.2York 12 SPRING GROVE AREA SD White 851 6.8 67.2 23.6 2.4York 12 SPRING GROVE AREA SD Black 44 2.3 56.8 36.4 4.5York 12 SPRING GROVE AREA SD Hispanic 18 0.0 61.1 33.3 5.6York 12 SPRING GROVE AREA SD Asian 8York 12 SPRING GROVE AREA SD Native American 5York 12 SPRING GROVE AREA SD Multi-ethnic 1York 12 SPRING GROVE AREA SD IEP 105 1.0 32.4 53.3 13.3York 12 SPRING GROVE AREA SD ELL 4York 12 SPRING GROVE AREA SD Economically Disadvantaged 250 3.2 58.4 33.6 4.8
*Full Academic Year Students. Data for groups with less than 10 students assessed were replaced by blanks.Percentages were rounded to the nearest one-tenth.Proficiency percentages may not add up to 100 due to rounding. 198
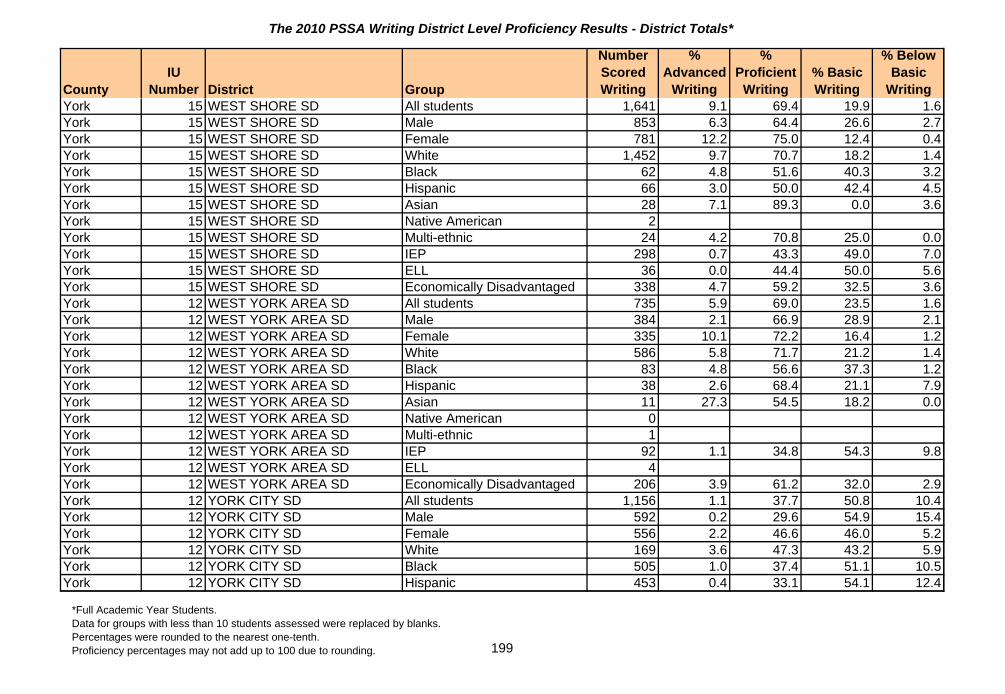
The 2010 PSSA Writing District Level Proficiency Results - District Totals*
CountyIU
Number District Group
Number Scored Writing
% Advanced
Writing
% Proficient
Writing% Basic Writing
% Below Basic
WritingYork 15 WEST SHORE SD All students 1,641 9.1 69.4 19.9 1.6York 15 WEST SHORE SD Male 853 6.3 64.4 26.6 2.7York 15 WEST SHORE SD Female 781 12.2 75.0 12.4 0.4York 15 WEST SHORE SD White 1,452 9.7 70.7 18.2 1.4York 15 WEST SHORE SD Black 62 4.8 51.6 40.3 3.2York 15 WEST SHORE SD Hispanic 66 3.0 50.0 42.4 4.5York 15 WEST SHORE SD Asian 28 7.1 89.3 0.0 3.6York 15 WEST SHORE SD Native American 2York 15 WEST SHORE SD Multi-ethnic 24 4.2 70.8 25.0 0.0York 15 WEST SHORE SD IEP 298 0.7 43.3 49.0 7.0York 15 WEST SHORE SD ELL 36 0.0 44.4 50.0 5.6York 15 WEST SHORE SD Economically Disadvantaged 338 4.7 59.2 32.5 3.6York 12 WEST YORK AREA SD All students 735 5.9 69.0 23.5 1.6York 12 WEST YORK AREA SD Male 384 2.1 66.9 28.9 2.1York 12 WEST YORK AREA SD Female 335 10.1 72.2 16.4 1.2York 12 WEST YORK AREA SD White 586 5.8 71.7 21.2 1.4York 12 WEST YORK AREA SD Black 83 4.8 56.6 37.3 1.2York 12 WEST YORK AREA SD Hispanic 38 2.6 68.4 21.1 7.9York 12 WEST YORK AREA SD Asian 11 27.3 54.5 18.2 0.0York 12 WEST YORK AREA SD Native American 0York 12 WEST YORK AREA SD Multi-ethnic 1York 12 WEST YORK AREA SD IEP 92 1.1 34.8 54.3 9.8York 12 WEST YORK AREA SD ELL 4York 12 WEST YORK AREA SD Economically Disadvantaged 206 3.9 61.2 32.0 2.9York 12 YORK CITY SD All students 1,156 1.1 37.7 50.8 10.4York 12 YORK CITY SD Male 592 0.2 29.6 54.9 15.4York 12 YORK CITY SD Female 556 2.2 46.6 46.0 5.2York 12 YORK CITY SD White 169 3.6 47.3 43.2 5.9York 12 YORK CITY SD Black 505 1.0 37.4 51.1 10.5York 12 YORK CITY SD Hispanic 453 0.4 33.1 54.1 12.4
*Full Academic Year Students. Data for groups with less than 10 students assessed were replaced by blanks.Percentages were rounded to the nearest one-tenth.Proficiency percentages may not add up to 100 due to rounding. 199

The 2010 PSSA Writing District Level Proficiency Results - District Totals*
CountyIU
Number District Group
Number Scored Writing
% Advanced
Writing
% Proficient
Writing% Basic Writing
% Below Basic
WritingYork 12 YORK CITY SD Asian 13 0.0 69.2 23.1 7.7York 12 YORK CITY SD Native American 0York 12 YORK CITY SD Multi-ethnic 8York 12 YORK CITY SD IEP 281 0.0 11.4 59.1 29.5York 12 YORK CITY SD ELL 208 0.0 19.2 63.0 17.8York 12 YORK CITY SD Economically Disadvantaged 945 0.8 35.8 52.3 11.1York 12 YORK SUBURBAN SD All students 631 14.6 64.0 20.1 1.3York 12 YORK SUBURBAN SD Male 325 10.2 59.4 29.2 1.2York 12 YORK SUBURBAN SD Female 306 19.3 69.0 10.5 1.3York 12 YORK SUBURBAN SD White 520 15.6 64.6 18.7 1.2York 12 YORK SUBURBAN SD Black 54 7.4 51.9 37.0 3.7York 12 YORK SUBURBAN SD Hispanic 34 11.8 64.7 23.5 0.0York 12 YORK SUBURBAN SD Asian 19 15.8 73.7 10.5 0.0York 12 YORK SUBURBAN SD Native American 2York 12 YORK SUBURBAN SD Multi-ethnic 2York 12 YORK SUBURBAN SD IEP 112 3.6 39.3 50.9 6.3York 12 YORK SUBURBAN SD ELL 8York 12 YORK SUBURBAN SD Economically Disadvantaged 131 9.2 64.1 26.0 0.8
*Full Academic Year Students. Data for groups with less than 10 students assessed were replaced by blanks.Percentages were rounded to the nearest one-tenth.Proficiency percentages may not add up to 100 due to rounding. 200