psychobehaviouralfactorsaremorestronglyassociatedwith...
TRANSCRIPT

Hindawi Publishing CorporationJournal of ObesityVolume 2012, Article ID 274068, 14 pagesdoi:10.1155/2012/274068
Research Article
Psychobehavioural Factors Are More Strongly Associated withSuccessful Weight Management Than Predetermined SatietyEffect or Other Characteristics of Diet
Leila Karhunen,1 Marika Lyly,2, 3 Anja Lapvetelainen,1 Marjukka Kolehmainen,1
David E. Laaksonen,4, 5 Liisa Lahteenmaki,2, 6 and Kaisa Poutanen1, 2
1 Department of Clinical Nutrition, Food and Health Research Centre, Institute of Public Health and Clinical Nutrition,University of Eastern Finland, Kuopio Campus, P.O. Box 1627, 70211 Kuopio, Finland
2 VTT Technical Research Centre of Finland, P.O. Box 1000, 02044 Espoo, Finland3 Vaasan Oy, P.O. Box 250, 02631 Espoo, Finland4 Department of Medicine, Kuopio University Hospital, P.O. Box 1777, 70211 Kuopio, Finland5 Institute of Biomedicine, Physiology, University of Eastern Finland, Kuopio Campus, P.O. Box 1627, 70211 Kuopio, Finland6 MAPP, Department of Business Administration, Business and Social Sciences, Arhus University, Haslegaardsvej 10, 8210 Arhus V,Denmark
Correspondence should be addressed to Leila Karhunen, [email protected]
Received 8 November 2011; Revised 5 March 2012; Accepted 16 April 2012
Academic Editor: Simone Lemieux
Copyright © 2012 Leila Karhunen et al. This is an open access article distributed under the Creative Commons AttributionLicense, which permits unrestricted use, distribution, and reproduction in any medium, provided the original work is properlycited.
This study aimed to investigate factors associated with weight management, especially whether satiety value of food as a partof a weight-maintenance diet would affect self-regulation of food intake and weight management. Altogether 82 obese subjectscompleted the study consisting of weight-loss and weight-maintenance (WM) periods. During the WM, subjects were randomizedinto higher- and lower-satiety food groups. No differences were observed in the changes in body weight, energy intake, or eatingbehaviour between the groups, even despite the different macronutrient compositions of the diets. However, when regarding allstudy subjects, success in WM was most strongly associated with a greater increase in the flexible control of eating and experienceof greater easiness of WM and control of food intake and a greater decrease in uncontrollable eating and psychological distress.Psychobehavioural factors seem to be more strongly associated with successful weight management than the predetermined satietyeffect or other characteristics of the diet.
1. Introduction
Success in weight management is challenging. Even aftersuccessful weight loss, weight regain is very common [1,2]. Therefore it is important to identify factors that areassociated with and could enhance the self-regulation of foodintake and other behaviours related to weight management.
Because obesity is always a result of an imbalancebetween the energy intake and energy expenditure, decreasedenergy intake is generally required for successful weightloss. Regulation of energy balance is very complex, however,with multiple mechanisms maintaining homeostasis andresisting changes in the energy balance [3]. Therefore, during
negative energy balance, that is, when energy intake islower than energy requirements, orexigenic pathways in theorganism are activated [4], a usual consequence of whichis a regain of reduced body weight. Successful long-termmanagement of weight thus requires safe and effective meansto counteract these compensatory regulatory mechanisms toreduce appetite and enhance satiety.
Various foods, even regardless of their energy content,may differ in their capacity to regulate satiety [5]. This can beaccounted for multiple characteristics of food, such as energydensity, macro- and micronutrient composition, palatability,food form, and structure [6–10]. Among different foodcharacteristics, especially dietary fibre and protein have

2 Journal of Obesity
recently raised much interest as potential factors capable ofincreasing the satiating value of food [11, 12].
Indeed, higher protein intake has been shown to sustainor increase satiety both during the periods of energy restric-tion [13] or during the periods of isocaloric [14] or ad libi-tum energy intake [15]. Greater satiating effect of protein hasbeen ascribed to greater meal-induced thermogenesis afterprotein-rich meals than after meals rich in carbohydrates orfat [16, 17]. Protein also efficiently stimulates the expressionof various gastrointestinal satiety hormones, and amino acidsserve as precursors for specific neurotransmitters involved inappetite or are directly involved in pathways regulating foodintake.
High dietary fibre intake has also been shown to con-tribute to increased satiety and reduced energy intake [12,18]. Among key mechanisms, dietary fibre increases satietyand reduces energy intake by decreasing the energy densityof the diet as well as by retarding nutrient absorption, gastricemptying, and intestinal passage times in the gastrointestinaltract [18]. Dietary fibre enhances satiety also throughincreased oral stimulation due to longer chewing time.
Several studies have shown that higher intake of dietaryprotein and fibre can contribute to greater weight loss orbetter maintenance of reduced weight [11, 12, 19, 20].Greater weight loss with high-protein or high-fibre diets hasbeen ascribed in part to their higher satiating effects andthereby to better dietary compliance and ability to reducespontaneous energy intake.
However, in spite of the large number of short-termstudies linking various food properties to increased satiety,it is still poorly known whether the satiety value of food hasan impact on the self-regulation of food intake and therebyon the regulation of body weight also at the longer term.
Different features of eating behaviour, such as restraintand disinhibition of eating, are also strong determinants ofweight management [21–24]. Dietary restraint and disinhi-bition are psychological constructs that assess behaviouralcontrol and attitudes toward food and eating [25, 26].Dietary restraint refers to a tendency to consciously restrictor control food intake, whereas dietary disinhibition isa tendency to overeat in the presence of, for example,palatable foods, emotional stress, or other disinhibitingstimuli. Dietary disinhibition has been linked to higher bodyweight and increased risk of weight regain [22, 24], whereasincreased dietary restraint with greater weight loss or bettermaintenance of reduced body weight [23, 27, 28]. Otherfeatures of eating behaviour, such as emotional eating andgreater susceptibility to sensations of hunger or externalfood-related cues, have also been associated with greater riskof obesity and difficulties in weight management [29–32].
Therefore, the aim of the present study was to investigatefactors that are associated with successful weight manage-ment in middle-aged obese men and women. We were espe-cially interested in investigating whether foods with higherpredetermined satiety values, when ingested as a part of aweight-maintenance diet, contribute to better self-regulationof food intake and reduced body weight. The study consistedthus of two distinct, consecutive phases: determination ofsatiating values of foods in a controlled laboratory setting
Table 1: Baseline characteristics of the subjects completing thestudy.
Mean ± SD Range (min–max)
n (males/females) 82 (21/61)
Age (years) 49.5± 9.3 31–63
Height (cm) 166.7± 8.6 150.0–192.0
Body weight (kg) 95.2± 11.9 71.1–122.8
Body mass index (kg/m2) 34.2± 2.5 29.7–40.0
to select foods with lower and higher satiating values forthe intervention and an intervention including weight-lossand weight-maintenance periods whereby the satiety-testedfoods were used as a part of a weight-maintenance diet.
2. Subjects and Methods
2.1. Subjects in the Intervention Study. Originally 99 (28males, 71 females) obese (inclusion criteria being body massindex (BMI) 30–40 kg/m2, age 30–65 years) subjects wererecruited into the intervention study. They were recruitedby an announcement in a local newspaper and among theeligible subjects who had participated previously in thestudies performed at the University of Kuopio, Kuopio,Finland (currently University of Eastern Finland). Theexclusion criteria of the subjects were BMI >40 or <30 kg/m2,pregnancy, type 1 or 2 diabetes, abnormal liver, thyroidor kidney function, polycystic ovary syndrome, less than6 months since coronary event or operation, myocardialinfarction, susceptibility to arrhythmia, diagnosed eatingdisorder, neuroleptic or oral cortisone medication, andexcess alcohol consumption (women > 16, men > 24 por-tions/week). The subjects could not have any other diseases,medications, or life situations that would have potentiallyprevented them to successfully complete the study.
Altogether 82 subjects completed the whole interventionand form the study group of this study. Baseline characteris-tics of the completers are shown in Table 1.
The study was performed in accordance with the stan-dards of the Helsinki Declaration. The Ethics Committeeof the District Hospital Region of Northern Savo and theKuopio University Hospital approved the study plan, andall participants gave written informed consent for theirparticipation.
2.2. Selection and Satiety Testing of Foods for Intervention
2.2.1. Selection of Foods for Satiety Testing. Because thesatiating value of food cannot be directly estimated basedon the nutritional composition or other characteristics offoods [20, 33], satiety tests were performed to identify foodswith different satiety values for the intervention. Satietytests were performed in a laboratory setting to control forpotential confounders known to affect satiety measurements[32, 33]. Satiety values were determined for food productsfrom seven categories (yoghurt-type dairy products, crispbread, soft bread, cheese, cold cuts, beverages, vegetable meal

Journal of Obesity 3
components). These food categories were selected so thatthe test foods would represent diversely different parts ofthe mixed diet. However, due to practical reasons a limitednumber of foods (altogether 22 foods, 2–5 foods per foodcategory) could be included into the satiety tests. The foodswere provided by Finnish food manufacturers, and theyrepresented both commercial products as well as products atthe stage of product development.
In the selection of foods for satiety testing, the follow-ing factors were considered: the difference between foodsregarding the amount of dietary fibre or protein per 700 kJportion should be as large as possible, since based onliterature dietary fibre and protein play an important rolein the satiating effect of foods [11, 20]. Furthermore, wechose an isocaloric portion size of 700 kJ, which was inour previous study shown to be an energy level at whichdifferent satiety effects of test foods can be distinguished [34].At this energy level we tried to keep portion sizes (weightor volume) as similar as possible. However, if the sizes oftested isocaloric portions differed, the volume or weight offood with potentially greater satiety value should be greaterthan that with potentially lower satiety value, due to possibleindependent effect of volume or weight on postprandialsatiety [35]. Also, within each food category, the foods withpotentially different satiety values should otherwise be assimilar as possible.
2.2.2. Satiety Testing. The satiety values of the test foodswere assessed at VTT, Espoo, Finland, before the interventionstudy. Altogether 35 subjects (20 males, 15 females, aged23.3 ± 2.2 (range 19–28) years) recruited mainly fromthe Helsinki University of Technology participated in thetests. The subjects were healthy, normal-weight (n = 27),or at most moderately overweight (n = 8, mean BMI23.3 ± 2.3 (range 19.1–29.7) kg/m2) due to potentiallyattenuated satiety responses in obese as compared with leanindividuals [32]. The subjects followed normal dietary andexercise patterns and did not have any dietary restrictions orabnormal eating behaviour based on individual interviewsand the Three-Factor Eating Questionnaire [25]: cognitiverestraint 7.5 ± 4.2 (mean ± SD), disinhibition of eating5.1± 2.8, hunger 4.9± 2.5.
Subjects participated in the satiety tests in the morning,after a minimum of 8 hours overnight fast. There was atleast one day between the consecutive test sessions. Beforethe actual satiety tests, the subjects were familiarized withthe procedure and trained to use the rating scales usingtypical Finnish rye bread as the practice product. The satietytests lasted for 3 hours, during which the subjects ratedtheir satiety-related perceptions before consuming the testproduct and after 20, 40, 60, 90, 120, 150, and 180 minfrom the beginning of the consumption. At each session,subjects ate the whole portion of the test food with 2 dL ofwater. With crisp breads subjects consumed 50 g of slicesof cucumber and 1.5 dL of water. Each subject participatedin the maximum 25 testing sessions, including two practicesessions.
The satiety-related sensations were evaluated using a10-unit scale (0 = not at all, 10 = extremely) before theconsumption of the test product. Immediately after theconsumption and during the following 180 min, sensationswere rated as a change from the starting value with a −10–0–+10 scale (−10 = a lot less than that in the beginning, 0 =as much as that in the beginning, +10 = a lot more than thatin the beginning) where 0 represents the baseline value [34].A total of six satiety/hunger and thirst-related attributes wererated (hunger, thirst, desire to eat something, satiety, fullness,desire to eat the test food). The data were collected usinga computerized data-collecting system (CSA, ComputerizedSensory Analysis System, Compusense, Guelph, Canada,Compusense 5, version 4.6.702 SP3).
Results were analyzed as the changes in the satiety-relatedsensations from the baseline levels as a function of time, andthe area under curve (AUC, cm × min) was calculated. Thepossible area under or over the baseline level was subtracted.All curves followed the same pattern with the lowest orhighest ratings 20 min after eating the sample, and thenscores increased or decreased, respectively, during the 3-hour follow-up time. Finally, 8 food pairs with significantdifference in the overall 3 h response of the feelings of hungeror satiety were selected to be the test foods in the intervention(Table 2).
2.3. Study Protocol of the Intervention. The interventionstudy consisted of two periods, weight loss and weightmaintenance. Subjects were informed that the aim of thestudy was to examine the effect of various food characteristicson the management of body weight and food intake andrelated mechanisms. Since satiety is a highly subjectivesensation, the subjects were not told about the differentsatiety values of the test foods to avoid any bias due to thatinformation.
2.3.1. Weight-Loss Period. The weight-loss period was per-formed by using very-low-calorie-diet (VLCD) products(Nutrifast, Leiras Finland Ltd) providing 600 kcal/day. Inaddition, the subjects were allowed to consume ad libitumlow-energy vegetables and noncaloric beverages. The VLCDproducts were given free of charge, and they were consumedfor 7 weeks, followed by a 2-week transition phase duringwhich subjects gradually finished using the VLCD productsand switched back to the mixed food diet. During the weight-loss period, the subjects were given dietary counselling ingroup sessions, 7 times during the whole period. The groupsessions, lasting for 1.5 hours, were held in the evenings.Altogether 8–10 subjects participated in each group. Thesame experienced nutritionist tutored all the groups. Differ-ent themes were discussed at each session (Table 3).
2.3.2. Weight-Maintenance Period. After the weight-lossperiod, the subjects were randomized, stratified by age andsex, into two diet groups: higher-satiety food group (HSF)and lower-satiety food group (LSF) (Table 4). The baselinecharacteristics of the subjects in the HSF and LSF groupsare presented in Tables 4, 6, and 7 (baseline). There were

4 Journal of Obesity
Table 2: Foods selected to the intervention and their tested portion sizes, macronutrient and dietary fibre contents and 3 h satiety/hungerresponses (3 h AUC; mean ± standard error). Energy content of all tested food portions was 700 kJ.
Dairy, yoghurt type Bread Cheese Cold cutsVegetable meal
component
HSFPear
flavourn = 35
Lingonberryflavoura
Rye crispbreadn = 32
Soft ryebread (1)n = 30
Soft ryebread (2)n = 29
Hard cheesen = 30
Smoked hamn = 35
Vegetable patty(fibre-rich) n = 35
Portion size, g 280 280 52 82 70 88 140 104
Protein, g 30.6 30.6 5.6 5.9 5.6 29.90 31.6 9.2
Fat, g 0.6 0.6 1.2 1.1 1.4 4.4 4.5 10.7
Carbohydrates, g 11.2 11.2 31.0 31.1 32.7 1.3 2.3 8.7
Dietary fibre, g 5.6 5.6 8.9 9.0 10.5 0 0.4 6.9
Satiety, 3 h AUC 464 ± 65 —a 237 ± 60 289 ± 56 224 ± 62 103 ± 60 400 ± 72 231 ± 53
Hunger, 3 h AUC −503 ± 67 —a −313 ± 67 −275 ± 54 −278 ± 75 −148 ± 61 −463 ± 86 −259 ± 59
LSFVanillaflavourn = 35
Strawberryflavourn = 32
Wheatcrisp breadn = 35
Soft wheatbreadn = 35
Thin ryecrisp breadn = 35
Soft slicedcheese n = 30
Sausagen = 35
Vegetable pattyn = 35
Portion size, g 230 200 44 61 52 58 108 93
Protein, g 8.3 7.1 4.6 5.4 5.8 11.6 9.7 4.3
Fat, g 4.6 4 3.5 2.9 5.8 12.8 9.7 11.5
Carbohydrates, g 23 26 31 28.8 33 0.9 8.9 10.1
Dietary fibre, g 0 0 2.8 2.0 9.9 0 0.3 3.1
Satiety, 3 h AUC 111 ± 47 179 ± 59 154 ± 50 114 ± 49 122 ± 51 −2 ± 62 146 ± 54 93 ± 62
Hunger, 3 h AUC −173 ± 48 −148 ± 65 −186 ± 55 −130 ± 59 −161 ± 55 −1 ± 72 −171 ± 63 −124 ± 65
HSF: higher-satiety food group; LSF: lower-satiety food group; AUC: area under the curve: positive values represent area above the baseline level, negativevalues represent area under the baseline level; aa flavour variant for pear-flavoured yoghurt, not tested in the satiety tests.
Table 3: The themes discussed in the group sessions during the weight-loss period.
Group session Theme
(1) SessionPrinciples of the very-low-calorie diet (VLCD, 600 kcal); tasting and choice ofthe most pleasing options of available VLCD products for the weight-loss period
(2) Session (start of VLCD)Energy requirement and energy consumption, physical exercise, vegetables in thediet; VLCD products delivered to the subjects
(3) Session (1 week at VLCD) Control of food intake, meal rhythm, snacks, and beverages
(4) Session (3 weeks at VLCD) Thoughts and attitudes as barriers for weight management
(5) Session (5 weeks at VLCD) Good and bad dietary fats, package labelling
(6) Session (7 weeks at VLCD; start of transition phase) Transition phase diet (800 kcal), control of food intake
(7) Session (start of weight-maintenance period) Principles of the weight-maintenance diet and the use of test foods
no significant differences at the baseline between the groupsexcept for external eating, which was greater in the HSFthan in the LSF group (P = 0.02), and the proportion ofdaily energy from carbohydrates, which was greater in theLSF than in the HSF group (P = 0.03). However, the totalcarbohydrate intake was the same in both groups.
Neither of the diets was considered a control diet.During the 24-week weight-maintenance period, subjectswere instructed to maintain their weight loss but not tocontinue actively losing weight. The subjects in the HSFconsumed the test foods with higher satiety value the subjectsin the LSF consumed the test foods with lower satiety value
as a part of their weight-management diet. The way of usingthe test foods and all dietary counselling was otherwise thesame in both groups.
The test foods aimed to cover about 30% of the individ-ually estimated daily energy requirements. The proportionof test foods was tested in the pilot study performed priorto the intervention study to find out what was the highestrealistic amount of the test foods that could be consumed asa part of the diet. 19 subjects (5 men, 14 women) of sameage (51.2 ± 10.0 years) and BMI (31.3 ± 4.4 kg/m2) as thesubjects in the intervention study participated in the pilotand used the test foods for two weeks as a part of their

Journal of Obesity 5
habitual diet. At the end of this period, they were interviewedabout their experiences, and the intervention protocol wasfurther modified using this information.
The individual energy requirements were estimated bycalculating the basal metabolic rate by the formula of MifflinSt-Jeor [36]. To take into account the likely reduction of theenergy expenditure due to the recent marked weight loss[37], the resultant values were deducted by 5%. The resultswere then multiplied by factor 1.3 to take into account theenergy requirements due to any physical activity. Based onthe experiences from the pilot study, the resultant values werethen deducted by the value 333.45 kcal to take into accountthe difference between the calculated energy requirementsand the reported energy intakes. Thus the final equationsfor the calculation of the energy requirements were [(9.99 ∗weight (kg) + 6.25 ∗ height (cm) − 4.92 ∗ age (yrs) + 5) ∗0.95 ∗ 1.3] − 335.45 kcal for men and [(89.99 ∗ weight (kg)+ 6.25 ∗ height (cm) − 4.92 ∗ age (yrs)−161) ∗ 0.95 ∗ 1.3]− 335.45 kcal for women. The resultant individual energylevels were rounded up to the nearest 100 kcal and variedfrom 1200 kcal to 2300 kcal/day. The amounts of portions ofdifferent test foods used per day were calculated and advisedbased on these energy levels.
The subjects received the test foods free of chargefrom the University of Kuopio (current the University ofEastern Finland) every two weeks. The test foods weregiven as the blank packages so that the subjects could notidentify their exact content on the basis of, for example,comparable commercial products. During every visit, thesubjects’ body weight was measured, and they were givenwritten instructions about the use of the test foods as wellas the weight-management diet in general.
The written instructions included the numbers of theportions of each test food and the recommendations of thenumber of servings within each food group (vegetables/berries/fruit, dairy, potatoes and cereals, meat/fish/poultry,fat) to be consumed each day so that the total energyintake would cover the individually estimated daily energyrequirement. The subjects were, however, informed that thediet was otherwise freely selected. In addition, to allow thepossible satiety effect of test foods to function, subjects weretold that they could increase or decrease the number of foodservings (other than test foods) if still hungry or if sated,respectively.
Table 5 shows the portion sizes and typical numbers ofdaily portions of each test food as instructed to be consumedduring the intervention. The portion sizes could be differentfrom those used in the standard satiety tests because thefoods were used as a part of a diet and were therefore targetedto represent typical portion sizes of each food. The numberof the portions/day varied among different energy levels andfrom day to day. In addition, in order to reduce the risk ofmonotony and boredom due to the continued and frequentuse of a quite limited number of test products, test foodswithin each list varied so that each two weeks list included6 out of 8 test foods. On each week, the subjects were allowedto have one day free of the use of the test foods, if theywished. The subjects recorded the use of the test foods forthe whole duration of the weight-maintenance period. These
50556065707580859095
100105110
Before WL 12 weeksWM
24 weeksWM
Wei
ght
(kg)
HSFLSF
After WL/0 weeks WM
Figure 1: Changes in the body weight during the study. Nosignificant differences between the groups. HSF: higher-satiety foodgroup (n = 42); LSF: lower-satiety food group (n = 40); WL: weightloss; WM: weight maintenance.
recordings were used when calculating the compliance (i.e.,the use of the test foods as compared with the instructed use).
The subjects were not given any specific instructionsabout physical activity but were advised to keep it at theirhabitual level.
2.4. Measurements in the Intervention
2.4.1. Anthropometric Measurements. Body weight was mea-sured in the morning after 12 hours fast after voiding inthe normal indoor clothing using a digital scale (Vogel &Halke, Hamburg, Germany) with the weighing accuracy of0.1 kg. The measurements were done at the separate studyvisits in the beginning of the weight-loss period beforeany weight loss had occurred, at the end of the weight-loss period (i.e., the beginning of the weight-maintenanceperiod), and at 12 and 24 weeks after the beginning of theweight-maintenance period (Figure 1). Height was measuredusing a wall-mounted stadiometer to the nearest 0.1 cm inthe beginning of the weight-loss period. Body mass index(BMI) was calculated (weight (kg)/height (m)2).
2.4.2. Dietary Intake. Subjects completed 4-day food recordsaltogether five times during the study: before the weight-loss period and at 6, 12, 18, and 24 weeks from thebeginning of the weight-maintenance period. The portionsizes were estimated using household measures. Nutrientintake was calculated with Diet32 analysis program (AivoFinland Oy) using the Finnish Food Composition Database,Fineli (National Institute for Health and Welfare).
2.4.3. Eating Behaviour and Psychological Distress. Variousfeatures of eating behaviour were evaluated by standardizedand validated self-report questionnaires. Three-Factor Eat-ing Questionnaire (TFEQ) was used to measure cognitiverestraint of eating and divided also to the flexible andrigid parts of the restraint [38], disinhibition of eating, and

6 Journal of Obesity
Table 4: Subjects in the higher-satiety food (HSF) and lower-satiety food (LSF) groups. Mean ± SD.
HSF LSF Pa
n (males/females) 42 (12/30) 40 (9/31) 0.53b
Age (years) 49.6± 9.5 49.1± 9.1 0.83
Height (cm) 167.6± 8.0 165.8± 9.3 0.35
Body weight (kg), before weight loss 95.7± 10.8 94.6± 13.1 0.67
Body weight (kg), after weight loss 83.7± 8.9 82.6± 10.2 0.63
Body mass index (kg/m2), before weight loss 34.0± 2.3 34.3± 2.7 0.60
Body mass index (kg/m2), after weight loss 29.8± 2.1 30.0± 2.3 0.63aStudent’s t-test; bChi-square.
Table 5: Instructed portion sizes, possible numbers of daily portions, and their energy and macronutrient contents per portion during theintervention.
Portionsize, g
Number ofportions/daya
Energy,kcal
Protein, g Fat, g Carbohydrates, g Dietary fibre, g
HSF
Yoghurt (pear flavour) 150 1-2 90 16.5 0.3 6.0 3
Yoghurt (lingonberry flavour) 150 1-2 90 16.5 0.3 6.0 3
Rye crisp bread 12.9 1–3 41 1.4 0.3 7.7 2.2
Soft rye bread (1) 43 1–3 86 3.1 0.6 16.3 4.7
Soft rye bread (2) 30 1–3 75 2.4 0.6 14.0 4.5
Hard cheese 125 0.25–0.75 238 42.5 6.3 1.9 0
Smoked ham 6.2 4–10 7.5 1.4 0.2 0.1 0.2
Vegetable patty (fibre-rich) 60 1-2 96 5.3 6.2 5.0 4.0
LSF
Yoghurt (vanilla flavour) 130 1-2 91 4.7 2.6 13.0 0
Yoghurt (strawberry flavour) 110 1-2 91 3.9 2.2 14.3 0
Wheat crisp bread 12.5 1-2 50 1.3 1.0 8.8 0.8
Soft white wheat toast bread 25 1–4 70 2.2 1.2 11.8 0.8
Thin rye crisp bread 6.3 2–10 20 0.7 0.7 4.0 1.2
Soft sliced cheese 19 1–3 55 3.8 4.2 0.3 0
Sausage cold cut 13.4 1–5 20 1.2 1.2 1.1 0.4
Vegetable patty 60 1-2 10.5 2.8 7.4 6.5 2.0
HSF: higher-satiety food group, LSF: lower-satiety food group; arange, the number of the portions varied from day to day and among different energy levels.
susceptibility to hunger [25]. The Dutch Eating BehaviourQuestionnaire (DEBQ) was used to measure restraint ofeating, emotional eating, and external eating [39]. BingeEating Scale (BES) assessed the presence of binge eating [40].The subjects filled in the questionnaires in the beginning ofthe weight-loss period and after 12 and 24 weeks of weightmaintenance.
Psychological distress was evaluated by the GeneralHealth Questionnaire [41] in the beginning and at the endof the weight-loss period as well as after 12 and 24 weeks ofweight maintenance.
During the weight-maintenance period, the subjectsevaluated at the end of each week their overall well-being,bowel function, hunger, satiety, and easiness of control offood intake by the 9-point scale (1 = not at all/extremelybad, . . ., 9 = a lot/extremely good). In addition, at the endof each dietary data collection day, the subjects rated howdifficult/easy they had experienced control of food intake
that day by using 7-point scale (1 = very difficult, . . ., 7= veryeasy).
At the end of the study, the subjects filled in a finalquestionnaire to assess how they had experienced the weight-maintenance period in general (1 = very difficult, . . ., 10 =very easy) and what they had liked about the test foods (1 =did not like at all, . . ., 9 = liked very much).
2.5. Statistical Analyses. The statistical analyses were per-formed with SPSS for Windows software (SPSS for windows,version 14.0, USA). The results are expressed as mean andstandard deviation (SD) with a value P < 0.05 as a criterionfor the statistical significance, unless not otherwise specified.
In the satiety tests, paired samples t-test was used toevaluate the differences between the food pairs within eachfood category.
In the intervention study, independent samples t-test(Student’s t-test) and Chi-square test were used to compare

Journal of Obesity 7
the baseline values between the study groups. Linear mixed-effect modelling was used to compare the effect of thestudy group on the changes in the examined variables.The associations between the variables in the whole studypopulation were analyzed by Spearman’s correlation test andby partial correlation adjusted by the study group.
3. Results
3.1. Adherence and Compliance. Altogether 82 out of 99subjects completed the intervention. There were 17 subjectswho dropped out, three subjects (2 men, 1 woman) duringthe weight-loss period and 14 subjects (6 men, 9 women)during the weight-maintenance period. There were nodifferences in the dropouts during the weight-maintenanceperiod between the HSF (8 (3 men, 5 women)) and the LSFgroups (6 (2 men, 4 women)).
The use of test foods, as an indicator of compliance,was equal in both groups (% of the instructed use, cal-culated from the individual recordings during the weight-maintenance period: 100.8 ± 9.0% versus 99.1 ± 9.1%, HSFversus LSF), as well as the proportion of energy ingested fromthe test foods (mean during the weight-maintenance period:30.7 ± 6.1% versus 29.0 ± 5.0%, HSF versus LSF). Thesubjects in the HSF group generally liked the test foods theyused more than in the subjects in the LSF group (7.1 ± 1.0versus 6.4 ± 1.0, P = 0.003).
3.2. Main Effects
3.2.1. Body Weight. Weight changes were comparablebetween the HSF and the LSF groups (Figure 1). Theweight reduced by about 12 kg during the weight-loss periodin both groups (HSF −12.5 ± 2.4%, LSF −12.4 ± 2.6%of the body weight at the baseline). During the weight-maintenance period, there was only a very slight regainin the mean body weight with no significant differencebetween the groups (HSF 1.3 ± 3.5%, LSF 0.9 ± 3.5%).The interindividual variation in the success to maintain thereduced body weight during the weight-maintenance periodwas large, with weight changes varying from 8.8% furtherweight reduction to 9.8% weight regain.
3.2.2. Dietary Factors. The overall energy intake was similarin both groups with no significant differences in overallenergy intake during the intervention (Table 6). Only at theend of the study, the energy intake changed differently inthe HSF and LSF groups, with continuing gradual increasein the energy intake in the HSF group and a small decreasein the LSF group (P = 0.02). Instead, the macronutrientcomposition of the diet changed differently in the HSF andthe LSF groups. The intakes of dietary protein and fibreincreased at the beginning of the weight-maintenance periodin the HSF group whereas they remained about the same inthe LSF group (P < 0.001 for all). The intakes of dietary fiberand protein were thus higher in the HSF than those in theLSF group for the whole duration of the weight-maintenanceperiod (P < 0.001 for all). The intake of dietary fat decreased
from the beginning of the study to the weight-maintenanceperiod in both groups, the decrease being greater and thusoverall fat intake lower in the HSF than in the LSF groupduring the weight-maintenance period (P < 0.001). Thetotal carbohydrate intake decreased from the beginning ofthe study to the weight maintenance in both groups. Thereduction was greater in the HSF group than that in the LSFgroup (P = 0.04). As the percentage of energy, carbohydrateintake remained about the same during the whole studybeing greater in the LSF group (P < 0.001). The alcoholintake decreased from the beginning of the study in bothgroups, being, as the percentage of energy, somewhat greaterin the HSF group than that in the LSF group (P = 0.04).
The observed differences in dietary protein, fibre, fat, andcarbohydrate intakes during the weight-maintenance periodwere due to the different macronutrient contents of the testfoods (Table 5). The composition and energy intake of thefreely selected part of the diet was the same in both groups(data not shown).
3.2.3. Psychobehavioural Factors. The subjects in the HSF andthe LSF groups experienced the study very similarly based ontheir responses in the final questionnaire at the end of thestudy (estimated easiness of the weight maintenance period:HSF 7.1 ± 1.8, LSF 7.1 ± 1.9). Neither did they report anydifferences in the easiness of the control of food intake orother conditions that were evaluated along the study (overallwellbeing, bowel function, hunger, satiety).
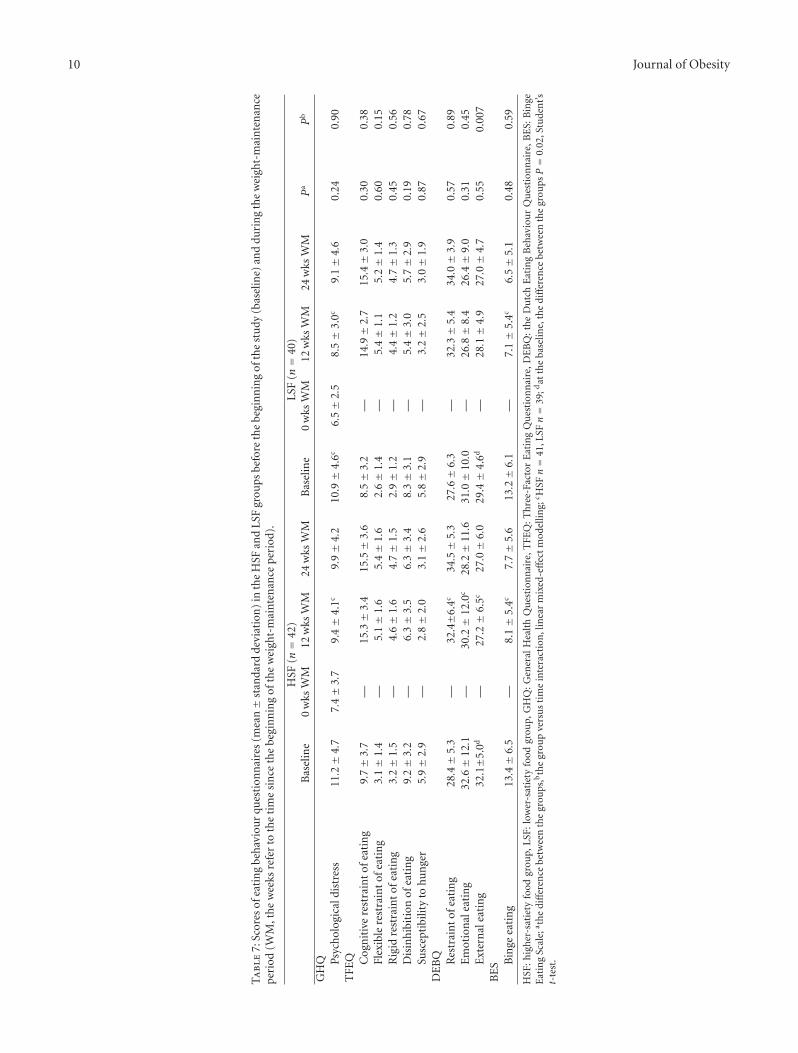
Cognitive restraint of eating, both flexible and rigid,increased in both the HSF and the LSF groups after theweight-loss period, as measured by the TFEQ and the DEBQquestionnaires (Table 7). At the same time, disinhibitionof eating, susceptibility to hunger, and binge eating aswell as emotional and external eating decreased in bothgroups. There were no significant differences in the changesbetween the groups, except in the external eating whichdecreased more in the HSF group than those in the LSFgroup (P = 0.007) most likely due to higher scores in theHSF at the beginning of the study. Neither were there anysignificant differences between the groups in the changesin the psychological distress, as assessed by GHQ, whichalleviated in both groups after the weight loss then graduallyreturning towards the baseline level.
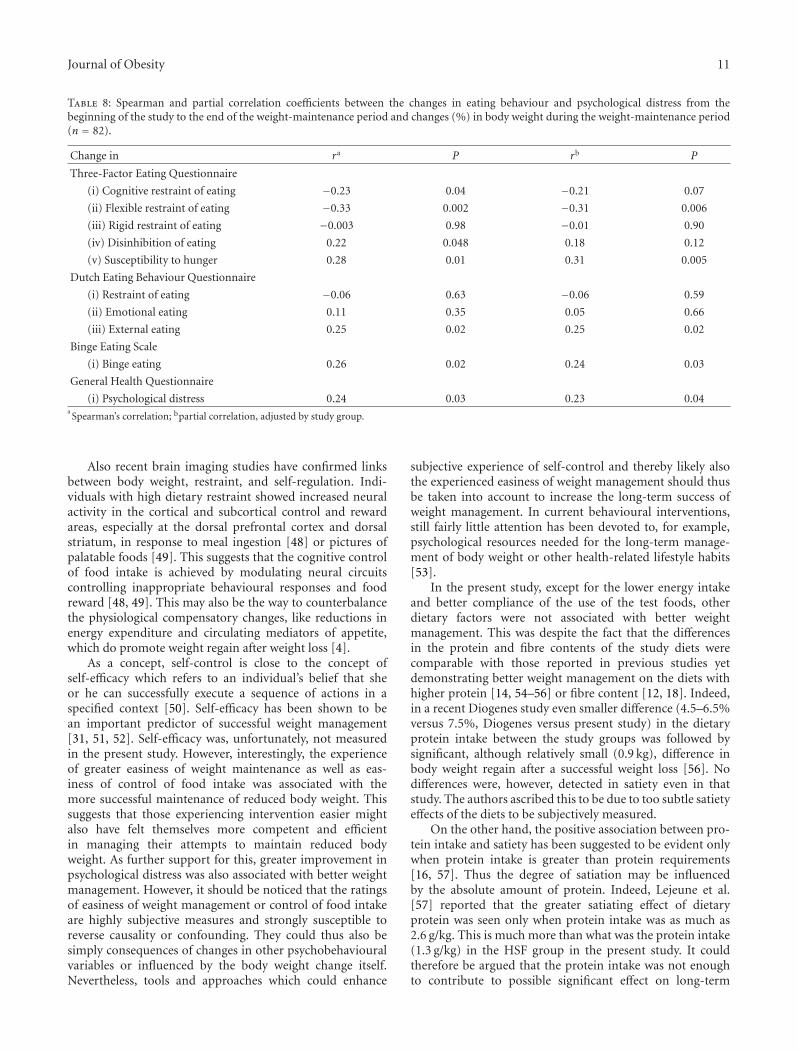
3.2.4. Predictors of Weight Maintenance. Due to greatinterindividual variation in the success to maintain reducedbody weight, irrespective of the study group, the predictorsof weight maintenance were analysed in the whole studypopulation. The changes in the eating behaviour duringthe study were significantly associated with the weightmaintenance (Table 8). The success in weight maintenancewas associated with the greater increase in the cognitiverestraint of eating, especially in the flexible control of eatingas well as the greater decrease in the disinhibition of eating,susceptibility to hunger, binge eating behaviour, externaleating, and psychological distress. Most of these changes,that is, increase in the flexible control of eating and thedecrease in susceptibility to hunger, binge eating behaviour,

8 Journal of Obesity
external eating, and psychological distress, were associatedwith better weight maintenance also after adjusting forgroup membership during the weight-maintenance period(Table 8).
The self-reported easiness of the weight-maintenanceperiod resulted to be a single factor which was most stronglyassociated with the successful maintenance of reduced bodyweight during the weight-maintenance period (r = −0.47,P < 0.001, n = 82). The association was significant, evenslightly stronger, also after making adjustment for studygroup (partial correlation r = −0.52, P < 0.001). Thosesubjects who experienced the weight-maintenance period theeasiest also managed better than those experiencing it moredifficult. Similarly, the self-reported easiness of the control offood intake, as assessed at the different phases of the weight-maintenance period, correlated significantly with the weightmaintenance (mean of weekly assessments, r = −0.39, P <0.001, n = 82), also after adjusting for group membership(partial correlation r = −0.39, P < 0.001). The easier thesubjective control of food intake, the more successful theweight maintenance.
Among the dietary determinants of successful weightmaintenance, the compliance (i.e., the use of the test foods)correlated with the final outcome; the higher the compliance,the better the reduced body weight maintained during theweight-maintenance period (r = −0.27, P = 0.02, n =82). This association was seen also after adjusting for thestudy group (partial correlation r = −0.23, P = 0.05).Lower energy intake according to the food diaries duringthe weight-maintenance period was also associated with thebetter maintenance of reduced body weight (r = 0.24, P =0.03, n = 82) also when adjusted by group membership(partial correlation r = 0.22, P = 0.047).
4. Discussion
This study investigated dietary and psychobehavioural fac-tors associated with the success in weight maintenance.More specifically, we were interested in whether foodswith predetermined satiety values consumed in free-livingconditions as a part of a weight-maintenance diet wouldaffect self-regulation of food intake and thereby weightmanagement. To our knowledge, no previous studies havebeen published on the issue. In contrast to expectation,the diet containing foods with higher predetermined satietyvalue did not contribute to better weight management. Thiswas even despite the obvious differences in the macronu-trient contents of the diets, especially the differences in theamounts of dietary protein and fibre, which by themselvescould also have been expected to influence satiety or weightmanagement [11, 12].
Nevertheless, the present results were interestingly in linewith the findings of a recent large intervention comparingthe effects of weight-loss diets differing in the proportionsof dietary fat, protein, or carbohydrate [42]. In that study,no diet was superior in reducing body weight. Therewere also no significant differences in satiety, hunger, ordiet satisfaction among the diets. Instead, the strongest
determinant of successful weight loss was an attendanceat the group sessions, suggesting that behavioural factorsrather than the composition of the diet are more importantfor the success of weight loss. Also in the present studythe successful maintenance of reduced weight was notprimarily associated with the diet-related factor, but ratherwith the psychobehavioural variables related especially toeating behaviour. Also participants’ subjective experiencesabout the easiness of the intervention and control of foodintake were associated with better weight maintenance. Theonly diet-related factors that were significantly associatedwith the weight management were lower energy intake andbetter compliance of the use of the test products, which,on the other hand, could be seen also as behaviouralfactors similarly as the attendance at group sessions in theSacks et al.’s [42] study. Thus, as Sacks et al. [42] alsopointed out, behavioural and psychological factors ratherthan macronutrient metabolism seem to have the maininfluence on the success of longer-term weight management.
Changes in various features of eating behaviour wereassociated with the better success in weight management.All the observed changes, that is, increase in the cognitiverestraint of eating and decrease in binge eating, externaleating, disinhibition of eating, and susceptibility to hunger,were into the direction that could be suggested to repre-sent better self-control of eating. These changes were alsowell in line with several previous findings, thus furtherconfirming the important role of eating behaviour in thesuccessful weight management [27, 28, 30, 31, 43]. Whendistinguishing cognitive restraint of eating into flexible andrigid forms of restraint behaviour [38], it was specificallythe flexible restraint that was associated with the bettermaintenance of reduced weight. This is in accordance withthe earlier findings [22, 27, 31, 38, 44] and also with theconcept of flexible restraint. By definition, flexible restraint ofeating is a form of eating behaviour characterized by a moregraduated approach to eating, dieting, and weight in contrastto rigid control which is characterized by a dichotomous,all-or-nothing approach to eating, dieting, and weight [38].A form of restrained eating in which flexible approachis adopted seems thus to be beneficial to effective weightcontrol [31, 45]. The beneficial effect of flexible control ofeating on weight management has been documented earlierboth in cross-sectional and in prospective analysis. In cross-sectional settings, flexible restraint has been shown to predictlower fatness and BMI [22, 46]. In prospective studies,successful weight change has been more strongly associatedwith flexible than with rigid form of cognitive restraint ofeating [31, 38, 46, 47]. Thus, as Teixeira et al. [31] concluded,sustained weight loss seems to require that subjects adopta flexible eating self-regulation pattern that allows them tomodify their eating behaviour and quite likely also theirphysical activity by appropriate ways in this complex foodenvironment. Successful restraint of eating can also be linkedwith higher self-control capacity in general [45]. Thereforeattempts to enhance self-regulation could be of value to thoseattempting to control body weight and food intake.

Journal of Obesity 9
Ta
ble
6:E
ner
gyan
dm
acro
nu
trie
nti
nta
ke(m
ean±
stan
dard
devi
atio
n)
inth
eH
SFan
dLS
Fgr
oups
befo
reth
ebe
gin
nin
gof
the
stu
dy(b
asel
ine)
and
duri
ng
the
wei
ght-
mai
nte
nan
cepe
riod
(WM
,th
ew
eeks
refe
rto
the
tim
esi
nce
the
begi
nn
ing
ofth
ew
eigh
t-m
ain
ten
ance
peri
od).
HSF
n=
42a
LSFn=
40a
Bas
elin
e6
wks
WM
12w
ksW
M18
wks
WM
24w
ksW
MB
asel
ine
6w
ksW
M12
wks
WM
18w
ksW
M24
wks
WM
Pb
Pc
En
ergy
(goa
l),k
cal
—15
81±
233
1581±
233
1581±
233
1581±
233
—15
55±
259
1555±
259
1555±
259
1555±
259
——
En
ergy
(rea
lizat
ion
),kc
al20
53±
526
1553±
348
1692±
404
1761±
439
1863±
573
1945±
558
1666±
407
1755±
386
1811±
490
1718±
405
0.96
0.02
Pro
tein
,g86±
2110
0±
1810
5±
1711
0±
2311
0±
2579±
2177±
2177±
2081±
2478±
20<
0.00
1<
0.00
1P
rote
in,E
%17±
326±
326±
425±
325±
517±
218±
218±
218±
318±
2<
0.00
1<
0.00
1Fa
t,g
71±
2646±
1751±
1857±
2158±
2569±
3058±
1762±
1566±
2064±
170.
049
0.01
Fat,
E%
31±
726±
526±
529±
528±
631±
631±
432±
333±
534±
5<
0.00
1<
0.00
1C
arbo
hydr
ates
,g22
3±
6216
9±
3918
8±
5618
8±
5219
4±
6022
6±
6219
8±
4620
8±
4821
1±
5819
6±
480.
090.
04C
arbo
hydr
ates
,E%
44±
7d44±
544±
643±
642±
647±
7d48±
447±
447±
546±
4<
0.00
10.
98D
ieta
ryfi
bre,
g23±
732±
834±
1033±
932±
923±
1024±
723±
723±
922±
7<
0.00
1<
0.00
1A
lcoh
ol,g
21±
396±
116±
115±
914±
4111±
153±
54±
94±
93±
60.
080.
15A
lcoh
ol,E
%7±
103±
53±
52±
34±
103±
51±
22±
31±
21±
20.
040.
27
HSF
:hig
her
-sat
iety
food
grou
p,L
SF:l
ower
-sat
iety
food
grou
p;a H
SF:1
2w
ksn=
41,1
8w
ksn=
40,L
SF:6
wks
n=
39,1
2w
ksn=
37,1
8w
ksn=
37,2
4w
ksn=
36;b
the
diff
eren
cebe
twee
nth
egr
oups
,c the
grou
pve
rsu
sti
me
inte
ract
ion
,lin
ear
mix
ed-e
ffec
tm
odel
ling;
dat
the
base
line,
the
diff
eren
cebe
twee
nth
egr
oups
P=
0.03
,Stu
den
t’st-
test
.
10 Journal of Obesity
Ta
ble
7:Sc
ores
ofea
tin
gbe
hav
iou
rqu
esti
onn
aire
s(m
ean±
stan
dard
devi
atio
n)
inth
eH
SFan
dLS
Fgr
oups
befo
reth
ebe
gin
nin
gof
the
stu
dy(b
asel
ine)
and
duri
ng
the
wei
ght-
mai
nte
nan
cepe
riod
(WM
,th
ew
eeks
refe
rto
the
tim
esi
nce
the
begi
nn
ing
ofth
ew
eigh
t-m
ain
ten
ance
peri
od).
HSF
(n=
42)
LSF
(n=
40)
Bas
elin
e0
wks
WM
12w
ksW
M24
wks
WM
Bas
elin
e0
wks
WM
12w
ksW
M24
wks
WM
Pa
Pb
GH
Q Psyc
hol
ogic
aldi
stre
ss11.2±
4.7
7.4±
3.7
9.4±
4.1c
9.9±
4.2
10.9±
4.6c
6.5±
2.5
8.5±
3.0c
9.1±
4.6
0.24
0.90
TFE
Q Cog
nit
ive
rest
rain
tof
eati
ng
9.7±
3.7
—15.3±
3.4
15.5±
3.6
8.5±
3.2
—14.9±
2.7
15.4±
3.0
0.30
0.38
Flex
ible
rest
rain
tof
eati
ng
3.1±
1.4
—5.
1±
1.6
5.4±
1.6
2.6±
1.4
—5.
4±
1.1
5.2±
1.4
0.60
0.15
Rig
idre
stra
int
ofea
tin
g3.
2±
1.5
—4.
6±
1.6
4.7±
1.5
2.9±
1.2
—4.
4±
1.2
4.7±
1.3
0.45
0.56
Dis
inh
ibit
ion
ofea
tin
g9.
2±
3.2
—6.
3±
3.5
6.3±
3.4
8.3±
3.1
—5.
4±
3.0
5.7±
2.9
0.19
0.78
Susc
epti
bilit
yto
hun
ger
5.9±
2.9
—2.
8±
2.0
3.1±
2.6
5.8±
2.9
—3.
2±
2.5
3.0±
1.9
0.87
0.67
DE
BQ Res
trai
nt
ofea
tin
g28.4±
5.3
—32
.4±6
.4c
34.5±
5.3
27.6±
6.3
—32.3±
5.4
34.0±
3.9
0.57
0.89
Em
otio
nal
eati
ng
32.6±
12.1
—30
.2±
12.0
c28.2±
11.6
31.0±
10.0
—26.8±
8.4
26.4±
9.0
0.31
0.45
Ext
ern
alea
tin
g32
.1±5
.0d
—27
.2±
6.5c
27.0±
6.0
29.4±
4.6d
—28.1±
4.9
27.0±
4.7
0.55
0.00
7B
ES B
inge
eati
ng
13.4±
6.5
—8.
1±
5.4c
7.7±
5.6
13.2±
6.1
—7.
1±
5.4c
6.5±
5.1
0.48
0.59
HSF
:hig
her
-sat
iety
food
grou
p,L
SF:l
ower
-sat
iety
food
grou
p,G
HQ
:Gen
eral
Hea
lth
Qu
esti
onn
aire
,TFE
Q:T
hre
e-Fa
ctor
Eat
ing
Qu
esti
onn
aire
,DE
BQ
:th
eD
utc
hE
atin
gB
ehav
iou
rQ
ues
tion
nai
re,B
ES:
Bin
geE
atin
gSc
ale;
a the
diff
eren
cebe
twee
nth
egr
oups
,bth
egr
oup
vers
us
tim
ein
tera
ctio
n,l
inea
rm
ixed
-eff
ect
mod
ellin
g;c H
SFn=
41,L
SFn=
39;d
atth
eba
selin
e,th
edi
ffer
ence
betw
een
the
grou
psP=
0.02
,Stu
den
t’st-
test
.
Journal of Obesity 11
Table 8: Spearman and partial correlation coefficients between the changes in eating behaviour and psychological distress from thebeginning of the study to the end of the weight-maintenance period and changes (%) in body weight during the weight-maintenance period(n = 82).
Change in ra P rb P
Three-Factor Eating Questionnaire
(i) Cognitive restraint of eating −0.23 0.04 −0.21 0.07
(ii) Flexible restraint of eating −0.33 0.002 −0.31 0.006
(iii) Rigid restraint of eating −0.003 0.98 −0.01 0.90
(iv) Disinhibition of eating 0.22 0.048 0.18 0.12
(v) Susceptibility to hunger 0.28 0.01 0.31 0.005
Dutch Eating Behaviour Questionnaire
(i) Restraint of eating −0.06 0.63 −0.06 0.59
(ii) Emotional eating 0.11 0.35 0.05 0.66
(iii) External eating 0.25 0.02 0.25 0.02
Binge Eating Scale
(i) Binge eating 0.26 0.02 0.24 0.03
General Health Questionnaire
(i) Psychological distress 0.24 0.03 0.23 0.04aSpearman’s correlation; bpartial correlation, adjusted by study group.
Also recent brain imaging studies have confirmed linksbetween body weight, restraint, and self-regulation. Indi-viduals with high dietary restraint showed increased neuralactivity in the cortical and subcortical control and rewardareas, especially at the dorsal prefrontal cortex and dorsalstriatum, in response to meal ingestion [48] or pictures ofpalatable foods [49]. This suggests that the cognitive controlof food intake is achieved by modulating neural circuitscontrolling inappropriate behavioural responses and foodreward [48, 49]. This may also be the way to counterbalancethe physiological compensatory changes, like reductions inenergy expenditure and circulating mediators of appetite,which do promote weight regain after weight loss [4].
As a concept, self-control is close to the concept ofself-efficacy which refers to an individual’s belief that sheor he can successfully execute a sequence of actions in aspecified context [50]. Self-efficacy has been shown to bean important predictor of successful weight management[31, 51, 52]. Self-efficacy was, unfortunately, not measuredin the present study. However, interestingly, the experienceof greater easiness of weight maintenance as well as eas-iness of control of food intake was associated with themore successful maintenance of reduced body weight. Thissuggests that those experiencing intervention easier mightalso have felt themselves more competent and efficientin managing their attempts to maintain reduced bodyweight. As further support for this, greater improvement inpsychological distress was also associated with better weightmanagement. However, it should be noticed that the ratingsof easiness of weight management or control of food intakeare highly subjective measures and strongly susceptible toreverse causality or confounding. They could thus also besimply consequences of changes in other psychobehaviouralvariables or influenced by the body weight change itself.Nevertheless, tools and approaches which could enhance
subjective experience of self-control and thereby likely alsothe experienced easiness of weight management should thusbe taken into account to increase the long-term success ofweight management. In current behavioural interventions,still fairly little attention has been devoted to, for example,psychological resources needed for the long-term manage-ment of body weight or other health-related lifestyle habits[53].
In the present study, except for the lower energy intakeand better compliance of the use of the test foods, otherdietary factors were not associated with better weightmanagement. This was despite the fact that the differencesin the protein and fibre contents of the study diets werecomparable with those reported in previous studies yetdemonstrating better weight management on the diets withhigher protein [14, 54–56] or fibre content [12, 18]. Indeed,in a recent Diogenes study even smaller difference (4.5–6.5%versus 7.5%, Diogenes versus present study) in the dietaryprotein intake between the study groups was followed bysignificant, although relatively small (0.9 kg), difference inbody weight regain after a successful weight loss [56]. Nodifferences were, however, detected in satiety even in thatstudy. The authors ascribed this to be due to too subtle satietyeffects of the diets to be subjectively measured.
On the other hand, the positive association between pro-tein intake and satiety has been suggested to be evident onlywhen protein intake is greater than protein requirements[16, 57]. Thus the degree of satiation may be influencedby the absolute amount of protein. Indeed, Lejeune et al.[57] reported that the greater satiating effect of dietaryprotein was seen only when protein intake was as much as2.6 g/kg. This is much more than what was the protein intake(1.3 g/kg) in the HSF group in the present study. It couldtherefore be argued that the protein intake was not enoughto contribute to possible significant effect on long-term

12 Journal of Obesity
satiety. However, much higher protein intake would havebeen impractical to achieve and would not have representeda normal balanced diet.
Howarth et al. [18] estimated that about 14 g increasein daily dietary fibre intake in ad libitum conditions wasassociated with about 10% decrease in dietary energy intakeand consequent decrease in body weight. In the presentstudy the HSF group increased their daily dietary fibre intakeapproximately by 10 g. It could therefore be argued that thedietary fibre content of the study diet was still not enough tocontribute to more successful weight management, althoughalready smaller amounts of dietary fibre have been demon-strated to be effective [12].
When interpreting the results, it should be noticed thatthe weight-maintenance diet was not totally ad libitumsince the participants were given instructions about therecommended number of portions to be consumed withineach food group. This could naturally have diminished thepossible influence of dietary fibre and protein and theirpotential satiety effect on the self-regulation of food intakeand thereby on the maintenance of reduced body weight. Inline, most studies reporting greater weight loss after high-protein than low-protein diet have been those allowing adlibitum food intake, whereas only few of the studies thathave provided isocaloric high- versus low-protein diets haveshown significant weight loss results [14, 19, 32]. We cannotrule out that if the proportion of foods with different satietyvalues would have been greater than 30% of energy intake,a possible satiety effect could have been seen. This was,however, the highest amount of test foods that could berealistically included into the diet without an excessive riskof dietary noncompliance due to the continuous use ofonly limited number of test foods. On the other hand, theproportion of test foods should not be too high to limitfreedom in the remaining diet to show potential differencesin energy intake. Finally, all the other dietary counsellinggiven to the subjects during the study, especially in the groupsessions before the weight-maintenance period, might alsohave diminished the possible differences between the groups.
Another central methodological issue is that, to ourknowledge, this was the first time to examine whether foodswith predetermined satiety values could contribute to weightmanagement. Thus, at the same time, the study examined thepredictive value of a single satiety measurement of food onsatiety during continued use in a free-living context. As theresults suggest, the different predetermined satiety values ofthe test foods did not influence weight management in a free-living situation. No differences were seen either in energyintake or in the weekly ratings of hunger or satiety. Eventhe experienced easiness of weight management was virtuallyidentical between the study groups. This confirms how muchmore difficult it is to get reliable data about satiety outside acontrolled laboratory setting. It also raises issues as to howfar laboratory data can really be extrapolated to free-livingconditions [32]. Yet controlled laboratory testing is a generaland recommended practice when assessing the satiety valuesof foods [33].
Naturally, the laboratory testing conditions are also ofimportance. In the present study, the satiety values of the
test foods were determined in a separate group representingmostly relatively young, normal-weight subjects. The demo-graphic characteristics of the subjects in the satiety testsand in the intervention were thus quite different. Normal-weight and overweight subjects were, however, selected forsatiety testing instead of obese individuals due to potentiallyattenuated satiety responses in obese as compared with leanindividuals [32], to be able to demonstrate actual differencesin satiety values between the test products. Furthermore, inthe satiety tests, the foods were tested as isocaloric portions,and, during the intervention, the recommended portion sizeswere adjusted to represent typical portion sizes of each foodrelative to everyday food consumption. The test foods alsovaried in some other dimensions, such as macronutrientcontent and palatability. All this could have affected thebehaviours observed over the weight-maintenance periodand perhaps obscured the potential effect of satiety value offoods. Nevertheless, although satiety value of foods shouldideally be tested in subjects and conditions representingthe target situation as close as possible, controlling all theprevailing conditions comparable to free-living conditionsmay be unrealistic. Furthermore, most of the foods are rarelyeaten as such but usually as a part of a mixed meal or asnack. Thus, the satiety values do vary also according toother prevailing, mostly uncontrollable circumstance-relatedfactors.
It could be argued that factors that predict subsequentweight maintenance are not necessarily the same if weightloss is initially achieved rapidly with a VLCD comparedwith methods inducing more gradual weight loss. A recentstudy comparing factors associated with successful weightmaintenance in relation to initial method of weight loss (i.e.,VLCD versus commercial program or self-guided approach)did not, however, observe any differences across the methodson the changes in eating behaviour or dietary intake [58],which further supports the relevance of the present findingson the success of weight management.
5. Conclusions
Foods with higher predetermined satiety value, wheningested as a part of a controlled weight-maintenance diet,did not contribute to better weight maintenance. Instead,success in weight maintenance was associated with a greaterincrease in flexible control of eating and greater decreasein uncontrollable eating and psychological distress. Thus,means to support changes in these psychobehavioural factorsare of essential importance in successful long-term weightmanagement.
Acknowledgments
The authors gratefully acknowledge Eeva Lajunen for herexcellent laboratory assistance and authorized nutrition-ists M.S. Anne Jaaskelainen, M.S. Tarja Martikainen, M.S.Reetta Mustonen, and M.S. Taisa Venalainen for theirexcellent assistance in nutritional and other practical dutiesthroughout the intervention study. The skillful assistance

Journal of Obesity 13
of technicians Pirkko Nousiainen, Heidi Eriksson, and UllaOsterlund and M.S. Nora Ohls in conducting the satietytests at VTT is also greatly appreciated. This work wassupported by the Finnish Funding Agency for Technologyand Innovation (Tekes, grant 40100/07) and Finnish foodmanufacturers (Atria Plc, Fazer Group Ltd, Arla Ingman Ltd,Valio Ltd, Sinebrychoff Ltd, Vaasan Ltd, Foodfiles Ltd, LeirasFinland Ltd) and partly by the SalWe Research Program forMind and Body (Tekes grant 1104/10).
References
[1] J. Ikeda, N. K. Amy, P. Ernsberger et al., “The national weightcontrol registry: a critique,” Journal of Nutrition Education andBehavior, vol. 37, no. 4, pp. 203–205, 2005.
[2] V. Hainer, H. Toplak, and A. Mitrakou, “Treatment modalitiesof obesity: what fits whom?” Diabetes Care, vol. 31, supple-ment 2, pp. S269–S277, 2008.
[3] P. J. Havel, “Peripheral signals conveying metabolic informa-tion to the brain: short-term and long-term regulation offood intake and energy homeostasis,” Experimental Biologyand Medicine, vol. 226, no. 11, pp. 963–977, 2001.
[4] P. Sumithran, L. A. Prendergast, E. Delbridge et al., “Long-term persistence of hormonal adaptations to weight loss,” NewEngland Journal of Medicine, vol. 365, no. 17, pp. 1597–1604,2011.
[5] S. H. A. Holt, J. C. Brand Miller, P. Petocz, and E. Farmakalidis,“A satiety index of common foods,” European Journal ofClinical Nutrition, vol. 49, no. 9, pp. 675–690, 1995.
[6] C. Marmonier, D. Chapelot, and J. Louis-Sylvestre, “Effectsof macronutrient content and energy density of snacksconsumed in a satiety state on the onset of the next meal,”Appetite, vol. 34, no. 2, pp. 161–168, 2000.
[7] M. Yao and S. B. Roberts, “Dietary energy density and weightregulation,” Nutrition Reviews, vol. 59, no. 8, pp. 247–258,2001.
[8] L. B. Sørensen, P. Møller, A. Flint, M. Martens, and A. Raben,“Effect of sensory perception of foods on appetite and foodintake: a review of studies on humans,” International Journalof Obesity, vol. 27, no. 10, pp. 1152–1166, 2003.
[9] D. E. Gerstein, G. Woodward-Lopez, A. E. Evans, K. Kelsey,and A. Drewnowski, “Clarifying concepts about macronutri-ents’ effects on satiation and satiety,” Journal of the AmericanDietetic Association, vol. 104, no. 7, pp. 1151–1153, 2004.
[10] D. M. Mourao, J. Bressan, W. W. Campbell, and R. D. Mattes,“Effects of food form on appetite and energy intake in lean andobese young adults,” International Journal of Obesity, vol. 31,no. 11, pp. 1688–1695, 2007.
[11] D. Paddon-Jones, E. Westman, R. D. Mattes, R. R. Wolfe, A.Astrup, and M. Westerterp-Plantenga, “Protein, weight man-agement, and satiety,” American Journal of Clinical Nutrition,vol. 87, no. 5, pp. 1558S–1561S, 2008.
[12] A. J. Wanders, J. J. G. C. van den Borne, C. de Graaf etal., “Effects of dietary fibre on subjective appetite, energyintake and body weight: a systematic review of randomizedcontrolled trials,” Obesity Reviews, vol. 12, no. 9, pp. 724–739,2011.
[13] H. J. Leidy, N. S. Carnell, R. D. Mattes, and W. W. Campbell,“Higher protein intake preserves lean mass and satiety withweight loss in pre-obese and obese women,” Obesity, vol. 15,no. 2, pp. 421–429, 2007.
[14] D. S. Weigle, P. A. Breen, C. C. Matthys et al., “A high-protein diet induces sustained reductions in appetite, adlibitum caloric intake, and body weight despite compensatorychanges in diurnal plasma leptin and ghrelin concentrations,”American Journal of Clinical Nutrition, vol. 82, no. 1, pp. 41–48, 2005.
[15] A. M. Johnstone, G. W. Horgan, S. D. Murison, D. M. Bremner,and G. E. Lobley, “Effects of a high-protein ketogenic diet onhunger, appetite, and weight loss in obese men feeding adlibitum,” American Journal of Clinical Nutrition, vol. 87, no.1, pp. 44–55, 2008.
[16] M. Veldhorst, A. Smeets, S. Soenen et al., “Protein-inducedsatiety: effects and mechanisms of different proteins,” Physi-ology and Behavior, vol. 94, no. 2, pp. 300–307, 2008.
[17] M. S. Westerterp-Plantenga, A. Nieuwenhuizen, D. Tome, S.Soenen, and K. R. Westerterp, “Dietary protein, weight loss,and weight maintenance,” Annual Review of Nutrition, vol. 29,pp. 21–41, 2009.
[18] N. C. Howarth, E. Saltzman, and S. B. Roberts, “Dietary fiberand weight regulation,” Nutrition Reviews, vol. 59, no. 5, pp.129–139, 2001.
[19] T. L. Halton and F. B. Hu, “The effects of high protein dietson thermogenesis, satiety and weight loss: a critical review,”Journal of the American College of Nutrition, vol. 23, no. 5, pp.373–385, 2004.
[20] J. L. Slavin, “Dietary fiber and body weight,” Nutrition, vol. 21,no. 3, pp. 411–418, 2005.
[21] N. P. Hays, G. P. Bathalon, M. A. McCrory, R. Roubenoff,R. Lipman, and S. B. Roberts, “Eating behavior correlates ofadult weight gain and obesity in healthy women aged 55–65y,” American Journal of Clinical Nutrition, vol. 75, no. 3, pp.476–483, 2002.
[22] V. Provencher, V. Drapeau, A. Tremblay, J. P. Despres, and S.Lemieux, “Eating behaviors and indexes of body compositionin men and women from the Quebec family study,” ObesityResearch, vol. 11, no. 6, pp. 783–792, 2003.
[23] J. S. Savage, L. Hoffman, and L. L. Birch, “Dieting, restraint,and disinhibition predict women’s weight change over 6 y,”American Journal of Clinical Nutrition, vol. 90, no. 1, pp. 33–40, 2009.
[24] K. Elfhag and S. Rossner, “Who succeeds in maintainingweight loss? A conceptual review of factors associated withweight loss maintenance and weight regain,” Obesity Reviews,vol. 6, no. 1, pp. 67–85, 2005.
[25] A. J. Stunkard and S. Messick, “The three-factor eatingquestionnaire to measure dietary restraint, disinhibition andhunger,” Journal of Psychosomatic Research, vol. 29, no. 1, pp.71–83, 1985.
[26] P. J. Teixeira, M. N. Silva, S. R. Coutinho et al., “Mediatorsof weight loss and weight loss maintenance in middle-agedwomen,” Obesity, vol. 18, no. 4, pp. 725–735, 2010.
[27] F. Bellisle, “Why should we study human food intakebehaviour?” Nutrition, Metabolism and Cardiovascular Dis-eases, vol. 13, no. 4, pp. 189–193, 2003.
[28] N. Vogels and M. S. Westerterp-Plantenga, “Successful long-term weight maintenance: a 2-year follow-up,” Obesity, vol. 15,no. 5, pp. 1258–1266, 2007.
[29] H. Konttinen, S. Mannisto, S. Sarlio-Lahteenkorva, K. Silven-toinen, and A. Haukkala, “Emotional eating, depressive symp-toms and self-reported food consumption. A population-based study,” Appetite, vol. 54, no. 3, pp. 473–479, 2010.
[30] A. M. Keranen, M. J. Savolainen, A. H. Reponen et al., “Theeffect of eating behavior on weight loss and maintenance

14 Journal of Obesity
during a lifestyle intervention,” Preventive Medicine, vol. 49,no. 1, pp. 32–38, 2009.
[31] P. J. Teixeira, M. N. Silva, S. R. Coutinho et al., “Mediatorsof weight loss and weight loss maintenance in middle-agedwomen,” Obesity, vol. 18, no. 4, pp. 725–735, 2010.
[32] B. Benelam, “Satiation, satiety and their effects on eatingbehaviour,” Nutrition Bulletin, vol. 34, no. 2, pp. 126–173,2009.
[33] J. Blundell, C. de Graaf, T. Hulshof et al., “Appetite control:methodological aspects of the evaluation of foods,” ObesityReviews, vol. 11, no. 3, pp. 251–270, 2010.
[34] M. Lyly, N. Ohls, L. Lahteenmaki et al., “The effect of fibreamount, energy level and viscosity of beverages containingoat fibre supplement on perceived satiety,” Food and NutritionResearch, vol. 54, article 2149, 2010.
[35] T. V. E. Kral and B. J. Rolls, “Energy density and portion size:their independent and combined effects on energy intake,”Physiology and Behavior, vol. 82, no. 1, pp. 131–138, 2004.
[36] D. Frankenfield, L. Roth-Yousey, and C. Compher, “Com-parison of predictive equations for resting metabolic ratein healthy nonobese and obese adults: a systematic review,”Journal of the American Dietetic Association, vol. 105, no. 5, pp.775–789, 2005.
[37] A. Astrup, P. C. Gøtzsche, K. van de Werken et al., “Meta-analysis of resting metabolic rate in formerly obese subjects,”American Journal of Clinical Nutrition, vol. 69, no. 6, pp. 1117–1122, 1999.
[38] J. Westenhoefer, A. J. Stunkard, and V. Pudel, “Validation ofthe flexible and rigid control dimensions of dietary restraint,”International Journal of Eating Disorders, vol. 26, no. 1, pp. 53–64, 1999.
[39] T. Van Strien, J. E. R. Frijters, G. P. A. Bergers, and P. B.Defares, “The Dutch eating behavior questionnaire (DEBQ)for assessment of restrained, emotional, and external eatingbehavior,” International Journal of Eating Disorders, vol. 5, no.2, pp. 295–315, 1986.
[40] J. Gormally, S. Black, S. Daston, and D. Rardin, “Theassessment of binge eating severity among obese persons,”Addictive Behaviors, vol. 7, no. 1, pp. 47–55, 1982.
[41] D. Goldberg and P. Williams, A Users Guide to the Gen-eral Health Questionnaire, NFERNELSON Publishing Co.Ltd,Windsor, Berkshire, UK, 1988.
[42] F. M. Sacks, G. A. Bray, V. J. Carey et al., “Comparison ofweight-loss diets with different compositions of fat, protein,and carbohydrates,” New England Journal of Medicine, vol. 360,no. 9, pp. 859–873, 2009.
[43] R. Dalle Grave, S. Calugi, F. Corica, S. Di Domizio, andG. Marchesini, and QUOVADIS Study Group, “Psychologicalvariables associated with weight loss in obese patients seekingtreatment at medical centers,” Journal of the American DieteticAssociation, vol. 109, no. 12, pp. 2010–2016, 2009.
[44] C. A. Timko and J. Perone, “Rigid and flexible control of eatingbehavior in a college population,” Eating Behaviors, vol. 6, no.2, pp. 119–125, 2005.
[45] F. Johnson, M. Pratt, and J. Wardle, “Dietary restraint and self-regulation in eating behavior,” International Journal of Obesity,vol. 36, no. 5, pp. 665–674, 2012.
[46] M. T. McGuire, R. W. Jeffery, S. A. French, and P. J. Hannan,“The relationship between restraint and weight and weight-related behaviors among individuals in a community weightgain prevention trial,” International Journal of Obesity, vol. 25,no. 4, pp. 574–580, 2001.
[47] V. Drapeau, V. Provencher, S. Lemieux, J. P. Despres, C.Bouchard, and A. Tremblay, “Do 6-y changes in eating
behaviors predict changes in body weight? Results from theQuebec Family Study,” International Journal of Obesity, vol. 27,no. 7, pp. 808–814, 2003.
[48] A. DelParigi, K. Chen, A. D. Salbe et al., “Successful dietershave increased neural activity in cortical areas involved in thecontrol of behavior,” International Journal of Obesity, vol. 31,no. 3, pp. 440–448, 2007.
[49] M. Hollmann, L. Hellrung, B. Pleger et al., “Neural correlatesof the volitional regulation of the desire for food,” Interna-tional Journal of Obesity, vol. 36, no. 5, pp. 648–655, 2012.
[50] A. Bandura, “Self-efficacy: toward a unifying theory ofbehavioral change,” Psychological Review, vol. 84, no. 2, pp.191–215, 1977.
[51] A. L. Palmeira, P. J. Teixeira, T. L. Branco et al., “Predictingshort-term weight loss using four leading health behaviorchange theories,” International Journal of Behavioral Nutritionand Physical Activity, vol. 4, article no. 14, 2007.
[52] N. Hankonen, M. Vollmann, B. Renner, and P. Absetz,“What is setting the stage for abdominal obesity reduction?A comparison between personality and health-related socialcognitions,” Journal of Behavioral Medicine, vol. 33, no. 5, pp.415–422, 2010.
[53] P. J. Teixeira, H. Patrick, and J. Mata, “Why we eat what weeat: the role of autonomous motivation in eating behaviourregulation,” Nutrition Bulletin, vol. 36, no. 1, pp. 102–107,2011.
[54] A. Due, S. Toubro, A. R. Skov, and A. Astrup, “Effect ofnormal-fat diets, either medium or high in protein, on bodyweight in overweight subjects: a randomised 1-year trial,”International Journal of Obesity, vol. 28, no. 10, pp. 1283–1290,2004.
[55] M. P. G. M. Lejeune, E. M. R. Kovacs, and M. S. Westerterp-Plantenga, “Additional protein intake limits weight regain afterweight loss in humans,” British Journal of Nutrition, vol. 93, no.2, pp. 281–289, 2005.
[56] T. M. Larsen, S. M. Dalskov, M. van Baak et al., “Diets withhigh or low protein content and glycemic index for weight-loss maintenance,” New England Journal of Medicine, vol. 363,no. 22, pp. 2102–2113, 2010.
[57] M. P. G. M. Lejeune, K. R. Westerterp, T. C. M. Adam, N. D.Luscombe-Marsh, and M. S. Westerterp-Plantenga, “Ghrelinand glucagon-like peptide 1 concentrations, 24-h satiety, andenergy and substrate metabolism during a high-protein dietand measured in a respiration chamber,” American Journal ofClinical Nutrition, vol. 83, no. 1, pp. 89–94, 2006.
[58] A. Marinilli Pinto, A. A. Gorin, H. A. Raynor, D. F. Tate, J. L.Fava, and R. R. Wing, “Successful weight-loss maintenance inrelation to method of weight loss,” Obesity, vol. 16, no. 11, pp.2456–2461, 2008.

Submit your manuscripts athttp://www.hindawi.com
Stem CellsInternational
Hindawi Publishing Corporationhttp://www.hindawi.com Volume 2014
Hindawi Publishing Corporationhttp://www.hindawi.com Volume 2014
MEDIATORSINFLAMMATION
of
Hindawi Publishing Corporationhttp://www.hindawi.com Volume 2014
Behavioural Neurology
EndocrinologyInternational Journal of
Hindawi Publishing Corporationhttp://www.hindawi.com Volume 2014
Hindawi Publishing Corporationhttp://www.hindawi.com Volume 2014
Disease Markers
Hindawi Publishing Corporationhttp://www.hindawi.com Volume 2014
BioMed Research International
OncologyJournal of
Hindawi Publishing Corporationhttp://www.hindawi.com Volume 2014
Hindawi Publishing Corporationhttp://www.hindawi.com Volume 2014
Oxidative Medicine and Cellular Longevity
Hindawi Publishing Corporationhttp://www.hindawi.com Volume 2014
PPAR Research
The Scientific World JournalHindawi Publishing Corporation http://www.hindawi.com Volume 2014
Immunology ResearchHindawi Publishing Corporationhttp://www.hindawi.com Volume 2014
Journal of
ObesityJournal of
Hindawi Publishing Corporationhttp://www.hindawi.com Volume 2014
Hindawi Publishing Corporationhttp://www.hindawi.com Volume 2014
Computational and Mathematical Methods in Medicine
OphthalmologyJournal of
Hindawi Publishing Corporationhttp://www.hindawi.com Volume 2014
Diabetes ResearchJournal of
Hindawi Publishing Corporationhttp://www.hindawi.com Volume 2014
Hindawi Publishing Corporationhttp://www.hindawi.com Volume 2014
Research and TreatmentAIDS
Hindawi Publishing Corporationhttp://www.hindawi.com Volume 2014
Gastroenterology Research and Practice
Hindawi Publishing Corporationhttp://www.hindawi.com Volume 2014
Parkinson’s Disease
Evidence-Based Complementary and Alternative Medicine
Volume 2014Hindawi Publishing Corporationhttp://www.hindawi.com