psychometric functions for level discrimination
TRANSCRIPT
Psychometric functions for level discrimination Seren Buus
Communication and Digital Signal Processing Center, Department of Electrical and Computer Engineering (409 D•4 ), Northeastern University, Boston, Massachusetts 02115
Mary Florentine Communication Research Laboratory, Department of Speech-Language Pathology and Audiology (133 FR ), Northeastern University, Boston, Massachusetts 02115
(Received 7 March 1990; revised 22 January 1991; accepted 21 May 1991 )
To determine the form of psychometric functions for 21,2AFC level discrimination (commonly called intensity discrimination), ten increment levels were presented in random order within blocks of 100 trials. Stimuli were chosen to encompass a wide range of conditions and difference limens: eight 10-ms tones had frequencies of 0.25, 1, 8, or 14 kHz and levels of 30, 60, or 90 dB SPL; two 500-ms stimuli also were tested: a 1-kHz tone at 90 dB SPL and broadband noise at 63 dB SPL. For each condition, at least 20 blocks were presented in mixed order. Results for five normal listeners show that the sensitivity, d ', is nearly proportional to AL{ = 20 log[ (p + Ap)/p ], where p is sound pressure} over the entire range of difference limens. When d' is plotted against Weber fractions for sound pressure, Ap/p, or intensity, AI/I, exponents of the best-fitting power functions decrease with increasing difference limens and are less than unity for large difference limens. The approximately proportional relation between d' and AL agrees with modern multichannel models of level discrimination and with psychometric functions derived for single auditory-nerve fibers. The results also support the notion that the difference limen, expressed as ALto and plotted on a logarithmic scale, is an appropriate representation of performance in level-discrimination experiments.
PACS numbers: 43.66.Fe, 43.66.Ba, 43.64.Bt [NFV]
INTRODUCTION
The purpose of this study is to examine psychometric functions for level discrimination (also called intensity dis- crimination). At least three different forms of the psycho- metric function have been assumed, either explicitly or im- plicitly, in the literature. For example, many studies consider level discrimination a special case of masking and plot the energy or intensity of the "signal" (or increment) as a function of the energy or intensity of the "masker" (e.g., McGill and Goldberg, 1968; Penner et al., 1974; Viemeister, 1988). This implies that the sensitivity, d ', ought to be pro- portional to the intensity difference, A/, between the two sounds to be discriminated. Another form follows from sig- nal detection theory. When the signal is known completely (including phase information), signal detection theory pre- dicts d' = x/2E/No, where E is signal energy and No is the spectral power density of a masking noise (Tanner, 1958; see Green, 1960, for review). Because any deterministic masker will be subtracted by the ideal receiver used to arrive at this prediction, E is the energy of what remains after subtraction. Thus, d' is proportional to AI ø'5 only if the signal is orthogo- nal to the pedestal. If the signal is in phase with the pedestal, d' ought to be proportional to the sound pressure difference,
a) Parts of this paper were presented at the 114th and 118th Meetings of the Acoustical Society of America in Miami, November 1987 and St. Louis, December 1989.
Ap, to be discriminated, because E is proportional to Ap 2 [ see Chap. 7 in Green and Swets (1966) and p. 50 in Green (1988) ]. Yet another form of the psychometric function for level discrimination follows from the models of Durlach and
Braida (1969) and of Florentine and Buus ( 1981 ). Accord- ing to these models, d' should be proportional to the level difference, AL { = 20 log[ (p + Ap)/p], where p is the sound pressure of the pedestal}, between the sounds to be discriminated.
Although many studies have shown psychometric func- tions for level discrimination (e.g., Tanner, 1958; Campbell and Lasky, 1967; McGill and Goldberg, 1968; Ronken, 1969; Rabinowitz, 1970; Pynn et al., 1972; Rabinowitz et al., 1976; Green et al., 1979; Hanna et al., 1986; Viemeister, 1988), it is not clear which, if any, of the three forms dis- cussed above is correct. For example, Tanner (1958) found psychometric functions with a slope of about 2%/dB in terms of percent correct versus 10 log(AI/I), which is roughly consistent with d' being proportional to the square root of increment energy. In contrast, Campbell and Lasky (1967) found slopes of about 5%-6%/dB, which is consis- tent with d' being proportional to AI. • Other studies have concluded that d' is proportional to Ap (Green et al., 1979; Hanna et al., 1986; Raney et al., 1989), and still other studies have concluded that d' is proportional to AL (Rabinowitz, 1970; Pynn et al., 1972; Rabinowitz et al., 1976; Viemeister, 1988). One problem with these studies is that most have measured psychometric functions for stimuli with relatively
1371 J. Acoust. Soc. Am. 90 (3), September 1991 0001-4966/91/091371-10500.80 @ 1991 Acoustical Society of America 1371
Redistribution subject to ASA license or copyright; see http://acousticalsociety.org/content/terms. Download to IP: 129.101.79.200 On: Thu, 11 Sep 2014 16:02:18
small differ&nce limens, which makes necessary the use of relatively small increments. When the increments are small, A LAp, and AL are nearly proportional to one another and it is impossible to distinguish among the three hypotheses.
The present study seeks to alleviate this problem by measuring psychometric functions in a variety of conditions with a wide range of difference limens. To provide a clear distinction among the proposed forms of the psychometric functions, emphasis is placed on conditions in which the dif- ference limens are relatively large, but to ensure that the results are general, conditions with relatively small differ- ence limens are also included.
+ 12 and + 15 dB) followed by ten trials at each of the ten test levels presented in random order. For each listener and condition, approximately 25 blocks of trials were obtained. To ensure that the data for each listener and condition were
relatively homogenous, blocks that yielded an average per- centage correct outside the 80% confidence interval were eliminated from analysis. The 80% confidence interval was calculated on the basis of the mean and standard deviation of
the average percentage correct obtained for each block. 2 In general, this procedure eliminated about 20% of the blocks. To ensure that each datum was based on at least 200 trials, extra blocks of trials were run, if necessary, until at least 20 blocks were retained.
I. METHOD
A. Procedure
Level-discrimination performance was measured in a two-interval, two-alternative forced-choice procedure with feedback. On each trial, the listeners were presented two bursts of sound that differed in level. The level difference was
produced by in-phase addition of a signal to a pedestal. The signal had the same waveform as the pedestal except for a variable amount of attenuation, As, and was added to either the first or the second burst with equal apriori probability for each burst. The listener's task was to indicate by pressing one of two buttons which of the two bursts contained the signal. Immediately after responding, the listener was shown on the CRT terminal which interval contained the signal.
An adaptive [ one-up, two-down (Levitt, 1971 ) ] proce- dure was used to provide practice and to select the range of increments to be tested for each listener and condition.
These measurements determined the difference limen for a
change in sound level, ALi>L { = 20 log[ (p + Apt>L )/p ] = 20 log[ 1 + 10(--Ai>•/20) ], where Api>• is the sound-
pressure increment and At>r the signal attenuation yielding 70.7% correct responses}. The signal level, defined as -- As mi.e., the negative of the signal attenuation relative to the pedestal, decreased following two consecutive correct re- sponses and increased following one incorrect response. The step size was 5 dB until the first reversal and 2 dB from then on. Reversals occurred whenever the signal levels in succes- sive trials changed from increasing to decreasing or vice versa. A single measurement of ALi>• consisted of three brief, consecutive runs. Each run was terminated after five
reversals and the ALi>L was calculated from the average sig- nal level at the last two reversals for each of the three runs.
At least three such ALt>r's were obtained for each listener and condition. Conditions were presented in mixed order.
Psychometric functions were then obtained by the method of constant stimuli. For each condition, ten signal levels, 3 dB apart [ in terms of 20 log (Ap/p) ], ranging from -- 12 to + 15 dB re: Apt>• were tested. Equal spacing on a
logarithmic scale of Ap was chosen because it provides con- venient, equal steps in As. It also corresponds to equal steps of log(d ') ifd' is proportional to Apmas is the median of the predictions by the three hypotheses discussed above. Condi- tions were presented in mixed order in blocks of 104 trials. Each block consisted of four warm-up trials (two each at
B. Listeners
Three listeners, RR, LG, and KS, were university stu- dents (20 to 24 years old) with no history of hearing difficul- ties. Their thresholds were within 10 dB of ANSI (1969) standard audiometric thresholds between 250 and 8000 Hz.
Between 8000 and 20 000 Hz, their thresholds were within the normal range established in our laboratory. RR and LG had extensive practice in level discrimination from a pre- vious experiment (Florentine et al., 1987). In preparation for other experiments, two other listeners with normal hear- ing, SS and TZ ( 24 and 33 years old), were tested in a limited set of conditions. Their data will be shown together with those for RR, LG, and KS. Except TZ, all listeners were paid to participate in the experiments.
C. Stimuli
Psychometric functions were obtained for ten different stimuli. Eight stimuli were 10-ms tone bursts at 0.25, 1, 8, and 14 kHz. At 1 and 8 kHz, the pedestal levels were 30, 60, and 90 dB SPL; at 0.25 and 14 kHz, the pedestal level was 60 dB SPL. To provide data for conditions with small difference limens, measurements also were obtained for a 500-ms, 1- kHz tone at 90 dB SPL and a 500-ms broadband noise brc -- 22 kHz) with a spectrum level of 20 dB SPL (63 dB SPL
overall). In addition, LG was tested with 10-ms, 12-kHz and 500-ms, 14-kHz tones at 60 dB SPL to examine further the
form of the psychometric function at high frequencies and moderate levels. SS and TZ were tested only in five condi- tions, some of which differed from those stated above (see Table I). All stimuli had raised-cosine onsets and offsets with rise and fall times of 2 ms for the 10-ms duration and 20
ms for the 500-ms duration. Durations are specified between the half-amplitude points of the envelope.
D. Apparatus
A programmable oscillator (Krohn-Hite 4180R) pro- duced the sinusoids, and a white noise generator (Briiel & Kjaer 1405) followed by a low-pass filter (TTE, 120 dB/ oct) produced the noise. The output of the sound source was divided into a pedestal channel and a signal channel, which were gated (Wilsonics BSIT) and attenuated (Wilsonics PATT) before being summed. The output of the summation amplifier was attenuated (Wilsonics PATT), amplified, and
1372 J. Acoust. Soc. Am., Vol. 90, No. 3, September 1991 S. Buus and M. Florentine: Level discrimination 1372
Redistribution subject to ASA license or copyright; see http://acousticalsociety.org/content/terms. Download to IP: 129.101.79.200 On: Thu, 11 Sep 2014 16:02:18
led to the headphone (Yamaha YH-1 ). All listeners were tested in a sound-attenuating booth.
E. Data analysis
As stated above, at least 20 blocks were analyzed for each listener and condition. First, the average percentage correct and the 95% confidence interval for each signal level were calculated across blocks of trials. Signal levels for which the confidence interval included 100% correct were
excluded from further analysis, because the d' was too large to be estimated reliably. Likewise, signal levels for which the confidence interval included 50% correct were excluded
from further analysis, because performance in these cases was not significantly different from chance and d' was too low to be plotted reliably on a logarithmic scale. Typically, eight-to-ten signal levels remained for further analysis and, in all cases, the slopes of the psychometric functions were based on data for at least six signal levels.
Next, d "s for the remaining points were calculated from the estimates of hits and false alarms. To assess whether d' is
proportional to AL Ap, or AL, d' was plotted on a logarith- mic scale as a function of either AL Ap, or AL also on loga- rithmic scales. 3 In these plots, a straight line describes d' as a power function of the independent variable; if d' is propor- tional to the independent variable, the slope of the line--the exponent--ought to be equal to unity for all listeners and conditions. 4 The best-fitting line in each of the three plots was estimated by the method of least squares and was used to summarize the psychometric function for each listener and condition.
II. RESULTS
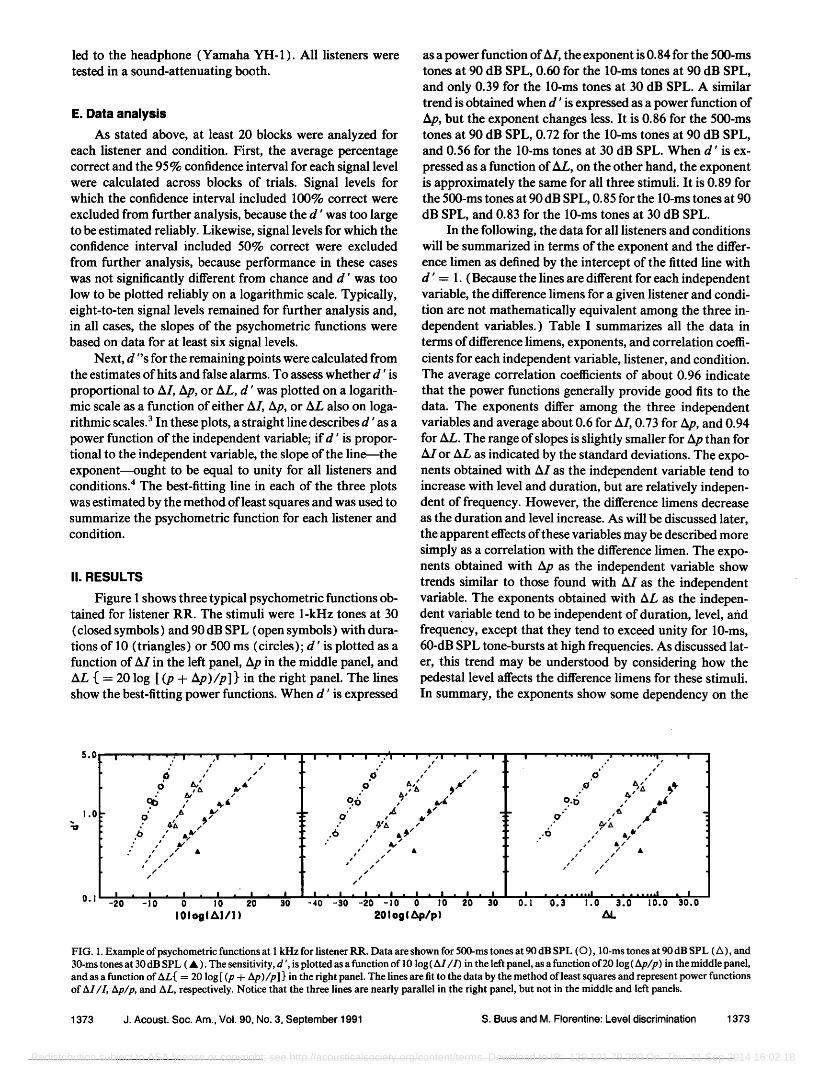
Figure 1 shows three typical psychometric functions ob- tained for listener RR. The stimuli were 1-kHz tones at 30
(closed symbols ) and 90 dB SPL (open symbols) with dura- tions of 10 (triangles) or 500 ms (circles); d' is plotted as a function of AI in the left panel, Ap in the middle panel, and AL { = 20 log [ (p + Ap)/p]} in the right panel. The lines show the best-fitting power functions. When d' is expressed
as a power function of AL the exponent is 0.84 for the 500-ms tones at 90 dB SPL, 0.60 for the 10-ms tones at 90 dB SPL, and only 0.39 for the 10-ms tones at 30 dB SPL. A similar trend is obtained when d' is expressed as a power function of Ap, but the exponent changes less. It is 0.86 for the 500-ms tones at 90 dB SPL, 0.72 for the 10-ms tones at 90 dB SPL, and 0.56 for the 10-ms tones at 30 dB SPL. When d' is ex-
pressed as a function of AL, on the other hand, the exponent is approximately the same for all three stimuli. It is 0.89 for the 500-ms tones at 90 dB SPL, 0.85 for the 10-ms tones at 90 dB SPL, and 0.83 for the 10-ms tones at 30 dB SPL.
In the following, the data for all listeners and conditions will be summarized in terms of the exponent and the differ- ence limen as defined by the intercept of the fitted line with d' = 1. (Because the lines are different for each independent variable, the difference limens for a given listener and condi- tion are not mathematically equivalent among the three in- dependent variables.) Table I summarizes all the data in terms of difference limens, exponents, and correlation coeffi- cients for each independent variable, listener, and condition. The average correlation coefficients of about 0.96 indicate that the power functions generally provide good fits to the data. The exponents differ among the three independent variables and average about 0.6 for AL 0.73 for Ap, and 0.94 for AL. The range of slopes is slightly smaller for Ap than for AI or AL as indicated by the standard deviations. The expo- nents obtained with AI as the independent variable tend to increase with level and duration, but are relatively indepen- dent of frequency. However, the difference limens decrease as the duration and level increase. As will be discussed later, the apparent effects of these variables may be described more simply as a correlation with the difference limen. The expo- nents obtained with Ap as the independent variable show trends similar to those found with AI as the independent variable. The exponents obtained with AL as the indepen- dent variable tend to be independent of duration, level, and frequency, except that they tend to exceed unity for 1 O-ms, 60-dB SPL tone-bursts at high frequencies. As discussed lat- er, this trend may be understood by considering how the pedestal level affects the difference limens for these stimuli. In summary, the exponents show some dependency on the
5o0 ÷
1.0
O. I . I , I , I , I , I ß I I ........ I ........ I , I -20 -lO 0 10 20 .•0 0.1 0,3 1.0 3,0 10.0 30.0
IOIoglA]/l) •L
FIG. 1. Example of psychometric functions at 1 kHz for listener RR. Data are shown for 500-ms tones at 90 dB SPL (O), 10-ms tones at 90 dB SPL (A), and 30-ms tones at 30 dB SP L ( & ). The sensitivity, d ', is plotted as a function of 10 log ( AI/I) in the left panel, as a function of 20 log (Aœ/œ) in the middle panel, and as a function of AL( = 20 log [ (œ + Aœ)/œ ] ) in the right panel. The lines are fit to the data by the method of least squares and represent power functions of AI/I, Ap/p, and AL, respectively. Notice that the three lines are nearly parallel in the right panel, but not in the middle and left panels.
1373 J. Acoust. Soc. Am., Vol. 90, No. 3, September 1991 S. Buus and M. Florentine: Level discrimination 1373
Redistribution subject to ASA license or copyright; see http://acousticalsociety.org/content/terms. Download to IP: 129.101.79.200 On: Thu, 11 Sep 2014 16:02:18
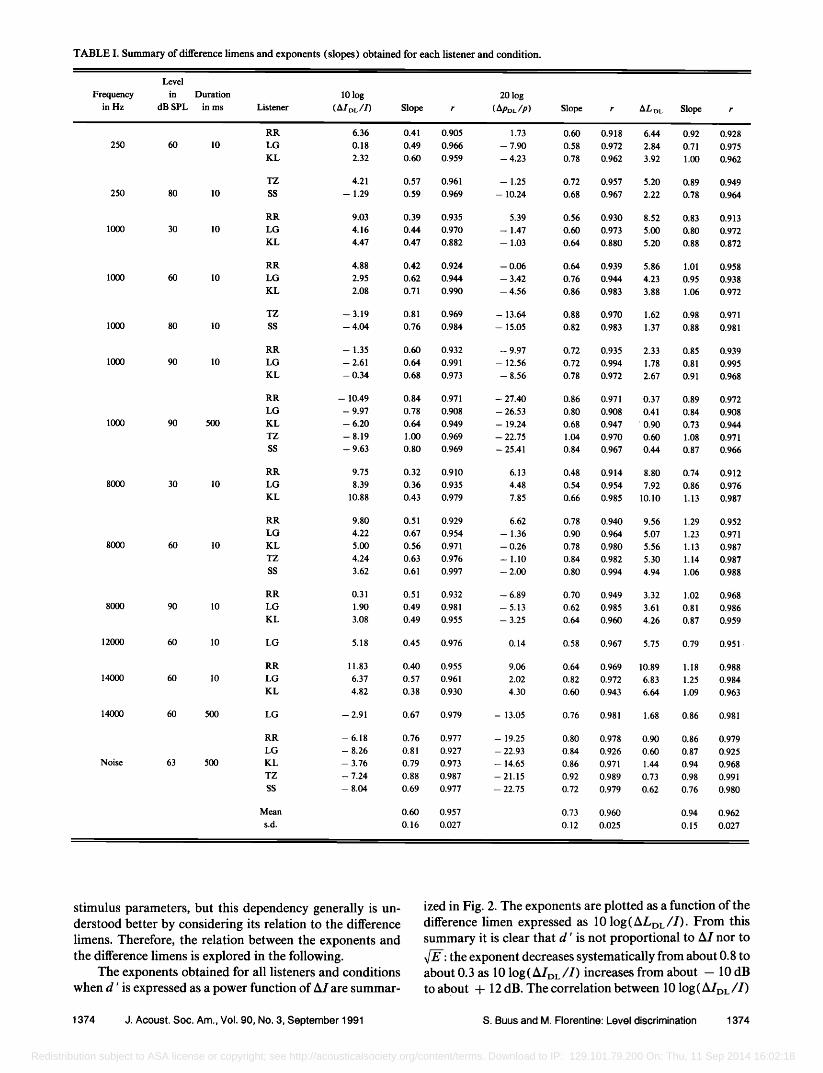
TABLE I. Summary of difference limens and exponents (slopes) obtained for each listener and condition.
Level
Frequency in Duration 10 log 20 log in Hz dB SPL in ms Listener (AIoL/I) Slope r (ApoL/p) Slope r AL o• Slope r
250 60 10
250 80 10
1000 30 10
1000 60 10
1000 80 10
1000 90 10
1000 90 500
8000 30 10
8000 60 10
8000 90 10
12000 60 10
14000 6O 10
14000 60 500
Noise 63 500
RR 6.36 0.41 0.905 1.73
LG 0.18 0.49 0.966 --7.90
KL 2.32 0.60 0.959 -- 4.23
TZ 4.21 0.57 0.961 --1.25
SS --1.29 0.59 0.969 - 10.24
RR 9.03 0.39 0.935 5.39
LG 4.16 0.44 0.970 --1.47
KL 4.47 0.47 0.882 -- 1.03
RR 4.88 0.42 0.924 -- 0.06
LG 2.95 0.62 0.944 - 3.42
KL 2.08 0.71 0.990 -- 4.56
TZ -- 3.19 0.81 0.969 -- 13.64
SS - 4.04 0.76 0.984 - 15.05
RR -- 1.35 0.60 0.932 - 9.97
LG --2.61 0.64 0.991 -12.56
KL -- 0.34 0.68 0.973 -- 8.56
RR - 10.49 0.84 0.971 - 27.40
LG -9.97 0.78 0.908 --26.53
KL -- 6.20 0.64 0.949 -- 19.24
TZ -- 8.19 1.00 0.969 -- 22.75
SS -9.63 0.80 0.969 -25.41
RR 9.75 0.32 0.910 6.13
LG 8.39 0.36 0.935 4.48
KL 10.88 0.43 0.979 7.85
RR 9.80 0.51 0.929 6.62
LG 4.22 0.67 0.954 -1.36
KL 5.00 0.56 0.971 -- 0.26
TZ 4.24 0.63 0.976 -- 1.10
SS 3.62 0.61 0.997 - 2.00
RR 0.31 0.51 0.932 -- 6.89
LG 1.90 0.49 0.981 - 5.13
KL 3.08 0.49 0.955 -- 3.25
LG 5.18 0.45 0.976 0.14
RR 11.83 0.40 0.955 9.06
LG 6.37 0.57 0.961 2.02
KL 4.82 0.38 0.930 4.30
LG - 2.91 0.67 0.979 - 13.05
RR - 6.18 0.76 0.977 - 19.25
LG - 8.26 0.81 0.927 - 22.93
KL -- 3.76 0.79 0.973 -- 14.65
TZ -- 7.24 0.88 0.987 - 21.15
SS -- 8.04 0.69 0.977 - 22.75
Mean 0.60 0.957
s.d. 0.16 0.027
0.60 0.918 6.44 0.92 0.928
0.58 0.972 2.84 0.71 0.975
0.78 0.962 3.92 1.00 0.962
0.72 0.957 5.20 0.89 0.949
0.68 0.967 2.22 0.78 0.964
0.56 0.930 8.52 0.83 0.913
0.60 0.973 5.00 0.80 0.972
0.64 0.880 5.20 0.88 0.872
0.64 0.939 5.86 1.01 0.958
0.76 0.944 4.23 0.95 0.938
0.86 0.983 3.88 1.06 0.972
0.88 0.970 1.62 0.98 0.971
0.82 0.983 1.37 0.88 0.981
0.72 0.935 2.33 0.85 0.939
0.72 0.994 1.78 0.81 0.995
0.78 0.972 2.67 0.91 0.968
0.86 0.971 0.37 0.89 0.972
0.80 0.908 0.41 0.84 0.908
0.68 0.947 '0.90 0.73 0.944
1.04 0.970 0.60 1.08 0.971
0.84 0.967 0.44 0.87 0.966
0.48 0.914 8.80 0.74 0.912
0.54 0.954 7.92 0.86 0.976
0.66 0.985 10.10 1.13 0.987
0.78 0.940 9.56 1.29 0.952
0.90 0.964 5.07 1.23 0.971
0.78 0.980 5.56 1.13 0.987
0.84 0.982 5.30 1.14 0.987
0.80 0.994 4.94 1.06 0.988
0.70 0.949 3.32 1.02 0.968
0.62 0.985 3.61 0.81 0.986
0.64 0.960 4.26 0.87 0.959
0.58 0.967 5.75 0.79 0.951
0.64 0.969 10.89 1.18 0.988
0.82 0.972 6.83 1.25 0.984
0.60 0.943 6.64 1.09 0.963
0.76 0.981 1.68 0.86 0.981
0.80 0.978 0.90 0.86 0.979
0.84 0.926 0.60 0.87 0.925
0.86 0.971 1.44 0.94 0.968
0.92 0.989 0.73 0.98 0.991
0.72 0.979 0.62 0.76 0.980
0.73 0.960 0.94 0.962
0.12 0.025 0.15 0.027
stimulus parameters, but this dependency generally is un- derstood better by considering its relation to the difference limens. Therefore, the relation between the exponents and the difference limens is explored in the following.
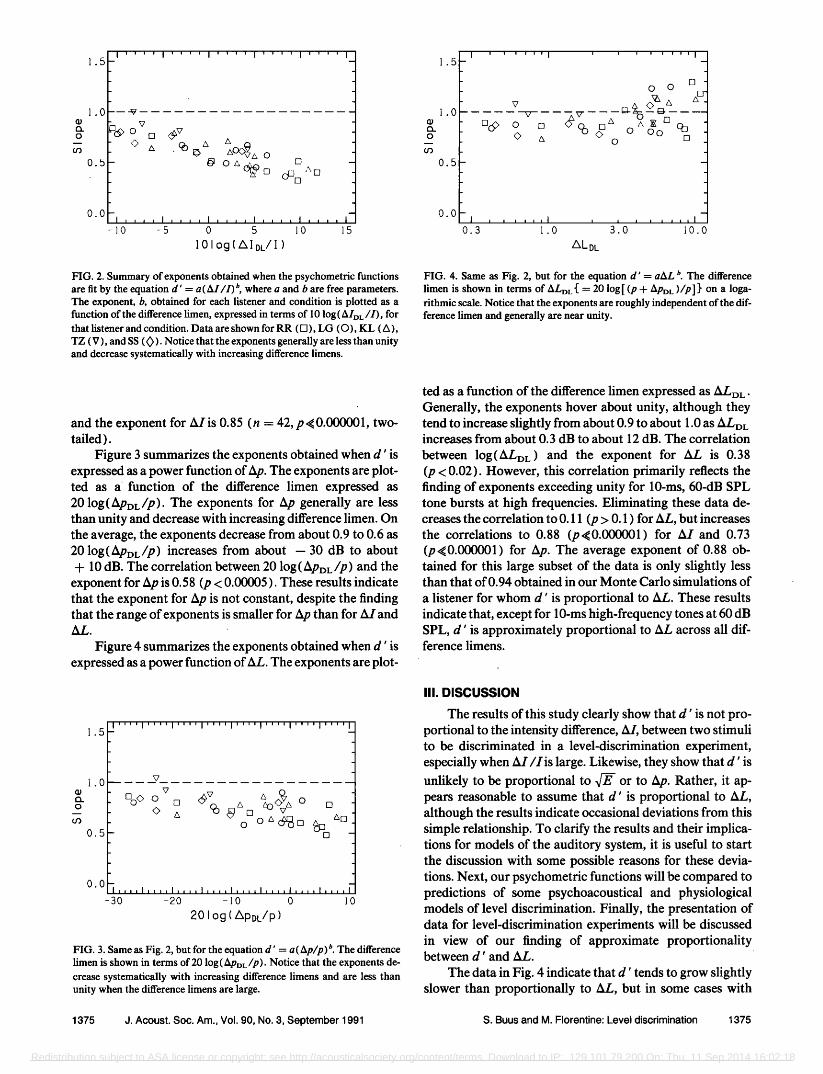
The exponents obtained for all listeners and conditions when d' is expressed as a power function of AI are summar-
ized in Fig. 2. The exponents are plotted as a function of the difference limen expressed as 10 log(ALoi•/I). From this summary it is clear that d' is not proportional to AI nor to x/E: the exponent decreases systematically from about 0.8 to about 0.3 as 10 log(AIoi•/I) increases from about -- 10 dB to about q- 12 dB. The correlation between 10 log (AIoi•/I)
1374 J. Acoust. Soc. Am., Vol. 90, No. 3, September 1991 S. Buus and M. Florentine: Level discrimination 1374
Redistribution subject to ASA license or copyright; see http://acousticalsociety.org/content/terms. Download to IP: 129.101.79.200 On: Thu, 11 Sep 2014 16:02:18
1.5
1.0
0.5
0.0
-10 -5 0 5 lo 15
1010g(AIDL/I)
FIG. 2. Summary of exponents obtained when the psychometric functions are fit by the equation d' - a(AI/I) •', where a and b are free parameters. The exponent, b, obtained for each listener and condition is plotted as a function of the difference limen, expressed in terms of 10 log(AIDE/I), for that listener and condition. Data are shown for RR ( [] ), LG (¸), KL ( A ), TZ (X7), and SS (•). Notice that the exponents generally are less than unity and decrease systematically with increasing difference limens.
1.5
1.0
0.5
0.0
I ! i ! ! ! i I
[-3(• 0 [] ¸ /x
0.3 1.0 3.0
/hLDL
i ! i i I I
o o
o Oo
.
lO.O
FIG. 4. Same as Fig. 2, but for the equation d'= aAL •'. The difference limen is shown in terms of ALD,• ( -- 20 log[ (p + ApD L )/p]) on a loga- rithmic scale. Notice that the exponents are roughly independent of the dif- ference limen and generally are near unity.
and the exponent for A/is 0.85 (n = 42, p,•0.000001, two- tailed).
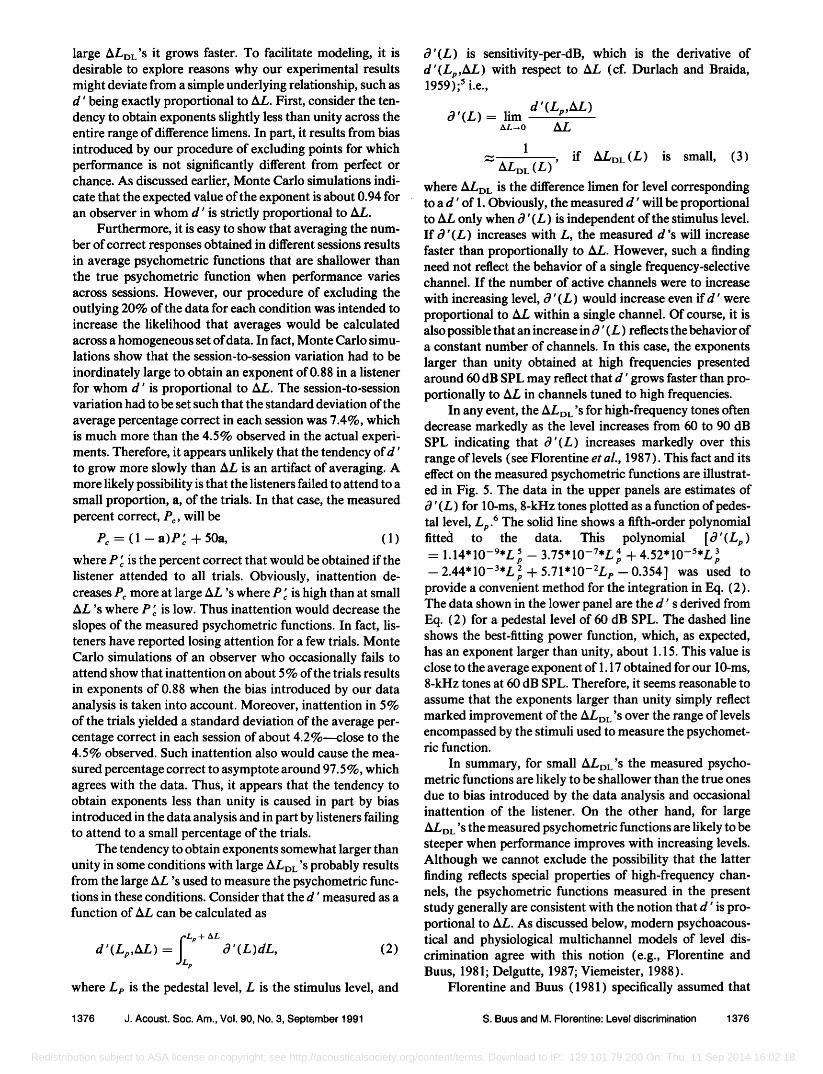
Figure 3 summarizes the exponents obtained when d' is expressed as a power function of Ap. The exponents are plot- ted as a function of the difference limen expressed as 20 log( ApD L/p). The exponents for Ap generally are less than unity and decrease with increasing difference limen. On the average, the exponents decrease from about 0.9 to 0.6 as 20 1og(ApDL/p) increases from about --30 dB to about + 10 dB. The correlation between 20 log (ApD L/p) and the
exponent for Ap is 0.58 (p < 0.00005). These results indicate that the exponent for Ap is not constant, despite the finding that the range of exponents is smaller for Ap than for AI and AL.
Figure 4 summarizes the exponents obtained when d' is expressed as a power function of AL. The exponents are plot-
1.5
1.0
0.5
0.0
-30 -20 -10 0 10
20109(APDL/p)
FIG. 3. Same as Fig. 2, but for the equation d' = a(Ap/p) b. The difference limen is shown in terms of 20 log( ApD L/p). Notice that the exponents de- crease systematically with increasing difference limens and are less than unity when the difference limens are large.
ted as a function of the difference limen expressed as ALDL. Generally, the exponents hover about unity, although they tend to increase slightly from about 0.9 to about 1.0 as ALDL increases from about 0.3 dB to about 12 dB. The correlation
between 1og(ALDL) and the exponent for AL is 0.38 (p < 0.02). However, this correlation primarily reflects the finding of exponents exceeding unity for 10-ms, 60-dB SPL tone bursts at high frequencies. Eliminating these data de- creases the correlation to 0.11 (p > 0.1 ) for AL, but increases the correlations to 0.88 (p,•0.000001) for AI and 0.73 (p,•0.000001) for Ap. The average exponent of 0.88 ob- tained for this large subset of the data is only slightly less than that of 0.94 obtained in our Monte Carlo simulations of
a listener for whom d' is proportional to AL. These results indicate that, except for 10-ms high-frequency tones at 60 dB SPL, d' is approximately proportional to AL across all dif- ference limens.
III. DISCUSSION
The results of this study clearly show that d' is not pro- portional to the intensity difference, A/, between two stimuli to be discriminated in a level-discrimination experiment, especially when AI/Iis large. Likewise, they show that d' is unlikely to be proportional to x/E or to Ap. Rather, it ap- pears reasonable to assume that d' is proportional to AL, although the results indicate occasional deviations from this simple relationship. To clarify the results and their implica- tions for models of the auditory system, it is useful to start the discussion with some possible reasons for these devia- tions. Next, our psychometric functions will be compared to predictions of some psychoacoustical and physiological models of level discrimination. Finally, the presentation of data for level-discrimination experiments will be discussed in view of our finding of approximate proportionality between d' and AL.
The data in Fig. 4 indicate that d' tends to grow slightly slower than proportionally to AL, but in some cases with
1375 J. Acoust. Soc. Am., Vol. 90, No. 3, September 1991 S. Buus and M. Florentine: Level discrimination 1375
Redistribution subject to ASA license or copyright; see http://acousticalsociety.org/content/terms. Download to IP: 129.101.79.200 On: Thu, 11 Sep 2014 16:02:18
large ALoL'S it grows faster. To facilitate modeling, it is desirable to explore reasons why our experimental results might deviate from a simple underlying relationship, such as d' being exactly proportional to AL. First, consider the ten- dency to obtain exponents slightly less than unity across the entire range of difference limens. In part, it results from bias introduced by our procedure of excluding points for which performance is not significantly different from perfect or chance. As discussed earlier, Monte Carlo simulations indi- cate that the expected value of the exponent is about 0.94 for an observer in whom d' is strictly proportional to AL.
Furthermore, it is easy to show that averaging the num- ber of correct responses obtained in different sessions results in average psychometric functions that are shallower than the true psychometric function when performance varies across sessions. However, our procedure of excluding the outlying 20% of the data for each condition was intended to increase the likelihood that averages would be calculated across a homogeneous set of data. In fact, Monte Carlo simu- lations show that the session-to-session variation had to be
inordinately large to obtain an exponent of 0.88 in a listener for whom d' is proportional to AL. The session-to-session variation had to be set such that the standard deviation of the
average percentage correct in each session was 7.4%, which is much more than the 4.5% observed in the actual experi- ments. Therefore, it appears unlikely that the tendency of d' to grow more slowly than AL is an artifact of averaging. A more likely possibility is that the listeners failed to attend to a small proportion, a, of the trials. In that case, the measured percent correct, Pc, will be
Pc = (1 --a)P• + 50a, (1)
where P • is the percent correct that would be obtained if the listener attended to all trials. Obviously, inattention de- creases Pc more at large AL's where P • is high than at small AL's where P • is low. Thus inattention would decrease the slopes of the measured psychometric functions. In fact, lis- teners have reported losing attention for a few trials. Monte Carlo simulations of an observer who occasionally fails to attend show that inattention on about 5 % of the trials results
in exponents of 0.88 when the bias introduced by our data analysis is taken into account. Moreover, inattention in 5% of the trials yielded a standard deviation of the average per- centage correct in each session of about 4.2%---close to the 4.5% observed. Such inattention also would cause the mea-
sured percentage correct to asymptote around 97.5%, which agrees with the data. Thus, it appears that the tendency to obtain exponents less than unity is caused in part by bias introduced in the data analysis and in part by listeners failing to attend to a small percentage of the trials.
The tendency to obtain exponents somewhat larger than unity in some conditions with large ALDL'S probably results from the large AL's used to measure the psychometric func- tions in these conditions. Consider that the d' measured as a
function of AL can be calculated as
L•, + AL d '(L•,,AL) = a9'(L)dL, (2) p
where Lp is the pedestal level, L is the stimulus level, and
a9'(L) is sensitivity-per-dB, which is the derivative of d' (L•,,AL) with respect to AL (cf. Dur!ach and Braida, 1959); 5 i.e.,
•9'(L) = lim AL--O AL
d' (L•, ,AL )
1 = , if ALDL (L) is small, (3)
ALDL (L)
where ALDL is the difference limen for level corresponding to a d' of 1. Obviously, the measured d' will be proportional to AL only when •' (L) is independent of the stimulus level. If •' (L) increases with L, the measured d's will increase faster than proportionally to AL. However, such a finding need not reflect the behavior of a single frequency-selective channel. If the number of active channels were to increase
with increasing level, •'(L) would increase even if d' were proportional to AL within a single channel. Of course, it is also possible that an increase in •' (L) reflects the behavior of a constant number of channels. In this case, the exponents larger than unity obtained at high frequencies presented around 60 dB SPL may reflect that d' grows faster than pro- portionally to AL in channels tuned to high frequencies.
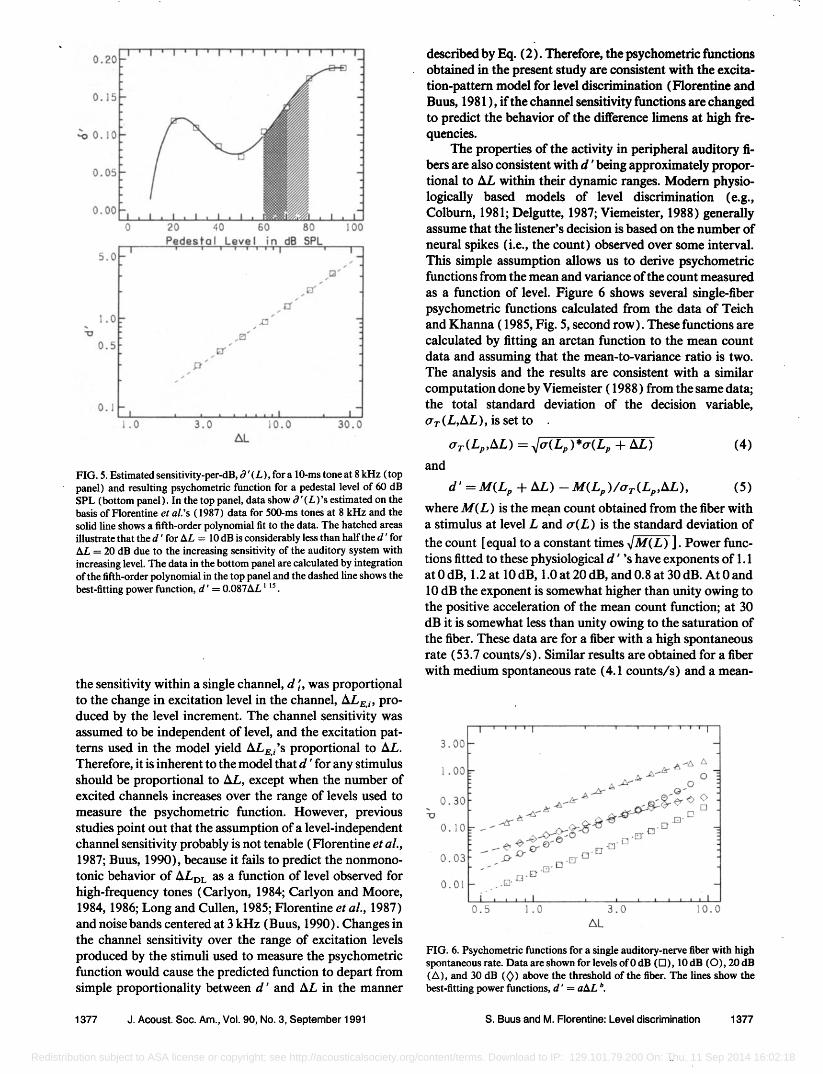
In any event, the ALDL'S for high-frequency tones often decrease markedly as the level increases from 60 to 90 dB SPL indicating that •'(L) increases markedly over this range of levels (see Florentine et al., 1987). This fact and its effect on the measured psychometric functions are illustrat- ed in Fig. 5. The data in the upper panels are estimates of •' (L) for 1 O-ms, 8-kHz tones plotted as a function of pedes- tal level, Lp. 6 The solid line shows a fifth-order polynomial fitted to the data. This polynomial [a9'(Lp)
4 + 4.52* 10-5*L 3 5 _ 3.75,10-7,L p p = 1.14' 10-9*L •, : + 5.71*10-:Lp -- 0.354] was used to _ 2.44,10-3,L •,
provide a convenient method for the integration in Eq. (2). The data shown in the lower panel are the d' s derived from Eq. (2) for a pedestal level of 60 dB SPL. The dashed line shows the best-fitting power function, which, as expected, has an exponent larger than unity, about 1.15. This value is close to the average exponent of 1.17 obtained for our 10-ms, 8-kHz tones at 60 dB SPL. Therefore, it seems reasonable to assume that the exponents larger than unity simply reflect marked improvement of the ALDL'S over the range of levels encompassed by the stimuli used to measure the psychomet- ric function.
In summary, for small ALDL'S the measured psycho- metric functions are likely to be shallower than the true ones due to bias introduced by the data analysis and occasional inattention of the listener. On the other hand, for large ALDL 'S the measured psychometric functions are likely to be steeper when performance improves with increasing levels. Although we cannot exclude the possibility that the latter finding reflects special properties of high-frequency chan- nels, the psychometric functions measured in the present study generally are consistent with the notion that d' is pro- portional to AL. As discussed below, modern psychoacous- tical and physiological multichannel models of level dis- crimination agree with this notion (e.g., Florentine and Buus, 1981; Delgutte, 1987; Viemeister, 1988).
Florentine and Buus (1981) specifically assumed that
1376 J. Acoust. Soc. Am., Vol. 90, No. 3, September 1991 S. Buus and M. Florentine: Level discrimination 1376
Redistribution subject to ASA license or copyright; see http://acousticalsociety.org/content/terms. Download to IP: 129.101.79.200 On: Thu, 11 Sep 2014 16:02:18
0.20II' I' I' I' I' I' I' I' I' I' I t 015 ß • ! o 05-
.
0'00 I . I . I . i . i . I , . I . I 0 20 40 80 80 lO0
Pedestal Level in dB $PL ' ' ' ' ' ' ''1 ' I
5.0
1.0
0.5
0.1
I
I , , , , , , .,I I I ß 0 3 0 ]0.0 30.0
AL
FIG. 5. Estimated sensitivity-per-dB, 8' (L), for a 10-ms tone at 8 kHz (top panel) and resulting psychometric function for a pedestal level of 60 dB SPL (bottom panel). In the top panel, data show 8' (L)'s estimated on the basis of Florentine et al.'s (1987) data for 500-ms tones at 8 kHz and the solid line shows a fifth-order polynomial fit to the data. The hatched areas illustrate that the d' for AL -- 10 dB is considerably less than half the d' for AL = 20 dB due to the increasing sensitivity of the auditory system with increasing level. The data in the bottom panel are calculated by integration of the fifth-order polynomial in the top panel and the dashed line shows the best-fitting power function, d' = 0.087AL
the sensitivity within a single channel, d •, was proportional to the change in excitation level in the channel, ALe, i, pro- duced by the level increment. The channel sensitivity was assumed to be independent of level, and the excitation pat- terns used in the model yield ALe. i's proportional to AL. Therefore, it is inherent to the model that d' for any stimulus should be proportional to AL, except when the number of excited channels increases over the range of levels used to measure the psychometric function. However, previous studies point out that the assumption of a level-independent channel sensitivity probably is not tenable (Florentine et al., 1987; Buus, 1990), because it fails to predict the nonmono- tonic behavior of ALDL as a function of level observed for high-frequency tones (Carlyon, 1984; Carlyon and Moore, 1984, 1986; Long and Cullen, 1985; Florentine et al., 1987) and noise bands centered at 3 kHz (Buus, 1990). Changes in the channel sensitivity over the range of excitation levels produced by the stimuli used to measure the psychometric function would cause the predicted function to depart from simple proportionality between d' and AL in the manner
described by Eq. (2). Therefore, the psychometric functions obtained in the present study are consistent with the excita-
ß
tion-pattern model for level discrimination (Florentine and Buus, 1981 ), if the channel sensitivity functions are changed to predict the behavior of the difference limens at high fre- quencies.
The properties of the activity in peripheral auditory fi- bers are also consistent with d' being approximately propor- tional to AL within their dynamic ranges. Modern physio- logically based models of level discrimination (e.g., Colburn, 1981; Delgutte, 1987; Viemeister, 1988) generally assume that the listener's decision is based on the number of
neural spikes (i.e., the count) observed over some interval. This simple assumption allows us to derive psychometric functions from the mean and variance of the count measured
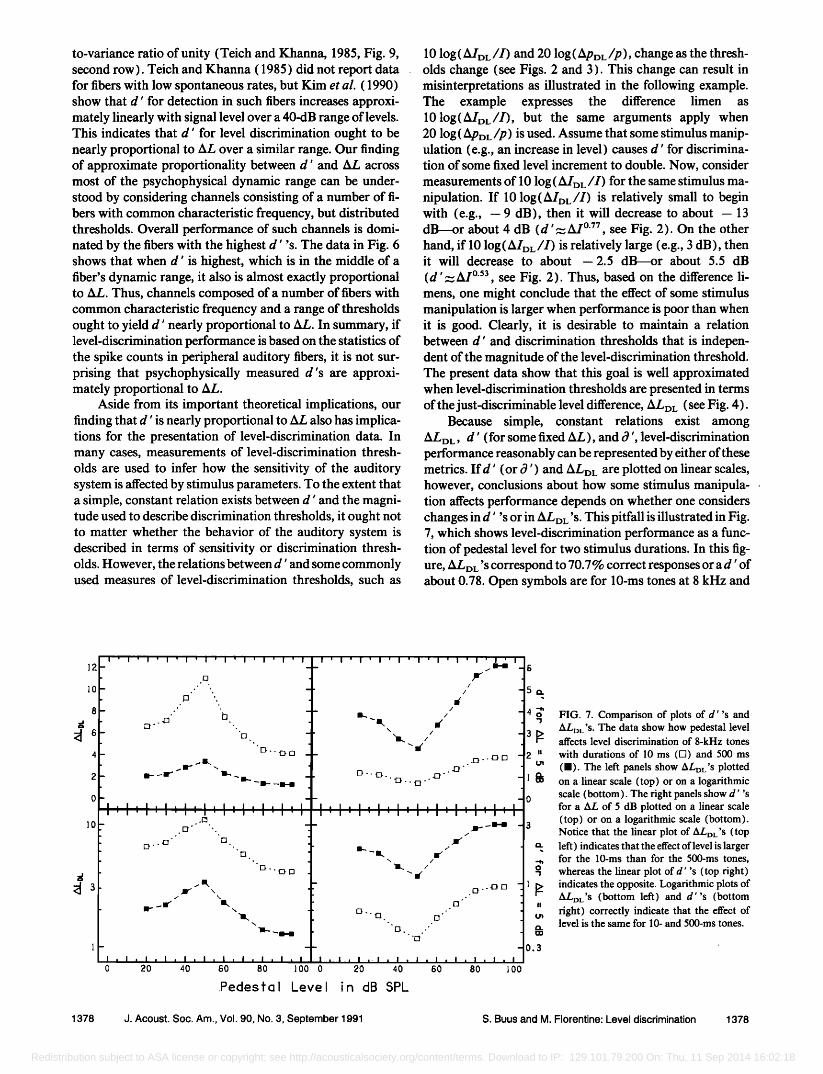
as a function of level. Figure 6 shows several single-fiber psychometric functions calculated from the data of Teich and Khanna ( 1985, Fig. 5, second row). These functions are calculated by fitting an arctan function to the mean count data and assuming that the mean-to-variance ratio is two. The analysis and the results are consistent with a similar computation done by Viemeister (1988) from the same data; the total standard deviation of the decision variable, •T (L,AL), is set to .
O'T(Lp,AL ) = x/•(L•)*•(L• + AL) (4)
and
d' = M(Lp + AL) -- M(Lp )/o'r(Lp,AL), (5) where M(L) is the mean count obtained from the fiber with a stimulus at level L and tr(L) is the standard deviation of
the count [ equal to a constant times x/M(L) ]. Power func- tions fitted to these physiological d' 's have exponents of 1.1 at 0 dB, 1.2 at 10 dB, 1.0 at 20 dB, and 0.8 at 30 dB. At 0 and 10 dB the exponent is somewhat higher than unity owing to the positive acceleration of the mean count function; at 30 dB it is somewhat less than unity owing to the saturation of the fiber. These data are for a fiber with a high spontaneous rate (53.7 counts/s). Similar results are obtained for a fiber with medium spontaneous rate (4.1 counts/s) and a mean-
3.00
1.00
0.30
O.lO
0.03
0.01
- .
i ,, • , I , , , , , , , , I 0.5 -1.0 3.O 10.0
AL
FIG. 6. Psychometric functions for a single auditory-nerve fiber with high spontaneous rate. Data are shown for levels of 0 dB ([3), 10 dB (¸), 20 dB (A), and 30 dB (•) above the threshold of the fiber. The hnes show the best-fitting power functions, d' = aAL b.
1377 J. Acoust. Soc. Am., Vol. 90, No. 3, September 1991 S. Buus and M. Florentine: Level discrimination 1377
Redistribution subject to ASA license or copyright; see http://acousticalsociety.org/content/terms. Download to IP: 129.101.79.200 On: Thu, 11 Sep 2014 16:02:18
to-variance ratio of unity (Teich and Khanna, 1985, Fig. 9, second row). Teich and Khanna ( 1985 ) did not report data for fibers with low spontaneous rates, but Kim et al. (1990) show that d' for detection in such fibers increases approxi- mately linearly with signal level over a 40-dB range of levels. This indicates that d' for level discrimination ought to be nearly proportional to AL over a similar range. Our finding of approximate proportionality between d' and AL across most of the psychophysical dynamic range can be under- stood by considering channels consisting of a number of fi- bers with common characteristic frequency, but distributed thresholds. Overall performance of such channels is domi- nated by the fibers with the highest d' 's. The data in Fig. 6 shows that when d' is highest, which is in the middle of a fiber's dynamic range, it also is almost exactly proportional to AL. Thus, channels composed of a number of fibers with common characteristic frequency and a range of thresholds ought to yield d' nearly proportional to AL. In summary, if level-discrimination performance is based on the statistics of the spike counts in peripheral auditory fibers, it is not sur- prising that psychophysically measured d's are approxi- mately proportional to AL.
Aside from its important theoretical implications, our finding that d' is nearly proportional to AL also has implica- tions for the presentation of level-discrimination data. In many cases, measurements of level-discrimination thresh- olds are used to infer how the sensitivity of the auditory system is affected by stimulus parameters. To the extent that a simple, constant relation exists between d' and the magni- tude used to describe discrimination thresholds, it ought not to matter whether the behavior of the auditory system is described in terms of sensitivity or discrimination thresh- olds. However, the relations between d' and some commonly used measures of level-discrimination thresholds, such as
10 log (AIDE/I) and 20 log (ApD L/p), change as the thresh- olds change (see Figs. 2 and 3). This change can result in misinterpretations as illustrated in the following example. The example expresses the difference limen as 101og(•/DL/I), but the same arguments apply when 20 log ( ApD L/p) is used. Assume that some stimulus manip- ulation (e.g., an increase in level) causes d' for discrimina- tion of some fixed level increment to double. Now, consider measurements of 10 log ( AIDE/I) for the same stimulus ma- nipulation. If 10 log(AIDE/I) is relatively small to begin with (e.g., --9 dB), then it will decrease to about -- 13 dB-•or about 4 dB (d ',.• AI ø'77 , see Fig. 2). On the other hand, if 10 log ( AIDE/I) is relatively large (e.g., 3 dB), then it will decrease to about --2.5 dB---or about 5.5 dB
(d 'mAI ø'53 , see Fig. 2). Thus, based on the difference li- mens, one might conclude that the effect of some stimulus manipulation is larger when performance is poor than when it is good. Clearly, it is desirable to maintain a relation between d' and discrimination thresholds that is indepen- dent of the magnitude of the level-discrimination threshold. The present data show that this goal is well approximated when level-discrimination thresholds are presented in terms of the just-discriminable level difference, ALDL (see Fig. 4).
Because simple, constant relations exist among ALDL , d' (for some fixed AL), and eS ', level-discrimination performance reasonably can be represented by either of these metrics. If d' (or eS') and ALDL are plotted on linear scales, however, conclusions about how some stimulus manipula- ß tion affects performance depends on whether one considers changes in d' 's or in ALDL 'S. This pitfall is illustrated in Fig. 7, which shows level-discrimination performance as a func- tion of pedestal level for two stimulus durations. In this fig- ure, ALDL'S correspond to 70.7 % correct responses or a d' of about 0.78. Open symbols are for 1 O-ms tones at 8 kHz and
10
8
I'1'1'1'1'1'1'1'1'1'1
1,1,1,1,1,1,1,1,1.1,1 I'1'1'1'1'1'1'1'1'1'1
I , I . I . I , I , I , I . I , i . I . I
0 20 40 60 80
I•l,l,l•l•i,l•l,l•l•l ['['['['['l'['l'l'l'[
U
I , I , I , I , I , I , I , I , I , I , I
100 0 20 40 60 80 100
Pedesfol Level in d8 SPL
FIG. 7. Comparison of plots of d' 's and ALDL 'S. The data show how pedestal level affects level discrimination of 8-kHz tones
with durations of 10 ms (D) and 500 ms
(I). The left panels show ALDL'S plotted on a linear scale (top) or on a logarithmic scale (bottom). The fight panels show d' 's for a AL of 5 dB plotted on a linear scale (top) or on a logarithmic scale (bottom). Notice that the linear plot of ALDi.'S (top left) indicates that the effect of level is larger for the 10-ms than for the 500-ms tones,
whereas the linear plot of d' 's (top right) indicates the opposite. Logarithmic plots of ALDL'S (bottom left) and d' 's (bottom right) correctly indicate that the effect of level is the same for 10- and 500-ms tones.
1378 J. Acoust. Soc. Am., Vol. 90, No. 3, September 1991 S. Buus and M. Florentine: Level discrimination 1378
Redistribution subject to ASA license or copyright; see http://acousticalsociety.org/content/terms. Download to IP: 129.101.79.200 On: Thu, 11 Sep 2014 16:02:18
are based on the data in Fig. 5; closed symbols are Florentine etal.'s (1987) data for 500-ms tones at 8 kHz. At the top left, •LD• ' is plotted on a linear scale. From this plot one is likely to conclude that the effect of level is much larger for the 10- ms than for the 500-ms stimuli. However, the likely conclu- sion is the opposite when considering the plot ofd' for a fixed AL of 5 dB in the upper right panel. The plot ofd' on a linear scale shows that the effect of level is much smaller for the 10- ms than for the 500-ms stimuli. This paradox is easily re- solved if d' and ALD•. are plotted on logarithmic scales, as shown in the bottom panels. These plots ofd' and AL•. both show that the effect of level is the same for 1 O-ms and 500-ms stimuli. Given that the two variables represent the same measurements, reasonable conclusions about the effect of
level (or any other stimulus manipulation) should not de- pend on which one is used. Because equal ratios of AL•.'s correspond to equal (inverse) ratios in d ', changes in perfor- mance clearly should be considered in terms of ratios ofd' 's or AL•.'s; differences are not meaningful. Logarithmic plots present equal ratios as equal visual distances and pro- vide useful representations of level-discrimination perfor- mance. The use of logarithmic plots of AL•. is also support- ed by the fact that variability tends to be independent of overall performance when ALD•. 's are plotted on a logarith- mic scale (see Florentine, 1983, 1986; Florentine et al., 1987; Buus, 1990). In conclusion, it seems clear that level-dis- crimination thresholds are appropriately represented as AL•. plotted on a logarithmic scale. The present data show that presenting the data in this manner provides a straight- forward relation between measurements of discrimination thresholds and the sensitivity of the auditory system.
IV. SUMMARY
The present study examined the form of the psychomet- ric function for level discrimination. The major findings are as follows.
( 1 ) Results for a variety of stimuli with a wide range of difference limens show that d' is not proportional to AI. Likewise, d' is unlikely to be proportional to x/-ff or to Ap. Rather, it appears reasonable to assume that d' generally is proportional to AL.
(2) The data show some departures from simple pro- portionality between d' and AL that are unlikely to reflect the underlying behavior of single auditory channels. First, the estimated exponents for d' as a power function of AL tend to be less than unity due to bias introduced by the data analysis and occasional inattention of the listener. Second, when AL•. is large and decreases with increasing level, the exponents tend to exceed unity.
(3) The conclusion that d' generally is proportional to AL is consistent with the excitation-pattern model of level discrimination (Florentine and Buus, 1981 ) and with the properties of single auditory-nerve fibers (Teich and Khanna, 1985; see also Viemeister, 1988).
(4) The finding that d' is nearly proportional to AL indicates that level-discrimination performance is reasona- bly represented by AL•. on a logarithmic scale. Logarith- mic plots of AL•.'s show equal ratios of sensitivity as equal
visual distances, and lead to conclusions consistent with those obtained from logarithmic plots of d' for a fixed AL.
ACKNOWLEDGMENTS
The authors would like to thank Christine R. Mason for
expertly running many of the experiments, for help with the data analysis, and for many valuable suggestions. Thanks also are due to Tilmann Zwicker for help with data collec- tion and analysis for listeners SS and TZ. Comments by the Associate Editor, Neal F. Viemeister, and the reviewers, H. Steven Colburn, David M. Green, and Walt Jesteadt led to many improvements of the paper. This work was supported by NIDCD Grant R01 DC00187, and the Department of Health and Human Services Grant RR07143.
•The relation between the percentage correct in a 21,2AFC experiment and d' (assuming unbiased responses) is roughly logarithmic over a consider- able part of the range ofpsychophysical interest. Around d' = 1, the slope is about 50% per log unit of d' If d' is proportional to 10 log(AI/I), the percentage correct ought to increase about 5% for each 1-dB increase in 10 log (AI/I). If d' is proportional to AI ø'5 , the rate of increase is halved and the percentage correct ought to increase about 2.5% for each 1-dB increase in 10 log (AI/I).
2The average of the standard deviations calculated in this manner is about 4.5% and the critical value of t corresponding to a two-tailed probability of 0.1 and 24 deg of freedom is about 1.32. It follows that--on the average-- blocks in which the average percentage correct deviated more than 6% from the mean across the 25 blocks were eliminated. The observed stan- dard deviation exceeds the approximately 4% expected on the basis of bi- nomial distributions of the percent correct obtained for each of the ten increment levels. This excess variability is unlikely to reflect nonhomogen- eous distributions resulting from session-to-session variability. As dis-
consistent with a failure of attention on a small percentage of the trials. 3•L is alrealy a logarithmic quantity. Plotting •L on a logarithmic scale may be considered as taking the logarithm of the logarithm, but it provides a convenient way to obtain the parameters of the best-fitting power func- tion for d' as a function of •L.
•Our pr•edure of excluding the extreme points from further analysis intro- duces a slight negative bias in the slope estimates because it tends to exclude points for which the obse•ed performance is better than expected at high signal levels and worse than expect• at low signal levels. Monte Carlo simulations of an obse•er for whom d' was exactly propo•ional to •L yielded estimated slopes averaging 0.94 rather than that of unity expected if no bias was introduced by the data analysis.
5Durlach and Braida (1969) used sensitivity-per-Bel, which is equal to ten times 8' (L) as defined in the present paper. •is difference results •cause they used Bel as the unit for level rather than the more common unit of dB used here.
6Our estimates of 8' (L) are based on •orentine et al.'s (1987) difference limens for 5•-ms, 8-kHz tones measured with a criterion of 70.7% cor- rect. •is criterion co•esponds to a d' of approximately 0.78. Because the difference limens are relatively small (between 1 and 3.5 dB), 8' (L) for the 5•-ms tones can be estimated as 0.78/•L•= 7o.7%. To obtain the •ti- mates for 10-ms tones shown in the figure, the 8'(L)'s for 5•-ms ton• were divided by 3.23. (The fictor 3.23 [ = ( 10 ms/5• ms) -0.3 ] follows from the finding that •LD• is propo•ional to T- 0.3, where Tis the signal duration (Florentine, 1986).)
ANSI (1969). ANSI S3.6-1969 "Specifications for audiometers" (Ameri- can National Standards Institute, New York).
Buus, S. (1990). "Level discrimination of frozen and random noise," J. Acoust. Soc. Am. 87, 2643-2654.
Campbell, R. A., and Lasky, E. Z. (1967). "Masker level and sinusoidal- signal detection," J. Acoust. Soc. Am. 42, 972-976.
Carlyon, R. P. (1984). "Intensity discrimination in hearing," Ph.D. disser- tation, King's College, University of Cambridge, England.
1379 J. Acoust. Soc. Am., Vol. 90, No. 3, September 1991 S. Buus and M. Florentine: Level discrimination 1379
Redistribution subject to ASA license or copyright; see http://acousticalsociety.org/content/terms. Download to IP: 129.101.79.200 On: Thu, 11 Sep 2014 16:02:18
Carlyon, R, P., and Moore, B.C. J. (1984). "Intensity discrimination. A severe departure from Weber's law," J. Acoust. Soc. Am. 76, 1369-1376.
Carlyon, R. P., and Moore, B.C. J. (1986). "Continuous versus gated ped- estals and the 'severe departure' from Weber's law," J. Acoust. Soc. Am. 79, 453-460.
Colburn, H. S. (1981). "Intensity perception: Relations of intensity dis- crimination to auditory-nerve firing patterns," internal memorandum, Res. Lab. Electron., MIT, Cambridge, MA.
Delgutte, B. (1987). "Peripheral auditory processing of speech informa- tion: Implications from a physiological study of intensity discrimina- tion," in The Psychophysics of Speech Perception, edited by M. E. H. Schouten (Nijhoff, Dordrecht, The Netherlands), pp. 333-353.
Durlach, N. I., and Braida, L. D. (1969). "Intensity perception I. Prelimi- nary theory of intensity resolution," J. Acoust. Soc. Am. 46, 372-383.
Florentine, M. (1983). "Intensity discrimination as a function of level and frequency and its relation to high-frequency hearing," J. Acoust. Soc. Am. 74, 1375-1379.
Florentine, M. (1986). "Level discrimination as a function of duration," J. Acoust. Soc. Am. 79, 792-798.
Florentine, M., and Buus, S. (1981). "An excitation-pattern model for in- tensity discrimination," J Acoust. Soc. Am. 70, 1646-1654.
Florentine, M., Buus, S., and Mason, C. R. (1987). "Level discrimination of tones as a function of level and frequency from 0.25 to 16 kHz," J. Acoust. Soc. Am. 81, 1528-1541.
Green, D. M. (1960). "Psychoacoustics and detection theory," J. Acoust. Soc. Am. 32, 1189-1203.
Green, D. M. (1988). Profile Analysis: Auditory Intensity Discrimination (Oxford, New York).
Green, D. M., Nachmias, J., Kearney, J. K., and Jeffress, L. A. (1979). "Intensity discrimination with gated and continuous sinusoids," J. Acoust. Soc. Am. 66, 1051-1056.
Green, D. M., and Swets, J. A. (1966). Signal Detection Theory and Psycho- physics (Wiley, New York) (reprinted by Krieger, Huntington, NY, 1974).
Hanna, T., von Gierke, S. M., and Green, D. M. (1986). "Detection and intensity discrimination of a sinusoid," J. Acoust. Soc. Am. 80, 1335- 1340.
Kim, D. O., Chang, S. O., and Sirianni, J. G. (1990). "A population study of auditory-nerve fibers in unanesthetized decerebrate cats: Response to pure tones," J. Acoust. Soc. Am. 87, 1648-1655.
Levitt, H. (1971). "Transformed up-down procedures in psychoacous- tics," J. Acoust. Soc. Am. 49, 467-477.
Long, G. R., and Cullen, J. K. (1985). "Intensity difference limens at high frequencies," J. Acoust. Soc. Am. 78, 507-513.
McGill, W. J., and Goldberg, J.P. (1968). "Pure-tone intensity discrimina- tion and energy detection," J. Acoust. Soc. Am. 44, 576-581.
Penner, M. J., Leshowitz, B., Cudahy, E., and Ricard, G. (1974). "Intensi- ty discrimination for pulsed sinusoids of various frequencies," Percept. Psychophys. 15, 568-570.
Pynn, C. T., Braida, L. D., and Durlach, N. I. (1971). "Intensity percep- tion. III. Resolution in small-range identification," J. Acoust. Soc. Am. 51, 559-566.
Rabinowitz, W. M. (1970). "Frequency and intensity resolution in audi- tion," S. M. thesis, Department of Electrical Engineering and Computer Science, MIT, Cambridge, MA.
Rabinowitz, W. M., Lim, J. S., Braida, L. D., and Durlach, N. I. (1976). "Intensity perception. VI. Summary of recent data on deviations from Weber's law for 1000-Hz tone pulses," J. Acoust. Soc. Am. 59, 1506- 1509.
Raney, J. J., Richards, V. M., Onsan, Z. A., and Green, D. M. (1989). "Signal uncertainty and psychometric functions in profile analysis," J. Acoust. Soc. Am. 86, 954-960.
Ronken, D. A. (1969). "Intensity discrimination of Rayleigh noise," J. Acoust. Soc. Am. 45, 54-57.
Tanner, W. P. (1958). "A re-evaluation of Weber's law as applied to pure tones," University of Michigan: Electronic Defense Group, Tech. Rep. 47.
Teich, M. C., and Khanna, S. M. (1985). "Pulse-number distribution for the neural spike train in the cat's auditory nerve," J. Acoust. Soc. Am. 77, 1110-1128.
Viemeister, N. (1988). "Psychophysical aspects of auditory intensity cod- ing," in•tuditory Function, edited by G. M. Edelman, W. E. Gall, and W. M. Cowan (Wiley, New York).
1380 J. Acoust. Soc. Am., Vol. 90, No. 3, September 1991 S. Buus and M. Florentine: Level discrimination 1380
Redistribution subject to ASA license or copyright; see http://acousticalsociety.org/content/terms. Download to IP: 129.101.79.200 On: Thu, 11 Sep 2014 16:02:18