psychometric properties of the globesmart profile · psychometric properties of the globesmart...
TRANSCRIPT
Psychometric Properties of the GlobeSmart Profile
William J. Doherty, Ph.D.

Copyright© Aperian Global 2016 Technical Report: GlobeSmart Profile 2
Table of Contents
Executive Summary ............................................................................................................... 3
I. Purpose .............................................................................................................................. 4
II. Overview of the GlobeSmart Profile (GSP) ......................................................................... 4
Dimensions .................................................................................................................................4
Survey Items ...............................................................................................................................7
Country Placements ..................................................................................................................7
III. Profile Development Process ............................................................................................ 8
IV. Psychometric Procedures ................................................................................................. 8
V. Results .............................................................................................................................. 9
VI. Summary ....................................................................................................................... 26
References .......................................................................................................................... 27
About Aperian Global .......................................................................................................... 28

Copyright© Aperian Global 2016 Technical Report: GlobeSmart Profile 3
Executive Summary
The n e w GlobeSmart Profile (GSP) is a major upgrade to the instrument previously known as the
GlobeSmart Assessment Profile (GAP). The upgrade was the result of extensive psychometric
analyses that focused on strengthening its psychometric properties, and this report presents
the results of the analyses as well as an explanation of the processes used in updating the country
placements in the GSP.
Design and development of the GSP included analyses of Dimension Reliability and Factorial
Composition, as well as analyses of Construct and Content Validity. The results showed that the
dimensions had high internal consistency reliability with estimates ranging from .700 to .799. The
analyses of the Construct Validity and Content Validity also provided empirical support in each of
these areas.
Based on the analysis, it can be said with confidence that the GSP has sound psychometric properties
for use by individuals examining their preferred interaction styles and wanting to know how they
compare with others on the selected dimensions of culture.
Copyright© Aperian Global 2016 Technical Report: GlobeSmart Profile 4
I. Purpose The purpose of this report is to explain the technical properties of the GlobeSmart Profile (GSP). The
results of these analyses are presented and appropriate technical conclusions drawn. The report is
organized into five sections: Overview of the GSP, Development Process, Psychometric Procedures,
Results, and Summary.
II. Overview of the GlobeSmart Profile (GSP) The GSP is a cultural awareness tool. It helps individuals understand their own preferences and
tendencies for interacting with others, and allows for comparisons with other individuals as well as with
other cultures. It is meant to start discussions about the impact of culture on our preferred style of
engaging with others.
The GSP is based on a previous Aperian Global instrument know as the GAP (GlobeSmart
Assessment Profile) which was an adaptation of a highly reliable and valid research instrument
developed by a leading cross-cultural researcher, Dr. David Matsumoto of San Francisco State
University.
The GAP had five dimensions:
Independent- Interdependent
Egalitarianism-Status
Risk-Restraint
Direct-Indirect
Task-Relationship
Dimensions
These same five dimensions were maintained in the GSP (with the exception that the term Restraint
was changed to Certainty as the word Restraint had a somewhat negative connotation). However, the
definitions have been updated and made more mutually exclusive. Additionally, the items measuring
each dimension were entirely new with two exceptions.
Thus, the GSP is operationally and psychometrically a new instrument. It maintains the linkage with
the same research base as the GAP and the same conceptual framework (that is, the five dimensions)
but defines and measures these dimensions in a slightly different manner.
The definitions for each of the five dimensions are presented below. Each dimension is defined in
terms of an overall "theme" that presents the key conceptual question that the dimension answers.
Then, each end of the dimension is defined in terms of specific characteristics and behaviors.
Examples are provided for each end of the dimensions. Similarities to dimensions in the research
base are provided in the notes below the dimension definition.

Copyright© Aperian Global 2016 Technical Report: GlobeSmart Profile 5
Independent Theme/Definition Interdependent
People at this end of this
dimension tend to:
Place great importance
on individual identity
Derive identity from
personal choices and
achievements
Prefer taking action on
one's own
How do I derive my
identity?
People at this end of this
dimension tend to:
Place great importance
on group harmony and
cooperation
Derive identity from
group affiliation
Feel a sense of duty,
obligation, and loyalty to
ascribed groups
Notes:
This dimension had its roots in elements of Hofstede's dimensions of Individualism v. Collectivism and
Masculinity v. Femininity.
Egalitarianism Theme/Definition Status
People at this end of this
dimension tend to:
Be comfortable
challenging the views of
superiors
Be flexible about roles
Treat everyone much
the same
Assume power and
authority should be
shared broadly among a
group
What is my preference for
how my group should be
structured and power
should be distributed?
People at this end of this
dimension tend to:
Prefer not to challenge
those above them
Be deferential to
superiors
Adapt behavior
depending on relative
status
Assume power and
authority should be
reserved for a few
members of a group
Notes:
This dimension is related to Hofstede's concept of Power Distance.
Risk Theme/Definition Certainty
People at this end of this
dimension tend to:
Prefer rapid decision-
making and quick
results
Place great importance
on flexibility and
initiative
Value speed over
thoroughness
How do I make decisions in
uncertain or ambiguous
situations?
People at this end of this
dimension tend to:
Spend significant time
on background research
Establish proper
procedures before
starting a project
Value thoroughness
over speed
Notes:
This dimension had its roots in Hofstede's notion of Uncertainty Avoidance.
Copyright© Aperian Global 2016 Technical Report: GlobeSmart Profile 6
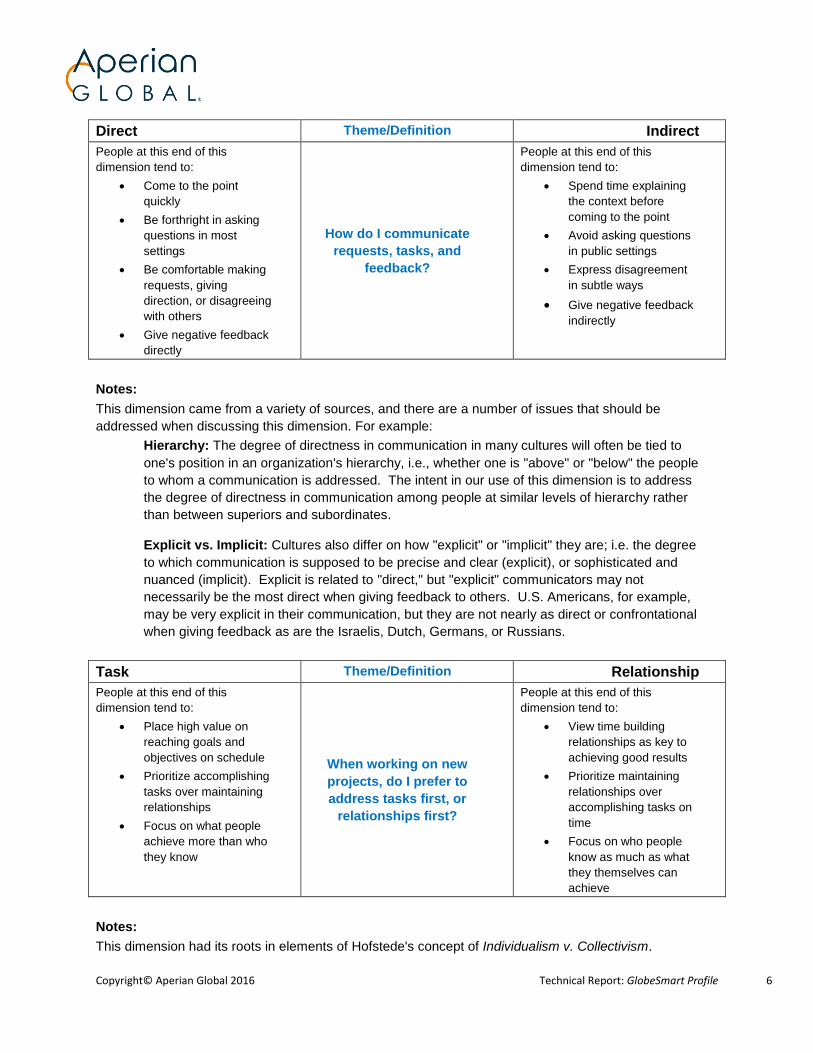
Direct Theme/Definition Indirect
People at this end of this
dimension tend to:
Come to the point
quickly
Be forthright in asking
questions in most
settings
Be comfortable making
requests, giving
direction, or disagreeing
with others
Give negative feedback
directly
How do I communicate
requests, tasks, and
feedback?
People at this end of this
dimension tend to:
Spend time explaining
the context before
coming to the point
Avoid asking questions
in public settings
Express disagreement
in subtle ways
Give negative feedback
indirectly
Notes:
This dimension came from a variety of sources, and there are a number of issues that should be
addressed when discussing this dimension. For example:
Hierarchy: The degree of directness in communication in many cultures will often be tied to
one's position in an organization's hierarchy, i.e., whether one is "above" or "below" the people
to whom a communication is addressed. The intent in our use of this dimension is to address
the degree of directness in communication among people at similar levels of hierarchy rather
than between superiors and subordinates.
Explicit vs. Implicit: Cultures also differ on how "explicit" or "implicit" they are; i.e. the degree
to which communication is supposed to be precise and clear (explicit), or sophisticated and
nuanced (implicit). Explicit is related to "direct," but "explicit" communicators may not
necessarily be the most direct when giving feedback to others. U.S. Americans, for example,
may be very explicit in their communication, but they are not nearly as direct or confrontational
when giving feedback as are the Israelis, Dutch, Germans, or Russians.
Task Theme/Definition Relationship
People at this end of this
dimension tend to:
Place high value on
reaching goals and
objectives on schedule
Prioritize accomplishing
tasks over maintaining
relationships
Focus on what people
achieve more than who
they know
When working on new
projects, do I prefer to
address tasks first, or
relationships first?
People at this end of this
dimension tend to:
View time building
relationships as key to
achieving good results
Prioritize maintaining
relationships over
accomplishing tasks on
time
Focus on who people
know as much as what
they themselves can
achieve
Notes:
This dimension had its roots in elements of Hofstede's concept of Individualism v. Collectivism.
Copyright© Aperian Global 2016 Technical Report: GlobeSmart Profile 7
Survey Items
The GSP consists of 40 items. There are six items per dimension with the exception of Egalitarianism-
Status (which has eight items) and Task-Relationship (which has nine items) dimensions. These 35
items are the items that are scored to produce the profiles provided to the users. In addition, five other
items are included as experimental items but not scored. When sufficient data are available for these
items they will be examined for possible inclusion in the next version of the GSP. A seven point Likert
agreement scale was used as the response scale for the items, ranging from Strongly Disagree to
Strongly Agree.
Country Placements
The country placements in the GSP were derived from a combination of three data sources, each of
which built on the previous one:
1. Merged data of leading cross-cultural researchers: As mentioned above, the GSP is based on the
previous Aperian Global instrument known as the GAP. In the GAP, the country placements on
the dimensions were derived from the merged data of leading cross-cultural researchers such as
Hofstede, Schwartz, McCrae, and Inglehart. They were empirically derived, statistical averages of
available country data on the five cultural dimensions as they existed in the research literature.
2. GlobeSmart Profile User Data: Since some of the original research used in deriving the country
placements on the GAP dimensions is now a few decades old, in the development of the GSP an
analysis was included of the data from over 700,000 users of the instrument (as of early 2014),
each of whom filled out demographic items before completing the GAP survey. This user data
was combined with the earlier research data and used to update a number of the country
placements.
3. Expert Judgment Data: Finally, expert opinions from a dozen Aperian Global trainers and
associates living and working in countries around the world was incorporated to make final
adjustments to the country placements. There were three rounds of expert input in this revision
process, with each round receiving higher levels of convergence on the placements of countries
on the dimensions by the group of experts.
In spite of the use of these three data sets in arriving at the updated country placements on the GSP,
it is important to note that these placements are not absolutes. When viewing country comparisons in
GSP, a bell curve appears on the Profile chart. This is a reminder that while the country placements
on each dimension are based on the data sets mentioned above, many people from a particular
culture will fall to the left or to the right of the country average "plot" that is marked on the chart.
It is also useful to keep in mind that cultures do evolve over time, and typical behaviors along the
selected dimensions of culture can change. Because of this, Aperian Global plans to continue to
update the country placements in the GSP every few years.
Copyright© Aperian Global 2016 Technical Report: GlobeSmart Profile 8
III. Profile Development Process
The process of developing the GSP started with an examination of the definitions of the previous
dimensions in the GAP. This examination showed that the definitions needed to be updated and made
more mutually exclusive. By doing this, the dimensions could be designed to be more independent
and provide less redundant information. Further, interpretation of performance along the dimensions
would be simpler and easier to understand.
Using the new definitions for the dimensions, specifically the dimension theme and the
characterization of each end point of the dimension, sets of possible items were developed. The item
development started with the previous item set. The existing items were compared with the new
definitions and generally found not to be good candidates for inclusion in the GSP, and therefore, new
items were developed. To some extent, research on similar dimensions was used to find potential
items or modified such items to fit the new definitions. In many cases, new items were generated
through a small group process of Content Experts (Subject Matter Experts) led by the author of this
report.
Clinical Pretests
A series of three clinical pretests was conducted on the potential item set. The clinical pretests used
internal Aperian Global personnel to provide the data. In the first two clinical trials, 10 people provided
data. In the third trial slightly fewer than 20 people provided data. The primary focus of these trials was
on item wording, development of instructions for the instrument and comparison of the results for the
new GSP versus the previous GAP. Basic psychometric analyses were performed but because of the
small sample size the results were viewed cautiously and taken as indicative and not definitive.
Formal Pretests
When the item pool appeared to be stable in terms of wording and understanding by users, two
Formal Pretests were conducted. The first Formal Pretest included approximately 100 respondents
from around the globe and represented a much more diverse group of respondents than those who
had participated in the clinical pretests. Diversity in ethnicity, geographic location, occupation and
organizational position was much more pronounced in the first Formal Pretest. Results for the
psychometric analyses of this pretest resulted in some revisions to the item pool as some of the items
did not function as they had in the clinical pretests. Following revision and finalization of the items, a
second Formal Pretest was conducted. This second Pretest went out to 200 possible respondents
around the globe. Over 190 people responded but not all with complete data. Data on 187 of these
form the basis for the results reported here.
IV. Psychometric Procedures
Four specific issues were addressed in establishing the psychometric properties of the GSP: Reliability
of the Dimensions, Dimension Factorial Composition, Construct Validity, and Content Validity. The
reliability of the dimension was investigated using Cronbach's alpha reliability (Cronbach, 1951)

Copyright© Aperian Global 2016 Technical Report: GlobeSmart Profile 9
estimate. This estimate has a range of 0 to 1, with .7 being normally considered the minimal
acceptable level of reliability for psychological assessments (Nunnally, 1978). The alpha reliability
estimate is a measure of the internal consistency of a set of items. That is, it indicates the degree to
which all the items consistently measure individuals. Internal Consistency reliability is the most
common form of reliability reported for psychological assessments.
Investigations of the Dimension Composition, Construct Validity, and Content Validity were each
addressed using Exploratory Factor Analysis. Specifically, Principal Axis Factor Analysis was used
with a criterion for retaining factors with an Eigenvalue greater than 1.0. A Varimax Rotation was
used if appropriate (in cases where more than one factor was identified).
All respondents that had completed the GSP in early 2014 provided the data set. A total of 187
respondents were included in the data set. Only respondents with complete data were used in each
analysis. All analyses were performed using the Statistical Package for the Social Sciences (SPSS)
Version 22.
V. Results
The results are presented separately for Dimension Reliability, Dimension Composition, Construct
Validity, and Criterion Validity and Dimension Scaling and Descriptives.
Dimension Reliability
The investigation of Dimension Reliability provides information on the degree to which items identified
to measure a specific dimension are internally consistent. That is, the reliability estimate shows the
degree to which performance on each item of the scale produces the same rank order of individuals. It
should be noted that internal consistency reliability does not necessarily require unidimensionality for
the scale, though this condition often exists in scales with high internal consistency. The importance of
reliability for a dimension is that it provides information on how accurately performance is measured.
In order to perform the reliability analyses, it was necessary to have all the items scored in such a way
that they would be consistent. That is, since three of the items were intended to measure one end of
the dimension and the other three items were intended to measure the opposite and potentially
contradictory end of the dimension, an individual should agree with three of the items and disagree
with the other three items if they were being consistent. Thus, it was necessary to "recode" three of the
items so that they would measure in the same direction as the other set of three items for the
dimension. For convenience sake, it was decided that the items measuring the left hand side of the
dimensions (Independence, Egalitarianism, Risk, Direct, and Task) would be the "high" end of the
scoring scale. So the items for the opposite end of each dimension were recoded to make them
consistent with the "high" end of the dimension. Thus, people who had higher dimension scores would
be more likely to be Independent, Egalitarian, Risk-oriented, Direct, and Task-focused.

Copyright© Aperian Global 2016 Technical Report: GlobeSmart Profile 10
A. Independent-Interdependent
The results for the six items measuring Independent-Interdependent are shown below.
The reliability estimate for this scale of 0.712 exceeds the minimum acceptable level of 0.70, so the
scale can be considered as producing reliable and consistent measurements.

Copyright© Aperian Global 2016 Technical Report: GlobeSmart Profile 11
B. Egalitarian-Status
The results for the reliability investigation of the Egalitarianism-Status dimension items are shown
below. In the formal pretests, seven items defined this dimension.
Again, the reliability estimate for this scale meets the minimum acceptable threshold, and the scale
can be considered as producing reliable and consistent measurements.

Copyright© Aperian Global 2016 Technical Report: GlobeSmart Profile 12

Copyright© Aperian Global 2016 Technical Report: GlobeSmart Profile 13
C. Risk-Certainty
The results for the six items measuring Risk-Certainty are shown below.
The reliability estimate for this dimension of 0.770 exceeds the minimum acceptable level of 0.70, so the
scale can be considered as producing reliable and consistent measurements.

Copyright© Aperian Global 2016 Technical Report: GlobeSmart Profile 14
D. Direct-Indirect
The results for the reliability investigation of the Direct-Indirect dimension items are shown below.
Again, the reliability estimate for this dimension exceeds the minimum acceptable threshold, and the
scale can be considered as producing reliable and consistent measurements.
Copyright© Aperian Global 2016 Technical Report: GlobeSmart Profile 15
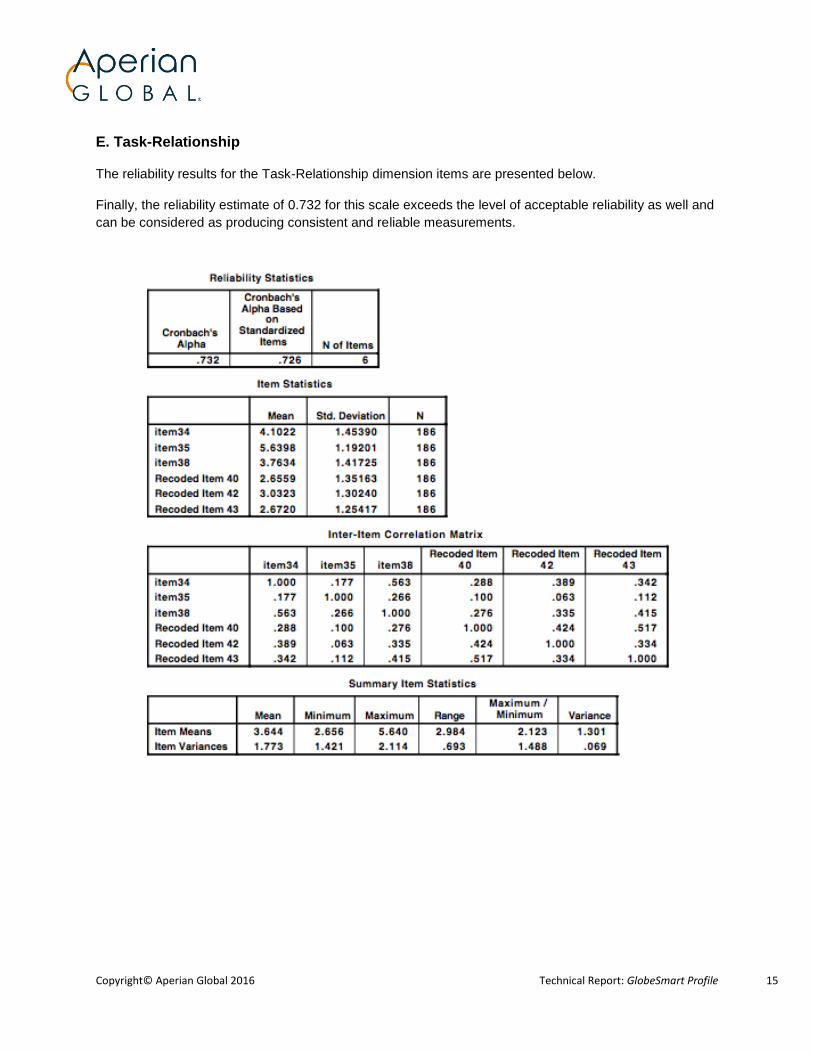
E. Task-Relationship
The reliability results for the Task-Relationship dimension items are presented below.
Finally, the reliability estimate of 0.732 for this scale exceeds the level of acceptable reliability as well and
can be considered as producing consistent and reliable measurements.

Copyright© Aperian Global 2016 Technical Report: GlobeSmart Profile 16
Dimension Factor Composition
To determine whether the items on a dimension were measuring a single dimension or construct, an
Exploratory Factor Analysis was applied to each set of dimension items. Since the items for a dimension
were designed to measure two ends of a bipolar dimension it would not be at all surprising if the factor
analysis indicated that more than a single factor would be needed to explain performance. The results of
the five factor analyses (one each for Independence-Interdependent, Egalitarianism-Status, Risk-
Certainty, Direct-Indirect, and Task-Relationship) showed a consistent pattern of results.
In each case, two factors were indicated by examining the eigenvalues of the solutions. In other words,
there were two eigenvalues greater than one in each of the Principal Axis factor analyses. In all cases,
the first factor accounted for the largest amount of variance ranging in value from 37% in the case of
Egalitarianism-Status to almost 51% for Direct-Indirect. The second factor in the solution ranged in value
from slightly less than 16% to 18%. In terms of overall variance accounted for the values ranged from
52% (Egalitarianism-Status) to 68% (Direct-Indirect). The pattern of loadings was nearly the same in all
five solutions. Typically all items had a significant loading on the first factor and then only one of the items
had a significant on the second factor. In the case of Direct-Indirect, there were two items with a
significant secondary loading.
Given the design of the instrument, a balance of items measuring two opposite ends of a single
dimension, the factor analysis results are not surprising. In fact, they are better than they could have been
in that almost all of the items had their largest loading on the first factor. Typically, only one of the items
had a significant secondary loading. The findings from these analyses help explain why the internal
consistency reliability estimates, while exceeding the accepted standard for psychological assessments,
were not higher.
Construct Validity
Construct Validity is normally established through empirical evidence supporting the model that was used
to build the instrument. For the GSP, this model was composed of five dimensions of intercultural
behavior: Independence-Interdependence, Egalitarianism-Status, Risk-Certainty, Direct-Indirect, and
Task-Relationship. It is important to note that the model assumed that these dimensions were fairly
independent of each other in a statistical sense. The model thus implies that performance on the five
scales is independent of each other, so that performance on a dimension can be interpreted without
considering performance on the other dimensions.
A. Exploratory Factor Analysis
The initial analytic approach to establishing the Construct Validity of the GSP was to perform an
Exploratory Factor Analysis using a Principal Axis Factor Analysis followed by a Varimax Rotation. This
approach assumes an orthogonal or independent set of dimensions for the GSP. It is a useful initial
method for determining the number of factors and to explore the instrument's factorial composition.
The results of this analysis showed that the best factorial solution for the GlobeSmart Profile has five
factors. Again, the criterion used to determine the number of factors was an Eigenvalue greater than 1.0.
This supports the hypothesis of the five dimensions of the GSP Model. The results of the Varimax

Copyright© Aperian Global 2016 Technical Report: GlobeSmart Profile 17
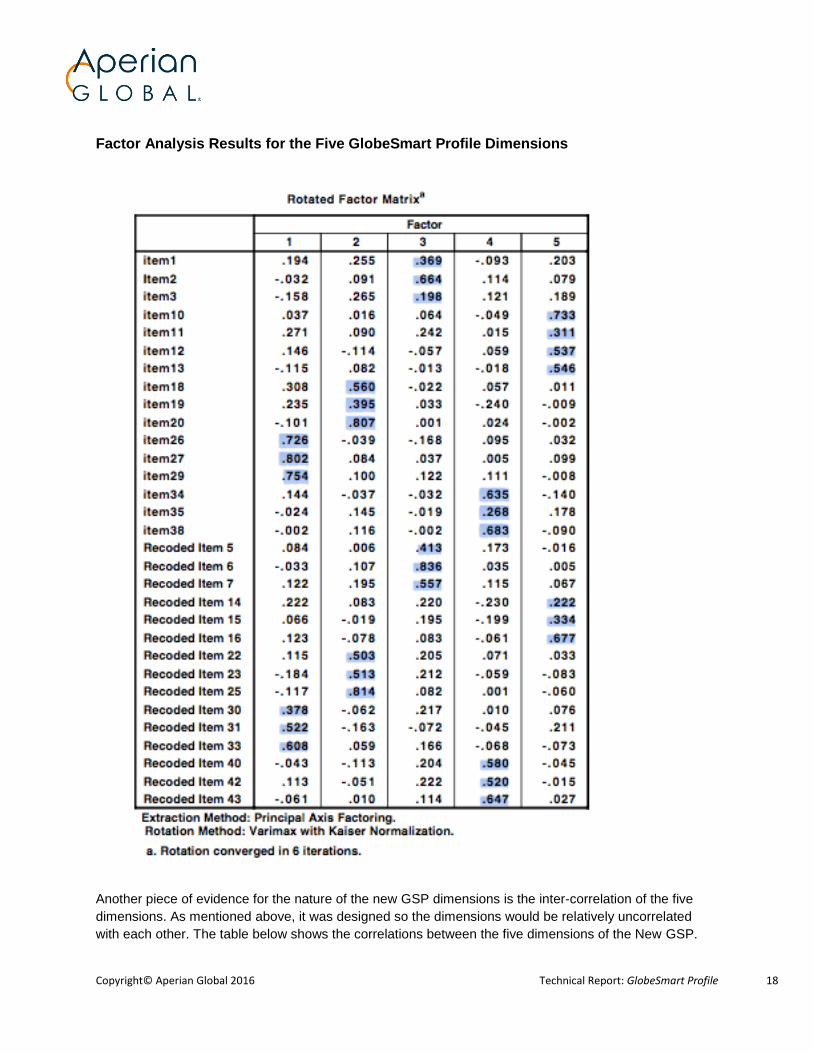
Rotation provided a very clear picture of the hypothesized dimensions. All of the items loaded on their
hypothesized factors. In the Figure below, the highlighted loadings are the hypothesized loadings for the
five dimensions. With two exceptions (item 14 and item 35) the loadings are all greater than .30, the
accepted criteria for statistical significance. Even in the two cases, the loadings are the largest of any
loading for those items. Factor 1 corresponds to the Direct-Indirect dimension. Factor 2 corresponds to
the Risk-Certainty dimension. Factor 3 corresponds to the Independence-Interdependence dimension.
Factor 4 is the Task-Relationship dimension. Factor 5 is the Egalitarianism-Status dimension.
Another important aspect to note in these results is there were few instances where an item had a
significant loading on a factor other than its hypothesized factor. This is more strong evidence supporting
the construct validity of the GSP.
Copyright© Aperian Global 2016 Technical Report: GlobeSmart Profile 18
Factor Analysis Results for the Five GlobeSmart Profile Dimensions
Another piece of evidence for the nature of the new GSP dimensions is the inter-correlation of the five
dimensions. As mentioned above, it was designed so the dimensions would be relatively uncorrelated
with each other. The table below shows the correlations between the five dimensions of the New GSP.

Copyright© Aperian Global 2016 Technical Report: GlobeSmart Profile 19
New GS Profile
II Dimension
ES
Dimension
RC
Dimension
DI
Dimension
TR
Dimension
II Dimension 1 .204** .287
** .080 .194
**
ES Dimension
1 .030 .225** -.095
RC Dimension
1 .066 .006
DI Dimension
1 .052
TR Dimension
1.000
The results show small correlations between the dimensions. While some of the correlations are
statistically significant that is due to the large sample size. None of the correlations account for as much
as nine percent of the variance. For all intents and purposes, the dimensions can be considered
independent.
The final piece of evidence for the Construct Validity of the GSP is its correlation with the previous GAP.
The table below shows the correlations between the dimensions of the previous GAP with those of the
new GSP.
New GSP and Previous GAP
II
Dimension
ES
Dimension
RC
Dimension
DI
Dimension
TR
Dimension
II
Dimension
.499** .149
* .099 .162
* -.311
**
ES
Dimension
.227** .391
** .232
** .271
** -.024
RC
Dimension
.432** .306
** .254
** .093 -.209
**
DI
Dimension
.392** .547
** .600
** .676
** -.161
*
TR
Dimension
-.033 -.016 -.103 .094 -.281**
The results in the table show statistically significant correlations between the corresponding dimensions in
the previous GAP and new GSP. The correlations are actually stronger than those between the
dimensions in the GSP. The results support the construct validity of the GSP but also shows that the GSP
measures other attributes than the previous GAP. That is, since the correlations are all low to modest
(the largest is .676 or 46% of the variance), the GSP items are measuring attributes other than just what
the previous GAP measured. This finding is consistent with the new definitions of the dimensions and the
new items.
B. Confirmatory Factor Analysis
In light of the very clear and compelling results from the Exploratory Factor Analysis and in particular the
Varimax Rotation, it was deemed unnecessary to perform a formal Confirmatory Factor Analysis. A
Copyright© Aperian Global 2016 Technical Report: GlobeSmart Profile 20
Confirmatory Factor Analysis approach is selected as the appropriate analytic technique when the
Exploratory Results are unclear or when formal hypothesis testing of the model is required. This
technique allows for specification of the specific measurement model and tests the degree to which the
model is consistent. Typically, the analysis is performed using LISREL (Jöreskog & Sörbom, 2000).
Criterion Validity
Evidence of Criterion Validity is important because it supports the use of the assessment to identify good
performers from poor performers or to predict good performance. Since the GSP is an awareness tool
and not meant to be used as a diagnostic tool nor for development decisions, Criterion Validity was not
addressed at this time. Should the use of the GSP change in the future so that it is applied in such areas,
then appropriate Criterion Validity analyses and studies will need to be undertaken to document the GSP
properties in this regard.
Dimension Scaling and Descriptives
The results of the GSP were scaled so that each dimension would be put on the same numerical scale.
This scale had a mean of 5 and standard deviation of 1.5. To derive an individual's scale score the
following process was applied:
1. The dimension score was calculated by taking the mean of the item values that identified the
specific dimension. This calculation used all non-missing item values and for items that defined
the right hand side of the dimension it was their recoded values.
2. The dimension score was then converted into a standard score (mean of zero and standard
deviation of 1).
3. The standard scores were then placed on the dimension scale by multiplying by 1.5 and adding 5,
so that the score distribution would have a mean of 5 and a standard deviation of 1.5. In a
Normal Curve distribution, this would produce an effective range of score values from zero to 10*.
* Note: The display of an individual's scores in the GSP chart is further modified so that only
values between 1 and 9 are actually plotted in the profile chart. Scores less than 1 are plotted as
1, and scores greater than 9 are plotted as 9.
A series of simple descriptive analyses was performed to examine the characteristics of the scales for
each dimension as well as plots comparing the actual data distribution on the scales versus a normal
curve distribution. The results are provided in the table and charts below.

Copyright© Aperian Global 2016 Technical Report: GlobeSmart Profile 21
The results show that the scaling accomplished what was intended, producing score distributions that had
a mean of 5 and standard deviation of 1.5 with scores ranging from zero to 10. The skewness statistic
shows that the distributions are not perfectly normal in shape, but are not highly skewed. The charts
below provide further information on the empirical score distributions and how they compare to the
Normal Curve.

Copyright© Aperian Global 2016 Technical Report: GlobeSmart Profile 22

Copyright© Aperian Global 2016 Technical Report: GlobeSmart Profile 23

Copyright© Aperian Global 2016 Technical Report: GlobeSmart Profile 24

Copyright© Aperian Global 2016 Technical Report: GlobeSmart Profile 25
The charts show that with the exception of the II distribution the distributions, while not perfectly normal,
are symmetric and approximately normal in shape and form. It is possible that with a larger sample the
distribution would become even more normal in shape. The current results show that the GSP provides
adequate discrimination between respondents and that it discriminates in the desirable and intended form
of a Normal Curve.

Copyright© Aperian Global 2016 Technical Report: GlobeSmart Profile 26
VI. Summary
The results of the analyses provide support for the psychometric properties of the GSP in the areas of
Reliability, Scale Composition, and Construct Validity. All scales have appropriate levels of reliability as
measured by Cronbach's alpha reliability estimate. There is factor analytic support for five dimensions of
the GSP Model being measured by the GSP scale items. The Exploratory Factor Analysis offered
empirical support that the model provided a reasonable fit to the data, thus providing support for GSP
Construct Validity. In fact, the Varimax Rotation results were so clear and supportive of the hypothesized
model it was not necessary to perform a Confirmatory Factor Analysis. The results also show that the five
dimensions are not highly inter-correlated so that they can be interpreted independently of each other,
making feedback simpler and more dependable. Finally, the independence of the dimensions shows that
the GSP is measuring a broad behavioral domain consistent with an area as large as intercultural
behavior and values.
Based on the above, it can be said with confidence that the GSP has sound psychometric properties
for use by individuals examining their preferred interaction styles and wanting to know how they
compare with others on the selected dimensions of culture.

Copyright© Aperian Global 2016 Technical Report: GlobeSmart Profile 27
References
Cronbach, L. J. (1951) Coefficient alpha and the internal structure of tests. Psychometrika, 16, 297-324.
Browne, M. W. & Cudeck, R. (1993) Alternative Ways of Assessing Fit. In K.A. Bollen & J.S. Long
(Eds.),
Testing Structural Equation Models. Newbury Park: Sage Publications.
Jöreskog, K.G. & Sörbom, D. (2000) LISREL 8.30 Chicago: Scientific Software International, Inc.
Nunnally, J. C. (1978) Psychometric Theory. New York: McGraw-Hill.
Steiger, J. H. (1990) Structural model evaluation and modification: an interval estimation approach.
Multivariate Behavioral Research, 25, 173-180.
Steiger, J. H. (2000) Point Estimation, Hypothesis Testing, and Interval Estimation using RMSEA: Some
comments and a reply to Hayduk and Glaser. Structural Equation Modeling, 7, 49-62.

Copyright© Aperian Global 2016 Technical Report: GlobeSmart Profile 28
About Aperian Global
Founded in 1990, Aperian Global provides consulting, training, and web tools for global talent
development and has offices around the world. The company's mission is to develop the capabilities of
individuals, teams, and organizations to perform effectively worldwide in order to create a sustainable
global future. Beginning with GlobeSmart, a popular online reference tool that focuses on how to do
business around the world, Aperian Global has pioneered the development of blended solutions that use
online learning to engage the learner and enhance the learning process. Aperian Global offers a uniquely
powerful integration of Innovative Web Tools, Thought Leadership, and Global Reach to meet the talent
development needs of its clients worldwide.