psychophysics with children: investigating the …smgxprj/pdfs/manning_app_2018.pdfpsychophysics...
TRANSCRIPT

Psychophysics with children: Investigating the effects of attentionallapses on threshold estimates
Catherine Manning1,2& Pete R. Jones3,4 & Tessa M. Dekker3,5 & Elizabeth Pellicano2,6
Published online: 26 March 2018# The Author(s) 2018
AbstractWhen assessing the perceptual abilities of children, researchers tend to use psychophysical techniques designed for use withadults. However, children’s poorer attentiveness might bias the threshold estimates obtained by these methods. Here, we obtainedspeed discrimination threshold estimates in 6- to 7-year-old children in UK Key Stage 1 (KS1), 7- to 9-year-old children in KeyStage 2 (KS2), and adults using three psychophysical procedures: QUEST, a 1-up 2-down Levitt staircase, and Method ofConstant Stimuli (MCS). We estimated inattentiveness using responses to Beasy^ catch trials. As expected, children had higherthreshold estimates and mademore errors on catch trials than adults. Lower threshold estimates were obtained from psychometricfunctions fit to the data in the QUEST condition than the MCS and Levitt staircases, and the threshold estimates obtained whenfitting a psychometric function to the QUEST data were also lower than when using the QUEST mode. This suggests thatthreshold estimates cannot be compared directly across methods. Differences between the procedures did not vary significantlywith age group. Simulations indicated that inattentiveness biased threshold estimates particularly when threshold estimates werecomputed as the QUEST mode or the average of staircase reversals. In contrast, thresholds estimated by post-hoc psychometricfunction fitting were less biased by attentional lapses. Our results suggest that some psychophysical methods are more robust toattentiveness, which has important implications for assessing the perception of children and clinical groups.
Keywords Signal detection theory . Attention . Development
Introduction
A common way to characterize the sensitivity of a perceptualsystem is by measuring its perceptual threshold: the minimum
stimulus intensity required to reach a specified level of perfor-mance (e.g., 70.7% correct; Green & Swets, 1974). Thresholdestimates have been shown to improve during childhood for arange of visual tasks, including spatial contrast sensitivity
Significance statement Psychophysical procedures designed for use inadults are often used to assess perceptual abilities in children. However,these methods may be inappropriate for populations with limited attention,including children. Here, we investigated the effects of attentional lapses onthreshold estimates for three different methods using empirical datacollected from children and simulated data. We show that methods differin their robustness to attentiveness and recommend that researchersassessing children or individuals with attentional difficulties use methodsthat fit the psychometric function post-hoc, rather than using the resultingestimate from adaptive techniques.
* Catherine [email protected]
1 Department of Experimental Psychology, University of Oxford,Anna Watts Building, Radcliffe Observatory Quarter, WoodstockRoad, Oxford OX2 6GG, UK
2 Centre for Research in Autism and Education (CRAE), UCL Instituteof Education, University College London, London, UK
3 UCL Institute of Ophthalmology, University College London,London, UK
4 NIHR Moorfields Biomedical Research Centre, London, UK
5 UCL Psychology and Language Science, University CollegeLondon, London, UK
6 Department of Educational Studies, Macquarie University,Sydney, NSW, Australia
Attention, Perception, & Psychophysics (2018) 80:1311–1324https://doi.org/10.3758/s13414-018-1510-2

(Bradley & Freeman, 1982; Ellemberg et al., 1999), temporalcontrast sensitivity (Ellemberg et al., 1999) and motion per-ception (Hadad et al., 2011; Hayward et al., 2011; Manninget al., 2014). This protracted development is paralleled in oth-er sensory modalities (e.g., audition: Fior, 1972; Jensen &Neff, 1993; Maxon & Hochberg, 1982; olfaction: Stevensonet al., 2007). Developmental scientists tend to assume thatage-related reductions in psychophysical threshold estimatesreflect real differences in sensitivity. Yet, it is possible thathigher-level factors, such as inattentiveness, reduced motiva-tion, or response bias, contribute to age-related changes inthreshold estimates (Wightman & Allen, 1992). Thus, to fullyunderstand the development of perceptual systems, it is im-portant to investigate the extent to which these higher-levelfactors may impact on children’s psychophysical thresholdestimates.
Here, we operationalized inattentiveness in terms of atten-tional lapses: responses made independent of the stimuluslevel (Kingdom & Prins, 2010; Madigan & Williams, 1987).Attentional capacities go through considerable developmentalchanges throughout childhood (Rueda et al., 2004) and, ac-cordingly, lapses are often elevated in children compared toadults (Halliday et al., 2008; Manning et al., 2014; McArthur& Hogben, 2012; Talcott et al., 2002; see also Nardini et al.,2010). Simulations suggest that attentional lapses contributeto elevated and more variable threshold estimates in childpopulations (Roach et al., 2004; Wightman et al., 1989;Wightman & Allen, 1992; Witton et al., 2017).
It is unclear how the deleterious effect of inattentivenessmay vary depending on the psychophysical procedure used.Answering this question is important for ensuring the robust-ness of findings in populations with limited attention such aschildren, and also elderly and clinical groups. Typically, whenestimating thresholds in children, researchers and cliniciansuse psychophysical procedures that have been designed al-most exclusively for use with adults. These include bothnon-adaptive and adaptive methods. Non-adaptive methods,such as the Method of Constant Stimuli (MCS), test responsesat predefined stimulus levels, whereas adaptive methods (e.g.,transformed staircases: Levitt, 1971; QUEST:Watson & Pelli,1983; PEST: Taylor & Creelman, 1967) use previous re-sponses to guide which stimulus levels are presented next, inorder to Bhome in^ on the threshold. Previous research sug-gests that different procedures converge on comparable esti-mates of thresholds in adult participants (Amitay et al., 2006;Leek et al., 2000; Madigan & Williams, 1987; Shelton &Scarrow, 1984; Shelton et al., 1982; but see also Kollmeieret al., 1988), but this finding may not generalize to observerswith elevated lapse rates, such as children.
Adaptive methods have intuitive appeal when testing chil-dren. In these methods, trials are placed at stimulus levelsstrategically chosen to be informative of the observer’s thresh-old (Kingdom & Prins, 2010; Leek, 2001). While approaches
differ, all adaptive methods are designed to estimate thresh-olds in fewer trials than non-adaptive methods (Macmillan &Creelman, 1991). Fewer trials are generally preferable whentesting children, as they have the potential to minimize fatigueand/or boredom effects. Furthermore, unlike non-adaptivemethods, stimulus intensities do not need to be predefinedbefore the testing session, which is useful when there is highuncertainty about the observer’s threshold (King-Smith et al.,1994), as in the case of children whose thresholds may differwidely from those of their peers. Instead, other choices have tobe made, including the selection of appropriate starting points,priors, and step-sizes (García-Pérez, 2011; Kaernbach, 1991;Watson & Pelli, 1983; Wetherill & Levitt, 1965).
While adaptive procedures have clear advantages com-pared to non-adaptive procedures for testing participantswho cannot tolerate large numbers of trials, they may sufferfrom an important drawback. Because the next stimulus isselected based on previous trial performance, a lapse maycause the adaptive procedure to deviate away from the mostefficient presentation sequence, potentially leading to unreli-able estimates of threshold, especially when they occur earlyon in the testing session (Gu & Green, 1994; Kingdom &Prins, 2010). Threshold estimation techniques that fit thewhole psychometric function, such as MCS and Bhybrid^ ver-sions of adaptive methods (Hall, 1981) may minimize thiseffect of attentional lapses, as the lapse rate can be estimatedfrom the psychometric function and accounted for (Dakin &Frith, 2005; Prins, 2012; Wichmann & Hill, 2001).
Buss et al. (2001) previously compared the use of differentpsychophysical procedures in children. They investigated au-ditory detection threshold estimates in a three-alternative-forced-choice task in 6- to 11-year-olds (n = 23) and adults(n = 13), comparing three procedures: a 1-up 3-down Levittstaircase (Levitt, 1971), a maximum likelihood estimationprocedure (MLE; Green 1993), and MCS. Participants werefirst presented with the staircase and MLE procedures, andresulting threshold estimates were then used to select MCSstimulus intensity levels. Buss et al. reported that the threeprocedures yielded comparable threshold estimates, thus con-cluding that the choice of psychophysical procedure is not ofgreat importance when assessing children’s auditory detectionthresholds. The aim of the current study was to expand on thiswork by directly testing the effects of attentional lapses onchildren’s threshold estimates, using a large dataset combinedwith computer simulations.
We asked children aged 6–9 years and adults to discrimi-nate between two sequentially presented random-dot stimulimoving at different speeds in a two-alternative forced-choiceparadigm. We used three psychophysical procedures: QUEST(Watson & Pelli, 1983), a 1-up 2-down staircase, and MCS, toobtain discrimination threshold estimates, defined as the stim-ulus level leading to a 70.7% chance of a correct judgmentabout which stimulus moved faster. Unlike in Buss et al.’s
1312 Atten Percept Psychophys (2018) 80:1311–1324

study, we tested the more typical scenario where MCS stimu-lus levels are not selected using preceding staircase proce-dures. We chose a speed discrimination task for two reasons.First, speed discrimination threshold estimates have beenshown to reduce with age, following a relatively protractedrate of development that only reaches adult-like levels bymid-to-late childhood (Manning et al., 2012). Second, young chil-dren show considerable between-participants variability intheir speed discrimination threshold estimates, particularlyfor slow speeds (Ahmed et al., 2005; Manning et al., 2012).Increased attentional lapses could contribute to both elevatedspeed discrimination threshold estimates and between-participants variability in young children. We obtained acoarse measure of attentiveness from the number of incorrectresponses to randomly-placed Beasy^ catch trials (Treutwein,1995), where a random response at 10% of trials (0.1 lapserate) would yield an expected error rate of 5% on catch trials inthe 2AFC task. In addition to these empirical data, we usedMonte Carlo simulations to assess whether attentional lapsescould explain the pattern of threshold estimates acrossmethods obtained in our participants.
We had three main research questions. First, we testedwhether children have more attentional lapses than adultsusing errors in catch trials as a proxy. We predicted that theywould, based on previous research (Manning et al., 2014;Talcott et al., 2002). Second, we investigated whether speeddiscrimination threshold estimates varied across procedures,and whether the effect of procedure interacted with age group.Third, we assessed the effect of inattentiveness on differentthreshold estimation techniques using simulations to investi-gate whether any differences between threshold estimatesacross conditions in our participants could be explained by adifferential effect of attentional lapses.
Methods
Participants
Three groups of participants were tested: 31 children in KeyStage 11 (KS1) (M = 6.80 years, range 6.19–7.40 years, 18females); 39 children in Key Stage 2 (KS2) (M = 8.39 years,range 7.53–9.27 years, 21 females), and 19 adults (M = 25.12years, range 20.61–33.41 years, 10 females). Children wererecruited from schools in the Greater London area, and adultparticipants were recruited through the UCL Institute ofEducation and community contacts. Parents completed a briefquestionnaire about their child’s vision, and normal orcorrected-to-normal visual acuity was confirmed by binoculartesting with the Cambridge Crowding cards for children, and
with a Snellen acuity chart for adults. Normal acuity was de-fined as a binocular crowded-letter acuity of 6/9 or better forchildren aged 6–8 years.
Analyses of catch trials were conducted with the full co-hort, but threshold estimates could not be reliably computedfor all participants in all conditions (see Data Screening andAnalysis). The analysis on threshold estimates therefore in-volved a subset of 26 KS1 children (17 female), 32 KS2 chil-dren (17 female) and 12 adults (seven female).
Apparatus and stimuli
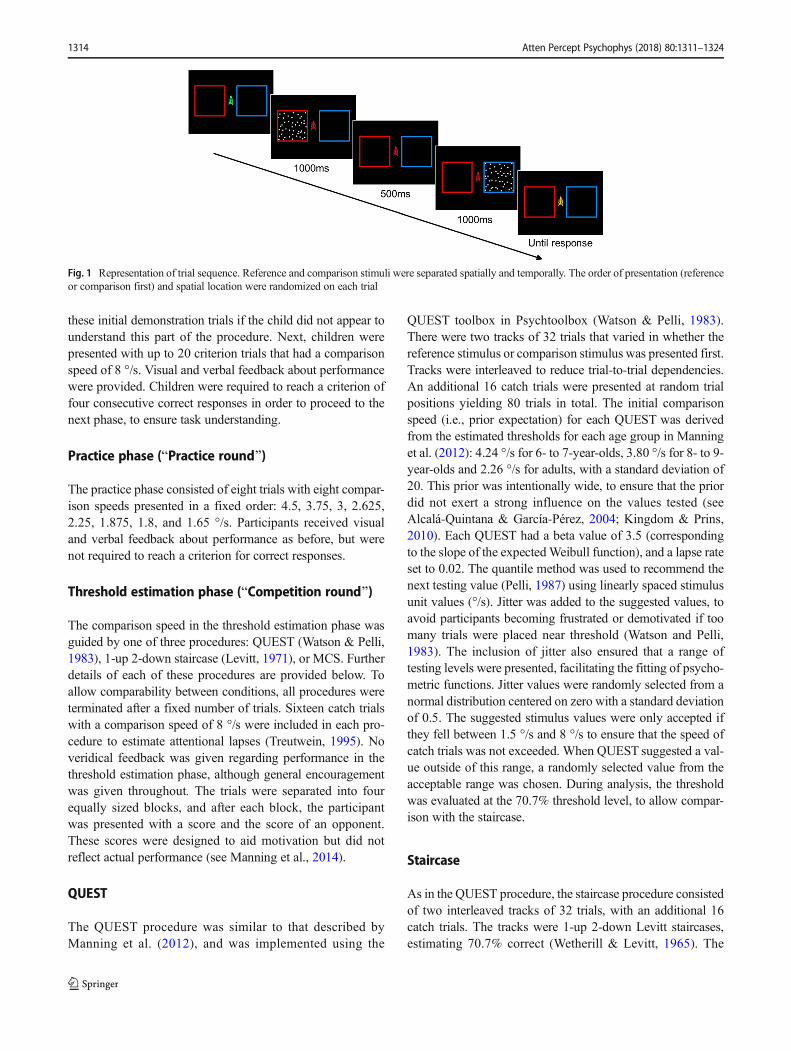
The stimuli were presented using MATLAB (The MathworksLtd.) using the Psychophysics Toolbox (Brainard, 1997;Kleiner, Brainard, & Pelli, 2007; Pelli, 1997). The screenwas black with a central fixation point (1.54° × 3.12°) in theshape of a rocket that changed color to mark trial events(Manning et al., 2012). There was a red square border (11° ×11°) to the left and a blue square border (11° × 11°) to the rightof fixation. The stimuli were white random dot patterns mov-ing with 100% motion coherence within either border (seeFig. 1). In each stimulus, there were 100 white dots of 0.34°diameter and a limited lifetime of five monitor refreshes (~83ms).
Procedure
The speed discrimination task was based on Manning et al.(2012). In each trial, a reference and a comparison stimuluswere presented sequentially for 1,000 ms, separated by aninterstimulus interval of 500 ms. A stimulus in the left (red)border was followed by a stimulus in the right (blue) border,and vice versa (see Fig. 1). The order of presentation of thereference and comparison stimulus (first or second interval)was randomized on each trial. The reference stimulus movedat 1.5 °/s, and the speed of the comparison stimulus variedabove the reference speed.
The task was presented in the context of a space-themedBgame,^ to enhance children’s motivation and attentionthroughout the task. Participants were asked to determinewhether the red or blue rocket had Bstars^ travelling faster pastthe window. Participants were presented with an initial dem-onstration and criterion phase, followed by practice andthreshold estimation phases for each procedure. The initialphases served to cement the observer’s strategy beforeobtaining thresholds.
Demonstration and criterion phase (BSpace gamewarm-up^)
The experimenter explained the task to participants using aminimum of four demonstration trials. Participants indicatedwhich set of Bstars^ moved faster. The experimenter replayed
1 Key Stages refer to the division of the UK National Curriculum, with KS1and KS2 corresponding to 5–7 years and 7–11 years, respectively.
Atten Percept Psychophys (2018) 80:1311–1324 1313
these initial demonstration trials if the child did not appear tounderstand this part of the procedure. Next, children werepresented with up to 20 criterion trials that had a comparisonspeed of 8 °/s. Visual and verbal feedback about performancewere provided. Children were required to reach a criterion offour consecutive correct responses in order to proceed to thenext phase, to ensure task understanding.
Practice phase (BPractice round^)
The practice phase consisted of eight trials with eight compar-ison speeds presented in a fixed order: 4.5, 3.75, 3, 2.625,2.25, 1.875, 1.8, and 1.65 °/s. Participants received visualand verbal feedback about performance as before, but werenot required to reach a criterion for correct responses.
Threshold estimation phase (BCompetition round^)
The comparison speed in the threshold estimation phase wasguided by one of three procedures: QUEST (Watson & Pelli,1983), 1-up 2-down staircase (Levitt, 1971), or MCS. Furtherdetails of each of these procedures are provided below. Toallow comparability between conditions, all procedures wereterminated after a fixed number of trials. Sixteen catch trialswith a comparison speed of 8 °/s were included in each pro-cedure to estimate attentional lapses (Treutwein, 1995). Noveridical feedback was given regarding performance in thethreshold estimation phase, although general encouragementwas given throughout. The trials were separated into fourequally sized blocks, and after each block, the participantwas presented with a score and the score of an opponent.These scores were designed to aid motivation but did notreflect actual performance (see Manning et al., 2014).
QUEST
The QUEST procedure was similar to that described byManning et al. (2012), and was implemented using the
QUEST toolbox in Psychtoolbox (Watson & Pelli, 1983).There were two tracks of 32 trials that varied in whether thereference stimulus or comparison stimulus was presented first.Tracks were interleaved to reduce trial-to-trial dependencies.An additional 16 catch trials were presented at random trialpositions yielding 80 trials in total. The initial comparisonspeed (i.e., prior expectation) for each QUEST was derivedfrom the estimated thresholds for each age group in Manninget al. (2012): 4.24 °/s for 6- to 7-year-olds, 3.80 °/s for 8- to 9-year-olds and 2.26 °/s for adults, with a standard deviation of20. This prior was intentionally wide, to ensure that the priordid not exert a strong influence on the values tested (seeAlcalá-Quintana & García-Pérez, 2004; Kingdom & Prins,2010). Each QUEST had a beta value of 3.5 (correspondingto the slope of the expectedWeibull function), and a lapse rateset to 0.02. The quantile method was used to recommend thenext testing value (Pelli, 1987) using linearly spaced stimulusunit values (°/s). Jitter was added to the suggested values, toavoid participants becoming frustrated or demotivated if toomany trials were placed near threshold (Watson and Pelli,1983). The inclusion of jitter also ensured that a range oftesting levels were presented, facilitating the fitting of psycho-metric functions. Jitter values were randomly selected from anormal distribution centered on zero with a standard deviationof 0.5. The suggested stimulus values were only accepted ifthey fell between 1.5 °/s and 8 °/s to ensure that the speed ofcatch trials was not exceeded. When QUEST suggested a val-ue outside of this range, a randomly selected value from theacceptable range was chosen. During analysis, the thresholdwas evaluated at the 70.7% threshold level, to allow compar-ison with the staircase.
Staircase
As in the QUEST procedure, the staircase procedure consistedof two interleaved tracks of 32 trials, with an additional 16catch trials. The tracks were 1-up 2-down Levitt staircases,estimating 70.7% correct (Wetherill & Levitt, 1965). The
Fig. 1 Representation of trial sequence. Reference and comparison stimuli were separated spatially and temporally. The order of presentation (referenceor comparison first) and spatial location were randomized on each trial
1314 Atten Percept Psychophys (2018) 80:1311–1324

staircases started at the same point as the QUEST functions.Initially, an incorrect response would increase the comparisonspeed by 0.2 times, and two consecutive correct responseswould reduce the comparison speed by 0.2 times. The stepsize was reduced to 0.1 and 0.05 times the stimulus value afterthe first and second reversals, respectively. The larger initialstep size was designed to minimize any effect of an inappro-priate choice of starting point. The staircase values were sub-ject to an upper limit of 8 °/s and a lower limit of 1.5 °/s as inthe QUEST procedure.
Method of Constant Stimuli (MCS)
The MCS procedure presented 16 trials at each of five levelsof comparison speed in a random order. The comparisonspeeds were selected to span the expected threshold(Kingdom & Prins, 2010) for each age group (Manninget al., 2012). In the KS1 children, the comparison speeds were2.19, 2.87, 4.24, 5.61, and 6.99 °/s; in the KS2 children, thecomparison speeds were 2.08, 2.65, 3.80, 4.95, and 6.10 °/s;and in the adults the comparison speeds were 1.69, 1.88, 2.26,2.64, and 3.02 °/s. As in the adaptive procedures, 16 catchtrials were included with a comparison speed of 8 °/s for allparticipants, yielding a total of 96 trials for this procedure. Thetemporal order (reference stimulus vs. comparison stimuluspresented first) was randomized on each trial.
General procedure
The procedure was approved by the Institute of Education’sFaculty Research Ethics Committee. All adult participants andparents of child participants gave informed consent, and chil-dren provided verbal assent. Child participants were seen in-dividually at school and adult participants were seen at theInstitute of Education or another convenient location.Procedures were presented in separate sessions to minimizefatigue, with the first and last sessions spanning no more than9 days, and each session lasted approximately 15 min. Theorder of presentation of the different procedures wascounterbalanced across participants. In the first session, par-ticipants completed the demonstration and criterion phase,followed by the practice and threshold estimation phase forone procedure. In the second and third sessions, participantswere reminded of the task before proceeding to the practiceand threshold estimation phases for the second and third pro-cedures, respectively.
Participants were tested binocularly in a dimly illuminatedroom at a viewing distance of 50 cm from the computerscreen, fixed using a chin-rest. Participants were instructedto maintain central fixation throughout stimulus presentation,and received regular reminders to do so. Child participantsgave responses verbally or by pointing, and the experimenterpressed the corresponding response key. The experimenter
continuously monitored children’s eye movements and initi-ated trials only when the child was fixating appropriately.Adult participants made their responses by directly pressingthe response keys.
Data analysis
As an index of attentiveness, we computed the proportion ofcatch trials for which participants gave an incorrect response.We used non-parametric analyses when analyzing group andcondition differences in catch trial error rates, as the data werehighly skewed, with the majority of error rates being zero andunamenable to transformation. These analyses were conduct-ed with the full sample of 31 KS1 children, 39 KS2 children,and 19 adults.
To estimate thresholds, we first fit psychometric functionsto the raw data from each individual participant in each pro-cedure (including the adaptive tracks, i.e., the Bhybrid adap-tive procedure,^ Hall, 1981; Kingdom & Prins, 2010). Thecatch trials were included in the fit and we did not bin trialsin the adaptive procedure. We fitted bootstrapped cumulativeGaussian functions with 200 runs, using the psignifit toolbox(see http://bootstrap-software.org/psignifit/), a softwarepackage that implements the maximum-likelihoodmethod de-scribed by Wichmann and Hill (2001). The proportion of cor-rect responses was plotted as a function of the difference inspeed between the reference and comparison stimuli on a logscale (Fig. 2), with the guessing rate (gamma) fixed at 0.5.Lapse rate (lambda) was a free parameter allowed to varybetween 0 and 0.1 with equal probability of values across thisrange. The threshold was defined as the speed difference atwhich 70.7% of responses were correct. Participants wereexcluded from the threshold analysis if negative slopes wereobtained (QUEST: n = 1; staircase: n = 2) or if the thresholdestimates fell outside of the tested stimulus range (QUEST: n= 8; staircase: n = 9; MCS: n = 2). It is possible that theQUEST and staircase had higher exclusion rates than MCSbecause MCS included more trials. Notably, many adult par-ticipants and some child participants had threshold estimatesbelow the minimum presented stimulus, which seemed to becaused by too few trials targeting below-threshold. Althoughthese data indicate good performance, these threshold esti-mates are unreliable as they involve extrapolating beyondthe tested values. We excluded these participants from thethreshold analysis to ensure that we could compare estimatesreliably across methods, resulting in a smaller dataset of 26KS1 children, 32 KS2 children, and 12 adults for theseanalyses.
Additionally, we computed threshold estimates specific tothe adaptive track used. For each participant’s data in the stair-case condition, we averaged the last even number of reversals,omitting the first two reversals, for each staircase, and aver-aged these across the two runs to get a single threshold
Atten Percept Psychophys (2018) 80:1311–1324 1315

estimate. For one KS1 child, too few reversals were obtainedto compute a threshold estimate, so this participant was ex-cluded from analysis involving the staircase reversals. For theQUEST condition, we obtained the mode of the posteriorprobability density function (Watson & Pelli, 1983) for eachQUEST track using the QUEST toolbox in Psychtoolbox andaveraged these within participants to get a single thresholdestimate.2
Simulations
To model the effects of attentional lapses on threshold esti-mates, we ran a set of 2,000 Monte Carlo simulations for eachpsychophysical procedure, using a simulated observer withprogressively greater lapse rates. Trial values were presentedto the simulated observer in the same way as the youngest,KS1 children. The simulated observer responded on the basisof a cumulative log-Gaussian psychometric function with astandard deviation (internal noise) of .20 and a mean of .02in log units. This function was based on the MCS data fromthe KS1 observer shown in Fig. 2C with a perceptual thresh-old of .97 °/s. The lapse rate corresponded to the proportion oftrials onwhich the simulated observer would respond random-ly (see also Gu & Green, 1994; Madigan & Williams, 1987;
Prins, 2012). Thresholds were estimated in the same way asthose for the real datasets, and again, we filtered out thresholdestimates falling outside of the stimulus range and psychomet-ric functions with negative slopes. The code and resultingsimulations can be found at: https://osf.io/ne2c8/.
Results
Characterizing the attentiveness of children
To characterize inattentiveness in our child and adult ob-servers, we used the proportion of catch trials for which par-ticipants gave an incorrect response for each condition(Fig. 3A; QUEST, staircase, MCS). The errors made in theseBeasy^ catch trials can be used to estimate the lapse rate (pro-portion of random responding), by multiplying the proportionof errors by two (to account for a 50% guessing rate).Accordingly, the catch trial error rate was significantly corre-lated with lapse rates estimated during psychometric functionfitting, for all methods (QUEST: rs = .67, p < .001; staircase: rs= .70, p < .001; MCS: rs = .56, p < .001). While 52% ofparticipants made no errors in catch trials (i.e., lapse rate =0), some of the children made multiple errors.
Friedman’s test showed no differences in catch trial errorsbetween the different methods, χ2(2) = 1.63, p = .44. However,
2 The QUEST mean (King-Smith et al. 1994) is not reported here because itoften fell outside of the stimulus range.
Fig. 2 Example datasets for each psychophysical procedure. (A)Example dataset for the QUEST condition, belonging to a participant inthe KS1 group. The speed difference is the difference between thecomparison speed and the reference speed (1.5 °/s). The valuessuggested by the QUEST functions are shown as black dotted lines, andthe presented values (after trimming within the allowable stimulus rangeand adding jitter) are shown as filled markers. Green markers indicate
correct responses and red markers indicate incorrect responses. (B)Example dataset for the staircase condition, belonging to a participantin the KS1 group. As above, green markers indicate correct responsesand red markers indicate incorrect responses. (C) Psychometric functionfit to an example dataset for the MCS condition, in which the proportionof correct responses is plotted for each speed difference between thecomparison and reference stimulus
1316 Atten Percept Psychophys (2018) 80:1311–1324

as expected, a Kruskal-Wallis H test showed significant differ-ences in catch trial errors between the age groups, χ2(2) = 23.38,p < .001. Follow-up comparisons showed that the KS1 childrenmade more errors in catch trials than the KS2 children, Mann-Whitney U = 360.50, p = .003 (KS1 mean rank: 43.37; KS2mean rank: 29.24), and that the KS2 children made more errorsthan the adults,Mann-Whitney U = 240.00, p = .009 (KS2meanrank: 32.85; adult mean rank: 22.63). These errors occurredthroughout the testing session, and were not confined only toearlier or later trials (Fig. 3B). There was some indication thaterrors increased in the final 81–96 trials, but it is worth notingthat these trials were only present in the MCS condition.
Speed discrimination threshold estimates
Figure 4 shows individual threshold estimates for each methodacross age groups. The child groups showed higher inter-subjectvariability than the adult groups, as expected. To determine
whether similar threshold estimateswere obtained for the differentprocedures, and whether the effect of procedure varied across agegroups, we conducted a two-way mixed ANOVA on log thresh-old estimates, with age group as a between-participants factor andprocedure as a within-participants factor. First, we looked atthreshold estimates obtained when fitting psychometric functionsto the datasets obtained from each procedure (Fig. 4). A prelim-inary analysis showed that there were no age-group differences inthe reliability of individual threshold estimates, normain effects orinteractions with method, as indexed by the cumulative probabil-ity deviance estimates (p > .05). As expected, we found signifi-cant age-related improvements in threshold estimates, F(2,67) =9.34, p < .001, ηp
2 = .22. Planned contrasts showed that theyounger, KS1 children (M = 1.57 °/s, 95% CI 1.31–1.85) hadsignificantly higher threshold estimates than the older, KS2 chil-dren (M = 1.02 °/s, 95% CI .83–1.23), p = .001, but the KS2children did not differ significantly from adults (M = .77 °/s, 95%CI .50–1.08), p = .17. There was also a significant effect of
Fig. 3 Responses to catch trials. (A) The proportion of errors made in 16catch trials by each participant in KS1 (green; 6–7 years), KS2 (orange;7–9 years) and adult (purple) groups for each threshold estimationmethod. Note that values are jittered on the x- and y-axis for displaypurposes. (B) The distribution of errors made across the experimental
session. The proportion of errors made in catch trials occurring in eachof six bins of trials is shown, pooled across participants and thresholdestimation method (i.e., number of errors/total number of catch trials).Note that trials in the final bin (81–96) represent trials in the MCScondition only
Fig. 4 Threshold estimates.Threshold estimates for KS1(green; 6–7 years), KS2 (orange;7–9 years) and adult (purple)groups for each thresholdestimation method. Box plotsshow the median, 25th, and 75thpercentiles of estimates, and thewhiskers extend up to 1.5 timesthe interquartile range. Box widthis proportional to the square-rootof the number of points in eachgroup. Note that data are shownhere on a linear scale, but wereanalyzed in log units to minimizethe effect of the positive skew
Atten Percept Psychophys (2018) 80:1311–1324 1317

condition, F(2,134) = 4.65, p = .01, ηp2 = .07, whereby the
threshold estimates obtained in the QUEST condition (M = .93°/s, 95% CI .75–1.12) were lower than those obtained in both thestaircase (M= 1.19 °/s, 95%CI .98–1.41, p= .01) andMCS (M=1.20 °/s, 95% CI 1.04–1.37, p = .01) conditions. The interactionbetween age group and condition was not significant, F(4,134) =2.20, p = .07, ηp
2 = .06. There were significant relationshipsbetween the threshold estimates in each condition, using partialcorrelations to control for age (QUESTand staircase: r(67) = .53,p < .001; QUEST and MCS: r(67) = .36, p = .002; staircase andMCS: r(67) = .53, p < .001). In sum, threshold estimates obtainedfrom post-hoc fitting of psychometric functions reveal age-relatedchanges across all procedures, although lower threshold estimatesare obtained in the QUEST condition.
Next, we compared the different ways of estimating thresh-olds from the QUEST. Unsurprisingly, the threshold estimatesobtained from post-hoc fitting of the psychometric functionwere significantly correlated with the average QUEST mode,while controlling for age, r(67) = .67, p < .001. A mixedANOVAwith estimation method as a within-participants factorand age group as a between-participants factor revealed differ-ences between the age groups, F(2,67) = 5.24, p = .008, ηp
2 =.14, as before. The younger, KS1 children (M = 1.73 °/s, 95%CI 1.41–2.07) had higher threshold estimates than the older,KS2 children (M = 1.34 °/s, 95% CI 1.09–1.63), although thiswas not significant, p = .07, and the KS2 children had non-significantly higher threshold estimates than the adults (M =.91 °/s, 95% CI .58–1.31, p = .07). The source of significantdifference between the groups appeared to result from the KS1children having significantly higher threshold estimates than theadults, p = .002. We also found a significant difference betweenestimation methods, F(1,67) = 88.02, p < .001, ηp
2 = .57, withthe QUEST mode leading to higher threshold estimates (M =1.75 °/s, 95% CI 1.52–2.00) than those derived from the post-hoc fitting of a psychometric function (M= .93 °/s, 95%CI .75–1.12). There was no significant interaction between age groupand estimation method, F(2,67) = .48, p = .62, ηp
2 = .01.Finally, we compared the different ways of estimating thresh-
olds from the staircase (fitting a psychometric function vs. theaverage of reversals). Note that the average reversals could notbe computed for one child (see Data Analysis), so this analysiswas conducted on a sample of 25 KS1 children, 32 KS2 childrenand 12 adults. The two types of threshold estimate were signif-icantly correlated, while controlling for age, r(66) = .86, p< .001.A mixed ANOVA comparing threshold estimates from the twomethods revealed a significant difference in threshold estimatesbetween age groups, F(2,66) = 12.44, p < .001, ηp
2 = .27, withhigher threshold estimates in the younger, KS1 children (M =2.00 °/s, 95% CI 1.63–2.42) than the older, KS2 children (M =1.07 °/s, 95% CI .83–1.34, p < .001), but no significant differ-ence between the KS2 children and the adults (M = .80 °/s, 95%CI .45–1.20, p = .23). The staircase average of reversals (M =1.29 °/s, 95% CI 1.10–1.50) yielded slightly higher threshold
estimates than fitting the psychometric function (M = 1.20,95% CI .99–1.42), but this difference was not significant,F(1,66) = 2.45, p = .12, ηp
2 = .04, and there was no significantinteraction between condition and age group,F(2,66) = 1.36, p =.27, ηp
2 = .04. Together, these analyses suggest that the resultingthreshold estimates from adaptive techniques led to slightlyhigher threshold estimates than post-hoc fitting of the psycho-metric function, although this difference was only significant forthe QUEST condition. However, age-related changes were ap-parent regardless of the threshold estimation technique chosen.
The relationship between catch trial performanceand threshold estimates
To investigate the possible relationship between catch trial per-formance and threshold estimates, we computed the averagecatch trial error rate for each participant (across conditions)and conducted non-parametric correlations between this valueand threshold estimates while controlling for age. Participantswith higher error rates showed significantly higher thresholdestimates for all procedures (QUEST psychometric function:rs(67) = .27, p = .03; staircase psychometric function: rs(67) =.28, p = .02;MCS psychometric function: rs(67) = .36, p = .003;staircase average of reversals: rs(66) = .32, p = .008) apart fromthe QUEST average mode, rs(67) = .20, p = .10, which did notreach significance. Additionally, to test if catch trial error ratesaffected our three procedures differently, we divided participantsinto groups of those who made no errors in any procedure (n =35) and those who made errors in one or more procedure (n =35). We then ran a mixed ANOVA on threshold estimates ob-tained with psychometric functions with procedure as a within-participants factor, error group as a between-participants factorand age as a covariate. This analysis again showed that thresh-old estimates were higher with higher error rates, with higherthreshold estimates in those who responded incorrectly in one ormore catch trials (M = 1.37 °/s, 95% CI 1.15–1.60) than thosewho did not (M = .97 °/s, 95%CI .79–1.18), F(1,67) = 6.55, p =.01, ηp
2 = .09. However, the effect of error group did not interactwith the procedure used, F(2,134) = .45, p = .64, ηp
2 = .01.Further ANOVAs were conducted to confirm that the effect oferror group did not vary between the two QUEST thresholdestimation techniques and the two staircase threshold estimationtechniques (group by procedure interactions: p ≥ .57).
Simulations
Our empirical data suggest that there is a relationship betweenperformance in Beasy^ catch trials and threshold estimates.However, it is difficult to fully equate the proportion of errorsin catch trials to the lapse rate, as high error rates could alsoreflect other factors, such as extreme difficulty with the task(although note that all participants passed a criterion of con-secutive responses in the practice phase), forgetting the
1318 Atten Percept Psychophys (2018) 80:1311–1324

response strategy, or generally reduced motivation across theboard. Moreover, the number of catch trials had to be kept lowto avoid overly long testing time, so it is possible that childrenresponding correctly to catch trials made lapses at other pointsthroughout the session. Simulations allowed us to more clear-ly investigate the effects of attentional lapses, by assessing theeffect of random responses on occasional trials, with a knownthreshold that was held constant. Therefore, we could addresswhether increased lapse rates could explain the age-relateddifferences in threshold estimates obtained in our participants.
These simulations assessed the effects of differing lapse rateson threshold estimates on a simulated observer, using the sametask parameters and threshold estimation procedures as for theyoungest, KS1 children (Fig. 5). Table 1 shows that relativelymore simulated datasets were excluded from the staircase meth-od than the other techniques, which was also apparent in ourempirical datasets. As expected, threshold estimates increasedwith increasing lapse rates for all methods, becoming furtherfrom the true threshold, and became more variable. These sim-ulations therefore demonstrate that increased lapses can causeincreased threshold estimates. First, we considered whether theeffect of increasing lapse rates differentially affected the variousmethods, potentially explaining the different threshold estimatesobtained in our experimental data (Fig. 4). While our mainanalysis may have lacked power to detect such differences dueto low lapse rates, simulations do not suffer from this drawback.
In our experimental data, we found that lower threshold es-timates were obtained from psychometric functions fit to thedata obtained with the QUEST, compared to the staircase andMCS procedures. In the simulations, there was no evidence for
this effect. Instead, the MCS threshold estimates were lowerthan staircase and QUEST for low levels of lapse rate (0–0.15) and the staircase threshold estimates were lowest at higherlevels of lapse (0.2–0.4). Generally, the difference between pro-cedures became more pronounced at higher levels of lapse rate.For example, the QUESTand staircase estimates were separatedby only 0.01 °/s at a lapse rate of 0, but by 0.15 °/s at a lapse rateof 0.4, and the staircase and MCS methods were separated by0.03 °/s at a lapse rate of 0 and 0.19 °/s at a lapse rate of 0.4.
As in our experimental data, the thresholds estimated usingthemode of the QUEST posterior distribution were considerablyhigher than the thresholds estimated with post-hoc fitted psycho-metric functions, and this was true for all levels of lapse rate.Follow-up simulations showed that the difference was largelydue to the slope of the Weibull function (beta value) assumedby the QUEST function (Supplemental Material). However,these simulations also showed that, regardless of the slope valueused, QUEST mode was considerably more affected by increas-ing lapse rates than the same data refitted with a psychometricfunction (Supplemental Material). The staircase average of re-versals also led to slightly higher threshold estimates than thoseobtained from the psychometric functions, which was a non-significant trend in the experimental data, and could potentiallybe attributed to too few staircase reversals (Witton et al., 2017)and/or a suboptimal ratio of stepsize to slope (spread) of theobserver’s psychometric function (García-Pérez, 2011). For theQUEST procedure, the QUEST mode estimate was 0.19 °/shigher than the threshold estimated from the psychometric func-tion at a lapse rate of 0, and this steadily increased to a differenceof 2.57 °/s for a lapse rate of 0.4. The discrepancy in staircaseestimates was relatively less affected by lapse rate, but increasedsteadily from 0.06 °/s at a lapse rate of 0 to 0.56 °/s at the highestlapse rate tested (0.4). In sum, our simulation results suggest thatincreased attentional lapses exaggerate discrepancies in thresholdestimates. The QUEST mode appears to be particularly affectedby increased lapse rates, with the largest increases in bias.
We considered two possibilities that might have accountedfor the reduced bias in threshold estimates obtained from fittinga psychometric function compared to the QUEST mode orstaircase average reversals. First, it is possible that post-hocfitting of the psychometric function led to less biased thresholdestimates with increasing lapses because lapse rate was a freeparameter (allowed to vary between 0 and 0.1) in the fitting ofthe psychometric function. However, even when the psycho-metric functions were fit with the lapse rate fixed at zero, thresh-old estimates were less biased than the staircase average ofreversals and QUEST mode (see Supplemental Material).Second, it could be that the reduction of bias associated withpost-hoc fitting of a psychometric function is contingent on theinclusion of catch trials in the fitting procedure. However, addi-tional simulations showed that the thresholds estimated frompost-hoc fitting of the psychometric function were less biasedthan the QUEST mode and average of staircase reversals even
Fig. 5 The effect of increasing lapse rates on a simulated observer. Theeffect of increasing lapse rates on the threshold estimates of a simulatedobserver with a true threshold of .97 °/s. 2,000 simulations were run foreach lapse rate and for each of the three procedures (QUEST, staircase,MCS). Thresholds were estimated with identical parameters andexclusion criteria as the experimental data. For each lapse rate, themedian threshold estimate is plotted with 95% bootstrapped confidenceintervals around the median. PF psychometric function
Atten Percept Psychophys (2018) 80:1311–1324 1319

when the catch trials were removed and replaced with extratrials in the adaptive tracks (see Supplemental Material).Therefore, the benefit of fitting psychometric functions is notdependent on either of these factors.
As shown in Fig. 3, most participants made no errors in the16 catch trials, and those who did make errors generally madeonly one or two errors (corresponding to a lapse rate of 12.5%and 25%, respectively). Figure 5 shows that even low lapserates can bias threshold estimates, but the magnitude of thisbias is relatively small, particularly when fitting psychometricfunctions. Specifically, the increase in threshold estimates ob-tained from psychometric functions between a lapse rate of 0and a lapse rate of 0.25 was .19 °/s, .18 °/s, and .26 °/s for theQUEST, staircase, and MCS, respectively. In contrast, age-related differences in speed discrimination threshold estimatesfar exceed this value, with adults having thresholds on average0.8 °/s lower than KS1 children. Thus, the effect of lapsing on25% of trials is about a quarter of the developmental age effect.We therefore reason that developmental changes in speed dis-crimination threshold estimates are unlikely to be fully attrib-utable to differences in attentiveness, and are likely to reflect, atleast in part, real changes in perceptual abilities with age.
Discussion
In this study, we estimated speed discrimination thresholds inchildren (KS1: 6–7 years; KS2: 7–9 years) and adults, usingQUEST, staircase, and MCS procedures. We used the propor-tion of errors on catch trials as a coarse measure of inatten-tiveness. As expected, both child groupsmademore catch trialerrors compared to adults, and these errors occurred through-out the test session. Individuals with higher catch trial errorrates generally had higher threshold estimates. Lower thresh-old estimates (higher sensitivities) were obtained, overall,from psychometric functions in the QUEST condition thanthe staircase and MCS conditions. Additionally, lower thresh-old estimates were obtained when refitting a psychometricfunction to the QUEST data than when using the QUESTmode. Importantly, however, developmental improvements
in speed discrimination threshold estimates were apparentacross all psychophysical procedures used, with no significantinteractions between age group and procedure. We also inves-tigated whether differences between threshold estimationtechniques could be explained by differential effects of atten-tional lapses. We found that threshold estimates were particu-larly elevated away from the true threshold as a function ofincreasing lapses when using the QUEST mode or average ofstaircase reversals, compared to thresholds estimated whenfitting a psychometric function to the data, post-hoc.
The fact that some threshold estimation techniques aremore affected by lapses than others could partly explain thediscrepant threshold estimates obtained in our experimentaldata. For example, attentional lapses could contribute to par-ticularly elevated threshold estimates obtained from theQUEST mode, while thresholds estimated based on fittingpsychometric functions to the same data remain closer to thetrue threshold. However, in this case, lapses cannot fullyexplain the observed differences between QUEST thresholdestimates, because our simulations showed differences evenwhen the simulated observer had a zero lapse rate, whichappeared to arise due to the choice of slope (beta) parameterused in the QUEST function. Nonetheless, nonzero lapserates exacerbate differences between the threshold estima-tion techniques. Notably, we did not observe any significantinteractions between threshold estimation technique and agegroup in our experimental data, which we would have ex-pected given that (a) children had more frequent catch trialerrors than adults, suggesting increased attentional lapses,and (b) lapses have differential effects on threshold estima-tion techniques. The absence of significant interaction ef-fects could be a result of low power, especially if most chil-dren made few attentional lapses. Additionally, the findingthat psychometric functions yielded lower threshold esti-mates in the QUEST condition than the staircase and MCSconditions in the experimental data was not borne out in thesimulated datasets at any level of lapse rate, suggesting thatthe patterns observed in our behavioral data could not beexplained by a differential effect of attentiveness on thesethree methods.
Table 1 Percentage (%) of simulated datasets excluded for different levels of lapse rate
Lapse rate
Method 0 0.05 0.1 0.15 0.2 0.25 0.3 0.35 0.4
QUEST PF 0 0 0 0.2 0.8 1.3 2.4 4.9 8.6
Staircase PF 5.6 3.9 4.6 4.0 5.6 7.7 10.4 13.6 16.9
MCS PF 0 0 0.1 0.1 0.6 1.2 1.9 3.1 5.9
QUEST mode 0 0 0 0 0.2 0.5 0.7 1.9 3.9
Staircase Avg. Reversals 2.2 1.8 2.2 2.7 2.0 2.7 1.7 1.8 1.3
Note. Simulations were excluded if the threshold estimate fell outside of the stimulus range and/or if negative psychometric function slopes wereobtained, or if too few staircase reversals were obtained in the staircase average of reversals condition
1320 Atten Percept Psychophys (2018) 80:1311–1324

Our finding that thresholds estimated after fitting psycho-metric functions are more immune to attentional lapses thanthreshold estimates obtained at the end of adaptive tracks(QUEST mode, average of staircase reversals) supportsDakin and Frith’s (2005) recommendation to fit the wholepsychometric function when testing populations for whomattentional lapses might be elevated. Fitting the psychometricfunction allows the lapse rate to be modelled, as we did hereby setting the lapse rate to be a free parameter between 0 and0.10. However, evenwhen this lapse rate parameter was fixed,fitting psychometric functions led to less biased threshold es-timates than the QUEST mode or staircase average of rever-sals – perhaps because it allows for differences in psychomet-ric function slope. Rather than solely recommending MCS forfitting psychometric functions (cf. Dakin & Frith, 2005), weshow that the same principle can be achieved by fitting apsychometric function to the data from adaptive methods, assuggested by Hall (1981; Amitay et al., 2006). This approachhas a clear benefit that the researcher does not have to committo a set of testing values in advance – which might be partic-ularly difficult if the researcher does not have previous studiesto knowwhat range of values to expect, and/or if there is muchbetween-participants variability.
The difference in threshold estimates for different psycho-physical procedures found here contrasts with Buss et al.(2001), who showed that comparable threshold estimates wereobtained across three procedures for children aged 6–11 yearsand adults. However, there are numerous differences betweenBuss et al.’s study and the current study, four of which weconsider here. First, Buss et al. compared different proceduresto those compared here (a 1-up 3-down staircase, a MLE pro-cedure and MCS), and while Buss et al. used between threeand four adaptive tracks, we used only two. Second, Busset al. used an auditory detection task with feedback, as op-posed to the visual discrimination task without feedbackemployed here. Third, Buss et al. used a three-alternative-forced choice procedure as opposed to our two-alternative-forced-choice procedure, thus tracking a higher level of per-formance. Finally, we saw a larger sample of children withnarrower age groups. More research is needed to investigatethe importance of each of these differences and how theyinteract. It has been suggested that better threshold estimatesare achieved with three or more alternatives, compared to twoalternatives, both in adults (Jäkel & Wichmann, 2006;Kollmeier et al., 1988; Leek et al., 1992; Leek, 2001;Shelton & Scarrow, 1984) and children (Buss et al., 2012;Sutcliffe & Bishop, 2005), which could explain the discrep-ancy in results. However, two-alternative and three-alternativemethods have not been compared directly in the visual domainin children.
It remains unclear why we obtained lower threshold esti-mates from psychometric functions in the QUEST conditioncompared to the staircase and MCS procedures in our
observers, but not in the simulated datasets. We haveestablished that it cannot be due to differential effects of at-tentional lapses, as the staircase yielded the lowest thresholdestimates at high levels of lapse rate in the simulated datasets.However, there could be additional factors that affect a realobserver, which are not taken into account by the simulations.Indeed, there are previous reports of lower threshold estimatesin adaptive procedures thanMCS procedures, even when sim-ulation studies suggest that similar threshold estimates shouldbe obtained (Kollmeier et al., 1988; Stillman, 1989; Tayloret al., 1983; see also Leek, 2001, for review). In QUEST, thepresentation of trials is dependent on performance, whereasthis is not the case for MCS, where there may be too manyeasy and/or difficult trials for a given observer (depending onthe levels of signal strength chosen), potentially leading toreduced motivation. However, it is less apparent whyQUEST might lead to improved performance compared to thestaircase, which is also an adaptive procedure. Perhaps the use ofjitter in the QUEST meant that a greater range of trial intensitieswere presented compared to that in the staircase method, reduc-ing boredom and/or providing reminders of the cue. Other fac-tors, such as nonstationary thresholds (Fründ et al., 2011; Hall,1983; Leek et al., 1991; Taylor et al., 1983; Wallis et al., 2013)and response biases (e.g., a preference to respond Bfaster^ for acertain stimulus location or interval, or to alternate responses[Tune, 1964; Raviv et al., 2014]; serial inter-trial dependencies(Baird, Green, & Luce, 1980; Fründ, Wichmann, & Macke,2014; Fischer & Whitney, 2014; Green, Luce, & Duncan,1977; Jones, Moore, Shub, & Amitay, 2015a; Stewart, Brown,& Chater, 2002) could also differentially impact the variouspsychophysical procedures, although this was beyond the scopeof the current research. Additional factors such as the startingpoint for adaptive tracks (Leek, Hanna, & Marshall, 1992) mayalso affect the performance of an observer in a way that was notcaptured by our simulations.
Although inappropriate choices of QUEST slope (beta)values can lead to biased threshold estimates, our data showthat estimating thresholds through post-hoc psychometricfunction fitting minimizes this effect. This is important be-cause children vary from adults in the slope of their psycho-metric functions (Buss et al., 2009), and it may be difficult toselect a single QUEST slope value that is appropriate for allobservers. Similarly, bias in the average of staircase reversals,which has been shown to be introduced by an inappropriateratio of stepsize to observer’s slope (García-Pérez, 2011), canbe minimized significantly by fitting the same data with apsychometric function. These findings are in line with theoverall conclusion that fitting psychometric functions of effi-cient adaptive methods is a powerful approach that yieldshighly robust results – provided that lapse rates are within areasonable range (< 20%). Although rarely used with child pop-ulations, adaptive procedures that estimate both the threshold andslope of the psychometric function (Brand & Kollmeier, 2002;
Atten Percept Psychophys (2018) 80:1311–1324 1321

King-Smith & Rose, 1997; Kontsevich & Tyler, 1999; Shen &Richards, 2012)may also confer benefits for child observers withvariable slopes. However, it will be necessary to weigh suchbenefits against the cost of increased test durations which arelikely to be detrimental in populations with limited attention(Jones, Kalwarowsky, Braddick, Atkinson, & Nardini, 2015b).
Overall, we have shown that attentional lapses are morecommon in children than adults and that this leads to biasedthreshold estimates, especially for methods that do not fit apsychometric function to the data. Additionally, differencesbetween methods become more pronounced when lapse ratesare higher. Particularly high lapse rates (and therefore moreinaccurate threshold estimates) could be obtained in studieswhich use tasks that are less engaging and motivating for childobservers, and in studies of children with developmental con-ditions, for whom attentional difficulties have been reported(for reviews, see Amso & Scerif, 2015; Cornish et al., 2012).Indeed, future research is needed to consider the effects ofinattention on threshold estimates in atypically developinggroups, to ensure that reports of reduced sensitivity comparedto typically developing children do not arise purely due to ahigher proportion of attentional lapses (see Roach et al., 2004;Skottun & Skoyles, 2007; Sutcliffe et al., 2006).
While we used speed discrimination in this study as anexample task to assess the influence of attentional lapses onperceptual performance across methods, we can also gaininsights to further our understanding of the development ofchildren’s speed discrimination abilities. We demonstratedthat attentional lapses can cause thresholds to beunderestimated, as shown previously (e.g., Kingdom &Prins, 2010; Madigan & Williams, 1987), and our experi-mental catch trial data suggest that attentional lapses arehigher in young children. However, most children madeno errors in catch trials, suggesting low lapse rates. Lowlapse rates lead to biases that are considerably smaller thanthe age-related changes in threshold estimates reported. Inaddition, developmental changes in speed discriminationthresholds were evident regardless of the psychophysicalprocedure chosen. Therefore, it appears that developmentalchanges in speed discrimination threshold estimates cannotbe fully attributable to differences in attentiveness betweenchildren and adults, or differences in procedures, and thuslikely reflect, at least in part, real age-related changes inperceptual abilities.
On the basis of our experimental and simulated data, werecommend fitting a psychometric function to estimate thresh-olds, especially if it is suspected that lapses might be elevated,as in children or clinical groups. We have shown that this is afeasible strategy even for data collected with adaptive proce-dures like QUEST and staircases. The inclusion of catch trialsprovides a coarse but useful measure of attentiveness, al-though the benefits of fitting psychometric functions can beobtained even without their inclusion.
Acknowledgements We are grateful to the schools and families whoparticipated in this study, to Janina Brede and Rebecca McMillin for helpwith data collection and Dr Paul Thompson for statistical advice. CMwassupported by an Economic and Social Research Council (ESRC) PhDstudentship, a Scott Family Junior Research Fellowship at UniversityCollege, Oxford and a Sir Henry Wellcome Postdoctoral Fellowship,204685/Z/16/Z. Research at CRAE is supported by The Clothworkers’Foundation and Pears Foundation. PRJ was supported by the NIHRBiomedical Research Centre at (both) Moorfields Eye Hospital and theUCL Institute of Ophthalmology.
References
Ahmed, I. J., Lewis, T. L., Ellemberg, D., & Maurer, D. (2005).Discrimination of speed in 5-year-olds and adults: Are children upto speed? Vision Research, 45, 2129-2135.
Alcalá-Quintana, R. & García-Pérez, M. A. (2004). The role of paramet-ric assumptions in adaptive Bayesian estimation. Psychologicalmethods, 9, 250-271.
Amitay, S., Irwin, A., Hawkey, D. J. C., Cowan, J. A., & Moore, D. R.(2006). A comparison of adaptive procedures for rapid and reliablethreshold assessment and training in naive listeners. Journal of theAcoustical Society of America, 119(3), 1616-1625.
Amso, D., & Scerif, G. (2015). The attentive brain: insights from devel-opmental cognitive neuroscience. Nature Reviews Neuroscience,16(10), 606.
Baird, J. C., Green, D. M., & Luce, R. D. (1980). Variability and sequen-tial effects in cross-modality matching of area and loudness. Journalof Experimental Psychology: Human Perception and Performance,6(2), 277.
Brainard, D. H. (1997). The Psychophysics Toolbox. Spatial Vision, 10,433-436.
Brand, T., & Kollmeier, B. (2002). Efficient adaptive procedures forthreshold and concurrent slope estimates for psychophysics andspeech intelligibility tests. Journal of the Acoustical Society ofAmerica, 111(6), 2801-2810.
Buss, E., Hall III, J.W., &Grose, J. H. (2009). Psychometric functions forpure tone intensity discrimination: slope differences in school-agedchildren and adults. The Journal of the Acoustical Society ofAmerica, 125(2), 1050-1058.
Buss, E., Hall III, J. W., & Grose, J. H. (2012). Development of auditorycoding as reflected in psychophysical performance Human auditorydevelopment (pp. 107-136): Springer.
Buss, E., Hall, J. W., Grose, J. H., & Dev, M. B. (2001). A comparison ofthreshold estimation methods in children 6-11 years of age. Journalof the Acoustical Society of America, 109(2), 727-731.
Cornish, K., Steele, A., Monteiro, C. R. C., Karmiloff-Smith, A., &Scerif, G. (2012). Attention deficits predict phenotypic outcomesin syndrome-specific and domain-specific ways. Frontiers inPsychology, 3.
Dakin, S., & Frith, U. (2005). Vagaries of visual perception in autism.Neuron, 48, 497-507.
Fischer, J., &Whitney, D. (2014). Serial dependence in visual perception.Nature Neuroscience, 17(5), 738-743.
1322 Atten Percept Psychophys (2018) 80:1311–1324
Open Access This article is distributed under the terms of the CreativeCommons Attribution 4.0 International License (http://creativecommons.org/licenses/by/4.0/), which permits unrestricted use, distribution, andreproduction in any medium, provided you give appropriate credit tothe original author(s) and the source, provide a link to the CreativeCommons license, and indicate if changes were made.

Fründ, I., Haenel, N. V., & Wichmann, F. A. (2011). Inference for psy-chometric functions in the presence of nonstationary behavior.Journal of Vision, 11(6), 16-16.
Fründ, I.,Wichmann, F. A., &Macke, J. H. (2014). Quantifying the effectof intertrial dependence on perceptual decisions. Journal of Vision,14(7), 9-9.
García-Pérez, M. A. (2011). A cautionary note on the use of the adaptiveup-down method. The Journal of the Acoustical Society of America,130(4), 2098-2107.
Green, D. M. (1993). A maximum-likelihood method for estimatingthresholds in a yes–no task. The Journal of the Acoustical Societyof America, 93, 2096.
Green, D. M., Luce, R. D., & Duncan, J. E. (1977). Variability andsequential effects in magnitude production and estimation of audi-tory intensity. Perception & Psychophysics, 22(5), 450-456.
Green, D. M. & Swets, J. A. (1974). Signal detection theory andpsychophysics. Huntington, NY: RF Krieger.
Gu, X., & Green, D. M. (1994). Further studies of a maximum-likelihoodyes–no procedure. The Journal of the Acoustical Society of America,96(1), 93-101.
Hadad, B.-S., Maurer, D., & Lewis, T. L. (2011). Long trajectory for thedevelopment of sensitivity to global and biological motion.Developmental Science, 14(6), 1330-1339.
Hall, J. (1983). A procedure for detecting variability of psychophysicalthresholds. The Journal of the Acoustical Society of America, 73(2),663-667.
Hall, J. L. (1981). Hybrid adaptive procedure for estimation of psycho-metric functions. The Journal of the Acoustical Society of America,69(6), 1763-1769.
Halliday, L. F., Taylor, J. L., Edmondson-Jones, A. M., & Moore, D. R.(2008). Frequency discrimination learning in children. The Journalof the Acoustical Society of America, 123(6), 4393-4402.
Hayward, J., Truong, G., Partanen, M., & Giaschi, D. (2011). Effects ofspeed, age, and amblyopia on the perception of motion-definedform. Vision Research, 51(20), 2216-2223.
Jäkel, F., & Wichmann, F. A. (2006). Spatial four-alternative forced-choice method is the preferred psychophysical method for naïveobservers. Journal of Vision, 6(11), 13-13.
Jensen, J. K., & Neff, D. L. (1993). Development of basic auditory dis-crimination in preschool children. Psychological Science, 4(2), 104-107.
Jones, P. R., Moore, D. R., Shub, D. E., & Amitay, S. (2015a). The role ofresponse bias in perceptual learning. Journal of ExperimentalPsychology: Learning, Memory, and Cognition, 41(5), 1456.
Jones, P. R., Kalwarowsky, S., Braddick, O. J., Atkinson, J., & Nardini,M. (2015b). Optimizing the rapid measurement of detection thresh-olds in infants. Journal of Vision, 15(11), 2.
King-Smith, P. E., Grigsby, S. S., Vingrys, A. J., Benes, S. C., & Supowit,A. (1994). Efficient and unbiased modifications of the QUESTthreshold method: Theory, simulations, experimental evaluationand practical implementation. Vision Research, 34(7), 885-912.
King-Smith, P. E., & Rose, D. (1997). Principles of an adaptive methodfor measuring the slope of the psychometric function. VisionResearch, 37, 1595-1604.
Kingdom, F. A. A., & Prins, N. (2010). Psychophysics: A PracticalIntroduction. London: Elsevier.
Kleiner, M., Brainard, D. H., & Pelli, D. G. (2007). What's new inPsychtoolbox-3? Perception, 36(ECVPAbstract Supplement).
Kollmeier, B., Gilkey, R. H., & Sieben, U. K. (1988). Adaptive staircasetechniques in psychoacoustics: A comparison of human data and amathematical model. The Journal of the Acoustical Society ofAmerica, 83(5), 1852-1862.
Kontsevich, L. L. & Tyler, C. W. (1999). Bayesian adaptive estimation ofpsychometric slope and threshold. Vision Research, 39(16), 2729-2737.
Leek, M. R. (2001). Adaptive procedures in psychophysical research.Perception & Psychophysics, 63(8), 1279-1292.
Leek, M. R., Dubno, J. R., He, N.-J., & Ahlstrom, J. B. (2000).Experience with a yes–no single-interval maximum-likelihood pro-cedure. The Journal of the Acoustical Society of America, 107(5),2674-2684.
Leek, M. R., Hanna, T. E., &Marshall, L. (1991). An interleaved trackingprocedure to monitor unstable psychometric functions. The Journalof the Acoustical Society of America, 90(3), 1385-1397.
Leek, M. R., Hanna, T. E., & Marshall, L. (1992). Estimation of psycho-metric functions from adaptive tracking procedures. Perception &Psychophysics, 51(3), 247-256.
Levitt, H. (1971). Transformed up-down methods in psychoacoustics.The Journal of the Acoustical Society of America, 49(2B), 467-477.
Macmillan, N. A., & Creelman, C. D. (1991). Detection theory: A user'sguide. Cambridge: Cambridge University Press.
Madigan, R., &Williams, D. (1987). Maximum-likelihood psychometricprocedures in two-alternative forced-choice: Evaluation and recom-mendations. Perception & Psychophysics, 42(3), 240-249.
Manning, C., Aagten-Murphy, D., & Pellicano, E. (2012). The develop-ment of speed discrimination abilities. Vision Research, 70, 27-33.
Manning, C., Dakin, S. C., Tibber, M. S., & Pellicano, E. (2014).Averaging, not internal noise, limits the development of coherentmotion processing. Developmental Cognitive Neuroscience, 10,44-56.
Maxon, A. B., & Hochberg, I. (1982). Development of psychoacousticbehavior: Sensitivity and discrimination. Ear and Hearing, 3(6),301-308.
McArthur, G. M., & Hogben, J. H. (2012). Poor auditory task scores inchildren with specific reading and language difficulties: some poorscores are more equal than others. Scientific Studies of Reading,16(1), 63-89.
Nardini, M., Bedford, R., & Mareschal, D. (2010). Fusion of visual cuesis not mandatory in children. Proceedings of the National Academyof Sciences, 107(39), 17041-17046.
Pelli, D. G. (1987). The ideal psychometric procedure. InvestigativeOphthalmology & Visual Science, 28(Suppl), 366.
Pelli, D. G. (1997). TheVideoToolbox software for visual psychophysics:Transforming numbers into movies. Spatial Vision, 10, 437-442.
Prins, N. (2012). The psychometric function: The lapse rate revisited.Journal of Vision, 12(6), 25.
Raviv, O., Lieder, I., Loewenstein, Y., & Ahissar, M. (2014).Contradictory behavioral biases result from the influence of paststimuli on perception. PLoS Computational Biology, 10(12),e1003948.
Roach, N. W., Edwards, V. T., & Hogben, J. H. (2004). The tale is in thetail: An alternative hypothesis for psychophysical performance var-iability in dyslexia. Perception, 33(7), 817-830.
Rueda, M. R., Fan, J., McCandliss, B. D., Halparin, J. D., Gruber, D. B.,Lercari, L. P., & Posner, M. I. (2004). Development of attentionalnetworks in childhood. Neuropsychologia, 42(8), 1029-1040.
Shelton, B. R., Picardi, M. C., & Green, D. M. (1982). Comparison ofthree adaptive psychophysical procedures. Journal of the AcousticalSociety of America, 71(6), 1527-1533.
Shelton, B. R., & Scarrow, I. (1984). Two-alternative versus three-alternative procedures for threshold estimation. Perception &Psychophysics, 35(4), 385-392.
Shen, Y., & Richards, V. M. (2012). A maximum-likelihood procedurefor estimating psychometric functions: Thresholds, slopes, andlapses of attention. Journal of the Acoustical Society of America,132(2), 957-967.
Skottun, B. C., & Skoyles, J. (2007). Dyslexia: Sensory deficits or inat-tention? Perception, 36(7), 1084-1088.
Stevenson, R. J., Mahmut, M., & Sundqvist, N. (2007). Age-relatedchanges in odor discrimination. Developmental Psychology, 43(1),253-260.
Atten Percept Psychophys (2018) 80:1311–1324 1323

Stewart, N., Brown, G. D., & Chater, N. (2002). Sequence effects incategorization of simple perceptual stimuli. Journal ofExperimental Psychology: Learning, Memory, and Cognition,28(1), 3.
Stillman, J. A. (1989). A comparison of three adaptive psychophysicalprocedures using inexperienced listeners. Perception &Psychophsics, 46(4), 345-350.
Sutcliffe, P., & Bishop, D. (2005). Psychophysical design influences fre-quency discrimination performance in young children. Journal ofExperimental Child Psychology, 91, 249-270.
Sutcliffe, P. A., Bishop, D. V., Houghton, S., & Taylor, M. (2006). Effectof attentional state on frequency discrimination: a comparison ofchildren with ADHD on and off medication. Journal of Speech,Language, and Hearing Research, 49(5), 1072-1084.
Talcott, J. B., Witton, C., Hebb, G. S., Stoodley, C. J., Westwood, E. A.,France, S. J. et al. (2002). On the relationship between dynamicvisual and auditory processing and literacy skills; results from alarge primary-school study. Dyslexia, 8(4), 204-225.
Taylor, M., Forbes, S., & Creelman, C. D. (1983). PEST reduces bias inforced choice psychophysics. The Journal of the Acoustical Societyof America, 74(5), 1367-1374.
Taylor, M. M., & Creelman, C. D. (1967). PEST: Efficient estimates onprobability functions. The Journal of the Acoustical Society ofAmerica, 41, 782-787.
Treutwein, B. (1995). Adaptive psychophysical procedures. VisionResearch, 35(17), 2503-2522.
Tune, G. (1964). Response preferences: A review of some relevant liter-ature. Psychological Bulletin, 61(4), 286.
Wallis, S. A., Baker, D. H., Meese, T. S., &Georgeson,M.A. (2013). Theslope of the psychometric function and non-stationarity of thresh-olds in spatiotemporal contrast vision. Vision Research, 76, 1-10.
Watson, A. B., & Pelli, D. G. (1983). QUEST: A Bayesian adap-tive psychometric method. Perception & Psychophysics, 33(2),113-120.
Wetherill, G., & Levitt, H. (1965). Sequential estimation of points on apsychometric function. British Journal of Mathematical andStatistical Psychology, 18(1), 1-10.
Wichmann, F. A., & Hill, J. N. (2001). The psychometric function: 1.Fitting, sampling, and goodness of fit. Perception & Psychophysics,63(8), 1293-1313.
Wightman, F., & Allen, P. (1992). Individual differences in auditory ca-pability among preschool children. In L. A. Werner & E. W. Rubel(Eds.) Developmental Psychoacoustics, 113-133.
Wightman, F., Allen, P., Dolan, T., Kistler, D., & Jamieson, D. (1989).Temporal resolution in children. Child Development, 60, 611-624.
Witton, C., Talcott, J. B., & Henning, G. B. (2017). Psychophysicalmeasurements in children: challenges, pitfalls, and considerations.PeerJ, 5, e3231.
1324 Atten Percept Psychophys (2018) 80:1311–1324