pti journal - ww2.post-tensioning.orgww2.post-tensioning.org/web/ptijournal-december2012.pdf ·...
TRANSCRIPT
PTI JOURNALDecember 2012 • V. 8 • No. 2
JOURNAL OF THE POST-TENSIONING INSTITUTE
20 Structural Efficiency from a Sustainability Perspective
43 Two-Way Post-Tensioned Slabs with Bonded Tendons
Post-Tensioning in Buildings: Contribution to Sustainability


PTI JOURNAL | December 2012 1
PTI JOURNALPTI JOURNAL STAFF
EDITOR-IN-CHIEF MIROSLAV F. VEJVODA
GRAPHIC DESIGNER & EDITOR KELLI R. SLAYDEN
ADVERTISING JEFFREY D. PONDER
CAM PUBLISHING SERVICES
MANAGER BARRY M. BERGIN
EDITORS CARL R. BISCHOF
KAREN CZEDIKDENISE WOLBER
GRAPHIC DESIGNER RYAN M. JAY
EDITORIAL DATA
The PTI JOURNAL is published
semi-annually by the Post- Tensioning Institute. Original
manuscripts and reader comments on published articles are accepted pending review by the PTI Editorial Review Board.
Direct all correspondence to: Editor-in-Chief, PTI JOURNAL
Post-Tensioning Institute 38800 Country Club Drive
Farmington Hills, MI 48331 Phone: (248) 848-3184
Fax: (248) 848-3181 Web: www.post-tensioning.org
Copyright © 2012 Post-Tensioning Institute
DECEMBER 2012 • V. 8 • NO. 2
TECHNICAL PAPERS5 REHABILITATION OF UNBONDED POST-TENSIONED SLABS WITH
DIFFERENT BOUNDARY CONDITIONS UKSUN KIM, THOMAS H.-K. KANG, AND PINAKI R. CHAKRABARTI
20 STRUCTURAL EFFICIENCY FROM A SUSTAINABILITY PERSPECTIVE CAROL HAYEK AND SALEEM KALIL
26 ASSESSMENT OF SECONDARY EFFECTS IN POST-TENSIONED FLAT PLATES AMY HUFNAGEL AND THOMAS H.-K. KANG
43 TWO-WAY POST-TENSIONED SLABS WITH BONDED TENDONS KENNETH B. BONDY
PT TREASURES49 THE TOWER, 3900 WEST ALAMEDA BOULEVARD, BURBANK, CA
KENNETH B. BONDY
INDUSTRY NEWS52 PTI COMMITTEE NEWS, ACI NEWS, PTI DOCUMENTS
p. 5, Rehabilitation p. 20, Sustainability
p. 26, Secondary effects

2 December 2012 | PTI JOURNAL
BOARD OF DIRECTORS
RASHID AHMEDBRETT ALAMILLO JAMES L. BEICKER
KENNETH B. BONDY JAMES R. CAGLEY
TOMMASO CICCONE GUY CLOUTIER
SERGIO P. DALMAU MARC DUCOMMUN
RICHARD ELKINS JEFF FEITLER
TRAVIS GILPIN MARK HASELTON PAUL HOHENSEE BRUCE JENSEN
TERRY JOHNSON RATTAN L. KHOSA ANDY D. KOCHIS
CARY KOPCZYNSKI DAWN KORI
JIM LUKE
PRESIDENT LARRY KRAUSER
VICE PRESIDENT MARC KHOURY
ANDY LYNAM DAN MACLEAN
DAVID B. MARTIN ANDREW MICKLUS JR.
TED MUMFORD HARLEY NETHKEN DAVID PATTRIDGECARRICK PIERCE RUSSELL L. PRICE
JOSÉ LUIS QUINTANADANNY RAINES
STEVE ROSSDOUGLAS J. SCHLEGEL
GUIDO SCHWAGERPETE SCOPPA
TODD STEVENSBOB SWARD
BEN TNGGREG TOMLINSON
MERRILL R. WALSTAD CURTIS WOLFE JR.
EXECUTIVE DIRECTOR THEODORE L. NEFF
TECHNICAL AND
CERTIFICATION DIRECTOR MIROSLAV F. VEJVODA
MEMBER SERVICES
COORDINATOR MICHELLE J. STERN
LEAD ACCOUNTANTSTACEY A. CLEMENT
CERTIFICATION PROGRAMS COORDINATOR
TRACEY M. BALES
MARKETING COORDINATOR JEFFREY D. PONDER
EDITOR &
GRAPHIC DESIGNER KELLI R. SLAYDEN
PTI STAFF
Cover photo: Two-Way Slab with Bonded Post-Tensioning, University of Rochester, NY, courtesy of ccl, NJ, USA
CERTIFICATION ADVISORY BOARD
GUY CLOUTIERNORRIS HAYES
GREG HUNSICKERNEEL KHOSA
MARC KHOURY
CHAIR LARRY KRAUSER
TECHNICAL ADVISORY BOARD
RASHID AHMED ASIT BAXI
JAMES L. BEICKER KENNETH B. BONDY
JAMES R. CAGLEY
CHAIR CARY KOPCZYNSKI
VICE CHAIRJAMES R. CAGLEY
SECRETARY MIROSLAV F. VEJVODA
JOHN CRIGLERCAROL HAYEK
DON KLINE DOUGLAS SCHLEGEL MERRILL WALSTAD
EDGAR ZUNIGA
THOMAS MATHEWSHARLEY NETHKENMERILL WALSTADJACK WELBORN
CURTIS WOLFE JR.

PTI JOURNAL | December 2012 3
NOTES FROM THE EDITOR'S DESK
EDITORIAL
Dear Reader:We are happy to present you with the second issue of
the PTI JOURNAL published in the 2012 calendar year. The economic downturn of recent years delayed our goal to consistently publish the JOURNAL twice a year, but now we are back on our track to provide the JOURNAL semi-annually to our readers and authors. This is a great medium to share your research and significant post-tensioned structures with a wide readership in the always exciting field of post-tensioning.
“PT TREASURES”With this issue, we are starting a new column that may be
of great interest—“PT Treasures.” This column will showcase pioneering or otherwise significant structures built in the “good old days.” It is important to remind ourselves from time to time that it takes imagination and a little bit of courage to propose new methods and new applications, and to push the conventional ways just a little further. Such an approach not only provides us with great satisfaction but it also opens new opportunities and stimulates the imagination of others.
The Tower is the first project selected for this column and it is not by chance. This post-tensioned concrete tower, completed in 1988, opened up options for architects, engi-neers, and owners by demonstrating that tall post-tensioned concrete structures in the most severe seismic conditions are not only safe and superior in performance, but also econom-ical. As a result, similar structures today are becoming more common in these demanding conditions.
POST-TENSIONING IN BRIDGESPost-tensioning is the prevalent and indispensable
reinforcement used in concrete bridges, from small cast-in-place bridges to major segmental bridges. Most bridges use grouted post-tensioning tendons—both internal and external. The post-tensioning system suppliers and bridge contractors work in many states and have to adapt to the local practices and specifications that prevail in each indi-vidual state. These sometimes very different requirements make the work more difficult, may lead to interpretation difficulties, and can be more costly.
With the publication of the PTI/ASBI M50.3-12, “Guide Specification for Grouted Post-Tensioning,” an
important step was made in the direction of making the requirements more uniform across the different states. A team of PTI and ASBI, supported by the FHWA and local post-tensioning system suppliers, is presenting this new specification to the major state DOTs where most post-tensioned concrete bridges are built. This industry-initiated discussion is bringing the major stakeholders together with the common goal of improving the construction of the infrastructure. At the same time, the new edition of the PTI M55.1-12, “Specification for Grouting of Post-Tensioned Structures,” is presented and discussed, thus including all aspects of post-tensioning construction. Last but not least, the new M50.3-12 specification requires field personnel certification that goes beyond current practices. Recognizing the key role of field personnel certification, some DOTs are planning on adopting these certification requirements. Many contractors have already certified many of their workforce, as the avoidance of problems through knowledge and anticipation is the best insurance.
Miroslav F. VejvodaEditor-in-Chief
Restore PT Structures!NEW! — PTI DC80.3-12/ICRI 320.6, Guide for Evaluation and Repair of Unbonded
Post-Tensioned Concrete Structures
This publication familiarizes readers with procedures, tests, equipment, and other aspects of the evaluation and repair of post-tensioned structures.
Order in hard copy or digital format at www.post-tensioning.org/bookstore.php.

2013 PTI Convention
www.post-tensioning.org
Save the date
May 5-7, 2013 • Scottsdale, AZ
• Technical Sessions
• Committee Meetings
• Networking Events
• 2013 PTI Awards Dinner
• Industry Trade Show

PTI JOURNAL | December 2012 5
TECHNICAL PAPER
REHABILITATION OF UNBONDED POST-TENSIONED SLABS wITH
DIFFERENT BOUNDARY CONDITIONS BY UKSUN KIM, THOMAS H.-K. KANG, AND PINAKI R. CHAKRABARTI
In Phase-I, a total of six unbonded post-tensioned (PT) slab specimens were tested. Three were simply supported two-way slabs with two-way post-tensioning (Specimens PTS-1, PTS-2, and PTS-6), whereas three other one-way slabs were tested with different boundary conditions (Specimens PTS-3, PTS-4, and PTS-5). The specimens were loaded to develop extensive cracks. Each of the specimens was then repaired with carbon fiber-reinforced polymer (CFRP) sheets using two different patterns. In Phase-II, the repaired specimens (PTS-1CR, PTS-2CR, PTS-3CR, PTS-4CR, PTS-5CR, and PTS-6CR) were tested again to reach their ultimate loads. The Phase-I and Phase-II research focused on the study of cracking patterns, reinforcing bar strains, tendon stresses, as well as the pressure-deflection and ultimate strength behavior of unbonded PT slabs. The investigation was also extended to the repair of these slabs with CFRP and the evaluation of the efficiency of CFRP repair of unbonded PT slabs. The research revealed that proper placement of CFRP sheets effectively restrained crack opening and crack growth and increased the flexural strength, stiffness, and deflection capacity of unbonded PT slabs, whereas there were modest increases in tendon stress.
KEYwORDSBoundary conditions; carbon fiber-reinforced poly-
mers; post-tensioned concrete; rehabilitation; repair; slabs; strengthening; unbonded tendons.
INTRODUCTIONIn recent decades, a large number of structures, which
have aged, were built with one- and two-way PT. In most cases, the PT tendons were unbonded (PTI 2011). Some of the problems that existing buildings and infrastructures with
unbonded post-tensioning face today are excess loading, inadequate maintenance, and a lack of periodic repair and strengthening (PTI 2011). Some form of external reinforce-ment is needed to repair and strengthen these structurally deficient buildings and infrastructures. Many of the slabs can also be repaired or retrofitted by using external PT tech-niques and fiber-reinforced polymer (FRP) composites. The external post-tensioning, however, is often challenging for one-way slabs, due to the obstruction of one-way beams, and for two-way slabs, due to the limited clear story height of office and residential buildings. Replacing old strands with new internal strands is more difficult and cumbersome, even though the new strands are smaller. An addition of new tendons and a new layer of concrete could be an option; however, this makes the structure heavier, which contradicts the design philosophy of prestressed structures—namely, the pursuit of relatively light, crack-free, long-span struc-tures. An FRP repairing and retrofitting system, particularly a carbon FRP (CFRP) system, is a suitable and convenient solution embracing such a philosophy. The FRP system saves time and costs. Also, it does not require significant alteration to the original floor slabs.
A handful of research programs on flexural and shear strengthening of the prestressed concrete members using FRP composites have been conducted in recent decades (for example, Meier and Kaiser 1991; Chakrabarti 1995; Chakrabarti et al. 2002; Di Ludovico et al. 2005; Chakrab-arti 2005a, 2005b; Rosenboom et al. 2007; Ibrahim Ary and Kang 2012a; Kang and Ibrahim Ary 2012b). All of these tests focused on the study of bonded pre-tensioned and unbonded PT concrete beams. In particular, only limited research was conducted on unbonded PT slabs with FRP (Michaluk et al. 1998; Chakrabarti et al. 2007, 2009). Therefore, the behavior of unbonded PT members strengthened with FRP remains poorly understood, and standard configurations and formal procedures are yet to be established. Given this gap, an extensive experimental
PTI JOURNAL, V. 8, No. 2, December 2012. Received and reviewed under Institute journal publication policies. Copyright ©2012, Post-Tensioning Institute. All rights reserved, including the making of copies unless permission is obtained from the Post-Tensioning Institute. Pertinent discussion will be published in the next issue of PTI JOURNAL if received within 3 months of the publication.

6 December 2012 | PTI JOURNAL
TECHNICAL PAPER
research program was conducted on the application of CFRP for the rehabilitation of unbonded, PT one- and two-way slabs and repaired slabs using CFRP in this study.
The objectives of this experimental research are 1) to observe the general behavior of unbonded PT slabs before and after the application of CFRP with different boundary conditions; 2) to understand the relationship between internal reinforcement (mild steel and unbonded PT tendons) and externally bonded CFRP; 3) to observe and record crack propagation, strain, pressure, and deflec-tion during testing; and 4) to quantitatively compare the ultimate strength of nonrepaired and repaired slabs.
MATERIALSQuality concrete with a design compressive strength
of 5000 psi (34.5 MPa) was used. Concrete mixtures were prepared according to ASTM C-94. The slabs were cured in their forms for 24 hours and then removed and continuously cured for at least 28 days. The concrete was proportioned using portland cement and fly ash with a water-cementitious material ratio (w/cm) of 0.34 (weight per volume ratio), resulting in a slump of about 3 in. (76 mm). The average concrete compressive strength of at least three specimens measured on the test date for each specimen is indicated in Table 1. The average measured concrete strength was 5690 psi (39.2 MPa), which is typical for PT slabs. Quarter-inch diameter seven-wire
strands were used in each direction of the two-way slabs and in the span direction of one-way slabs. These were Grade 270 ASTM A-416 strands with a specified ultimate strength fpu of 270 ksi (1860 MPa) and cross-sectional area Aps of 0.036 in.2 (23.2 mm2). The individual prestressing strands were inserted through 9/32 in. (7 mm) inner diam-eter plastic tubes. This process eliminated any bonding between the strands and the concrete.
Two different types of non-prestressed mild steel were used: 1) welded wire mesh (WWM) produced in accor-dance with ASTM A-185; and 2) ASTM A-615 deformed reinforcing bars. For the tension mild steel of two-way slabs, the WWM with a specified yield strength of 60 ksi (414 MPa) was used, whereas Grade 60 No. 3 (db = 3/8 in. [9.5 mm]) reinforcing bars were used as tension reinforce-ment of the one-way slabs.
For strengthening, CFRP sheets were used. Three different types of CFRP sheet materials were applied: 1) CF130 high tensile carbon; 2) CF530 high-modulus carbon; and 3) CF160 high-modulus carbon. All the material properties indicated in Table 2 were obtained from the manufacturer (Structural Group, Inc. 2002). The second type (CF530) had measured values of ultimate tensile strength fu,frp of 580 ksi (4000 MPa) and modulus of elasticity Efrp values of 54,000 ksi (372,300 MPa). The first and second types had the same material properties, whereas the third type (CF160) with an ultimate strength
Table 1—Summary of steel reinforcement and measured concrete strength for specimens
SpecimensPT tendons per unit width
Aps, in.2/in. (mm2/mm)Tensile mild steel per unit
width Aps, in.2/in. (mm2/mm)Compressive mild steel per unit width Aps, in.2/in. (mm2/mm)
fc′, psi (MPa)
PTS-1, PTS-1CR16-1/4 in. strands
each way 0.00554 (0.14)
4 x 4-4/4 WWM0.01 (0.254)
6 x 6-10/10 WWM0.0024 (0.06) 5931 (40.9)
PTS-2, PTS-2CR16-1/4 in. strands
each way 0.00554 (0.14)
6 x 6-10/10 WWM0.0024 (0.06)
6 x 6-10/10 WWM0.0024 (0.06) 5963 (41.1)
PTS-3, PTS-3CR16-1/4 in. strands in span direction 0.00554 (0.14)
25-No. 3 at top and 9-No. 3 at bottom
each fixed end 0.0265 (0.673)
6 x 6-10/10 WWM0.0024 (0.06) 5726 (39.5)
PTS-4, PTS-4CR16-1/4 in. strandsin span direction 0.00554 (0.14)
26-No. 3 at top and 9-No. 3 at bottom
each fixed end 0.0276 (0.7)
6 x 6-10/10 WWM0.0024 (0.06) 5959 (41.1)
PTS-5, PTS-5CR16-1/4 in. strandsin span direction0.00554 (0.14)
27-No. 3 at top and 9-No. 3 at bottom
each fixed end 0.0265 (0.673)
6 x 6-10/10 WWM0.0024 (0.06) 5362 (37)
PTS-6, PTS-6CR16-1/4 in. strands
each way 0.00554 (0.14)
6 x 6-10/10 WWM0.0024 (0.06)
6 x 6-10/10 WWM0.0024 (0.06) 5223 (36)
Note: WWM is welded wire mesh; fc′ is concrete compressive strength; concrete pouring dates are different.

PTI JOURNAL | December 2012 7
TECHNICAL PAPER
Fu,frp of approximately 7.14 kips/in. (1.6 kN/mm) had twice the thickness of the first type (CF130) with an Fu,frp of approximately 3.57 kips/in. (0.8 kN/mm). The ulti-mate strengths fu,frp in Table 2 were calculated as Fu,frp times the unit width of 1 in. (25.4 mm), divided by the CFRP thickness (for example, 0.0058 in. [0.146 mm] for CF130; 0.0115 in. [0.292 mm] for CF160 per ply, where the thick-ness of the CFRP impregnated with epoxy [saturant] was used). The design strengths in Table 2 were determined as the average ultimate strength minus three standard devia-tions of the measured values of fu,frp.
TEST SPECIMENSAn experimental program was divided into two phases:
1) Phase-I; testing control specimens of three two-way PT slabs and three one-way PT slabs; and 2) Phase-II; testing the same specimens after repairing using CFRP sheets. Table 3 summarizes the dimensions and boundary condi-tions of each specimen. Six control slabs were nonrepaired specimens labeled as PTS (Post-Tensioned Slab Specimen). Of these six, three were two-way slabs (PTS-1, PTS-2, and PTS-6) and three were one-way slabs (PTS-3, PTS-4, and PTS-5). Note that testing of PTS-6 (additional two-way slab specimen) was planned and conducted after the completion of testing of the first four specimens, and that all the damaged specimens were repaired with CFRP sheets and retested. The six repaired slabs were labeled as CR (for
example, PTS-1CR; Post-Tensioned Slab No. 1 with CFRP Repair). The two-way slab specimens (PTS-1, PTS-2, and PTS-6) were simply supported on four sides of the slab. The one-way slab specimens had three different boundary conditions on two span ends: 1) PTS-3 and PTS-3CR had fixed conditions on both ends; 2) PTS-4 and PTS-4CR were simply supported on one end and fixed on the other end; and 3) PTS-5 and PTS-5CR were simply supported one-way slabs. The test installations to achieve the desig-nated boundary conditions are as shown in Fig. 1 and 2.
Table 2—Properties of carbon fiber-reinforced polymer (CFRP) used for specimens
Specimens TypeTensile modulus of
elasticity, ksi (MPa)Design tensile strength,
ksi (MPa)Ultimate tensile
strength*, ksi (MPa)PTS-1CR, PTS-2CR CF130 high tensile carbon 33,000 (227,600) 550 (3790) 620 (4280)
PTS-5CR, PTS-6CR CF530 high modulus carbon 54,000 (372,400) 550 (3790) 580 (4000)
PTS-3CR, PTS-4CR CF160 high tensile carbon 33,000 (227,600) 510 (3520) 620 (4280)*Provided by manufacturer’s design guide (Structural Group, Inc., 2002).Note: CF160 (7.14 kips/in.;1.6 kN/mm) has twice the thickness of CF130 (3.57 kips/in.; 0.8 kN/mm).
Table 3—Dimensions for test specimensSpecimens l1 lc1 l2 lc2 Boundary condition
PTS-1, PTS-1CR, PTS-2, PTS-2CR,
PTS-6, and PTS-6CR9 ft 0.5 in. (2756 mm) 8 ft 10 in. (2692 mm) 9 ft 0.5 in. (2756 mm) 8 ft 10 in. (2692 mm) Pin-pin
PTS-3, PTS-3CR 10 ft 8 in. (3251 mm) 8 ft 8 in. (2642 mm) 8 ft 8 in. (2642 mm) 8 ft 8 in. (2642 mm) Fixed-fixed
PTS-4, PTS-4CR 9 ft 10 in. (2997 mm) 8 ft 9 in. (2667 mm) 8 ft 8 in. (2642 mm) 8 ft 8 in. (2642 mm) Fixed-pin
PTS-5, PTS-5CR 8 ft 10 in. (2692 mm) 8 ft 10 in. (2692 mm) 8 ft 8 in. (2642 mm) 8 ft 8 in. (2642 mm) Pin-pinNotes: l1 is slab length in span or one direction; lc1 is support center-to-support center length in span or one direction; l2 is slab length in transverse or other direction; and lc2 is support center-to-support center length in transverse or other direction.
Fig. 1—Fixed-fixed condition (PTS-3).

8 December 2012 | PTI JOURNAL
Slab thickness was 3 in. (76 mm) for all specimens. The two-way slabs (PTS-1, PTS-1CR, PTS-2, PTS-2CR, PTS-6, and PTS-6CR) had a footprint of 9 ft 0.5 in. x 9 ft 0.5 in. (2.76 x 2.76 m) (Fig. 3) and were internally reinforced using mild steel and unbonded PT tendons in each direction as indicated in Table 1. The clear span length in each prin-cipal direction was 8 ft 10 in. (2.7 m) for PTS-1, PTS-1CR, PTS-2, PTS-2CR, PTS-6, and PTS-6CR (Fig. 4). Mild steel
wire mesh measuring 7 x 7 ft (2.13 x 2.13 m) was placed at the compression surface of each slab, mainly to prevent damage during transportation (Fig. 5). The amount of mild steel, which varied for each specimen, is provided in Table 1. Two different sizes of the WWM mild steel were used (Fig. 6): 1) 4 x 4 – 4/4 with cross-sectional areas As of 0.01 in.2 (6.45 mm2) per unit inch width; and 2) 6 x 6 – 10/10 with an As of 0.0024 in.2 (1.55 mm2) per unit inch width. The WWM
TECHNICAL PAPER
Fig. 2—Pin-support portion of PTS-4.
Fig. 3—Test setup for two-way slabs under uniformly distributed area loads or pressure. (Note: 1 ft = 305 mm; 1 in. = 25.4 mm.)
Fig. 4—Draped tendon profiles for test specimens. (Note: 1 ft = 305 mm; 1 in. = 25.4 mm.)
Fig. 5—Tendon and mild steel layout for PTS-6.

PTI JOURNAL | December 2012 9
of 6 x 6 – 10/10 was placed as compression reinforcement at the bottom of the two-way slabs.
The one-way slabs (PTS-3, PTS-3CR, PTS-4, PTS-4CR, PTS-5, and PTS-5CR) had various foot-prints depending on the support boundary conditions as indicated in Table 3 and Fig. 4. Twenty-five No. 3 (db = 3/8 in. [9.5 mm]) tension bars were placed at a spacing of 4 in. (102 mm) in the span direction of the one-way slabs (Fig. 7), and nine No. 3 bars were placed as tension reinforcement at a spacing of 11 in. (280 mm) at the fixed end of the one-way slabs. Additionally, the 6 x 6 – 10/10 bottom wire meshes were used for all one-way slab
specimens to prevent cracks during installation of the specimens. Overall, the amount of bonded steel was deter-mined to obtain the balanced failure mode (this was done to see whether or not CFRP is effective even with a small degree of steel yielding), and the number of tendons was determined not to make any initial cracks due to excessive camber under applied PT forces.
Figure 4 shows the draped tendon profiles used for the specimens. Figures 8 and 9 show the PT reinforcement layout plan for the specimens. A total of 16 post-tensioning tendons were placed in each direction of the two-way slabs and in the span direction of the one-way slabs (Fig. 5 and 10). The spacing of uniformly distributed tendons was 6 in. (152 mm) for the two-way slabs; thus, the cross-sectional area of the tendons per unit width was 0.006 in.2/in. (0.15 mm2/mm). For the one-way slab, two tendons were grouped with a spacing of 2.25 in. (57 mm) between each tendon, and the two-tendon group was then uniformly distributed with a spacing of 12 in. (305 mm) between the groups (Fig. 9 and 10). PT tendons were stressed to approximately 0.7fpu before transfer (that is, jacking stress fpj), resulting in approximately 0.65fpu after transfer (that is, initial stress fpi). Note that the initial stress fpi is almost the same as the effective stress fpe in this research, as there are minor long-term changes in tendon stress. After
TECHNICAL PAPER
Fig. 6—Welded wire mesh (WWM) mild steel used for two-way slabs.
Fig. 7—No. 3 deformed mild steel used for one-way slabs. (Note: 1 ft = 305 mm; 1 in. = 25.4 mm.)
Fig. 8—Tendon layout for two-way slabs.

10 December 2012 | PTI JOURNAL
the Phase-I test was completed, each of the six specimens was repaired with CFRP and high-strength adhesive (epoxy) in accordance with ACI 440.2R-02 recommenda-tions (Fig. 11 and 12). Prior to placing the CFRP sheet, the substrate was cleaned and primer was applied: a steel coarse brush attached to the hand drill was used to smooth and remove concrete deposit from the top. This method provided strong bond between concrete surface and CFRP. Then, the slabs were physically repaired (for
example, filling cracks and applying sealer). The two-way slabs were repaired using two different FRP-strengthening schemes: 1) a diagonal scheme; and 2) an orthogonal scheme. Two plies of CFRP fabric sheets were placed for both schemes. The diagonal scheme, which was used for PTS-2CR, is shown in Fig. 13, and the orthogonal scheme, which was used for PTS-1CR and PTS-6CR (parallel to slab edges), is shown in Fig. 14. The one-way slabs (PTS-3CR, PTS-4CR, and PTS-5CR) were strengthened with straight CFRP sheets in the slab top (note that loading is applied from the bottom) and in the bottom tension zone over a quarter of the clear span at the support (Fig. 15). Details of CFRP materials are given in Table 2.
TEST SETUP AND TESTINGTwo-way, simply supported, PT slabs were tested
under uniformly distributed area loads or pressure. The
TECHNICAL PAPER
Fig. 9—Tendon layout for one-way slabs. (Note: 1 ft = 305 mm; 1 in. = 25.4 mm.)
Fig. 10—Tendon and mild steel layout for PTS-3 and PTS-4.
Fig. 11—Diagonal scheme for CFRP attachment (PTS-2CR).
Fig. 12—Orthogonal scheme for CFRP attachment (PTS-1CR).

PTI JOURNAL | December 2012 11
loading frame is shown in Fig. 3 and 16. The area loads or pressure were applied upward by using a hydraulic water bag (the top of the slab at midspan was referred to as the tension side). The water pressure was gradually increased at approximately 1 psi (7 kPa) increments. One-way PT
slabs were also subjected to uniformly distributed area load (water pressure), which was exerted vertically upward.
The control slabs were loaded to the ultimate (Phase-I); however, the slabs were not loaded to a point where they could become unrepairable for safety. Phase-I testing stopped when the slabs reached one of the following three criteria: 1) when excessive cracks were visually observed; 2) when the deflection in the slab reached close to L/120, where L is the span length; and 3) when the PT stress reached nearly 75 to 85% (0.75fpu to 0.85fpu) of the ulti-mate tensile strength. It was intended that the specimens would not completely fail during the Phase-I testing. The point of excessive cracking was close to the threshold of either of the other two criteria.
The same criteria were used for the repaired slabs (Phase-II), except for the first criteria. At the time the Phase-II test was stopped, the slabs were deemed semi-elastic. No crushing of concrete occurred until the ulti-mate stage. As noted previously, the cracked slabs (all six specimens) were then repaired with CFRP sheets and tested again. The same criteria to determine the ultimate load were used for the repaired slabs.
During the testing, all readings were taken using an automated data recording system. The test measurements included pressure, deflection, strain (in mild steel), and a change in PT forces. The applied pressure was monitored by the pressure gauge. The displacement gauges used to measure the deflection were linear variable differential transformers (LVDTs) with 4 in. (100 mm) of travel. Strain gauges were mounted in the mild steel at the midspan of the slab. Load cells were placed behind the anchor plates of the unbonded PT tendons to record the PT forces and stresses, and the increments of those forces and stresses during the PT and external loading. The strain gauges were attached at midspan of the slab.
TEST RESULTS AND DISCUSSIONCracking
The compression (bottom) surface of each of the test specimens was not accessible for observation of cracks while testing was in progress. After the first crack appeared in the tension (top) surface, additional cracks were marked and recorded (Fig. 17). As expected, diagonal cracking patterns were observed in the two-way control slabs (PTS-1, PTS-2 and PTS-6). Since the square panel with the same reinforcing details in two principal directions was tested, the crack patterns were symmetrical with respect to both principal axes (Fig. 17 and 18). The symmetric
TECHNICAL PAPER
Fig. 13—Diagonal scheme for CFRP attachment (PTS-2CR). (Note: 1 ft = 305 mm.)
Fig. 14—Orthogonal scheme for CFRP attachment (PTS-1CR and PTS-6CR). (Note: 1 ft = 305 mm; 1 in. = 25.4 mm.)

12 December 2012 | PTI JOURNAL
cracks observed from the two-way slabs indicate that the area load/pressure was quite uniformly applied on the slabs. For the one-way control slabs (PTS-3, PTS-4, and PTS-5), flexural cracks were focused on the tension (top) surface at the location where positive moment was the largest (for example, midspan for PTS-3 at approxi-mately 3 ft 9 in. (1.14 m) from the simply supported end for PTS-4) (Fig. 19). After the test, the bottom surfaces of the slabs were examined. Almost no cracking was observed
on the bottom surface of the control or repaired two-way slabs (that is, no concrete crushing was noted). In the first phase of testing of control specimens, the loads were not applied to the collapse level for safety reasons. It is noted that special safety precautions are essential in the testing of
Fig. 15—CFRP attachment for PTS-3CR and PTS-4CR. (Note: 1 ft = 305 mm.)
Fig. 16—Water pressure loading test frame.
Fig. 17—Crack patterns (PTS-1).
TECHNICAL PAPER

PTI JOURNAL | December 2012 13
an unbonded PT system. Also, the use of a hydraulic water bag warrants further precautions.
For the repaired slabs (PTS-CR specimens), cracks were not visible on the tension (top) surface during testing, as the surface was covered by CFRP. In some of the exposed areas, the old cracks opened up. No debonding of the CFRP sheets was observed at the ultimate loading stage.
Pressure-deflection behaviorThe comparison of deflection values between control
(nonrepaired) and repaired specimens is shown in Table 4 and Fig. 20 to 25. In general, the control slabs behaved linearly during the initial stages of loading. A hairline
crack (tension crack) for any one test slab was defined as the first crack which appeared on the top of the slab and corresponding pressure was defined as pressure at first cracking (Table 5). Once the two-way slabs cracked under approximately 2 to 4 psi (0.014 to 0.028 MPa) pressure, they exhibited reduced flexural stiffness as evidenced by the pressure-deflection relationships shown in Fig. 20, 21, and 25. The second stage of the linear behavior of cracked elastic slabs continued until approximately 4.5 to 6.5 psi (0.031 to
Fig. 18—Crack patterns (PTS-6).
Fig. 19—Crack patterns (PTS-3 and PTS-4). (Note: 1 ft = 305 mm; 1 in. = 25.4 mm.)
Table 4—Measured deflection at center of slab at 5.2 psi (0.0359 MPa) pressure
SpecimenExternal water
pressure, psi (MPa)
Measured deflection ∆,
in. (mm)
repaired
non-repaired
DD
PTS-1 5.2 (0.0359) 0.45 (11.5) 1
PTS-1CR 5.2 (0.0359) 0.40 (10.3) 0.9
PTS-2 5.2 (0.0359) 0.31 (7.9) 1
PTS-2CR 5.2 (0.0359) 0.20 (5.1) 0.64
PTS-3 5.2 (0.0359) 0.85 (21.6) 1
PTS-3CR 5.2 (0.0359) 0.6 (15.2) 0.71
PTS-4 5.2 (0.0359) 1.52 (38.6) 1
PTS-4CR 5.2 (0.0359) 1.05 (26.8) 0.69
PTS-5* 5.2 (0.0359) 2 (50.8) 1
PTS-5CR 5.2 (0.0359) 0.69 (17.5) 0.34
PTS-6 5.2 (0.0359) 0.45 (11.4) 1
PTS-6CR 5.2 (0.0359) 0.39 (9.8) 0.86*Excessive cracking.
TECHNICAL PAPER

14 December 2012 | PTI JOURNAL
0.045 MPa) pressure was applied. As the flexural tensile cracks increased in number and width, the pressure-deflec-tion curves started to show trilinearity and slope reduction. Subsequently, a significantly reduced stiffness was noted. This trilinear pressure-deflection behavior was similar for each two-way slab specimen. The strength of PTS-1 with a larger amount of mild steel was greater than that of PTS-2 by approximately 25%.
Similar behavior was noted for the one-way slabs. The boundary condition affected the pressure-deflection behavior. As the number of simple supports changed from 0 to 1 to 2, the stiffness and load-carrying capacity were reduced. Testing of PTS-5 with two simple supports was stopped due to excessive cracking. The curves of the PTS-3 and PTS-4 specimens also became nonlinear rather than trilinear, while PTS-5 exhibited a distinctly bilinear
Fig. 20—Pressure-deflection relationship (PTS-1 and PTS-1CR).
Fig. 21—Pressure-deflection relationship (PTS-2 and PTS-2CR).
Fig. 22—Pressure-deflection relationship (PTS-3 and PTS-3CR).
Fig. 23—Pressure-deflection relationship (PTS-4 and PTS-4CR).
TECHNICAL PAPER

PTI JOURNAL | December 2012 15
pressure-deflection relationship. This indicates that the initial stiffness of unbonded PT slabs can be improved by increasing the fixity of the end supports. This point is especially important in terms of the serviceability of such slender PT members. Thus, in order to minimize floor vibrations, etc., application of restrained boundary condi-tions is highly recommended.
After the Phase-I testing of control specimens and release of water pressure, it was noticed that the residual deflections were negligible due to the restoring force provided by the PT tendons. These measurements are also noteworthy in that unbonded PT structures possess a high elastic deformation-restoring capability even after consider-able concrete damage. Therefore, there was no additional
Fig. 24—Pressure-deflection relationship (PTS-5 and PTS-5CR). Fig. 25—Pressure-deflection relationship (PTS-6 and PTS-6CR).
Table 5—Measured values for pressure at first cracking Pcr and ultimate pressure Pu
Specimen Pressure at first cracking Pcr, psi (MPa) Ultimate pressure Pu, psi (MPa)u
cr
PP
_ repaired
_ non-repaired
u
u
P
P
PTS-1 6.35* (0.044) 6.5 (0.045) 1.02 NA
PTS-2 4.8* (0.033) 5.2 (0.036) 1.08 NA
PTS-3 5.65* (0.04) 6.5 (0.045) 1.15 NA
PTS-4 4* (0.028) 5.4 (0.037) 1.35 NA
PTS-5 2* (0.021) 4.17 (0.029) 2.09 NA
PTS-6 3.5* (0.024) 5.5 (0.044) 1.57 NA
PTS-1CR N/A 9.2 (0.063) N/A 1.42
PTS-2CR N/A 9.8 (0.068) N/A 1.88
PTS-3CR N/A 10.9 (0.075) N/A 1.68
PTS-4CR N/A 7.9 (0.055) N/A 1.46
PTS-5CR N/A 7.48†(0.052) N/A 1.79
PTS-6CR N/A 8.88 (0.061) N/A 1.61*Based on visual observation.†Testing was prematurely stopped for safety reason; thus, 10% of last measured value was added. Note: N/A is not available.
TECHNICAL PAPER

16 December 2012 | PTI JOURNAL
step related to zeroing slab deflection before applying CFRP sheets. All LVDTs were removed prior to the applica-tion of CFRP sheets on the surface of specimens, and then the LVDTs were reinstalled. At this point, initial midspan deflections were reset to zero.
The deflection profiles for the strengthened slabs primarily show essentially linear or slightly nonlinear behavior without sharp turning points, whereas the load-carrying capacity was considerably increased (by approxi-mately 17 to 88%) (Table 5). For the two-way slabs, the stiffness was recovered up to that of the control slabs. For the repaired one-way slabs, the stiffness also became equiva-lent to that of the original one-way slabs or even superior to the nonrepaired slabs with simple support (PTS-3CR, PTS-4CR, and PTS-5CR). In particular, the simply supported PTS-5CR had less deflection at the ultimate load of PTS-5 even after excessive cracking. At the pressure level around the yielding point of the control specimen, the repaired slab’s deflection was much smaller than the nonre-paired slab’s deflection (see Fig. 24), indicating that use of CFRP sheets effectively increases the flexural resistance of unbonded PT slabs.
In terms of ductility capacity, there were no consistent trends between the nonrepaired and repaired specimens. If significantly smaller reinforcing bar amounts are present, the failure mode would have been more ductile. More studies need to be developed to achieve ductile failure mode, and/or a strength reduction factor should be applied to the brittle mode of failure.
Stresses in PT and nonprestressed mild steelUnlike bonded prestressed or conventionally rein-
forced concrete members, the prestressing strands in the unbonded PT members never reach their ultimate strength fpu. This is because the ultimate strength fpu of unbonded tendons is not dependent on the localized strain at the flex-ural critical section but depends on the total member elon-gation, number of spans, span-depth ratio, and loading type (ACI 318-08; Kang and Wallace 2008). Just before loading of the slabs, the PT forces in the strands were recorded. The average effective stress (in this case before external loading) was normally kept between 65 and 70% of the ultimate strength of the strands. As the loading increased, the tendon stress increased nonlinearly. The rate of tendon stress increase was very small (approximately 0.005% of fpe) before concrete cracking, but it became increasingly larger as the slab deflection increased until the ultimate load. Figure 26 shows a representative result for PT force varia-tion against an external pressure.
On the other hand, as the slabs were loaded and started to crack heavily, the stress in the mild steel started to increase and became close to yield stresses (Fig. 27); however, no significant yielding was observed from the strain gauge data (Fig. 27). For example, strain in the wire mesh of PTS-1
Fig. 26—Tendon load variation with increasing pressure (PTS-3).
Fig. 27—Reinforcing bar strain variation with increasing pressure (PTS-3).
TECHNICAL PAPER

PTI JOURNAL | December 2012 17
started to increase as the external loading was increased and reached a maximum strain of approximately 0.002 at an external pressure on the slab of 6.5 psi (0.045 MPa). The stresses of the wire mesh in the two-way slabs nearly reached the yield stress near the ultimate load, but it cannot be said that the nonlinear pressure-deflection behavior is attrib-uted to the yielding of the mild steel. Rather, the nonlinear behavior was related to the significant concrete cracking. Note that the nonlinear behavior of the tendons was modest, as it was kept within the elastic range.
The stresses of the reinforcing bars in the one-way slabs were greater than those of the wire mesh in the two-way slabs. For instance, the average stress at the ultimate load was 52.5 ksi (362 MPa) and 55.6 ksi (383 MPa) for PTS-1 and PTS-2, respectively, whereas the average was 56 ksi (386 MPa) and 61 ksi (421 MPa) for PTS-3 and PTS-4, respectively. This may be due in part to the larger width of the damaged region that formed in the one-way slab than in the two-way slab; however, the degree of bonded steel yielding was limited for the specimens.
Behavior of slabs repaired with CFRP sheetsAs noted, the cracked slabs were repaired with CFRP
sheets and tested again. The ultimate loads of the test specimens strengthened with CFRP sheets were always higher than the ultimate loads of the non-repaired speci-mens (Table 5). The flexural strength of the slabs strength-ened with CFRP composite materials increased by 42%, 88%, and 61% for PTS-1CR, PTS-2CR, and PTS6CR (two-way slabs), respectively, and by 68%, 46% and 79% for PTS-3CR, PTS-4CR, and PTS-5CR (one-way slabs), respectively. Interestingly, however, the stress increases in PT tendons in the repaired specimens at ultimate loading
stage were always lower in comparison to those in the control specimens by approximately 10 to 65% (Table 6). This was the case even though the maximum deflections of the repaired specimens were larger than those of the control specimens. Note that the testing of the non-repaired control specimens was stopped when the tendon stress reached the criteria of 0.75fpu to 0.8fpu or other criteria were reached. This means that the total elongation of the tendon was larger when the concrete cracked heavily such that the plastic concrete deformation (that is, opening of cracks) at the level of the tendons was substantial. On the other hand, the cracks were stitched by the CFRP reinforcement externally bonded to the concrete top surface. After the repair, the slab concrete behaved like an elastic solid and, in this case, the tendon stress increase in the CFRP-repaired slab was not as much as that in the slab without CFRP at the same given deflection. As a result, the components of tension were produced primarily by the CFRP composite materials under bending. This experimental finding is of value and demonstrates another benefit of using CFRP for unbonded PT structures, as the CFRP strengthening not only provides the additional strength but also leads to the decrease in the tendon stress increase.
The increased strength with respect to the nonrepaired strength varied from 42 to 88% for two-way slabs and from 46 to 79% for one-way slabs. The larger increase in strength was attributed to the larger amount of CFRP used for strengthening (refer to Tables 2 and 5). The critical yield line pattern developed in the control specimens could not propagate further because of the presence of the CFRP across the crack lines. Again, at the time the testing was completed, the CFRP-repaired slabs remained in an essen-tially elastic condition. This is due to the perfectly linear strain-stress behavior of the carbon fibers, which had not
Table 6—Effective tendon forces and tendon forces at ultimate loads for selected specimens
SpecimenApplied pressure,
psi (MPa)
Measured average PT forces, lb (kN)∆F = Fu – Fe ,
lb (kN) e
FFD
, %Fe Fu
PTS-1 6.5 (0.045) 6900 (30.8) 7101 (31.7) 201 (0.897) 2.9PTS-1CR 9.2 (0.063) 6920 (30.89) 7001 (31.25) 81 (0.362) 1.2
PTS-2 5.2 (0.036) 6931 (30.94) 7128 (31.82) 197 (1.027) 2.8PTS-2CR 9.8 (0.068) 6910 (30.85) 7013 (31.3) 103 (0.879) 1.5
PTS-3 6.5 (0.045) 6892 (30.77) 7122 (31.8) 230 (1.46) 3.3PTS-3CR 10.9 (0.075) 6920 (30.89) 7068 (31.55) 148 (0.661) 2.1
PTS-4 5.4 (0.037) 6588 (29.41) 7033 (31.4) 445 (1.987) 6.8PTS-4CR 7.9 (0.054) 6546 (29.22) 6601 (29.47) 55 (0.246) 0.8
Notes: Fe is effective tendon force; Fu is tendon force at ultimate load.
TECHNICAL PAPER

18 December 2012 | PTI JOURNAL
been ruptured throughout the testing. Also, rigid plate movement along the crack line did not happen. Concrete did not crush at the bottom surface along the yield lines. Overall, it was verified that effective placement of CFRP increased the load-carrying capacity of unbonded PT slabs. The quantity of the CFRP sheets used for the specimens was sufficient and adequate for increasing the flexural strength by about 42 to 88% without concrete crushing. Further-more, it was concluded that the CFRP placement patterns of both the diagonal and orthogonal schemes were effective for two-way unbonded PT slabs.
SUMMARY AND CONCLUSIONS1. Nonlinear behavior was observed from pressure-
deflection relationships of unbonded PT one- and two-way slabs under uniformly distributed pressure or area loads. This was due to the considerable tensile cracks that occurred at the high moment region. However, as anticipated, the tendon stress increase was only approximately 0.8 to 6.8% of the effective stress.
2. While the deflection was much higher for CFRP-repaired slabs, the unbonded tendon stress increases were lower than those in the control specimens by approximately 10 to 65%. This indicates that a total elongation of the tendons is much higher when large crack opening occurs, rather than when a large deflection occurs.
3. The PT concrete slabs repaired with CFRP fabric and bonded to the tension surfaces gained considerable strength. Flexural capacity of the slabs strengthened with CFRP composite materials increased by approximately 40 to 90% for two-way slabs (PTS-1CR, PTS-2CR, and PTS6CR) and approximately 50 to 80% for one-way slabs (PTS-3CR, PTS-4CR, and PTS-5CR).
4. As such, the slabs repaired with properly designed CFRP schemes showed sufficiently larger load-carrying capac-ities than the nonrepaired slabs. Both orthogonal and diagonal two-layer placement schemes used in this study were effective, as the CFRP fibers were perpendicular to the crack lines.
5. The measured pressure-deflection relationships between the control PT slabs and repaired slabs also indicate better serviceability conditions (for example, stiffness and crack restraint) for the repaired slabs even after substantial damage. The behavior of the CFRP-repaired slabs was essen-tially linear or slightly nonlinear. No fiber tensile failure, debonding, or concrete crushing was observed.
6. The quantity of used CFRP sheets was sufficient and adequate for increasing the flexural strength by approxi-mately 42 to 88% without concrete crushing.
7. The results from this study indicate that different end supports of one-way slabs caused large variations in perfor-mance. The fixed-fixed condition (PTS-3 and PTS-3CR) shows a 68% increase in ultimate strength due to CFRP repair, whereas the fixed-pin condition (PTS-4 and PTS-4CR) shows a 46% increase. As the degree of fixity at the ends decreased, the stiffness and load-carrying capacity (ultimate strength) increased by the CFRP sheets were reduced.
An alternate CFRP retrofitting system that can be employed is to use CFRP laminated strips or CFRP prestressed strips. These retrofitting methods for prestressed or PT concrete structures should also be considered as future studies. Although promising outcomes have been reported by this study, the CFRP systems applied to unbonded PT slabs may not be considered as a generally applicable repair system until further verifications are undertaken on the ductility of CFRP-repaired PT slabs with overstressed or ruptured steel reinforcement.
ACKNOwLEDGMENTSThe work presented in this paper was funded by a NASA
grant (FAR-NASA-2002) and, in part, by a U.S. DOT–RITA grant (DTRT06-G-0016/OTCREOS10.1-21). The authors would like to acknowledge laboratory staff L. Sanchez and research assistants M. Busciano, V. Dao, and H. Hong at California State University, Fullerton, CA, and Y. Huang at the University of Oklahoma, Norman, OK, for their assis-tance. The views expressed are those of authors and do not necessarily represent those of the sponsors.
REFERENCESACI Committee 318, 2011, “Building Code Require-
ments for Structural Concrete (ACI 318-11) and Commen-tary,” American Concrete Institute, Farmington Hills, MI, 503 pp.
ACI Committee 440, 2002, “Guide for the Design and Construction of Externally Bonded FRP Systems for Strengthening Concrete Structures (ACI 440.2R-02),” American Concrete Institute, Farmington Hills, MI, 45 pp.
ASTM International, 2008, “American Society for Testing and Materials Annual Book of ASTM Standards,” West Conshohocken, PA.
Chakrabarti, P. R., 1995, “Ultimate Stress for Un-Bonded Post-Tensioning Tendons in Partially Pre-Stressed Beams,” ACI JOURNAL, Proceedings V. 92, No. 6, Nov.-Dec., pp. 689-697.
Chakrabarti, P. R.; Miller, D.; and Bandyopadhayay, S., 2002, “Application of Composites in Infrastructure—
TECHNICAL PAPER

PTI JOURNAL | December 2012 19
Parts I, II, and III (a brief report on materials and construc-tion),” Proceedings ICCI-2002, The Third International Conference on Composites in Infrastructure, June 10-12, 2002, San Francisco, CA.
Chakrabarti, P. R., 2005a, Retrofitting and Repairing of Heavily Cracked Un-bonded Post-Tensioned Structural Systems, ACI SP-225, American Concrete Institute, Farm-ington Hills, MI, 2005.
Chakrabarti, P. R., 2005b, “Repairing and Retrofitting of Post-Tensioned Beams,” Concrete International, Amer-ican Concrete Institute, Farmington Hills, MI, Feb. 2005, pp. 45-48.
Chakrabarti, P. R.; Kim, U.; Hong, H., Busciano, M.; and Dao, V., 2007, “Repair Systems for Post-Tensioned Slabs with Composite Materials,” Proceedings ASCE/SEI Structures Congress 2007, May 16-19, 2007, Long Beach, CA.
Chakrabarti, P. R.; Kim, U.; Busciano, M.; and Dao, V., 2009, “Repair Systems for Un-Bonded Post-Tensioned One & Two Way Slabs with CFRP,” Proceedings of the 5th Inter-national Structural Engineering and Construction Conference (ISEC-5), Sept. 21-27, 2009, Las Vegas, NV.
Di Ludovico, M.; Nanni, A.; Prota, A.; and Cosenza, E., 2005, “Repair of Bridge Girders with Composites: Experi-mental and Analytical Validation,” ACI Structural Journal, V. 102, No. 5, Sept.-Oct., pp. 639-648.
Kang, T. H.-K., and Wallace, J. W., 2008, “Stresses in Unbonded Tendons of Post-Tensioned Flat Plate Systems under Dynamic Excitation,” PTI Journal, V. 6, No. 1, Feb., pp. 31-44.
Ibrahim Ary, M., and Kang, T. H.-K., 2012a, “Shear-Strengthening of Reinforced & Prestressed Concrete Beams Using FRP: Part I—Review of Previous Research,” Interna-tional Journal of Concrete Structures and Materials, V. 6, No. 1, Mar., pp. 41-48.
Kang, T. H.-K., and Ibrahim Ary, M., 2012b, “Shear-Strengthening of Reinforced & Prestressed Concrete Beams Using FRP: Part II—Experimental Investigation,” Interna-tional Journal of Concrete Structures and Materials, V. 6, No. 1, Mar., pp. 49-57.
Meier, U., and Kaiser, H., 1991, “Reprinted from Advanced Composite Materials in Civil Engineering Structures,” Proceedings MT Div/ASCE/Las Vegas, Jan. 31, pp. 224-229.
Michaluk, C. R.; Rizkalla, S. H.; Tadros, G.; and Benmokrane, B., 1998, “Flexural Behavior of One-Way Concrete Slabs Reinforced by Fiber-Reinforced Plastics Reinforcements,” ACI Structural Journal, V. 95, No. 3, May-June, pp. 353-365.
PTI Committee DC-20, 2011, “Guide for Design of Post-Tensioned Buildings (PTI DC20.9-11),” Post-Tensioning Institute, Farmington Hills, MI, 74 pp.
Rosenboom, O.; Hassan, T. K.; and Rizkalla, S., 2007, “Flexural Behavior of Aged Prestressed Concrete Girders Strengthened with Various FRP Systems,” Construction and Building Materials, Elsevier, V. 21, pp. 764-776.
Structural Group, Inc., 2002, “Wabo®-M-Brace Composite Strengthening System Engineering Design Guidelines,” May, Hanover, MD.
Uksun Kim is an Associate Professor and Chair of civil engineering at California State University, Fullerton, CA. He received his BS from Yonsei University, Seoul, Korea; his MS from Michigan State University, East Lansing, MI; and his PhD from the Georgia Institute of Technology, Atlanta, GA. His research interests include seismic design of building systems with steel joist girders, partially restrained connec-tions and concrete-filled tubes, and seismic rehabilitation of prestressed building systems. He is a licensed professional engineer in Washington and a LEED AP.
PTI Fellow Thomas H.-K. Kang is an Assistant Profes-sor at Seoul National University, Seoul, Korea. Before that, he was an Assistant Professor at the University of Oklahoma, Norman, OK. He received his BS from Seoul
National University and his PhD from the University of California, Los Angeles, Los Angeles, CA. He is a member of PTI Committee DC-20, Building Design. His research interests include design and rehabilitation of post-tensioned buildings and systems. He is a licensed professional engi-neer in California.
Pinaki R. Chakrabarti is a Professor of civil engineering at California State University, Fullerton, CA, He received his BE from Calcutta University, India; his MS from the University of Minnesota, Twin Cities, MN; and his PhD from Rutgers University, Piscataway, NJ. His research interests include admixtures, prestressed concrete, and seis-mic retrofit with composites. He is a licensed professional engineer and structural engineer in California.
TECHNICAL PAPER

20 December 2012 | PTI JOURNAL
TECHNICAL PAPER
STRUCTURAL EFFICIENCY FROM A SUSTAINABILITY PERSPECTIVE
BY CAROL HAYEK AND SALEEM KALIL
A practical approach to evaluate structural efficiency is presented, taking into consideration various structural alternatives applied to a high-rise building located in central London, UK. The study focuses on the choice of the slab system between conventional reinforced and bonded post-tensioned concrete and tackles the sustainability triple bottom line: environmental, social, and economic. The environmental impact is assessed using European factors restricted to embodied energy and embodied carbon dioxide (CO2); the social impact is assessed using a ranking scheme considering construction time, material usage, and indoor and outdoor factors. The results show that the post-tensioned concrete option contributed to the project’s sustainability goals and led to considerable savings of approximately 25% on the overall slab’s embodied energy and embodied carbon while presenting an economical solution and social benefits.
INTRODUCTIONConstruction material, construction activity, and the
operability of a building impact our quality of life in many ways. As population levels around the world continue to rise and more building structures are required, the construction impact is set to increase. To fully assess the effect of buildings on the environment, it is important to assess the impact of the construction phase in addition to the impact of the operational phase. There has been tremendous focus on the operational phase, given the fact that it accounts for approximately 90% of the environmental impact. However, as buildings become more environmentally efficient during the operation phase, the impact of the construction phase and, consequently, the structural efficiency, become essential.
This study aims to evaluate structural efficiency over the building’s life cycle through a practical approach, covering the sustainability triple bottom line: environmental, social, and economic. The focus is on slab construction for bonded post-tensioned and conventional reinforced concrete slab options with an emphasis on the construction phase. The comparison is carried out on an actual project—Strata SE1—a high-rise building in London designed with stringent sustainability requirements. The evaluation of structural efficiency examines material selection, quantity, construction time, and architectural features and how they translate into the environment and social well-being.
PROjECT DESCRIPTIONThe project is a multi-
unit residential building (482 ft tall) with 41 post-tensioned flat slabs designed using European standards with a central core and only two internal columns. The building has several unique features, with offset columns and wind turbines housed at the top of the tower and resting on a post-tensioned transfer slab. It is the world’s first building with wind turbines destined to supply a portion of the building’s operational energy.
For the structural slab design, the following objectives were put in place:
• Structural performance: Frame a solution that simplifies forming, routing of mechanical services, and architectural layout flexibility; reach the thinnest achievable slab thickness for spans of 31 ft; and frame
PTI JOURNAL, V. 8, No. 2, December 2012. Received and reviewed under Institute journal publication policies. Copyright ©2012, Post-Tensioning Institute. All rights reserved, including the making of copies unless permission is obtained from the Post-Tensioning Institute. Pertinent discussion will be published in the next issue of PTI JOURNAL if received within 3 months of the publication.

PTI JOURNAL | December 2012 21
a solution that controls deflection and cracks to meet cladding requirements and tolerances. Deflection was set to 0.4 in. on all the façade elements and to L (span)/360 internally.
• Construction: Achieve a fast construction schedule and stay below budget.
• Sustainability: Optimize use of resources, mini-mize carbon footprint, and reduce social impact of the construction work.
STRUCTURAL SLAB OPTIONS Given the slab layouts and the sustainability goals set for the
project, it was decided from the start that an in-place concrete frame would work better than a steel frame. The main reasons behind this assessment were the curved slab edges, which could be formed easily and economically with concrete; advantages of concrete, such as acoustic isolation, resilience, and thermal mass properties (Schokker 2010); and lateral stability capacity. Therefore, only the following in-place concrete options were considered for the comparative analysis:
• PT: Flat-slab post-tensioned concrete with a bonded system (bonded post-tensioning is common in UK building construction);
• RC1: Flat-slab reinforced concrete; and• RC2: Slab with drop beams all in reinforced
concrete.A detailed design for all three options was performed
following the same assumptions to allow for a fair compar-ison. Given the project location, the structures were designed according to the British code to meet equivalent service-ability, ultimate state, and deflection limits. Table 1 shows the material quantity rates per square foot of slab. Non-prestressed reinforcement rates represent all conventional reinforcement needed, including detailing requirements, such as trim bars around openings and bars at slab edges. The overall slab area shown in the table is the exact value from the built project accounting for all recesses, openings, and so on.
The roof slab supporting the wind turbine is excluded from the aforementioned quantities. Its quantities do not affect the analysis, as the overall material quanti-ties are driven by the typical 40 stories. The roof slab is very specific to the loads induced by the wind turbines. It involves concentrated wind loads and moments trans-ferred by the turbines to the slab.
PROjECT CONSTRUCTION SCHEDULEConstructing a high-rise on a very tight site in London,
where the Strata project is located, comprises many challenges. One of the main focuses is to reduce disruptions to nearby communities and businesses and complete the construction work as fast as possible. It is therefore vital to adopt a construc-tion system that speeds up the construction schedule.
Structural frame designEstimates of the construction time of the three
concrete options were computed. The estimates for each option were based on same concrete strength, loadings,
Table 1—Slab material quantityStructure type
Structural item Unit PT RC1 RC2
Average slab area ft2 6781 6781 6781Overall area ft2 271,272 271,272 271,272
Slab thickness in. Approximately 8 (200 mm)
Approximately 10 (260 mm) 8.3*
Non-prestressed reinforcement rate lb/ft2 2.38 4.42 3.99PT strand rate lb/ft2 0.72 0 0
PT ducts rate (0.43 ft/ft2) lb/ft2 0.12 0 0PT anchors (0.01 pc/ft2) lb/ft2 0.08 0 0
*Value represents equivalent slab thickness. It is based on slab of 7.1 and 23.6 in. (180 and 600 mm) deep beams placed along long spans and perimeter to control deflection.
TECHNICAL PAPER

22 December 2012 | PTI JOURNAL
TECHNICAL PAPER
deflection control, and forming and labor resources. The floor cycles came out at 5, 6.5, and 8.5 days for the PT, RC1, and RC2 options, respectively. Consequently, for the 40 stories, RC1 yields a total increase of 60 working days with respect to the PT option and RC2 yields an increase of 140 working days with respect to PT. With additional forming and labor resources consisting of an entire slab forming set and back-propping, the floor cycle for the RC options can be improved; however, this additional forming adds—in addition to its cost—an environmental impact caused by the extra formwork material, its mobilization, and more waste. Time savings for the PT option is due to less material and hence less installation time and labor, stressing of the tendons and, consequently, faster deshoring. The actual floor cycle achieved for the PT slab was 4.5 days on average, yielding even greater time savings.
Construction management On job sites, as trades are interlinked, efficient coor-
dination and control of the work to minimize errors and enhance information-sharing significantly improve the construction workflow and deadlines. It is hard to quan-tify the related savings, but the project was completed 12 weeks ahead of the estimated schedule.
Structural detailingWhile the choice of the structural frame has a major
impact on the construction time period, small improve-ments from thorough detailing can also help in reducing the construction time. A simple example is the construction requirement for this project to avoid complicated, skewed blockouts at the PT anchor locations and the slabs’ curved edges. Skewed blockouts require more labor and material and, most importantly, would lead to increased friction losses at the anchor and higher risk of damage to the post-tensioning tendons. With efficient detailing, these blockouts were avoided at no extra cost or resources. Every anchor would have necessitated approximately 2 additional minutes for installation or, alternatively, more labor cost. This seems negligible, but when counting 2000 anchors required for the project, this amounts to 67 hours; therefore, this saved the site approximately 1.5 weeks on the PT trade schedule.
MATERIAL AND ENVIRONMENTAL RATESThe overall material quantity for the 40 stories is listed
in Table 2 along with the unit rates of embodied energy and embodied CO2.
The environmental factors listed are taken from the ICE report (Hammond and Jones 2008), which is based on life-cycle inventory (LCI) cradle-to-gate and 40% recycled content for steel. This reference focuses on energy and carbon dioxide factors without representation of other greenhouse gases. It was used due to its comprehensive database on concrete slab material and application to the UK market. The LCI approach was deemed satisfactory given the scarcity and variability of data on life-cycle assessment (LCA) or cradle-to-grave; the use of the same material type in all options; and the abundance of cradle-to-gate values, which are docu-mented by the material manufacturers (Sweet 2010). In addition, for database consistency, the wire and galva-nized sheet rates used herein for PT strands and duct are from virgin material, as no other values are given in the ICE source. However, PT strand and ducts can have up to 95% recycled content. The results are, therefore, very conservative and the reality would yield higher savings in the PT option.
ENVIRONMENTAL IMPACTThe cumulative environmental impact of the concrete
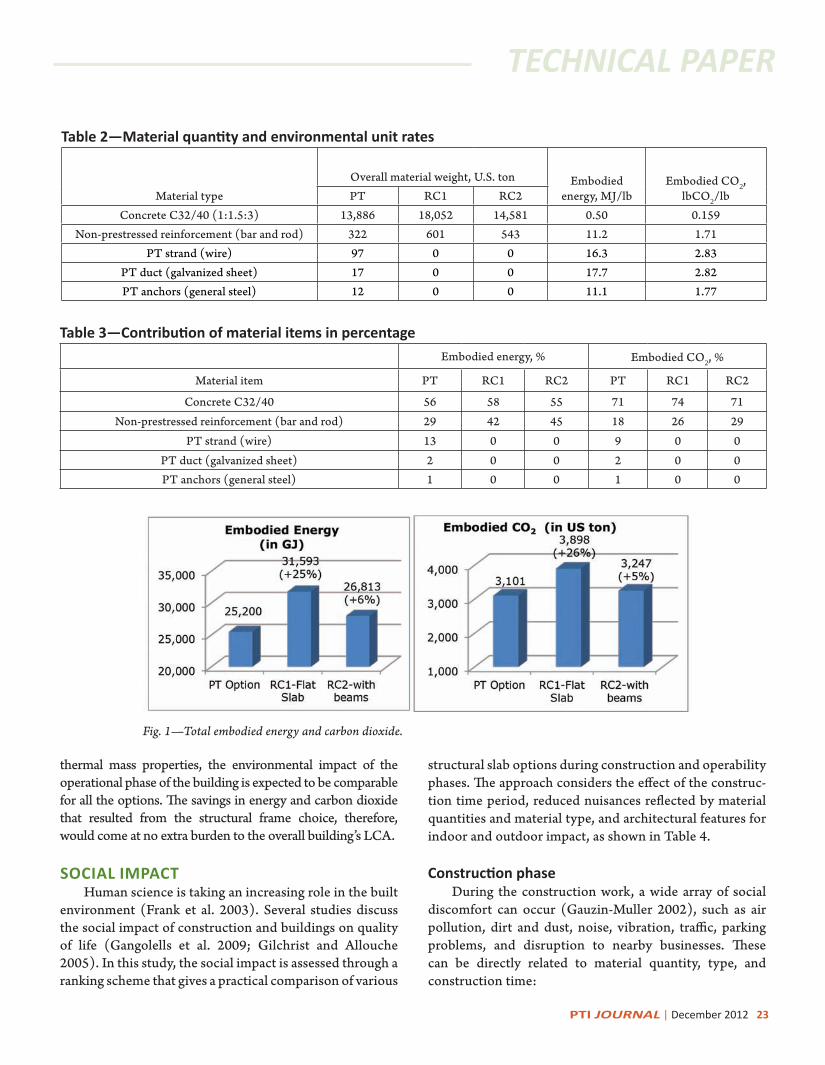
stories is shown in Fig. 1. The results point out that PT records the lowest embodied energy at 25,200 GJ and embodied CO2 at 3101 tons. An estimated 6393 GJ in energy and 797 tons in CO2 is added by using RC1 versus PT—an increase of approximately 25% in the overall embodied energy and CO2. Between PT and RC2, the environmental differences are not as pronounced; PT saves approximately 5% in energy and CO2. RC2, however, does not benefit from a simplified formwork that a flat slab presents. The existence of drop beams in RC2 requires elaborate formwork, more workmanship, changes to mechanical services distribution, and reduced layout flexibility.
The results can be extrapolated to determine the LCA of the concrete slabs. The transport, construction process, and demolition phases to cover gate-to-grave are estimated to add between 10 and 20% to the LCI results (Kawai et al. 2005; Guggemos and Horvath 2005; Nielsen 2008). Due to lack of a coherent database, more research is needed to obtain reliable numbers.
It is important to note that per Table 3, concrete alone accounts for 56% on average of the embodied energy of the slabs and 72% of total embodied CO2.
Moreover, as the three options involve cast-in-place concrete solid slabs and would benefit from the concrete’s
PTI JOURNAL | December 2012 23
TECHNICAL PAPER
thermal mass properties, the environmental impact of the operational phase of the building is expected to be comparable for all the options. The savings in energy and carbon dioxide that resulted from the structural frame choice, therefore, would come at no extra burden to the overall building’s LCA.
SOCIAL IMPACT Human science is taking an increasing role in the built
environment (Frank et al. 2003). Several studies discuss the social impact of construction and buildings on quality of life (Gangolells et al. 2009; Gilchrist and Allouche 2005). In this study, the social impact is assessed through a ranking scheme that gives a practical comparison of various
structural slab options during construction and operability phases. The approach considers the effect of the construc-tion time period, reduced nuisances reflected by material quantities and material type, and architectural features for indoor and outdoor impact, as shown in Table 4.
Construction phaseDuring the construction work, a wide array of social
discomfort can occur (Gauzin-Muller 2002), such as air pollution, dirt and dust, noise, vibration, traffic, parking problems, and disruption to nearby businesses. These can be directly related to material quantity, type, and construction time:
Table 2—Material quantity and environmental unit rates
Material typeOverall material weight, U.S. ton Embodied
energy, MJ/lbEmbodied CO
2,
lbCO2/lbPT RC1 RC2
Concrete C32/40 (1:1.5:3) 13,886 18,052 14,581 0.50 0.159Non-prestressed reinforcement (bar and rod) 322 601 543 11.2 1.71
PT strand (wire) 97 0 0 16.3 2.83PT duct (galvanized sheet) 17 0 0 17.7 2.82PT anchors (general steel) 12 0 0 11.1 1.77
Table 3—Contribution of material items in percentageEmbodied energy, % Embodied CO
2, %
Material item PT RC1 RC2 PT RC1 RC2
Concrete C32/40 56 58 55 71 74 71Non-prestressed reinforcement (bar and rod) 29 42 45 18 26 29
PT strand (wire) 13 0 0 9 0 0PT duct (galvanized sheet) 2 0 0 2 0 0PT anchors (general steel) 1 0 0 1 0 0
Fig. 1—Total embodied energy and carbon dioxide.

24 December 2012 | PTI JOURNAL
• Using less of the same material leads to less disrup-tion, reduced pollution, trucking, traffic conges-tion, deliveries, and waste. Because all options use concrete and reinforcement, based on the material quantities of Table 4, the options rank: 1) PT; 2) RC2; and 3) RC1.
• A faster construction cycle yields less disrup-tion and helps alleviate the negative nuisances of construction sites. The options rank: 1) PT; 2) RC1; and 3) RC2 in terms of time savings. The PT option saved the community approximately 3 months of construction time and all related disruptions.
Operational phaseDuring the operational phase, improving indoor living
conditions has a direct impact on economic and social bene-fits from increased productivity to better health. The average person spends 87% of their time indoors (Kleipis et al. 2001); thus, their well-being depends largely on the condi-tions of the interior spaces in terms of lighting, air quality, acoustics, sight openness (visual), and thermal comfort.
• Concrete has clear benefits for the aforementioned factors (applicable to all three options).
• Architecturally, a flexible and open indoor layout that a flat-slab system provides would contribute to better visual and living comfort. While both PT and RC1 options are based on flat slabs, RC2 includes drop beams. Such beams would lower the layout flexibility and restrain the view.
• Outdoors, efficient structures that reduce unnec-essary building height stemming from pure floor thickness also help the environment with a lesser shadowing effect, less cladding material, and all its repercussions in energy consumption. The slab thicknesses in Table 1 show that RC1 and RC2 would have yielded increases of 7.9 and 52.5 ft in overall building height, respec-
tively. A smaller building would also consume less energy in terms of its heating, cooling, and overall operation.
For the overall social impact, a weighted scoring scheme could be used by assigning an importance factor to each item. For Strata, the PT option ranks first in all categories, as summarized in Table 5.
ECONOMIC IMPACTAs with any project, cost-effectiveness plays an
important role in deciding on an optimal solution. When comparing overall cost impact, however, a holistic approach is needed to cover both direct and indirect cost.
Direct cost estimates for the three options were done according to UK unit prices from 2008 to 2009. The prices for PT, RC1, and RC2 yield 6.9£/ft2, 7.2£/ft2, and 7.8£/ft2, respectively, which include material and placement costs for concrete, non-prestressed reinforcement, PT strands, ducts, anchors, and formwork.
Further savings for the PT option came from indirect cost, such as reduced columns and foundation material due to the lighter concrete weight, savings in cladding material from the lowered building height, and the fast construc-tion schedule.
CONCLUSIONSThe concept of sustainability is at the forefront of many
aspects of our daily lives, and the area of construction is no exception. The United Nations World Commission on Environment and Development (Brundtland 1987) defines sustainability as “meeting the needs of the present without compromising the ability of future generations to meet their own needs.”
This study shows that building sustainable structures can be achieved without compromising social well-being, structural performance, or cost. The comparison between PT and RC structures indicates that structural efficiency
TECHNICAL PAPER
Table 4—Slab parametersMaterial item* Unit PT RC1 RC2
Material weight U.S. ton 14,334 18,652 15,124
Increase in material weight U.S. ton — 4318 790
Main material type — Concrete Concrete Concrete
Increase in construction time Days — 60 140
Increase in building height Foot — 7.9 52.5
Structural slab configuration — Flat Flat Drop beams*Increases shown in RC1 and RC2 columns are with respect to PT option.

PTI JOURNAL | December 2012 25
TECHNICAL PAPER
contributes to a building’s overall sustainability assess-ment. For the Strata project, the use of PT slabs saved approximately 25% in embodied energy (6400 GJ) and embodied carbon (797 tons of CO2) and yet it is the most economical solution. The results are based on structural efficiency alone and through an LCI of the slabs. On the social impact, the proposed ranking scheme shows that PT also has the best score for indoor living, outdoor living, and reduced construction disruption. This demonstrates that when structural efficiency is assessed at the design stage, it can result in considerable sustainability benefits. When deciding which structure type and material to use on a given building, the earlier sustainability factors are integrated into the decision-making process, the greater the possibilities of reaching sustainable solutions.
REFERENCESBrundtland, U. N., 1987, Our Common Future (Brundt-
land Commission Report)—General Assembly Resolution 42/187, Oxford University Press.
Frank, L.; Engelke, P.; and Schmid, T., 2003, Health and Community Design: The Impact of the Built Environment on Physical Activity, Island Press.
Gangolells, M.; Casals, M.; and Gasso, S. E., 2009, “A Methodology for Predicting the Severity of Environmental Impacts Related to the Construction Process of Residential Buildings,” Building and Environment, V. 44, pp. 558-571.
Gauzin-Muller, D., 2002, Sustainable Architecture and Urbanism: Concepts, Technologies, Examples, Birkhauser.
Gilchrist, A., and Allouche, E., 2005, “Quantification of Social Costs Associated with Construction Projects: State-of-the-Art Review,” Tunnelling and Underground Space Technology, V. 20, No. 1, pp. 89-104.
Guggemos, A., and Horvath, A., 2005, “Comparison of Environmental Effects of Steel- and Concrete-Framed Buildings,” Journal of Infrastructure Systems, ASCE, V. 11, No. 2, pp. 93-101.
Hammond, G., and Jones, C., 2008, Inventory of Carbon and Energy (ICE), University of Barth.
Kawai, K.; Sugiyama, T.; Kobayashi, K.; and Sano, S., 2005, “Inventory Data and Case Studies for Environ-mental Performance Evaluation of Concrete Structure Construction,” Journal of Advanced Concrete Technology, V. 3, No. 3, pp. 435-456.
Kleipis, N.; Nelson, W.; Ott, W.; Robinson, J.; Tsang, A.; Switzer, P. et al., 2001, “The National Human Activity Survey: A Resource for Assessing Human Exposure to Pollutants,” Journal of Exposure Analysis and Environmental Epidemiology, V. 11, pp. 231-252.
Nielsen, C., 2008, “Carbon Footprint of Concrete Buildings Seen in the Life Cycle Perspective,” Proceedings of the NRMCA 2008 Concrete Technology Forum, Denver, CO.
Schokker, A., 2010, The Sustainable Concrete Guide—Strategies and Examples, U.S. Green Concrete Council, Washington, DC, 89 pp.
Sweet, A., 2010, An Environmental Comparison of Framing Options in Multi-Story Building Construction, CCL, UK.
Table 5—Ranking of concrete options on social impactSocial factor PT RC1 RC2
Construction phaseReduced negative
social impacts 1 3 2
Faster construction cycle 1 2 3
Operational phaseIndoor impact 1 1 2
Outdoor impact 1 2 3Total points (lower is better) 4 8 10
Dr. Carol Hayek is the Chief Technical Officer for CCL Group. She has a wealth of expertise in the post-tensioning field. She is actively involved in committees at PTI, ACI and fib; and is a lecturer at Johns Hopkins University, Baltimore, MD. She received her MSE and PhD in civil engineering from Johns Hopkins University and holds an MBA from ESA Business School.
Saleem Kalil is an Associate at CCL Engineering located in Leeds, UK. He has been involved for over a decade in the design and construction of post-tensioned buildings and bridges around the world. He received his MSE and BS in civil engineering from Saint Joseph University in Beirut, Lebanon.

26 December 2012 | PTI JOURNAL
TECHNICAL PAPER
ASSESSMENT OF SECONDARY EFFECTS IN POST-TENSIONED FLAT PLATES
BY AMY HUFNAGEL AND THOMAS H.-K. KANG
The research was focused on determining the secondary, or hyperstatic, moment of post-tensioned concrete flat plate buildings of different dimensions, as well as investigating the secondary column axial forces induced by post-tensioning. The primary purpose of this research was to develop design charts regarding the secondary moment to aid practicing engineers in the preliminary design of post-tensioned flat plates. Prac-ticing engineers in the post-tensioned building construction industry often struggle to calculate the secondary moment of indeterminate structures because of the interrelation of many different variables, including the degree of post-tensioning and restraints, post-tensioning steel profile, and member sizes. The design aid charts produced contain the secondary moment for these provided building sizes. The other purpose of this research was to investigate the effect of post-tensioning on column axial forces and to determine the possibility of differential column shortening, which may occur at exterior building locations in very tall buildings. This paper describes the methods used in completing the aforementioned charts and analyzes the data and trends found throughout the project.
KEYwORDSBalanced moment; column axial force; flat plates; post-
tensioned concrete; primary moment; secondary moment.
INTRODUCTIONPrestressed concrete encompasses both pre-tensioned
and post-tensioned concrete structures, which both use high-strength materials as a means to counteract the stress of gravity loads that are placed on a structure. There are different areas of implementation for pre-tensioned and post-tensioned concrete; however, the focus of this research
is on cast-in-place post-tensioned concrete slabs. Post-tensioning is used for many reasons, including economy and building efficiency as well as the reduction of deflec-tion and cracking it provides. The use of post-tensioning can reduce the depth of slabs and story height, as well as improve the installations of “heating and electrical ducts, plumbing risers, and wall and partition surfaces” (Nilson et al. 2009). Post-tensioned flat plates have already been widely implemented into the design of both residential and commercial structures (Foutch et al. 1990).
This research uses the idea of the application of equiva-lent or balanced loads as a way to describe the effect of post-tensioning on the structures, that is, the load balancing method (Lin and Burns 1981). The load balancing method can be especially useful for analysis of indeterminate struc-tures such as continuous beams and two-way slabs. In post-tensioned flat plate construction, post-tensioning tendons with variable eccentricity are used to apply such balanced loads throughout the length of the slabs. Different loads can be achieved by different tendon profiles. Free-body diagrams are important tools to visually display the loads applied through post-tensioning, both axially along the tendon and vertically countering the applied loads. With slabs that use tendon eccentricity at the ends, forces at the ends of the beams or slabs may create end moments, although it is not typical for relatively thin two-way slabs.
Many different tendon profiles can be chosen for different building scenarios, and the choice depends on the necessary balanced loads. In buildings with slabs that stretch across multiple columns or supports, the shape of the tendon can be variable along the entire length of the span to best balance the applied loads. If uniformly distributed loads are being applied, the best tendon profile is typically a second-order parabolic shape. It is always important to consider not only the loads involved in the design, but also the economic aspect of the different tendon profiles, quantities of unbonded post-tensioning
PTI JOURNAL, V. 8, No. 2, December 2012. Received and reviewed under Institute journal publication policies. Copyright ©2012, Post-Tensioning Institute. All rights reserved, including the making of copies unless permission is obtained from the Post-Tensioning Institute. Pertinent discussion will be published in the next issue of PTI JOURNAL if received within 3 months of the publication.
PTI JOURNAL | December 2012 27
tendons and bonded reinforcing bars, and slab thickness and span length (Kang and Wallace 2008).
In cast-in-place post-tensioned flat plate construction, the slab is restrained against vertical deformation at the support, and such a restraint causes secondary moments in the slab as well as secondary axial forces in the column, both of which should be considered in the design. However, determination of the induced secondary moments is very cumbersome during the preliminary design stage because of the interrelation of many different variables, including the degree of post-tensioning and restraints, post-tensioning steel profile, and member sizes. The objectives of this research are to determine the secondary moment of post-tensioned concrete flat plates, to provide design aid charts regarding this secondary moment, and to investigate the effect of the forces induced by post-tensioning on the columns as an axial force. The purpose of this paper is to describe the methods used in completing this research, to provide a summary of the data collected, and to analyze the data found throughout the project to draw conclusions about certain characteristics of post-tensioned flat plate design.
METHODOLOGYThis research was completed in two main portions,
the first involving the determination of secondary, or hyperstatic, slab moments (Msec) in indeterminate struc-tures; and the second focusing on the secondary effects of post-tensioning on column axial forces. The process for conducting this research involved using a finite element program for both portions of the research.
The secondary moment (Msec) is defined as the moment due to reactions induced by prestressing (with a load factor of 1) according to ACI 318-08 (Section 18.10.3) (ACI Committee 318 2008). In monolithic concrete construction, as the columns constrain transla-tion—deflection and rotation of the slab that are caused by post-tensioning—additional reactions are developed in the columns and these additional column axial forces and moments generate hyperstatic (or secondary) moments and shears in the slab (Alaami and Bommer 1999). There are two methods to determine the Msec value: 1) the direct method; and 2) the indirect method. In the direct method, the column reactions due to post-tensioning can be first obtained by imposing balanced loads on the slabs, and then these column reactions are separately applied to each slab at the top and bottom to determine the secondary moment Msec. In the indirect method, which was used in this research, first the balanced moment Mbal in the concrete generated
by the post-tensioning forces was found for model build-ings of different dimensions. Next, the primary moment (Mp = ePe) was found by evaluating the eccentricities e of the placement of the tendons at certain locations and the effective post-tensioning forces Pe. Finally, from this information, the secondary moment Msec was calculated as (Mbal – Mp). Both the direct and indirect methods would yield the same solution when using the Equivalent Frame Method (refer to ACI 318-08 Sections 13.7 and 18.12.1) (Alaami and Bommer 1999).
For the second portion of the research, the column axial forces induced solely by post-tensioning were found and then analyzed to consider other effects, including differential column shortening. A detailed step-by-step procedure is provided in the following sections.
Model buildingsA total of 96, 3-bay by 3-bay, two-story model build-
ings were created in a structural analysis program SAP2000 (CSI 2009) as shown in Fig. 1 and Tables 1 and 2 (refer to Fig. 2 for notation and directions). The selected dimen-sions of the buildings are typical of those used in actual post-tensioned flat plate construction (PTI Committee DC-20 2010). The dimensions were input to the program, including the story height, bay width, number of bays in each direction, and number of stories. Fixed joint restraints were defined for the bottom of the columns. The concrete used was assumed to have a compressive strength of 5000 psi. For each dimension provided, three trials were used to explore the effect of different column sizes. Keeping all other variables consistent, only the column
Fig. 1—Office flat plate buildings with 20 x 25 ft slab panels.
TECHNICAL PAPER

28 December 2012 | PTI JOURNAL
TECHNICAL PAPER
sizes were changed from 20 x 20 in. to 24 x 24 in. and 28 x 28 in. The slab-beam sections were defined to function as equivalent slab-beams, using a length l2 reaching the full transverse span with a thickness h, as provided, and a width depending on the location of the slab-beam and the tributary area. The interior slab-beams were defined with a width equivalent to the transverse width of the bay, while exterior slab-beams received half of this width plus half of the column transverse width (refer to Fig. 2). The equivalent slab-beams were applied in both directions. The end offsets were defined as half the distance of the column width, embedded halfway into the column, giving the slab-beams a rigid-zone factor of 1. The column stiffness was not reduced, as the stiffness of torsional elements (refer to Section 13.7.2.3 of ACI 318-08) is likely to be significantly higher than that of nonprestressed concrete flat plates due to the in-plane (membrane) constraints provided by the post-tensioning. This was shown from previous experi-mental studies (Kang 2004; Kang and Wallace 2005) and also is commonly used at both the service limit and ulti-mate limit states (under gravity loads) in practice (PTI Committee DC-20 2010; also refer to Section 4.3.1 of PTI DC20.9-11 [PTI Committee DC-20 2011]). Figure 1 shows a sample of one of the buildings within the program.
Factored gravity loads and momentsFirst, the gravity loads were determined for each
building model and applied as trapezoidal loads along the
Table 1—Design options for office flat plate building models
Bay width in transverse direction
(x-direction), ft
Slab span length in longitudinal direction
(y-direction), ftSlab thickness,
in.
20
25 7.5
27 8
30 8.5
25
25 7.5
27 8
30 8.5
30
25 8.5
27 8.5
30 8.5
35
25 10
27 10
30 10
Table 2—Design options for residential flat plate building models
Bay width in transverse direction
(x-direction), ft
Slab span length in the longitudinal direction
(y-direction), ftSlab thickness,
in.
20
21 5.5
24 6.5
27 7.5
30 8
32 8.5
25
21 7
24 7
27 7.5
30 8
32 8.5
28
21 7.5
24 7.5
27 7.5
30 8
32 8.5
30
21 8
24 8
27 8
30 8
32 8.5
Fig. 2—Model building plan.

PTI JOURNAL | December 2012 29
TECHNICAL PAPER
length of each slab-beam to account for accurately shaped tributary areas, which can be seen in Fig. 3. For buildings of different bay widths in the two principal directions, the longer bay direction has a trapezoidal gravity load, whereas the load distribution of the shorter bay is triangular (Fig. 3). If the span lengths along both principal directions are equal, the tributary areas are also equal for the slab-beams in each of these directions (Fig. 4).
A dead load was applied based on a unit weight of concrete of 150 lb/ft3 for both the office and residential buildings. A sustained dead load of 30 lb/ft2 and a live load of 50 lb/ft2 were also applied to the office buildings, while a sustained dead load of 10 lb/ft2 and a live load of 55 lb/ft2 were applied to the residential buildings. These loads are commonly used in practice (PTI Committee DC-20 2010). Figures 3 and 4 show the loads applied to the building using the load distribution caused by the tribu-tary areas. To determine the factored gravity moments Mu, load factors of 1.2 and 1.6 were used for the combined dead
loads (sustained dead load in addition to the self-weight of the concrete) and the live loads, respectively, considering only the factored gravity load combination.
Balanced moments due to post-tensioningThe next step involved finding the balanced moment
Mbal due to post-tensioning. For this part, the buildings were again created in SAP2000 (CSI 2009) using the same methods previously discussed. This time, the balanced loads wbal induced by post-tensioning were applied instead of the factored gravity loads. The balanced loads were determined by analyzing the tendon profiles. Parabolic tendon profiles were used, as can be seen in Fig. 5. Also, horizontal end forces due to post-tensioning were applied at the perimeter of each floor (Fig. 5).
The number of tendons was determined to meet ACI 318 flexural and minimum precompression require-ments. The tendon starts at the center of gravity of the concrete slab (c.g.c.) at the exterior. Specified clear covers governed the eccentricities of the tendon at the peak of the parabolic shape. The distance from the slab bottom to the lowest point in the parabolic center of gravity of the pressing force (c.g.s.) curve in the exterior span was 1.75 in. (Fig. 5). This point is located in the middle of the exterior span. The highest point of the c.g.s. curve can be
Fig. 3—Gravity load distribution based on tributary area for model buildings with rectangular panels.
Fig. 4—Gravity load distribution based on tributary area for model buildings with square panels.

30 December 2012 | PTI JOURNAL
found over the interior column centerline, 1.5 in. from the top of the slab. The distance from the soffit to the lowest c.g.s. for the interior span is 1.25 in. The tendon c.g.s values used are based on typical practice (PTI Committee DC-20 2010) and consistent with those in Chapter 6 of PTI DC20.9-11.
Another important aspect of parabolic tendon profiles is the presence of inflection points along the length of the tendon. In this profile, two can be found in each span. These changes in curvature create both upward and downward forces due to post-tensioning. The change in direction of the force at the inflection points of the tendon is illustrated in Fig. 5. To provide a smooth transition between the changes in positive and negative curvature, the inflection points must be located at specific locations that satisfy the following conditions (refer to Fig. 6 for derivation and notation).
a b
a bl l
=(1)
c d
c dl l
= (2)
where a, b, c, and d are the vertical distances between the c.g.s. and the inflection point as shown in Fig. 5, and la, lb, lc, and ld are the lengths of portions of the span considered as shown in Fig. 5. These conditions were based on the basic geometry of the tangential force at the location of the inflection points. The heights and lengths shown in Fig. 5 are dependent on one another in the determination of the inflection points. The geometrical conditions ensured that the length of the slab span and the thickness of the slab were both considered accurately, as well as ensured that the angles shown in Fig. 6 were equal. Although many different scenarios related length between inflection points and distance between inflection point and maximum and minimum heights of the tendon in a way that satisfied the tangential force equilibrium, typical tendon profiles influenced the final choice of inflection point location. In this study, the inflection points were located at 8 and 92% of the length of the span (~ l2/12), with the lowest point of the tendon at the exact center of the span, for both the interior and exterior spans.
The balanced loads applied through post-tensioning involved upward and downward uniformly distributed
Fig. 5—Tendon profile and balanced loads induced by post-tensioning.
Fig. 6—Free body diagram of tendon at exterior half of exte-rior span.
TECHNICAL PAPER

PTI JOURNAL | December 2012 31
forces of differing magnitudes due to the presence of these inflection points. An example of the loads induced by post-tensioning can be seen in Fig. 5. The placement of the inflection points at these specific positions resulted in a smooth transition between positive and negative curvature as well as an equilibrium of vertical balanced loads acting on the concrete slab within a given floor. The uniform downward load applied by each tendon at the left-hand edge of the exterior span (refer to Fig. 5 or 6) was found using Eq. (3), while the uniform upward load was found using Eq. (4).
sin tandownward e a e a ea
aP P P
l
w = q ≈ q = 2
(3)
sin tanuplift e b e b eb
bP P P
l
w = q ≈ q = 2 (4)
where Pe is the total effective stress of tendons, and qa and qb are the angle between the horizontal line and tangential line at the inflection point, respectively, as shown in Fig. 6.
The buildings were all analyzed to view the deflected shape as well as the shear and moment diagrams. The moments produced (Mbal) have the opposite effect of the factored gravity moments Mu; therefore, the locations of negative and positive moments are opposite (Fig. 7).
Primary momentThe primary moment Mp was hand-calculated by
taking into account the force applied by the amount of steel used in each tendon, the number of tendons used, and the eccentricity of each tendon as follows
p eM P e=
(5)
where e is the tendon eccentricity with respect to the c.g.c (that is, the distance between the c.g.s. and c.g.c.). The number of tendons needed for each span was first deter-mined based on the minimum precompressive stress fpc in the concrete due to the tendons—125 psi as specified by ACI 318-08 Section 18.12.4. Note that the effective force applied for each Grade 270, 1/2 in. diameter tendon (cross-sectional area Aps = 0.153 in.2) is approximately 27 kips, 65% of the ultimate tensile force of a tendon
(Aps fpu). The number of tendons was then confirmed or modified based on the nominal moment strength check, as will be discussed later in this paper. Table 3 presents the number of tendons used for each model.
Secondary momentThe secondary, or hyperstatic, moment Msec is gener-
ated from column reactions induced by post-tensioning. After finding the primary moment and the balanced moment due to post-tensioning, the secondary moment was found using the following equation (that is, the indi-rect method).
bal pM M M= −sec
(6)
Note that no load factors are taken into account in Eq. (6). Table 4 shows the secondary moments at five loca-tions for the selected office building model (all 96 model results are available in Appendix A* or by Hufnagel [2011]). Because the dimensions of the building are symmetric, only half of the moments across the length of the building were considered (Fig. 7). Only the y-direction of the building was considered (refer to Fig. 2 for the y-direction) because this was the variable in question for each scenario. Addi-tionally, Table 4 provides the values for the factored gravity moments, moments used to compute required strength (Mreq’d = fMu + Msec), and design moment strengths (fMn) for the selected locations. The design moment strength is discussed in the following section.
*This Appendix includes the design charts mentioned in this paper; it can be downloaded from the PTI website at www.post-tensioning.org.
Fig. 7—Balanced moment diagram of exterior frame for office building model with 20 x 25 ft slab panels and 20 x 20 in. columns.
TECHNICAL PAPER

32 December 2012 | PTI JOURNAL
Design moment strengthFirst, the required amount of bonded reinforcing bars
was determined. The bonded steel reinforcement used in the slabs was determined as per ACI 318-08 Section 18.9. Number 4 and 5 bars were considered, as these are typical sizes for post-tensioned concrete slabs. Next, the following equation was used to determine the design moment strength at the five selected locations.
n p ps p s y
a aM A f d A f d f = − + − 2 2
(7)
where f is the strength reduction factor (= 0.9 for this project); Ap is the total area of post-tensioning tendons; fps is the tendon stress at nominal moment strength; dp is the distance from the extreme compression fiber to the centroid of post-tensioning tendons; a is the depth of the rectangular stress block; As is the total area of bonded reinforcement; fy is the yield strength of bonded reinforce-ment; and d is the distance from the extreme compression fiber to the centroid of bonded tension reinforcement. The design moment strength was then compared to the required moment strength to ensure that it satisfied the strength requirement according to Section 18.10.3 of the
Table 3—Total number of tendons designed for building models
Building type
Bay width or span length, ft
Total number of tendons
Longitudinal (y-direction) Transverse (x-direction)
Transverse Longitudinal Exterior Interior Exterior Interior
Office
2025 5 9 6 1127 5 9 7 1330 5 10 8 15
2525 6 11 6 1127 6 12 7 1330 6 12 8 15
3025 8 15 6 1227 8 15 7 1330 8 15 8 15
3525 10 20 7 1427 10 20 8 1630 10 20 9 17
Residential
20
21 4 7 4 724 4 8 5 927 5 9 6 1230 5 9 7 1432 5 10 8 16
25
21 5 10 5 924 5 10 5 1027 6 11 6 1230 6 11 7 1432 6 11 8 16
28
21 6 12 5 924 6 12 6 1127 6 12 6 1230 7 13 7 1432 7 14 8 16
30
21 7 14 5 1024 7 14 6 1127 7 14 7 1330 7 14 7 1432 8 15 8 16
TECHNICAL PAPER
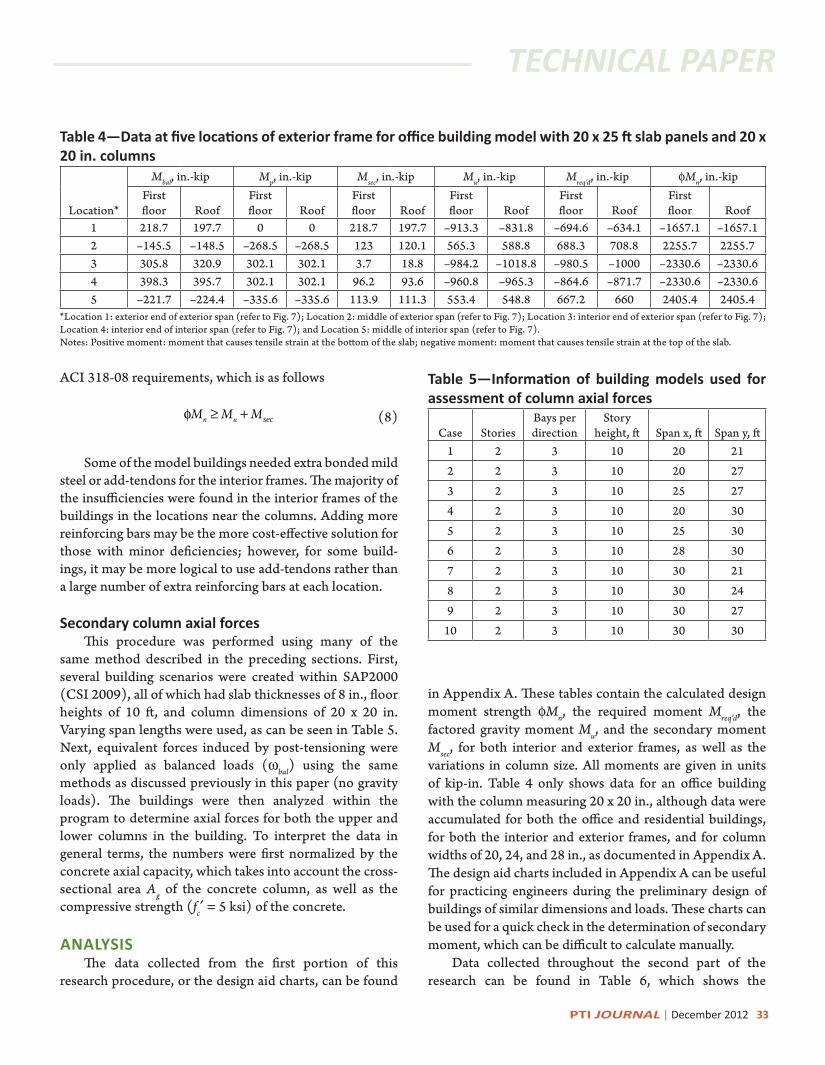
PTI JOURNAL | December 2012 33
ACI 318-08 requirements, which is as follows
n uM M Mf ≥ + sec (8)
Some of the model buildings needed extra bonded mild steel or add-tendons for the interior frames. The majority of the insufficiencies were found in the interior frames of the buildings in the locations near the columns. Adding more reinforcing bars may be the more cost-effective solution for those with minor deficiencies; however, for some build-ings, it may be more logical to use add-tendons rather than a large number of extra reinforcing bars at each location.
Secondary column axial forcesThis procedure was performed using many of the
same method described in the preceding sections. First, several building scenarios were created within SAP2000 (CSI 2009), all of which had slab thicknesses of 8 in., floor heights of 10 ft, and column dimensions of 20 x 20 in. Varying span lengths were used, as can be seen in Table 5. Next, equivalent forces induced by post-tensioning were only applied as balanced loads (wbal) using the same methods as discussed previously in this paper (no gravity loads). The buildings were then analyzed within the program to determine axial forces for both the upper and lower columns in the building. To interpret the data in general terms, the numbers were first normalized by the concrete axial capacity, which takes into account the cross-sectional area Ag of the concrete column, as well as the compressive strength (fc′ = 5 ksi) of the concrete.
ANALYSISThe data collected from the first portion of this
research procedure, or the design aid charts, can be found
in Appendix A. These tables contain the calculated design moment strength fMn, the required moment Mreq’d, the factored gravity moment Mu, and the secondary moment Msec, for both interior and exterior frames, as well as the variations in column size. All moments are given in units of kip-in. Table 4 only shows data for an office building with the column measuring 20 x 20 in., although data were accumulated for both the office and residential buildings, for both the interior and exterior frames, and for column widths of 20, 24, and 28 in., as documented in Appendix A. The design aid charts included in Appendix A can be useful for practicing engineers during the preliminary design of buildings of similar dimensions and loads. These charts can be used for a quick check in the determination of secondary moment, which can be difficult to calculate manually.
Data collected throughout the second part of the research can be found in Table 6, which shows the
Table 4—Data at five locations of exterior frame for office building model with 20 x 25 ft slab panels and 20 x 20 in. columns
Location*
Mbal, in.-kip Mp, in.-kip Msec, in.-kip Mu, in.-kip Mreq’d, in.-kip fMn, in.-kipFirst floor Roof
First floor Roof
First floor Roof
First floor Roof
First floor Roof
First floor Roof
1 218.7 197.7 0 0 218.7 197.7 –913.3 –831.8 –694.6 –634.1 –1657.1 –1657.12 –145.5 –148.5 –268.5 –268.5 123 120.1 565.3 588.8 688.3 708.8 2255.7 2255.73 305.8 320.9 302.1 302.1 3.7 18.8 –984.2 –1018.8 –980.5 –1000 –2330.6 –2330.64 398.3 395.7 302.1 302.1 96.2 93.6 –960.8 –965.3 –864.6 –871.7 –2330.6 –2330.65 –221.7 –224.4 –335.6 –335.6 113.9 111.3 553.4 548.8 667.2 660 2405.4 2405.4
*Location 1: exterior end of exterior span (refer to Fig. 7); Location 2: middle of exterior span (refer to Fig. 7); Location 3: interior end of exterior span (refer to Fig. 7); Location 4: interior end of interior span (refer to Fig. 7); and Location 5: middle of interior span (refer to Fig. 7).Notes: Positive moment: moment that causes tensile strain at the bottom of the slab; negative moment: moment that causes tensile strain at the top of the slab.
Table 5—Information of building models used for assessment of column axial forces
Case StoriesBays per direction
Story height, ft Span x, ft Span y, ft
1 2 3 10 20 21
2 2 3 10 20 27
3 2 3 10 25 27
4 2 3 10 20 30
5 2 3 10 25 30
6 2 3 10 28 30
7 2 3 10 30 21
8 2 3 10 30 24
9 2 3 10 30 27
10 2 3 10 30 30
TECHNICAL PAPER

34 December 2012 | PTI JOURNAL
percentage of the column axial force to the concrete axial capacity for each of story of each building. Negative numbers designate columns in tension, while positive number corre-late to compression. They are organized by column number designation, which is illustrated in Fig. 2, as well as their building case number, which can be found in Table 5.
Table 7 shows the ratio of axial forces (P1/P2) between the first and second floors as determined by the numbers found in the structural analysis program (CSI 2009), where P1 and P2 are the column axial forces due to post-tensioning in the first- and second-floor columns, respectively. Most of the ratios exceed 2 significantly, and the ratio is as high as 4
Table 6—Column axial forces only due to post-tensioningCase Floor A1 A2 A3 B1 B2 B3 C1 C2 C3 D1 D2 D3
11 –3.67 –0.94 –0.95 –0.93 5.52 5.49 –0.91 5.55 5.52 –3.66 –0.91 –0.93
2 –1.64 –0.33 –0.34 –0.33 2.30 2.28 –0.32 2.31 2.30 –1.63 –0.32 –0.33
21 –3.44 –1.36 –1.37 0.01 4.75 4.73 0.03 4.79 4.77 –3.42 –1.33 –1.34
2 –1.47 –0.37 –0.37 –0.01 1.82 1.82 –0.02 1.85 1.84 –1.46 –0.35 –0.36
31 –3.42 –1.13 –1.14 –0.65 5.18 5.15 –0.63 5.21 5.18 –3.41 –1.11 –1.12
2 –1.49 –0.37 –0.38 –0.22 2.07 2.06 –0.21 2.09 2.07 –1.48 –0.36 –0.37
41 –3.25 –1.45 –1.46 0.02 4.63 4.61 0.05 4.67 4.66 –3.24 –1.41 –1.42
2 –1.38 –0.37 –0.37 –0.03 1.76 1.76 –0.02 1.78 1.78 –1.37 –0.35 –0.36
51 –2.93 –1.14 –1.16 –0.36 4.41 4.39 –0.35 4.44 4.42 –2.92 –1.12 –1.13
2 –1.27 –0.36 –0.37 –0.14 1.75 1.74 –0.13 1.77 1.76 –1.27 –0.35 –0.35
61 –3.71 –1.41 –1.42 –1.04 6.15 6.12 –1.03 6.18 6.15 –3.70 –1.38 –1.40
2 –1.68 –0.54 –0.54 –0.41 2.62 2.60 –0.41 2.63 2.62 –1.67 –0.52 –0.53
71 –3.20 –0.19 –0.21 –1.47 4.87 4.83 –1.46 4.89 4.85 –3.19 –0.17 –0.19
2 –1.36 –0.11 –0.12 –0.40 1.89 1.87 –0.40 1.90 1.88 –1.36 –0.10 –0.11
81 –3.32 –0.44 –0.44 –1.26 5.11 4.96 –1.27 5.05 4.92 –3.29 –0.50 –0.39
2 –1.44 –0.18 –0.18 –0.37 2.05 1.97 –0.38 2.01 1.95 –1.43 –0.21 –0.16
91 –3.40 –0.80 –0.82 –1.01 5.21 5.17 –1.00 5.23 5.20 –3.38 –0.78 –0.80
2 –1.48 –0.30 –0.30 –0.32 2.09 2.08 –0.31 2.11 2.09 –1.48 –0.29 –0.29
101 –3.25 –0.98 –0.99 –0.98 5.19 5.16 –0.96 5.22 5.19 –3.24 –0.96 –0.97
2 –1.42 –0.34 –0.35 –0.34 2.10 2.09 –0.34 2.12 2.10 –1.41 –0.33 –0.34All units: kips.
Table 7—Ratio of column axial forces (P1/P2) between first and second floors only due to post-tensioningCase A1 A2 A3 B1 B2 B3 C1 C2 C3 D1 D2 D3
1 2.24 2.85 2.79 2.82 2.4 2.41 2.84 2.4 2.4 2.25 2.84 2.82
2 2.34 3.68 3.7 –1* 2.61 2.6 –15* 2.59 2.59 2.34 3.8 3.72
3 2.3 3.05 3 2.95 2.5 2.5 3 2.49 2.5 2.3 3.08 3.03
4 2.36 3.92 3.95 –0.7* 2.63 –2.6* –2.5* 2.62 2.62 2.36 4.03 3.94
5 2.31 3.17 3.14 2.57 2.52 2.52 2.69 2.51 2.51 2.3 3.2 3.23
6 2.21 2.61 2.63 2.54 2.35 2.35 2.51 2.35 2.35 2.22 2.65 2.64
7 2.35 1.7 1.75 3.68 2.58 2.58 3.65 2.57 2.58 2.35 1.7 1.73
8 2.31 2.44 2.44 3.41 2.49 2.52 3.34 2.51 2.52 2.3 2.38 2.44
9 2.3 2.67 2.73 3.16 2.49 2.49 3.23 2.48 2.49 2.28 2.69 2.76
10 2.29 2.88 2.83 2.88 2.47 2.47 2.82 2.46 2.47 2.3 2.91 2.85*The axial force is close to zero either in compression or in tension.
TECHNICAL PAPER

PTI JOURNAL | December 2012 35
at the column location D2 of the Case 4 building (refer to Table 7 and Fig. 2). This implies that the reactions due to post-tensioning of the roof floor are smaller than those of the first floor. Otherwise, the axial force ratio between the first and second floors would have been approximately 2.
Because some of the columns were found to be in compression and some in tension, this also poses a potential problem of differential column shortening (ddiff) between the exterior and interior columns. To quantify these effects, the column shortening d was found for each column based on the following equation.
col
g c
PLA E
Dd =
(9)
where d is the column axial deformation; DP is the column axial force only due to post-tensioning; Lcol is the column height; Ag is the gross cross-sectional column area; and Ec is the modulus of elasticity of concrete, estimated to be 57,000√fc′. This equation was used for all columns, including
those on the first and second floors. It was confirmed that the sum of the column axial forces in all columns at each floor was equal to zero. The differential column shortening ddiff was obtained from the difference (dint – dext) in column axial deformation between adjacent interior and exterior columns. Maximum differential column shortening was observed between a corner column and an adjacent interior column. The two floors were then combined to give the total differential column shortening at the base level, which is shown in Table 8.
DISCUSSION OF RESULTSSecondary slab moments
Figures 8 through 11 show the moment diagrams for the different moments found in the first portion of the research for the office building with 20 x 25 ft slab panels and 20 x 20 in. columns. These diagrams show the opposite effects of the factored gravity loads and the balanced loads and are also useful in analyzing the relationship between the different variables. The balanced moment diagram has
Table 8—Differential column shortening
Case Floor
Differential column force, kips Differential column shortening, in.
A1-A2 B1-B2 C1-C2 D1-D2 A1-A2 B1-B2 C1-C2 D1-D2
1First –2.73 –6.45 –6.46 –2.75 –0.00030 –0.00068 –0.00068 –0.00030
Roof –1.31 –2.63 –2.63 –1.31 — — — —
2First –2.08 –4.74 –4.76 –2.09 –0.00024 –0.00049 –0.00049 –0.00024
Roof –1.1 –1.83 –1.852 –1.11 — — — —
3First –2.29 –5.83 –5.84 –2.3 –0.00025 –0.00060 –0.00061 –0.00025
Roof –1.12 –2.29 –2.3 –1.12 — — — —
4First –1.8 –4.61 –4.62 –1.83 –0.00021 –0.00048 –0.00048 –0.00021
Roof –1.01 –1.79 –1.8 –1.02 — — — —
5First –1.79 –4.77 –4.79 –1.8 –0.00020 –0.00050 –0.00050 –0.00020
Roof –0.91 –1.89 –1.9 –0.92 — — — —
6First –2.3 –7.19 –7.21 –2.32 –0.00026 –0.00076 –0.00076 –0.00026
Roof –1.14 –3.03 –3.04 –1.15 — — — —
7First –3.01 –6.34 –6.35 –3.02 –0.00032 –0.00064 –0.00064 –0.00032
Roof –1.25 –2.29 –2.3 –1.26 — — — —
8First –2.88 –6.37 –6.32 –2.79 –0.00031 –0.00065 –0.00065 –0.00030
Roof –1.26 –2.42 –2.39 –1.22 — — — —
9First –2.6 –6.22 –6.23 –2.6 –0.00028 –0.00064 –0.00064 –0.00028
Roof –1.18 –2.41 –2.42 –1.19 — — — —
10First –2.27 –6.17 –6.18 –2.28 –0.00025 –0.00064 –0.00064 –0.00025
Roof –1.08 –2.44 –2.46 –1.08 — — — —
TECHNICAL PAPER

36 December 2012 | PTI JOURNAL
Fig. 8—Factored gravity moment diagram for office building model with 20 x 25 ft slab panels and 20 x 20 in. columns.
Fig. 9—Balanced moment diagram for office building model with 20 x 25 ft slab panels and 20 x 20 in. columns.
Fig. 10—Primary moment diagram for office building model with 20 x25 ft slab panels and 20 x 20 in. columns.
TECHNICAL PAPER

PTI JOURNAL | December 2012 37
a parabolic shape, as does the primary moment diagram. When the primary moment is subtracted from the balanced moment, the result is the secondary moment, which exhibits an essentially linear shape (Fig. 11).
Notable trends were found in analyzing the data collected in the design tables. The dimensions of the buildings seem to directly correlate to the magnitude of the secondary moment. For each building dimension (l2) provided for the transverse direction, several options were given for the longitudinal direction (refer to Fig. 12). As the length of l2 increases, the value found for the secondary moment increases in magnitude. Also, for the given l2, the span aspect ratio of l2 to l1 affects the magnitude of the secondary moment Msec (Fig. 12); the larger the longitu-dinal span length l2, the greater Msec will be (all other param-eters being equal). These trends are mainly due to the fact that the more tendons are used for the larger l2, as indicated in Table 3. The information on the magnitude of Msec may be
useful to practicing engineers, who may be able to formu-late better estimates after looking at the trends in the data and comparing to the dimensions and loads of the building being designed.
For interior frames, the secondary moments are typically much higher in magnitude. This can be partially attributed to the fact that more post-tensioning tendons are used in the tributary area of the interior frames than that of the exterior frames. For both interior and exterior frames, the secondary moments increased with the increased column dimension in the longitudinal direction, except adjacent to the interior columns where an increase in column dimension seems to decrease the secondary moment slightly. These trends were found in the data for both the office buildings and the resi-dential buildings (refer to Appendix A).
As expected, the loads applied on the buildings with the larger longitudinal spans created factored gravity moments (Mu) of greater magnitudes. The increase in these moments,
Fig. 11—Secondary moment diagram for office building model with 20 x 25 ft slab panels and 20 x 20 in. columns.
Fig. 12—Secondary moment versus slab span aspect ratio (l2/l1) for various longitudinal span lengths (l2).
TECHNICAL PAPER

38 December 2012 | PTI JOURNAL
combined with the increase in secondary moments, results in a greater required moment at the midspan, where the maximum positive gravity moment occurs. At the end of each span, on the other hand, the increase in (positive) secondary moment results in a smaller required moment, as it has the opposite sign of the (negative) factored gravity moment. However, when the post-tensioned flat plate frame is subjected to significant lateral loading, causing a positive moment at the face of the column, the positive secondary moment can be a critical issue in the slab design. This is particularly true at the exterior connection and at the interior face of the interior column. The amount of the secondary moment at the exterior face of the interior column is typically very small or almost negligible (Fig. 11). Figure 10 also compares secondary moments in the first-floor and roof levels, indicating the fact that the lower floor slabs experienced greater numbers in comparison to the upper-floor slabs.
Figure 13 shows a graph comparing the percentage of the secondary moment with regard to the factored gravity moment against the slab span-depth ratio. The secondary moment can be as much as 40% of the required positive moment for some of the buildings; however, this number decreases as the slab span-depth ratio increases. This means that although large span buildings typically have larger secondary moments in comparison to smaller span build-ings, the secondary moment may affect the smaller build-ings more drastically as it is a much larger portion of the required moment. At the corner connections of smaller buildings, the secondary moment is even greater than the factored negative gravity moment (Fig. 11); thus, the gravity load combination generates the positive required moment demand at the corner of those buildings.
Comparison to results from ADAPT-Builder Floor ProResults of the model buildings from the research completed
using SAP2000 were compared to those done using ADAPT-Builder Floor Pro 2010 (ADAPT 2010), a three-dimensional finite element program commonly used in the industry. It is noted that ADAPT-Builder employs only the finite element method (not the Equivalent Frame Method incorporated in ADAPT-PT). This program models each floor individually and is not capable of modeling a multi-story system.
First, a floor slab of the selected building was modeled (Fig. 14). Ten-foot columns with fixed end restraints were provided on the bottom of the slab; however, the presence of the top column really did not affect the ADAPT-Builder results of the secondary moment, nor did the column end boundary (or restraint) conditions. The same number of tendons used previously remained consistent. Banded tendons in the N-S direction and distributed tendons in the E-W direction were used. The same parabolic tendon profile was attempted to be used as previously discussed. Note that the lowest and highest points of the c.g.s. curve as well as inflection point locations can only be input in the ADAPT-Builder.
For each design section, secondary moment diagrams can be viewed, and these secondary moments of the inte-rior and exterior frames for the selected model buildings are indicated in Table 9. A comparison of the values for secondary moments acquired from SAP2000 and ADAPT-Builder can also be found in Table 9. In analyzing the data, the values for secondary moments from the two programs vary a significant amount; however, the trends are very similar. Both produced essentially linear distributions of hyperstatic moment within a span for each frame (Fig. 15 and 16), with the peak value nearest to the exterior column
Fig. 13—Secondary moment as of percentage of required moment versus slab span-depth ratio (l1/h).
TECHNICAL PAPER

PTI JOURNAL | December 2012 39
of the exterior spans of each frame, or Location 1, as previ-ously specified. The locations of interest in the interior span of each frame showed very similar values, while the lowest recorded secondary moment was found near the interior column in the exterior span of each frame.
The difference in values acquired between the two programs seems most significant at the location near the interior column in the exterior span of each frame. While this location was consistently the area of smallest secondary moment, SAP2000 recorded somewhat lower values than that of ADAPT-Builder. On the other hand, at the location near the exterior column in the exterior span, the secondary moment monitored from ADAPT-Builder was consistently lower than that of SAP2000. Possible reasons for discrepan-cies between the values between the two problems include many differences in modeling. SAP2000 modeled two-story buildings with three bays, or four frames, in each direction. ADAPT-Builder was capable of modeling only one story in each simulation, not reflecting the discrepancy in the boundary conditions at the bottom of the column. Given the fact that the column end fixity and the presence of the top column did not affect the secondary moment results, the boundary restraints used for the column bottom supports in ADAPT-Builder appear to be simple supports, which may lead to a more flexible system than that in SAP2000. On the other hand, the Equivalent Frame Method used in this study did not account for the reduced column stiffness due to the torsional element’s flexibility, as the in-plane constraints provided by the post-tensioning were considered signifi-cant. The rigid torsional stiffness, however, might have slightly overestimated the stiffness of a flat plate frame.
Another possible reason for finding different results in ADAPT-Builder is that the ADAPT-Builder analysis uses the direct method to determine the secondary moment in three-dimensional (3-D) finite element models whereas SAP2000 uses the indirect method in connection with the Equivalent Frame Method. It is also worth mentioning that the presented results in ADAPT-Builder are not exactly symmetric with respect to the centerline (midspan) of the interior span (Fig. 15 and 16), possibly due to the asymmetric mesh used for the simulation (they were meshed automatically in ADAPT-Builder). Overall, the produced secondary moment diagrams are useful in a comparison to the previous research and could be used for engineers’ preliminary assessments.
Secondary column axial forcesIn this section, results of secondary column axial forces
monitored from SAP2000 are examined. The investigation of the effects of forces induced only by post-tensioning on
Fig. 14—ADAPT-Builder Floor Pro modeling: office building model with 20 x 25 ft slab panels and 20 x 20 in. columns.
column axial forces showed that the interior columns of the building were consistently in compression, while the exte-rior columns were in tension. Table 6 shows the secondary column axial forces for each building. For these buildings, the highest force added by the balanced loads was approxi-mately 6 kips on an interior column and 4 kips on an exterior column. This correlates to about 0.3% and 0.2% of the total axial capacity, respectively. This may seem minimal, but these are only two-story buildings. In considering a 50-story building, this increase in force at the foundation level could be as much as approximately 300 kips, which is significant and must be considered during the design process.
This also creates the possibility for differential column shortening between the interior and exterior columns. All concrete columns are expected to shorten during the life of the building; however, the interior columns are subjected to higher magnitudes of force, and therefore may be affected by the secondary forces more than the columns in the exte-rior of the building. Once again, this effect may be more crucial to consider for buildings with many floor levels. The differential column shortening in the first floor could be approximately 0.5 in. due to the instantaneous elastic effect of post-tensioning for a 75-story building with floor heights of 10 ft, based on the two-story building analysis (Tables 6 to 8) and the following approximation.
( )
( )
...
( )
avg avg avg avg col
g c
navg colavg col
k
g c g c
P P P n P L
A E
n nP LP L k
A E A E=
D + D + D + + Dd =
+ DD ∑ = =
1
1
2 3
12
(10)
TECHNICAL PAPER

40 December 2012 | PTI JOURNAL
_ _ _diff extd = d −d1 1 1int
(11)
where d1 is the secondary column shortening or extension due to post-tensioning at the first-floor level of n-story building; n is the total floor level; DPavg is the average column axial force due to post-tensioning in each slab floor (half the maximum first floor column force in Table 6 was used in this approximation), d1_diff is the differential column shortening between a corner column and an adjacent interior column at the first floor level; and d1_int and d1_ext are the secondary
column axial deformations of adjacent interior and corner columns, respectively, at the first floor level.
Note that in Eq. (10) and (11), the total column defor-mation was not derived as a summation of the deformations of all floors, but the summation of the column axial forces was only used considering the sequence of construction. More importantly, this approximation does not include creep effects, which may be approximately three times greater than the elastic deformation; thus, further investiga-tion is recommended in this area of research.
Table 9—Comparison between SAP200 and ADAPT-Builder Floor Pro results
Bay width, ft Span length, ft Column size, in. Location*
Secondary moment, in.-kipSAP2000 – roof ADAPT-Builder
Exterior frame Interior frame Exterior frame Interior frame
20
25
20 x 20
1 218.7 370.2 77.0 139.62 123.0 218.7 64.7 114.03 3.3 24.8 37.0 111.84 96.2 169.6 61.4 136.95 113.9 201.5 65.3 115.8
24 x 24
1 223.2 388.4 83.0 158.52 127.5 228.1 66.5 118.23 –2.0 7.1 36.7 98.94 95.5 169.7 65.2 137.05 121.0 215.5 68.3 116.5
28 x 28
1 223.2 393.6 97.7 162.22 131.6 236.1 70.0 124.23 –5.9 –4.0 32.5 103.04 92.6 165.4 69.2 128.45 127.3 227.9 70.1 119.6
27
20 x 20
1 244.4 411.9 82.6 146.22 137.3 243.6 75.2 134.23 7.6 34.6 47.0 141.54 104.8 184.7 66.6 161.95 121.6 214.8 80.0 145.3
24 x 24
1 250.8 435.1 89.9 169.72 142.1 254.0 77.6 139.63 1.0 14.5 46.2 128.84 104.8 186.1 70.7 157.75 129.0 229.6 81.2 147.2
28 x 28
1 251.7 443.1 109.2 180.82 146.4 262.6 74.5 131.63 –2.9 2.7 25.3 94.84 102.7 183.3 65.0 188.95 135.6 242.5 83.8 150.7
*Location 1: exterior end of exterior span (refer to Fig. 7); Location 2: middle of exterior span (refer to Fig. 7); Location 3: interior end of exterior span (refer to Fig. 7); Location 4: interior end of interior span (refer to Fig. 7); and Location 5: middle of interior span (refer to Fig. 7).
TECHNICAL PAPER

PTI JOURNAL | December 2012 41
SUMMARY AND CONCLUSIONSThe primary purpose of this research was to investigate the
role of the secondary moment in the design of post-tensioned concrete structures. The design aid charts included in Appendix A can be useful for practicing engineers during the preliminary design of buildings of similar dimensions and loads. These charts can be used as a quick check in the determination of the secondary moment, which can be difficult to calculate at the initial design stage. Furthermore, this research also sought to quantify the effects of post-tensioning on the column axial forces of structures in an effort to investigate the increased loads due to the addition of the secondary moment, as well as the possi-bility of differential column shortening. While the columns carry the factored gravity loads sufficiently, a significant amount of additional load due to post-tensioning may affect the structural stability of the buildings. This is important to consider because of the added downward force at the locations of the interior columns, which is due to the profile of the tendon. These forces also affect the shortening of the concrete columns and have the potential to cause differential shortening between the interior and exterior (particularly corner) locations. All of these issues are especially important in the design and construction of build-ings with many stories.*
ACKNOwLEDGMENTSThe research presented in this paper was funded by the U.S.
DOT–RITA (Grant No. DTRT06-G-0016/OTCREOS10.1-21) and the University of Oklahoma, Norman, OK. The authors would like to thank F. Aalami, President of the ADAPT Corporation, for generously donating the ADAPT-Builder Floor Pro program for this research. The authors also would like to acknowledge PTI DC-20: Building Design Committee members R. Ahmed, J. Ales, B. Allred, P. Antis, A. Baxi, M. Cuadra, C. Hayek, J. Hirsch, D. Kline, C. Kopczynski, and M. Vejvoda for their active discussion concerning the design of post-tensioned buildings during committee meetings and conference calls. The views expressed are those of authors and do not necessarily represent those of the sponsors, donor, or discussants.
REFERENCESAalami, B. O., and Bommer, A., 1999, “Design
Fundamentals of Post-Tensioned Concrete Floors,” Post-Tensioning Institute, Phoenix, AZ, 184 pp.
ACI Committee 318, 2008, “Building Code Require-ments for Structural Concrete (ACI 318-08) and Commen-tary,” American Concrete Institute, Farmington Hills, MI, 473 pp.
ADAPT, 2010, “ADAPT-Builder Floor Pro 2010,” ADAPT Corp., Redwood City, CA.
CSI, 2009, “SAP2000 Tutorial Manual,” Computers and Structures Inc., Berkeley, CA, 50 pp.
Foutch, D. A.; Gamble, W. L.; and Sunidja, H., 1990, “Tests of Post-Tensioned Concrete Slab-Edge Column Connections,” ACI Structural Journal, V. 87, No. 2, Mar.-Apr., pp. 167-179.
Fig. 15—ADAPT-Builder Floor Pro results: secondary moment diagram of exterior frame for office building model with 20 x 25 ft slab panels and 20 x 20 in. columns.
Fig. 16—ADAPT-Builder Floor Pro results: secondary moment diagram of interior frame for office building model with 20 x 25 ft slab panels and 28 x 28 in. columns.
TECHNICAL PAPER

42 December 2012 | PTI JOURNAL
Hufnagel, A. C., 2011, “Analytical Studies of Reinforced and Post-Tensioned Concrete Flat-Plate Systems,” MS thesis, School of Civil Engineering and Environmental Science, University of Oklahoma, Norman, OK, 222 pp.
Kang, T. H.-K., 2004, “Shake Table Tests and Analytical Studies of Reinforced and Post-Tensioned Concrete Flat Plate Frames,” PhD dissertation, Department of Civil & Environmental Engineering, University of California, Los Angeles, Los Angeles, CA, 309 pp.
Kang, T. H.-K., and Wallace, J. W., 2005, “Dynamic Responses of Flat Plate Systems with Shear Reinforce-ment,” ACI Structural Journal, V. 102, No. 5, Sept.-Oct., pp. 763-773.
Kang, T. H.-K., and Wallace, J. W., 2008, “Stresses in Unbonded Tendons of Post-Tensioned Flat Plate Systems
under Dynamic Excitation,” PTI Journal, V. 6, No. 1, Feb., pp. 31-44.
Lin, T. Y., and Burns, N. H., 1981, Design of Prestressed Concrete Structures, third edition, Wiley, Hoboken, NJ, 646 pp.
Nilson, A. H.; Darwin, D.; and Dolan, C. W., 2009, Design of Concrete Structures, fourteenth edition, McGraw-Hill, New York, 816 pp.
PTI Committee DC-20, 2010, private communication.PTI Committee DC-20, 2011, “Guide for Design of
Post-Tensioned Buildings (PTI DC20.9-11),” Building Design Committee, Post-Tensioning Institute, Farmington Hills, MI, 74 pp.
Amy Hufnagel is a Structural Engineer at Walter P Moore, Houston, TX, and is a licensed Engineer-in-Training in Oklahoma. She received her MS and BS from the Univer-sity of Oklahoma, Norman, OK. She was awarded the 2011 Edward K. Rice Memorial Scholarship from the Post-Tensioning Institute (PTI). Her research interests include analytical and experimental studies of reinforced, prestressed, and post-tensioned concrete structures.
PTI Fellow Thomas H.-K. Kang is an Assistant Professor at Seoul National University, Seoul, Korea, and is a licensed Professional Engineer in California. He received his PhD from the University of California, Los Angeles (UCLA), Los Angeles, CA; and his BS from Seoul National University. He is a member of PTI Committee DC-20, Building Design. His research interests include design and rehabilitation of post-tensioned buildings and systems.
PTI JOURNALResearch involving post-tensioned concrete structures
CASE STUDIES
Submit contributions to your JOURNAL:
RESEARCH
Applications of post-tensioning illustrating innovation, performance, economics, and sustainability
For more details and submission deadlines, please contact: Miroslav Vejvoda, Editor-in-Chief, PTI JOURNAL E-mail: [email protected] Phone: (248) 848-3184 Paper submittal requirements are outlined in the PTI JOURNAL Publication Policy available online at: www.post-tensioning.org/pti_journal.php
TECHNICAL PAPER

PTI JOURNAL | December 2012 43
TECHNICAL PAPER
TwO-wAY POST-TENSIONED SLABS wITH BONDED TENDONS
BY KENNETH B. BONDY
INTRODUCTIONTwo-way post-tensioned slabs have been an extremely
popular floor-framing system in American building construction. The vast majority of post-tensioning tendons used in these slabs have been unbonded. In the United States alone, it is estimated that there are 2.5 billion ft2 of two-way post-tensioned slabs with unbonded tendons in service.1 Major research programs have been executed on two-way post-tensioned slabs with unbonded tendons at prominent American universities2; based on both performance and research, the ACI Building Code (ACI 318-11)3 has devel-oped comprehensive requirements for their use. While not prohibited by ACI 318-11,3 the use of bonded tendons in two-way slabs built in the United States is extremely rare.
However, two-way slabs with bonded tendons are widely used in other parts of the world—notably, Asia, Europe, and Australia. While there is a dearth of published research available describing the behavior of two-way slabs with bonded tendons, the author has received reports by personal communication that their behavior in existing buildings is adequate and is unaware of reports to the contrary.
While various aspects of the behavior of two-way slabs with both bonded and unbonded tendons are discussed in this paper, the focus will be on code requirements and standard practices for minimum amounts of bonded reinforcement used for crack distribution and ductility in the highly stressed negative moment areas over columns. The need for crack control over columns in two-way slabs is not limited to slabs with unbonded tendons. High local stresses in negative-moment areas exist, regardless of whether the tendons are bonded or unbonded.
Requirements for providing a minimum amount of bonded reinforcement to resist this cracking in two-way slabs with bonded tendons appear in codes and recom-mendations governing their design in other countries. However, ACI 318-113 has no requirements whatsoever for minimum amounts of bonded reinforcement—prestressed or non-prestressed—in any location in two-way slabs with bonded tendons.
This paper will address the ACI 318-113 deficiencies regarding two-way slabs with bonded tendons and make recommendations to remedy them.
SURVEY OF CODE REqUIREMENTS FOR BONDED TwO-wAY SLABS
Because two-way slabs with bonded tendons are rarely used in the United States and research on their behavior is substantially nonexistent, ACI 318-113 contains virtually no requirements governing their design. These would include minimum amounts of bonded prestressed and/or non-prestressed reinforcement and requirements for locating tendons over supports (integrity steel). For example, ACI 318-11, Section 18.9.3.3,3 requires a minimum amount of bonded reinforcement over the tops of columns in two-way post-tensioned slabs with unbonded tendons. The purpose of this reinforcement is, in part, to increase ductility and distribute negative-moment cracking caused by high local flexural tensile stresses at the top of the slab in this area of peak negative moments. The amount of reinforcing required was based on testing of two-way unbonded slabs at the University of Texas in the 1970s (ACI 318-11, References 18.14 and 18.153). However, these requirements apply only to slabs with unbonded tendons; similar requirements for minimum bonded reinforcement in two-way slabs with bonded tendons do not exist in ACI 318-11.3
AS3600-2009, Section 9.4.2,4 requires no minimum amount of bonded reinforcement—prestressed or non-
PTI JOURNAL, V. 8, No. 2, December 2012. Received and reviewed under Institute journal publication policies. Copyright ©2012, Post-Tensioning Institute. All rights reserved, including the making of copies unless permission is obtained from the Post-Tensioning Institute. Pertinent discussion will be published in the next issue of PTI JOURNAL if received within 3 months of the publication.

44 December 2012 | PTI JOURNAL
TECHNICAL PAPER
prestressed—when flexural tensile stresses under service
loads are less than or equal to . cf ′0 25 , where fc′ is in MPa,
for slabs with bonded tendons. This is equivalent to . cf ′3 0, where fc′ is in psi. This stress can be exceeded—up to
. cf ′0 6 MPa ( . cf ′7 2 psi)—by providing “…reinforcement or bonded tendons, or both, near the tensile face…” and limiting the incremental stress in the bonded tendons and non-prestressed reinforcement to certain values, as shown in Table 9.4.2.4 The incremental stress increase in the rein-forcement is that which occurs “…as the load increases from its value when the extreme concrete tensile fibre is at zero stress to the short-term service load value.” The incremental stress increase in the reinforcement is, of course, a function of the cross-sectional area of the reinforcement provided—the more reinforcement, the smaller the stress increase. This indirect, somewhat complex, method for determining the required amount of bonded reinforcement does not offer a direct comparison to the minimum reinforcement require-ments for unbonded slabs specified in ACI 318-11,3 which are simply based on a percentage of the concrete cross-sectional area. It should be emphasized, however, that if service-
load flexural tensile stresses exceed . cf ′3 0 (fc′ in psi), a minimum amount of bonded reinforcement—prestressed or non-prestressed—is required by AS3600-2009.4
The Eurocode (EC2)5 has a minimum requirement for bonded reinforcement in two-way slabs with bonded tendons where the service load flexural tensile stress exceeds the concrete modulus of rupture. It is expressed as a complex equation (Section 7.3.2, Eq. (7.1)) and is a function of the yield strength and spacing of the reinforce-ment and the modulus of rupture of the concrete. It can be shown that the EC25 requirement for minimum bonded reinforcement is reasonably similar to the ACI 318-11, Section 18.9.3.3, Eq. (18-6),3 requirement for minimum bonded reinforcement in unbonded two-way slabs.
The Concrete Society in England publishes a design handbook6 for post-tensioned concrete floors that includes recommendations for two-way slabs with both bonded and unbonded tendons. For slabs with both bonded and unbonded tendons, this handbook recommends exactly the same minimum amount of bonded reinforcement over columns (Section 5.8.8) as ACI 318-11, Section 18.9.3.3,3 for unbonded slabs. No minimum amount of bottom bonded reinforcement is required in positive-moment areas. It should be noted that these are recommendations, not code requirements.
Standard practices for two-way slabs with bonded tendons in Hong Kong require a minimum area of non-prestressed bonded reinforcement (fy = 460 MPa [67 ksi]) equal to 0.13% of the gross concrete area located at the tension faces.7 This is actually much larger than the ACI 318-113 requirement for minimum bonded reinforcement in two-way slabs with unbonded tendons and approaches the required amount of shrinkage and temperature reinforce-ment in ACI 318-11, Section 7.12.2.1(b).3
BONDED VERSUS UNBONDED TENDONSThe decision to use bonded tendons in two-way post-
tensioned slabs must be made very carefully, particularly when the slab design is governed by ACI 318-11.3 Virtu-ally all American experience—both in the field and the laboratory—has been with unbonded tendons. Unbonded tendons offer unique structural advantages not found in bonded tendons, and these advantages should be recog-nized and carefully considered in the decision between unbonded and bonded tendons in two-way slabs.
The most significant of these advantages is post-flexural catenary capacity. The only way to significantly increase the stress in an unbonded tendon is to increase its length between anchorages. Thus, local strains caused by large local deforma-tions, such as those encountered at columns in two-way slabs, are distributed throughout the entire length of the tendon and do not result in high local tendon stresses. It is virtually impos-sible to fail an unbonded tendon in tension due to applied load. This factor offers obvious advantages under severe overload or in preventing progressive collapse should the member suffer punching shear failure or the loss of one or more column supports due to some catastrophic event. Tests8 have shown that slabs with unbonded tendons possess catenary capacities three to four times the demand at factored load.
On the other hand, in a properly bonded tendon, high local strains, such as those found in negative-moment areas at columns of two-way slabs under factored loads, can develop local stresses higher than the strand tensile strength, resulting in tensile failure. For example, using ACI 318-113 terminology, in an 8 in. thick normalweight slab with bonded tendons where fc′ = 5000 psi, dp = 7 in., fpc = 150 psi, fse = 176 ksi, and Aps = 0.082 in.2/ft, the steel strain when the extreme concrete strain reaches 0.003 in./in. (the crushing strain) is 0.044 in./in.—substantially greater than the ASTM A416 breaking strain of 0.035 in./in. Thus, in this rather typical case, the bonded steel will fail in tension before the concrete crushes and the catenary capacity will be lost. In the same example, if the tendons
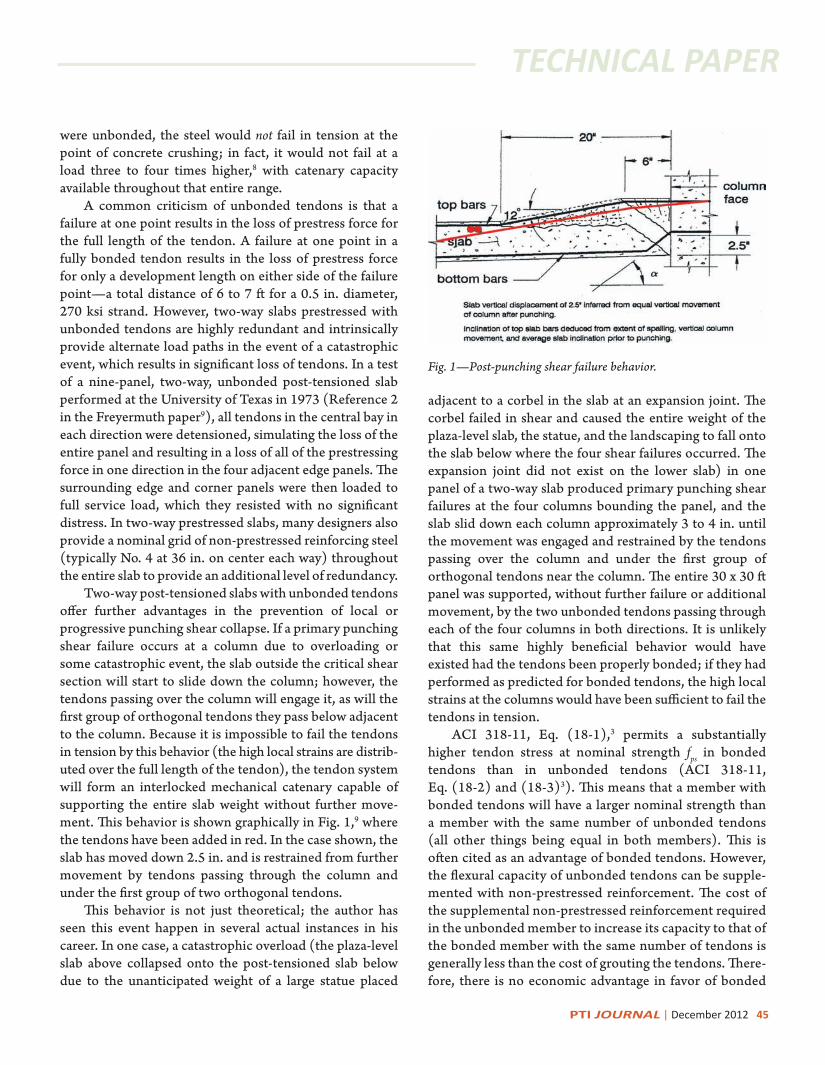
PTI JOURNAL | December 2012 45
TECHNICAL PAPER
were unbonded, the steel would not fail in tension at the point of concrete crushing; in fact, it would not fail at a load three to four times higher,8 with catenary capacity available throughout that entire range.
A common criticism of unbonded tendons is that a failure at one point results in the loss of prestress force for the full length of the tendon. A failure at one point in a fully bonded tendon results in the loss of prestress force for only a development length on either side of the failure point—a total distance of 6 to 7 ft for a 0.5 in. diameter, 270 ksi strand. However, two-way slabs prestressed with unbonded tendons are highly redundant and intrinsically provide alternate load paths in the event of a catastrophic event, which results in significant loss of tendons. In a test of a nine-panel, two-way, unbonded post-tensioned slab performed at the University of Texas in 1973 (Reference 2 in the Freyermuth paper9), all tendons in the central bay in each direction were detensioned, simulating the loss of the entire panel and resulting in a loss of all of the prestressing force in one direction in the four adjacent edge panels. The surrounding edge and corner panels were then loaded to full service load, which they resisted with no significant distress. In two-way prestressed slabs, many designers also provide a nominal grid of non-prestressed reinforcing steel (typically No. 4 at 36 in. on center each way) throughout the entire slab to provide an additional level of redundancy.
Two-way post-tensioned slabs with unbonded tendons offer further advantages in the prevention of local or progressive punching shear collapse. If a primary punching shear failure occurs at a column due to overloading or some catastrophic event, the slab outside the critical shear section will start to slide down the column; however, the tendons passing over the column will engage it, as will the first group of orthogonal tendons they pass below adjacent to the column. Because it is impossible to fail the tendons in tension by this behavior (the high local strains are distrib-uted over the full length of the tendon), the tendon system will form an interlocked mechanical catenary capable of supporting the entire slab weight without further move-ment. This behavior is shown graphically in Fig. 1,9 where the tendons have been added in red. In the case shown, the slab has moved down 2.5 in. and is restrained from further movement by tendons passing through the column and under the first group of two orthogonal tendons.
This behavior is not just theoretical; the author has seen this event happen in several actual instances in his career. In one case, a catastrophic overload (the plaza-level slab above collapsed onto the post-tensioned slab below due to the unanticipated weight of a large statue placed
adjacent to a corbel in the slab at an expansion joint. The corbel failed in shear and caused the entire weight of the plaza-level slab, the statue, and the landscaping to fall onto the slab below where the four shear failures occurred. The expansion joint did not exist on the lower slab) in one panel of a two-way slab produced primary punching shear failures at the four columns bounding the panel, and the slab slid down each column approximately 3 to 4 in. until the movement was engaged and restrained by the tendons passing over the column and under the first group of orthogonal tendons near the column. The entire 30 x 30 ft panel was supported, without further failure or additional movement, by the two unbonded tendons passing through each of the four columns in both directions. It is unlikely that this same highly beneficial behavior would have existed had the tendons been properly bonded; if they had performed as predicted for bonded tendons, the high local strains at the columns would have been sufficient to fail the tendons in tension.
ACI 318-11, Eq. (18-1),3 permits a substantially higher tendon stress at nominal strength fps in bonded tendons than in unbonded tendons (ACI 318-11, Eq. (18-2) and (18-3)3). This means that a member with bonded tendons will have a larger nominal strength than a member with the same number of unbonded tendons (all other things being equal in both members). This is often cited as an advantage of bonded tendons. However, the flexural capacity of unbonded tendons can be supple-mented with non-prestressed reinforcement. The cost of the supplemental non-prestressed reinforcement required in the unbonded member to increase its capacity to that of the bonded member with the same number of tendons is generally less than the cost of grouting the tendons. There-fore, there is no economic advantage in favor of bonded
Fig. 1—Post-punching shear failure behavior.

46 December 2012 | PTI JOURNAL
tendons, resulting from the fact that they develop a larger nominal tendon stress. Further, it is the author’s opinion that the incremental flexural strength is more reliably achieved with non-prestressed reinforcement, which can be visually inspected, than with grouting, which cannot be visually inspected.
Finally, it should be mentioned that two-way slabs with bonded tendons must satisfy ACI 318-11, Section 18.8.2.3 This section requires that members with bonded tendons contain sufficient prestressed and non-prestressed reinforce-ment to develop a flexural capacity at every section of at least 1.2Mcr, where Mcr is the moment that produces first cracking
at the section (based on a modulus of rupture of . cfλ ′7 5 ). This requirement is waived for unbonded members because the type of undesirable behavior addressed (sudden transfer of tensile force from concrete to reinforcement at first cracking) does not occur in unbonded tendons. In many typically proportioned and loaded two-way slabs with bonded tendons, this code section will require more total bonded reinforcement than that required for two-way slabs with unbonded tendons in ACI 318-11, Section 18.9.3.3.3
However, the reinforcement required by ACI 318-11, Section 18.8.2,3 cannot be directly compared to that required by Section 18.9.3.3 for ductility and crack distribution for the following reasons:
• The reinforcement required by Section 18.8.2 for negative moment can be located anywhere hori-zontally in the slab. There is no requirement that it be concentrated over the column, as opposed to Section 18.9.3.3, which requires that the reinforce-ment be concentrated in a narrow width straddling the column; and
• There are many two-way slab configurations (for example, lightly loaded, relatively thin slabs with low concrete strengths and densities) in which the total bonded reinforcement required by Section 18.8.2 is substantially less than that required by Section 18.9.3.3.
Clearly, the 1.2Mcr requirement in Section 18.8.2 in itself does not adequately address the problem of minimum reinforcement in two-way slabs with bonded tendons.
The primary purpose of this paper is not to dwell on the virtues of unbonded tendons in two-way slabs, but to emphasize what the author considers to be ACI 318-113 deficiencies in the use of bonded tendons. Nonetheless, the author feels that the previous discussion of bonded and unbonded tendon behavior is important in evaluating the significance of these code deficiencies.
qUANTITATIVE EXAMPLEConsider a two-way slab post-tensioned with
unbonded tendons with a 30 x 30 ft bay size, 8 in. slab thickness, and 24 in. square columns. A section of the slab at the column is shown (perpendicular to the span) in Fig. 2.
ACI 318-11, Section 18.12.6,3 requires a minimum of two 0.5 in. diameter seven-wire strands to pass directly over the column in each direction. A minimum area of bonded reinforcement is also required between lines that are 1.5h (1.5 × 8 = 12 in.) outside opposite column faces (Section 18.9.3.3). Thus, in this case, the added bonded reinforcement is required within a distance of 24 + 2 × 12 = 48 in. centered on the column, and the amount of bonded reinforcement required in this distance is
. . . in.s cfA A= = × × × = 20 00075 0 00075 8 30 12 2 16
Thus, in addition to the two tendons (Aps = 0.312 in.2) required directly over the columns, the code would require an additional seven No. 5 bars within lines that are 12 in. outside each column face (a 48 in. total dimension centered on the column).
Now, consider the same two-way slab, except with bonded tendons. A cross section through this slab, taken in the same location as Fig. 2, is shown in Fig. 3.
For two-way slabs with bonded tendons, ACI 318-113 has no minimum requirements for bonded reinforcement—prestressed or non-prestressed—anywhere in the slab, including the critical area in the immediate vicinity of the column. This slab would satisfy ACI 318-113 with no reinforcement of any kind in the shaded area of Fig. 3. Note that Section 18.12.6, which requires a minimum of two 0.5 in. diameter seven-wire strands directly over the column, applies only to slabs with unbonded tendons and that Section 18.9.3.3, which requires a minimum amount of bonded reinforcement in the shaded area, also applies only to slabs with unbonded tendons. This does not seem rational.
Figure 4 presents the author’s recommendations for minimum amounts of bonded reinforcement in two-way slabs with bonded tendons. Similar to slabs with unbonded tendons, the author proposes that a minimum of one bonded tendon with at least two 0.5 in. diameter seven-wire strands be required directly over the column in both directions. If some physical condition makes it impossible to pass tendons directly over the column (as in a lift slab), the minimum amount of bottom integrity reinforcement required for unbonded slabs in ACI 318-11, Section
TECHNICAL PAPER

PTI JOURNAL | December 2012 47
18.12.7,3 may be used. The bonded integrity tendons will not be as effective in preventing catastrophic failure as if they were unbonded, but they should provide some incre-mental benefit. In addition, the author proposes that the same minimum cross-sectional area of bonded reinforce-ment required for unbonded slabs be required in the same distance (the shaded area between lines 1.5h on either side of the column faces), and that this minimum required area of steel can include the area of all bonded tendons within the stated distance. Thus, if the minimum of two tendons is placed directly over the column (Aps = 0.312 in.2), the required incremental area of bonded reinforcement would be 2.16 – 0.312 = 1.848 in.2 or six No. 5 bars. Additional bonded tendons placed within the 48 in. wide shaded area would further reduce the incremental amount of bonded reinforcement required.
CONCLUSIONSThe author is aware of no published American
research work that has been performed on two-way slabs with bonded tendons. A literature search and personal communications with those knowledgeable about the use of bonded tendons in two-way slabs outside the United States suggests that no such research exists anywhere. While the field performance of bonded slabs is reported to be adequate, field performance generally reveals little about the behavior of structures in the realm between service loading and flexural and/or shear failure; thus, no information exists about the behavior of bonded two-way slabs in this critical range.
The design of two-way slabs with bonded tendons outside the United States is primarily based on the Austra-lian Code,4 EC2,5 and the British Code,7 depending on loca-
tion. The Australian Code4 requires a minimum amount of bonded reinforcement when service-load flexural tensile stresses exceed a relatively small value. EC25 requires a minimum amount of bonded reinforcement over columns under certain conditions, and it is reasonably similar to the ACI 318-113 requirements for unbonded slabs. The British Code7 actually requires more non-prestressed bonded rein-forcement in two-way bonded slabs than ACI 318-113 for two-way unbonded slabs.
Lacking any research information on the actual over-load behavior of two-way bonded slabs and considering how they are actually being designed outside the United States, it seems rational that ACI 318 should require the same amount of bonded reinforcement in two-way slabs with bonded tendons as is required in slabs with unbonded tendons. It should be permitted to include the cross-sectional area of the bonded tendons in the total cross-sectional area of bonded reinforcement required. If
TECHNICAL PAPER
Fig. 2—Two-way slab with unbonded tendons (ACI 318-11). Fig. 3—Two-way slab with bonded tendons (ACI 318-11).
Fig. 4—Recommendations for two-way slabs with bonded tendons.

48 December 2012 | PTI JOURNAL
minimum reinforcement is required in two-way slabs with bonded tendons in other parts of the world, where they are actually being built, there is no reason it should not be required by ACI 318. It is anticipated that the incremental amount of bonded reinforcement required to satisfy the criteria recommended herein would be small and would present no significant economic penalty on the use of bonded tendons in two-way slabs, but it would provide a substantial benefit in performance. Finally, it is recom-mended that a minimum of one bonded tendon with at least two 0.5 in. diameter strands be placed directly over columns in both directions.
Perhaps testing of two-way slabs with bonded tendons will demonstrate this recommendation to be conservative, but until that testing exists, these recommendations should be followed to reasonably ensure the same level of performance and safety in bonded two-way slabs as has been demonstrated by tests and performance in slabs with unbonded tendons.
REFERENCES1. Bondy, K. B., Post-Tensioned Concrete in Buildings—A
Half-Century Overview, PTI Convention, Nashville, TN, May 2012.
2. Design of Post-Tensioned Slabs Using Unbonded Tendons (PTI DC20.8-04), third edition, Post-Tensioning Institute, Farmington Hills, MI, 2004, p. 17.
3. ACI Committee 318, “Building Code Requirements for Structural Concrete (ACI 318-11) and Commentary,” American Concrete Institute, Farmington Hills, MI, 2011, 503 pp.
4. AS3600-2009, “Concrete Structures,” Building Code of Australia (BCA).
5. BS EN 1992-1-1:2004, “Eurocode 2. Design of Concrete Structures. General Rules and Rules for Build-ings,” European Commission for Standardization, Dec. 2004, 230 pp.
6. TR43a—Post-Tensioned Concrete Floors—Design Hand-book—Amendment, The Concrete Society, Blackwater, Camberley, Surrey, UK.
7. BS EN 1994-1-1:2004, “Eurocode 4. Design of Composite Steel and Concrete Structures. General Rules and Rules for Buildings,” British Standards Institution, 2004.
8. Freyermuth, C. L., “Structural Integrity of Buildings Constructed with Unbonded Tendons,” Concrete Interna-tional, V. 11, No. 3, Mar. 1989, pp. 56-63.
9. Pan, A., and Moehle, J., “An Experimental Study of Slab-Column Connections,” ACI Structural Journal, V. 89, No. 6, Nov.-Dec. 1992, p. 626.
New PTI BRIDGE PUBLICATIONS
PTI M55.1-12, Specification for
Grouting of Post-Tensioned Structures
PTI DC45.1-12, Recommendations
for Stay Cable Design, Testing, and Installation
to order or for more information, visit the
bookstore at www.post-tensioning.org.
PTI/ASBI M50.3-12, Guide Specification for Grouted Post-
Tensioning
TECHNICAL PAPER
Ken Bondy has specialized in the design and construc-tion of post-tensioned concrete buildings for 50 years. He is a Charter Officer and Director of the Post-Tensioning Institute (1976), a PTI Legend, Past President, Fellow, and Lifetime Member. He currently serves on the Technical Activities Board (TAB). Now retired, he is a licensed civil and structural engineer in California and has been licensed in many other states.

PTI JOURNAL | December 2012 49
PT TREASURES
THE TOwER3900 wEST ALAMEDA BOULEvARD
BURBANK, CABY KENNETH B. BONDY
One of the most important buildings in the history of American post-tensioned building construction was completed in 1988—a 32-story office building at 3900 West Alameda Avenue in the “Media District” of Burbank, CA, Fig. 1. At the time of completion, it was the tallest concrete building ever built in the country’s most severe seismic zone—then called Zone IV—now Seismic Design Category F. This building opened the eyes of many decision-makers to the advantages of concrete in tall buildings and led the way for several subsequent tall (40+ stories) post-tensioned concrete buildings in California. It began to change the long-held perception among owners, developers, contractors, insurance companies, and struc-tural engineers that all tall (20+ stories) buildings must be built with structural steel.
Called “The Tower,” the building has 27 office floors and parking for 1342 cars on nine levels—five above grade and four below, Fig. 2 and 3. The parking levels cover an entire city block. Set at a 45-degree angle to the bounding
Fig. 1—The Tower, 3900 West Alameda Avenue, Burbank, CA.
Fig. 2—The Tower with 27 office floors and...
streets, the 27 office levels provide 1.1 million ft2 of rent-able area. Structural framing is entirely cast-in-place post-tensioned concrete, with clear-span beam and slab framing in the parking levels and a 7 in. post-tensioned flat plate with typical 27 ft square bays in the office levels. Seismic
Fig. 3—...five parking levels above and four levels below grade.

50 December 2012 | PTI JOURNAL
PT TREASURES
framing on the office floors is with a perimeter concrete seismic moment-resisting frame (called a “ductile frame” back then), with 38 in. deep downturned beams cast monolithically with the floor slab. Lateral loads are trans-ferred to perimeter shear walls at the top parking level. The building is founded on a reinforced concrete mat 4 to 6 ft thick. All post-tensioning tendons are unbonded.
The building was completed for a cost of $38/ft2, not including tenant improvements. At that time, comparable structural steel office buildings in California were being built for $50 to $60/ft2. It was estimated (by sophisticated southern California developers and contractors) that the use of post-tensioned concrete in this tall building saved at least $15/ft2 when compared with the cost of structural steel buildings. Some of the factors that contributed to the economy of this building include:
• The perimeter concrete frame beams and columns were exposed architecturally. This reduced the required amount of expensive curtain wall by approximately 25%.
• The use of post-tensioned concrete in the floor system reduced the total height of the building by approximately 30 ft (roughly 1 ft per floor) when compared to structural steel, resulting in savings in every vertical building component (curtain wall, plumbing, electrical, elevators, and so on).
• The reduction in building height also reduced the interior volume of the building by approximately 15%, resulting in future savings in heating and air-conditioning.
• The use of post-tensioning in the floor system minimized dead load and high-strength 6000 psi
concrete (high for that time), resulted in reason-able column sizes (36 in. square maximum) and economically feasible rentable floor areas.
Other less tangible benefits that accrued in this tall building due to the use of post-tensioned concrete included:
• Exposing the perimeter beams eliminated the opening between the edge of the floor framing and the curtain wall, an opening usually necessary in structural steel buildings where the floor structure cannot be exposed. This opening provides a path for fire to spread vertically from floor to floor.
This factor became painfully apparent when later, in a 62-story structural steel office building in downtown Los Angeles, a fire started on one mid-level floor and then progressed upwards through the opening between the floors and the curtain wall, gutting three floors above.
• Fire resistance in the concrete beams and columns is provided by the concrete itself rather than sprayed-on fireproofing, which is much less durable.
• The redundancy and structural continuity of cast-in-place buildings such as this one offers signifi-cant advantages in resisting catastrophic loadings.
• The inherent stiffness of concrete buildings offers advantages in comfort for the occupants.
Construction time in The Tower compared very favor-ably with structural steel buildings of similar size, Fig. 4. The frame goes up rapidly in a structural steel building, but interior work (nonstructural partitions, finishes, plumbing, electrical work) cannot start until the metal deck and concrete topping is complete on each floor, and that work lags well behind the completion of the frame. In a multi-story concrete building interior, work can proceed immediately upon completion of each floor. More information about the construction of this building can be found in References 1 through 3.
This building has functioned well for 25 years now, although it is no longer the tallest concrete building in California. The Tower has been exceeded in height by several other post-tensioned concrete buildings, each with more than 40 stories.
Of particular note is the performance of this building in the 1994 Northridge earthquake. Located only 12 miles from the epicenter, the building suffered no structural damage in the earthquake. That is very notable because the earthquake caused widespread structural damage in build-ings and bridges throughout the Los Angeles area, and it affected all types of framing.
In summary, the use of cast-in-place post-tensioned concrete in this tall office building resulted in significant
Fig. 4—The Tower under construction.

PTI JOURNAL | December 2012 51
PT TREASURES
economies, greatly increased fire resistance, improved resistance to catastrophic loading, and greater occupant comfort. It has performed well for 25 years, including the Northridge earthquake in 1994, which it resisted with no structural damage. It is a landmark building that led the way for other tall post-tensioned concrete buildings in California and in other areas of high seismic risk.
REFERENCES1. “The Tallest Reinforced Concrete Building in Seismic
Zone IV,” Case History Report, Concrete Reinforcing Steel Institute (CRSI), 1992.
2. “Concrete Tower Sets Record,” Engineering News-Record, Apr. 27, 1989.
3. Workman, E. B., “Concrete Overcomes Seismic Challenge,” Engineered Concrete Structures Newsletter, Portland Cement Association, Skokie, IL, Aug. 1989.
Credits:Structural Engineer Edwin B. Workman, S.E., PTI Legend FRAME Design GroupArchitect Herbert Nadel PartnersConcrete Contractor Parr Contracting CompanyGeneral Contractor Stolte/KGPost-Tensioning and Reinforcing Steel Seneca Construction Systems, Inc.
InsistPTI certification of field personnel is an investment that can increase efficiency, reduce risk, and provide you with a competitive edge. It is required by ACI 301 Specification for Concrete and PTI/ASBI M50.3-12 Guide Specification for Grouted Post-Tensioning. PTI offers certification programs for personnel involved with field installation,inspection, and supervision of bonded PT, unbonded PT, and slab-on-groundconstruction. Visit www.post-tensioning.org to learn more and register for upcomingworkshops or contact PTI to request a special workshop at your facility or job site.
on quality. Insist on safety. Insist on PTI Certified Personnel.

52 December 2012 | PTI JOURNAL
INDUSTRY NEWS
PTI COMMITTEE NEwSMany PTI members contribute to the industry through
their work on technical and certification committees of the Institute. The work on these committees is rewarding in many ways. It gives members exposure to their peers and an opportunity to share knowledge and expertise, ensuring their views or the interests of their companies are heard and possibly incorporated into PTI documents. The dissemination of information through committee docu-ments is an important part of the Institute’s mission.
During the 2012 Fall PTI Committee Days, two new certification committees were established by the Certifica-tion Advisory Board (CAB):
1. CRT-50, Slab-on-Ground Engineers Certification Committee. This committee, chaired by Ryne Stoker, has started to draft a manual and prepare slide presentations for the upcoming certification of engineers who have demon-strated an in-depth understanding of PTI DC10.5-12, “PTI Standard Requirements for Design and Analysis of Shallow Post-Tensioned Concrete Foundations on Expan-sive Soils,” the newly published combined standard.
2. CRT-60, Repair, Rehabilitation and Strengthening Field Personnel Certification Committee. This committee, chaired by Merrill Walstad, has started to work on a new certification program for field personnel concerning the repair of structures post-tensioned with unbonded single-strand tendons. This type of certification program has been requested by number of companies in the past, and PTI is filling that need with this new program. It will be based on PTI DC80.3-12/ICRI 320.6, “Guide for Evaluation and Repair of Unbonded Post-Tensioned Concrete Struc-tures,” a document published earlier this year.
ACI NEwSThe ACI documents related to post-tensioning are
as follows:1. ACI 318-11, “Building Code Requirements for
Structural Concrete and Commentary. The new edition, ACI 318-14, will be the first reorganized version of the code; however, there will be no major changes affecting post-tensioning, except Chapter 18, Prestressed Concrete, will be deleted. The provisions within this chapter will be dispersed in other general and member-based chapters.
The section on loss of prestress could be shortened and the commentary may reference the ACI 423 document on esti-mating prestress losses that is currently being finalized; and
2. Revisions are being finalized by Joint ACI-ASCE Committee 423, Prestressed Concrete, to ACI 423.7, “Specification for Unbonded Single-Strand Tendon Mate-rials and Commentary.” These revisions will correspond to the PTI M-10 specifications for unbonded tendons.
PTI DOCUMENTSPTI technical committees were
productive in 2012 and published the following documents:• PTI DC80.3-12/ICRI 320.6,
“Guide for Evaluation and Repair of Unbonded Post-Tensioned Concrete Structures”;
• PTI DC45.1-12, “Recommen-dations for Stay Cable Design, Testing, and Installation”;
• PTI M55.1-12, “Specification for Grouting of Post-Tensioned Structures”;
• PTI/ASBI M50.3-12, “Guide Specification for Grouted Post-Tensioning”; and
• PTI DC10.5-12, “Standard Requirements for Design and Analysis of Shallow Post-Tensioned Concrete Foundations on Expansive Soils.”
Several documents are in the last stages of preparation and are expected to be published in 2013:
• PTI M10.2-13, “Specifications for Unbonded Single Strand Tendons for Slabs-on-Ground”;
• PTI M10.6-13, “Specification for Unbonded Single Strand Tendons”; and
• PTI DC35.1-13, “Recommendations for Prestressed Rock and Soil Anchors.”

