ptj-5-2019 - pipeline leak detection & integrity management · pipeline technology journal -...
TRANSCRIPT

PIPELINE LEAK DETECTION & INTEGRITY MANAGEMENT
Pipeline Technology Journal
Journale
ISSN 2196-4300www.pipeline-journal.net
Issu
e 5
/ 201
9

Your job is too hard
weld seam.
Only DENSOLEN® protects like DENSOLEN®. The only corrosion prevention tape with 40 years’ proven durability. Extremely resilient. Easy to process – using DENSOMAT® wrapping machines. denso-group.com
DENSOLEN® Protection for Eternity
DENSOLEN®
to have a badly protected

Admir CelovicDirector Publications
EITEP Institute
Pipelines & Politics
It was not surprising that both chambers of the U.S. Congress signed a bill that will put sanctions in place against some companies that are currently working to finalize the much-disputed Nord Stream 2 pipeline. The pipeline will still be completed, though, because Russia already made clear that it will replace every company necessary that is forced to drop out due to the sanctions. The upcoming signing of the bill by President Donald Trump is therefore more of a symbolic gesture than a serious threat to the project.
However, pipelines are becoming more and more the center of unwanted political attention, not just in case of the Nord Stream 2 project. This gives me the impression, that 2020 is not going to be easier, especially in the U.S., where many pipeline projects are still facing major public opposition, although fierce clashes like during the Dakota Access Pipeline construction are still unmatched, fortunately.
The Pipeline Technology Journal (ptj) will continue to report on these occurrences, although we will not limit our focus to the already known public battles between pipeliners and their opponents in the west. There are many more projects ongoing in the world with many hurdles to take, because the resistance against even the most necessary projects is increasingly strong, like it was the case in Massachusetts, with dramatic consequences.
Our industry must drastically increase its transparency to the general public, in order to avoid or at least decrease the re-sistance towards our projects. We have also to work on solutions for pressing issues, like the infamous pipeline tapping, which results in catastrophic loss of live on a regular basis.
It is a good sign that the Pipeline Technology Conference (ptc), Europe’s leading pipeline event and our official partner event, discusses such topics in more depth lately. Last year’s event proved, that there is a need to exchange information about this. Of course, the main focus of the events remains the same. Technical sessions with more than 100 presenta-tions regarding the latest pipeline technology. But it is a positive development, that difficult sociocultural and political topics are becoming more important by the year.
After all, we cannot escape the gravity of our own significance. Pipelines are significant, whether they are producing a real incident or they are demonized by angry protesters. We must not ignore these issues, not in the U.S., nor in Europe or elsewhere. So stick with us at the ptc in Berlin and let us discuss the best ways to move forward.
www.pipeline-conference.com
Yours,
> Admir Celovic, Director Publications, EITEP Institute
EDITORIALPIPELINE TECHNOLOGY JOURNAL 3

THIS ISSUE’S COMPLETE CONTENT
DECEMBER 2019 / ISSUE 5
Company Directory
Page 34
ptc Preview 28
Event Calendar 39
Pipeline Technology Journal - ptj
@pipelinejournal
www.pipeline-journal.net
Pipeline.Technology.Conference
Advanced Detection Technologies and Collaborative Informations Systems for Leak Detection and Response
Alan Vidal
GAZOMAT
Pipeline Leak Detection via Machine Learning
Michael Milner
University of Alberta
Digital Pipeline Integrity with Spiral Wound Pipe
Dr. Andrew Stevenson,
Doug Everard & Mebs Bobat
Sustainable Pipeline Systems Ltd
6 14
22 30EITEP Institute
European/African International Transfer Centre for Infrasturcture Development in Aftica (ITIDA) founded
4 PIPELINE TECHNOLOGY JOURNAL

PIPELINE TECHNOLOGY JOURNAL 5
Journale
Pipeline Technology Journal Pipeline Technology Journal
ptj Editorial BoardCHAIRMAN
Dr. Michael Beller, Director Global
Market Strategy, Rosen Europe
MEMBERS
Max Wedekind, Managing Director,
DENSO
Asle Venas, Senior Principle Pipeline
Specialist, DNV GL
Steffen Paeper, Senior Offshore
Commissioning Engineer, South Stream
Andreas Antoniou, Senior Research
Associate,
National Technical University of Athens
Mark Iden, Chief Executive Officer,
SkyData Air & Space
Tobias Walk, Managing Director, ILF
Belkacem Bechka, Freelance Pipeline
Consultant
Mahmoud Abdel Hakim, Pipeline
Engineering Team Leader, ADNOC
Offshore
Admir Celovic, Director Publications,
EITEP Institute
Used Copyright Material: P. 4; 28; 29; 39 ©Philip WilsonP. 32 ©Shutterstock.com/ KekyalyaynenP. 32 ©Shutterstock.com/ Travel maniaP. 33 ©Shutterstock.com/ Darren J. Bradley
President: Dr. Klaus RitterRegister Court: Amtsgericht HannoverCompany Registration Number: HRB 56648Value Added Tax Identification Number: DE 182833034
Editor in ChiefDr. Klaus RitterE-Mail: [email protected]: +49 (0)511 90992-10
Editorial Boardptj Editorial Board
Editorial Management & AdvertisingAdmir CelovicE-Mail: [email protected]: +49 (0)511 90992-20 Design & LayoutConstantin Schreiber: [email protected]
Editorial StaffDennis Fandrich: [email protected] Iden: [email protected]
Terms of publicationSix times a year
PublisherEuro Institute for Information and Technology Transfer GmbHMarie-Jahn-Straße 2030177 Hannover, GermanyTel: +49 (0)511 90992-10Fax: +49 (0)511 90992-69URL: www.eitep.de

Entreprise Management System
Pedestrianand vehicularleak detection
Multigasstationary sensors
SurveyMobile app
On-site CH4 leakconfi rmation data
Web-based Monitoring software
Long distanceCH4 detection
250 ppm
320 ppm
250 ppm
105 ppm
505 ppm
Alan Vidal > GAZOMAT
Abstract
A recent newcomer in the global energy mix, natural gas will represent the second biggest share after oil by 2040, according to the International Energy Agency (IEA). Demand on natural gas is rising globally with the economic growth of developing countries and the significant move from coal to gas initiated by governments to meet the challenge of climate change and the transition to low-carbon economies.
If natural gas is considered as the fossil fuel with the lowest specific carbon dioxide emissions (CO2) for the same power generated, methane however - natural gas main component- has a far more important impact on global warm-ing than CO2 with a greater Global Warming Potential. Therefore, to support the major role natural gas has to play in the energy transition, the gas industry will have to cut methane emissions.
Leak sources are multiple within the complex gas systems in place ranging from gas wells to millions of miles of pipelines, millions of compressors, valves and other components. Likewise leak factors are numerous, among which natural ageing of installations, exposure to environmental conditions or continuous operation. The task facing the gas industry is not an easy one, especially as a recent study published by the US Environmental Protection Agency (EPA) indicates methane emissions from US oil and gas operations are much higher than previous estimates.
Traditional methods and detection technologies have existed for decades but today technology is advancing at an amazing rate in several aspects and disciplines applicable for gas leak detection. This paper discusses the use of advanced laser technologies combined with multi-network satellite location services and robust enterprise software for accurately measuring, locating, communicating, and responding to gas leaks large and small helping to protect the public, gas service and emergency response personnel, and the environment.
Advanced Detection Technologies and Collaborative Information Systems for Leak Detection and Response

INTRODUCTION
Gas detection technologies are essential to safety in meth-ane leak monitoring. Domains of applications are broad, versatile and challenging – gas transmission and distribu-tion pipeline networks, oil and gas production, processing and storage industries, processing industries at large, emergency interventions in confined spaces, etc.
Explosion is the primary risk that methane detection technologies protect against. Whenever methane gas is emitted, its interaction with the oxygen present in the atmosphere will increase its flammability. When combined with pressure, this may create an explosion or fire hazard subject to methane gas concentration levels in the air.
Methane leak survey applied to gas distribution networks has been used for a long time in efforts to ensure public safety. Since the outset of gas distribution, gas utilities have devised procedures and policies for detecting meth-ane leaks, maintaining, repairing their networks and pre-venting safety hazards. It is no surprise that ensuring the safety of assets, personnel and the public in general is one of the key commitments stated by gas utilities. Over past decades, legislations have also imposed a strict regulatory framework requiring transmission or distribution pipelines to be regularly surveyed following a number of rules.
Looking beyond regulatory compliance, economic con-siderations are also a driving force for detecting methane gas. When gas supply has to be shut down in a part of the city to undertake unscheduled repair works on the pipe-line, the financial impact is considerable. In France, for example, after a gas supply disconnection/reconnection, each customer’s installation has to be visually checked by a technician of the French gas distribution company, an extremely long and costly process. But the consequences are nothing to compare with the “worst-case scenario” of a gas explosion occurring in a densely populated area caus-ing material damages and potentially, human casualties. The impact in such cases goes beyond the sole financial aspect, this greatly affects the company’s reputation and image.
These “worst-case scenarios” are the nightmares of gas utilities. On a day-to-day basis however, an important factor is the need to reduce ongoing routine maintenance costs and increase operational safety and performance using adequate technologies and detection instruments.
In addition to preventing dangerous situations there is the ever-pressing demand of the public opinion and even governments to reduce the carbon footprint of human ac-tivities. Major contributing sources include the gas industry and the methane emissions it generates and explain the need to turn to new technological solutions. The evolution
in methane gas detection is considerable with the break-through of laser technologies. Combining the strength of laser detection with advances in communication technolo-gies can offer significant added-value and provide tangi-ble benefits throughout the process, from production to end-consumers.
LEAK SURVEY: A MAINTENANCE PROGRAM NECESSITY
As part of the leak Detection and Repair programs (LDAR), gas network leak survey is a key contributor to the In-tegrity Management Systems pipeline operators and gas utilities are setting up worldwide.
Scheduled leak survey is a powerful tool that enables natural gas operators to know the state of their networks and perform the needed operations, from forecasting and budgeting asset replacement to emergency repair. This takes however a global approach based on a number of key considerations:
Analyzing survey procedures to come up with detailed maintenance guidelines is a first key step. This requires taking into consideration the characteristics of the network built over the decades: pipe material (ductile cast-iron, steel, copper, wood, HDPE), date of installation, lay-out techniques, service pressure, the immediate environment (densely urban area or rural area), accessibility of the dif-ferent sections to leak survey teams (on-foot or by vehicle). Past experience feedback as well as risk analysis issues are also taken into account to assign survey priority levels and frequencies to each section of the gas network and determine the human and material resources to be com-mitted.
Second, regulatory constraints are setting the global framework. Survey frequency was the first issue addressed, to be followed more recently by the requirement for survey operations’ traceability. The obligation on gas operators to be in the capacity of reporting on any part of a survey oper-ation conducted changes the game completely. It leads to review all the data management process.
Then, selecting the best equipment suited to meet all re-quirements is the last step.
LEAK DETECTION TECHNOLOGY: THE BREAKTHROUGH OF LASER
Leak detection technology has evolved considerably since the early days of gas distribution. If, at the very beginning, leak survey relied on visual inspection of any dead vegeta-tion along pipelines and smell detection – the human nose
RESEARCH / DEVELOPMENT / TECHNOLOGYPIPELINE TECHNOLOGY JOURNAL 7

can sense gas concentration as from 500 ppm if the gas has been properly odorized, other detection techniques had to be employed to improve leak surveys. All measuring techniques applied to methane leak detection are based on a same working principle: an air sample is aspirated and brought into contact with a sensor reacting to gas molecules to provide a gas concentration measurement. Effectiveness is conditioned by the following criteria:
• Measurement stability: Detectors, once calibrated, must ensure repeatability of measurements, no matter what the operating conditions are.
• Sensitivity: detection range must go down to the low-est ppm levels
• Selectivity: Calibrated to one type of gas (methane for gas distribution networks), detectors must be highly selective, with no false alarms occurring due to other gases.
• Response time: must be the shortest to enable precise leak location and increase survey speed.
First measurement techniques were initially based on pel-listors, katharometer sensors, flame ionization detection (FID) or semi-conductors, each technique offering advan-tages and drawbacks, thus compelling gas companies to work with a wide range of devices using different detection technologies to suit their survey needs. The rapidly chang-ing context of the gas industry however urged pipeline
Table 1: How laser-based inspection makes a difference
RESEARCH / DEVELOPMENT / TECHNOLOGY8 PIPELINE TECHNOLOGY JOURNAL
operators to look for improved detection solutions. At the end of the nineties, a new type of detectors based on laser spectroscopy technology appeared. Already successfully employed in other domains, the laser technology applied to gas sensing demonstrated most promising results for the detection and quantification of low concentrations of gases such as carbon dioxide or methane. And optical detectors do offer key advantages:
• Higher sensitivity in the order of parts per billion (ppb)• Selectivity as they detect only methane. Selectivity to
methane reduces false alarms and unnecessary inter-ventions by gas emergency teams.
• New laser-based instruments also offer a wide mea-surement range from 0ppm to 100% vol. gas, which significantly extends the range of survey operations covered.
• Immune to humidity and temperature, resistant to vibrations, the laser-based devices also contribute to measurement stability and accuracy.
• A quick response time (typically one second which is more than half of that of flame ionization) allows for surveying faster.
• Other significant advantages, the lower cost of own-ership, as they are easier to calibrate and to maintain, as well as their greater operational simplicity which reduces drastically operators’ training time.
• Advances in laser technology have also contributed to the emergence of extremely compact, small-sized measuring devices, with powerful detection capacities down to 0.5ppm and even less. For gas operators, this translates into improved detection methods and proce-dures as well as new, flexible solutions:
• Stationary or semi-stationary real-time continuous monitoring systems capable of low concentrations readings (methane, CO2).
• Remote methane leak detection systems. Available in hand-held portable models but also utilized with drone systems they make surveying difficult-to-reach or hazardous areas much simpler and safer. Inspection of elevated pipelines, outside risers, valves, flanges, ser-vice galleries that required the mobilization of costly equipment and experts is no longer an issue.
• On-foot leak survey which purpose is to inspect in detail all components of a network or a gas installation is made easier for field technicians with smaller, lighter and more effective devices.
• More options are available for mobile leak survey as laser-based detection systems can be installed in the smallest sized carriers. Areas such as pedestrian zones, narrow passageways, court yards that were not accessible to conventional survey vehicles can now be monitored by these new mobile devices. They repre-sent a cost-effective and flexible alternative to walking leak survey, which is a very time-consuming process compared to vehicle.
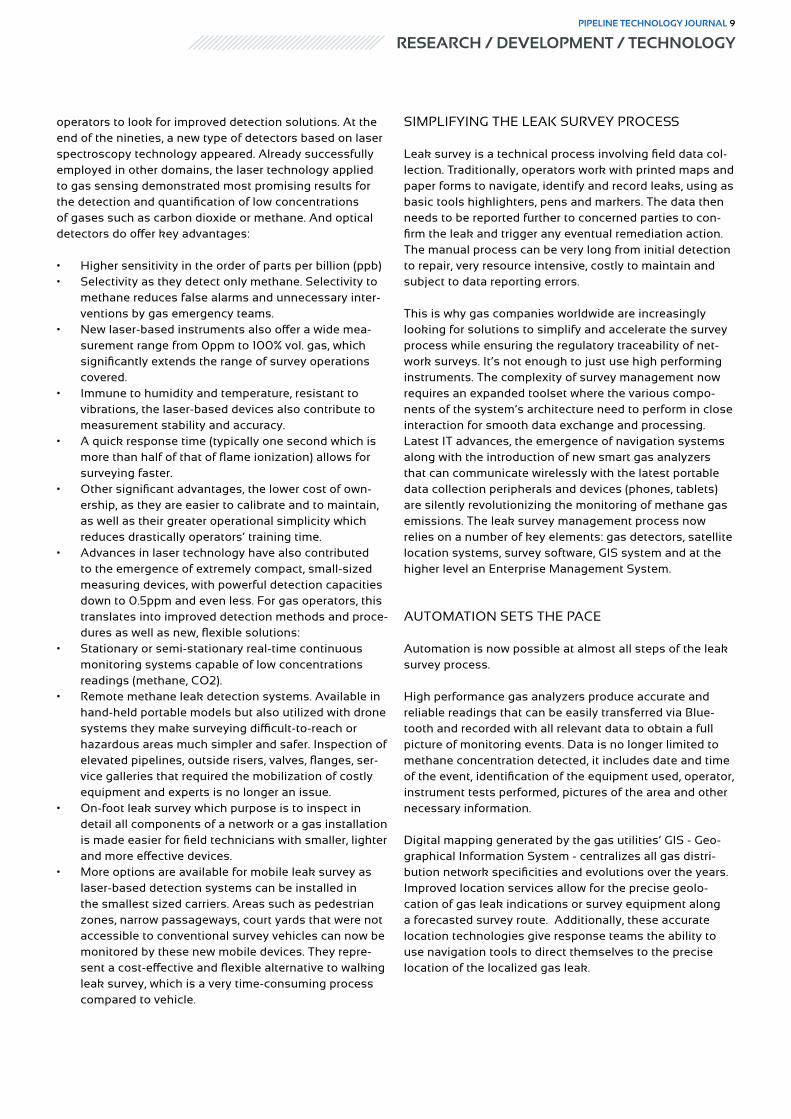
SIMPLIFYING THE LEAK SURVEY PROCESS
Leak survey is a technical process involving field data col-lection. Traditionally, operators work with printed maps and paper forms to navigate, identify and record leaks, using as basic tools highlighters, pens and markers. The data then needs to be reported further to concerned parties to con-firm the leak and trigger any eventual remediation action. The manual process can be very long from initial detection to repair, very resource intensive, costly to maintain and subject to data reporting errors.
This is why gas companies worldwide are increasingly looking for solutions to simplify and accelerate the survey process while ensuring the regulatory traceability of net-work surveys. It’s not enough to just use high performing instruments. The complexity of survey management now requires an expanded toolset where the various compo-nents of the system’s architecture need to perform in close interaction for smooth data exchange and processing. Latest IT advances, the emergence of navigation systems along with the introduction of new smart gas analyzers that can communicate wirelessly with the latest portable data collection peripherals and devices (phones, tablets) are silently revolutionizing the monitoring of methane gas emissions. The leak survey management process now relies on a number of key elements: gas detectors, satellite location systems, survey software, GIS system and at the higher level an Enterprise Management System.
AUTOMATION SETS THE PACE
Automation is now possible at almost all steps of the leak survey process.
High performance gas analyzers produce accurate and reliable readings that can be easily transferred via Blue-tooth and recorded with all relevant data to obtain a full picture of monitoring events. Data is no longer limited to methane concentration detected, it includes date and time of the event, identification of the equipment used, operator, instrument tests performed, pictures of the area and other necessary information.
Digital mapping generated by the gas utilities’ GIS - Geo-graphical Information System - centralizes all gas distri-bution network specificities and evolutions over the years. Improved location services allow for the precise geolo-cation of gas leak indications or survey equipment along a forecasted survey route. Additionally, these accurate location technologies give response teams the ability to use navigation tools to direct themselves to the precise location of the localized gas leak.
RESEARCH / DEVELOPMENT / TECHNOLOGYPIPELINE TECHNOLOGY JOURNAL 9
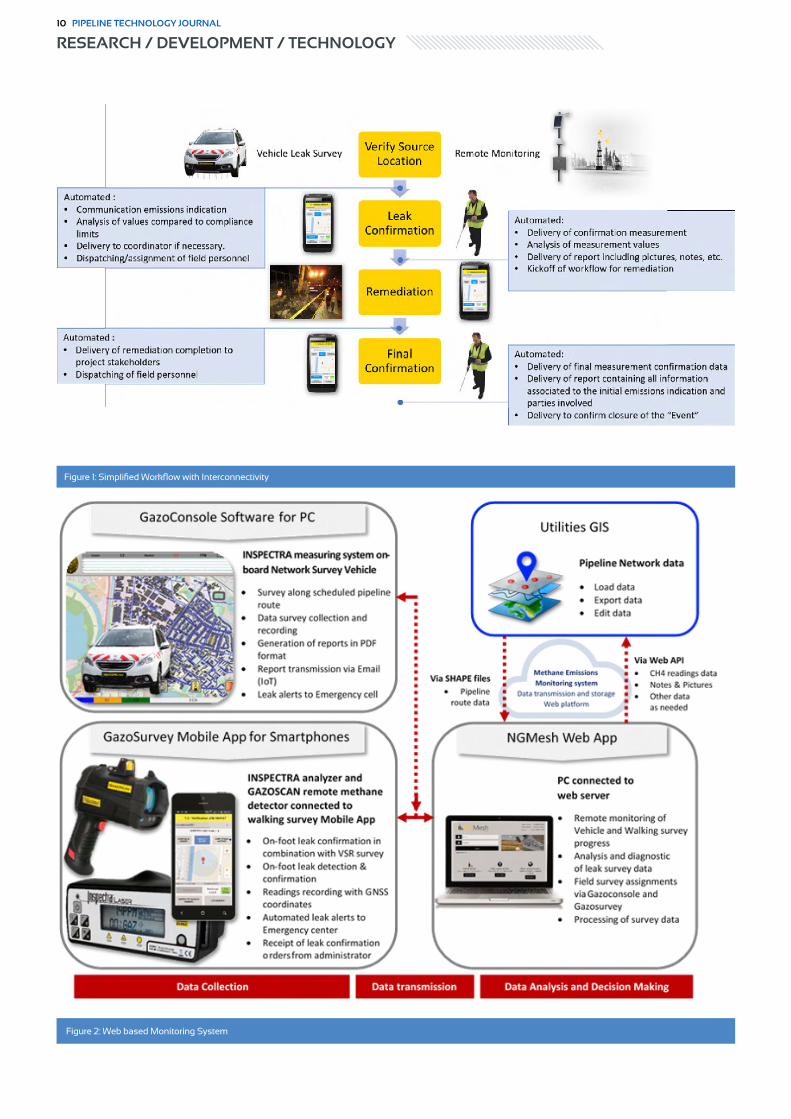
Figure 1: Simplified Workflow with Interconnectivity
Figure 2: Web based Monitoring System
RESEARCH / DEVELOPMENT / TECHNOLOGY10 PIPELINE TECHNOLOGY JOURNAL

Running on many types of data collection devices such as mobile phones, tablets, PCs, dedicated survey software drives the measuring instruments and geolocation equip-ment; it automatically collects, records emissions monitor-ing data activity, generates detailed reports, providing full monitoring traceability via geolocation coordinates. Where field operators used to work with paper maps, they will now follow the survey route on a computer or tablet screen with real-time visualization of survey results and survey advancement status. Replacing the traditional note taking tools of pen and paper, the cursor, the operator’s finger or voice allows for notes entry or direct interaction with the software anytime.
DATA MANAGEMENT AT THE CORE OF LEAK SURVEY SYSTEMS
Collecting relevant and accurate data is essential and it is quite obvious that the way field data is communicated, processed, stored and made available for analysis and decision making is key. Typically, the priority level of a gas leak recorded will either lead to an immediate alert made by the field operator to the Emergency Intervention cell for immediate action, or the information will be integrated to the survey report for analysis and may ultimately require planning of repair work or periodical monitoring.
In the case of Emergency Intervention, it is critical that the information reaches the concerned parties in near real-time. Mobile phones offer nowadays the most efficient solution for alert purposes. In the other cases, it is strate-gic that relevant data updates the database as seamlessly possible and is made readily accessible to authorized users. The ever-growing amount of data collected however poses the key question of rapid, safe data transfer, storage and retrieval, with the ultimate goal of data integrity and global efficiency. This is where an enterprise management system can help. For the gas industry, this includes not only the centrally managed server-based computer sys-tems, but also portable, mobile and stationary monitors as well as the equipment from which the information is being gathered. All these systems must be interlinked and are critical to the collection and delivery of accurate informa-tion. According to their respective authorized access levels – field technicians, Engineers, Coordinators, Managers, even sub-contractors will be granted easy access to the information and functionalities they need. Other consid-erations are an entirely internally managed solution or a web-based, externally hosted solution.
Figure 1 above gives an example of an interconnected gas leak monitoring system that streamlines the overall opera-tions of people involved.
Figure 3: Global Survey Activity and Real-time view
RESEARCH / DEVELOPMENT / TECHNOLOGYPIPELINE TECHNOLOGY JOURNAL 11
• In step 1, two simultaneous methods of methane detection are being performed. One method is with ve-hicle-based detection and the second method is with a stationary remote monitoring system.
• Upon detection of a methane gas emission, the infor-mation is immediately communicated. The communi-cation occurs in accordance with workflow processes but expedited and automated by the enterprise solu-tion. The workflow can implement decision making such as dispatching a field technician to verify the source location of the emission. This task would ap-pear on their mobile device represented in the second step. The mobile application can show the user where the emission was found and provide navigation to the location.
• Once at the location, the technician uses a portable methane analyzer to confirm the source of the emis-sion and the concentration. When the leak is localized and confirmed by the field technician, the mobile appli-cation communicates the information to the enterprise solution that then delivers the information to response coordination. Again, workflow processes are followed, and decisions can be made. If a high gas leak concen-tration is found and requires emergency measures, it is communicated digitally and follows the organization’s procedures for emergency response, as shown in the third step.
• When the remediation action is completed, a commu-nication can be delivered to a field technician moving to the final step. A task on the mobile application is available to confirm the repair of the emission source. After confirmation, an entire workflow cycle has been completed.
Figure 2 shows a high-level view of a monitoring man-agement system’s architecture based on a web-server solution. All the closely interconnected tools – GIS for the delivery of continuously-updated network maps, vehi-cle survey software, walking survey mobile application, location technologies are all driven by the Enterprise Management System. Workflows deliver more relevant data of higher quality to concerned parties, allowing for the processing and storage of larger amounts of data, in a fast and secure way. Direct access to a web-based server is granted using a web-browser. The system is flexible and efficient. It provides real-time visibility on leak activity anytime, everywhere, for immediate decision-making and action coordination, while ensuring traceability of leak detection operations, securing data storage and optimizing availability of reliable data.
The added value is all the more obvious when transposing this type of system on a larger scale of survey operation, with hundreds of emissions monitoring equipment run-ning simultaneously in different locations and hundreds or thousands of users interfacing with the data. Figure 3
shows how the activity of several survey teams operating in different locations can be displayed and followed.
PREPARING THE FUTURE
The gas industry is clearly at an important crossroads of its history. Operational, financial, technical and even socie-tal issues need to be addressed to stay in the game and move forward. At the international level, cards are being reshuffled and strategies revamped. At a time when pipe-line integrity management systems require more data to constantly monitor dynamic changes along infrastructure and maintain safety at a high level with a need to reduce both capital and operational expenditures, gas operators can activate a number of powerful levers, building upon the most recent developments in electronic, sensor, telecom-munications and computing technologies.
Laser technology is constantly improving detection perfor-mances and pushing the limits. Achieving a sensitivity as high as 100ppb (0.1ppm) with a cost-effective solution will be readily available. Gas dilution in the air and survey vehi-cle’s speed would no longer be an issue for measuring the smallest gas concentrations and spotting gas leaks more precisely. Similarly, amplification of the signal noise by frequency modulation is improving sensitivity for remote detection distance, allowing for detection distances at 100 meters or more, as demonstrated by latest remote meth-ane detectors on the market.
What seemed impossible is becoming possible. It is, the ability to integrate and interconnect multiple data sets including historical operator records as well as real-time values and finally the ability to analyze and assess all available information in a quick and timely fashion that will make a difference. Only by way of a global approach, will gas operators obtain the most accurate snapshot of their assets’ current leak status, while gaining all the insights required to plan and act efficiently.
Author
Alan Vidal
GAZOMAT S.A.R.L.
Managing Director
RESEARCH / DEVELOPMENT / TECHNOLOGY12 PIPELINE TECHNOLOGY JOURNAL

900+ PARTICIPANTS 80+ PIPELINE OPERATORS NETWORKING90+ EXHIBITORS
15TH PIPELINE TECHNOLOGY CONFERENCE 30 MAR. - 2 APR. 2020, ESTREL CONGRESS CENTER, BERLIN, GERMANY
Meet the international Pipeline Community in Berlin
Golden Sponsors Silver Sponsors
Diamond Sponsor Platinum Sponsor
www.pipeline-conference.com

Michael Milner > University of Alberta
Abstract
As physical entities, pipelines are subject to numerous points of failure including corrosion, mechanical damage, and natural hazards. Despite being infrequent, pipeline failure can have disproportionate consequences resulting from environmental clean-up and lost production. Best practices in pipeline risk management employ both leak-preven-tion and leak-detection strategies, the latter to reduce leak impacts via earlier detection, resolution, and remediation. However, sensor systems for leak detection (e.g. fiber optics) can be prohibitively costly to install on legacy pipelines. Inferential (soft) sensing approaches using hydraulic modeling can be effective, but are vulnerable to measurement uncertainties, noise, and calibration drifts. There is a clear need for models that can tolerate such phenomena while minimizing detection time and false-positive and false-negative errors.
We propose an inferential sensing framework using machine learning as a cost-effective leak detection system. We treat leak detection as an instance of anomaly detection; a model of normal behavior is built, and deviations from that model trigger alarms. Intelligent anomaly detection designs are two-stage models, with normal behavior and deviations from it learned separately, often via completely different algorithms. In this instance, sensor data streams (temperature, pressure, etc.) are treated as time series, and forecasting models (deep neural networks) are learned from the delayed normal behavior of the pipeline. These forecasts are designed to predict the current, rather than future, pipeline behavior from past observations. The anomaly detector (support vector machines or shallow neural networks) learns to compare the prediction against the actual, current observation and raise an alarm when predic-tions and reality diverge significantly. When tested against real-world pipeline data with a nominal flow rate of 350 m3/hr, the inferential sensing framework correctly identified a 35 m3/hr leak within 5 minutes and a 5 m3/hr leak within 48 minutes, with no false positives.
Pipeline Leak Detection via Machine Learning

INTRODUCTION
Artificial intelligence (AI) as an umbrella term for machine learning, neural networks, and deep learning is gaining in-creasing acceptance in industrial circles [1]. To illustrate the simplicity and applicability of AI in the context of pipeline technology, we set out to build an intelligent leak detec-tion system using only inferential sensing and machine learning.
The proposed system is realized as a two-stage model. In the first stage leak-free flow rate, temperature, pressure, and density measurements are used to train a deep learn-ing neural network as a predictor of nominal flow. For this task two architectures are compared: a one-dimensional convolutional neural network (CNN) and a long short-term memory (LSTM) recurrent neural network. Mean square error (MSE) on an out-of-sample test set is the indicator of each architecture’s overall performance. In the second stage an anomaly detector compares the leak-free time series predictions against controlled-leak observations. For this task two supervised machine learning models are compared: a one-class support vector machine (SVM) and a multi-layer perceptron (MLP) neural network. Receiver Operating Characteristic (ROC) curves measure the perfor-mance of each model. Taken as a whole, the predictor and anomaly detector are characterized by high-level metrics such as detection, speed of detection, and number of false positives. Figure 1 illustrates the proposed solution.
MACHINE LEARNING BACKGROUND
The following section provides a high-level overview of the machine learning concepts considered.
ARTIFICIAL NEURON
A fundamental building block of many neural network architectures, the artificial neuron is designed to mimic bio-logical neurons present in the human brain [2]. An artificial neuron operates on an input vector as shown in Figure 2. In this experiment the input vector contains flow rate, tem-perature, pressure, and density measurements at a specific instance in time.
MULTI-LAYER PERCEPTRON
As shown in Figure 3, when multiple layers of artificial neu-rons are combined in sequence, the resulting architecture is referred to as a multi-layer perceptron [3].
If the output variable is categorical, as in the case of a leak/no-leak scenario, an MLP can be used as a classifier. In this experiment, an MLP is considered for the anomaly detector component. Among numerous hyperparameters, the number of layers and the number of neurons per layer are important in minimizing the error of the MLP.
Figure 1: Intelligent Leak Detector
Figure 2: Model of an Artificial Neuron
Figure 3: Multi-Layer Perceptron
Pipeline Technology Journal
Haven’t seen your company in here?
There is space for advertising!
Contact us: [email protected]
RESEARCH / DEVELOPMENT / TECHNOLOGYPIPELINE TECHNOLOGY JOURNAL 15
CONVOLUTIONAL NEURAL NETWORK
A convolutional neural network is a special instance of the multi-layer perceptron that has traditionally been applied as an image classifier [4]. More recently, one-dimensional CNNs have also proven effective when forecasting future values in a series of observations with temporal ordering [5]. In this experiment, a CNN is considered for the predic-tion of nominal flow.
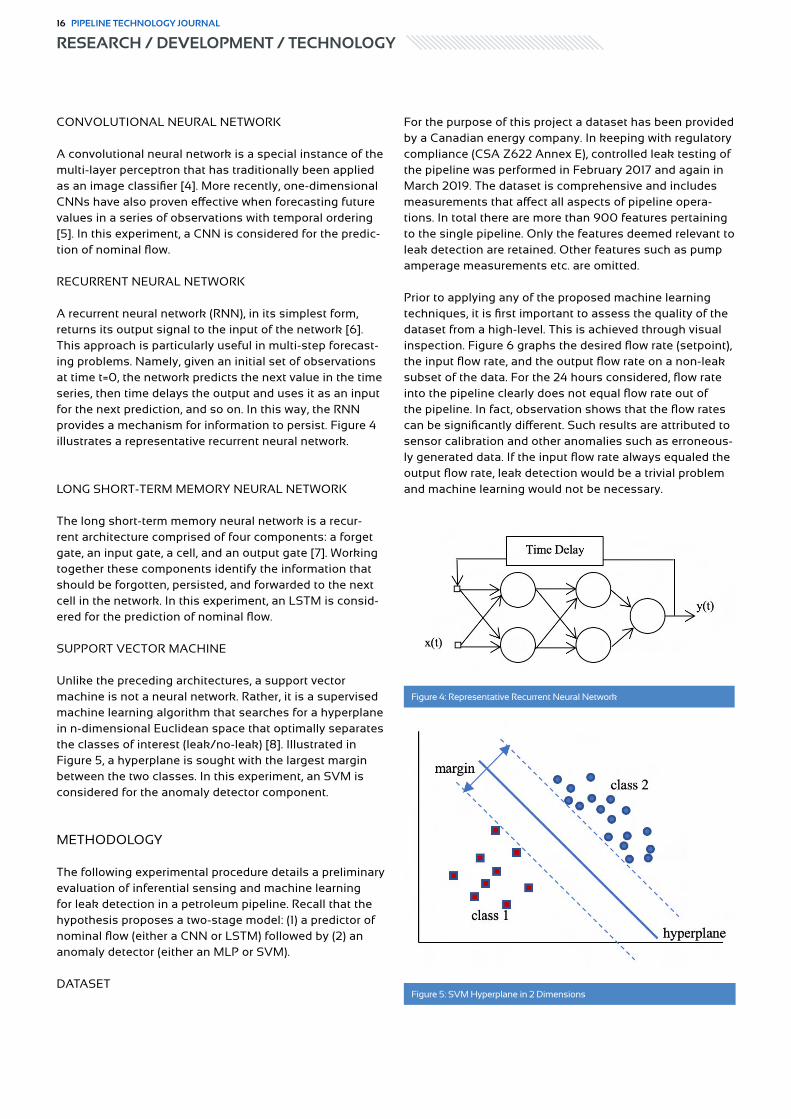
RECURRENT NEURAL NETWORK
A recurrent neural network (RNN), in its simplest form, returns its output signal to the input of the network [6]. This approach is particularly useful in multi-step forecast-ing problems. Namely, given an initial set of observations at time t=0, the network predicts the next value in the time series, then time delays the output and uses it as an input for the next prediction, and so on. In this way, the RNN provides a mechanism for information to persist. Figure 4 illustrates a representative recurrent neural network.
LONG SHORT-TERM MEMORY NEURAL NETWORK
The long short-term memory neural network is a recur-rent architecture comprised of four components: a forget gate, an input gate, a cell, and an output gate [7]. Working together these components identify the information that should be forgotten, persisted, and forwarded to the next cell in the network. In this experiment, an LSTM is consid-ered for the prediction of nominal flow.
SUPPORT VECTOR MACHINE
Unlike the preceding architectures, a support vector machine is not a neural network. Rather, it is a supervised machine learning algorithm that searches for a hyperplane in n-dimensional Euclidean space that optimally separates the classes of interest (leak/no-leak) [8]. Illustrated in Figure 5, a hyperplane is sought with the largest margin between the two classes. In this experiment, an SVM is considered for the anomaly detector component.
METHODOLOGY
The following experimental procedure details a preliminary evaluation of inferential sensing and machine learning for leak detection in a petroleum pipeline. Recall that the hypothesis proposes a two-stage model: (1) a predictor of nominal flow (either a CNN or LSTM) followed by (2) an anomaly detector (either an MLP or SVM).
DATASET
For the purpose of this project a dataset has been provided by a Canadian energy company. In keeping with regulatory compliance (CSA Z622 Annex E), controlled leak testing of the pipeline was performed in February 2017 and again in March 2019. The dataset is comprehensive and includes measurements that affect all aspects of pipeline opera-tions. In total there are more than 900 features pertaining to the single pipeline. Only the features deemed relevant to leak detection are retained. Other features such as pump amperage measurements etc. are omitted.
Prior to applying any of the proposed machine learning techniques, it is first important to assess the quality of the dataset from a high-level. This is achieved through visual inspection. Figure 6 graphs the desired flow rate (setpoint), the input flow rate, and the output flow rate on a non-leak subset of the data. For the 24 hours considered, flow rate into the pipeline clearly does not equal flow rate out of the pipeline. In fact, observation shows that the flow rates can be significantly different. Such results are attributed to sensor calibration and other anomalies such as erroneous-ly generated data. If the input flow rate always equaled the output flow rate, leak detection would be a trivial problem and machine learning would not be necessary.
Figure 5: SVM Hyperplane in 2 Dimensions
Figure 4: Representative Recurrent Neural Network
RESEARCH / DEVELOPMENT / TECHNOLOGY16 PIPELINE TECHNOLOGY JOURNAL
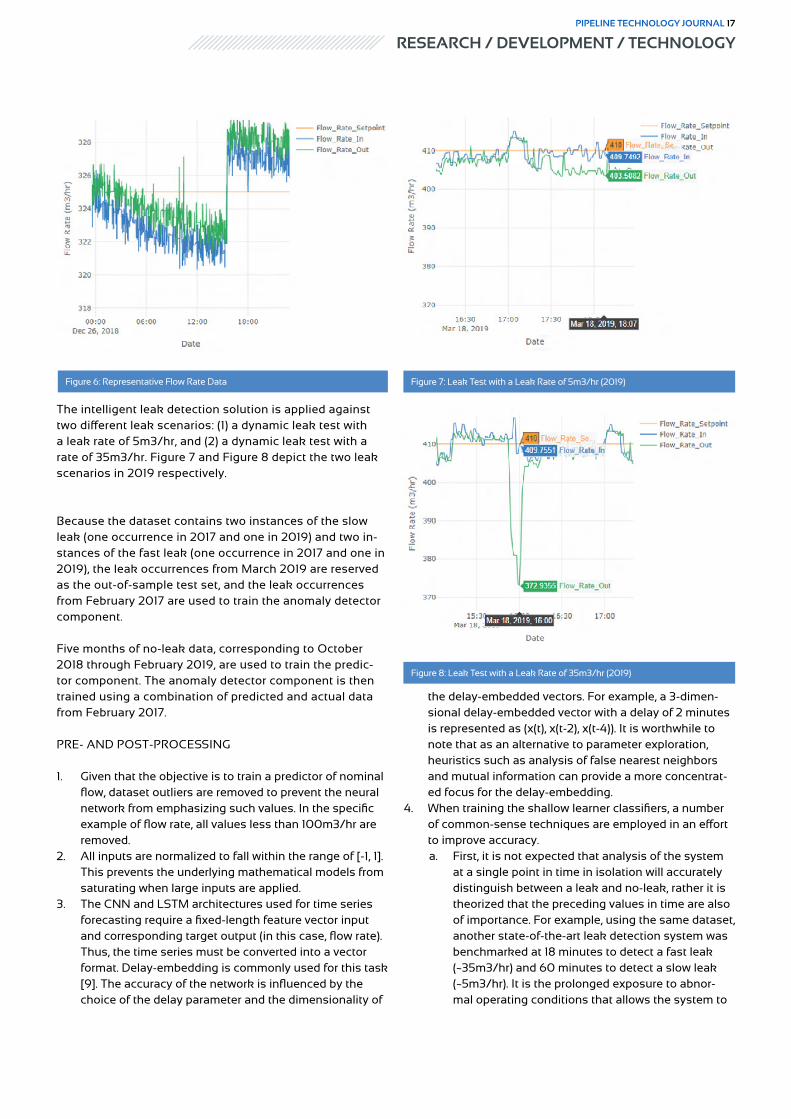
The intelligent leak detection solution is applied against two different leak scenarios: (1) a dynamic leak test with a leak rate of 5m3/hr, and (2) a dynamic leak test with a rate of 35m3/hr. Figure 7 and Figure 8 depict the two leak scenarios in 2019 respectively.
Because the dataset contains two instances of the slow leak (one occurrence in 2017 and one in 2019) and two in-stances of the fast leak (one occurrence in 2017 and one in 2019), the leak occurrences from March 2019 are reserved as the out-of-sample test set, and the leak occurrences from February 2017 are used to train the anomaly detector component.
Five months of no-leak data, corresponding to October 2018 through February 2019, are used to train the predic-tor component. The anomaly detector component is then trained using a combination of predicted and actual data from February 2017.
PRE- AND POST-PROCESSING
1. Given that the objective is to train a predictor of nominal flow, dataset outliers are removed to prevent the neural network from emphasizing such values. In the specific example of flow rate, all values less than 100m3/hr are removed.
2. All inputs are normalized to fall within the range of [-1, 1]. This prevents the underlying mathematical models from saturating when large inputs are applied.
3. The CNN and LSTM architectures used for time series forecasting require a fixed-length feature vector input and corresponding target output (in this case, flow rate). Thus, the time series must be converted into a vector format. Delay-embedding is commonly used for this task [9]. The accuracy of the network is influenced by the choice of the delay parameter and the dimensionality of
the delay-embedded vectors. For example, a 3-dimen-sional delay-embedded vector with a delay of 2 minutes is represented as (x(t), x(t-2), x(t-4)). It is worthwhile to note that as an alternative to parameter exploration, heuristics such as analysis of false nearest neighbors and mutual information can provide a more concentrat-ed focus for the delay-embedding.
4. When training the shallow learner classifiers, a number of common-sense techniques are employed in an effort to improve accuracy.a. First, it is not expected that analysis of the system
at a single point in time in isolation will accurately distinguish between a leak and no-leak, rather it is theorized that the preceding values in time are also of importance. For example, using the same dataset, another state-of-the-art leak detection system was benchmarked at 18 minutes to detect a fast leak (~35m3/hr) and 60 minutes to detect a slow leak (~5m3/hr). It is the prolonged exposure to abnor-mal operating conditions that allows the system to
Figure 6: Representative Flow Rate Data Figure 7: Leak Test with a Leak Rate of 5m3/hr (2019)
Figure 8: Leak Test with a Leak Rate of 35m3/hr (2019)
RESEARCH / DEVELOPMENT / TECHNOLOGYPIPELINE TECHNOLOGY JOURNAL 17
classify the leak. Accordingly, the machine learning approaches in this experimental procedure will threshold past values in making a final prediction. Specifically, each classifier output will be compared against the past x number of predictions and if the average number of leak classifications exceeds a threshold (for example, 90%), a leak will officially be asserted. This approach is anticipated to reduce the number of false positives caused by temporary measurement fluctuations.
a. Secondly, given the disproportionate number of no-leak data points to leak data points, oversampling is performed. In this technique, the data samples labelled as leaks are duplicated and randomly dispersed throughout the original dataset such that the leak to no-leak ratio is roughly 50-50. It is acknowledged that oversampling will reduce the predictive validity of the solution, however the counter-argument proposes that leak events will exhibit similar characteristics (i.e. a divergence between predicted and actual flow rate values) and that the absolute feature magnitude is of lesser importance than its relative shape in relation to the other features. For this reason, the flow rate values are normalized to account for the current setpoint prior to testing.
PREDICTOR COMPONENT PARAMETER EXPLORATION
Parameter exploration of the predictor component is performed against standard hyperparameter combinations such as batch size, number of layers, number of neurons per layer, and delay embedding.
ANOMALY DETECTOR COMPONENT PA-RAMETER EXPLORATION
Parameter exploration of the anomaly detector component is also performed against standard hyperparameter com-binations but in addition, is done so in two distinct experi-ments. The objective of Experiment 1 is to detect fast leaks (leaks of ~35m3/hr) and the objective of Experiment 2 is to
detect slow leaks (leaks of ~5m3/hr). The reason for this decision is derived from analysis of Figure 7 and Figure 8 wherein noticeably different trends between the two leak conditions are observed.
PARAMETER EXPLORATION RE-SULTS AND ANALYSIS
PREDICTOR COMPONENT RESULTS
In total, 336 parameter explorations were performed for the CNN. The best result yielded an average fivefold cross-val-idation MSE of 0.00166, and when run against the out-of-sample test set from February 2017, the MSE on the scaled dataset was 0.000579.
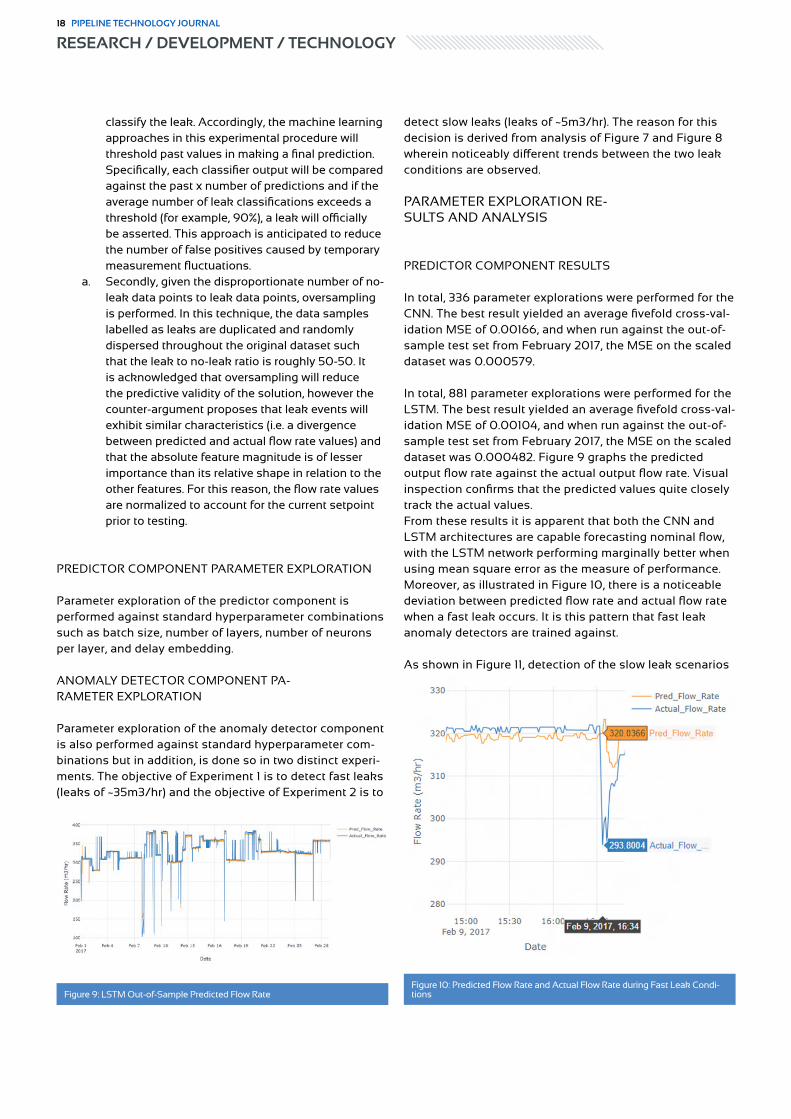
In total, 881 parameter explorations were performed for the LSTM. The best result yielded an average fivefold cross-val-idation MSE of 0.00104, and when run against the out-of-sample test set from February 2017, the MSE on the scaled dataset was 0.000482. Figure 9 graphs the predicted output flow rate against the actual output flow rate. Visual inspection confirms that the predicted values quite closely track the actual values.From these results it is apparent that both the CNN and LSTM architectures are capable forecasting nominal flow, with the LSTM network performing marginally better when using mean square error as the measure of performance. Moreover, as illustrated in Figure 10, there is a noticeable deviation between predicted flow rate and actual flow rate when a fast leak occurs. It is this pattern that fast leak anomaly detectors are trained against.
As shown in Figure 11, detection of the slow leak scenarios
Figure 9: LSTM Out-of-Sample Predicted Flow RateFigure 10: Predicted Flow Rate and Actual Flow Rate during Fast Leak Condi-tions
RESEARCH / DEVELOPMENT / TECHNOLOGY18 PIPELINE TECHNOLOGY JOURNAL

may prove more challenging given that unlike the fast leak there is no abrupt change in flow rate, rather there appears to be a decreasing trend in actual flow rate compared to predicted flow rate. As mentioned previously, it is for this reason that the detection of fast vs. slow leaks is handled by two separately trained classifiers.
ANOMALY DETECTOR COMPONENT RESULTS
In total, 300 parameter explorations were performed for MLP Experiment 1 (detection of the fast leak). In this exer-cise a number of architectures yielded an average tenfold cross-validation accuracy of 0.999 and a training ROC curve area of 1. Figure 12, illustrates an out-of-sample test set ROC curve area of 0.993.
In the context of leak detection, a false positive is a Type I error and represents a leak prediction when there is no physical leak. A false positive can prove to be a costly mis-classification if it results in the pipeline being shut down. That said, a Type II error, which is indicative of a no-leak prediction when there is a physical leak, is perhaps an even more costly misclassification as it can quickly lead to environmental damage and lost production at large scale.
The receiver operating characteristic curve illustrates the trade-off between the false positive rate and the true positive rate. With a perfect classifier, the true positive rate will be 1 and the false positive rate will be 0, resulting in an ROC curve area of 1. Thus, while the out-of-sample ROC curve area of 0.993 is quite close to 1, given the severity of a false positive, a further decrease in the number of false positives is worth pursuing. To address this concern the thresholding technique is applied. Using a leak classifi-cation threshold of 90% over a 5-minute window, the true
is leak is detected and all false positives are eliminated. Figure 13 illustrates the classification with the filter applied.
As evidenced in Figure 13, the MLP classifier (with thresh-olding applied) correctly detected the fast leak approxi-mately 5 minutes after the leak began. In comparison, the hydraulic model used during controlled leak testing of the physical pipeline took approximately 6 minutes to generate the leak alarm.
For Experiment 2 (detection of the slow leak), 300 param-eter explorations were performed. As with the fast leak classifier, there were a number of high-performing architec-tures. Figure 14 illustrates an out-of-sample test set ROC curve area of 0.968.
To reduce the number of false positives, the thresholding
Figure 12: ROC for MLP Fast Leak Out-of-Sample Classification
Figure 13: MLP Fast Leak Out-of-Sample Classification, With Thresholding
Figure 11: Predicted Flow Rate and Actual Flow Rate during Slow Leak Condi-tions
RESEARCH / DEVELOPMENT / TECHNOLOGYPIPELINE TECHNOLOGY JOURNAL 19
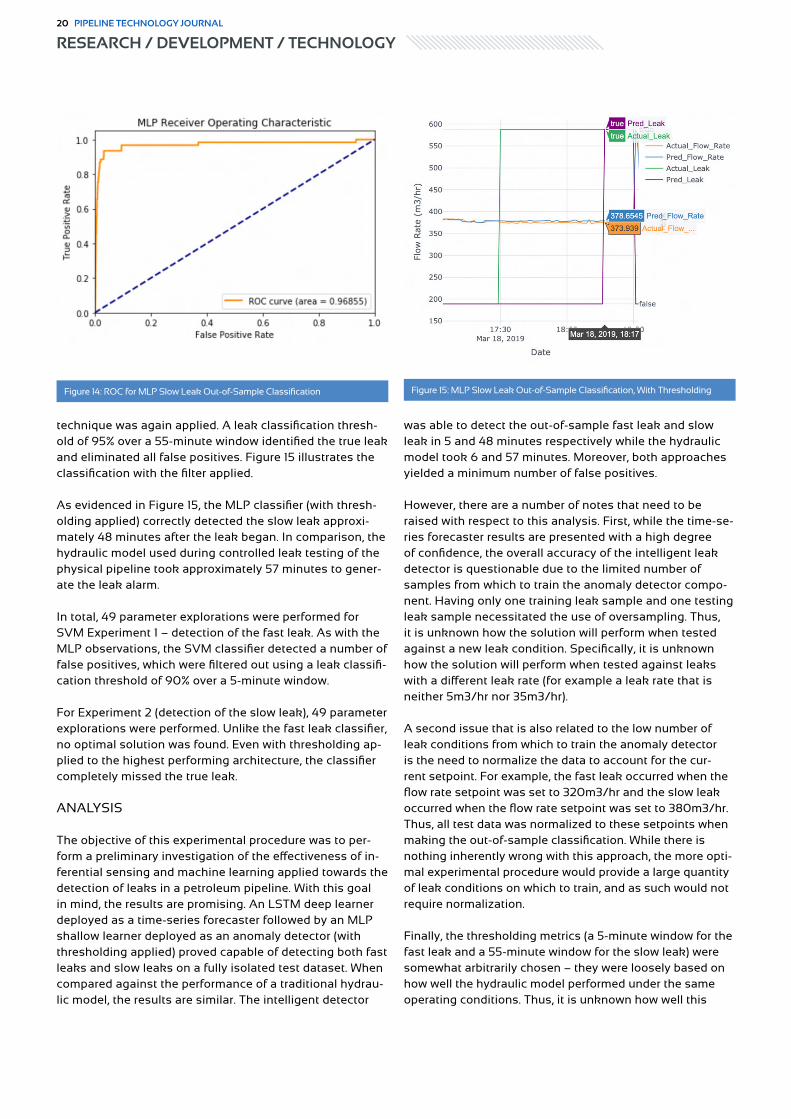
technique was again applied. A leak classification thresh-old of 95% over a 55-minute window identified the true leak and eliminated all false positives. Figure 15 illustrates the classification with the filter applied.
As evidenced in Figure 15, the MLP classifier (with thresh-olding applied) correctly detected the slow leak approxi-mately 48 minutes after the leak began. In comparison, the hydraulic model used during controlled leak testing of the physical pipeline took approximately 57 minutes to gener-ate the leak alarm.
In total, 49 parameter explorations were performed for SVM Experiment 1 – detection of the fast leak. As with the MLP observations, the SVM classifier detected a number of false positives, which were filtered out using a leak classifi-cation threshold of 90% over a 5-minute window.
For Experiment 2 (detection of the slow leak), 49 parameter explorations were performed. Unlike the fast leak classifier, no optimal solution was found. Even with thresholding ap-plied to the highest performing architecture, the classifier completely missed the true leak.
ANALYSIS
The objective of this experimental procedure was to per-form a preliminary investigation of the effectiveness of in-ferential sensing and machine learning applied towards the detection of leaks in a petroleum pipeline. With this goal in mind, the results are promising. An LSTM deep learner deployed as a time-series forecaster followed by an MLP shallow learner deployed as an anomaly detector (with thresholding applied) proved capable of detecting both fast leaks and slow leaks on a fully isolated test dataset. When compared against the performance of a traditional hydrau-lic model, the results are similar. The intelligent detector
was able to detect the out-of-sample fast leak and slow leak in 5 and 48 minutes respectively while the hydraulic model took 6 and 57 minutes. Moreover, both approaches yielded a minimum number of false positives.
However, there are a number of notes that need to be raised with respect to this analysis. First, while the time-se-ries forecaster results are presented with a high degree of confidence, the overall accuracy of the intelligent leak detector is questionable due to the limited number of samples from which to train the anomaly detector compo-nent. Having only one training leak sample and one testing leak sample necessitated the use of oversampling. Thus, it is unknown how the solution will perform when tested against a new leak condition. Specifically, it is unknown how the solution will perform when tested against leaks with a different leak rate (for example a leak rate that is neither 5m3/hr nor 35m3/hr).
A second issue that is also related to the low number of leak conditions from which to train the anomaly detector is the need to normalize the data to account for the cur-rent setpoint. For example, the fast leak occurred when the flow rate setpoint was set to 320m3/hr and the slow leak occurred when the flow rate setpoint was set to 380m3/hr. Thus, all test data was normalized to these setpoints when making the out-of-sample classification. While there is nothing inherently wrong with this approach, the more opti-mal experimental procedure would provide a large quantity of leak conditions on which to train, and as such would not require normalization.
Finally, the thresholding metrics (a 5-minute window for the fast leak and a 55-minute window for the slow leak) were somewhat arbitrarily chosen – they were loosely based on how well the hydraulic model performed under the same operating conditions. Thus, it is unknown how well this
Figure 14: ROC for MLP Slow Leak Out-of-Sample Classification Figure 15: MLP Slow Leak Out-of-Sample Classification, With Thresholding
RESEARCH / DEVELOPMENT / TECHNOLOGY20 PIPELINE TECHNOLOGY JOURNAL

thresholding scheme will perform when tested against a new leak condition.
Despite these concerns, these initial results are promising enough to warrant further consideration. Namely, if given sufficient data it is believed that the accuracy of both the time series forecasting component and the anomaly detec-tion component can reach acceptable levels of confidence to be deployed in a production system. Moreover, it is an-ticipated that a hybrid solution – comprised of a traditional hydraulic model and an intelligent model – can detect leaks faster and with a higher degree of confidence than either model used in isolation.
CONCLUSION
Intending to use inferential sensing and machine learn-ing to detect leaks in a petroleum pipeline network, the experimental procedure was conducted against a real-world dataset. Results showed that an architecture comprised of an LSTM time-series predictor of nominal flow in series with an MLP anomaly detector was able to detect both an out-of-sample fast leak (35m3/hr) and an out-of-sample slow leak (5m3/hr) in 5 minutes and 48 minutes respec-tively, without false positives. Caution should be used when interpreting these results as a number of techniques were applied to account for the limited availability of labelled leak data. As such, the results are recommended to remain a proof-of-concept pending further investigation on a more complete dataset.
Authors
Michael Milner
University of Alberta
MBA, M.Eng. Candidate
References
1. M. Chui, “AI adoption advances, but foundational barriers remain,” McKinsey & Company, 2018. [Online]. Available: https://www.mckinsey.com/featured-insights/artificial-intelligence/ai-ad-option-advances-but-foundational-barriers-remain
2. S. Haykin, Neural Networks and Learning Machines. New York: Prentice Hall, 2008, p. 6.3. S. Haykin, Neural Networks and Learning Machines. New York: Prentice Hall, 2008, p. 22.4. F. Sultana, A. Sufian, P. Dutta, “Advancements in Image Classification using Convolution Neural
Network,” 2019. [Online] Available: https://arxiv.org/pdf/1905.03288.pdf5. A. Borovykh, S. Bohte, C. Oosterlee, “Conditional time series forecasting with convolutional
neural networks,” 2018. [Online] Available: https://arxiv.org/pdf/1703.04691.pdf6. S. Haykin, Neural Networks and Learning Machines. New York: Prentice Hall, 2008, p. 23.7. R. Staudemeyer, E. Morris, “Understanding LSTM,” 2019. [Online] Available: https://arxiv.org/
pdf/1909.09586.pdf8. S. Haykin, Neural Networks and Learning Machines. New York: Prentice Hall, 2008, p. 268.9. S. Pan, K. Duraisamy, “On the Structure of Time-delay Embedding in Linear Models of Non-line-
ar Dynamical Systems,” 2019. [Online] Available: https://arxiv.org/pdf/1902.05198.pdf
Pipeline Technology Journal
COMPLEMENTARY SERVICESFOR YOUR CORPORATE-COMMUNICATION
Offers multiple advertising opportunities to increase your company‘s visibility
e-JournalTechnical Articles
e-NewsletterLatest News
WebsiteInformation Hub
IN OUR MEDIA KIT FOR 2020
YOU FIND ALL DETAILS ABOUT
OFFERS, PRICES, TOPICS
AND DATES
www.pipeline-journal.net/advertise
RESEARCH / DEVELOPMENT / TECHNOLOGYPIPELINE TECHNOLOGY JOURNAL 21
Dr. Andrew Stevenson, Doug Everard & Mebs Bobat > Sustainable Pipeline Systems Ltd
Abstract
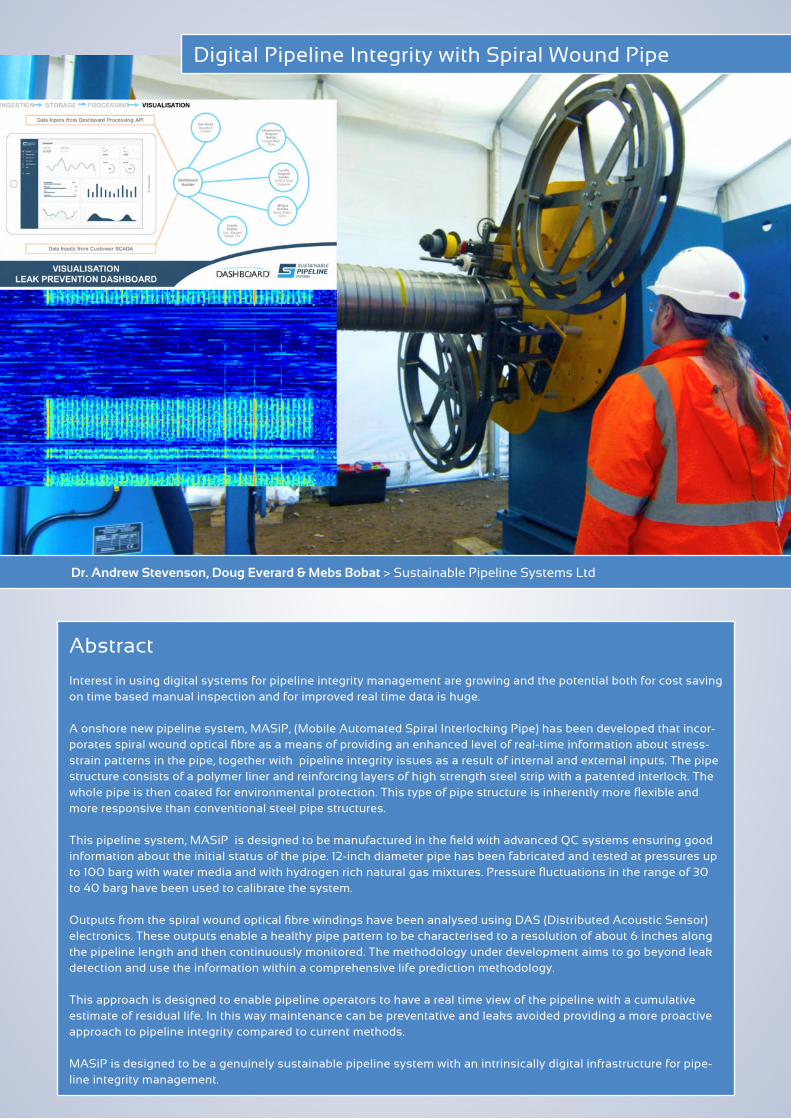
Interest in using digital systems for pipeline integrity management are growing and the potential both for cost saving on time based manual inspection and for improved real time data is huge.
A onshore new pipeline system, MASiP, (Mobile Automated Spiral Interlocking Pipe) has been developed that incor-porates spiral wound optical fibre as a means of providing an enhanced level of real-time information about stress-strain patterns in the pipe, together with pipeline integrity issues as a result of internal and external inputs. The pipe structure consists of a polymer liner and reinforcing layers of high strength steel strip with a patented interlock. The whole pipe is then coated for environmental protection. This type of pipe structure is inherently more flexible and more responsive than conventional steel pipe structures.
This pipeline system, MASiP is designed to be manufactured in the field with advanced QC systems ensuring good information about the initial status of the pipe. 12-inch diameter pipe has been fabricated and tested at pressures up to 100 barg with water media and with hydrogen rich natural gas mixtures. Pressure fluctuations in the range of 30 to 40 barg have been used to calibrate the system.
Outputs from the spiral wound optical fibre windings have been analysed using DAS (Distributed Acoustic Sensor) electronics. These outputs enable a healthy pipe pattern to be characterised to a resolution of about 6 inches along the pipeline length and then continuously monitored. The methodology under development aims to go beyond leak detection and use the information within a comprehensive life prediction methodology.
This approach is designed to enable pipeline operators to have a real time view of the pipeline with a cumulative estimate of residual life. In this way maintenance can be preventative and leaks avoided providing a more proactive approach to pipeline integrity compared to current methods.
MASiP is designed to be a genuinely sustainable pipeline system with an intrinsically digital infrastructure for pipe-line integrity management.
Digital Pipeline Integrity with Spiral Wound Pipe

ADVANTAGES OF SPIRAL WOUND OPTICAL FIBRE
Optical fibre systems have proven to be a powerful source of accurate data but generally the fibre is laid in a straight line in a separate trench next to the pipeline. The advan-tages of spirally winding the fibre around the pipe are that (a) the 360degree data collection offers a complete view of the whole pipe (b) the intimate contact enhances the data that can be collected and (c) with spirally wound pipe the optical fibre can be incorporated into the structure of the pipe at fabrication and d) the 2-layer environmental coating provides protection to the fibre.
STRUCTURE OF MASIP
Mobile Automated Spiral interlocking intelligent Pipe (MA-SiP) consists of 4 layers.
The innermost layer is a liner pipe – usually a polymer- either HDPE or PVDF which is designed to provide fluid tightness and chemical resistance to the fluid transported by the pipe.
The next layer is the reinforcement layer which provides mechanical pressure containment and consists of high strength steel strip incorporating a patented interlocking rib.
The next layer is the distributed sensing layer consisting of one or more optical fibre bundles. The function of this layer is to respond to the state of the reinforcement layer of the pipe.
The outer layer is the environmental protection layer which consists of a 2 part system , one part to adhere to the reinforcement surface and encapsulate the fibre optic cables and provide resistance to moisture the other part to provide outer resistance to moisture and to minor mechan-ical impacts such as scuffs, abrasion resistance etc.
MOBILE MANUFACTURING SYSTEM
This approach is a holistic approach to the installation of new pipelines which includes the fabrication of the pipe in-field using mobile automated equipment.
Figure 1: Pipe design with spiral wound optical fibre
Figure 2: Schematic showing the structure of MASiP with location of optical fibre within pipe wall
Figure 3: Mobile pipe fabrication at field trial site
RESEARCH / DEVELOPMENT / TECHNOLOGYPIPELINE TECHNOLOGY JOURNAL 23

Effectively raw materials are delivered to site and the mo-bile automated equipment modules move along the right of way fabricating and installing pipe continuously directly into a trench or on to supports. This has the advantage that automated quality control systems can be used to measure and record every inch of the pipe key parameters as it is laid with 100% traceability. A further advantage is that the optical fibre is installed automatically as part of the pipe fabrication and installation process.
With this approach it is no longer necessary to manufac-ture pipe in a dedicated steel mill, transport to a coating factory, subsequent transport to a site location, manually weld pipe sections on site and eliminates the require-ments of pipeline field joint coatings. Compared to conven-tional construction methods, pipe stringing, lifting and low-ering are also eliminated. The need for large amounts of semi-skilled labour in locations is substantially decreased with a potential reduction in the risk of HSE incidents. In addition, due to the automated process, the right of way requirements are minimised thereby cutting down on the environmental impact.
PHYSICAL TESTS AND DATA GATHERING
A series of tests have been carried out using test pipe sec-tions that also had strain gauges applied to calibrate the stress/strain outputs from the fibre optic system
The physical tests consisted of applying a series of pressure cycles to 12-inch diameter MASiP test pipe. The pressure tests were conducted at DNVGL pipe test centre at Spadeadam.When there is a pressure cycle there is a clear change on the pattern of hoop and axial stress /strain distributions which allow a healthy pipe profile to be recorded and used as a benchmark for data analysis.
The optical fibre cable provides a complete connectivity along the pipe. Data gathering and pre-processing was carried out using Optasense advanced system which uses interference fringes created when light pulses are fired down the fibre to construct baseline data on hoop strain as well as temperature change and acoustic transients.
This is an advanced system already in service with linear optic fibre systems. It was found that there was a good correlation between the strain gauge outputs and the fibre optic outputs for stress strain along the pipe.
The fibre length was divided into about 200 channels, each channel representing about 6 inches of pipe. A waterfall display allows changes in any channel to be seen in real time and visualised on a display illustrated below This provides an early advance warning system in the event of abnormal events, including, but not limited to third party intrusion. The channel width available allows the section of pipeline affected to be identified with pinpoint precision. The system was also found to be very sensitive to fractions of a degree change in temperature. This data , as with all the other data, needs to be appropriately managed with a data analysis and alerting system that can ensure false alarms are not confused with real incidents.The ability of a closely wound optical fibre to generate a
Figure 4: Test pipe without environmental outer layer showing strain gauges and optical fibre cable
Figure 5: 3D finite element analysis of reinforcement layer of MASiP providing the basis for the healthy pipe algorithm
Figure 6: Calibration results of strain gauge outputs comparing strain gauge and optical fibre
RESEARCH / DEVELOPMENT / TECHNOLOGY24 PIPELINE TECHNOLOGY JOURNAL

large amount of data and for this data to offer resolution to every 6 inches of pipe length in real time offers a ground breaking approach to pipeline integrity management. There are a number of spare fibres in the cable installed that allow dedicated fibres for specific parameters of interest and also for general communications. All these benefits in one fibre cable provide a real advantage over conventional systems.
DATA MANAGEMENT
This system generates a huge amount of data on a daily basis so it is important to have a very organised data management system. The processing system comprises 7 areas:
1. DAS is the field equipment on the pipe referred to above
2. Comms node is the means by which the pre-processed data is passed on to the main computing system. This may use spare fibres in the cable bundle.
3. Data Aggregator is the first level of processing at the main servers- formulating data for bulk storage
4. Storage is a large volume data store that provides long term access to data for aggregation and historic purposes
5. Data Analysis is where the main processing is carried out
6. Visualisation is the software module that provides screen views of insights needed by different users
7. Identity management portal identifies the user and the views that they need access to
This is under development with our subcontractors Dash-board.
Neural networks can be used and have advantages over the conventional type of statistical processing with such methods as linear regression. These can also be fed into a neural network system which once trained offers a more robust approach.
Visualisation dashboards can be configured to specific pipeline and operator needs so that the optimum insights are presented for the role of the viewer. This can also be integrated with other sources such as existing SCADA sys-tems. Individual pipelines can be portrayed, and sections colour coded with the risk level to aid appropriate planned responses.
Figure 7: Waterfall output from channels along the test pipe Figure 8: Temperature sensitivity of optical fibre system
Figure 9: System overview for data processing
Figure 10: Indicative front end visualisation
RESEARCH / DEVELOPMENT / TECHNOLOGYPIPELINE TECHNOLOGY JOURNAL 25

LEAK PREVENTION STRATEGY
Our strategy for leak prevention is to first identify every potential failure mode of a pipeline and then develop the healthy pipe profile that would enable the early stages of any of these events to be monitored automatically before they reach the level at which failure would occur.
This is a well established process for deep water produc-tion platforms in the N Sea and elsewhere and proven successful there in eliminating structural failure events that did occur prior to its introduction.
There will be some events, such as low amplitude pressure cycling which would be below the threshold for any effect. Then there is a mid-level where the cumulative effect can over a period of time limit the residual life of the pipeline. At the high level of severity there are events which clearly shorten the life of the pipeline very substantially or may even be the immediate cause of a failure event.
The real time monitoring parameters available from this system are:
• Pressure• Temperature• Stress /strain • External vibrations (eg interferance)• Leak detection (internal and external)• Location identification of issues to 6 inches
These monitoring parameters give rise to the following leak prevention benefits for pipeline operators:
• Continuous prediction/updating based on algorithms of healthy pipe
• Proactive inspection and maintenance as required rather than time based as is done currently
• Analysis done by exception• Fatigue life prediction in real time based on the above
inputs
CONCLUSIONS
A new pipeline system has been developed and tested that incorporates spiral wound optical fibre as an intrinsic part of the pipe wall structure.
This is a holistic system for new pipeline installation that offers a number of advantages to pipeline operators:
1. Real time digital integrity monitoring with instant alert system against identified threats which can also reduce inspection costs.
2. Reduce risk of leakage with genuinely preventative and proactive approach and the ability to pinpoint the location of the issue within 0.2m?
3. Ability for Pipeline Engineers and Operational Manag-ers to understand pipeline life expectancy at any given moment in time.
4. Ease of using surplus fibres in the bundle for general purpose communications either at the outset or in the future
5. Precision pinpointing of any issues that do occur6. Reduced risk of HSE incidents due to decrease in man-
power requirements7. Automated construction process with 100% traceabili-
ty and automated QC data collection8. Potential to halve the cost of pipeline construction9. Improved logistics for larger diameter pipelines above
8inch diameter10. A more flexible pipe structure better able to follow
terrain without bend stations11. Reduced carbon footprint and reduced overall environ-
mental impact
Figure 11: Individual pipeline integrity map
Pipeline Technology Conference 2010
15th Pipeline Technology Conference Europe‘s leading pipeline conference and exhibition
SAVE THE DATE
30 March - 2 April 2020 Berlin, Germany
RESEARCH / DEVELOPMENT / TECHNOLOGY26 PIPELINE TECHNOLOGY JOURNAL

ACKNOWLEDGEMENTS
SPS would like to acknowledge the contribution of Opta-sense Ltd in supplying the trial data analysis equipment, Dashboard for developing data management and front end visualisation protocols and DNVGL at Spadeadam in setting up and conducting the pipe tests. SPS would also like to acknowledge funding from Research and Innovation UK .
Authors
Dr. Andrew Stevenson
Sustainable Pipeline Systems Ltd
Executive Chairman
andrew.stevenson@sustainable-
pipelines.com
Doug Everard
Sustainable Pipeline Systems Ltd
Chief Operating Officer
doug.everard@sustainable-
pipelines.com
Mebs Bobat
Sustainable Pipeline Systems Ltd
Engineering Manager
mebs.bobat@sustainable-
pipelines.com
“This is the first truly holistic product seen in the onshore pipeline industry and a groundbreaking approach that offers to transform it.
Dr. Andrew Stevenson
Pipeline Technology Journal
Register for free & join 30,000 verified recipients!
Stay up-to-date with the
ptj - newsletter
RESEARCH / DEVELOPMENT / TECHNOLOGYPIPELINE TECHNOLOGY JOURNAL 27

The pipeline world as guest in Berlin:Pipeline operators from all over the world take part in Europe’s leading industry event: the 15th Pipeline Technology Conference and Exhibition (ptc) in Berlin.
The leading European event for the pipeline industry is now taking place for the 15th time, this time from 30 March to 2 April 2020 in Berlin’s Estrel Congress Center. The ptc provides the international pipeline industry with a plat-form to discuss technical challenges and solutions and to discuss the future of the entire industry. Europe’s most important pipeline event is growing from year to year: “For 2020, too, we as organisers expect growth of between 15 and 20% compared to the previous year,” says Dr. Klaus Ritter, President of the EITEP Institute.
For them, there is a series of high-ranking plenary sessions and panel discussions, all of which deal with topics of in-terest to operators worldwide. This includes classic topics such as “Safety” as well as current challenges in the areas of “Qualification & Recruitment”, “Difficult to Inspect Pipe-lines”, “Illegal Tapping” and “Climate Adaption”. Important future topics such as hydrogen transport and Power-to-X are also included in the programme.
Another unique selling point of the ptc is its internationali-ty: “About two thirds of the participants come from abroad. Last year, we saw the greatest growth from Latin Ameri-ca and Eastern Europe, a large proportion of which were
EXHIBITORS90+PARTICIPANTS 900+ DIFFERENT NATIONS50+
CONFERENCES / SEMINARS / EXHIBITIONS28 PIPELINE TECHNOLOGY JOURNAL

Pipeline Operators80+
pipeline operators,” says Dennis Fandrich, Chairman of the Pipeline Technology Conference. This makes ptc the most international event of its kind in the world.
The conference will be accompanied by a trade exhibition at which leading technology and service providers and pipeline operators will be able to present their innovative pipe solutions. The suppliers will be present throughout the entire lifecycle of the pipeline. With more than 90 ex-hibitors, a new record is also expected in this area in 2020. The conference and the trade exhibition will be comple-mented by thematically oriented one-day seminars, work-shops and operator discussion rounds in which partici-pants will be able to delve deeper into various topics.
As every year, the conference papers will be made avail-able to the specialist public via the freely accessible “Pipe-line Open Knowledge Base”:
https://www.pipeline-conference.com/abstracts.
CONFERENCES / SEMINARS / EXHIBITIONSPIPELINE TECHNOLOGY JOURNAL 29

The European governments are currently pushing their companies and institutions to increase their involvement in Africa. From the Governments point of view, Africa offers many business opportunities.
ITIDA is a major initiative that supports this development by enabling the systematic transfer of technology and know-how between Europe / the industrialized countries and Africa. It provides a framework that enables compa-nies to apply their expertise, which is already renowned in most parts of the world, in Africa as well.
At the same time, it offers African authorities, state-owned enterprises and private companies access to important know-how and technologies from all over the world. In this way, the initiative should contribute to the improvement of the economic circumstances and thus to the overall situation.
The International Transfer Centre for Infrastructure Devel-opment in Africa (ITIDA) is operated by several institutions with a similar interest: to improve the infrastructure in Af-rica with the expertise of European companies. Originally, the initiative was created by two cooperating institutions:
EUROPEAN/AFRICAN INTERNATIONAL TRANSFER CENTRE FOR INFRASTRUCTURE DEVELOPMENT IN AFRICA (ITIDA) FOUNDED
THE CENTER AIMS TO TRANSFER TECHNOLOGY AND KNOW-HOW FROM EUROPEAN INSTITUTIONS TO AFRICA
CONFERENCES / SEMINARS / EXHIBITIONS30 PIPELINE TECHNOLOGY JOURNAL

The Euro Institute for Information and Technology Transfer in Environmental Protection, EITEP Institute is Europe’s largest networker in terms of oil, gas and water pipelines. TEAM Academy (Training and Education in Africa and Mid-dle East) is a group of German companies dealing with the construction, operation, maintenance and repair of water supply and sanitation infrastructure. Together they have already won another important partner for the initiative: Hamburg Port Consulting (HPC), which brings enormous expertise regarding worldwide port, logistics and transpor-tation routes.
Together, these three institutions are currently preparing their first major project in Africa. It is an international con-ference& exhibition named Infrastructure Development in Africa (IDA). The event will take place in November 2020 in Tunis, Tunisia. It marks one of the highlights ITIDA has planned for 2020. Fixed topics during the event:
• Supply / Disposal Solutions for Water, Waste Water & Gas
• Production / Treatment Solutions for Water & Waste Water
• Transport and Logistic Solutions for Ports • Pipeline Solutions for Oil, Gas, Petrochemicals and
other Products
Furthermore, the organizers are eager to increase the
scope of the first IDA. Partners are welcome for following areas: power supply regional and international; urban traf-fic development, cross-region road, rail and air transport; telecommunications.
ITIDA’s administration and seminar building in Tunis
The three institutions of ITIDA: The EITEP Institute, TEAM Academy & Hamburg Port Consulting (HPC)
CONFERENCES / SEMINARS / EXHIBITIONSPIPELINE TECHNOLOGY JOURNAL 31

One of the topics of IDA: supply, disposal and treatment solutions for water and waste water (including training measures)
Logistics and transport services of ports are further focus of IDA
CONFERENCES / SEMINARS / EXHIBITIONS32 PIPELINE TECHNOLOGY JOURNAL

Although the Infrastructure Development in Africa (IDA) is without doubt an integral part of the ITIDA agenda, it is by far not the only attractive activity. The following additional steps are currently in planning, showing the full scope of this ambitious and promising project:
• Advisory services for cities and federal states, drawing on the expertise of German institutions
• Creation of international electronic journals and news-letters covering all aforementioned topics
• Establishing a job and trainee platform for access to the European and African job markets
• Train-the-Trainer-Activities • Establishment of drinking- and waste water treatment
plant neighborhoods• Etc.
All ITIDA players have many years of experience in inter-national economic cooperation. Success in this work also requires cooperation with other initiatives.
“We seek coordination with the goals set by African institutions and initiatives Dr. Klaus Ritter, President of EITEP
One of the topics is oil, gas and water pipelines
Contact
Rana Alnasir-Boulos
EITEP Institute
+49 511 90992 19
CONFERENCES / SEMINARS / EXHIBITIONSPIPELINE TECHNOLOGY JOURNAL 33
.
Association
IAOT - International Association of Oil Transporters
Czech Republicwww.iaot.eu/
DVGW - German Technical and Scientific Association for Gas and Water
Germanywww.dvgw.de
Automation
SiemensGermanywww.siemens.com
YokogawaJapanwww.yokogawa.com
Certification
Bureau VeritasGermanywww.bureauveritas.de
DNV GLNorwaywww.dnvgl.com
TÜV SÜD Indutrie ServiceGermanywww.tuev-sued.de/is
Cleaning
Reinhart HydrocleaningSwitzerlandwww.rhc-sa.ch/rhc/
Coating 1/2
DensoGermanywww.denso.de
Kebulin-gesellschaft KettlerGermanywww.kebu.de
POLINOM Russiawww.rikol.ru
Coating 2/2
Polyguard Products United Stateswww.polyguard.com
Premier CoatingsUnited Kingdomwww.premiercoatings.com/
RPR TechnologiesNorwaywww.rprtech.com/
ShawcorUnited Stateswww.shawcor.com
Sulzer Mixpac Switzerlandwww.sulzer.com
TDC InternationalSwitzerlandwww.tdc-int.com
TIAL Russiawww.tial.ru
TIB ChemicalsGermanywww.tib-chemicals.com
Construction 1/2
BIL - Federal German Construction Enquiry
Portal
Germanywww.bil-leitungsauskunft.de
Herrenknecht Germanywww.herrenknecht.com
IPLOCA - International Pipe Line & Offshore Contractors Association
Switzerlandwww.iploca.com
LiderrollBrasilwww.liderroll.com.br
LogICFrancewww.logic-sas.com
COMPANY DIRECTORY34 PIPELINE TECHNOLOGY JOURNAL
Construction 2/2
MAX STREICHERGermanywww.streicher.de/en
Petro IT Irelandwww.petroit.com
VACUWORXNetherlandswww.vacuworx.com
Vintri Technologies Canadawww.vintritech.com
VlentecNetherlandswww.vlentec.com
Construction Machinery
MaatsNetherlandswww.maats.com
Worldwide GroupGermanywww.worldwidemachinery.com
VIETZGermanywww.vietz.de
Engineering
ILF Consulting Engineers Germanywww.ilf.com
KÖTTER Consulting EngineersGermanywww.koetter-consulting.com
Inline Inspection 1/2
3P ServicesGermanywww.3p-services.com
Inline Inspection 2/2
A.Hak Industrial ServicesNetherlandswww.a-hak-is.com
Baker HughesUnited Stateswww.bakerhughes.com
Intero Integrity ServicesNetherlandswww.intero-integrity.com/
Kontrolltechnik Germanywww.kontrolltechnik.com
KTN AS Norwaywww.ktn.no
LIN SCAN United Arab Emirateswww.linscaninspection.com
NDT Global Germany www.ndt-global.com
Pipesurvey InternationalNetherlandswww.pipesurveyinternational.com
PPSA - Pigging Products and Services AssociationUnited Kingdomwww.ppsa-online.com
RomstarMalaysia www.romstargroup.com
RosenSwitzerlandwww.rosen-group.com
Inspection 1/2
Ametek – Division Creaform Germany
www.creaform3d.com
Applus RTD Germanywww.applusrtd.com
COMPANY DIRECTORYPIPELINE TECHNOLOGY JOURNAL 35
Inspection 2/2
EMPITGermanywww.empit.com
Integrity Management
Metegrity Canadawww.metegrity.com
Pipeline Innovations United Kingdomwww.pipeline-innovations.com
Leak Detection 1/2
Asel-TechBrazilwww.asel-tech.com
Atmos InternationalUnited Kingdomwww.atmosi.com
Direct-CCanadawww.direct-c.ca
EntegraUnited Stateswww.entegrasolutions.com
Fotech Solutions United Kingdomwww.fotech.com
GOTTSBERG Leak DetectionGermanywww.leak-detection.de
Liwacom Germanywww.liwacom.de
MSA Germanywww.MSAsafety.com/detection
Leak Detection 2/2
OptaSenseUnited Kingdomwww.optasense.com
Pergam Suisse Switzerlandwww.pergam-suisse.ch
PSI SoftwareGermanywww.psioilandgas.com
sebaKMT Germanywww.sebakmt.com
SolAres (Solgeo / Aresys) Italywww.solaresweb.com
VEGASE Francewww.vegase.fr
Monitoring
Airborne Technologies Austriawww.airbornetechnologies.at
Krohne Messtechnik Germanywww.krohne.com
PHOENIX CONTACT Germanywww.phoenixcontact.de/prozess
SolSpec United Stateswww.solspec.solutions
Operators 1/2
TransneftRussiawww.en.transneft.ru/
COMPANY DIRECTORY36 PIPELINE TECHNOLOGY JOURNAL
Operators 2/2
TRAPILFrancewww.trapil.com/en/
Qualification & Recruitment
YPPE - Young Pipeline Professionals Europe International
Pump and Compressor Stations
TNO The Netherlandswww.pulsim.tno.nl
Repair
CITADEL TECHNOLOGIESUnited Stateswww.cittech.com
Clock Spring NRIUnited Stateswww.clockspring.com
RAM-100 United Stateswww.ram100intl.com
T.D. WilliamsonUnited Stateswww.tdwilliamson.com
Research & Development
Pipeline Transport Institute (PTI LLC)Russiawww.en.niitn.transneft.ru
Safety 1/2
DEHN & SÖHNEGermanywww.dehn-international.com/en
Safety 2/2
HIMAGermanywww.hima.de
Signage
Franken PlastikGermanywww.frankenplastik.de/en
Surface Preparation
MONTI - Werkzeuge GmbH Germanywww.monti.de
Trenchless Technologies
BohrtecGermanywww.bohrtec.com
GSTT - German Society for Trenchless Technology
Germanywww.gstt.de
Rädlinger Primus Line Germanywww.primusline.com
Valves & Fittings
AUMAGermanywww.auma.com
Zwick ArmaturenGermanywww.zwick-armaturen.de
Further boost your brand awareness and list your company within the ptj -
Company Directory
www.pipeline-journal.net/advertise
COMPANY DIRECTORYPIPELINE TECHNOLOGY JOURNAL 37

In the next Edition of ptj:
The next issue of Pipeline Technology Journal (ptj) will address Pipeline Comprehensive Topics This is a great opportunity for skilled authors to submit insightful papers and to contribute to the global pipeline industry’s constant professional exchange.
Comprehensive Topics
December 2019
Find Us! Young Pipeline
Professionals Europe
yppeurope.org
Host a webinar / site visit Promote membership Provide support / mentoring Sponsor a YPPE event Don’t just be in
the industry, be a part of it
IF YOU ARE READING THIS WE NEED YOU

Pipeline Technology Journal
Next Issue: December 2019
www.pipeline-journal.net
Comprehensive Topics
In the next Edition of ptj:
www.pipeline-conference.com
15TH PIPELINE TECHNOLOGY CONFERENCE Europe’s Leading Pipeline Conference and Exhibition
30 MARCH - 2 APRIL 2020, ESTREL CONVENTION CENTER, BERLIN, GERMANY
15th Pipeline Technology Conference 30 March - 2 April 2020 Berlin, Germany
Global Petroleum Show 9 - 11 June 2020 Calgary, Canada
Event Calendar
UESI Pipelines 2020 Conference 9 - 12 August 2020 San Antonio, USA
IPC - International Pipeline Conference 28 September - 2 October 2020 Calgary, Canada

Pipeline Technology Journal
You have interesting content to share with the global pipeline community?
Submit an Article!
Use ptj as a platform to report about your news, projects, innovations and technologies. If you are interested in submitting insightful technical articles to be considered for the ptj, please send us an abstract for review.
11%CEO
20%Director
26%Manager
43%Executive
ptj-brand-audiences
A manifold databaseWe deliver content to local practicioners and global de-cision-makers alike, making the ptj-brand a suitable tool for global knowledge distribu-tion as well as developing and upholding overall visibility in the global pipeline industry.
Audience Job Levels
23%Operators
61%Techn. / Service
Providers
11%Researchers
4%Authorities
Company types
North America 37,8%
South America 4.5%
Europe 33.4%
Africa 2.5%
Mena Region 6.8%
Asia 12.6%
Oceania 2.5%
China special e-mail list of 20.000 recipients
You want to enhance or maintain your international visibility as a company?
Book an Advertisement !
The ptj-brand offers a multitude of advertisement
opportunities to increase visibility and reputation to-
ward pipeline professionals worldwide. Make use of the
extensive ptj-portfolio and reach over 30,000 Experts.