public and patient perceptions & insights series april 2014
TRANSCRIPT

Public and Patient Perceptions & Insights Series
April 2014

Results Review: Rationale
Increasing enterprise-wide interest in engaging study volunteers as partners in clinical research
Inside knowledge, Trust; Ownership/Support; Collaboration
For 5-7 years, no active and regular assessment of public and patient perceptions and experiences
HarrisInteractive (2005); CenterWatch (2005)
CISCRP’s Objectives: Resume and establish routine assessment Identify trends and new insights that inform and educate
the enterprise on improving public and patient attitudes and experience

Methods
• Survey instrument based in part on past surveys; establish new areas of inquiry
• Input and support from pharmaceutical and biotechnology companies and sites.
• Conducted online January through March 2013
• Collaborated with Acurian – a global provider of patient recruitment and retention services: proprietary database represents people who have explicitly opted-in – via online and offline consumer health surveys -- to receive healthcare information on specific diseases and clinical trial notifications.
Final sample size: N=5,701 (Global)
Primary comparisons: CISCRP 2013: N=5,701 (Global) 2007: N= 4,496 (Global) 2005: N= 998 (US)
Harris Interactive 2005: N=2,935 (Global) 2003: N=2,031 ( (US)
CenterWatch 2005: N=1,170 (US)
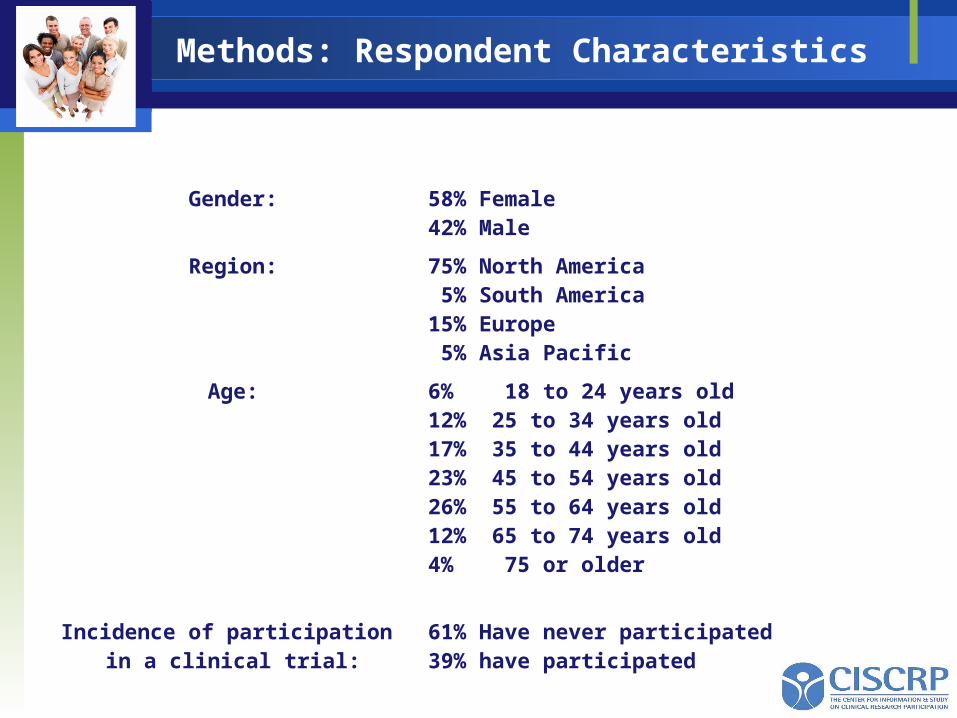
Methods: Respondent Characteristics
Final sample composition: (n=5,701)
Gender: 58% Female42% Male
Region: 75% North America 5% South America15% Europe 5% Asia Pacific
Age: 6% 18 to 24 years old12% 25 to 34 years old17% 35 to 44 years old23% 45 to 54 years old26% 55 to 64 years old12% 65 to 74 years old4% 75 or older
Incidence of participation in a clinical trial:
61% Have never participated39% have participated

Response Size by Respondent Experience
General Perceptions (N=5,701)
Have Not Seriously Considered Participating
(N=1,221)
Have Seriously Considered Participating
(N= 4,425)
Has Not Participated (N=2,647)
Has Participated
(N=1,724)
Dropped Out
(N=259)
Completed
(N=1,336)
Generally a 3-percentage point difference between values is significant at the p<.05 level

Key Insights
1. Generally consistent attitudes with past polls; some areas of notable and significant improvement in public attitudes and perceptions
2. Significant age-related and regional differences observed among public and participants
3. Losing high proportion of participants ineligible for one clinical trial who may qualify for another
4. Wide differences found between those who drop-out versus those who complete their clinical trials

General Attitudes
High willingness to participate; consistent with past survey results
High percentage believes that they have a good general understanding of clinical research
General understanding appears to be tenuous and superficial
Trust in the research enterprise, public perceptions of study volunteer motivation, and public attitudes about safety have all improved
Wide differences by region and age group

How willing are you (‘Very’/‘Somewhat’) to Participate in a Clinical Research Study?
Overall North America
Europe South America
Asia Pacific
18-34 Year Olds
87%93%
58%64%
73% 73%
Base: All Respondents
Public Perceptions

Public Perceptions
CISCRP 2005 CISCRP 2007 CISCRP 2013
86% 88% 87%
Percent ofRespondents
How willing are you (‘Very’/‘Somewhat’) to Participate in a Clinical Research Study?

Evolving Public Perceptions
(Percent who indicated ‘Strongly or Somewhat Agree ‘ that people who participate in clinical trials:
CISCRP 2013 (US)
Harris Interactive 2005 (US)
Percentage point
change
Get access to the best doctors 61% 46% +15
Get access to the best possible treatment 62% 48% +14
Are like experimental test subjects NOT people
34% 46% +12
Make a contribution to science 88% 86% +2
Have a chance to receive free medicines and care
76% 65% +11
Are gambling with their health 23% 49% +26
Learn more about their condition and health 84% 76% +8
Source: CISCRP, 2013 Perceptions & Insights Study; N=5,701 Respondents

Overall North America
Europe South America
AsiaPacific 18-34 year olds
2% 2%7% 9% 6% 5%
17% 15%
40%
22%21% 24%
Not at all informed Not very informed
How would you rate your general knowledge about clinical research?
Base: All Respondents
Public Perceptions

Top Perceived Benefits and Risks
BENEFITS OVERALL FEMALE MALE NA South America
EU Asia-Pacific
Advance science and treatment
33% 35% 30% 35% 25% 26% 23%
Help improve or save lives 29% 30% 28% 30% 20% 28% 21%
Help improve my condition 15% 14% 15% 16% 6% 11% 13%
RISKS OVERALL FEMALE MALE NA South America
EU Asia-Pacific
Possibility of side effects 57% 56% 58% 59% 45% 53% 42%
Possible risks to my overall health
20% 22% 17% 19% 24% 27% 21%
Possibility of receiving placebo
13% 14% 12% 14% 10% 7% 14%
Possible disclosure of my private medical information
5% 3% 6% 3% 13% 8% 13%

Top Information Sources
Primary care physician
Specialty care physician
Internet Email Media Mail Family
14%11%
25%
33%
44%
22%
9%
20% 20%
46%
32%
39%
22%
15%
Harris-Interactive 2004 CISCRP 2013

Preferred vs. Actual Information Sources
52%
41%
32%30%
22% 22%20% 20%
13%
20% 20%
46%
32%
39%
21%
8%11%
15%
Preferred Actual
Base: All Respondents
Preferred and actual sources for information about clinical research

Top Sources for Information about clinical research
NAPrefer
NAActual
SAPrefer
SAActual
EUPrefer
EUActual
ApacPrefer
ApacActual
Primary care physician 58% 22% 30% 23% 38% 11% 35% 21%
Specialty care physician 44% 20% 35% 30% 32% 14% 32% 24%
Internet 34% 50% 26% 35% 26% 32% 26% 35%
EMail 36% 40% 15% 13% 11% 6% 11% 11%
Media 23% 41% 21% 24% 19% 32% 19% 33%
Mail 26% 46% 12% 13% 11% 5% 11% 9%
Advocacy groups 24% 13% 12% 10% 12% 5% 13% 7%
Pharmacists 23% 7% 10% 8% 13% 7% 15% 12%
Family 11% 13% 33% 31% 14% 15% 26% 27%
REGION
Base: All Respondents
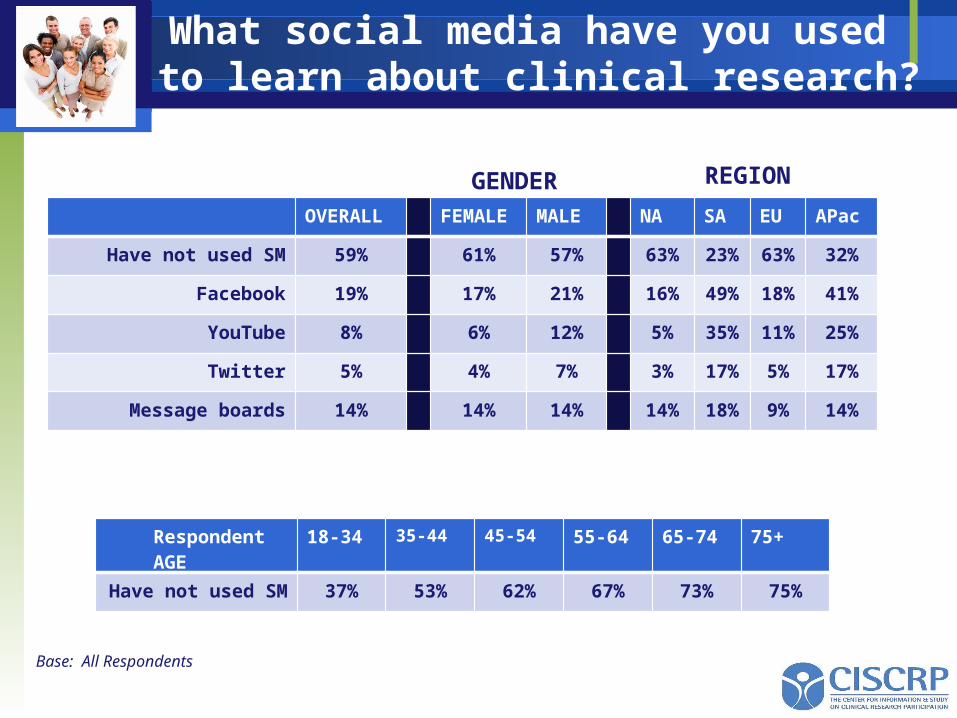
What social media have you used to learn about clinical research?
OVERALL FEMALE MALE NA SA EU APac
Have not used SM 59% 61% 57% 63% 23% 63% 32%
Facebook 19% 17% 21% 16% 49% 18% 41%
YouTube 8% 6% 12% 5% 35% 11% 25%
Twitter 5% 4% 7% 3% 17% 5% 17%
Message boards 14% 14% 14% 14% 18% 9% 14%
REGIONGENDER
Base: All Respondents
Respondent AGE 18-34 35-44 45-54 55-64 65-74 75+
Have not used SM 37% 53% 62% 67% 73% 75%

Who did you consult with before choosing to participate in a clinical research study?
OVERALL FEMALE MALE NA SA EU APac
My primary care physician 61% 63% 60% 66% 36% 51% 43%
My specialty care physician 39% 40% 39% 42% 34% 29% 34%
The Research center conducting the study
30% 34% 25% 34% 15% 20% 21%
My spouse/significant other 31% 31% 31% 33% 18% 25% 26%
My family 27% 28% 25% 24% 44% 31% 44%
My pharmacist 13% 13% 14% 14% 11% 10% 13%
REGIONGENDER
Base: All Respondents

Preferred Screening Method
Screening survey… OVERALL FEMALE MALE NA SA EU Apac
By mail 10% 10% 11% 9% 18% 14% 18%
By email 56% 57% 56% 57% 49% 55% 56%
By telephone 12% 11% 12% 13% 9% 7% 10%
By mobile device 2% 2% 2% 2% 3% 2% 3%
No Preference 20% 20% 19% 20% 21% 22% 12%
Base: All Respondents

Top Reasons for Not Participating
Percent mentioning OVERALL FEMALE MALE NA SA EU Apac
Concerns about risk 26% 29% 23% 26% 19% 29% 26%
Difficult to get to the research center
23% 25% 21% 28% 8% 10% 11%
Did not want to take chance with my health
20% 22% 17% 17% 19% 32% 23%
Too much time required 20% 19% 21% 22% 17% 15% 17%
No reasons in particular 18% 16% 20% 19% 20% 13% 14%
Could not afford time away from my job
18% 18% 17% 20% 14% 12% 13%
Do not want to get placebo
15% 16% 14% 15% 12% 12% 21%
Do not know enough about clinical research
14% 14% 15% 12% 15% 19% 22%
Base: Has Not Participated/Not Willing to Participate

Reasons why you did not qualify for the study?
OVERALL FEMALE MALE NA SA EU APac
Don’t Know 35% 36% 33% 35% 33% 37% 33%
REGION
Respondent AGE 18-34 35-44 45-54 55-64 65-74 75+
Don’t Know 41% 34% 38% 33% 26% 43%
GENDER
Base: Wanted to Participate But Did Not Qualify

Losing Ineligible Volunteers
Searched for Another Clinical Trial
Decided not to Participate Nothing
35%
23%
42%Percent of ineligible Volunteers
What did you do after finding out that you did not qualify for a clinical research study?
Base: Volunteers Who Wanted to Participate But Did Not Qualify (N=2,647);

Losing Ineligible Volunteers
OVERALL FEMALE MALE NA SA EU APac
Searched for another trial 35% 35% 35% 35% 43% 32% 31%
Decided not to participate 23% 23% 22% 21% 29% 33% 33%
Nothing 42% 42% 43% 44% 29% 35% 36%
REGIONGENDER
Base: Wanted to Participate But Did Not Qualify
Percent select
What did you do after finding out that you didn’t qualify for a clinical research study?

How important were the following factors in influencing your decision to participate?
OVERALL FEMALE MALE NA SA EU APac
Quality medical care 85% 90% 79% 90% 55% 61% 58%
Access to medical professionals
83% 88% 78% 88% 57% 63% 57%
Learn about my disease 79% 83% 74% 84% 47% 55% 59%
Receive information about the results after the study
has ended
71% 73% 69% 73% 68% 55% 59%
Receive regular updates about the research while I’m
enrolled
68% 70% 66% 71% 59% 52% 57%
Feel part of a community 61% 65% 57% 62% 63% 57% 53%
REGIONGENDER
Base: Have Participated
Percent rate ‘Somewhat/Very Important’

Participant Experiences
Who reviewed the informed consent form with you?
OVERALL NA SA EU Apac
The study coordinator 50% 52% 34% 39% 48%
Administrator 25% 25% 23% 20% 27%
Principal Investigator 21% 18% 39% 31% 48%
No One 12% 11% 18% 12% 10%
Base: Have Participated
How did you read the informed consent form? OVERALL NA SA EU Apac
Study staff read it to me 10% 9% 11% 15% 25%
I read it together with study staff 18% 19% 13% 13% 22%
I read it by myself 57% 61% 30% 46% 23%
I watched a video 4% 2% 10% 5% 5%
Percent of Respondents
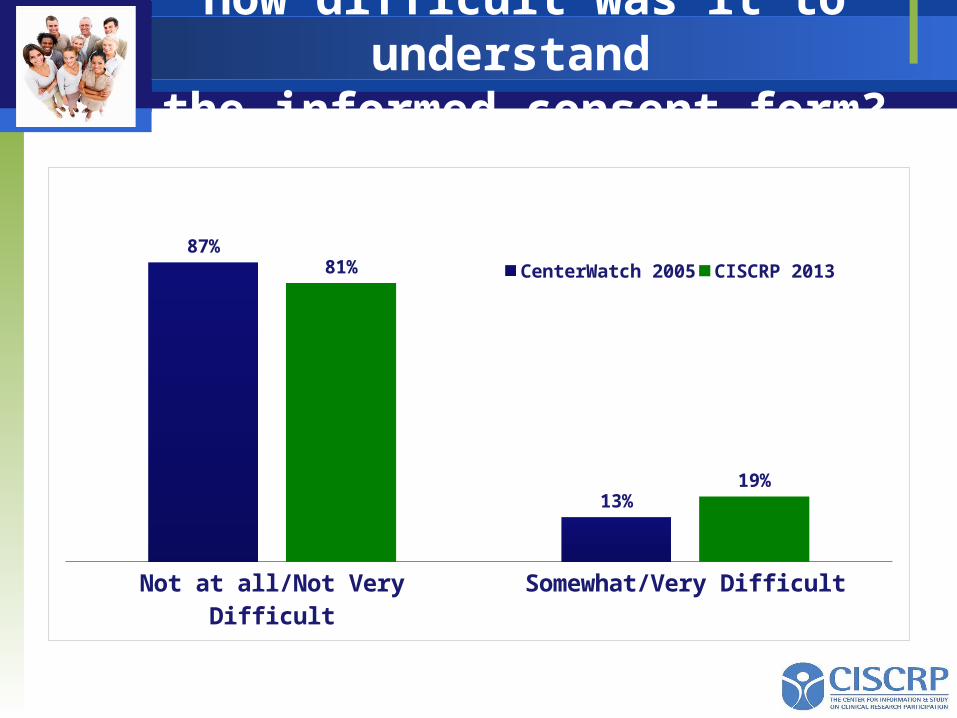
How difficult was it to understand the informed consent form?
(Comparisons with Past Surveys)
Not at all/Not Very Difficult Somewhat/Very Difficult
87%
13%
81%
19%
CenterWatch 2005 CISCRP 2013
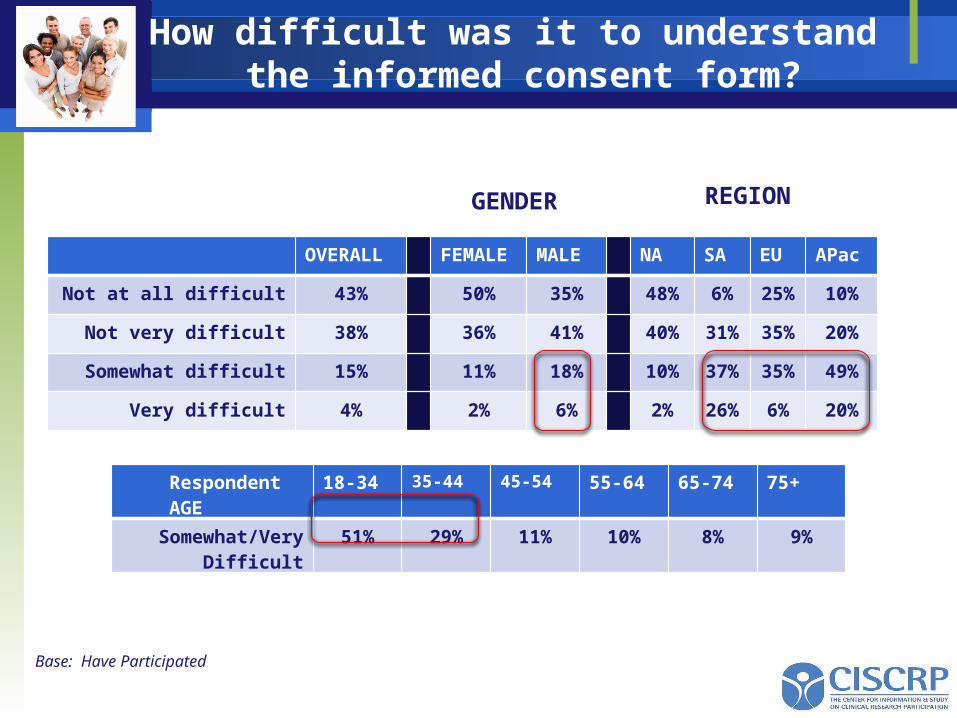
How difficult was it to understand the informed consent form?
OVERALL FEMALE MALE NA SA EU APac
Not at all difficult 43% 50% 35% 48% 6% 25% 10%
Not very difficult 38% 36% 41% 40% 31% 35% 20%
Somewhat difficult 15% 11% 18% 10% 37% 35% 49%
Very difficult 4% 2% 6% 2% 26% 6% 20%
REGIONGENDER
Base: Have Participated
Respondent AGE 18-34 35-44 45-54 55-64 65-74 75+
Somewhat/Very Difficult
51% 29% 11% 10% 8% 9%

After reading the informed consent form, I was ‘much more’/’somewhat more’ willing to participate
Overall North America Europe South America Asia Pacific
52% 50% 51%
59%
68%
Base: All Respondents
Participant Experience

OVERALL NA SA EU Apac
Not at all/Not very satisfied 15% 12% 34% 33% 29%
Somewhat/very satisfied 85% 88% 66% 67% 71%
OVERALL 18-34 35-44 45-54 55-64 65-74 75+
Not at all/Not very satisfied 15% 28% 18% 13% 11% 10% 11%
Somewhat/very satisfied 85% 72% 82% 87% 89% 90% 89%
AGE
Base: Have Participated
Participant Experiences
Satisfaction that all questions answered after informed consent form review

What most motivated you to continue participating in your clinical research study?
OVERALL FEMALE MALE NA SA EU APac
Compensation I expected to receive
35% 34% 36% 37% 18% 26% 25%
Keep my promise/commitment
34% 37% 30% 37% 25% 14% 16%
Information I learned about my condition
26% 26% 26% 27% 21% 19% 28%
Positive response to treatment
26% 29% 23% 27% 21% 23% 19%
Free procedures and care I was receiving
26% 26% 15% 27% 15% 14% 31%
My relationship with the study staff
20% 21% 19% 21% 15% 12% 24%
REGIONGENDER
Base: Completed Participation

Who most motivated you to stay in your study?
OVERALL FEMALE MALE NA SA EU APac
Myself 72% 75% 68% 76% 47% 48% 52%
Study coordinator 15% 14% 15% 15% 9% 13% 23%
Principal Investigator 9% 7% 11% 7% 17% 15% 27%
My spouse/family 7% 6% 9% 7% 8% 7% 14%
REGIONGENDER
Base: Completed Participation

Participant Experiences
OVERALL FEMALE MALE NA SA EU Apa
Did not meet them at all 18% 22% 14% 22% 5% 8% 5%
Fell short of meeting them 6% 7% 5% 8% 0% 0% 0%
Met them 45% 41% 48% 46% 25% 62% 40%
Exceeded them 21% 20% 22% 15% 55% 23% 40%
Greatly exceeded them 10% 9% 10% 9% 15% 8% 15%
Base: Did Not Complete Participation
How well did your study meet your expectations?

Overall North America
Europe South America
Asia Pacific
18-34 Year Olds
95% 97%
76%80%
93%
82%
Base: All Respondents
Participant Experiences
Would you consider participating in another clinical research study in the future?
(percent answer ‘yes’)

A Closer Look at Participants who Dropped Out
Overall Dropped Out Completed
Report ‘Somewhat/Very Informed’ about Clinical Research
81% 92% 95%
Percentage consider clinical trials ‘Not at all/Not very’ Safe
6% 7% 1%
Percentage have not used Social Media to find clinical research information
59% 46% 59%
Report that it was ‘Somewhat/Very Difficult’ to Understand the Informed Consent Form
19% 35% 16%
Say they are ‘Somewhat/Very Satisfied’ that their questions were answered during informed consent form review
85% 64% 89%
Consider site visits ‘Very/Somewhat’ stressful 20% 38% 16%
Say they were most motivated by ‘Themselves’ to stay in the study
72% 47% 78%

Next Steps
Disseminating and discussing study findings
Five Summary reports developed for Research professional community National Library of Education; HHS
Peer-review and trade publications ACRP Monitor (April 2014)

Ken Getz
Founder and Chairman, CISCRP
617-725-2750, [email protected]
Director, Sponsored Research Programs, Associate Professor
Tufts CSDD, Tufts School of Medicine
617-636-3487, [email protected]
Q&A and Thank You!