public attitudes ppt - international labour · pdf file · 2014-12-08public...
TRANSCRIPT

A FOUR COUNTRY STUDY
PREPARED BY THE ILO REGIONAL OFFICE FOR ASIA AND THE PACIFIC AND THE ILO
TRIANGLE PROJECT
Public Attitudes to Migrant Workers
Please do not quote or publish without prior permission from the ILO
1
Outline
� Background
� Methodology
� Survey Results
� KAP Barometer
Please do not quote or publish without prior permission from the ILO
2

Please do not quote or publish without prior permission from the ILO 3
Background and Rationale

Why do attitudes matter?
� Attitudes may translate into actions and behaviours that negatively impact on certain individuals and groups in society.
� Policy makers and politicians may be drawn to introduce policies in accordance with actual or perceived public preferences.
Please do not quote or publish without prior permission from the ILO
4
Source: Crawley, H. (2009) Understanding and changing public attitudes: A review of
existing evidence from public information and communication campaigns, Centre for
Migration Policy Research, Swansea University.

A global trend
Please do not quote or publish without prior permission from the ILO
5
� In Europe, polls on attitudes towards migrants show large differences between Member States, but the overall conclusion is that public perception of migration tends to be increasingly negative.
Beutin, R. et al (2006) Migration and public perception, Bureau of European Policy Advisers, European Commission.
� 39% of Asian Britons, 34% of white Britons and 21% of black Britons want all immigration into the UK to be stopped permanently, or at least until the economy improves.
Populus / Searchlight Educational Trust (2011)
� Almost two thirds (63%) of UK employers report that non-EU workers have allowed them to increase productivity. 43% say they are struggling to fill vacancies from within the UK or from EU countries.
CIPD / KPMG (2011)

TRIANGLE project
Please do not quote or publish without prior permission from the ILO
6
� ILO Tripartite Action to Protect Migrant Workers from Labour Exploitation (the TRIANGLE project) aims to strengthen the formulation and implementation of recruitment and labour protection policies and practices.
� In Thailand and Malaysia, the TRIANGLE project will cooperate with constituents and partners on a campaign to promote understanding with migrant workers. The campaign will highlight the contribution migrants make to the economy and society, counter misconceptions and promote the right to equal treatment.
� The findings of this survey will be used in the design of the campaign, and serve as a baseline against which to measure the impact of the survey.
Please do not quote or publish without prior permission from the ILO 7
Methodology

Survey design
Please do not quote or publish without prior permission from the ILO
8
� As this is a four-country study, special attention was given to survey design and methodology to ensure consistency in data collection. At the same time, there was a need to consider quality of information in relation to the cost of data collection.
� The sample size in each country was set to n=1000. This is deemed a large enough sample to be representative of any given population.
� In Thailand and Malaysia, face-to-face interviews were carried out across four provinces/states.
� In Korea and Singapore, data collection is significantly more expensive. As these countries have some of the world’s highest levels of internet penetration, it was decided that online data collection would be far more cost-effective.

Target groups and sample distribution
In each country, target respondents were the general population aged 18 years or older, with a 50/50 split between males and females.
The sample in Korea and Singapore is nationally representative. For Malaysia and Thailand, areas with high numbers of migrant workers were selected.
Ethnicity was taken into account in both Malaysia and Singapore in terms of Malay, Chinese and Indian/other.
9
Please do not quote or publish without prior permission from the ILO
Country Urban Rural* Total
Korea 890 110 1000
Singapore 1006 - 1006
Thailand
Bangkok 256 - 256
Surat Thani 101 152 253
Chiang Mai 76 177 253
Samut Sakorn 108 144 252
Malaysia
Kuala Lumpur 250 - 250
Selangor 220 30 250
Pahang 110 140 250
Perak 150 100 250
TOTAL 3167 843 4020
*Note: only semi-rural areas are included in Singapore and Korea

Sampling: face to face
Please do not quote or publish without prior permission from the ILO
10
� Sampling in Thailand and Malaysia was through multistage random sampling in both
urban and rural locations using the following procedure.
� First, a number of urban centers are randomly selected in the chosen provinces/states.
� Sub-districts are then selected inside those urban centers to represent the urban proportion of the
sample. Rural villages are also randomly selected outside the urban centers. The urban/rural split
is proportionate to the population in each province.
� In each selected sub-district, a random walk method is conducted to select dwellings.
� Within each dwelling the Kish Grid method is used to select a respondent 18 years or older.
Should the selected respondent not be home, up to three call backs are made before declaring a
non-response.
� The final samples were weighted to reflect the actual population distribution.

Sampling: Face to Face
To ensure the samples were representative based on province, sex and age, the final samples were weighted to bring them in line with the population of the selected provinces.
Quotas were also used to ensure representation across urban and rural areas within the selected provinces and in Malaysia, quotas were also used to obtain representation across ethnic groups.
11
Please do not quote or publish without prior permission from the ILO
Parameter Thailand sample
n=1014(%)
Thailand Weighted Samplen=1014(%)
Malaysia sample
n=1000(%)
Malaysia Weighted Samplen=1000(%)
SEX
Male 44 50 50 49
Female 56 50 50 51
Age
18 – 24 10 13 21 23
25 – 34 17 21 25 25
35 – 44 24 25 22 23
45 Or older 49 41 32 29
Ethnicity
Malay - - 60 61
Chinese - - 29 28
Indian and
others- - 11 11
Coverage
Four key provinces Four key provinces

Sampling: Online
The sampling methodology in Korea and Singapore was systematic random sampling from an online panel list with soft quotas on key population parameters (i.e. sex, age, geographic location, etc.).
To ensure the sample was nationally representative based on sex and age, the final samples were weighted to bring them in line with the national population.
12
Please do not quote or publish without prior permission from the ILO
Parameter Korea sample
n=1006(%)
Korea Weighted Samplen=1006(%)
Singaporesample
n=1000(%)
Singapore Weighted Samplen=1000(%)
SEX
Male 50 50 48 49
Female 50 50 52 51
Age
18 – 24 25 17 20 16
25 – 34 30 26 21 19
35 – 44 30 27 28 21
45 or older 15 30 31 44
Coverage
12 areas including 7 largestcities
All 5 Regions

Respondent Profile
On average, respondents in Korea and Singapore have a higher level of education and are more affluent as seen by their higher socioeconomic status (SES). Malaysia is in turn ahead of Thailand based on the same criteria.
13
Please do not quote or publish without prior permission from the ILO
ProfileThailand
n=1014
Malaysia
n=1000
Korea
n=1000
Singapore
n=1006
Employer* (%) (%) (%) (%)
Yes 26 15 31 33
Work status
Studying 6 7 16 11
Employed 73 63 67 72
Other 21 30 17 17
Work Sector
Agriculture 6 1 < 1 < 1
Manufacturing 3 8 12 8
Construction 3 4 5 4
Retail & wholesale 9 5 3 4
Services 11 20 19 21
Government 5 8 6 10
Self employed 20 17 5 5
Other 16 - 17 19
Education
Elementary school 38 10 1 1
Junior high school 18 45 3 23
Senior high school 24 24 34 10
Diploma or higher 20 21 62 66
Income (SES)
SES A 2 7 11 14
SES B 5 15 14 9
SES C 44 36 64 66
SES DE 49 42 11 11

Please do not quote or publish without prior permission from the ILO 14
Survey Findings
15
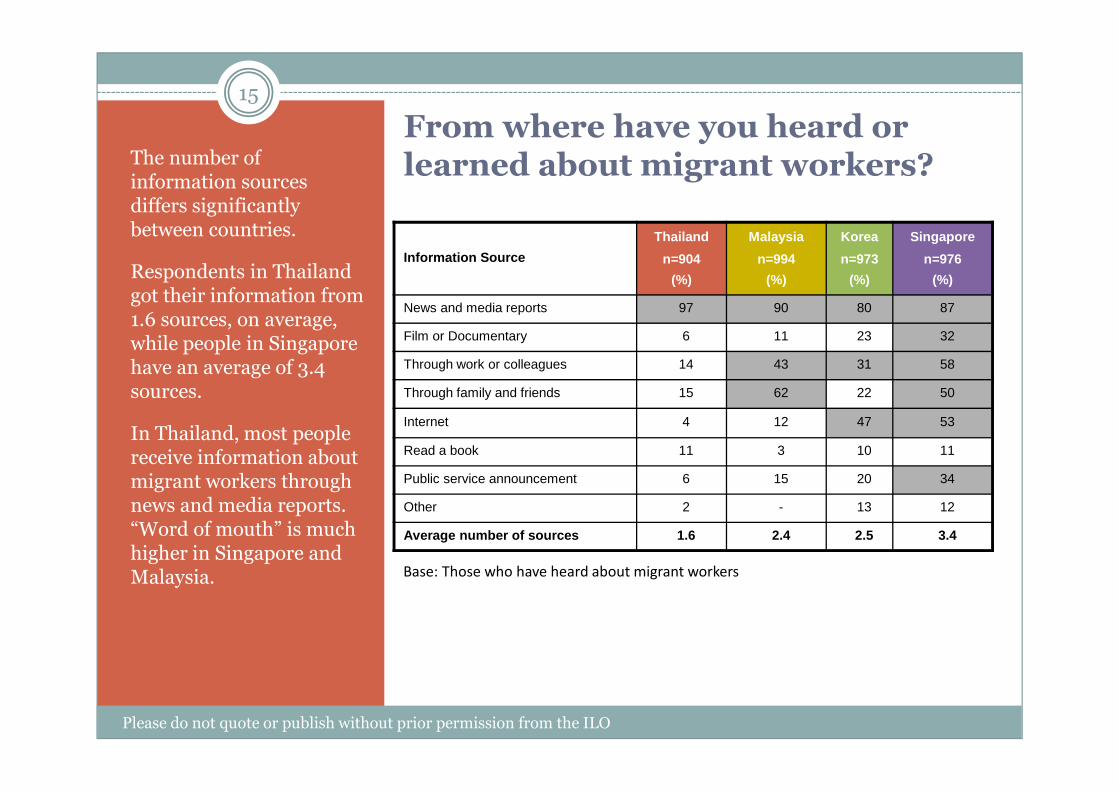
From where have you heard or learned about migrant workers?The number of
information sources differs significantly between countries.
Respondents in Thailand got their information from 1.6 sources, on average, while people in Singapore have an average of 3.4 sources.
In Thailand, most people receive information about migrant workers through news and media reports. “Word of mouth” is much higher in Singapore and Malaysia.
Please do not quote or publish without prior permission from the ILO
Information Source
Thailand
n=904
(%)
Malaysia
n=994
(%)
Korea
n=973
(%)
Singapore
n=976
(%)
News and media reports 97 90 80 87
Film or Documentary 6 11 23 32
Through work or colleagues 14 43 31 58
Through family and friends 15 62 22 50
Internet 4 12 47 53
Read a book 11 3 10 11
Public service announcement 6 15 20 34
Other 2 - 13 12
Average number of sources 1.6 2.4 2.5 3.4
Base: Those who have heard about migrant workers

Interaction with migrant workers
Please do not quote or publish without prior permission from the ILO
16
The respondents most likely to have encountered migrants were in Singapore and Malaysia –
where foreign workers make up approximately 30% and 20% of the total workforce respectively.
Thai respondents had the lowest level of interaction, with some four out of ten people having
had no encounters with migrant workers. Most encounters take place in the general community.
Where have you encountered migrant workers?
(Base: Those who have had encounters)
Have you had encounters with migrant workers
(Base: All respondents)
3250
28
59
26
44
58
34
0
20
40
60
80
100
Thailand Malaysia Korea Singapore
Pe
rce
nt
Regularly Sometimes
81 80
61
80
17
3223
29
15 15
33 35
0
20
40
60
80
100
Thailand Malaysia Korea Singapore
Pe
rce
nt
Community Work Other

Relationship with migrant workers
The vast majority of respondents in Singapore know foreign workers personally, and most are either personal friends or colleagues at work. In contrast, a much smaller proportion of respondents in Thailand know migrant workers personally.
Respondents in Singapore and Malaysia were far more likely to employ a migrant domestic worker than respondents in Thailand.
17
Please do not quote or publish without prior permission from the ILO
Type of relationship
Know migrant workers personally
17
58 6386
0
20
40
60
80
100
Thailand Malaysia Korea Singapore
Pe
rce
nt
1
136
23
3
2218
57
1321
28 29
0
20
40
60
80
100
Thailand Malaysia Korea Singapore
Pe
rce
nt
Supervised or Employed Friends or Colleagues
Aquaintances
Base: Those who
have encountered
migrant workers

Knowledge
Please do not quote or publish without prior permission from the ILO
18
0 20 40 60 80 100
National and migrant workers should betreated equally
MWs are needed to fill labor shortages
MWs make a net contribution to economy
MWs are often exploited
Migrant wages have impact on the wagesof national workers
High costs and complex procedurescontribute to unauthorized MWs
Tying work permits to one employer canlead to mistreatment of MWs
Thailand
Malaysia
Korea
Singapore
Proportion of respondents believing these statements to be “True”

Attitude analysis
Please do not quote or publish without prior permission from the ILO
19
� Statements to gauge attitudes were formulated in the third person, allowing respondents to answer more truthfully without attaching themselves to the issue.
� Since most people are reluctant to come across as xenophobic or prejudicial, statements were framed as negatives, and respondents had to strongly disagree in order to demonstrate a positive attitude.
� Attitudes were measured on a four point scale. Positive and negative attitudes were identified as shown below.
Don’t agree at all Don’t really agree
Agree to some extent
Agree completely
Positive Attitude Negative Attitude

Attitudes
Please do not quote or publish without prior permission from the ILO
20
0 20 40 60 80 100
Government policies to admit migrantsshould be more restrictive
Migrant workers cannot expect the samepay for the same job
Unauthorized migrants cannot expect tohave any rights at work
The authorities do enough to protectmigrants from being exploited
Migrants commit a high number of crimes
Migrants workers are a drain on thenational economy
Migrants are threatening the country’s culture and heritage
Reduce opportunities for skilled workersfrom ASEAN countries
Thailand
Malaysia
Korea
Singapore
Proportion of respondents that “Agree to some extent” or “Agree completely”

Behaviour
Please do not quote or publish without prior permission from the ILO
21
0 20 40 60 80 100
Would pay/Have paid the fees forregistration and work permit for a domestic
migrant worker
Would report and follow up on suspectedemployer abuse of migrant workers
Would report and follow up on the use ofmigrant children in dangerous work
Have educated friends about some positiveaspect about migrant workers
Have helped a migrant worker to integrateinto society or get ahead at work
Thailand
Malaysia
Korea
Singapore
Proportion of respondents that said “Yes, they have” or “Yes, they would”

22
Should the government do more to crack down on employers of unregistered migrants, rather than migrants?
The vast majority of respondents in all four countries agree that it is better to crack down on employers of unregistered migrant workers rather than the migrant workers themselves.
The sentiment in Thailand is particularly strong whereas in Malaysia and Korea, around one in five people disagree with the idea.
Please do not quote or publish without prior permission from the ILO
-6
-5
-9
-9
-5
-21
-18
-8
36
37
35
13
53
37
38
70
-30 -20 -10 0 10 20 30 40 50 60 70 80 90
Singapore
Korea
Malaysia
Thailand
Not sure Don't agree Agree Agree completely

Migrants’ ability to adapt to life in Thailand
Please do not quote or publish without prior permission from the ILO
23

Migrants’ ability to adapt to life in Malaysia
Please do not quote or publish without prior permission from the ILO
24

Migrants’ ability to adapt to life in Singapore
Please do not quote or publish without prior permission from the ILO
25

Migrants’ ability to adapt to life in Korea
Please do not quote or publish without prior permission from the ILO
26
Please do not quote or publish without prior permission from the ILO 27
KAP Barometer

KAP Barometer Framework
The KAP Barometer is an indicator into which knowledge, attitudinal and behavioral measures have been incorporated to form a one-number score.
The KAP Barometer divides the general population into three groups based on their level of support towards migrants (knowledge and non-discriminatory attitudes).
This Framework was developed by Rapid Asia.
28
Please do not quote or publish without prior permission from the ILO
KAP BAROMETER
YesNo KNOWLEDGE
PositiveNegative ATTITUDE
PositiveNegative PRACTICE
High SupportLow Support Moderate Support

KAP segmentation
Please do not quote or publish without prior permission from the ILO
29
� The KAP Barometer score is a tool for comparing the level of supportfor migrant workers across different segments of the population:
� In Singapore and Malaysia, the more highly educated people are, themore supportive they are of migrant workers.
� In Korea, the older people are the more supportive they are ofmigrant workers.
� In both Thailand and Malaysia there is a very distinct difference insupport between regions whereas in Singapore and Korea thesupport across regions is quite homogeneous.
� Across all four countries, those who know migrant workerspersonally, either through work or socially, show significantly higherlevels of support.

KAP score by country
Please do not quote or publish without prior permission from the ILO
30
2 2 9 919 16
36 31
79 82
55 60
0%
20%
40%
60%
80%
100%
KAP Distribution
High support Moderate support
Low support
24 19
5039
Proportion of respondents demonstrating ‘support’ for
migrant workers

KAP score by education
Please do not quote or publish without prior permission from the ILO
31
2131
1932
0
20
40
60
80
100
0
20
40
60
80
100
Elementary Junior Senior University
KAP Barometer
Percent
Proportion KAP Barometer
Thailand Malaysia
12 12
30 25
0
20
40
60
80
100
0
20
40
60
80
100
Elementary Junior Senior University
KAP Barometer
Percent
51 48 53 49
0
20
40
60
80
100
0
20
40
60
80
100
Elementary Junior Senior University
KAP Barometer
Percent
2533
3742
0
20
40
60
80
100
0
20
40
60
80
100
Primary Secondary Junior University
KAP Barometer
Percent
Korea Singapore

KAP score by age
Please do not quote or publish without prior permission from the ILO
32
Thailand Malaysia
45 4551
57 58
0
20
40
60
80
100
0
20
40
60
80
100
18-24 25-34 35-44 45-54 55 +
KAP Barometer
Pe
rce
nt
Korea Singapore
26 25 2230
20
0
20
40
60
80
100
0
20
40
60
80
100
18-24 25-34 35-44 45-54 55 +
KAP Barometer
Pe
rce
nt
18 17 18 21 24
0
20
40
60
80
100
0
20
40
60
80
100
18-24 25-34 35-44 45-54 55 +
KAP Barometer
Pe
rce
nt
36 37 42 3946
0
20
40
60
80
100
0
20
40
60
80
100
18-24 25-34 35-44 45-54 55 +
KAP Barometer
Pe
rce
nt
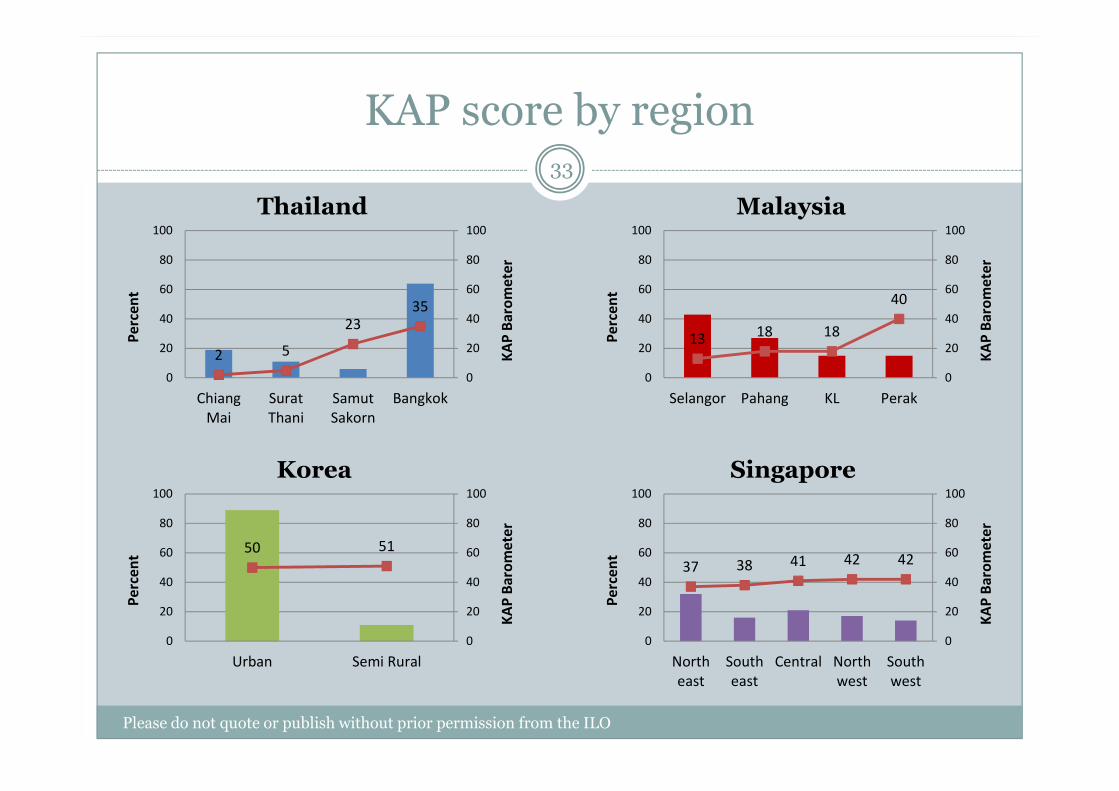
KAP score by region
Please do not quote or publish without prior permission from the ILO
33
2 5
23
35
0
20
40
60
80
100
0
20
40
60
80
100
Chiang
Mai
Surat
Thani
Samut
Sakorn
Bangkok
KA
P B
aro
me
ter
Pe
rce
nt
Thailand Malaysia
1318 18
40
0
20
40
60
80
100
0
20
40
60
80
100
Selangor Pahang KL Perak
KA
P B
aro
me
ter
Pe
rce
nt
50 51
0
20
40
60
80
100
0
20
40
60
80
100
Urban Semi Rural
KA
P B
aro
me
ter
Pe
rce
nt
37 38 41 42 42
0
20
40
60
80
100
0
20
40
60
80
100
North
east
South
east
Central North
west
South
west
KA
P B
aro
me
ter
Pe
rce
nt
Korea Singapore

KAP score by interaction with migrants
Please do not quote or publish without prior permission from the ILO
34
Thailand Malaysia
63 6153
46
0
20
40
60
80
100
0
20
40
60
80
100
KAP Barometer
Pe
rce
nt
Korea Singapore
39 3324
0
20
40
60
80
100
0
20
40
60
80
100
KAP Barometer
Pe
rce
nt
4032
198
0
20
40
60
80
100
0
20
40
60
80
100
KAP Barometer
Pe
rce
nt
5145
3730
0
20
40
60
80
100
0
20
40
60
80
100
KAP Barometer
Pe
rce
nt

KAP score by ‘employment decision-makers’
Please do not quote or publish without prior permission from the ILO
35
Thailand Malaysia
6050
0
20
40
60
80
100
0
20
40
60
80
100
Yes No
KAP Barometer
Pe
rce
nt
Korea Singapore
41
18
0
20
40
60
80
100
0
20
40
60
80
100
Yes No
KAP Barometer
Pe
rce
nt
36
17
0
20
40
60
80
100
0
20
40
60
80
100
Yes No
KAP Barometer
Pe
rce
nt
4837
0
20
40
60
80
100
0
20
40
60
80
100
Yes No
KAP Barometer
Pe
rce
nt
Base: Those employed and working

KAP score by employer of migrant domestic worker
Please do not quote or publish without prior permission from the ILO
36
Thailand Malaysia
53 50
0
20
40
60
80
100
0
20
40
60
80
100
Yes No
KAP Barometer
Pe
rce
nt
Korea Singapore
49
24
0
20
40
60
80
100
0
20
40
60
80
100
Yes No
KAP Barometer
Pe
rce
nt 42
17
0
20
40
60
80
100
0
20
40
60
80
100
Yes No
KAP Barometer
Pe
rce
nt
4538
0
20
40
60
80
100
0
20
40
60
80
100
Yes No
KAP Barometer
Pe
rce
nt

Please do not quote or publish without prior permission from the ILO 37
Contact information
For information about this study, please contact:
Max Tunon
ILO Regional Office for Asia and the Pacific
T: +66 (0)2 288 2245