public attitudes to science 2011 - gov.uk
TRANSCRIPT


Contents
Foreword ............................................................................................... 1
Summary ............................................................................................... 2
1. Introduction .................................................................................... 8
1.1. Background and Context ......................................................................... 8
1.2. Research Objectives .............................................................................. 10
1.3. Quantitative Methodology ...................................................................... 11
1.4. Qualitative Methodology ........................................................................ 12
1.5. Interpretation of Data ............................................................................. 13
1.6. Acknowledgements ................................................................................ 14
2. How People See Science ............................................................. 15
2.1. How the Public Defines the Sciences .................................................... 15
2.2. How the Public Sees Scientists .............................................................. 19
2.3. Awareness of the Knowledge Production Process ................................. 21
2.4. Hopes and Concerns about Science ...................................................... 24
2.5. Perceived Risks and Benefits of Scientific Developments ..................... 25
3. Finding Out about Science .......................................................... 27
3.1. Interest in Science ................................................................................. 27
3.2. How the Public Accesses Information .................................................... 28
3.3. Feeling Informed .................................................................................... 30
4. Trust in Science ........................................................................... 36
4.1. Trust in Information ................................................................................ 36
4.2. Trust in Scientists ................................................................................... 41
5. Regulating Science ...................................................................... 45
5.1. Awareness of Regulation ....................................................................... 45
5.2. Priorities for Regulation .......................................................................... 47
5.3. Confidence in Regulation ....................................................................... 47
6. Public Consultation and Involvement in Science ...................... 49
6.1. Awareness and Understanding of Public Consultation .......................... 49

6.2. Perceived Benefits of Public Involvement .............................................. 50
6.3. Perceived Barriers to Public Involvement .............................................. 51
6.4. Do People Want to Be Involved? ........................................................... 52
7. Science in People’s Lives ........................................................... 57
7.1. Science in Entertainment and Culture .................................................... 57
7.2. Science as a Leisure Activity ................................................................. 58
7.3. Studying Science ................................................................................... 60
7.4. Careers in Science ................................................................................. 64
7.5. Science in the Economy ........................................................................ 65
8. Segmenting the Public ................................................................ 71
8.1. Concerned ............................................................................................. 71
8.2. Indifferent ............................................................................................... 75
8.3. Late Adopters......................................................................................... 77
8.4. Confident Engagers ............................................................................... 80
8.5. Distrustful Engagers ............................................................................... 83
8.6. Disengaged Sceptics ............................................................................. 87
9. Conclusions ................................................................................. 90
Appendices .......................................................................................... 93
Appendix A: Guide to Statistical Reliability ........................................................ 93
Appendix B: Definition of Social Grades ........................................................... 94
Appendix C: Quantitative Sample Profile .......................................................... 95
Appendix D: Qualitative Sample Profile ............................................................ 96
Appendix E: Factor and Cluster Analyses ......................................................... 97
Appendix F: Questionnaire .............................................................................. 102
Appendix G: List of Scientists Attending Workshops ....................................... 121
Appendix H: List of PAS Steering Group Members ......................................... 122

Public Attitudes to Science 2011: Main Report
1
© 2011 Ipsos MORI
Foreword
I am pleased to present Public Attitudes to Science 2011, the fourth in our series of such studies, enabling trends to be measured back to 2000.
Since becoming Science Minister, I have been particularly struck by the way people react to scientific issues. The complexity of their attitudes is vividly illustrated in this study, which has used a broad methodological approach to get to the heart of how people feel about science, how they engage with it, the trust they place in it, and the role which it plays in their lives and careers. The results show that attitudes to science are not simple or one-
dimensional, but subject to nuances including age and personal circumstances. I was interested, for example, to read the report‟s conclusion that attitudes to science change and develop as individuals became more exposed to science.
There is much food for thought here, on attitudes to science and research, on our approaches to engagement, and the trust which we put in institutions and individuals.
I am pleased to see that the report shows the UK public to be broadly supportive of science. But even with some recent strong advances in strengthening public engagement in the UK, the report suggests that there is still much to do if we are to become a nation where an increasing appetite for science is matched by personal commitment and action.
Given our focus on Growth, I am pleased that so many of our respondents recognise the economic value of science and research, and value the role that both have to play in driving our economy forward. But the results show that there is more to do to increase awareness of the full range of opportunities that are available to those still to enter the job market. The report‟s conclusion that trust in businesses and their use of science is an issue which may in itself be a barrier to greater interest in the range of career choices available is of note.
In total, the survey presents a picture of a country which is proud of its scientific heritage, and curious to know more.
To encourage that spirit of curiosity further, and rightly to assist transparency of the results in the report, we are making the survey raw data available. I encourage all of you with an interest to make use of that, and help us develop an ever clearer picture of how our attitudes are shaped.
David Willetts MP Minister of State for Universities and Science

Public Attitudes to Science 2011: Main Report
2
© 2011 Ipsos MORI
Summary
Public Attitudes to Science (PAS) 2011 is the fourth in a series of studies looking at the UK public‟s attitudes to science, scientists and science policy.1 The PAS studies represent the Government‟s main mechanism for measuring the trends uncovered in the three previous studies and assessing progress since the first study in 2000. The Department for Business, Innovation and Skills (BIS) commissioned Ipsos MORI, in collaboration with the British Science Association (BSA), to conduct this latest study.
PAS 2011 used a mixed methodology approach, including a literature review2 of attitudes in the UK and internationally, a survey of 2,103 UK adults aged 16+, four sets of general public workshops and four general public discussion groups. We summarise the findings under a number of main themes from the quantitative and qualitative research below, using the trend data from the previous studies to add context where appropriate.
How People See Science
How People Define Science
The research shows that there is no single accepted definition of science. The survey finds that different people see science in different ways, and that people tend to emphasise the aspects of science that are most prominent in their own lives. In addition, while people may initially take a narrow view of what constitutes science, the considered responses of workshop participants tended to be much richer, with many ending the workshops expressing much broader definitions of science than they started with.
In the workshops, many participants judged whether something constituted science by the extent to which it incorporated maths, or used evidence and experimentation to prove things. This highlighted that they viewed science not just as a collection of disciplines, but also as a way of thinking or working.
Enthusiasm and Concerns about Science
As in previous PAS studies, the public generally views science as beneficial to society, with four-fifths (80%) agreeing that, “on the whole, science will make our lives easier” and over half (54%) thinking that “the benefits of science are greater than any harmful effect”.
The public also highly values scientists. Nine in ten (88%) think “scientists make a valuable contribution to society” and eight in ten (82%) agree they “want to make life better for the average person”. The proportion agreeing with the latter statement has increased consistently since 2000, suggesting perceptions of scientists have improved over time.
However, that is not to say people do not have concerns. Both the survey and the workshop findings indicate that, as in previous PAS studies, the speed of development and a sense of science going against nature still worry many people. The extent of these concerns is topic dependent, with the survey finding that, among the various science topics explored, GM crops, nuclear power and animal experimentation are particularly contentious.
1 This was based on the BIS definition of science, so explored attitudes not only to science,
technology, engineering and maths (STEM) subjects, but also to research more broadly. 2 The literature review has been published as a separate report. See http://www.ipsos-
mori.com/assets/docs/polls/sri-pas-2011-review-of-existing-literature.pdf.

Public Attitudes to Science 2011: Main Report
3
© 2011 Ipsos MORI
Awareness of the Knowledge Production Process
Despite holding science and scientists in high esteem, people generally have little knowledge of how science is carried out today. In the workshops, participants felt they knew less about the funding and design of scientific research than they did about the outcomes and applications. Although many assumed there was some checking of data, they tended not to have heard of “peer review”. Many also wanted to hear more about the wider implications of scientific research, i.e. how the outcomes of research inform policy and business decisions, and their implications for society and the economy.
People also still tend to have a stereotypical view of scientists. In the workshops, participants tended to see scientists exclusively as male and working in laboratories.
Finding Out about Science
Most people are interested in science. Four-fifths (82%) agree that “science is such a big part of our lives that we should all take an interest” and two-thirds (68%) think “it is important to know about science in my daily life”. Agreement with both statements has increased since 2000. There is also an appetite for hearing more about science, with half (51%) saying they hear and see too little information about science.
Fewer people say they feel informed about science, and scientific research and developments (43%) than say they do not (56%). Again, the extent to which people feel informed varies depending on the topic. Of the science and social science topics explored in the survey, people feel relatively well informed about climate change, vaccination, human rights and renewable energy, while most do not feel informed about relatively new areas of research such as nanotechnology and synthetic biology.
The proportion feeling informed about science has declined since 2008 (although it is still in line with the 2005 level), even though the proportion agreeing that “finding out about new scientific developments is easy these days” (49%) has risen consistently since 2000. However, compared to 2008, more agree that “Science and technology are too specialised for most people to understand them” (63%) and that they “cannot follow developments in science and technology because the speed of development is too fast” (46%), which may help to explain the decline in people saying they feel informed. Taken together, these trends highlight that feeling informed about science is not simply a case of getting more information, and there are instead a variety of factors at work here.
People hear or read about science most often through traditional media, such as television (54%) and print newspapers (33%). A fifth (19%) say one of their two most regular sources of information is the internet, though very few (2%) use science blogs specifically as one of their most regular sources.
Trust in Science
PAS 2011 explored two aspects of trust in science: trust in the information people see and hear about science, and trust in scientists themselves.
Trust in Information about Science
By a margin of more than five to one, people think that the information they hear about science “is generally true” (47% agree, while 9% disagree), though a third (34%) are undecided. The reasons people give for agreeing or disagreeing often relate to whether they

Public Attitudes to Science 2011: Main Report
4
© 2011 Ipsos MORI
think science is regulated or not, or to whether they think scientific findings are checked, both by scientists and by journalists.
Related to this, half (52%) say they would be more likely to believe the findings of scientific studies if they knew that other scientists had formally reviewed them. Just under half (47%) also say they would be more likely to believe scientific findings if they heard the same thing from a number of different sources.
The workshop findings suggest people trust some information channels more than others when it comes to science. Participants generally thought that scientific journals were most trustworthy, but felt scientific journals were not accessible to the public, being too technical for ordinary people to understand. Consequently some thought they had no alternative but to look to newspapers, which were not felt to carry the same level of trustworthiness.
Trust in Scientists
The findings suggest trust in scientists “to follow any rules and regulations” is a function of trust in the institutions that they work for. Trust is highest for scientists working at universities (84% trust a great deal/fair amount), while trust in industry scientists is lowest (56%). This is similar to the findings of the previous PAS studies, as well as other research in this area.3
People do not generally feel their trust in scientists has changed over time, with seven in ten (69%) saying they trust scientists “about the same as [they] did five years ago”. This suggests that the 2009 “climategate” controversy appears to have had little long-term impact on trust in scientists as a profession in the wider public imagination.
Regulating Science
People tend to assume the Government regulates science, but few are aware of the specific bodies in place for this. People also tend to overlook self-regulation by scientific professional bodies or scientists themselves when reflecting on how science is regulated.
The public is generally confident that scientists are well regulated, although this varies depending on the institutions they work for. Reflecting the findings on trust in scientists, people tend to be most confident about the regulation of scientists working at universities (80% confident), and least confident in the regulation of industry scientists (48% confident).
In the workshops, participants‟ priorities for regulation tended to focus on two areas. Firstly, participants wanted regulation to deal with conflicts of interest between scientists‟ research and the priorities of their funders. Secondly, they wanted regulators to ensure that scientists conducted their work safely, checking that they were not harming people, animals, or the environment both during their research, and through any new technologies developed.
Public Consultation and Involvement in Science
Many are confused as to what “public consultation on science” means and people are cynical about the value of public consultations generally. Nonetheless, around three-quarters (73%) feel “the Government should act in accordance with public concerns about science and technology”. In addition, many see various benefits from the public getting more involved in decision-making on science, with the most frequent mentions being that it allows the public to
3 Whitmarsh and Kean (2005) Connecting Science: What We Know and What We Don‟t Know about
Science in Society, British Association for the Advancement of Science [p.25.]

Public Attitudes to Science 2011: Main Report
5
© 2011 Ipsos MORI
make informed decisions about their lives (15%) and that it enables them to better judge science issues for themselves (13%).
However, people also feel there are barriers to getting involved, with lack of public understanding of science (26%) and lack of public interest (19%) most frequently mentioned. Indeed, half (50%) say they want to know that the public is being consulted, but not get involved themselves. This finding mirrors much existing research on involvement in public policy issues – that is to say that people think it is important that members of the public are involved, but they would not want to be personally.4
There is also some debate over the extent to which the Government should place more importance on scientific evidence and on expert opinion, rather than public opinion. Two-thirds (64%) say “experts and not the public should advise the Government about the implications of scientific developments” and almost half (45%) agree that “politicians should put scientific evidence above public opinion when making decisions”.
There is however potential for more of the public to become more involved in public consultation and dialogue on science. Around three in ten either want more of a say (21%), or want to become actively involved (7%) in this. It will nonetheless be important to consider how involvement might be widened across more of the public.
Science in People’s Lives
Science in Entertainment and Culture
The survey finds half the public (50%) have engaged in a science-related leisure activity in the last 12 months, with the most popular of these being visiting a zoo or a science museum. Those who have taken part in these activities tend to have done them only once over this period. They also tend to be family activities, with relatively few people doing them with friends. The findings also suggest that parents are somewhat more likely to take a son to a science-related activity than a daughter.
In the workshops, participants tended not to have considered the role of science in culture before, but on reflection many saw various cultural benefits from science, through its contributions to entertainment, to informed public debate and to day-to-day conversations. Some also saw science as being integral to the national culture of inventiveness, extending back to the industrial revolution.
Studying and Working in Science
The survey reflects that many people‟s attitudes towards science are formed at school, both positively and negatively, with a quarter (24%) agreeing that “school put me off science”. In all, people tend to be divided over whether the science they learned at school has been useful in their everyday lives or in their jobs. They also have a mixed view of the quality of science teaching, relative to other subjects, though slightly more say it was better than say it was worse (22% versus 18%).
Most see careers in science as desirable, with seven in ten (68%) agreeing that “jobs in science are very interesting”. However, there is less enthusiasm for working in science among 16-24 year olds (61% agree).
4 See for example the Hansard Society‟s (2009) Audit of Political Engagement 6
(http://www.hansardsociety.org.uk/files/folders/1755/download.aspx), which found that 55% of British adults did not want to be involved in national decision-making.

Public Attitudes to Science 2011: Main Report
6
© 2011 Ipsos MORI
Six in ten (61%) also agree “jobs in engineering are very interesting”. However, there is uncertainty about the future of the engineering sector, with a third agreeing (36%) that “engineering is a dying industry in the UK”.
Science in the Economy
Many see science as integral to the UK economy and to job creation, with three-quarters (75%) agreeing “scientific research makes a direct contribution to economic growth in the UK”. However, in the workshops, although participants agreed with this, they did not always understand the mechanisms through which science affects economic growth.
There is strong support for the public funding of scientific research, with three-quarters (76%) agreeing that “even if it brings no immediate benefits, research which advances knowledge should be funded by the Government”. Very few (15%) think that “Government funding for science should be cut because the money can be better spent elsewhere”. This is in spite of public support for cutting Government spending overall.5
In the workshops, there was also support for public funding, although participants had mixed thoughts on where this should be targeted. Some thought that publicly funded research should concentrate on areas that are not driven by commercial gain, such as medicine and the environment. However, others thought that in a climate of reduced public spending, the Government should put more emphasis on the potential economic benefits of research than they might have done before when considering whether to fund it.
Segmenting the Public
As in previous PAS studies, we carried out a cluster analysis on the final data from the survey. This is a statistical technique used to segment the population into distinct clusters of respondents who have similar attitudes to science. The analysis identified six distinct clusters6, which we summarise below:
The Concerned constitute around a quarter (23%) of the population, with a younger age profile than other clusters. They tend to have a more religious or spiritual outlook on life and consequently have stronger views on the limitations of science. They support Government efforts to consult the public on science, but have concerns about whether scientists themselves take the findings of these consultations on board.
The Indifferent account for two in ten (19%). They tend to be older, often retired people. They are not especially negative or worried about science, but tend to think science is not for them, so are less interested in finding out about it or in getting involved in public consultation.
Late Adopters also represent around two in ten (18%) and again have a relatively young age profile. They did not enjoy science at school, but have since become more enthusiastic and now want to have more of a say in decision-making. Their interest in science tends to be linked to their environmental and ethical concerns, so they tend to be more engaged on issues such as climate change, GM crops and vivisection.
Confident Engagers make up 14% of the population. People in this cluster tend to be
5 In a June 2010 Ipsos MORI survey looking at reactions to the June 2010 Budget, over two-fifths
agreed that “the deficit needs to be cut quickly, starting this year”. See http://www.ipsos-mori.com/researchpublications/researcharchive/2633/Budget-Reaction-Poll.aspx. 6 It should be noted that these are distinct from any clusters featured in previous PAS studies, which
also had clusters called “Concerned” and “Indifferent”.

Public Attitudes to Science 2011: Main Report
7
© 2011 Ipsos MORI
fairly affluent and well-educated. They tend to have the most positive attitude towards science of all clusters, and have relatively few concerns about scientists, or the relationship between Government and science. However, they are concerned about how the media reports science and the media‟s influence on science policy.
Distrustful Engagers make up 13% of the population. Like Confident Engagers, they generally come from more affluent backgrounds. They are similar to Confident Engagers in their enthusiasm about science, but tend to be far less trusting of scientists and Government. Consequently, they often think the public should play a larger role in decision-making on science issues, and many want to be personally involved in this.
Disengaged Sceptics also constitute 13% of the population. They tend to be less well educated than other clusters. They feel less informed about science and often find science somewhat overwhelming. They are among the most concerned about the speed of development in science. As a result, they favour a conservative approach to science regulation, and one that takes the public‟s views into account.

Public Attitudes to Science 2011: Main Report
8
© 2011 Ipsos MORI
1. Introduction
This report presents the findings from a programme of research carried out as part of Public Attitudes to Science (PAS) 2011, a study of attitudes among the UK public. The research was conducted by Ipsos MORI, in collaboration with the British Science Association (BSA), on behalf of the Department for Business, Innovation and Skills (BIS). It was based on the BIS definition of science7 and therefore explored attitudes not only to science, technology, engineering and maths (STEM) subjects, but also to research more broadly (e.g. including research into the social sciences).
PAS 2011 used a mixed methodology approach broken into three stages:
Stage one consisted of a review of the existing literature on attitudes to science in the UK and internationally. The findings from this review have been provided as a separate report.8
Stage two consisted of a quantitative survey of the UK public and four sets of deliberative workshops. The findings from this stage form the basis of this report.9
Stage three concluded the research with a cluster analysis of the quantitative data, followed by four discussion groups exploring the identified clusters qualitatively. The findings from these are mainly included in Chapter 8 of this report.
1.1. Background and Context
1.1.1. Policy Background
In The Allocation of Science and Research Funding 2011/12 to 2014/15, the Government acknowledged the importance of science in UK society, through its substantial and increasing impact on public policy, culture, quality of life and the economy.10 The Government also noted that, in the context of this increasingly technological society, public engagement with science has never been more important.
Public engagement with science is a core strand of the Science and Society Programme led by BIS. By facilitating greater public engagement, BIS aims to ensure that Government and scientists are responding to public priorities and concerns. In turn, this will enable greater citizen engagement in our modern, technologically-driven society, and with major societal issues such as climate change, while at the same time developing a healthy sense of scepticism among the public towards what they see or hear about science. BIS also aims to attract more children and adults to study and work in science, with the expansion of the science skills base recognised as being vital to the UK‟s future prosperity.
The PAS studies represent the Government‟s main mechanism for assessing progress on these areas. PAS 2011 is the fourth in this series and is intended to continue measuring the trends uncovered in the three previous studies:
7 For the wording of the BIS definition, see http://www.bis.gov.uk/policies/science/science-and-society.
8 See http://www.ipsos-mori.com/assets/docs/polls/sri-pas-2011-review-of-existing-literature.pdf.
9 A Summary Report outlining the key findings is also available here: http://www.ipsos-
mori.com/assets/docs/polls/sri-pas-2011-summary-report.pdf. 10
See http://www.bis.gov.uk/assets/biscore/science/docs/a/10-1356-allocation-of-science-and-research-funding-2011-2015.pdf.

Public Attitudes to Science 2011: Main Report
9
© 2011 Ipsos MORI
1. Science and the Public (OST/Wellcome Trust, 2000)11
2. Science in Society (MORI/OST, 2005)12
3. Public Attitudes to Science (RCUK/DIUS, 2008)13
PAS 2011 will also be used to monitor progress against the goals set out by the independent Science and Society Expert Groups.14 These goals have led to the study exploring new areas for the first time, such as the extent of public awareness of the knowledge production process, and of the use of science by business.
1.1.2. Developments since PAS 2008
It is important to note that there have been several developments in science since the most recent previous PAS study, each potentially affecting public attitudes to science. These include major science stories appearing in the news, various science communication campaigns and changes to Government policy and spending. In the table below, we have outlined some of the major developments that took place in between the PAS 2008 fieldwork15 and the 2011 fieldwork. This is intended to be a broad overview of the most high-profile developments, providing context to the 2011 findings, rather than a comprehensive list.
Year Month Event
2008 Year-long United Nations (UN) declares International Year of Planet Earth
May NASA Phoenix Mars Lander reaches Mars
September 14-19 Diploma in Engineering introduced Launch of Large Hadron Collider at CERN
October Human Fertilisation and Embryology Act allows creation of hybrid embryos
November First transplant of an organ grown from stem cells
2009 Year-long 200th anniversary of birth of Charles Darwin Launch of Government‟s Science: [So what? So everything]
campaign UN declares International Year of Astronomy
June World Health Organisation (WHO) declare Swine Flu Pandemic
July 40th anniversary of first moon landing G8 nations agree to cut carbon emissions by 80% by 2050
October Chair of Advisory Committee on Misuse of Drugs resigns
November Restarting of Large Hadron Collider at CERN University of East Anglia (UEA) Climate Research Unit email
controversy, dubbed “climategate”
December UN climate conference in Copenhagen
2010 Year-long BBC‟s Year of Science Royal Society‟s 350th anniversary UN declares International Year of Biodiversity
January Intergovernmental Panel on Climate Change (IPCC) admit errors in Fourth Assessment Report
February US Government cancels Constellation space project
11
See http://www.wellcome.ac.uk/stellent/groups/corporatesite/@msh_peda/documents/ web_document/wtd003419.pdf. 12
See http://www.ipsos-mori.com/researchpublications/researcharchive/poll.aspx?oItemId=720. 13
See http://www.rcuk.ac.uk/per/Pages/PublicAttitudes2008.aspx. 14
See http://interactive.bis.gov.uk/scienceandsociety/site/. 15
Fieldwork for PAS 2008 took place from 1 August to 25 September 2007.

Public Attitudes to Science 2011: Main Report
10
© 2011 Ipsos MORI
Year Month Event
April-July Deepwater Horizon oil spill in Gulf of Mexico
April-October
Eruptions of Eyjafjallajökull volcano in Iceland
May Andrew Wakefield struck off medical register by General Medical Council (GMC) over MMR vaccine research
Dr Craig Venter creates first synthetic life form General Election and new UK Government
July Independent Climate Change Email Review clears climate scientists of manipulating data
October Government‟s Spending Review First trial of embryonic stem cells in humans
November-December
UN climate conference in Cancun
December BIS announce allocation of science and research funding from 2011/12 to 2014/15
1.2. Research Objectives
There were various objectives for PAS 2011, decided upon by BIS and the PAS steering group set up for the study.16 These were as follows:
Understand how the public defines “the sciences”;
Establish what the public thinks about science, scientists, and science policy in the UK;
Explore why the UK public thinks as they do in relation to science, scientists, and science policy;
Identify some of the purposes and impacts that the public associates with a range of different science topics;17
Explore perceptions of science/engineering/technology as a subject and a career choice;
Understand where people currently get their information on science and technology from, and if/how they assess the quality of that information;
Find out more about why/how/when the public engages with science and how they want to be engaged;
Establish views on, and involvement in, public consultation and debate on science;
Find out more about public confidence in and understanding of science regulation and policymaking;
Establish whether/how views on how science is used within scientific institutions affects public confidence in science;
Gain deeper qualitative insights into the previous studies‟ findings on:
16
See Appendix H for a list of members of the PAS steering group, and their respective organisations. 17
In the context of this research, science topics were defined as specific research areas and/or related policy issues, e.g. nuclear power, stem cell research, nanotechnology etc.

Public Attitudes to Science 2011: Main Report
11
© 2011 Ipsos MORI
Awareness of the knowledge production process; and
Perceptions of businesses‟ use of science and the role of science in the economy.
Establish whether an interest in science is seen as a leisure and/or cultural activity, and where/how those interests are pursued;
Examine the extent to which science is perceived to be part of the UK national culture;
Identify public aspirations, concerns and views towards future developments in science, among scientists and in science policy;
To know whether public attitudes are stable or whether they are undergoing change – if so, what these changes are, and why they might be happening;
To know how public attitudes to science in the UK compare to those in other scientifically developed countries; and
Explore how attitudes vary across population subgroups (both demographic and attitudinal) and how these compare with those identified in previous studies.
1.3. Quantitative Methodology
Ipsos MORI carried out 2,103 interviews with UK adults aged 16+ from 11 October to 19 December 2010. Of these, 1,798 interviews comprised the main stage survey of adults of all ages, while 305 additional interviews were conducted exclusively with 16-24 year olds as a young people booster survey to allow for further subgroup analysis within this age group. Interviews were conducted face-to-face, in-home using Computer Assisted Personal Interviewing (CAPI) software.
1.3.1. Sampling and Quotas
As in all three previous PAS studies, a random location quota survey design was used.18 This involved stratifying the sample by country, Government Office region (within England) and council area, then randomly selecting Super Output Areas19 (SOAs) as sampling points with probability proportional to the size of the adult population. For the young people booster, all SOAs where less than 30% of local adult population were aged 16-24 were excluded.20 In total, 202 sampling points were selected for the main stage and 62 for the young people booster.
For each main stage sampling point, interviewers had non-interlocking, flexible quotas for the gender, age and working status of respondents. For the young people booster, there were no demographic quotas but a screener question was asked before the main questionnaire to ensure respondents were aged 16-24, so eligible for the survey.
18
An alternative random sampling approach was discussed at the inception stage of the research, but ruled out so that the approach would be consistent with previous PAS studies and remain cost-effective. 19
In Northern Ireland, which does not have Super Output Areas, Output Areas were used instead. 20
This was done to replicate the approach taken in the 2008 young people booster, which also excluded SOAs where less than 30% of the adult population were aged 16-24.

Public Attitudes to Science 2011: Main Report
12
© 2011 Ipsos MORI
1.3.2. Questionnaire Design and Piloting
Ipsos MORI and BIS designed the questionnaire in consultation with the PAS steering group, taking questions from the three previous questionnaires as well as adding new questions. The questionnaire was then tested in a pilot survey of 17 respondents using two interviewers to ensure that respondents understood the new questions and to test the length of the questionnaire. The final questionnaire length was 35-40 minutes. A copy of the questionnaire is appended.
1.3.3. Data Processing and Coding
All data processing and coding of unprompted questions was done by Ipsos MORI. Where appropriate, code frames for unprompted questions were taken from the previous PAS studies to maintain comparability.
1.3.4. Weighting
In line with previous studies, data have been weighted by gender, age, ethnicity, work status and social grade21, as well as by Government Office region (in England) and country (for Scotland, Wales and Northern Ireland), to correct for the oversampling of young people and to ensure that the final data are representative of the UK population profile. Weighted and unweighted sample profiles are provided in Appendix C.
1.4. Qualitative Methodology
1.4.1. Workshops
Ipsos MORI, in collaboration with the British Science Association (BSA), conducted deliberative workshops with members of the general public in four locations: London, Beverley, Birmingham and Cardiff. At each location, participants attended an initial Saturday workshop from 10am to 4pm and then attended a reconvened workshop of the same length a fortnight later. Fieldwork in London and Beverley took place on 11 and 25 September 2010, while fieldwork for Birmingham and Cardiff took place on 27 November and 11 December 2010.
The initial workshops explored how participants conceptualised science and their awareness of the knowledge production process, while the reconvened workshops looked in more detail at participants‟ attitudes towards science in culture, science regulation and policy and how businesses use science. At each workshop there were two scientists on hand to answer participants‟ queries, and to present participants with a case study on how they conduct their work.22 In between the initial and reconvened workshops participants completed a choice of homework tasks, which they then discussed on an online participant blog.23
For each location, 18 participants were recruited face-to-face and offered an incentive of £160 for attending both workshops and an additional £20 for completing the homework tasks in between workshops.24 To ensure a wide mix of participants, recruiters had flexible recruitment quotas for the gender, age, ethnicity, social grade and parental status of participants. In addition, the quotas of the London workshop specified that half the
21
A definition of social grades is in Appendix B. 22
Scientists were recruited by the BSA. See Appendix G for details of the attending scientists and their fields of research. 23
These tasks included: visiting a local science centre, looking at a school science textbook, interviewing a friend or family member about science, taking photos of science within people‟s homes and watching a television programme about science. 24
This is a typical incentive rate for general public reconvened workshops.

Public Attitudes to Science 2011: Main Report
13
© 2011 Ipsos MORI
participants should be from ethnic minority backgrounds, while the quotas for the Cardiff workshop specified that all participants should be aged 16-24. This was so that attitudes to science could be explored qualitatively among these particular groups. A demographic profile of participants who attended in each location is in Appendix D.
1.4.2. Discussion Groups
Following the cluster analysis, we conducted four further 90-minute discussion groups: two in Huntingdon on 15 February 2011 and two in London on 17 February 2011. These were designed to explore any gaps or hypotheses emerging from the workshops and survey results. They were also intended to examine four of the six clusters identified in the cluster analysis of survey data qualitatively.
Each set of group participants represented one of the following clusters: Concerned, Late Adopters, Distrustful Engagers and Indifferent. We chose these over the Confident Engagers and Disengaged Sceptics clusters because they were more likely to provide insight into how to improve public engagement with science.
For each group, participants were again recruited face-to-face and offered an incentive of £40 for attending. The recruitment questionnaire was designed to predict the cluster that participants belonged to, and therefore which group they were eligible for. Recruiters had no additional recruitment quotas. A demographic profile of participants who attended each group is again provided in Appendix D.
1.5. Interpretation of Data
1.5.1. Interpretation of Quantitative Data
It should be remembered that final data from the quantitative survey are based on a sample of UK adults, rather than the entire population. Therefore, results are subject to sampling tolerances, and not all differences are statistically significant. Throughout this report, we report only on differences that are statistically significant at the 95% level of confidence.25 Appendix A provides a guide to statistical reliability.
We sometimes refer to “net” scores. These represent the balance of opinion on attitudinal questions and provide a particularly useful means for comparing results across a number of issues. For example, if 40% agree and 25% disagree, the “net agree” score is +15.
Where percentages do not sum to 100%, or to net scores, this may be due to computer rounding, or when questions allow multiple answers. An asterisk (*) denotes any value less than half a per cent but greater than zero.
When discussing demographic differences, we sometimes refer to differences by ethnicity. Here, when it is clear from the data that differences relate to a particular ethnic group (e.g. Asian or Black people), we refer to that group, rather than the ethnic minorities overall. When differences do not clearly relate to a particular group, we do not make this distinction.
1.5.2. Comparison to Previous PAS Studies
Where possible, we have compared the results of the PAS 2011 survey to those in previous studies, to look at changes in attitudes over time. Although the 2011 survey has been designed to follow a similar methodology to the previous surveys, it is important to
25
Strictly speaking, confidence intervals apply only to random probability samples. However, in practice it is reasonable to assume that they provide a good indication of the margins of error in quota surveys.

Public Attitudes to Science 2011: Main Report
14
© 2011 Ipsos MORI
acknowledge the various changes to the research design between studies, which may have affected the results:
A different organisation carried out the interviews using a different set of interviewers each wave: Harris Research in 2000; MORI in 2005; TNS in 2008; and Ipsos MORI for this study.
Although large parts of the questionnaire are consistent with previous surveys, there are several new questions, and it was not always possible to maintain the order of existing questions without biasing answers. Therefore, there have been several variations in the order of questions between surveys.
The survey moved from paper to computer (CAPI) interviewing between 2005 and 2008, which may have affected how interviewers recorded respondents‟ answers.
The 2000 survey was conducted in Great Britain only (i.e. excluding Northern Ireland) as opposed to the UK (i.e. including Northern Ireland), although differences between Great Britain and the UK are likely to be very small at the overall level.
The trend data should therefore be treated with appropriate caution. Nonetheless, they still provide an indication of the direction in which public attitudes have moved in over the last decade.
1.5.3. Interpretation of Qualitative Data
Where we refer to findings from the workshops or discussion groups, these are intended to provide further context for the findings from the survey, as well as insight into why people may hold certain views, rather than be statistically representative. In addition, it is important to bear in mind that we are dealing with people‟s perceptions, rather than facts.
Throughout the report, we make use of verbatim comments from participants to illustrate findings. Where this is the case, it is important to remember that the views expressed do not always represent the views of the workshop or group as a whole, although in each case the verbatim is representative of at least a small number of participants.
1.6. Acknowledgements
Ipsos MORI would like to thank the 2,103 members of the public who took part in the survey, as well as the 90 participants that attended the various workshops and discussion groups. We would also like to thank Alice Taylor-Gee from the British Science Association (BSA) for her help with the workshops, and the 16 scientists who attended and presented at the workshops. Finally we would like to thank the management team at BIS, and members of the PAS steering group26 for their input throughout the study.
© Ipsos MORI/10-013904-01 May 2011
Checked & approved:
Dan Wellings Sarah Castell Jayesh Navin Shah Sarah Pope
26
See Appendix H.

Public Attitudes to Science 2011: Main Report
15
© 2011 Ipsos MORI
2. How People See Science
This chapter looks at how the public conceptualises science, which emerged as an important theme from the literature review. It also examines people‟s hopes and concerns about science. The key findings are as follows:
People initially tend to associate “the sciences” with biology, chemistry and physics. However, in the workshops, participants‟ ideas of what constitutes science were much wider, with many revising their initial views during the discussions.
The survey shows the public highly values scientists. However, in the workshops many found it difficult to move away from a stereotypical image of scientists.
People tend not to understand the knowledge production process in science in detail. In the workshops, participants felt they knew more about the outcomes of scientific research, rather than the funding or design.
People generally see science as benefiting society. However, some scientific developments are more contentious than others, with GM crops, the use of animals in research and nuclear power among the most contentious of the issues explored.
2.1. How the Public Defines the Sciences
2.1.1. Spontaneous Impressions of the Sciences
In order to gauge people‟s top-of-mind impressions of science, the survey asked people what came to mind when mentioning “the sciences”. This question was unprompted.
As we can see from Figure 1 overleaf, most people think of biology, chemistry or physics (36%). Around two in ten (17%) mention health/drugs/cures for diseases etc, suggesting many people associate “the sciences” with medical sciences. Fewer spontaneously associate the sciences with a way of thinking, as opposed to disciplines or applications, with just one in ten mentioning experiments/inquisitiveness/understanding (10%) or ideas/innovation etc (8%).
Far fewer spontaneously mention other disciplines, such as the social sciences (3%) or engineering (2%), which are not among the top ten responses (so not included in the chart).

Public Attitudes to Science 2011: Main Report
16
© 2011 Ipsos MORI
36%
17%
10%
10%
8%
7%
7%
6%
6%
6%
Top ten unprompted mentions
Experiment/Inquisitive/Understanding
Biology/Chemistry/Physics
Health/Drugs/Cures for diseases/ Hospitals/Doctors/Medicine/Hygiene
Advancement/Progress/The future/Better World/Helping Mankind/Easier living/Easier life
Ideas/Innovation/Invention/Discovery/Research/Analysis/Logic
School
Space/Rockets/Astronomy
Environment/Nature/Plants
Laboratory/Labs
New appliances/New technology
Q When I talk about “the sciences”, what comes to mind?
Figure 1: Spontaneous Impressions of “the Sciences”
Base: 2,103 UK adults aged 16+Fieldwork dates: 11 October-19 December 2010
The data suggest men have a different outlook on the sciences to women. Men are slightly more likely than women to mention advancement/progress etc (12% versus 8%), new appliances/technology (7% versus 5%), computers/IT (4% versus 1%) and engineering (4% versus 1%) – many of these are what workshop participants described as the more applied and practical areas of science. However, it is worth noting that all of these mentions come from small proportions of both men and women.
People‟s responses also tend to reflect their proximity to particular aspects of science. Younger age groups tend to think more of biology/chemistry/physics (46% of 16-24 year olds, compared with 22% of those aged 65+), which perhaps reflects their more recent experience of science at school. Older people are more likely to mention health/drugs/cures for diseases etc (19% of people aged 65+, versus 12% of 16-24 year olds).
Similarly, those who describe themselves as engineers are more likely than average to mention engineering when thinking of the sciences (11%, versus 2% overall) and are also somewhat more likely to think of new appliances/technology (11%, versus 6% overall). Those who have studied social sciences to a higher level are more likely to mention social sciences (8%, versus 3% overall), and are also more likely to mention advancement/ progress etc (18%, versus 10% overall).
2.1.2. What Constitutes a Science?
When we probed how people define the sciences in greater depth at the workshops, it revealed that, while participants‟ first impressions were often similar to responses in the survey, their considered responses after discussing the topic were much richer. During the course of the workshop, participants‟ definitions of the sciences quickly broadened beyond biology, chemistry and physics, with many eventually including aspects of engineering, medical sciences, environmental sciences, information technology and the social sciences in their definitions.
This in itself underlines that participants, many of whom started the day with fixed notions of what constitutes science, were willing to change their views on science based on what those around them suggested. Here, the backgrounds of fellow participants and the

Public Attitudes to Science 2011: Main Report
17
© 2011 Ipsos MORI
specialist fields of the scientists present at the workshops had an important effect – for example, participants were more willing to broaden their definitions to include engineering and social sciences when fellow participants or the attending scientists worked in these disciplines.
When asked to justify why participants thought these areas were part of the sciences, they usually gave one of two reasons. Firstly, many participants thought anything must be a science if it could be directly linked back to biology, chemistry or physics, which some referred to as “core” sciences. For example, some saw medical sciences as branching off from biology and chemistry, so included them in their definitions. Similarly, some viewed engineering as a branch of physics, so definitely a science.
“From those three [biology, chemistry and physics], you can branch off into things that are more mathematical like engineering.”
Birmingham workshop participant
Secondly, when participants could not make this direct link to biology, chemistry or physics, e.g. in the case of social sciences or humanities, they instead chose to include or exclude an aspect from their definition based on how “scientific” they felt it was. Here, many participants judged how scientific different areas were based on the extent to which they incorporated maths, or used evidence and experimentation to prove things. This highlighted that they viewed science not just as a collection of disciplines, but also as a way of thinking or working (in contrast to the spontaneous impressions recorded in the survey).
On this basis, there was some debate about whether the social sciences should be considered part of “the sciences”. Some felt they were scientific, but others disagreed. A few participants suggested that while the concept of proof in biology, chemistry or physics was often easy to comprehend through simple, visible experiments, it was far harder to prove things relating to human behaviour, which made the social sciences seem less scientific.
“With mechanical things … something will snap if it‟s not working. So I think physics is much more black and white. Even chemistry, it either reacts with the substances, or it doesn‟t.”
Beverley workshop participant
This supports the findings of PAS 2008 – participants in the discussion groups conducted as part of that study also tended to see the social sciences as more open to interpretation than biology, chemistry or physics, so less objective, and consequently less scientific.27
Building on this, some participants in the 2011 study thought that the social sciences were not inherently scientific, because although they might use maths and experimentation, these were not perceived as essential tools, whereas they were perceived as essential to biology, chemistry and physics, perhaps because participants were more familiar with these disciplines. This also extended to disciplines like history – some felt that scientific methods could be applied to the study of history, so it could be studied scientifically, but it was not inherently scientific, so should not be considered as part of the sciences.
Nonetheless, reflecting on whether the social sciences used maths or experiments sometimes changed participants’ initial impressions of them. For example, some participants began to see social sciences like psychology as more scientific when a fellow participant who was studying in that field explained that psychologists use statistics in their work. For younger participants, evidence and experimentation were more important factors than the presence of maths, and they felt that social sciences could only be seen as sciences
27
People, Science & Policy/TNS (2008) Public Attitudes towards Science 2008, RCUK/DIUS [p.37.]

Public Attitudes to Science 2011: Main Report
18
© 2011 Ipsos MORI
when they were done “properly”, which on probing meant following a structured and methodical approach.
“Yes [psychology is a science]. Because of things like Pavlov‟s experiments, you can show how things work by methods.”
Cardiff workshop participant
This suggests highlighting the mathematical and experimental aspects of the social sciences would make more people see them as part of the sciences.
2.1.3. How People Categorise Aspects of the Sciences
In the workshops, we asked participants to sort aspects of the sciences they had identified into what they saw as the different categories of science. Here, many made distinctions between aspects of the sciences based on how practical or abstract they felt they were. They generally saw medical sciences, environmental sciences and engineering as highly practical, because these were addressing important problems affecting people‟s daily lives. By contrast, biology, chemistry and physics, as well as space science, were areas that participants felt were less applicable to people‟s everyday lives, so more abstract.
A few participants initially thought more abstract areas such as space science or theoretical physics should be less of a priority because they assumed these had fewer practical applications. However, in the workshops where there were space scientists present, these scientists pointed out some of the practical applications emerging from research in these areas, such as CAT scans developed from space science. This often made participants reassess how useful they thought these more abstract sciences were. Again, this highlights how participants were willing to change their initial perceptions of science, in this case based on the dialogue with the attending scientists, which allowed participants to discuss issues that they would not have considered much in their daily lives (e.g. space science).
Some participants also distinguished what they saw as the “traditional” sciences of biology, chemistry and physics from what they called “contemporary” sciences. The contemporary sciences encompassed relatively recent applications of science, including communications technologies like computers and mobile phones, and technology used for entertainment such as video games and social networking websites. Participants thought these were different from other aspects of the sciences because they aimed to be financially profitable, with less focus on their scientific value.
2.1.4. Science’s Relationship with the Arts
The workshop participants also discussed science‟s relationship with the arts, about which they had mixed feelings. Some thought that there was an overlap between science and art because both were about interpreting the world creatively. Here, some participants cited architecture as an example of both a science and an art form, as they thought the design of buildings involved thinking about aesthetics, as well as more scientific concerns.
“Architecture, science is involved in the design of it but so is art. To design a building you have to be both an artist and a scientist.”
Birmingham workshop participant
However, many participants saw science as distinct from the arts. These participants felt scientific interpretation was different from artistic interpretation – they thought that art encouraged many interpretations of the world, whereas science was about narrowing down interpretations to some agreed, common ways of describing the world which enable people

Public Attitudes to Science 2011: Main Report
19
© 2011 Ipsos MORI
to make and do things. Because of this, participants generally felt the BIS definition of science, which includes “research in the arts and humanities”, was too wide .
2.2. How the Public Sees Scientists
2.2.1. Do People Value Scientists?
The findings suggest the UK public highly values scientists. Nine in ten (88%) think “scientists make a valuable contribution to society”, while eight in ten (82%) think they “want to make life better for the average person”. From Figure 2 below we can see that the proportion agreeing that scientists want to make lives better has increased consistently since 2000, suggesting public perceptions of scientists have improved.
0%
25%
50%
75%
100%
2000 2001 2002 2003 2004 2005 2006 2007 2008 2009 2010 2011
Figure 2: Do People Value Scientists?
Base for 2011: 2,103 UK adults aged 16+Fieldwork dates for 2011: 11 October-19 December 2010
Q For each of the statements, please could you tell me the extent to which you agree or disagree?
86 8885
76
67
82
0%
25%
50%
75%
100%
2000 2001 2002 2003 2004 2005 2006 2007 2008 2009 2010 2011
% Agree scientists make a valuable contribution to society
% Agree scientists want to make life better for the average person
Again, there are differences by demographic group. Men are more likely than women to agree that scientists make a valuable contribution (90% versus 85%). Those in the middle and older age groups tend to value scientists more than young people: 82% of 16-24 year olds think they make a valuable contribution compared to 91% of people aged 45+; and 78% of 16-24 year olds think they want to make life better versus 85% of those aged 45+. Finally, Black people are less likely than average to agree with both statements (78% agree scientists make a valuable contribution, versus 88% overall; 60% agree they want to make life better, versus 82% overall). Of course, across all these groups, it is worth noting that the majority do agree with both statements.
There are also differences by social status and by education. The less affluent (DEs) are less likely to think scientists make a valuable contribution to society (77%, versus 88% overall). Those with a higher education are more likely to think this (95%), regardless of the subject they studied.
2.2.2. Words or Phrases Used to Describe Scientists
From the list of words or phrases shown in Figure 3, people are most likely to pick out serious (48%), objective (41%) and rational (33%) to describe scientists. Out of this list, the

Public Attitudes to Science 2011: Main Report
20
© 2011 Ipsos MORI
words or phrases people least associate with scientists are narrow-minded (9%), friendly (9%), too inquisitive (8%) and good at public relations (5%).
More think scientists are poor at public relations (17%) than good at public relations (5%), although it is a small proportion picking either of these phrases. It is worth noting that those with a background in science themselves acknowledge this – those who work as scientists or have studied science to a higher level are more likely than average to describe scientists as poor at public relations (28% and 24% respectively, versus 17% overall).
48%41%
33%26%
25%24%
23%23%
22%17%
15%9%9%
8%5%
3%3%
Figure 3: Words or Phrases Used to Describe Scientists
Serious
Q Which, if any, of these words or phrases would you use to describe scientists?
Objective
Rational
Powerful
Independent
Detached
Secretive
Bookish
Socially responsible
Poor at public relations
Base: 2,103 UK adults aged 16+Fieldwork dates: 11 October-19 December 2010
Trustworthy
Narrow-minded
Friendly
Too inquisitive
Good at public relations
Don‟t know
None of these
There are various gender differences. Men are more likely than women to see scientists as objective (45% versus 36%) and rational (38% versus 28%), and also more likely to see them as detached (26% versus 21%) and poor at public relations (20% versus 15%). Women are more likely to describe them as powerful (31% versus 21%) and bookish (24% versus 21%).
Black people are more likely than average to say scientists are too inquisitive (22%, compared with 8% overall). This perhaps reflects indicative findings from the workshops, where participants of African ethnic origin tended to have stronger concerns about science and scientists, often linked to their religious beliefs (although it is important to note that these findings cannot be extrapolated to the population at large).
Media consumption also appears to be correlated with how people view scientists. Those who read broadsheet newspapers are more likely than average to see scientists as serious (54%, versus 48% overall), objective (55% versus 41%), rational (49% versus 33%) and independent (30% versus 25%). Tabloid readers are more likely than average to see them as secretive (28% versus 23%).
2.2.3. Do People Have a Stereotypical View of Scientists?
In the workshops, when we asked participants to describe their image of scientists, many admitted they found it difficult to move away from a stereotypical image of scientists. Some suggested this was because of their lack of exposure to actual scientists.
Participants overwhelmingly viewed scientists as male, even when there were female
Public Attitudes to Science 2011: Main Report
21
© 2011 Ipsos MORI
scientists present in the room. A small number of older participants even felt there was a taboo associated with being a female scientist, saying they would shy away from describing themselves as scientists if they were women. However, it is worth noting that this is a minority viewpoint – in the survey, just four per cent think “science is not a suitable career for a woman”.
When workshop participants did think of women working in science, their image of female scientists tended to be different from that of male scientists. They tended to think of female scientists as businesswomen in suits, while male scientists were usually people in lab coats with unruly hair.
The perception that scientists work exclusively in a laboratory setting also came across in the homework tasks participants had to do between workshops, where some chose to interview someone they knew and ask them to describe a scientist. Here is a selection of the responses:
“They work in labs, trying to find cures and new ways of doing things. They do controlled, repeatable tests, exploring theories and scenarios.”
Interview with Cardiff workshop participant‟s mum, aged 47
“A scientist is a teacher at mum‟s school and they mostly do experiments on animals.”
Interview with Beverley workshop participant‟s daughter, aged 7
Nonetheless, many of the responses to this task took a broader, more conceptual view of who a scientist is and what they do. In some descriptions, anyone that looked at data systematically or discovered or invented something was a scientist.
“Anyone who gathers and analyses data [is a scientist].”
Interview with Birmingham workshop participant‟s brother, aged 18
2.3. Awareness of the Knowledge Production Process
For this study, we defined the knowledge production process as incorporating each stage of a research project, from how scientists and other researchers get funding, to how they validate findings, through to the outcomes and implications of the research. This section explores the public‟s understanding of these different stages.
2.3.1. Awareness of How Science is Funded
When thinking about science funding generally, people tend to think of Government funding. When asked without prompting, more think funding comes from Government (71%) than from industry (44%), even though the majority of funding for UK research and development comes from the private sector. Fewer mention charities (17%) or universities (17%). Public sector funding of science did however have more coverage than usual in the media just before the survey fieldwork period, in the lead up to the announcement of the Government‟s Comprehensive Spending Review, which may have affected results.

Public Attitudes to Science 2011: Main Report
22
© 2011 Ipsos MORI
71%
44%
17%
17%
5%
1%
12%
1%
*%
*%
*%
*%
Figure 4: Perceived Sources of Funding
The Government/Taxpayer
Private industry/business/companies
Charities
Universities
Trusts/research trusts/foundations/grants
Don‟t know
Q As far as you know, who funds scientific research in the UK?
Base: 2,103 UK adults aged 16+Fieldwork dates: 11 October-19 December 2010
Unprompted mentions
NHS/Health service/medical bodies
Scientists/scientific institutes
Foreign countries/investors
Other
No answer
Wealthy individuals
Certain groups tend to feel less aware of who funds science, including young people aged 16-24 (19% don‟t know, versus 12% overall), the less affluent in social grades DE (20% don‟t know) and those without internet access (21% don‟t know). Asian people (21%) and Black people (21%) are also more likely to say they don‟t know than White people (11%).
Participants in the workshops generally felt they had little or no information on how scientists and their funders determine what will be researched. They assumed that the Government somehow prioritised research that would benefit society, but tended not to think there was a formal system in place to allocate funding. Some thought it instead depended on how well connected scientists were, which made them concerned about cronyism in science funding.
“I‟ve got a worry that there‟s cronyism. If someone came in with a radical new idea, they‟re not going to get a look in because they‟re not part of that little world.”
Birmingham workshop participant
For several participants, the workshops were the first time they had realised the extent of work scientists had to do to secure funding, for example in terms of writing grant proposals, which challenged their perceptions of scientists as simply conducting experiments and analysing data. For example, in Beverley, one of the scientists who attended noted that they spent a considerable amount of their time applying for funding, which surprised many participants.
2.3.2. Awareness of Peer Review
Three-fifths (62%) have a basic understanding of the peer review process, agreeing that “before scientific findings are announced, other scientists have checked them”. On the other hand, over a third (36%) think that “scientists adjust their findings to get the answers they want”, indicating that some people still have considerable doubts about the rigour of scientific findings.
In the workshops, many participants assumed there was some kind of system in place to

Public Attitudes to Science 2011: Main Report
23
© 2011 Ipsos MORI
check findings, but tended not to have heard explicitly of “peer review” at the beginning of the workshops.
When we gave participants more information about peer review, many thought this was a good system to validate scientific findings. However, some were sceptical about the motives of those conducting the review, thinking that they could never be completely objective.
“I‟m sometimes sceptical of peer review. Don‟t we tend to look after our own? Sometimes we‟re very critical, but doctors tend to be a closed circle and if one makes an error they … cover up and protect their own.”
London workshop participant
Because of this, participants were particularly interested in knowing how people get picked to be peer reviewers and whether they ever knew the scientists whose work they were reviewing.
2.3.3. Awareness of the Outcomes of Scientific Research
In the workshops, participants generally felt they knew more about the outcomes of science than its funding and design. Many thought that this was because media coverage tended to concentrate on outcomes, rather than the earlier stages of science.
For some, this balance in favour of the outcomes reflected their own priorities, and they questioned whether the public needed to know about the process of science as much as the results. However, many were still interested in knowing more about the funding and review processes because of their concerns about conflicts of interest between scientists, their funders and those who reviewed their work. This suggests that even though people may initially say they are more interested in the outcomes of science than the earlier stages of knowledge production, they would still want information on the earlier stages to address these concerns.
2.3.4. Awareness of the Wider Implications of Scientific Research
People tend to feel they do not hear enough about the wider implications of scientific research, i.e. how research informs decisions in policy and in business, and its implications for society and the economy. This comes across in the survey, where two-thirds (65%) agree that they “would like scientists to spend more time than they do discussing the social and ethical implications of their research with the general public”. This has however come down by fifteen percentage points from 80% in 2005, which might mean people see it as less of a priority, but might also mean that scientists have become better at communicating this aspect of their work.
The workshop findings also reflect a desire for more information on what happens after scientific research gets published. Some participants thought their knowledge of the eventual applications of scientific research was incomplete because the media would often cover the immediate outcomes of the research but not follow this up later on to see whether these outcomes had led to any concrete applications or not.
Participants appeared particularly interested in hearing more about the wider social and economic implications of scientific research. For example, one of the presentations by the scientists who attended involved research into malaria, after which many participants wanted to know more about the policy decisions and economics enabling or preventing anti-malaria drugs reaching poor countries. Some participants thought information on these decisions was often kept secret, especially by private companies.

Public Attitudes to Science 2011: Main Report
24
© 2011 Ipsos MORI
2.4. Hopes and Concerns about Science
2.4.1. Perceived Benefits of Science to Society
The public thinks science is beneficial to society, with four-fifths (80%) agreeing that, “on the whole, science will make our lives easier”. However, fewer (54%) agree that “the benefits of science are greater than any harmful effect”, while three in ten (28%) are neutral, suggesting people do have concerns about the potential harmful effects of science.
23
12
56
42
14
28
5
13
2
23
Figure 5: Perceived Benefits of Science to Society
% Strongly agree % Tend to agree % Neither/nor
% Tend to disagree % Strongly disagree % Don't know
The benefits of science are greater than any harmful effect
On the whole, science will make our lives easier
Base: 2,103 UK adults aged 16+Fieldwork dates: 11 October-19 December 2010
Q For each of the statements, please could you tell me the extent to which you agree or disagree?
% Agree
80%
54%
Across both statements, men and those in social grades AB are more likely to strongly agree than average. Black people are by contrast somewhat more likely to disagree that science will make lives easier (18%, compared with 5% overall), although even among this group seven in ten (69%) still agree.
2.4.2. What Do People Want from Science?
This section is based on findings from the workshops, where we explored participants‟ aspirations for science in relation to themselves, the UK and the World. Here, participants’ personal aspirations for science tended to reflect their life stage. Generally, younger participants tended to be more focused on lifestyle changes that science could provide, e.g. through gadgets and inventions that would reduce the burden of household chores, or improve physical appearance. On the other hand, older participants tended to be more focused on improvements related to their health, e.g. improved treatments for specific illnesses like diabetes or cancer.
We then asked participants which of their aspirations for science they would prioritise, which had a mixed response. In some workshops, participants felt that scientific developments helping to alleviate the effects of global problems, such as hunger, natural disasters, limited water resources and diseases such as malaria, should be prioritised over scientific developments benefitting the UK alone. By contrast, in the other workshop locations, participants largely prioritised scientific developments that would help people in the UK. Within this, they included cures for cancer, clean energy sources and increased food production. They said these developments were more important because they were more

Public Attitudes to Science 2011: Main Report
25
© 2011 Ipsos MORI
relevant to their everyday lives.
“I think a cure for cancer is more important than a cure for malaria as I know people who have died from cancer, but I don‟t know people who have died from malaria.”
Beverley workshop participant
2.4.3. Concerns about Science
Although people are generally optimistic about science, the findings suggest that there are nonetheless many areas of concern about future developments in science. The following concerns were raised in the workshops, and also come across in responses to various questions in the survey:
Some participants felt the advancement of technology was too fast. This is indeed an important concern emerging from the survey, with almost half (46%) agreeing they “cannot follow developments in science and technology because the speed of development is too fast” and two-fifths (40%) agreeing that “the speed of development in science and technology means that it cannot be properly controlled by Government” – both scores have risen by four percentage points since 2008.
Some also thought recent scientific advances were too focused on commercial gain, as opposed to the investment in science for the good of society, e.g. medicine and technologies to combat climate change etc.
Another area of concern was of science going against nature, which came across in discussions about fertility treatment, GM crops, cloning, food additives, pollution and climate change caused by overusing fossil fuels. These fears are also present in the survey, with over half (56%) agreeing that “people shouldn‟t tamper with nature”, although this is markedly lower than in 2008 (70%).
For some, the perceived lack of regulation of science was a concern. Much of this related to what scientists with vested interests might do behind closed doors. Again, this comes across as an important issue in the survey, with over half (54%) thinking “rules will not stop scientists doing what they want behind closed doors”.
Some thought there were global inequalities in science, for instance when medicine, food and water resources were not shared equally, or when only the richest in the World benefited from new drugs. We also explored this in the survey, where three in ten (30%) agree that “scientific advances tend to benefit the rich more than they benefit the poor”. This is down eight percentage points from 38% in 2008, suggesting global inequalities are a less salient issue than before.
Some older participants were concerned about science inventing labour-saving devices to take over human activities and put people out of work. An example of this was the self-checkout machines in supermarkets.
2.5. Perceived Risks and Benefits of Scientific Developments
The survey asked people about the risks and benefits they attached to various scientific issues, illustrated in Figure 6. The more contentious of the issues explored, where people are more split over the risks and benefits, are GM crops (+7 net score), nuclear power (+16) and the use of animals in research (+19). This is perhaps because these are historically controversial areas of science, with the risks and benefits of GM crops and nuclear power in particular having received considerable media coverage in recent years. Large proportions

Public Attitudes to Science 2011: Main Report
26
© 2011 Ipsos MORI
say they don‟t know about the risks and benefits of nanotechnology (44%) and synthetic biology (35%), which may reflect particularly low levels of awareness of these two areas (which in turn is a perhaps a reflection of the fact these are relatively recent developments in science).
Figure 6: Perceived Risks and Benefits of Scientific Developments
% Benefits outweigh the risks
% Risks outweigh the benefits
Base: 2,103 UK adults aged 16+Fieldwork dates: 11 October-19 December 2010
Q From what you know or have heard about … , which of these statements, if any, most closely reflects your own opinion?
Vaccination of people against diseases
Renewable energy
Clinical trials
The use of animals in research
Nuclear power
Stem cells research
Synthetic biology
Genetically modified plants (GM crops)
84
72
62
55
29
33
47
42
34
6
9
8
6
12
28
27
27
5
Nanotechnology
Net benefits
outweigh risks
+79
+66
+53
+19
+16
+46
+21
+7
+23
Different age groups appear to have different areas of concern. In particular, young people aged 16-24 are more likely than average to say the risks outweigh the benefits of using animals in research (35%, versus 28% overall) and of clinical trials (14%, versus 9% overall).
Differences by ethnicity also emerge. Black people are more likely than average to think the risks outweigh the benefits of nuclear power (44%, versus 27% overall), GM crops (43%, versus 27% overall) and stem cells research (19%, versus 8% overall). Again, this reflects a more reserved attitude towards science from this group.

Public Attitudes to Science 2011: Main Report
27
© 2011 Ipsos MORI
3. Finding Out about Science
This chapter looks at people‟s interest in science, how informed they feel about it, and how they typically find out about scientific research and developments. The key findings are as follows:
The public tends to be highly interested in science, and the findings indicate that interest has increased since 2000.
People tend to access most of their information on science through traditional media such as television and print newspapers.
There is a fairly even split between the proportion feeling informed and not feeling informed about science, and scientific research and developments, although this varies substantially depending on the specific science topic in question.
The proportion who feel informed about science has fallen since 2008. Similarly, in the same period the proportion saying they hear and see too little or far too little about science has increased.
3.1. Interest in Science
The UK public tends to be highly interested in science. Four-fifths (82%) agree that “science is such a big part of our lives that we should all take an interest”, with a quarter (25%) strongly agreeing. Two-thirds (68%) also think “it is important to know about science in my daily life”.
However, the difference in scores for these two statements indicates that some people see science as important, but not necessarily personally relevant. They think the public should take an interest, but are less willing to do so themselves.
Nonetheless, agreement with both statements has increased since 2000, by nine and eight percentage points respectively, as Figure 7 shows. These data suggest that the public is now more interested in science issues than they were previously.

Public Attitudes to Science 2011: Main Report
28
© 2011 Ipsos MORI
7379
82
0%
25%
50%
75%
100%
2000 2001 2002 2003 2004 2005 2006 2007 2008 2009 2010 2011
62
70
59
68
0%
25%
50%
75%
100%
2000 2001 2002 2003 2004 2005 2006 2007 2008 2009 2010 2011
% Agree science is such a big part of our lives we should all take an interest
% Agree it is important to know about science in my daily life
Figure 7: Interest in Science
Q For each of the statements, please could you tell me the extent to which you agree or disagree?
Base for 2011: 2,103 UK adults aged 16+Fieldwork dates for 2011: 11 October-19 December 2010
More affluent groups tend to take a greater interest in science. The middle classes (ABC1s), those with a higher education and those with internet access are more likely than average to agree with both statements.
Differences by age indicate that younger and older people take an interest in science for different reasons. Young people aged 16-24 are less likely than those aged 45+ to agree that everyone should take an interest in science (75% versus 86%). However, they are more likely than the middle to older age groups to agree that it is important to know about science in their daily lives (71% versus 65%). This perhaps relates to how young people tend to view science – in the workshops, younger participants tended to associate it more with consumer technologies and gadgets. For young people, knowing about science in their daily lives may refer to keeping up with the latest technology, which is why they find it important.
Ethnic minorities tend to have a greater interest in science. Black people (84%) and Asian people (80%) are more likely than White people (67%) to think it is important to know about science in their daily lives. Black people are also more likely than White people to strongly agree we should all take an interest in science (38% versus 25%), even though this group is more negative towards science generally. It is nonetheless possible that Black people in particular take a greater interest because they want to have their concerns about science and scientific developments addressed.
3.2. How the Public Accesses Information
3.2.1. Most Regular Sources of Information
PAS 2011 explored what people‟s most regular sources of information on science are. It should be noted that this is somewhat different from previous PAS studies (so not comparable), which have asked about what information sources people use, but not which of these they get their information from most often.
As Figure 8 overleaf illustrates, people’s most regular sources of information on science tend to be traditional media, such as television (54%) and print newspapers (33%).

Public Attitudes to Science 2011: Main Report
29
© 2011 Ipsos MORI
However, it is worth noting here that advertising research commonly finds that people tend to overestimate the extent to which they pick up information from television, so the influence of television is perhaps less strong than it appears in the survey.
A fifth (19%) say one of their two most regular sources is the internet. To put this in context however, some participants in the workshops actively sought out information on health topics online, but did not always consider this information about “science”, so the survey could underestimate the extent to which people find out about science, especially medical science, online. Indeed, research by the Wellcome Trust (2009) noted that the Internet was by far the most common source of information on medical research among the UK public.28
Very few (2%) use science blogs as one of their main vehicles for finding out about science or scientific research findings. These are more likely to be used as a main source by people under 35 (4%), and those with a higher education (4%).
54%33%
19%14%
9%8%
7%7%
4%3%3%
1%
1%*%
*%*%
Figure 8: Sources of Information about Science
TV
Q From which one or two of these, if any, do you hear or read about new scientific research findings most often?
Print newspapers
Other internet websites (not science blogs)
Radio
Magazines
Books
Friends and family
Directly from scientists
Work colleagues
Films
Science Blogs
Base: 2,103 UK adults aged 16+Fieldwork dates: 11 October-19 December 2010
Through school/lectures/university/teachers
Other
None of these
Don‟t know
Scientific journals
Women are less likely than men to most frequently find out about science online (16% versus 23%) and are more likely to most frequently get this information from friends and family (9%, versus 5% of men).
Different age groups tend to have different sources of information on science. Those aged 16-24 tend to read about science less frequently in print newspapers than people aged 55+ (24% versus 42%) and tend to get this information more frequently online (27% versus 11%). They are also somewhat more likely than average to have friends and family as one of their most regular source of information (10%, versus 7% overall). However, television remains the most regular source of information, even among 16-24 year olds (49%).
28
Wellcome Trust (2009) Wellcome Trust Monitor 1, Wellcome Trust [p.75.]

Public Attitudes to Science 2011: Main Report
30
© 2011 Ipsos MORI
3.2.2. Reasons for Accessing Information through Particular Sources
At the workshops we explored why participants preferred to use particular sources to access information on science. Participants‟ preferences depended on why they were accessing the information in the first place. They typically sought out information on science because it was entertaining, rather than due to an inherent interest in science. Here, they thought any information that linked science to everyday applications or to people‟s hobbies, such as the motoring section in newspapers, was more entertaining than information that simply explained experiments and results. Many also noted that science information was more entertaining when it was presented as a clear narrative, a story, with an outcome and implications for people's lives.
This was why some read about science in newspapers, which they felt focused on the most entertaining science stories. By contrast, participants thought sources like science journals had niche audiences, since they were for people with a deep-seated interest rather than a passing interest.
“They [newspapers] put in science that is interesting to the public. Not all the stuff in science journals goes into newspapers because it‟s boring.”
London workshop participant
Some also found television programmes more entertaining because they broke science down into manageable chunks of information. Examples of this were the Gadget Show and Bang Goes the Theory, which participants thought gave a brief explanation of the science so that the viewer did not feel overwhelmed, but also signposted them to where they could get further information if they wished.
Participants also noted that they did not always actively seek out information on science, but sometimes passively found it. Some thought the internet was their most frequent source for this kind of stumbled-upon information because they often came across a link to a science story while casually browsing non-science content. They felt this was different from newspapers, where they would read certain sections, but not continue browsing after they had finished these sections like they would online.
“When you first go on to the internet, it often has five top stories of the day, and sometimes there‟s a science story.”
Cardiff workshop participant
3.3. Feeling Informed
3.3.1. Feeling Informed about Science as a Whole
Fewer people say they feel informed about science, and scientific research and developments (43%) than say they do not (56%), as Figure 9 shows. However, the proportion feeling informed has declined by 12 percentage points since 2008, although it is still in line with the 2005 level. It is worth noting that this decline mirrors trend data from another Ipsos MORI/BIS survey on animal experimentation, which asked the same question and also found a 10 percentage point fall in the proportion feeling informed between 2008 and 2010.29
This fall comes in spite of the fact that the BBC held its Year of Science in 2010, bringing together a series of television and radio programmes, online initiatives and face-to-face
29
Ipsos MORI (2011) Views on Animal Experimentation, BIS

Public Attitudes to Science 2011: Main Report
31
© 2011 Ipsos MORI
roadshows about science, some of which took place during survey fieldwork.30 This suggests that feeling better informed may not simply be a case of getting more information – we discuss the potential drivers behind feeling informed in Section 3.3.4.
6%
38%
44%
13%
Figure 9: Feeling Informed about Science
Very well informedDon‟t know (1%)
Not very well informed
Fairly well informed
Not at all informed
Base for 2011: 2,103 UK adults aged 16+Fieldwork dates for 2011: 11 October-19 December 2010
Q How well informed do you feel, if at all, about science, and scientific research and developments?
40
55
43
0%
25%
50%
75%
100%
2005 2006 2007 2008 2009 2010 2011
% Informed trend
Women (37% informed) and those in social grades C2DE (32% informed) tend to feel less well informed than average (43%), which is consistent with the findings of previous PAS studies. By contrast, Asian people (58% informed) tend to feel better informed than average.
The data suggest how informed people feel about science is also linked to where they get their information from (see Section 3.2.1). Those that mostly get their information on science from traditional media such as television or newspapers are among the least informed (37% and 41% respectively), while those that get most of their information online, either through science blogs or other websites are more likely to feel informed (71% and 55% respectively). More generally, those with internet access tend to feel better informed than those without (47% versus 30%).
3.3.2. Feeling Informed about Different Science Topics
Figure 10 shows that people feel more informed about certain science and social science topics than others.31 The topics that people feel most informed about are climate change (+51 net informed), vaccination (+47), human rights (+35) and renewable energy (+23), perhaps reflecting the greater coverage these issues receive in the media. People feel far less informed about nanotechnology (-67) and synthetic biology (-78), perhaps reflecting the relatively recent development of these technologies.
It is worth noting that half (48%) do not feel informed about the way the economy works. This has implications for the extent to which people understand science‟s role in the economy (see Section 7.5).
30
See http://www.bbc.co.uk/pressoffice/pressreleases/stories/2010/01_january/19/science11.shtml. 31
The topics explored in this question fit in with the broader BIS definition of science. The PAS steering group recommended these topics for inclusion so that the survey could also explore how informed people feel about various social science issues.

Public Attitudes to Science 2011: Main Report
32
© 2011 Ipsos MORI
Figure 10: Feeling Informed about Different Science and Social Science Topics
% Informed
% Not informed
Base: 2,103 UK adults aged 16+Fieldwork dates: 11 October-19 December 2010
Q I‟m going to read out a list of topics. Could you tell me how well informed you feel, if at all, about each topic?
Climate change
Vaccination of people against diseases
Renewable energy
Clinical trials
The use of animals in research
Nuclear power
Stem cells research
Synthetic biology
Genetically modified plants (GM crops)
7574
6761
5251
4545
4140
373433
26149
2632
384748
54555759
626465
7381
87
24
Nanotechnology
Net informed
-78
+51
+35
+5
-31
-47
-9
-25
-67
-16
The way the economy works
Human rights
Medical ethics
Ensuring the UK has enough food
Radioactive waste
Research into human behaviour
+47
+24
+4
-10
-19
-31
Again, across the various issues explored, the less affluent (DEs) tend to feel less informed than average about each topic. Differences by gender are less clear cut, and are topic specific – men tend to feel more informed than women about many of the topics asked about, but women tend to feel more informed about research into human behaviour and clinical trials.
Although young people aged 16-24 did not feel less well informed about science overall than older age groups, they do feel less well informed than average about many specific science topics. This includes GM crops, the use of animals in research, food security, medical ethics, radioactive waste, stem cells research, the economy, clinical trials and vaccination.
3.3.3. Do People Want More or Less Information?
Fewer than one in ten (8%) think they hear and see too much or far too much information about science, suggesting that most people do not feel overexposed to science. On the other hand, four in ten (38%) think they hear and see the right amount of information, while five in ten (51%) think they hear and see too little or far too little. This indicates an appetite for knowing more about science among half the population.
Looking at Figure 11, we can see that the proportion saying they hear and see too little or far too little about science has increased by 17 percentage points since 2008, although it is once more in line with the 2005 level. This may be linked to the fall in the proportion feeling informed about science. However, it is also possible that the public‟s desire for information has increased because they are more interested in science than they were previously, as noted in Section 3.1.

Public Attitudes to Science 2011: Main Report
33
© 2011 Ipsos MORI
6%
38%
40%
11%3%
Figure 11: Perceptions of the Amount of Information on Science
far too much (2%)Don‟t know
the right amount
too much
too little
Q Which of the following statements on this card do you most agree with?
These days I hear and see … information about science
51
34
49
24
0%
25%
50%
75%
100%
2000
2001
2002
2003
2004
2005
2006
2007
2008
2009
2010
2011
% Hear and see too little/far
too little trend
2000 2005 2008 2011
far too little
Base for 2011: 2,103 UK adults aged 16+Fieldwork dates for 2011: 11 October-19 December 2010
Asian people (23%) and Black people (16%) are more likely than White people (7%) to say they hear and see too much or far too much information about science. This is despite people from these ethnic minority backgrounds tending to be more interested in science.
Those with internet access are more likely to say they hear and see too little information than those without (53% versus 45%). This again underlines that access to a greater amount of science information online does not necessarily mean people are content with the amount they see and hear.
3.3.4. What Drives How Informed People Feel?
Although the proportion feeling informed has fallen, the reasons for this are not entirely clear. The table overleaf brings together trends for various statements relating to information about science, highlighting the many factors at work here. The findings suggest that while fewer feel informed, access to information about science has increased – the proportion agreeing that “finding out about new scientific developments is easy these days” (49%) has risen consistently since 2000.
Furthermore, the data suggest that on balance people feel personally capable of processing the information they receive about science. Three in ten (32%) do not think they‟re “clever enough to understand science and technology”, but half (52%) disagree. Just 15% say they “don‟t understand the point of all the science being done today”, with seven in ten (72%) disagreeing. Once again, the trends for these statements since 2000 suggest that more people feel capable of understanding what they hear and see about science than before.
However, higher proportions agree that “Science and technology are too specialised for most people to understand them” (63%) and that they “cannot follow developments in science and technology because the speed of development is too fast” (46%). Agreement with both these statements has risen since 2008, suggesting more people now think the complexity of science and the speed of development are making it difficult to keep up, even if people feel capable of doing so. These trends could help to explain why people feel less informed.

Public Attitudes to Science 2011: Main Report
34
© 2011 Ipsos MORI
People also have concerns about the reporting of science. Seven in ten agree that “there is so much conflicting information about science it is difficult to know what to believe” (71%) and that “the media sensationalises science” (70%). The latter has been a consistent concern since 2005. Furthermore, the survey shows that even those who think the information they hear about science “is generally true” are no less concerned than average about conflicting information and the media reporting of science.
Statements relating to information about science
Percentage agreeing
2000 2005 2008 2011
Finding out about new scientific developments is easy these days
36% - 43% 49%
I don‟t think I‟m clever enough to understand science and technology
38% - 35% 32%
I don‟t understand the point of all the science being done today
29% - 27% 15%
Science and technology are too specialised for most people to understand them
66% - 56% 63%
I cannot follow developments in science and technology because the speed of development is too fast
42% - 42% 46%
There is so much conflicting information about science it is difficult to know what to believe
- - - 71%
The media sensationalises science 64% 72% 69% 70%
3.3.5. The Relationship between Information and Positive Attitudes to Science
This section examines the attitudes of those who feel informed versus those who do not. On the face of it, the findings suggest that those who feel informed about science as a whole tend to have more positive attitudes towards science and scientists, being more likely to agree that “the benefits of science are greater than any harmful effect” (58% agree, versus 51% of those not informed), and that “scientists make a valuable contribution to society” (91% versus 85%). Those who feel informed also tend to be more trusting than those who do not, being more likely to think that “the information I hear about science is generally true” (54% versus 41%).
When looking at specific issues in science, the relationship between feeling informed and attitudes to science varies depending on the topic being discussed. For example, on the more contentious issues of GM crops and the use of animals in research (see Section 2.5), feeling informed does not necessarily correlate with a more positive attitude towards these issues. Instead, the people who feel more informed about these more contentious topics tend to be more polarised in their views of the risks and benefits – this group is more likely than average to think the benefits outweigh the risks and more likely than average to think the risks outweigh the benefits.
Those who do not feel informed about specific science topics are not more negative towards them, but instead more likely to be neutral or say they don‟t know if the benefits outweigh the risks. This suggests that a better informed public is less likely to remain neutral on various science issues.
It is worth noting that these results reflect much previous research in this area. Bauer, Allum and Miller (2007) note that on more controversial science topics, there tends to be a greater variance in survey responses among those who feel more informed, i.e. that people in this group are often more negative, not just more positive, than average. They also highlight that “knowledge makes the difference between attitudes and non-attitudes, and not the difference

Public Attitudes to Science 2011: Main Report
35
© 2011 Ipsos MORI
between positive or negative attitudes”.32
3.3.6. The Relationship between Information and Worry about Science
As the previous section discussed, those who feel informed are not always more positive about science, and can sometimes be more negative. The survey examines the extent to which this is the case by asking people whether they agree that “the more I know about science, the more worried I am”. Generally, this does not appear to be the case, with just over half (53%) disagreeing with the statement. The proportion agreeing (24%) has also fallen since 2000, indicating that fewer are worried about what they hear than before. Nevertheless, this still highlights that for a quarter of the population, science communication must be handled carefully so that they do not become more anxious.
4%
20%
21%39%
14%
Figure 12: Information and Worry about Science
Strongly agreeDon‟t know (1%)
Neither/nor
Tend to agree
Strongly disagree
2425
3432
0%
25%
50%
75%
100%
2000
2001
2002
2003
2004
2005
2006
2007
2008
2009
2010
2011
% Agree trend
Tend to disagree
Q Please could you tell me the extent to which you agree or disagree with the following statement?
The more I know about science, the more worried I am
Base for 2011: 2,103 UK adults aged 16+Fieldwork dates for 2011: 11 October-19 December 2010
2000 2005 2008 2011
Those who feel more worried the more they know are more likely to be women (29%, versus 24% overall), older people aged 65+ (33%) and those in social grades DE (33%). Again, among all these groups, it is worth noting that the vast majority still disagree with the statement.
The findings suggest that those who feel less able to understand information about science are the ones that tend to worry about it. People who think they are “not clever enough to understand science and technology” are more likely to feel more worried the more they know (37%, versus 24% overall).
32
Bauer, M. W., Allum, N. and Miller, S. (2007) „What Can We Learn from 25 Years of PUS Survey Research? Liberating and Expanding the Agenda‟, Public Understanding of Science, 16, pp.79-95 [p.84.]

Public Attitudes to Science 2011: Main Report
36
© 2011 Ipsos MORI
4. Trust in Science
The Science and Trust Expert Group has noted that trust in science is multilayered and depends on a variety of factors.33 PAS 2011 explored two aspects of trust in science in particular: trust in the information people see and hear about science, and trust in scientists themselves. This chapter discusses both of these aspects. The key findings are as follows:
Half the public think the information they hear about science is generally true.
Trust in information about science often depends on whether people think it has been checked, by scientists and journalists, and on people‟s perceptions of regulation. It also depends on the source of information.
People tend to trust scientists to follow rules and regulations. However, many still have concerns that scientists do not sufficiently consider the consequences of their work.
People do not feel their trust in scientists has changed considerably over time, with most saying they trust them “about the same as [they] did five years ago”.
4.1. Trust in Information
4.1.1. Do People Trust Information about Science?
By a margin of more than five to one, people agree that the information they hear about science “is generally true” (47% agree, while 9% disagree). However, a third (34%) are undecided, indicating a sizable minority who tend to be sceptical about what they hear.
4%
42%
34%
8%1%
10%
Figure 13: Trust in Information about Science
Neither/nor
Strongly agreeDon‟t know
Tend to disagree
Tend to agree
Strongly disagree
Q Please could you tell me the extent to which you agree or disagree with the following statement?
The information I hear about science is generally true
Base: 2,103 UK adults aged 16+Fieldwork dates: 11 October-19 December 2010
47% Agree9%
Disagree
33
Science and Trust Expert Group (2010) Starting a National Conversation about Good Science, BIS. See: http://interactive.bis.gov.uk/scienceandsociety/site/trust/files/2010/03/BIS-R9201-URN10-699-WEB.pdf.

Public Attitudes to Science 2011: Main Report
37
© 2011 Ipsos MORI
Men are more likely to agree than women (51% versus 42%). Women are by contrast more likely to say they don‟t know (12%, versus 7% of men), rather than disagree.
Black people are more likely than average to disagree that the information they hear about science is generally true (20%, versus 9% overall). This again ties in with their more reserved attitudes towards science noted previously.
4.1.2. Reasons for Thinking Information is True or Not True
The survey asked people who agreed or disagreed that the information they hear about science is generally true why they had given this answer. Responses to these questions were unprompted.
We can see from Figures 14 and 15 that many people do not have specific reasons for trusting or not trusting information. Among those who agree the information they hear is generally true, a third (35%) say this is because they have no reason to doubt it. At the same time, among those who disagree, two fifths say either that they will believe it if they can see it (25%) or that they have no reason to trust it (20%).
More specific issues impacting on trust are perceptions of regulation and whether people think scientific findings have been checked, both by scientists and by journalists. It is therefore possible that raising awareness of how science is regulated and how scientists validate their findings could help to increase trust.
35%
27%
16%
12%
11%
5%
3%
3%
1%
4%
Figure 14: Reasons for Agreeing Information about Science is Generally True
Have no reason to doubt it
It‟s checked by other scientists
Regulation/Science is regulated
It comes directly from scientists
It‟s checked by someone
It‟s checked by journalists
I check the information myself
I trust scientists
No particular reason/That‟s my view
Don‟t know
Q You said that you agree that the information you hear about science is generally true. Why do you say that?
Base: All who agree that the information they hear about science is generally true (990)Fieldwork dates: 11 October-19 December 2010
Top ten unprompted mentions

Public Attitudes to Science 2011: Main Report
38
© 2011 Ipsos MORI
25%
20%
13%
11%
11%
10%
9%
8%
5%
2%
Figure 15: Reasons for Disagreeing Information about Science is Generally True
No proof/evidence/Believe it if I can see it
Have no reason to trust it
It‟s not checked by anyone (unspecified)
It‟s not checked by other scientists
It‟s not checked by journalists
It does not come directly from scientists
Media sensationalism/bias/don't trust the media
Weak regulation/Science is not regulated
Fabricated/con/Government cover-ups
Q You said that you disagree that the information you hear about science is generally true. Why do you say that?
Base: All who disagree that the information they hear about science is generally true (197)Fieldwork dates: 11 October-19 December 2010
Top ten unprompted mentions
No particular reason/That‟s my view
4.1.3. Increasing Trust in Information about Science
The survey also asked what would make people more likely to believe the findings of scientific studies (Figure 16). Half (52%) say they would be more likely to trust scientific findings if they knew other scientists had formally reviewed them. Notably, those who do not think that the information they hear about science is generally true are even more likely to give this response (59%). This suggests there is potential to raise trust in science by raising awareness of peer review.
Just under half (47%) also say they would be more likely to believe scientific findings if they heard the same thing from a number of different sources. This presents a challenge, since there is not always consensus in science. Nonetheless, the findings indicate that people also consider the credibility of sources, with two-fifths (39%) saying they would be more likely to believe findings if they were published in a scientific journal.

Public Attitudes to Science 2011: Main Report
39
© 2011 Ipsos MORI
52%
47%
39%
35%
33%
24%
16%
14%
14%
9%
8%
6%
2%
3%
*%
Figure 16: Increasing Trust in Information about Science
If I knew that the findings had been formally reviewed by other scientists
If I heard the same thing from a number of different sources
If they had been published in a scientific journal
If they fitted in with other things I know already
If I could see the original study for myself
If I saw them on a TV programme
If the research had been done in the UK
If I read them in a broadsheet newspaper
If I had heard of the place where the research was done
If I saw them on the internet
Q Which of these, if any, would make you more likely to believe the findings of scientific studies?
Base: 2,103 UK adults aged 16+Fieldwork dates: 11 October-19 December 2010
If my friends and family thought they were true
If I read them in a tabloid newspaper
Other
Don‟t know
None of these
Young people aged 16-24 are more likely than average to say they would believe scientific findings if they could see the original study (39%, versus 33% overall), if they saw them on the internet (13% versus 9%) and if their friends and family thought they were true (11% versus 8%). This reflects their most regular sources of information – young people are more likely than average to regularly access information on science online and through friends and family (see Section 3.2.1).
The findings also suggest the main drivers of trust differ by ethnicity. People from ethnic minority backgrounds are more likely to say they would believe scientific findings if they heard the same thing from a number of sources than if they knew that findings had been formally reviewed (47% versus 35%).
People from ethnic minority backgrounds also appear to be less interested than White people in knowing the primary sources of science information. They are less likely than White people to say they would believe scientific findings if they were published in a scientific journal (31% versus 40%), if they saw the study for themselves (24% versus 34%) or if they heard of the place where the research was done (8% versus 15%).
4.1.4. Do People Trust Some Sources of Information More than Others?
This section is based largely on the workshops, where we discussed how much participants trusted science information from different sources. To put these findings in context, it is worth noting that the survey finds a widespread suspicion of how the media reports science, with seven in ten (70%) thinking that “the media sensationalises science”.
Workshop participants generally thought that scientific journals were most trustworthy, because they assumed the information in them was checked more rigorously. However, they also felt scientific journals were not accessible to the public, as they were too technical for ordinary people to understand.
At the same time, participants were not especially keen for scientific journals to be more accessible. The few that were interested in seeking them out already tended to be comfortable doing so. Others felt scientific journals were not designed for them, but for scientists, so were never meant to be accessible to non-scientists. Hence, although

Public Attitudes to Science 2011: Main Report
40
© 2011 Ipsos MORI
participants trusted scientific journals, they could not imagine them being a regular source of information about science for most people.
Linked to their view of science journals, some considered science professionals or experts to be very trustworthy sources of information, because they were the ones who wrote scientific journals. However, as Section 4.2 notes, this often depended on the institutions they worked for.
Participants thought science books also tended to be trustworthy sources, but distinguished between science textbooks and popular science books. Some were concerned that popular science books tended to have a lower quality threshold, so were less trustworthy than science textbooks.
“What about popular science? In my field there‟s philosophy and popular philosophy which are two different things. Something like, „Aliens Built the Pyramids‟. That‟s had no peer review before publication.”
Birmingham workshop participant
Many participants were critical of science reporting in newspapers, which they claimed to trust less than other sources. They felt that newspapers often focused on bad news stories about science, and that they were more concerned with attracting readers than with facts (although, as noted previously, this focus on entertainment was often what attracted participants to read about science in the first place). Participants felt this applied to both tabloid and broadsheet newspapers.
However, some thought they had no alternative but to look to newspapers for information about science, since newspapers filtered their information from scientific journals that people would either not understand, or not have the time or inclination to seek out. In addition, participants tended to assume journalists writing about science had a depth of knowledge in the area they were writing about.
Participants trusted television more than newspapers for providing science information, mainly because they felt they could see the evidence for themselves on the screen. Participants thought science documentaries were generally the most trustworthy programmes, expecting documentary makers to have done substantial research on the subject area they were presenting. On the other hand, many were critical of science in adverts, which they felt used scientific terminology to make products sound more effective, while being vague about the evidence behind these claims.
“In the last 50 years there‟s been an increase in the amount of science that isn‟t valid, especially in advertising. They confuse you with the terminology but it‟s not really valid.”
Birmingham workshop participant
Some participants trusted talk radio more than television and newspapers, because they felt that radio programmes had the time to hold more in-depth discussions about scientific issues, and that radio tended to be freer from commercial or political bias than either television or newspapers. However, as noted previously, relative to television and newspapers, only a small number (14%) regularly find out about science through the radio.
Participants were more ambivalent about information from the internet. They thought the internet had many conflicting opinions on the same issues, so it was more difficult to know what to believe. They also had concerns that the internet was open to anyone, whereas they assumed that newspapers relied on experienced journalists (even though journalists are not always science experts). However, a few participants took a structured

Public Attitudes to Science 2011: Main Report
41
© 2011 Ipsos MORI
approach to validating science information online, for example by going to a Wikipedia article and then following references in the article to their source. Some also said they trusted certain websites, such as NHS websites.
4.2. Trust in Scientists
4.2.1. Trust in Scientists to Obey Regulations
Looking at Figure 17 overleaf, we can see that the majority trust scientists to follow rules and regulations. Taking scores across the various institutions, the results are broadly in line with Ipsos MORI‟s Trust in Professions tracker, which has consistently found since 1997 (when scientists were added to the survey) that more than six in ten people trust scientists “to tell the truth”.34
Trust tends to vary more by institution than by profession – whether they are labelled as “scientists” or “researchers” etc appears to have less impact than who they work for. This is also consistent with previous PAS studies, as well as other research, which has found that trust in scientists tends to mirror trust in institutions.35
There appears to be a hierarchy of trust by institution. People tend to trust scientists working at universities the most (84%), followed by scientists working for charities (77%), environmental groups (72%) and the Government (72%). This is in spite of the fact that scientists working for a university featured heavily in the “climategate” controversies in 2009.36 Trust in scientists working for industry is lower (56%), again reflecting previous research in this area.37 This difference between university and industry scientists suggests that people tend not to be aware that many scientists based at universities receive funding from private companies.
The workshop findings give an indication of why trust in scientists working for private companies is relatively low. Firstly, workshop participants tended to assume that private companies were less focused on making scientific discoveries than they were on making money, so were likely to be more secretive with their work. Secondly, before the workshops, participants had had relatively little exposure to industry scientists, so had little to base their trust on. When they did speak with these types of scientists in the workshops, many changed their minds and viewed industry scientists more positively.
In the workshops, a few participants also explained why their trust in Government scientists was relatively low. These participants thought the Government would sack science advisers if they did not say what the Government wanted them to. Here, these participants referred to the resignation of the Government‟s Chief Drugs Adviser in late 2009 as an example of this, which suggests that this issue remains in the public consciousness.
34
See http://www.ipsos-mori.com/researchpublications/researcharchive/poll.aspx?oItemId=15. 35
See for example Poortinga, W. and Pidgeon, N. F. (2003) Public Perceptions of Risk, Science and Governance, in which the authors note that low public trust in Government scientists matched overall distrust of Government. We discuss this topic further in the literature review. 36
The “climategate” controversy was based on allegations that climate scientists at the University of East Anglia (UEA) had manipulated scientific information to strengthen the case for climate change. Various inquiries in 2010 cleared the UEA scientists of withholding information or manipulating data. 37
Whitmarsh and Kean (2005) Connecting Science: What We Know and What We Don‟t Know about Science in Society, British Association for the Advancement of Science [p.25.]

Public Attitudes to Science 2011: Main Report
42
© 2011 Ipsos MORI
25
24
23
25
20
20
19
15
13
9
58
60
61
57
57
52
54
56
57
47
10
10
9
10
15
19
19
20
21
32
2
2
1
2
2
5
3
2
3
6
4
5
6
6
6
5
5
6
7
6
Figure 17: Trust in Different Types of Scientists to Follow Rules and Regulations
Q How much, if at all, do you trust each of the following to follow any rules and regulations which apply to their profession?
Scientists working for Government
% A great deal % A fair amount % Not very much
% Not at all % Don't know
Scientists working for private companies
Scientists working for universities
Scientists working for charities
Scientists working for environmental groups
Base: 2,103 UK adults aged 16+Fieldwork dates: 11 October-19 December 2010
Engineers working for universities
University lecturers
Engineers working for private companies
Researchers working for Government
Researchers working for universities
% Great
deal/fair
amount
72%
56%
84%
77%
72%
84%
82%
70%
72%
84%
Men tend to be more trusting than women of each of these groups of scientists (although the majority of both men and women do trust them). The exceptions to this are scientists working for environmental groups and researchers working for Government, where there is little gender difference. Those in the lowest social grades (DEs) also tend to be less trusting than average of all the different groups of scientists asked about.
Young people aged 16-24 come across as more trusting of “scientists” across the various institutions asked about, with the exception of scientists working for charities (where there is little difference by age). Similarly, people aged 16-24 tend to be slightly more trusting of “university lecturers” than average (85% versus 82%), possibly because there are more students in this age group. With “engineers” and “researchers” however, there is less difference in trust by age.
We might expect people who are sceptical about climate change to be less trusting of scientists. However, those who agree that “human activity does not have a significant effect on the climate” are just as likely as average to trust either scientists working for universities, for Government or for environmental groups. They are however more likely than average to trust scientists working for private companies (62%, versus 56% overall).
4.2.2. Trust in Scientists to Consider the Implications of their Work
As well as looking at trust in scientists to obey regulations, the survey also explored whether people think scientists consider the implications of their research before proceeding. This emerged as an important dimension of trust in the workshops – participants thought that in order for scientists to do “good science”, they needed to have good intentions, and needed to consider the wider social and ethical implications of their work.
When asked specifically about the “risks of new technologies”, over six in ten (64%) are confident that UK scientists have thoroughly considered the risks. Just three in ten (31%) are not confident.

Public Attitudes to Science 2011: Main Report
43
© 2011 Ipsos MORI
11%
53%
23%
7%4%
Figure 18: Confidence in Scientists to Consider the Risks of New Technologies
Not very confident
Very confidentDon‟t know
Not at all confident
Fairly confident
It depends on the area they work in (2%)
Q How confident, if at all, are you that scientists in the UK have thoroughly considered the risks of new technologies before they are used?
Base: 2,103 UK adults aged 16+Fieldwork dates: 11 October-19 December 2010
64% Confident
31% Not confident
Those who are less confident that scientists have considered the risks are more likely to come from social grades C2DE (37% not confident, versus 31% overall). Black people are also less confident than average (49% not confident).
However, when looking at whether people think scientists consider the implications of their work more generally, concern is higher. As Figure 19 below shows, four in ten (41%) agree “scientists seem to be trying new things without stopping to think about the consequences”, while just three in ten (30%) disagree. The proportion agreeing has however declined since 2000, suggesting people are less worried about this than before.
7%
33%
25%
26%
4%4%
Figure 19: Perceptions that Scientists Consider the Consequences of their Work
Q Please could you tell me the extent to which you agree or disagree with the following statement?
Scientists seem to be trying new things without stopping to think about the consequences*
Strongly agreeDon‟t know
Neither/nor
Tend to agree
Strongly disagree
4142
6156
0%
25%
50%
75%
100%
2000
2001
2002
2003
2004
2005
2006
2007
2008
2009
2010
2011
% Agree trend
Tend to disagree
Base for 2011: 2,103 UK adults aged 16+Fieldwork dates for 2011: 11 October-19 December 2010* "Scientists seem to be trying new things without stopping to think about the risks" in 2008, 2005 and 2000
2000 2005 2008 2011

Public Attitudes to Science 2011: Main Report
44
© 2011 Ipsos MORI
Some groups are more likely to be concerned that scientists do not think about the consequences. Both those in social grades DE (50%) and Black people (58%) are especially more likely to agree with this statement than average (41%).
4.2.3. Do People Feel Trust Has Changed Over Time?
People generally do not think their trust in scientists has shifted considerably compared to five years ago, with seven in ten (69%) saying they personally trust scientists “about the same”. Moreover, the proportion saying they trust scientists more than they did five years ago is around twice the proportion that says they trust them less (18% versus 10%).
Figure 20: Trust in Scientists Compared to Five Years Ago
Q Would you say you personally trust scientists more or less, or about the same as you did five years ago?
Base: 2,103 UK adults aged 16+Fieldwork dates: 11 October-19 December 2010
4%
14%
69%
8%3%
About the same
Trust them much more
Don‟t know
Trust them a little less Trust them a little more
Trust them much less (2%)18% Trust
more10% Trust less
Again there are differences by age. Younger people aged 16-24 are more likely than average to say they personally trust scientists more (29%, versus 18% overall). Older people aged 75+ are more likely to say they trust them less (15%, versus 10% overall).
Once more, those who agree that “human activity does not have a significant effect on the climate” do not tend to respond differently from the average. This suggests that, while it may have affected trust in climate science, “climategate” has had little long-term impact on how much people feel they trust scientists as a profession.

Public Attitudes to Science 2011: Main Report
45
© 2011 Ipsos MORI
5. Regulating Science
This chapter examines people‟s perceptions of regulation, including how aware they are of it, what they expect from it and how confident they are in it. The key findings are as follows:
People tend to assume that science is regulated, but are not always aware how or who by. The findings suggest people want to know more about the role that scientists themselves play in regulation.
The public‟s priorities for regulation tend to focus on avoiding conflicts of interest between scientists and their funders, and ensuring scientific research is not harmful. This suggests people would be interested in knowing more about the role of ethics committees and peer review in the scientific process.
Though the public has reservations about whether regulation can ever police what scientists do behind closed doors, most are confident that scientists across different institutions are well regulated. They are, however, more concerned about the regulation of scientists working for private companies than for other institutions.
5.1. Awareness of Regulation
5.1.1. Awareness of the Existence of Regulation
We can see from Figure 21 that, across different areas of science, people tend to think there is regulation in place. However, the fact that people do not on balance believe that medicines must be tested on animals before humans under UK law (which is in fact true for prescription drugs) highlights that the public is not always aware of important legislation that regulates science. Even among those who feel informed about the use of animals in research (asked about earlier in the survey), 50% answer incorrectly for this statement, while 38% answer correctly.
86
79
72
72
3649
14
14
12
6
Figure 21: Awareness of Legislation Regulating Science
UK law states that all medicines must be tested on animals before being used on
people [true]
The Government does not regulate the disposal of radioactive waste in the UK
[false]
The testing of new drugs on people is not regulated in the UK [false]
Any scientist in the UK can carry out experiments on animals without a
licence [false]
You need a licence before you can plant genetically modified (GM) crops in the
UK [true]
% Incorrect % Correct
Q I am going to read out a number of statements. For each one, I would like you to tell me whether you think it is true or false.
Base: 2,103 UK adults aged 16+Fieldwork dates: 11 October-19 December 2010
Net correct
-12
+57
+67
+80
+58

Public Attitudes to Science 2011: Main Report
46
© 2011 Ipsos MORI
Across all the statements, those in social grades DE and Asian people are more likely than average to say they don‟t know whether the statement is true or false. Women are also more likely than men to say they don‟t know, except on both statements about animal testing (where there is little gender difference).
5.1.2. Perceptions of Who Regulates versus Who Should Regulate
When asked, unprompted, who sets the rules and regulations for UK scientists, most people (67%) spontaneously think of Government regulation. Few think of self-regulation by scientific professional bodies (13%) or scientists themselves (8%), and very few can name the specific bodies in place such as ethics committees (5%). Indeed, most people (51%) give a single answer at this question, so tend not to be aware that regulation comes from a variety of bodies.
62%
13%
8%
5%
5%
5%
5%
5%
4%
21%
Figure 22: Perceptions of Who Regulates Science
The Government/Government agency/department/quango
Scientific professional bodies
Scientists themselves
The European Union (EU)/Brussels
Parliament/Westminster/Scottish Parliament/ Welsh Assembly/Northern Ireland Assembly
Ethics Committees
Health and Safety Executive (HSE)
Research Councils
Business/industry/companies/the companies the scientists work for
Don‟t know
Q As far as you know, who, if anyone, sets the rules and regulations for scientists in the UK to follow when they are doing their job?
Top ten unprompted mentions
Base: 2,103 UK adults aged 16+Fieldwork dates: 11 October-19 December 2010
Various groups are more likely to say they don‟t know who regulates science. This is most apparent among older people aged 75+ (36% don‟t know, versus 21% overall) and among the less affluent in social grades DE (27% don‟t know).
The survey also asked who people think should set the rules and regulations for UK scientists. We can see from Figure 23 that more think scientific professional bodies and scientists themselves should regulate science (19% and 15% respectively) than think this is already happening (13% and 8% respectively). This reiterates the finding that the public would be interested in knowing more about the self-regulation that goes on in science, through systems such as peer review.

Public Attitudes to Science 2011: Main Report
47
© 2011 Ipsos MORI
Figure 23: Perceptions of Who Regulates Science Versus Who Should Regulate
Q As far as you know, who, if anyone, sets/should set the rules and regulations for scientists in the UK to follow when they are doing their job?
Base: 2,103 UK adults aged 16+Fieldwork dates: 11 October-19 December 2010
62%
13%
8%
5%
5%
5%
5%
5%
5%
21%
51%
19%
15%
8%
6%
6%
5%
5%
3%
11%
The Government/Government agency/department/quango
Scientific professional bodies
Scientists themselves
The general public
Parliament/Westminster/Scottish Parliament/ Welsh Assembly/Northern Ireland Assembly
Ethics Committees
Health and Safety Executive (HSE)
Research Councils
Business/industry/companies/the companies the scientists work for
Don‟t know
Top ten unprompted mentions
% saying who regulates
% saying who should regulate
5.2. Priorities for Regulation
At the workshops, we explored participants‟ priorities for the regulation of science. Many participants wanted regulation to deal primarily with conflicts of interest between scientists‟ research and the priorities of their funders. They suggested there should be an independent review of the outcomes of scientific research, to ensure that scientists were not manipulating results for the benefit of their funders. Again, this suggests it would be beneficial for people to know more about the role peer review plays in this process.
The concern about conflicts of interest is also strongly reflected in the survey. Three-quarters (76%) agree that “the independence of scientists is often put at risk by the interests of their funders” and eight in ten (78%) agree that “when publishing the results of research, scientists should always state how they were funded”.
Many workshop participants also wanted regulators to ensure that scientists conducted their work safely. This involved checking that scientists were not harming people, animals, or the environment both during their research, e.g. during clinical trials, and through any new technologies that they developed. Here, participants did not spontaneously mention ethics committees or frameworks, and tended to be unaware of their existence.
5.3. Confidence in Regulation
Many people are sceptical about whether regulation can ever police what scientists choose to do behind closed doors, with over half (54%) thinking that “rules will not stop scientists doing what they want behind closed doors”. However, to put this in context, the survey also finds that the public generally trusts scientists to follow the rules and regulations of their profession, as discussed in Section 4.2.1.
As we can see in Figure 24, confidence that scientists are well regulated tends to be high, with more confident than not. The exception is with scientists working for private companies, where results are less clear-cut. As we saw with trust in scientists, we again see

Public Attitudes to Science 2011: Main Report
48
© 2011 Ipsos MORI
a hierarchy of confidence by institution, with people most confident in the regulation of university scientists (80%), followed by scientists working for charities (70%), environmental groups (65%), Government (62%) and industry (48%).
13
11
14
7
57
55
48
42
12
17
22
23
32
3
4
5
9
13
1
1
1
2
2
5
7
6
5
5
20 62
Figure 24: Confidence in the Regulation Different Types of Scientists
Scientists working for private companies
Scientists working for universities
Scientists working for charities
Scientists working for environmental groups
Scientists working for Government
% Very confident % Fairly confident
% Not very confident% Not at all confident
% It depends on the area they work in
% Don't know
Q How confident, if at all, are you that the work of the following groups of people is well regulated in the UK?
Base: 2,103 UK adults aged 16+Fieldwork dates: 11 October-19 December 2010
% Confident
80%
70%
62%
65%
48%
Women tend to be less confident than men of the regulation of scientists working for universities, for Government and for private companies. Young people aged 16-24 tend to be more confident than average that each group of scientists is well regulated, with the exception of scientists from charities (where there is no perceptible difference by age).

Public Attitudes to Science 2011: Main Report
49
© 2011 Ipsos MORI
6. Public Consultation and Involvement
in Science
This chapter examines people‟s perceptions of public consultation on science and the extent to which they want to be involved in consultation and dialogue. The key findings are as follows:
People are often confused as to what public consultation on science means, and many are cynical about what it can achieve. However, in principle people do think that the Government should act in accordance with public concerns about science.
Despite cynicism, people see various benefits, for individuals and for society, from the public becoming more involved in decision-making. However, some think that lack of public understanding and interest in science are barriers to this happening.
Many think the public is not consulted enough about science. However, people generally want to know that other members of the public are being consulted, but not necessarily get involved themselves.
While most people think the Government should take on board the views of ordinary people, many believe they should ultimately place greater importance on experts and on scientific evidence than on public opinion.
6.1. Awareness and Understanding of Public Consultation
6.1.1. What People Associate with Public Consultation on Science
Many are confused as to what “public consultation on science” means, with two-fifths saying either that they don‟t know (17%), saying nothing (16%), or saying they have never heard of it (5%) when asked unprompted. Outside of this, people tend to give commonsense answers, such as “asking the public” (18%) or “consulting the public” (16%). This is likely to stem from a lack of understanding of public consultation in general, which the 2008 study also found.
The less affluent in social grades DE and young people aged 16-24 tend to have less of an idea of what public consultation is, being more likely than average to say they don‟t know (28% and 26% respectively, versus 17% overall).
6.1.2. Cynicism about Public Consultation
There is a high degree of cynicism about public consultation (Figure 25). Half (51%) agree that public consultation events “are just public relations activities and don‟t make any difference to policy” and almost half (47%) think that they “are unrepresentative of public opinion”. This is nonetheless in line with responses in the previous two studies, suggesting people have remained consistent in their views about consultation since 2005.
These figures must be seen in context however. As noted, people tend not to know what public consultation on science is, so their cynicism may just reflect a negative attitude towards something they do not understand, and anything associated with Government in general. Moreover, when asked in a less direct way whether the Government should take on board the public‟s views, people tend to be supportive – around three-quarters (73%) think “the Government should act in accordance with public concerns about science and technology”.

Public Attitudes to Science 2011: Main Report
50
© 2011 Ipsos MORI
18
10
7
55
41
41
16
24
29
7
17
15
1
2
1
3
6
8
Figure 25: Attitudes towards Public Consultation Generally
Public consultation events are just public relations
activities and don‟t make any difference to policy
Public consultation events are unrepresentative of
public opinion
The Government should act in accordance with public concerns
about science and technology
Base: 2,103 UK adults aged 16+Fieldwork dates: 11 October-19 December 2010
Q For each of the statements, please could you tell me the extent to which you agree or disagree?
% Strongly agree % Tend to agree % Neither/nor
% Tend to disagree % Strongly disagree % Don't know % Agree
73%
47%
51%
Young people aged 16-24 tend to be less cynical about public consultation, being less likely than average to agree that public consultations are public relations activities, or that they are unrepresentative. In both cases, they tend to be more ambivalent or say they don‟t know, perhaps because they have less of an understanding of what public consultation on science is than average.
6.2. Perceived Benefits of Public Involvement
As Figure 26 overleaf illustrates, people see a variety of benefits to greater public involvement in decision-making about science, with two-fifths (42%) giving more than one response unprompted, and just six per cent saying nothing. The main benefits people mention are about allowing the public to make informed decisions about their lives (15%) and enabling them to better judge science issues for themselves (13%), indicating that people tend to value what they could personally get out of becoming more involved.
People also see benefits to society as a whole from greater public involvement. These include promoting interest or understanding in science (11%), medical benefits (8%) and better science education in schools (7%).

Public Attitudes to Science 2011: Main Report
51
© 2011 Ipsos MORI
15%
13%
12%
11%
8%
8%
7%
7%
6%
19%
Figure 26: Perceived Benefits of Public Involvement in Science Decision-making
Enables the public to make informed decisions about their lives
Enables the public to judge science issues for themselves
Better decision-making
Promotes interest in/understanding of science
Medical benefits
Greater/quicker scientific progress and adoption of technologies
More balanced debate
Better science education in schools
Nothing
Don‟t know
Q What, if any, would you say are the main benefits to society from having greater public involvement in decision-making about science?
Base: 2,103 UK adults aged 16+Fieldwork dates: 11 October-19 December 2010
Top ten unprompted mentions
Older people tend to cite medical benefits more than average (12% of those aged 75+, versus 8% overall), perhaps reflecting that they tend to think about science in terms of health and cures for diseases (see Section 2.1.1).
Those in social grades AB, who already tend to be more interested in science, are more likely than average to say that it promotes interest in science (15%, compared with 11% overall). By contrast, those in social grades DE are more likely to say they don‟t know what the benefits are (33%, versus 19% overall).
6.3. Perceived Barriers to Public Involvement
When asked (unprompted) what the main barriers to having greater public involvement in decision-making about science are (Figure 27), the most common reason offered is that the public does not understand science (26%). A few mention specific barriers related to public understanding, such as the use of scientific jargon etc (6%) and the lack of communication skills of scientists (6%). Around one in five (19%) think the public are not interested. These views contrast with the findings in the rest of the survey, which suggest that there is a high level of interest in science, and that most feel personally capable of processing the information they get about science.

Public Attitudes to Science 2011: Main Report
52
© 2011 Ipsos MORI
26%
19%
9%
7%
7%
6%
6%
6%
5%
19%
Figure 27: Perceived Barriers to Public Involvement in Science Decision-making
Public‟s lack of understanding of science/scientific processes
Lack of public interest in science
Lack of awareness among scientists of the public‟s understanding of science
Public don‟t have time
Government policy
Scientific jargon
Lack of communication skills among scientists
Mistrust of politicians/decision makers
Level of public concern about science
Don‟t know
Q What, if any, would you say are the main barriers to having greater public involvement in decision-making about science?
Base: 2,103 UK adults aged 16+Fieldwork dates: 11 October-19 December 2010
Top ten unprompted mentions
The more affluent (ABs) and those with a higher education are both more likely to state lack of public understanding as a barrier than average (38% of both groups, versus 26% overall). This is also a far more common response among those who describe themselves as scientists, with three-fifths (59%) saying it is one of the main barriers.
There are also differences by ethnicity. Black people and Asian people are less likely than White people to view lack of public understanding as a barrier (14% and 16% respectively, versus 27% of White people) but are more likely to cite Government policy as a barrier (18% and 13% versus 6%).
6.4. Do People Want to Be Involved?
6.4.1. Public versus Personal Involvement
People think it is important for scientists to listen to ordinary people, with two-thirds (66%) agreeing that “scientists should listen more to what ordinary people think”. Moreover, people appear keen for there to be more public dialogue on science, with just under a fifth (17%) thinking that “the public is sufficiently involved in decisions about science and technology”, and half (52%) disagreeing.
However, when people respond to the above statements, they may be referring to the public at large, rather than to themselves. When asked if it is important for them personally to be involved, there is little consensus. Only around a third (35%) agree that “for me, it is important to be involved in decisions about science and technology”, while a similar proportion (33%) disagree.

Public Attitudes to Science 2011: Main Report
53
© 2011 Ipsos MORI
20
6
2
46
29
15
18
29
24
13
25
42
2
8
10
2
3
7
Figure 28: Attitudes towards Public Involvement in Decisions about Science
Scientists should listen more to what ordinary people think
The public is sufficiently involved in decisions about
science and technology
For me, it is important to be involved in decisions about
science and technology
Base: 2,103 UK adults aged 16+Fieldwork dates: 11 October-19 December 2010
Q For each of the statements, please could you tell me the extent to which you agree or disagree?
% Strongly agree % Tend to agree % Neither/nor
% Tend to disagree % Strongly disagree % Don't know % Agree
66%
17%
35%
Indeed, when asked directly how involved they would like to be in public consultation on science issues, generally people want to know that public is being consulted, but not necessarily get involved themselves (50%), as Figure 29 overleaf shows. This finding chimes with much existing research on involvement in public policy issues – people generally want to know there are opportunities to get involved, and that others are involved, but don‟t want to be involved personally.38
There is nonetheless potential for much of the public to become more involved. A fifth (21%) say they would like to have more of a say, and seven per cent say they would like to be actively involved. It will nonetheless be important to consider how involvement might be widened across more of the public.
38
See for example the Hansard Society‟s (2009) Audit of Political Engagement 6 (http://www.hansardsociety.org.uk/files/folders/1755/download.aspx), which found that 55% of British adults did not want to be involved in national decision-making.

Public Attitudes to Science 2011: Main Report
54
© 2011 Ipsos MORI
7%
2%
21%
50%
17%
4%Don‟t know
I‟m not interested in public consultation on science issues, as long as scientists are doing
their jobs
I would like to know that the public are consulted on science issues, but I don‟t want to be involved
personally
I would like to have more of a say in science issues
I would like to become actively involved in public consultations on science issues
I am already actively involved in public consultations on science issues
Base: 2,103 UK adults aged 16+Fieldwork dates: 11 October-19 December 2010
Q Which of these statements, if any, comes closest to your own attitude to public consultation on science issues?
Figure 29: Getting Personally Involved in Public Consultation on Science
Some groups tend to be less convinced about the need for public consultation on science issues. People aged 75+ (27%) and those from social grades DE (29%) are especially more likely than average (17%) to think that public consultation is not necessary, as long as scientists are doing their jobs.
By contrast, those who would like to get more involved, either by just having their say or being actively involved, tend to be men (32%, versus 28% overall), young people aged 16-24 (32%) and the more affluent in social grades AB (34%). Those from ethnic minority backgrounds (44%) are also more likely than White people (26%) to want to be more involved either actively, or just by having more of a say.
6.4.2. Public versus Expert Opinion
The data suggest that, while much of the public thinks the Government should take on board the views of ordinary people, many believe the Government should defer to experts and to scientific evidence above public opinion (Figure 30). As noted previously, around three-quarters (73%) think that “the Government should act in accordance with public concerns about science and technology”. However, almost two-thirds (64%) also think “experts and not the public should advise the Government about the implications of scientific developments”, while almost half (45%) agree that “politicians should put scientific evidence above public opinion when making decisions”.
The proportion saying the Government should act in accordance with public concerns has fallen by six percentage points since 2008. Over the same period, more people strongly agree that experts and not the public should advise the Government (17%, versus 11% in 2008). This suggests an increased demand for expert, rather than public involvement in decision-making. It is important to acknowledge that this comes after considerable media coverage in late 2009 over the Government‟s dismissal of its Chief Drugs Adviser, Professor David Nutt – the Government‟s perceived mishandling of expert advice during this period may have had an impact on results.

Public Attitudes to Science 2011: Main Report
55
© 2011 Ipsos MORI
18
17
11
55
46
34
16
21
25
7
9
20
1
1
5
3
4
4
Figure 30: Public Opinion Versus Expert Opinion and Scientific Evidence
The Government should act in accordance with public concerns
about science and technology
Experts and not the public should advise the Government about the
implications of scientific developments
Politicians should put scientific evidence above public opinion
when making decisions
Base: 2,103 UK adults aged 16+Fieldwork dates: 11 October-19 December 2010
Q For each of the statements, please could you tell me the extent to which you agree or disagree?
% Strongly agree % Tend to agree % Neither/nor
% Tend to disagree % Strongly disagree % Don't know % Agree
73%
45%
64%
Those aged 16-24 are less likely than average to agree that politicians should put scientific evidence above public opinion (39%, versus 45% overall). Those aged 75+ are more likely to agree (53%).
There are again differences by affluence and level of education. Those from social grades AB (53%) and those with a higher education (51%) are also more likely than average to agree that politicians should put scientific evidence above public opinion.
6.4.3. Do People Think They Can Influence Science Policy?
Despite people tending to want scientists and the Government to act in line with the public‟s views, they tend not to feel they have much power over decision-making. Under two in ten (14%) agree that they “could influence Government policy on science if I wanted to”, while seven in ten (68%) disagree.

Public Attitudes to Science 2011: Main Report
56
© 2011 Ipsos MORI
13%
15%
40%
28%
3%
Figure 31: Perceived Influence over Government Policy on Science
Neither/nor
Strongly agree (1%)Don‟t know
Tend to disagree
Tend to agree
Strongly disagree
Q Please could you tell me the extent to which you agree or disagree with the following statement?
I feel I could influence Government policy on science if I wanted to
Base: 2,103 UK adults aged 16+Fieldwork dates: 11 October-19 December 2010
14% Agree
68% Disagree
Some groups are somewhat more likely to agree they could influence policy, including those who have done a science-related activity in the past 12 months (16%, versus 14% overall) and those who feel they trust scientists more than they did “five years ago” (18%).
Those that want to get more involved in decision-making, either by just having their say or being actively involved, are also more likely to feel they can influence policy (22% agree, versus 14% overall). This indicates that feeling able to influence policy could be a driver of public engagement with science.
However, it is important to acknowledge that people may not see consultation or dialogue on science issues as primarily about the public influencing Government policy. Instead, the workshop findings indicate that people have different motivations for attending dialogue events. Many workshop participants said they had attended simply to know more about how science is being done, especially in order to counteract what some saw as “dumbed-down” science information available in the mainstream media. This suggests that influencing decisions is not the only driver of public engagement with science.

Public Attitudes to Science 2011: Main Report
57
© 2011 Ipsos MORI
7. Science in People’s Lives
This chapter explores how people see science impacting on their daily lives, through its relationship with culture, leisure, education, careers and the wider economy. The key findings are as follows:
People tend not to have considered the role of science in culture, but on reflection many see science as an integral part of people‟s lives.
Half the public have engaged in a science-related leisure activity in the past 12 months. People tend to view these as a family day out, rather than a regular leisure activity or an activity to do with friends.
People are divided over whether their science education has been useful in their daily lives and in their jobs. They are also divided over the quality of science teaching relative to other subjects. Here, opinions appear to strongly depend on people‟s perceptions of their science teachers.
On the whole people see careers in science and engineering as desirable, though young people tend to respond less enthusiastically.
The public acknowledges that science benefits the economy and creates jobs, but there is little understanding of how this happens in practice.
People view Government funding of science as important, although their views on what research to prioritise appear to have changed in light of the Government cutting public spending overall.
7.1. Science in Entertainment and Culture
This section is based on findings from the workshops, where we explored how participants saw science fitting in with entertainment and culture. Many participants admitted they had changed their view on this based on the workshop discussions and on the homework tasks they had completed – whereas before, they had generally not considered the role of science in culture, at the end of the workshops many acknowledged that science was an integral part of people’s lives.
“Before, science was the Bunsen burner, nothing else, and then I thought it‟s everything: gardening, food, glasses.”
Birmingham workshop participant
When asked to think about what society might lose if science disappeared, participants identified various cultural benefits from science, varying from tangible benefits of technology to the more abstract impact of science and scientific thinking on social relations. These included the following:
Many thought removing science would seriously affect people‟s quality of life. Again people tended to think of this in terms of how they conceptualised science, so older participants often thought of losing the medical advances brought about by science, whereas younger participants tended to consider the loss of technologies and gadgets.
Participants thought that science enhanced entertainment and popular culture. This was discussed in two ways. Firstly, some noted that specific technological advances had led to improvements in other areas of culture, such as in art, music and television.

Public Attitudes to Science 2011: Main Report
58
© 2011 Ipsos MORI
Secondly, some also thought that science as a whole played an important role in entertainment. For instance, many participants acknowledged the science aspect of programmes such as Grand Designs (suggested viewing in the homework tasks), and said that science helped the programme to be more interesting and entertaining. For some, seeing it as entertainment also reminded them that science was not necessarily dull.
“I watched a science programme that shows how a microchip is made. The programme is very interesting … It shows that science is not a dry stuffy subject and can have a lot of humour in it.”
Birmingham workshop participant
Some felt that without science the public would lose informed public debate. They thought that it was an understanding of science that equipped the public with the tools and ability to challenge the status quo, politically or culturally. For instance, some thought that without a scientific discourse it would become more difficult for people to challenge superstitions.
Some participants felt the loss of science would change the art of conversation drastically, for example through the loss of conversations about the weather or the loss of popular science books. They felt the impact of this would be hard to quantify since it was so wide-reaching.
Finally, some saw science as part of a national cultural heritage. Some participants saw an inherent Britishness within inventiveness, which they saw as part of science and also part of British culture, extending back to the industrial revolution. There was a mixed reaction to this notion however, with others saying that science was globalised and no more special to Britain than to any other nation.
7.2. Science as a Leisure Activity
7.2.1. Popularity of Science Activities Relative to Other Activities
In the past 12 months, half the public (50%) have engaged in at least one of the science activities39 asked about in the survey. The most popular of these are visiting the zoo (26%) or a science museum (22%). Other less popular science activities included attending a lecture or talk on a science-related subject (12%), a science or discovery centre (11%), a laboratory (8%), a planetarium (6%), a science festival (3%) or any other science-related activity (12%).
Science activities do tend to be less popular than some of the other activities asked about. In particular, fewer say they have visited either science museums or science and discovery centres (27%) than have been to art galleries (31%). Figure 32 overleaf charts the full list of activities explored in the survey.
In the workshops, participants had mixed impressions of science museums and centres.40 Some found them old-fashioned, while others thought they had gone to great efforts to engage their audience with more interactive exhibits. Some younger participants also
39
Of the activities asked about, we defined the following as “science activities”: lectures/talks on science-related subjects outside school/college/university, planetariums, science activities at school/college/university outside of regular classes, science and discovery centres, science festivals, science museums and zoos. 40
Here, participants did not distinguish between science museums and science and discovery centres (where the latter are not necessarily museums).

Public Attitudes to Science 2011: Main Report
59
© 2011 Ipsos MORI
mentioned that science museums and centres tended to be for people who were already interested in science.
Figure 32: Participation in Science-related Leisure Activities
49%
42%
41%
40%
32%
31%
30%
27%
26%
24%
22%
22%
12%
11%
11%
6%
3%
3%
Q Which, if any, of the things on this list have you visited or attended in the last 12 months?
Base: 2,103 UK adults aged 16+Fieldwork dates: 11 October-19 December 2010* Activity takes place outside of regular classes at school/college/university
Library or archive
Historic house or garden
Tourist attraction or visitor centre
Theatre
Art gallery
Theme park
Sporting even as a spectator
Music festival
Another type of museum (not art or science)
Zoo
Live concert
Science museum
Lecture/talk on science-related subject*
Science and Discovery Centre
Science activity at a school/college/university*
Planetarium
Literature festival
Science festival
Science-related activities
Non science-related activities
Those aged under 45 are more likely than average to have done a science-related activity (59%, versus 50% overall), while those aged 55+ are less likely (37%). This is perhaps related to the number of young people who may have engaged in one of these activities through school, or parents who have visited with their children. Indeed, those who have children in the household are more likely than those who do not to have done a science activity in the last 12 months (66% versus 43%).
There are also differences by affluence. Two-thirds (66%) of those in social grades AB have engaged in a science-related activity, compared with just one third (32%) of those in social grades DE. In the workshops, some of the less affluent participants outside of London (where many science venues offer free access) mentioned that they did not go to their local science activities because of the cost, and that they would go if they were free.
There are differences in science as a leisure activity by geographic area, though perhaps not as we might expect. People living in London are not especially likely to have attended or visited a science activity (48% have done so, versus 50% on average), despite their proximity to various science museums and centres. By contrast, those who live in the East of England (64%) or in the South West (61%) are more likely than average to have done so, despite there being relatively few science venues in these regions. Broadly speaking, those in the North of England are less likely to have done one of these science activities, including those in Yorkshire and Humberside (42%) and the North East (36%).
It is also worth noting that there is considerable overlap between the populations that visit science-based venues and arts-based venues. For instance, of the 27% that have visited a science museum or science and discovery centre in the past 12 months, half (50%) have also been to an art gallery.

Public Attitudes to Science 2011: Main Report
60
© 2011 Ipsos MORI
7.2.2. Frequency of Visits to Science Activities
Most of those who have visited science museums or science and discovery centres have done so just once in the last 12 months (61% and 70% respectively). This suggests that people consider visiting a science museum or discovery centre as a special outing rather than a regular leisure activity.
Nonetheless, many have engaged in these activities more than once in the last 12 months. Four in ten (39%) visitors to science museums and three in ten (29%) of those who have visited science discovery centres went more than once in 12 months. However, people are more likely to have visited art galleries or other museums more than once in the last 12 months (62% and 57% respectively).
However, when it comes to more niche science activities, most people who have gone to these tend to have been more than once. For example, three-fifths (59%) of those who have been to a lecture or talk on a science-related subject had been to more than one in the last 12 months. This indicates a minority of people who are very interested in science, who will actively seek out further information on it on a regular basis.
7.2.3. Who People Go With to Science Activities
The findings suggest that science activities are primarily seen as family leisure activities. The majority of those have been to a science museum, discovery centre, zoo or planetarium went with other family members, primarily children or partners, rather than with friends. In addition, people are less likely to do science activities with friends than to visit an art gallery, the theatre, a live concert or a sporting event with them.
There are also indications that people see science as an activity for boys rather than girls. Looking at all the science-related activities asked about, people who have engaged in any of these activities are more likely to have done so with their sons than their daughters (30% versus 26%). By contrast, people are somewhat more likely to have taken their daughters than their sons to art galleries (10% versus 14%).
7.3. Studying Science
7.3.1. The Impact of Science Education
This section discusses perceptions of science in schools.41 The importance of science education came across in the workshops, with participants saying that their exposure to science in school greatly influenced their current interest in the subject, and how empowered they felt to engage with scientific issues. Personalities of science teachers in particular shaped participants‟ perceptions of science.
The importance of science education is also apparent in the survey findings (Figure 33), where a quarter (24%) agree that “school put me off science”. This is somewhat higher than in 2008 (21%) and 2005 (20%).
41
In this section, we concentrate on science and maths as school subjects, in line with terminology used by the Department for Education (DfE), rather than taking the broader definition of science we have used throughout the rest of the report.

Public Attitudes to Science 2011: Main Report
61
© 2011 Ipsos MORI
Figure 33: Impact of School on Attitudes to Science
Base for 2011: 2,103 UK adults aged 16+Fieldwork dates for 2011: 11 October-19 December 2010
20 21 24
0%
25%
50%
75%
100%
2005 2006 2007 2008 2009 2010 2011
Q Please could you tell me the extent to which you agree or disagree with the following statement?
School put me off science
8%
17%
14%
34%
26%
1%
Strongly agreeDon‟t know
Neither/nor
Tend to agree
Strongly disagree
% Agree trend
Tend to disagree
Women are more likely to agree that school put them of science than men (30% versus 18%), which suggests that their disengagement from science seen elsewhere in the survey stems from their school experience. Those from social grades DE are also slightly more likely than average to think this (29%, versus 24% overall).
Young people aged 16-24 are more likely than average to say school put them off (29%, versus 24% overall). However, this does not necessarily indicate that science teaching has got worse (see Section 7.3.3) – it may simply reflect that this age group can more easily recall their more recent experiences in school.
7.3.2. The Perceived Usefulness of Studying Science
As Figure 34 overleaf shows, people are divided over whether the science they learned at school is useful in their everyday lives, with slightly more thinking it was useful than not (44% versus 36%). People are more likely to see maths as useful in their daily lives (67%).42
People are no more certain about how useful school science has been for their job, with around two-fifths thinking it has been useful (37%) and a similar proportion saying it has not been useful (42%). Again, more people (66%) think maths has been useful in their jobs. As expected, this very much depends on people‟s occupations – those who describe themselves as scientists or engineers, or who say they work with scientists or engineers, are unsurprisingly all more likely to agree that the science and maths they learnt has been useful in their jobs.
The similarity of answers when relating to people‟s jobs or to their everyday lives suggests that people do not really distinguish between the two – if something is useful in work, it is useful in their everyday lives. This suggests that highlighting how science is useful in different types of jobs, including those not conventionally considered jobs in science, might make more people consider how important science is in people‟s everyday lives.
42
These questions asked respondents whether science or maths has not been useful in their everyday lives, so those who think it has been useful are disagreeing with the statements.

Public Attitudes to Science 2011: Main Report
62
© 2011 Ipsos MORI
25
12
10
5
41
25
26
18
11
18
17
9
15
26
30
38
7
16
15
29
2
4
2
1
Figure 34: The Usefulness of School Science and Maths
The science I learnt at school has not been
useful in my everyday life
The science I learnt at school has been useful
in my job
Base: 2,103 UK adults aged 16+Fieldwork dates: 11 October-19 December 2010
Q For each of the statements, please could you tell me the extent to which you agree or disagree?
The maths I learnt at school has not been
useful in my everyday life
The maths I learnt at school has been useful
in my job
% Strongly agree % Tend to agree % Neither/nor
% Tend to disagree % Strongly disagree % Don't know % Agree
66%
23%
37%
36%
Again, across each of the statements, there are differences by gender and social grade that conform to the rest of the survey results. Women and those in social grades DE are less likely to think that the science they learnt at school has been useful in their everyday lives or their jobs.
Young people aged 16-24 are no more likely than average to think of the science they studied as having been useful in their everyday lives, even though people in this age group are particularly likely to see science as important to their daily lives (see Section 3.1.2). This again reflects the finding from the workshops that the science they see as relevant in their daily lives tends to have more to do with technology and gadgets than to do with what they learnt at school.
The level to which people have studied science at school correlates with how useful they have found it. Those who have studied science A Levels are more likely than those who say they only studied science to GCSE or O Level to think that the science they learnt at school has been useful in their everyday lives (71% versus 48%) and their jobs (67% versus 34%).43
7.3.3. Perceptions of How Science is Taught
People have a mixed view of the quality of science teaching, relative to other subjects. When asked whether the teaching of science was better or worse than the teaching of the other subjects, half (51%) say it was about the same, and slightly more say it was better (22%) than say it was worse (18%). The proportion saying it was worse has however fallen by seven percentage points since 2008.
43
Although we cannot verify what subjects respondents included within “science” GCSEs, O Levels and A Levels, they are very likely to have been biology, chemistry and physics.

Public Attitudes to Science 2011: Main Report
63
© 2011 Ipsos MORI
7
4
15
15
51
47
11
17
6
7
7
7
2
3
Figure 35: Perceptions of The Quality of Science Teaching at School
Q In general, how good was the teaching of science at your secondary school compared with the teaching of other subjects?
2008
% Much better % A little better % About the same
% A little worse % Much worse % Don't know
2011
% Didn‟t study % Better
22%
19%
Base for 2011: 2,103 UK adults aged 16+Fieldwork dates for 2011: 11 October-19 December 2010
Tying into their overall more negative views of science education, women are somewhat more likely than men to think the teaching of science was worse than of other subjects (20% versus 15%). Asian people are more likely than average to think it was better (44%, versus 22% overall).
Younger age groups also tend to be more positive – a third (32%) of those aged between 16 and 34 think science was better taught, compared to just one in ten (12%) of those aged 65+. This indicates that perceptions of science teaching have improved over time. In the workshops, some participants noted that aspects of science education, such as the quality of textbooks, had improved since they were at school.
Those whose school had science or engineering clubs while they were there are more likely than average to think the teaching of science was better than of other subjects regardless of whether they attended these clubs (36%, versus 22% overall). Those who did attend are even more likely to think it was better (46%). Of course, this does not necessarily mean that the presence of science clubs drive better perceptions of science education, since the schools running the clubs may have had an increased focus on science overall, and those attending the clubs may have already had a greater interest in science.
Looking at Figures 36 and 37 overleaf, we can see that among those who think science teaching was better or worse than the teaching of other subjects, common (unprompted) reasons for this relate to the teacher, again highlighting the particularly important role of science teachers in developing people‟s attitudes to science.
A fifth (22%) mention the practical element of science education as the reason they think it was better taught than other subjects. Participants in the workshops also considered this element of science in schools as something that made science stand out from other subjects. By contrast, in the survey just four per cent of those who think science teaching was worse mention the practical element as the reason.
Relatively few say that they think science was taught better or worse than other subjects because it was easy or hard respectively. This suggests that it is not necessarily the level of difficulty that puts people off science at school in most cases.

Public Attitudes to Science 2011: Main Report
64
© 2011 Ipsos MORI
49%
46%
24%
22%
13%
9%
8%
5%
3%
2%
Figure 36: Reasons that Science Teaching was Better than Other Subjects
Subject was interesting
Teacher(s) was very good
Liked the teacher(s)
Practicals/experiments brought it to life/liked doing them
Subject was worthwhile/important/could see the point of it
Was good at science/performed well
Good textbooks
Subject was easy
Exams were easy
Science was prioritised/had better funding/was a science school
Q Why do you say that the teaching of science was better than other subjects?
Base: All who say that the teaching of science was better than other subjects (500)Fieldwork dates: 11 October-19 December 2010
Top ten unprompted mentions
45%
27%
12%
10%
8%
6%
6%
4%
4%
3%
Figure 37: Reasons that Science Teaching was Worse than Other Subjects
Teacher(s) was not very good
Subject was not interesting
Didn‟t like the teacher(s)
Subject was hard
Subject was not worthwhile/not important/couldn‟t see the point of it
Was not good at science/performed badly
Bad textbooks
Lack of priority given to science
Didn‟t like doing practicals/experiments
Exams were hard
Q Why do you say that the teaching of science was worse than other subjects?
Base: All who say that the teaching of science was worse than other subjects (369)Fieldwork dates: 11 October-19 December 2010
Top ten unprompted mentions
7.4. Careers in Science
The survey suggests that people see careers in science as desirable (Figure 38). Around seven in ten (68%) think that “jobs in science are very interesting”. Six in ten agree “jobs in engineering are very interesting” (61%) and that “compared to other professions, engineering offers a well paid career” (58%).
To put the latter statement in context however, recent research by FreshMinds/ EngineeringUK has found that when people compare engineering to specific professions, such as lawyers, doctors or accountants, on balance people think engineers are paid worse,

Public Attitudes to Science 2011: Main Report
65
© 2011 Ipsos MORI
so engineering still faces stiff competition from these sectors when trying to attract graduates.44 In addition, there is uncertainty about the future of the engineering sector, with similar proportions agreeing (36%) and disagreeing (39%) that “engineering is a dying industry in the UK”.
19
14
10
7
49
47
48
28
20
23
21
18
5
6
9
28
1
1
2
11
5
8
10
8
Figure 38: Attitudes to Careers in Science
Engineering is a dying industry in the UK
Compared to other professions, engineering offers a well paid career
Jobs in science are very interesting
Jobs in engineering are very interesting
Base: 2,103 UK adults aged 16+Fieldwork dates: 11 October-19 December 2010
Q For each of the statements, please could you tell me the extent to which you agree or disagree?
% Strongly agree % Tend to agree % Neither/nor
% Tend to disagree % Strongly disagree % Don't know % Agree
68%
36%
61%
58%
Men are more likely than women to agree that jobs in science are interesting (71% versus 65%). There is a more pronounced gender split when asking about jobs in engineering, with just five in ten (52%) women thinking engineering jobs are interesting, compared with seven in ten (71%) men.
Young people aged 16-24 are less likely to think that jobs in science are interesting (61% agree, versus 68% overall). This also reflects the findings from the literature review, which found that children and young people tend to be less excited by jobs in science, often because they have a narrow impression of what these jobs involve.45 The fact that young people are less enthusiastic about careers in science highlights the challenge of increasing the numbers working in Science, Technology, Engineering and Mathematics (STEM), even when the UK public as a whole finds jobs in STEM sectors attractive.
7.5. Science in the Economy
7.5.1. The Role of Science in the Economy
As Figure 39 overleaf indicates, people see science as integral to the UK economy. Four-fifths (79%) agree that “the UK needs to develop its science and technology sector in order to enhance its international competitiveness”, while just four per cent disagree. Three-quarters (75%) agree that “scientific research makes a direct contribution to economic growth
44
FreshMinds/EngineeringUK (2010) The 2010 Engineers and Engineering Brand Monitor, EngineeringUK [p.46.] 45
For example, in Potter, C. and Parvin, J. (2008) Learning to Love Science: Harnessing children‟s scientific imagination, the authors found that many 9-14 year olds perceived jobs in science to be based in laboratories, cut off from the world and not utilising communication skills, which put them off the idea of working in science.

Public Attitudes to Science 2011: Main Report
66
© 2011 Ipsos MORI
in the UK”, and just three per cent disagree. Finally, almost nine in ten (87%) think that “young people‟s interest in science is essential for our future prosperity”.
These responses should be seen in context however. Half do not feel informed on how the economy works (see Section 3.3.2), so the results may to an extent reflect a received, though not necessarily understood, wisdom that science is good for the economy. They may not indicate any particular appreciation among the general public of how science affects economic growth. Indeed, in the workshops participants were largely unsure of the role of the sciences in the economy. This might help to explain why people hold seemingly conflicting opinions about businesses‟ use of science – although people think science is important for prosperity, many distrust scientists working for businesses (see Section 4.2.1).
38
30
23
50
48
53
8
13
15
3
3
3
2
4
7
Figure 39: Attitudes to Science in the Economy
Young people‟s interest in science is essential for our
future prosperity
The UK needs to develop its science and technology sector in order to enhance its international
competitiveness
Scientific research makes a direct contribution to economic
growth in the UK
Base: 2,103 UK adults aged 16+Fieldwork dates: 11 October-19 December 2010
Q For each of the statements, please could you tell me the extent to which you agree or disagree?
% Agree
75%
87%
79%
% Strongly agree % Tend to agree % Neither/nor
% Tend to disagree % Strongly disagree % Don't know
People with children under 16 in the household are more likely than those without to answer neutrally for the statements about science‟s impact on economic growth and international competitiveness, indicating a less positive attitude among parents. They are however just as likely as average to see young people‟s interest in science as essential to future prosperity.
Young people aged 16-24, who feel less informed than average about how the economy works (see Section 3.3.2), are also more likely to be neutral about science‟s impact on economic growth and international competitiveness compared to other age groups. Moreover, they are less likely than average to agree that young people‟s interest in science is essential (79%, versus 87% overall), again highlighting the difficulty of engaging young people in science.
In workshops the topic of science and the economy was especially difficult for younger participants to discuss, because they felt they did not know exactly what the economy was. They particularly struggled to see who reaps the benefit when the economy is in a strong position.
“The economy is more than the stock market, the economy is money … What‟s the definition of the economy?”
Cardiff workshop participant

Public Attitudes to Science 2011: Main Report
67
© 2011 Ipsos MORI
However, some older participants in the workshops did raise various ways in which they saw science as contributing to the economy. These are noted below:
Some participants identified specific sectors in the economy that they felt benefited from scientific developments, such as the food sector or the transport sector.
Some felt that developing technologies in the UK might be an important part of boosting the future economy, i.e. that investment in science could be a strategy for more long-term economic growth.
Some thought that there was a strong link between businesses, science and the economy, and that businesses benefited from new products or scientific innovations that can be marketed. They also felt that other businesses had become more efficient because of the technological advances, and this helped businesses reduce their costs and increase their outputs.
Some felt that having an environment that encourages advancements in science made the UK more attractive to outside investment.
Others identified more indirect contributions that science makes to the economy. For example, some noted that science can make the population healthier through medicine, and a healthier population would benefit the economy.
However, it is important to note that some participants did have concerns about the role of science in the economy. These related to the impact of new technology on jobs, discussed in the next section, and also to the notion that science that was good for the economy might not necessarily be science that had good social outcomes.
“When I think of the economy and science, I think of warfare and I think it benefits in a good and a bad way.”
Birmingham workshop participant
7.5.2. The Role of Science in Job Creation
Generally people are positive about science creating job opportunities. Six in ten (62%) agree that “because of science and technology there will be more work opportunities for the next generation”.
However, those aged 25-34, who are more likely to have entered the jobs market more recently, tend to be less positive on this issue than older age groups (57% of 25-34 year olds agree, versus 71% of those aged 65+). People with children under 16 in the household are also less likely to agree than average (57%, versus 62% overall), again reflecting their less positive attitudes towards science‟s economic impact.
In addition, it is worth noting that in the workshops a few participants also had concerns that prioritising certain kinds of technology might actually hinder job creation. The example given was robotics, and some participants suggested developments in this field have been at the expense of manufacturing jobs.
“Technology makes people lose jobs. Machinery is more efficient, so you don‟t need people, so you have job cuts.”
London workshop participant

Public Attitudes to Science 2011: Main Report
68
© 2011 Ipsos MORI
7.5.3. Who Benefits from Science in the Economy?
Although many people think the economy as a whole benefits from science, they are more divided as to who within the economy benefits from science. Three in ten (30%) think that “scientific advances tend to benefit the rich more than they benefit the poor”, while two in ten (21%) are ambivalent. Almost half (47%) disagree. Again, this needs to be placed in the context of a limited understanding of how science works in the economy.
The subgroups that have higher than average proportions of less affluent people are more likely to agree than disagree with this statement, thinking on balance that scientific advantages tend to benefit rich people more. This includes Black people, those in social grades DE, those with no qualifications, those without internet access, and those who do not feel informed about science.
By contrast, people with a science or engineering degree are more likely than average to disagree (61%, versus 47% overall). Those who describe themselves as scientists are also more likely to disagree (70%).
7.5.4. Public Funding of Science
The survey findings seem to reveal a high level of support for the public funding of scientific research (Figure 40). Three-quarters (76%) agree that “even if it brings no immediate benefits, research which advances knowledge should be funded by the Government”, suggesting that people acknowledge that not all Government-funded research will have direct economic benefits, and that they recognise the wider benefits of research. Just around one in seven (15%) agree that “Government funding for science should be cut because the money can be better spent elsewhere”. This is in spite of public support for cutting Government spending overall – in a June 2010 Ipsos MORI survey looking at reactions to the June 2010 Budget, over two-fifths (44%) agreed that “the deficit needs to be cut quickly, starting this year”.46
It should again be noted that the survey fieldwork took place around the time the Government announced its Comprehensive Spending Review. During this period, there was considerable media coverage as well as an online campaign in favour of public funding of science, which may have affected responses to these questions.
46
See http://www.ipsos-mori.com/researchpublications/researcharchive/2633/Budget-Reaction-Poll.aspx for topline results of the Ipsos MORI Budget Reaction Poll.

Public Attitudes to Science 2011: Main Report
69
© 2011 Ipsos MORI
25
2
51
12
14
20
7
40
1
23
2
3
Figure 40: Attitudes to Government Funding for Science
Even if it brings no immediate benefits, scientific research which
advances knowledge should be funded by the Government
Government funding for science should be cut
because the money can be better spent elsewhere
Base: 2,103 UK adults aged 16+Fieldwork dates: 11 October-19 December 2010
Q For each of the statements, please could you tell me the extent to which you agree or disagree?
% Agree
% Strongly agree % Tend to agree % Neither/nor
% Tend to disagree % Strongly disagree % Don't know
76%
15%
However, the workshop findings indicate that some people’s attitudes towards public funding of science have shifted in a climate of public spending cuts. A few workshop participants thought that in this climate, the Government had to place a greater emphasis on the potential economic benefits of research when considering whether or not to fund it.
Across workshops, some participants also took a short-term view of science spending – they thought that because the UK was, in their view, already advanced in science compared to other countries, there would be more leeway to cut science funding and spend it on other areas such as the NHS without causing immediate problems to the UK economy. Indeed, some thought that spending in other areas, such as health or the environment, would itself contribute to scientific research (e.g. through medical research), which meant that the idea of cutting spending on “the sciences” did not register as having as important an impact on science funding as it might do in reality.
There was also a contrast between how participants treated publicly and privately funded research. Many felt that private organisations had the right to fund research as they wished since they were spending their own money, whereas the Government had a responsibility to get value for money for taxpayers, so should fund research with a perceived tangible benefit. There were conflicting opinions on this however, with some younger participants arguing on the contrary that publicly funded research should be in areas that are not driven by commercial gain, such as medicine and the environment.
Some participants did think that the way research funding is allocated should not depend solely on perceived immediate social and economic benefits, because this might mean missing out on research areas that might deliver practical benefits further down the line. There was also a sense that the workshop discussions had left participants more in favour of the public funding of science, because they had a greater idea of how wide its impact was on other sectors, such as food production or health.
“I wouldn‟t have connected science to all these areas. It [funding the sciences] would have been the last thing.”
London workshop participant

Public Attitudes to Science 2011: Main Report
70
© 2011 Ipsos MORI
Following presentations from scientists at the workshops, where they explained the role of Research Councils to participants, we also probed participants‟ attitudes towards these bodies. Many participants were concerned that politicians were not well placed to make decisions on science funding, so were pleased to hear that arms-length bodies such as Research Councils existed to avoid political interests affecting areas of research. Some thought that members of the public should also not be involved in decisions on science funding since they are not experts, and were surprised to hear that Research Councils did attempt to engage with members of the public on research directions and priorities. On reflection, participants agreed that having public involvement was a good way to stop potential “tunnel vision” among scientists, i.e. to ensure alternative viewpoints are heard. They also felt that lay people would have less of a vested interest when making decisions about funding.

Public Attitudes to Science 2011: Main Report
71
© 2011 Ipsos MORI
8. Segmenting the Public
To examine differences in attitudes beyond simple bivariate relationships (e.g. differences between men and women), Ipsos MORI carried out a cluster analysis on the final data from the quantitative survey. This is a statistical technique used to segment the population into distinct clusters of respondents who have similar attitudes to science.47 For PAS 2011, given the large number of new attitudinal statements added to the questionnaire since the 2008 study, we ran a new cluster analysis to include these new statements, rather than repeating past analyses.
The new cluster analysis identified six distinct clusters. The table below shows the proportion of the UK population that belongs to each cluster, going from largest to smallest:
Cluster Name Percentage of UK Population
Concerned 23%
Indifferent 19%
Late Adopters 18%
Confident Engagers 14%
Distrustful Engagers 13%
Disengaged Sceptics 13%
The rest of this chapter provides a detailed description of each cluster, including their defining characteristics, their demographic makeup and their preferences for communication. Where relevant, we supplement the cluster descriptions with findings from the discussion groups. We then examine the implications for how best to engage each cluster with science and science issues.
It is important to note that the clusters group together respondents who tend to have similar attitudes across a range of areas, but not identical attitudes in each area. Therefore, if the people in one cluster are more likely to hold a certain view, this does not necessarily mean that most people in that cluster hold this view. Clusters should be seen as illustrative typologies rather than exactly representing the views of a group of the population.
We have given each cluster a name that reflects their overall stance. Again, it should be noted that these names cannot reflect the whole breadth of opinion within each cluster and instead are chosen to represent the overall defining characteristics.
This new cluster analysis was designed to segment the population at a particular moment in time, and not to track how cluster groups have changed over time. Although some of the cluster descriptions are, on the surface, similar to the clusters that came out of the previous PAS studies, the differences between the make-up of past clusters and the current ones mean we are not able to compare old to new in a meaningful way, and have not tried to do so in this report.
8.1. Concerned
The Concerned48 are the largest cluster, with around a quarter (23%) belonging to this group. Religion tends to play a more important role in their lives than for other clusters. The strong presence of people from ethnic minority backgrounds in this cluster also suggests they are subject to a different set of cultural influences to other clusters.
47
The technical details of the factor and cluster analyses are in Appendix E. 48
It should be noted that this cluster is not related to the “Concerned” cluster from the 2000 study.

Public Attitudes to Science 2011: Main Report
72
© 2011 Ipsos MORI
These religious and cultural differences underpin their attitudes to science. The Concerned have strong views on the limitations of science relative to other clusters, and are among the least convinced of the economic benefits of investing in it. Further to this, they are more likely to have reservations about the intentions of scientists and about whether science and technology is sufficiently under Government control.
8.1.1. Defining Characteristics
The Concerned distinguish themselves from other clusters through their more religious or spiritual outlook on life.
They are more likely to think that “God created the earth and all life in it” (59%, versus 39% overall) and that “we are put on earth for a purpose” (74%, versus 57% overall). This impacts on how they view science, with the Concerned being less likely than average to think that “human beings have evolved from other animals” (52%, versus 68% overall) and more likely to think that “we depend too much on science and not enough on faith” (45%, versus 29% overall).
This religious outlook also came across in the discussion group, where some participants noted that science should not aim to contradict people‟s religious beliefs. There was also a sense that science was just one of many ways of thinking about the world.
Perhaps related to their greater emphasis on faith, the Concerned are more likely to feel overexposed to science.
The Concerned are more likely to think “the more l know about science, the more worried I am” (33%, versus 24% overall). They are also somewhat more likely to say they hear and see too much or far too much information about science (14%, versus 8% overall).
In addition, the Concerned are less interested in careers in science. They are slightly less likely than average to think that “jobs in science are very interesting” (62%, versus 68% overall), or that “jobs in engineering are very interesting” (48%, versus 61% overall).
Despite these strong views, the Concerned are not anti-science. The survey finds that people in this cluster are particularly likely to think “it is important to know about science in my daily life” (74%, versus 68% overall). In the discussion group, participants were also interested in hearing about particular areas of science, such as climate change.
Although not anti-science, the Concerned are often worried about certain aspects of science that they see as having gone too far.
This includes worries about science changing nature – the Concerned are more likely than average to think that “people shouldn‟t tamper with nature” (71%, versus 56% overall). They also tend to be more worried about the speed of development, being more likely to believe that “the speed of development in science and technology means that they cannot be properly controlled by Government” (48%, versus 40% overall).
Linked to this, they tend to be more worried about the intentions of scientists.
The Concerned are more likely than average to think that “scientists seem to be trying new things without stopping to think about the consequences” (47%, versus 41%) and that “scientists adjust their findings to get the answers they want” (43%, versus 36%). They are also more likely to feel that “scientists should listen more to what ordinary people think” (74%, versus 66% overall).

Public Attitudes to Science 2011: Main Report
73
© 2011 Ipsos MORI
People in this cluster also tend to be less convinced about the economic benefits of science.
The Concerned are less likely than average to agree that “because of science and technology there will be more work opportunities for the next generation” (52%, versus 62% overall). Indeed, some participants in the discussion group argued that scientific advances often made jobs obsolete, so reduced work opportunities.
“We‟ve been told that there will be redundancies because a new system that‟s been brought into the building I work in … that we had to pay loads of money for, is going to take people‟s jobs because they‟re not needed to do the paperwork.”
“Concerned” discussion group participant
Although a clear majority recognise the return on investment in science, this sentiment is less strong than in other clusters. They are less likely than average to agree that “scientific research makes a direct contribution to economic growth in the UK” (67%, versus 75% overall), that “the UK needs to develop its science and technology sector in order to enhance its international competitiveness” (64%, versus 79% overall) or that “young people‟s interest in science is essential for our future prosperity” (77%, versus 87% overall). Consequently, the Concerned are less supportive of Government funding for science, being somewhat more likely to think “Government funding for science should be cut because the money can be better spent elsewhere” (25%, versus 15% overall).
The Concerned appear to have more positive attitudes towards Government, and Government efforts to consult the public on science.
They are more likely to think that “the UK Government is working hard to ensure that people living in the UK will have enough fuel for our future needs” (54%, versus 45% overall). They are also less cynical about public consultation, being less likely to think that public consultation events are “just public relations activities and don‟t make any difference to policy” (32%, versus 51% overall) or “unrepresentative of public opinion” (35%, versus 47% overall). Instead they are more likely than average to think the Government makes a great deal or fair amount of effort to consult the public on science (35%, versus 26% overall).
8.1.2. Demographic Makeup
As we can see from Figure 41 overleaf, the Concerned, like Late Adopters and Disengaged Sceptics, are more likely to be women than average. They tend to come from the younger age groups (16-34 year olds) and from lower social grades (C2DEs). This cluster also has the highest proportion of people from ethnic minority backgrounds and accounts for half (53%) of the entire ethnic minority population in the UK, making ethnicity a particularly defining trait.

Public Attitudes to Science 2011: Main Report
74
© 2011 Ipsos MORI
Figure 41: “Concerned” Cluster Demographics
42%
58%
22%
20%
35%
10%
13%
77%
23%
46%
53%
48%
52%
15%
16%
34%
15%
20%
90%
10%
56%
45%
Male
Female
16-24
25-34
35-54
65+
White
BME
ABC1
C2DE
Gender % of Concerned
% of UK adults aged 16+
Age
Ethnicity
Social Grade
55-64
Base: 490 in Concerned cluster (dark green); 2,103 UK adults aged 16+ (light green)Fieldwork dates: 11 October-19 December 2010
8.1.3. Media Consumption
The Concerned are less well defined than other clusters by their media consumption, which tends to be close to average. They are however somewhat more likely to regularly read tabloid newspapers than other clusters, including the Sun (18%, versus 14% overall), the Daily Mirror (9%, versus 7% overall) and the Metro (11%, versus 6% overall). They are also less likely to read any Sunday newspapers than other clusters (65% read none, versus 58% overall).
They are somewhat more likely than average to use books as their most common source of information on science (12%, versus 8% overall) although most still mainly find out about science through television (51%). They are less likely than average to regularly read websites on science and technology (8%, versus 14% overall).
8.1.4. Implications for Communication and Engagement
Engaging the Concerned in science is important as they are the largest cluster. However, they are not straightforward to engage because more information about science could make them more anxious. The data suggest this cluster does however want to hear more about the intentions of scientists, particularly those working in more controversial areas of bioscience research, such as synthetic biology or stem cells research.
In addition, although the Concerned are relatively satisfied that the Government wants to consult the public on science, they are less convinced that scientists themselves are interested in doing this. This suggests they would want to know how individual scientists and scientific professional bodies, as well as Government, are responding to the concerns about science raised in public consultations.
Engagement focusing on how science impacts on the economy, particularly with regards to job creation, might help to improve the overall attitudes to science of the Concerned. In addition, given the relatively large prevalence of young people in this cluster, many of whom will be entering the labour market for the first time, it will be important to ensure that they are aware of the breadth of job opportunities in science, especially outside of stereotypical jobs in laboratories.

Public Attitudes to Science 2011: Main Report
75
© 2011 Ipsos MORI
8.2. Indifferent
One in five (19%) belong to the Indifferent49, making it the second largest cluster. The Indifferent tend to be much older in makeup than any of the other groups, with a quarter aged over 75 and half being retired. While they are less likely to feel informed about science, they are not especially negative or worried about it. In fact, they tend not to be as interested in science as other clusters, and consequently are far less inclined to get involved in public consultations on science. This is reflective of their general attitudes to life, as they tend to be less interested than average in changing the way they already live.
8.2.1. Defining Characteristics
The Indifferent are most different from other clusters in their general attitudes to life, tending to be less interested in changing the way they live.
Only half (48%) agree that “I enjoy new situations and challenges”, compared with 81% overall. They are also less likely than average to agree that “it is important for me to keep on learning new skills” (63%, versus 89% overall). This is perhaps reflective of the older age profile of this cluster.
Related to this, they are less likely to take an interest in science.
The indifferent are less likely than other clusters to agree that “it is important to know about science in my daily life” (40%, versus 68% overall), and somewhat less likely to agree that “science is such a big part of our lives that we should all take an interest” (72%, versus 82% overall). They are also less likely to have taken part in a science-related activity in the last 12 months (32%, versus 50% overall).
Unlike many of the other clusters, they do not seem to be particularly interested in climate change, and are more likely than average to be climate change sceptics. They are more likely to agree that “the UK is too small to make an impact on climate change” (33%, versus 25% overall) and that “human activity does not have a significant effect on the climate” (21%, versus 15% overall). They are also less likely than average to trust scientists working for environmental groups to follow rules and regulations (65%, versus 72% overall).
The Indifferent often feel confused by science and are consequently less likely to feel informed about it.
They tend to feel less confident in keeping up with science than other clusters. They are more likely to agree that “science and technology are too specialised for most people to understand them” (71%, versus 63% overall), that “I cannot follow the developments in science and technology because the speed of development is too fast” (57%, versus 46% overall).
This cluster also appear to have less of an understanding of how science works. They are less likely to think “it‟s normal for scientists to disagree” (77%, versus 84% overall). Almost half (46%) feel that “I don‟t think I‟m clever enough to understand science and technology” (versus 32% overall). This sentiment was also apparent in the discussion group with this cluster, with participants often put off by the technical terms used in science, as the following quotes illustrate:
“There‟s so much jargon that it‟s difficult to understand.”
49
It should be noted that this cluster is not related to the “Indifferent” cluster from PAS 2008.
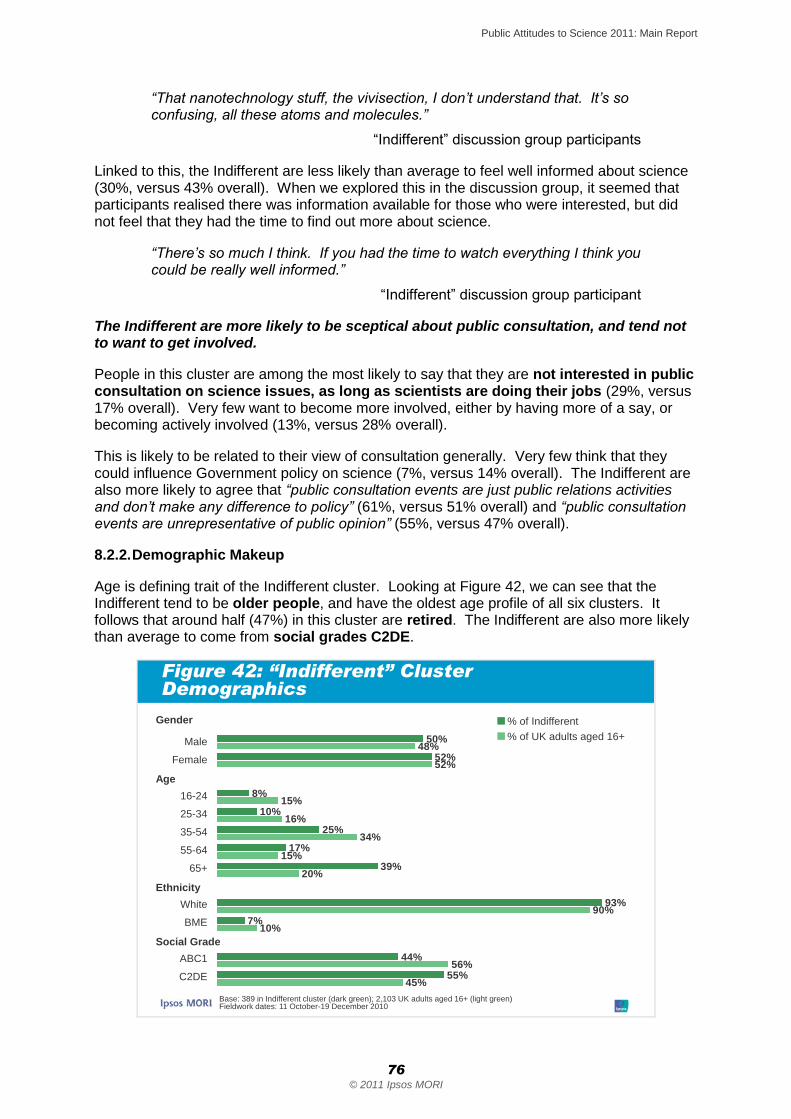
Public Attitudes to Science 2011: Main Report
76
© 2011 Ipsos MORI
“That nanotechnology stuff, the vivisection, I don‟t understand that. It‟s so confusing, all these atoms and molecules.”
“Indifferent” discussion group participants
Linked to this, the Indifferent are less likely than average to feel well informed about science (30%, versus 43% overall). When we explored this in the discussion group, it seemed that participants realised there was information available for those who were interested, but did not feel that they had the time to find out more about science.
“There‟s so much I think. If you had the time to watch everything I think you could be really well informed.”
“Indifferent” discussion group participant
The Indifferent are more likely to be sceptical about public consultation, and tend not to want to get involved.
People in this cluster are among the most likely to say that they are not interested in public consultation on science issues, as long as scientists are doing their jobs (29%, versus 17% overall). Very few want to become more involved, either by having more of a say, or becoming actively involved (13%, versus 28% overall).
This is likely to be related to their view of consultation generally. Very few think that they could influence Government policy on science (7%, versus 14% overall). The Indifferent are also more likely to agree that “public consultation events are just public relations activities and don‟t make any difference to policy” (61%, versus 51% overall) and “public consultation events are unrepresentative of public opinion” (55%, versus 47% overall).
8.2.2. Demographic Makeup
Age is defining trait of the Indifferent cluster. Looking at Figure 42, we can see that the Indifferent tend to be older people, and have the oldest age profile of all six clusters. It follows that around half (47%) in this cluster are retired. The Indifferent are also more likely than average to come from social grades C2DE.
Figure 42: “Indifferent” Cluster Demographics
50%
52%
8%
10%
25%
17%
39%
93%
7%
44%
55%
48%
52%
15%
16%
34%
15%
20%
90%
10%
56%
45%
Male
Female
16-24
25-34
35-54
65+
White
BME
ABC1
C2DE
Gender % of Indifferent
% of UK adults aged 16+
Age
Ethnicity
Social Grade
55-64
Base: 389 in Indifferent cluster (dark green); 2,103 UK adults aged 16+ (light green)Fieldwork dates: 11 October-19 December 2010

Public Attitudes to Science 2011: Main Report
77
© 2011 Ipsos MORI
8.2.3. Media Consumption
Traditional media is especially important for the Indifferent, as they are the least likely cluster to have internet access (58% have internet at home, versus 76% overall), again reflecting their older age profile. Consequently, television (64%) and newspapers (37%) tend to be their most regular sources of information on science. They are also more likely to say they would believe scientific findings more if they saw them on a television programme (31%, versus 24% overall).
The Indifferent are more likely to regularly read tabloid newspapers than average. The most popular weekly newspapers among this cluster are the Daily Mail (17%) and the Sun (15%), and the most popular Sunday newspapers are the News of the World (12%) and the Mail on Sunday (12%).
In the Indifferent discussion group, we found that some participants were especially passive consumers of science information, who suggested they might look at or listen to information about science if it was in front of them, but would not actively seek it out.
“I only know what‟s presented to me. Maybe TV advertisements or magazines – things that we look at … [Science] is the part of the newspaper that we skip normally.”
“Indifferent” discussion group participant
8.2.4. Implications for Communication and Engagement
The Indifferent are more challenging to engage, as they do not have any particular worries about scientific developments and are not very interested in finding out more about science, believing it is not for them. Nevertheless, they represent a large proportion of the population, and their relatively strong scepticism about important issues such as climate change should not be ignored, as these views could perhaps influence those in other clusters.
For many of the Indifferent, science currently seems like another world, which they do not play a part in. This stands in contrast to the findings of the workshops where, following discussion, participants were able to point out the wide impact of science in people‟s lives. The Indifferent might therefore engage more if they had a better understanding of the extent to which science affects their lives, so that they feel less isolated from it.
The findings suggest many in this cluster also require a better basic understanding of how scientists conduct their work before they can become engaged. Science communicators should perhaps attempt to demystify science for this cluster, explaining that it can be simple, and that anyone can do science.
The most important media for this cluster are television and newspapers, as they tend not to use the internet. It is also important to acknowledge that they tend not to actively seek out science information. They are sometimes less likely to watch a programme or read a news story specifically about science, so perhaps would be more likely to find out about science if it was incorporated into the non-science programmes they already watch, or the magazines they already read.
8.3. Late Adopters
Around two in ten (18%) belong to the Late Adopters cluster. The Late Adopters are so called because their interest in science began after school. They did not enjoy the science they studied at school, nor find it useful later in life. However, they now take a strong interest in science, and are interested in becoming more involved in public consultations on science.

Public Attitudes to Science 2011: Main Report
78
© 2011 Ipsos MORI
Late Adopters are also characterised by their relatively strong environmental and ethical concerns. They are more likely to believe in man-made climate change and support the development of renewable energy than average. They also have strong reservations about areas of science such as GM crops and the use of animals in research. Related to this, they want to hear scientists talking more about the social and ethical implications of their work.
8.3.1. Defining Characteristics
A defining trait of Late Adopters is their more negative attitude towards science education, compared to other clusters.
People in this cluster are more likely to think “school put me off science” (40%, versus 24% overall) and more likely to say the teaching of science at their school was worse than other subjects (26%, versus 18% overall). They are also less convinced their science education has been useful, with more thinking “the science I learnt at school has not been useful in my everyday life” (52%, versus 36% overall) and fewer thinking “the science I learnt at school has been useful in my job” (57%, versus 42% overall).
Some participants in the Late Adopter discussion group suggested this attitude to school science was not necessarily because they were less interested in science as a whole, but because they were not considered to perform well in it.
“If you‟re good at science you are encouraged to stick with it. If you‟re interested, but not as good, then you aren‟t.”
“Late Adopter” discussion group participant
Some participants also thought the science they learnt at school was not fun because it did not relate to their hobbies and interests. Some gave examples of how they thought science could be made more interesting by applying it to hobbies, such as the application of physics in football, or engineering in car design.
Despite their negative impressions of school science, Late Adopters now take a strong interest in science and feel capable of understanding it.
They are more likely than average to agree that “science is such a big part of our lives that we should all take an interest” (86%, versus 82% overall) and that “it is important to know about science in my daily life” (77%, versus 68% overall). They are also somewhat more likely than average to have taken part in a science-related leisure activity in the last 12 months (56%, versus 50% overall).
There is also potential to increase involvement in science among Late Adopters. They are more likely than average to want more of a say in science issues (27%, versus 21% overall). They also feel confident in taking part, being more likely than average to disagree with the statements, “I don‟t understand the point of all the science being done today” (81%, versus 72% overall) and “I don‟t think I‟m clever enough to understand science and technology” (58%, versus 52% overall).
Late Adopters also take a broad view of what constitutes science.
In the discussion group, participants were quick to point out the presence of science in various aspects of culture and entertainment – they saw science in politics through political science, as a leisure activity through science museums, and as entertainment through television programmes such as CSI. They also saw overlaps between science and the arts, which they thought both required creativity.

Public Attitudes to Science 2011: Main Report
79
© 2011 Ipsos MORI
“Science and the arts are both creative in different ways. Leonardo da Vinci did science and arts.”
“Late Adopter” discussion group participant
This broad view of science is perhaps linked to their educational backgrounds. Of the 26% of Late Adopters that are educated to a higher level, four in ten (38%) have studied an arts or humanities subject (versus 22% on average).
Late Adopters’ interest in science tends to focus on environmental and ethical issues.
They strongly believe in man-made climate change, being more likely than average to disagree that “human activity does not have a significant effect on the climate” (91%, versus 74% overall). They are also more likely to think the benefits of renewable energy far outweigh the risks (47%, versus 42% overall). By contrast, when it comes to nuclear energy they are more likely to think the risks outweigh the benefits (34%, versus 27% overall).
Late Adopters are also more likely to think the risks outweigh the benefits of GM crops (35%, versus 27% overall) and the use of animals in research (40%, versus 28% overall). Both these issues arose spontaneously in the discussion group, with participants feeling that they should be getting more information on GM crops in particular.
Related to these concerns, this cluster is the most likely to want “scientists to spend more time than they do discussing the social and ethical implications of their work with the general public” (81%, versus 65% overall). They are also more likely to think “scientists should be rewarded for communicating their work to the public” (68%, versus 44% overall).
8.3.2. Demographic Makeup
Looking at Figure 43, we can see that the Late Adopters, like the Concerned and Disengaged Sceptics, are more likely to be women than average. Also like the Concerned, they are more likely to belong to the younger age groups (16-34 year olds), with relatively few older people aged 65+ in this cluster. In other respects however they show little difference from the overall population.
Figure 43: “Late Adopters” Cluster Demographics
41%
59%
20%
20%
38%
13%
8%
92%
8%
56%
44%
48%
52%
15%
16%
34%
15%
20%
90%
10%
56%
45%
Male
Female
16-24
25-34
35-54
65+
White
BME
ABC1
C2DE
Gender % of Late Adopters
% of UK adults aged 16+
Age
Ethnicity
Social Grade
55-64
Base: 392 in Late Adopters cluster (dark green); 2,103 UK adults aged 16+ (light green)Fieldwork dates: 11 October-19 December 2010

Public Attitudes to Science 2011: Main Report
80
© 2011 Ipsos MORI
8.3.3. Media Consumption
The Late Adopters are somewhat more likely than average to regularly read the Guardian (11%, versus 8% overall) and the Observer (8%, versus 5% overall). However, Late Adopters are less likely than average to get most of their science information from print newspapers (27%, versus 33% overall), suggesting articles in newspapers are not the most effective way to communicate with this group.
The Late Adopters are more likely to have internet access than average, either at home (84%, versus 76% overall), or at work (44%, versus 39% overall). They are also more likely than average to download or stream programmes or video clips from their computer (36%, versus 31% overall) and to visit social networking websites, such as Facebook or Twitter (46%, versus 38% overall).
8.3.4. Implications for Communication and Engagement
The Late Adopters appear to engage more strongly with science when it is not treated as an isolated subject, but instead when it is placed in a wider context, and relates back to their daily lives and their interests in the environment and in ethical issues. This suggests they would be interested in hearing more about how science impacts on people‟s lives and on other areas of society.
This cluster would also like to hear scientists discuss the social and ethical implications of their research more, and to know how scientists and their funders take these implications into account in the scientific process.
Given their media usage, any engagement targeted at the Late Adopters would benefit from an online element. In particular, as with Confident Engagers, social networking websites are a good way of reaching this cluster.
8.4. Confident Engagers
Confident Engagers make up 14% of the population and tend to be the most affluent and well-educated cluster. They have a strongly positive attitude towards science and towards various scientific developments. At the same time they have relatively few concerns – they are confident that scientists across institutions are well regulated and are more likely to trust scientists to follow the regulations.
They want to get more involved in decisions about science, but are also keen for the Government to put expert advice and evidence above public opinion when making these decisions. Related to this, they do have concerns about the media‟s influence over science policy and the way science is reported in the media.
8.4.1. Defining Characteristics
Confident Engagers take a strong interest in Science.
Like Late Adopters, they are more likely than average to think that “science is such a big part of our lives that we should all take an interest” (92%, versus 82% overall) and that “it is important to know about science in my daily life” (84%, versus 68% overall). They are also the most likely cluster to have taken part in a science-related leisure activity in the last 12 months (74%, versus 50% overall).
Unlike Late Adopters, their enthusiasm for science often began at school. They are more likely to say the teaching of science at their school was better than other subjects

Public Attitudes to Science 2011: Main Report
81
© 2011 Ipsos MORI
(28%, versus 22% overall). They are also the most likely cluster to disagree with the statement “the science I learnt at school has not been useful in my everyday life” (79%, versus 44% overall).
Their interest also reflects their relatively close proximity to science in their lives. They are more likely than average to have scientists or engineers among their friends or family (62%, versus 35% overall) and to have studied science to at least A Level (48%, versus 21% overall).
They are also strongly positive about the role of science in society.
Confident Engagers overwhelmingly agree that “scientists make a valuable contribution to society” (99%, versus 88% overall). They also tend to recognise the economic benefits of science more, being more likely than average to agree that “Scientific research makes a direct contribution to economic growth in the UK” (86%, versus 75% overall) and that “Young people‟s interest in science is essential for our future prosperity” (95%, versus 87% overall).
Confident Engagers stand out from other clusters through their high levels of confidence and trust in scientists and Government.
People in this cluster tend to be among the most confident that scientists working in various institutions are well regulated. They also tend to be more trusting of scientists in different institutions to follow these rules and regulations. Similarly, they are more likely to disagree that “scientists seem to be trying new things without stopping to think about the consequences” (60%, versus 30% overall).
Related to this, Confident Engagers also tend to favour a less conservative approach to regulation. They are the most likely cluster to think that “scientists should be allowed to experiment on monkeys, if this can help cure life-threatening human diseases” (73%, versus 55% overall). They are also more likely than average to disagree that “Government should delay the introduction of new medicines or technologies until scientists are completely certain there are no bad side effects” (37%, versus 13% overall) and that “industry should wait until scientists are completely certain that there is no danger to their workers before they use new methods of production” (16%, versus 5% overall).
They tend to be content with current levels of information and engagement.
Confident Engagers tend to feel well informed about science (65% informed, versus 43% overall). They also tend to be more confident in seeking out information on science, being more likely than average to agree that “finding out about new scientific developments is easy these days” (60%, versus 49% overall) and less likely to think that “there is so much conflicting information about science it is difficult to know what to believe” (55%, versus 71% overall).
They are most likely to feel they hear and see the right amount of information about science (46%, versus 38% overall). In addition, they are the cluster least likely to think that “scientists put too little effort into informing the public about their work” (24%, versus 13% overall).
They are eager to have their say on scientific issues, but feel the Government should place scientific evidence and expert advice ahead of the views of the public and the media when making decisions.
Despite already being the most engaged cluster, Confident Engagers are among the most keen to become more involved in public consultation on science, either by becoming actively involved (15%, versus 7% overall) or just having more of a say (26%, versus 21% overall). However, they are also more likely than average to believe that “politicians should put

Public Attitudes to Science 2011: Main Report
82
© 2011 Ipsos MORI
scientific evidence above public opinion when making decisions” (62%, versus 45% overall) and that “experts and not the public should advise the Government about the implications of scientific developments” (75%, versus 64% overall).
Linked to this, one of the few concerns Confident Engagers have is about the media‟s influence on science and science policy. They are more likely to think that “the media sensationalises science” (93%, versus 70% overall) and that “politicians are too easily swayed by the media‟s reaction to scientific issues” (85%, versus 66% overall).
8.4.2. Demographic Makeup
As Figure 44 shows, the Confident Engagers are far more likely to come from the more affluent social grades (ABC1s). Related to this, they tend to be educated to a higher level (58%, versus 28% overall). In their social status and education, they therefore tend to be similar to Distrustful Engagers. They are also more likely to belong to the middle age groups (35-54 year olds), whereas very few are in the older age groups.
Figure 44: “Confident Engagers” Cluster Demographics
53%
47%
17%
18%
43%
13%
8%
94%
6%
81%
19%
48%
52%
15%
16%
34%
15%
20%
90%
10%
56%
45%
Male
Female
16-24
25-34
35-54
65+
White
BME
ABC1
C2DE
Gender % of Confident Engagers
% of UK adults aged 16+
Age
Ethnicity
Social Grade
55-64
Base: 303 in Confident Engagers cluster (dark green); 2,103 UK adults aged 16+ (light green)Fieldwork dates: 11 October-19 December 2010
8.4.3. Media Consumption
Confident Engagers are far more likely than average to read broadsheet newspapers (42%, versus 24% overall) and less likely to read tabloid newspapers (27%, versus 45% overall). In particular, they are most likely to read the Guardian (17%).
They are more likely to have access to the internet than other clusters, either at home (93%, versus 74% overall) or at work (68%, versus 39% overall). Like Late Adopters, they are also more likely than average to regularly visit social networking websites (58%, versus 38% overall).
In addition, Confident Engagers are more likely than average to regularly read science blogs (12%, versus 5% overall) and other websites on science and technology (33%, versus 14% overall). Related to this, they are less likely than average to cite television as their most common source of information on science (36%, versus 54% overall).

Public Attitudes to Science 2011: Main Report
83
© 2011 Ipsos MORI
8.4.4. Implications for Communication and Engagement
Confident Engagers are perhaps sufficiently engaged with science, because they already tend to have high levels of confidence and trust in science, scientists and science policy. Nonetheless, they may want to know more about how the Government incorporates scientific advice into policy, for example through scientific advisers and select committees. They might also be interested in knowing more about Government efforts to improve science reporting in the media, for instance through the Science and the Media expert group.
This cluster is more likely than average to respond to engagement online, through specialist science websites and blogs, as well as social networking websites. They should also be targeted through broadsheet, rather than tabloid newspapers.
8.5. Distrustful Engagers
One of the smaller clusters, Distrustful Engagers make up 13% of the population. They tend to be fairly affluent and well educated, and many have backgrounds in science or engineering. They are very interested in science, think of it as beneficial to society and feel relatively well informed about it, much like Confident Engagers.
What separates them from Confident Engagers is that, while they have a very positive attitude towards science, Distrustful Engagers are less trusting of those that work in science, and less confident in the Government‟s ability to regulate them. They are interested in becoming more involved in decision-making on scientific issues, and tend to think the public should play a larger role, alongside experts. However, they are sceptical about the consultation process.
8.5.1. Defining Characteristics
Distrustful Engagers are enthusiastic about science, and see it as beneficial to society.
Distrustful Engagers had a relatively good experience of science at school. They are among the least likely to agree that “school put me off science” (12%, versus 24% overall), and are more likely than average to say that the teaching of science at school was better than the teaching of other subjects (30%, versus 22% overall).
They are considerably more likely than average to agree that “it is important to know about science in my daily life” (85%, versus 67% overall) and that “science is such a big part of our lives that we should all take an interest” (91%, versus 82% overall). They are also more likely than average to have taken part in a science-related activity in the past 12 months (61%, versus 50 overall).
Like Confident Engagers, they highly value science, being more likely to agree with the statement “I am amazed by achievements of science” (92%, versus 87% overall) and think that “on the whole, science will make our lives easier” (88%, versus 80%). People in this cluster are also more likely than average to think that the science that they learned at school is useful in their jobs (58%, versus 37% overall) and daily lives (68%, versus 44% overall). This reflects the fact that a third (33%) in this cluster have, at some point in their lives, worked as engineers or scientists.

Public Attitudes to Science 2011: Main Report
84
© 2011 Ipsos MORI
They also tend to feel well informed about science and think it is relatively easy to become informed.
Distrustful Engagers are among the most well informed about science (62% informed, versus 43% overall). They are also more likely than average to think that “finding out about new scientific developments is easy these days” (59%, versus 49% overall). In our discussion group with Distrustful Engagers, many participants agreed it was easy to get information on science issues if you were interested in doing so.
“I think we are quite well informed. It‟s in the media, you can go on to the net. If you find something you‟re interested in, there‟s every form of finding something out – you can find out more.”
“Distrustful Engager” discussion group participant
In the groups, some participants said they had recently followed up or intended to follow up something they read about a science issue, for example by looking for more information on the internet, in an effort to get the most accurate information.
“You have to become your own little scientist, because you have to research everything if you want to be secure that you have the facts.”
“Distrustful Engager” discussion group participant
However, Distrustful Engagers have low levels of trust and confidence in scientists and in regulation.
They are more likely not to trust scientists working for private companies (45% do not trust them, versus 38% overall) and scientists working for Government (28%, versus 23% overall) to follow rules and regulations. Despite feeling well-informed about science, three in ten (29%) disagree that “before scientific findings are announced, other scientists have checked them” (versus 11% overall). This is even felt among the third of Distrustful Engagers who have previously worked as scientists or engineers, with 41% of this subgroup disagreeing with the statement.
They tend to be less confident that scientists working for any of the institutions asked about in the survey are well regulated. They are also less confident that scientists themselves have thoroughly considered the risks of new technologies before they are used (39% not confident, versus 31% overall).
Many Distrustful Engagers are also cynical about regulation generally. Almost two-thirds (63%) agree that “rules will not stop scientists doing what they want behind closed doors”, compared with 54% overall. Half (50%) also think that “the speed of development in science and technology means that they cannot be properly controlled by Government”, compared with 40% overall.
This lack of trust is likely to be linked to Distrustful Engagers’ more negative image of scientists and how they conduct their work.
From the list of words and phrases in the survey, they are more likely than average to describe them as detached (39%, versus 24% overall) and poor at public relations (31%, versus 17% overall). People in this cluster are also less likely to agree that “in general, scientists want to make life better for the average person” (72%, versus 82% overall).
This attitude also came across in the discussion group. Participants felt that scientists tended to be introverted and even inflexible. Even though some participants felt these were stereotypes, others noted that this had indeed been their experience when coming across scientists in real life.

Public Attitudes to Science 2011: Main Report
85
© 2011 Ipsos MORI
“The ones who work in labs are quite introverted.”
“The ones I‟ve come across are quite evangelistic about what they do.”
“Distrustful Engager” discussion group participants
Many participants in this group also shared a sceptical view of whether scientists could actually prove anything, since they thought there would always be dissenting scientists claiming the opposite. This was partly why they tended to distrust scientists.
“Sometimes you choose what to believe. There aren‟t really any facts in science are there – there‟s always some [opposing] theorist.”
“Distrustful Engager” discussion group participant
Given the older age profile of the cluster, their distrust could also be based on their experience. One participant in the discussion group brought up Thalidomide as an example of a scientific issue that scientists had got wrong, making them less trustworthy.
“In 47 years, I‟ve seen them mess up so many times – Thalidomide – it makes you cynical.”
“Distrustful Engager” discussion group participant
They have mixed views on public consultation, but nonetheless often want to get more involved.
When it comes to personal involvement in science consultation, four in ten (41%) would like to have more of a say or become more actively involved in public consultation on science issues, compared with 28% overall. This is despite cynicism about the idea – Distrustful Engagers are more likely to agree that “public consultation events are just public relations events and don‟t make any difference to policy” (71%, versus 51% overall) and “public consultation events are not representative of public opinion” (65%, versus 47% overall). They also tend to think the Government is not making an effort to consult the public (82% think it is not making very much, or any effort, versus 65% overall).
8.5.2. Demographic Makeup
Distrustful Engagers are predominantly male, and more so than any other cluster. Like Confident Engagers, this cluster also has a relatively high proportion of ABC1s, with almost two-fifths (37%) being educated to a higher level (versus 28% overall). It includes relatively few people from ethnic minority backgrounds. What differentiates them from the very similar Confident Engagers is their slightly older age profile, with more people aged 55 and over in this cluster than average.

Public Attitudes to Science 2011: Main Report
86
© 2011 Ipsos MORI
Figure 45: “Distrustful Engagers” Cluster Demographics
71%
29%
6%
9%
35%
25%
26%
97%
3%
70%
30%
48%
52%
15%
16%
34%
15%
20%
90%
10%
56%
45%
Male
Female
16-24
25-34
35-54
65+
White
BME
ABC1
C2DE
Gender % of Distrustful Engagers
% of UK adults aged 16+
Age
Ethnicity
Social Grade
55-64
Base: 260 in Distrustful Engagers cluster (dark green); 2,103 UK adults aged 16+ (light green)Fieldwork dates: 11 October-19 December 2010
8.5.3. Media Consumption
The most commonly read newspaper among this cluster is the Daily Mail (21% regularly read this, versus 14% on average). They are also more likely than average to read the Daily Telegraph (10%, versus 5% overall) and the Times (10%, versus 5% overall).
They are also interested in specialist science content. People in this cluster are more likely than average to subscribe to a science magazine (10%, versus 6% overall), or at least to have bought a science magazine in the last year (23%, versus 10% overall).
Distrustful Engagers are also comfortable with new media. Nine in ten (87%) have internet access at home. They are more likely than average to regularly read science blogs (8% versus 5% overall) and other internet websites on science and technology (29%, versus 14% overall). However, unlike Confident Engagers, they are not especially likely to use social networking sites (36%, versus 58% of Confident Engagers).
8.5.4. Implications for Communication and Engagement
As Distrustful Engagers already tend to be interested in science and feel informed about it, the challenge here is not about stimulating interest. Instead, the key issue is trust in scientists and regulators. It is worth noting however that the Science and Trust Expert Group has suggested that those who tend to distrust scientists may be those who are less trusting of others generally, making increasing public trust in science more challenging.
Distrustful Engagers are often sceptical that scientists validate their data, despite many having previously worked in the profession. This suggests that their experiences of science have been atypical and they might be surprised to find that the majority of scientists are in fact satisfied with validation processes such as peer review.50 There is also a sense that people in this cluster are especially likely to think of scientists as introverts, working alone behind closed doors, and would perhaps change their views if they understood the extent to which scientists collaborate, and work in teams.
50
For example, in their Peer Review Survey, Sense about Science (2009) found that 69% of the 4,037 researchers surveyed were satisfied with the current peer review system.

Public Attitudes to Science 2011: Main Report
87
© 2011 Ipsos MORI
They also want to see greater public oversight of scientists, so would be interested in knowing the extent to which the public is already involved in science regulation, for example through public consultation events. Four in ten of this cluster also want to get involved in science decision-making themselves, so could be made aware of the opportunities to do so.
Just like the Confident Engagers, this cluster is more likely than average to respond to engagement online, through specialist science websites and blogs. They should also be targeted through the newspapers they are most likely to read.
8.6. Disengaged Sceptics
Disengaged Sceptics also make up 13% of the population. The Disengaged Sceptics tend to be less well educated than other clusters, and feel less informed about science. Many were put off science at school. Today, they find science overwhelming, and do not engage with it.
Disengaged Sceptics have concerns about scientific developments, and the ability of the Government to control them. They do not trust scientists to self-regulate, instead having a highly conservative attitude towards science regulation.
While they are not particularly keen to get involved in decision-making on science and technology, they would like the Government and scientists to listen to the public‟s opinions on science issues.
8.6.1. Defining Characteristics
Like the Indifferent, Disengaged Sceptics do not feel informed about science, and are often overwhelmed by it.
Only two in ten (22%) Disengaged Sceptics feel informed about science, compared with over four in ten (43%) overall. They are the most likely cluster to think they “cannot follow developments in science and technology because the speed of development is too fast” (68%, versus 46% overall) and to agree that “I don't think I'm clever enough to understand science and technology” (58%, versus 32% overall).
They tend to be confused about what they do see and hear about science, with nine in ten (90%) thinking that “there is so much conflicting information about science it is difficult to know what to believe” (versus 71% overall). They are also somewhat more likely to think that “the more I know about science, the more worried I am” (30%, versus 24% overall).
These attitudes are likely in part to link back to how Disengaged Sceptics thought of science at school. A third (35%) say that school put them off science (versus 24% overall).
However, unlike the Indifferent, Disengaged Sceptics strongly enjoy new challenges and self-development.
They are overwhelmingly likely to “enjoy new situations and challenges” (92%, versus 81% overall) and to think “it is important for me to keep on learning new skills” (96%, versus 89% overall). This suggests that, unlike the Indifferent, Disengaged Cynic‟s lack of interest in science is less related to a more general apathy.
Disengaged Sceptics have strong concerns about scientific developments, and the ability of Government and scientists to control them.
They are especially worried about the speed of development, being more likely than average to think that “the speed of development in science and technology means that they cannot be properly controlled by Government” (49%, versus 40% overall). They are also concerned

Public Attitudes to Science 2011: Main Report
88
© 2011 Ipsos MORI
about the intentions of scientists, and what they do behind closed doors, being more likely to believe that “rules will not stop scientists doing what they want behind closed doors” (70%, versus 54% overall) and that “scientists seem to be trying new things without stopping to think about the consequences” (48%, versus 41% overall).
Related to this, they tend to favour a relatively conservative approach to science regulation. Two-thirds (67%) think that “people shouldn‟t tamper with nature”, compared with 56% overall. They are also somewhat more likely to agree that “Government should delay the introduction of new medicines or technologies until scientists are completely certain there are no bad side effects” (79%, versus 73% overall) and that “industry should wait until scientists are completely certain that there is no danger to their workers before they use new methods of production” (89%, versus 85% overall).
Disengaged Sceptics do not personally value involvement in science, but want to know the public is being listened to.
Disengaged Sceptics are not particularly keen to get involved – three-fifths (61%) don‟t want to be involved in public consultation on science, but want to know that the public is being consulted. Similarly, they are relatively less likely to agree that “it is important to know about science in my daily life” (52%, compared with 68% overall), but still think others should take an interest, with eight in ten (78%) agreeing that “science is such a big part of our lives that we should all take an interest”.
They want scientists to engage more with the public than they currently do, being more likely than average to agree that “scientists should listen more to what ordinary people think” (76%, versus 66% overall) and that “scientists put too little effort into informing the public about their work” (71%, versus 60% overall). However, they tend to see this as a duty of scientists, not something they should be rewarded for – only a quarter (25%) agree that “scientists should be rewarded for communicating their research to the public” (versus 44% overall).
They also want the Government to have a greater dialogue with the public on science issues, being especially likely to agree that “the Government should act in accordance with public concerns about science and technology” (89%, versus 73% overall) and that “those who regulate science need to communicate with the public” (93%, versus 84% overall).
8.6.2. Demographic Makeup
As Figure 46 shows, Disengaged Sceptics are more likely to be women. They are more likely to come from less affluent social grades (C2DEs), so are similar to the Concerned and the Indifferent is this respect. Around a quarter (23%) have no formal qualifications (versus 16% overall), making them one of the less well educated clusters alongside the Indifferent. Unlike the Concerned and the Indifferent however, they are more evenly spread across the different age groups. Relatively few people from ethnic minority backgrounds belong to this cluster.

Public Attitudes to Science 2011: Main Report
89
© 2011 Ipsos MORI
Figure 46: “Disengaged Sceptics” Cluster Demographics
40%
60%
12%
17%
32%
13%
26%
95%
5%
43%
57%
48%
52%
15%
16%
34%
15%
20%
90%
10%
56%
45%
Male
Female
16-24
25-34
35-54
65+
White
BME
ABC1
C2DE
Gender % of Disengaged Sceptics
% of UK adults aged 16+
Age
Ethnicity
Social Grade
55-64
Base: 269 in Disengaged Sceptics cluster (dark green); 2,103 UK adults aged 16+ (light green)Fieldwork dates: 11 October-19 December 2010
8.6.3. Media Consumption
Disengaged Sceptics are more likely than average to read tabloid newspapers (54%, versus 45% overall) and conversely less likely to read broadsheet newspapers (16%, versus 24% overall). The most popular newspaper in this cluster is the Sun (18% read this).
They are somewhat less likely to have internet access than average (72%, versus 78% overall). Consequently, they generally get their science information from traditional media. They are more likely to say television (66%, versus 54% overall) and newspapers (39%, versus 33% overall) are their most common sources of information on science. Like the Indifferent, they are also more likely to say they would believe scientific findings if they saw them on a television programme (31%, versus 24% overall).
8.6.4. Implications for Communication and Engagement
Given their cynicism about science, it is possible that many Disengaged Sceptics will never be interested in science issues. However, it is equally possible that some will become less cynical if they are targeted for engagement.
Given that they do not see science as useful in their everyday lives, they may engage more strongly with science when it is shown to impact on their daily lives. At the workshops, even the most disengaged participants were interested in hearing about aspects of science such as medicine, which had an impact on them and those around them. In this sense, this cluster requires a similar engagement strategy to the Indifferent.

Public Attitudes to Science 2011: Main Report
90
© 2011 Ipsos MORI
9. Conclusions
This chapter draws out the key themes emerging from PAS 2011.
9.1. The Public Values Science
As with the previous studies, PAS 2011 provides further evidence that the UK public is not anti-science. On the contrary, it suggests that public interest in science has increased since the first PAS study in 2000, and that many want to hear and see more information about science, rather than less. People also generally feel capable of understanding the science issues they are presented with, again more so than in 2000.
There is a strong recognition among the public that science benefits society. This is not only through science‟s economic impact, but also through its impact on policy and on quality of life, as well as its role in entertainment and culture. Related to this, most people support Government funding of science, even for projects that bring no immediate benefits, and even in the context of reduced Government spending across various public services. Public perceptions of science‟s role in culture in particular warrant further investigation, as this research has only touched the surface of public attitudes in this area.
The study also supports the Science and Trust Expert Group‟s assertion that there is no singular “crisis of trust in science”, but rather issues of trust tend to focus around institutions and their use of science.51 People continue to have high levels of trust and confidence in scientists and in science regulation, in spite of recent media controversies such as “climategate”. In fact, the public‟s estimation of scientists has in some ways improved, with more now agreeing scientists want to make life better for the average person than in 2000.
9.2. Attitudes to Science are Not Always Consistent
Looking across all strands of the research, we often find that people have seemingly contradictory views about certain topics, which underline the complexity of public attitudes:
While trust in scientists is high, there are still concerns about what scientists do behind closed doors, and the extent to which they consider the consequences of their work. Similarly, although most assume that scientific research is checked by others before release, people still worry about scientists manipulating data. Here, lack of understanding of the knowledge production process could help explain these conflicting attitudes – people may assume there are checks in place, but tend not to realise there are formalised validation and regulatory processes, for example through ethics committees and peer review.
We also find contrasting views in attitudes towards information. While more people agree finding out about science is easy, and more feel capable of understanding the information they see and hear than in 2005, fewer now feel informed about science. These findings indicate that feeling informed about science is not simply a case of having access to more information.
When it comes to public consultation on science, people think scientists should listen more to the public, but tend to be cynical about public consultation nonetheless. In
51
Science and Trust Expert Group (2010) Starting a National Conversation about Good Science, BIS [p.11.]

Public Attitudes to Science 2011: Main Report
91
© 2011 Ipsos MORI
addition, while most are keen for the public to be involved in decisions about science, they do not necessarily want to be personally involved. These findings suggest that most people want to know that the Government is discussing science issues with the public, and to know the actions taken by Government and scientists as a result of public consultations, but are unlikely to get involved themselves.
Finally, the study also finds apparent contradictions in people‟s view of science in the economy. The vast majority agree that science makes an important contribution to the UK economy, but at the same time many have negative views of scientists working in industry. Here, people‟s answers may to an extent reflect a received wisdom that science is good for the economy, but not an appreciation for the role industry plays in this, especially given that half do not feel informed about how the economy works.
9.3. Attitudes to Science are Not Fixed
The research shows that people are willing to change their attitudes to science based on what they see and hear. In the workshops, participants challenged each other‟s views leading many to reassess their ideas of what constitutes science, and the extent to which science plays a part in people‟s lives. Engaging in a dialogue with the scientists at the workshops also made many participants rethink their initially negative preconceptions of scientists working in more abstract areas of science, and scientists working for industry.
The survey also finds that people can move from an initially negative view of science to a more positive one. This is evident from the Late Adopters cluster, which tends to include people who were put off science when younger, but have since reengaged and are interested in becoming more involved in decisions about science issues that are relevant to their own lives.
9.4. Targeting Communication and Engagement
As noted above, simply increasing the overall amount of information people hear and see about science will not necessarily lead to them feeling better informed. This highlights the need for a more nuanced approach, with the right kind of communication and engagement targeted at the right groups.
As in previous PAS studies, the cluster analysis provides a useful starting point for this targeting, outlining the different engagement strategies required, and also which clusters are most important to focus on. Targeting Late Adopters and Distrustful Engagers is especially important given that they are keen to be more involved in public consultation on science. The Concerned are also a priority cluster since they want to have their concerns about scientists addressed. By contrast, the other clusters are either content with the status quo, or show a lack of willingness to engage, so are perhaps harder to reach.
In terms of demographic groups, the research suggests that young people aged 16-24, women and C2DEs should be priority groups for communication and engagement. Young people tend to be less interested in jobs in science than older age groups, suggesting more work is needed to encourage young people to enter careers in STEM. Women and C2DEs also tend to be relatively less engaged in science (though it is important to note that, even among these groups, the vast majority are enthusiastic about science). Each of these groups also tends to have a greater presence in clusters where there are clear avenues for further engagement, such as the Concerned or the Late Adopters.
With regards to women‟s involvement in science, the study also shows the ongoing need to challenge people‟s preconceptions. Although very few consciously believe that science is

Public Attitudes to Science 2011: Main Report
92
© 2011 Ipsos MORI
not a suitable career for women, many people nonetheless continue to picture scientists as male. In addition, the data suggest parents are somewhat more likely to see science as an activity for boys rather than girls, showing the need to engage parents as well as children.

Public Attitudes to Science 2011: Main Report
93
© 2011 Ipsos MORI
Appendices
Appendix A: Guide to Statistical Reliability
The final data are based on a sample of UK adults, rather than the entire population, so the percentage results are subject to sampling tolerances. These vary with the size of the sample and the percentage figure concerned. For example, for a question where 50% of the 2,103 respondents sampled in this survey give a particular answer, the chances are 95 in 100 that this result would not vary more or less than 2.3 percentage points from the true figure – the figure that would have been obtained had the entire population responded to the survey. The tolerances that may apply in this report are given in the table below.
Size of sample on which survey result is based
Approximate sampling tolerances applicable to percentages at or near these levels
10% or 90%
± 30% or 70%
± 50%
±
2,103 (all respondents) 1.4 2.1 2.3
556 (16-24 year olds) 2.6 3.9 4.3
216 (ethnic minority respondents) 4.4 6.8 7.4
Source: Ipsos MORI
Tolerances are also involved in the comparison of results between different elements of the sample. A difference must be of at least a certain size to be statistically significant. The following table is a guide to the sampling tolerances applicable to comparisons between subgroups for this survey.
Size of sample on which survey result is based
Differences required for significance at or near these percentage levels
10% or 90%
± 30% or 70%
± 50%
±
2,103 versus 2,137 (comparing to PAS 2008)
2.0 3.0 3.5
1,104 versus 999 (comparing men to women)
2.8 4.0 4.3
1,881 versus 216 (comparing White to ethnic minority)
5.6 7.2 7.8
Source: Ipsos MORI
It is important to note that, strictly speaking, the above confidence interval calculations relate only to samples that have been selected using random probability sampling methods. However, in practice it is reasonable to assume that these calculations provide a good indication of the confidence intervals relating to quota surveys.

Public Attitudes to Science 2011: Main Report
94
© 2011 Ipsos MORI
Appendix B: Definition of Social Grades
The table below provides a definition of the social grade classification referred to throughout the report.
Grade Social Class Occupation of Chief Income Earner Percentage of UK Population
A Upper Middle Class Higher managerial, administrative or professional
4.0%
B Middle Class Intermediate managerial, administrative or professional
22.4%
C1 Lower Middle Class Supervisor or clerical and junior managerial, administrative or professional
28.7%
C2 Skilled Working Class
Skilled manual workers 21.0%
D Working Class Semi and unskilled manual workers 15.6%
E Those at the lowest levels of subsistence
State pensioners etc, with no other earnings
8.4%
Sources: National Readership Survey 2007/08 and RAJAR (2010)

Public Attitudes to Science 2011: Main Report
95
© 2011 Ipsos MORI
Appendix C: Quantitative Sample Profile
The table below shows the unweighted and weighted profile of survey respondents.
Attribute Unweighted % Weighted %
Gender Male 52 49
Female 48 51
Age 16-24 26 15
25-34 13 16
35-44 14 18
45-54 14 16
55-64 14 15
65-74 11 10
75+ 8 10
Ethnicity White 89 90
Ethnic minority 10 10
Social Grade AB 25 26
C1 33 29
C2 19 21
DE 23 24
Work Status Working 44 52
Not working 55 48
Country/Region London 11 12
South East 13 14
South West 9 9
North East 4 4
North West 12 11
East of England 9 9
East Midlands 8 7
West Midlands 9 9
Yorkshire & Humberside 9 9
Scotland 8 9
Wales 5 5
Northern Ireland 3 3

Public Attitudes to Science 2011: Main Report
96
© 2011 Ipsos MORI
Appendix D: Qualitative Sample Profile
The table below shows the profile of participants attending the workshops by location. For the Cardiff workshops, participants were exclusively 16-24 years old.
Attribute London Beverley Cardiff Birmingham
Gender Male 6 8 7 9
Female 10 7 5 6
Ethnicity
White 7 15 10 13
Ethnic minority 9 0 2 2
Age 16-24 3 4 12 3
25-39 5 3 - 3
40-59 3 4 - 6
60+ 5 4 - 3
Social grade
ABC1 9 6 5 9
C2DE 7 9 7 6
Parental status
Children under 16 10 7 2 -
No children 6 8 10 -
Total 16 15 12 15
The table below shows the profile of discussion group participants, by location and cluster.
Attribute Huntingdon London
Concerned Late
Adopters Distrustful Engagers
Indifferent
Gender Male 2 4 5 3
Female 6 5 3 3
Ethnicity
White 7 8 4 4
Ethnic minority 1 1 4 2
Age 16-24 6 4 1 0
25-39 2 3 4 2
40-59 0 2 3 4
60+ 0 0 0 0
Social grade
ABC1 6 3 - -
C2DE 2 6 - -
Total 8 9 8 6

Public Attitudes to Science 2011: Main Report
97
© 2011 Ipsos MORI
Appendix E: Factor and Cluster Analyses
Before carrying out the cluster analysis, we carried out a factor analysis on the 77 attitudinal statements in the survey. This technique groups together observed variables, in this case the attitudinal statements, for which respondents‟ answers are highly correlated. It then sorts them into underlying unobserved variables, or factors, that explain the variance in respondents‟ answers.
The 15 factors identified by the analysis account for 46% of the variance in respondents‟ answers. The first three factors alone account for around 22% of the variance, which is similar to the 2008 factor analysis. While this means that just above 50% of the of the variance in responses to the 76 attitudinal statements cannot be explained by these 15 factors, the 15 factor solution is nonetheless sufficient for the purposes of providing a segmentation model that is of practical use and easy to interpret. The table below shows the 15-factor solution, outlining which statements feed into each factor.
No. Factor Description Attitudinal Statements Included in Factor
1 Concerns about science I cannot follow developments in science and technology because the speed of development is too fast
I don't think I'm clever enough to understand science and technology The more I know about science the more worried I am The speed of development in science and technology means that they cannot be
properly controlled by Government Science and technology are too specialised for most people to understand them Scientists seem to be trying new things without stopping to think about the
consequences I don't understand the point of all the science being done today Rules will not stop scientists doing what they want behind closed doors Scientists adjust their findings to get the answers they want Scientific advances tend to benefit the rich more than they benefit the poor I don't really know what an engineer does Science should be seen in isolation from other aspects of human knowledge There is so much conflicting information about science it is difficult to know what to
believe I see science and engineering differently People shouldn't tamper with nature
2 Optimism about science I am amazed by the achievements of science On the whole, science will make our lives easier

Public Attitudes to Science 2011: Main Report
98
© 2011 Ipsos MORI
Science is such a big part of our lives that we should all take an interest Scientists make a valuable contribution to society Even if it brings no immediate benefits, scientific research which advances
knowledge should be funded by the Government Government funding for science should be cut because the money can be better
spent elsewhere Young people's interest in science is essential for our future prosperity In general, scientists want to make life better for the average person The benefits of science are greater than any harmful effect
3 Attitudes towards science communication Those who regulate science need to communicate with the public I would like more scientists to spend more time than they do discussing the social
and ethical implications of their research with the g The Government should act in accordance with public concerns about science and
technology We ought to hear about potential new areas of science and technology before they
happen, not afterwards Scientists should listen more to what ordinary people think When publishing the results of research, scientists should always state how they
were funded Scientists put too little effort into informing the public about their work The public is sufficiently involved in decisions about science and technology
4 Attitudes towards science in careers and in the economy
Jobs in engineering are very interesting Jobs in science are very interesting Because of science and technology there will be more work opportunities for the
next generation Scientific research makes a direct contribution to economic growth in the UK The UK needs to develop its science and technology sector in order to enhance its
international competitiveness The information I hear about science is generally true
5 People's values and beliefs God created the earth and all life in it We are put on earth for a purpose Human beings have evolved from other animals We depend too much on science and not enough on faith
6 Perceived independence of science and scientists
The independence of scientists is often put at risk by the interests of their funders It is important to have some scientists who are not linked to businesses

Public Attitudes to Science 2011: Main Report
99
© 2011 Ipsos MORI
Scientists are too dependent on business and industry for funding Politicians are too easily swayed by the media's reaction to scientific issues The media sensationalises science It's normal for scientists to disagree
7 Attitudes towards science education The maths I learnt at school has been useful in my job The maths I learnt at school has not been useful in my everyday life The science I learnt at school has been useful in my job The science I learnt at school has not been useful in my everyday life School put me off science
8 Attitudes towards involvement in science I feel I could influence Government policy on science if I wanted to For me, it is important to be involved in decisions about science and technology Scientists should be rewarded for communicating their research to the public It is important to know about science in my daily life Finding out about new scientific developments is easy these days
9 Attitudes towards self-development I enjoy new situations and challenges It is important for me to keep on learning new skills
10 Attitudes towards science regulation Government should DELAY the introduction of new medicines or technologies until scientists are completely certain there are no bad side effects
Industry should wait until scientists are completely certain that there is no danger to their workers before they use new methods of production
11 Climate change scepticism Human activity does not have a significant effect on the climate The UK is too small to make an impact on climate change Science is not a suitable career for a woman
12 Attitudes towards science policymaking Experts and not the public should advise the Government about the implications of scientific developments
Politicians should put scientific evidence above public opinion when making decisions
We have no option but to trust those governing science Before scientific findings are announced other scientists have checked them Scientists should be allowed to experiment on monkeys, if this can help cure life
13 Attitudes towards public consultation Public consultation events are just public relations activities and don't make any difference to policy
Public consultation events are unrepresentative of public opinion
14 Trust in Government to resolve fuel/food issues
The UK Government is working hard to ensure that people living in the UK will have enough fuel for our future needs

Public Attitudes to Science 2011: Main Report
100
© 2011 Ipsos MORI
The UK Government is not doing enough to ensure that people living in the UK will have enough food in the future
15 Scepticism about science careers Studying science won't necessarily get you a good job Compared to other professions, engineering offers a well paid career Engineering is a dying industry in the UK
Following the factor analysis, we carried out a cluster analysis to segment the respondents. This was conducted in two steps: the first using the “hierarchical” method, the second using the “K-means” method. Using both methods in this manner allows us to avoid the flaws in both whilst maintaining the benefits of each. We make use of hierarchical segmentation to identify the initial cluster centres, and use these as the bases for the K-means analysis. By doing so we avoid the use of some arbitrary or random starting point for the K-means analysis (which can lead to local optima), and at the same time we are able to use K-means analysis to reallocate respondents into the cluster with the nearest cluster centre, thereby minimising the Euclidean sum of squares.
Three and four cluster solutions were ruled out as these were less robust statistically and representing the UK population in terms of three or four attitudinal clusters would be an over-simplification. Both the three and four cluster solutions produced groups whose views on science and whose demographic characteristics were less distinct.
The final decision was therefore between the five and the six cluster solutions. The six cluster solution was preferred as it split out two groups – which were merged together in the five cluster solution – with important differences in terms of attitudes to science. The six clusters were distinct in terms of the demographic profiles and, statistically, the six cluster solution is robust with each of the 15 factors contributing significantly to the model.
While solutions with seven or more clusters were statistically robust, these were less coherent than the six cluster solution. Increasing the number of clusters complicated the statistical model and the resulting clusters were less distinct in terms of their attitudes towards science. In conclusion, the six cluster solution was the most useful in terms of describing the UK population for practitioners and policymakers.

Public Attitudes to Science 2011: Main Report
101
© 2011 Ipsos MORI
The table below shows the factor scores for each cluster. A positive factor score indicates a positive correlation between this factor and a particular cluster. A negative score indicates a negative correlation. For example, Indifferent have a score of -1.07 for factor nine, attitudes towards self-development, which means people in this cluster are less likely to value self-development than average.
No. Factor Description Cluster Name
Concerned Indifferent Late
Adopters Confident Engagers
Distrustful Engagers
Disengaged Sceptics
1 Concerns about science 0.35 -0.30 0.06 -0.74 -0.28 0.53
2 Optimism about science -0.05 -0.28 -0.08 0.22 0.34 -0.40
3 Attitudes towards science communication -0.21 -0.08 0.19 -0.19 -0.06 0.50
4 Attitudes towards science in careers and in the economy
-0.47 0.21 0.22 -0.24 0.30 0.18
5 People's values and beliefs 0.47 0.16 -0.31 -0.28 -0.49 0.13
6 Perceived independence of science and scientists
-0.30 -0.05 -0.19 0.67 0.12 0.02
7 Attitudes towards science education -0.19 0.31 0.69 -0.65 -0.55 0.14
8 Attitudes towards involvement in science 0.42 -0.36 0.59 0.15 0.07 -1.21
9 Attitudes towards self-development 0.21 -1.07 0.33 0.01 0.20 0.63
10 Attitudes towards science regulation 0.05 0.23 0.36 -0.67 -0.29 0.09
11 Climate change scepticism 0.51 0.27 -0.64 -0.48 0.35 -0.24
12 Attitudes towards science policymaking 0.04 -0.18 0.05 0.41 -0.65 0.31
13 Attitudes towards public consultation -0.44 0.27 0.08 -0.19 0.51 -0.03
14 Trust in Government to resolve fuel/food issues
0.16 0.33 -0.24 0.29 -0.71 -0.06
15 Scepticism about science careers 0.06 -0.12 -0.28 -0.43 0.73 0.23

Public Attitudes to Science 2011: Main Report
102
© 2011 Ipsos MORI
Appendix F: Questionnaire
READ OUT Good morning/afternoon/evening. My name is … from Ipsos MORI, the research organisation, and we are carrying out a survey on various issues. After the first few questions, we will give you a little more information about the topic. The interview will take around 40 minutes. We will tell you the name of the organisation that has commissioned Ipsos MORI to do this survey at the end of the interview. I would like to assure you that all the information we collect will be kept in the strictest confidence, and used for research purposes only. The results will be presented as percentages, or individual (non-identifiable) comments. It will not be possible to identify any particular individual or address in the results. ASK ALL Q1. Which two or three issues in your life, if any, are most important to you personally? IF NECESSARY: What else? DO NOT PROMPT PROBE FOR UP TO THREE CODE NULL FOR NONE OF THESE Animal rights/Animal welfare Anti-social behaviour/Tackling anti-social behaviour Arts/Culture/Literature Bringing up children/Caring for a relative Career/Job/Having a job (i.e. paid work) Crime/Tackling crime/Law & Order/Vandalism Defence/Foreign affairs/War Economy/Cost of living/Inflation My education/A good education Education system/A good education system Environmental issues/Climate change Europe/EU/Relations with France, Germany etc Friends and family Happiness My health/Good health Healthcare system/A good healthcare system/NHS History/Heritage/Preserving our heritage Housing/Having a good home to live in Human rights/Legal rights/Civil liberties/ID cards Money/Having financial security Pensions/Benefits Politics/Political issues/Current affairs Public sector cuts/Government spending Public transport/Having good public transport Race relations/Immigration/Asylum seekers Religion/Faith Science/Cloning/Animal experimentation etc Terrorism/Tackling terrorism Traffic congestion/Tackling traffic congestion Unemployment/Factory closure/Lack of industry Other – specify (MP UP TO THREE; allow DK and NULL) ASK ALL

Public Attitudes to Science 2011: Main Report
103
© 2011 Ipsos MORI
Q2. When I talk about “the sciences”, what comes to mind? DO NOT PROMPT PROBE FULLY CODE NULL FOR NOTHING Advancement/Progress/The future/Better world/Helping mankind/Easier living/Easier life Animal experiments Archaeology Biology/Chemistry/Physics Boffins/Nerds/Eccentric/Crazy/Mad/Mad professor/Mysterious Bombs/War/Destruction of mankind Boring/Dull Laboratory/Labs Bunsen burners Test tubes/Chemicals Chemical reaction Communications/Phones Computers/IT Difficult/Difficult to understand Disliked at school/Horrible teacher Economic benefits/Jobs in the sciences Engineering Environment/Nature/Plants Experiment/Inquisitive/Understanding Fiction/Science fiction Food/Food production Genetics/DNA/GM food/GM crops Health/Drugs/Cures for diseases/Hospitals/Doctors/Medicine/Hygiene Ideas/Innovation/Invention/Discovery/Research/Analysis/Logic Important/Necessary Nanotechnology New appliances/New technology Preserving our heritage School Science festival/Science Museum/centre Social sciences/Economics/Psychology/Sociology Space/Rockets/Astronomy Test-tube babies/IVF Understanding human behaviour/Society White coats/Lab coats Other – specify (MP; allow DK and NULL) ASK ALL Q3. When I say “public consultation on science” what, if anything, springs to mind? DO NOT PROMPT PROBE FULLY CODE NULL FOR NOTHING Asking/Getting public opinion/views Consulting the public Discussion/Forum/Talking Government/Government involvement Informing the public Internet/Websites It‟s a bad idea It‟s a good idea It‟s a waste of time It‟s a waste of money

Public Attitudes to Science 2011: Main Report
104
© 2011 Ipsos MORI
It won‟t change anything/Government doesn‟t really listen Media/News stories/TV programmes about science Polls/Surveys Public don‟t know enough/understand enough Public health consultation/Department of Health Public meeting/Meetings Publishing/Making information available There is too much There‟s not enough/There should be more Never heard of it Other – specify (MP; allow DK and NULL) READ OUT And now I‟d like to focus more on science... ASK ALL SHOWCARD A (R) Q4. How well informed do you feel, if at all, about science, and scientific research and developments? Very well informed Fairly well informed Not very well informed Not at all informed (SP; allow DK) ASK ALL SHOWCARD B (R) Q5. Which of the following statements on this card do you most agree with? Just read out the letter that applies. A. These days I hear and see far too much information about science B. These days I hear and see too much information about science C. These days I hear and see the right amount of information about science D. These days I hear and see too little information about science E. These days I hear and see far too little information about science (SP; allow DK) ASK ALL SHOWCARD C (R) Q6. From which one or two of these, if any, do you hear or read about new scientific research findings most often? Just read out the letter or letters that apply. CODE NULL FOR NONE OF THESE A. Books B. Directly from scientists C. Friends and family D. Films E. Magazines F. Print newspapers G. Radio H. Science blogs I. Other internet websites (not science blogs) J. Scientific journals K. TV L. Work colleagues Other – specify (MP UP TO TWO; allow DK and NULL)

Public Attitudes to Science 2011: Main Report
105
© 2011 Ipsos MORI
ROTATE ORDER OF Q7 AND Q8 ASK ALL Q7. What, if any, would you say are the main BARRIERS to having greater public involvement in decision-making about science? DO NOT PROMPT PROBE FULLY CODE NULL FOR NOTHING Campaigns by activist groups Commercial or other barriers to making information available to the public Government policy Lack of awareness among scientists of the public‟s understanding of science Lack of communication skills among scientists Lack of public interest in science Level of public concern about science Mistrust of politicians/decision makers Mistrust of scientists Public don‟t have time Public‟s lack of understanding of science/scientific processes Scientific jargon/technical language/the terminology The negative image of scientists Other – specify (MP; allow DK and NULL) ASK ALL Q8. What, if any, would you say are the main BENEFITS to society from having greater public involvement in decision-making about science? DO NOT PROMPT PROBE FULLY CODE NULL FOR NOTHING Appreciation of where taxes go/justify research funding Better decision-making Better media coverage Better science education in schools Enables the public to judge science issues for themselves Enables the public to make informed decisions about their lives Greater/quicker scientific progress and adoption of technologies Improved democracy/accountability Improvements in the economy Improved public trust in policy-makers and decision-makers Less opposition to scientific research Medical benefits More balanced debate More funding for science More tolerance/trust of scientists Promotes interest in/understanding of science Other – specify (MP; allow DK and NULL) ASK ALL Q9. As far as you know, who funds scientific research in the UK? DO NOT PROMPT PROBE FULLY The Government/Taxpayer

Public Attitudes to Science 2011: Main Report
106
© 2011 Ipsos MORI
Private industry/business/companies Charities Universities Wealthy individuals Other – specify (MP; allow DK) ASK ALL SHOWCARD D (R) Q10. I‟m going to read out a list of topics. Could you tell me, using this card, how well informed you feel, if at all, about each topic? ROTATE ORDER a. Genetically modified plants (GM crops) b. The use of animals in research c. Ensuring the UK has enough food d. Nuclear power e. Medical ethics f. Radioactive waste g. Stem cells research h. Synthetic biology i. Research into human behaviour j. Human rights k. Climate change l. The way the economy works m. Clinical trials n. Vaccination of people against diseases o. Renewable energy p. Nanotechnology Very well informed Fairly well informed Not very well informed Not at all informed Have never heard of it (SP; allow DK) ASK ALL SHOWCARD E (R) Q11. From what you know or have heard about [INSERT ISSUE FROM LIST BELOW], which of these statements, if any, most closely reflects your own opinion? Just read out the letter that applies. ROTATE ORDER CODE NULL FOR NONE OF THESE a. Genetically modified plants (GM crops) b. The use of animals in research c. Nuclear power d. Stem cells research e. Synthetic biology – that is, designing new biological parts or systems that do not already exist,
or modifying existing ones f. Climate change g. Clinical trials h. Vaccination of people against diseases i. Renewable energy j. Nanotechnology – that is, using tiny particles in manufacturing different sorts of products Benefits far outweigh the risks Benefits slightly outweigh the risks The risks and benefits are about the same

Public Attitudes to Science 2011: Main Report
107
© 2011 Ipsos MORI
Risks slightly outweigh the benefits Risks far outweigh the benefits (SP; allow DK and NULL) ASK ALL SHOWCARD F (R) NOT INCLUDING CODE 5 Q12. How confident, if at all, are you that scientists in the UK have thoroughly considered the risks of new technologies before they are used? Very confident Fairly confident Not very confident Not at all confident It depends on the area they work in (SP; allow DK) ASK ALL SHOWCARD F (R) AGAIN, NOT INCLUDING CODE 5 Q13. How confident, if at all, are you that the work of the following groups of people is well regulated in the UK? READ OUT EACH PROFESSION ROTATE ORDER a. Scientists working for Government b. Scientists working for private companies c. Scientists working for universities d. Scientists working for charities e. Scientists working for environmental groups Very confident Fairly confident Not very confident Not at all confident It depends on the area they work in (SP; allow DK) ASK ALL Q14. As far as you know, who, if anyone, sets the rules and regulations for scientists in the UK to follow when they are doing their job? DO NOT PROMPT PROBE FULLY CODE NULL FOR NO ONE Scientists themselves The Government/Government agency/department/quango Parliament/Westminster/Scottish Parliament/Welsh Assembly/Northern Ireland Assembly The general public Business/industry/companies/the companies the scientists work for Campaign groups/the campaign groups the scientists work for Charities/the charities the scientists work for Environmental groups/the environmental groups the scientists work for Ethics Committees Global body (unspecified) Health and Safety Executive (HSE) The European Union (EU)/Brussels Local council The NHS The Royal Society

Public Attitudes to Science 2011: Main Report
108
© 2011 Ipsos MORI
Research Councils Scientific professional bodies The United Nations (UN) Universities/The universities the scientists work for Other (MP allow DK and NULL) ASK ALL Q15. Who, if anyone, do you think should set the rules and regulations for scientists in the UK to follow when they are doing their job? DO NOT PROMPT PROBE FULLY CODE NULL FOR NO ONE Scientists themselves The Government/Government agency/department/quango Parliament/Westminster/Scottish Parliament/Welsh Assembly/Northern Ireland Assembly The general public Business/industry/companies/the companies the scientists work for Campaign groups/the campaign groups the scientists work for Charities/the charities the scientists work for Environmental groups/the environmental groups the scientists work for Ethics Committees Global body (unspecified) Health and Safety Executive (HSE) The European Union (EU)/Brussels The NHS The Royal Society Research Councils Scientific professional bodies The United Nations (UN) Universities/The universities the scientists work for Other (MP; allow DK and NULL) ASK ALL SHOWCARD G (R) Q16. I am now going to read out some statements. For each of the statements, please could you tell me the extent to which you agree or disagree? ROTATE ORDER a. The UK Government is working hard to ensure that people living in the UK will have enough fuel
for our future needs b. We depend too much on science and not enough on faith c. Human beings have evolved from other animals d. The UK Government is not doing enough to ensure that people living in the UK will have
enough food in the future e. We are put on earth for a purpose f. Human activity does not have a significant effect on the climate g. People shouldn‟t tamper with nature h. The UK is too small to make an impact on climate change i. I enjoy new situations and challenges j. God created the earth and all life in it k. It is important for me to keep on learning new skills Strongly agree Tend to agree Neither agree nor disagree Tend to disagree

Public Attitudes to Science 2011: Main Report
109
© 2011 Ipsos MORI
Strongly disagree (SP; allow DK) ASK ALL Q17. SHOWCARD H (R) Which, if any, of the things on this list have you visited or attended in the last 12 months? CODE NULL FOR NONE OF THESE A. Science museum B. Science and Discovery Centre C. Art gallery D. Another type of museum (not science or art) E. Music festival F. Literature festival G. Science festival H. Library or archive I. Laboratory or similar scientific site J. Live concert K. Theatre L. Theme park M. Planetarium N. Zoo O. Lecture/Talk on a science-related subject outside school, college or university P. Public meeting or debate on a science-related subject Q. Science-related activity at a school, community centre or university, outside regular classes R. Sporting event as a spectator S. Tourist attraction visitor centre T. Historic house or garden (MP; allow DK and NULL) ASK FOR EACH ANSWER AT Q17 Q18. How many times have you been to or visited [INSERT STATEMENT FROM Q17] in the last 12 months? CODE NUMBER FROM 1-99 SOFT CHECK: INTERVIEWER TO RECONFIRM IF ABOVE 20 TIMES (Allow DK) ASK FOR EACH ANSWER AT Q17 Q19. And on your last visit, who, if anyone, did you go to the [INSERT STATEMENT FROM Q17] with? DO NOT PROMPT Went alone Son(s) (including step or foster) Daughter(s) (including step or foster) Mother (including step or foster) Father (including step or foster) Sister(s) (including step) Brothers (including step) Partner Friends With school, college or university Other relative (including in-laws) Other (non-relative) (SP code 1; MP code 2-12; allow DK) ASK ALL SHOWCARD I (R)

Public Attitudes to Science 2011: Main Report
110
© 2011 Ipsos MORI
Q20. I am now going to read out some statements about science. For each of the statements, please could you tell me the extent to which you agree or disagree? ROTATE ORDER a. I don‟t understand the point of all the science being done today b. Finding out about new scientific developments is easy these days c. I don‟t think I‟m clever enough to understand science and technology d. Science is such a big part of our lives that we should all take an interest e. Even if it brings no immediate benefits, scientific research which advances knowledge should
be funded by the Government f. I am amazed by the achievements of science g. I see science and engineering differently h. School put me off science i. The benefits of science are greater than any harmful effect j. I cannot follow developments in science and technology because the speed of development is
too fast k. Government funding for science should be cut because the money can be better spent
elsewhere l. Science and technology are too specialised for most people to understand them m. It is important to know about science in my daily life n. The speed of development in science and technology means that they cannot be properly
controlled by Government o. On the whole, science will make our lives easier p. The more I know about science the more worried I am q. Scientific advances tend to benefit the rich more than they benefit the poor r. Politicians should put scientific evidence above public opinion when making decisions s. I don‟t really know what an engineer does t. Science should be seen in isolation from other aspects of human knowledge Strongly agree Tend to agree Neither agree nor disagree Tend to disagree Strongly disagree (SP; allow DK) ASK ALL SHOWCARD J (R) Q21. Which, if any, of these words or phrases would you use to describe scientists? Just read out the letter or letters that apply. PROBE FULLY CODE NULL FOR NONE OF THESE A. Bookish B. Detached C. Friendly D. Good at public relations E. Independent F. Narrow-minded G. Objective H. Poor at public relations I. Rational J. Secretive K. Serious L. Socially responsible M. Too inquisitive N. Trustworthy O. Powerful (MP; allow DK and NULL)

Public Attitudes to Science 2011: Main Report
111
© 2011 Ipsos MORI
ASK ALL Q22. I am going to read out a number of statements. For each one, I would like you to tell me whether you think it is true or false. ROTATE ORDER NOTE TO INTERVIEWER: IF NECESSARY, ALLOW RESPONDENTS A FEW SECONDS TO THINK BEFORE ANSWERING a. UK law states that all medicines must be tested on animals before being used on people b. Any scientist in the UK can carry out experiments on animals without a licence c. The testing of new drugs on people is not regulated in the UK d. You need a licence before you can plant genetically-modified (GM) crops in the UK e. The Government does not regulate the disposal of radioactive waste in the UK True False (SP; allow DK) ROTATE ORDER OF Q23 AND Q24 ASK ALL SHOWCARD K (R) [AGAIN] Q23. [And] how much, if at all, do you trust each of the following to follow any rules and regulations which apply to their profession? READ OUT EACH PROFESSION ROTATE ORDER ADD [And] AND [AGAIN] IF ASKED AFTER Q24 a. Scientists working for Government b. Scientists working for private companies c. Scientists working for universities d. Scientists working for charities e. Scientists working for environmental groups A great deal A fair amount Not very much Not at all (SP; allow DK) ASK ALL SHOWCARD K (R) [AGAIN] Q24. [And] how much, if at all, do you trust each of the following to follow any rules and regulations which apply to their profession? READ OUT EACH PROFESSION ROTATE ORDER ADD [And] AND [AGAIN] IF ASKED AFTER Q23 a. Engineers working for private companies b. Engineers working for universities c. Researchers working for Government d. Researchers working for universities e. University lecturers A great deal A fair amount Not very much Not at all

Public Attitudes to Science 2011: Main Report
112
© 2011 Ipsos MORI
(SP; allow DK) ASK ALL Q25. Would you say you personally trust scientists more or less, or about the same as you did five years ago? IF MORE OR LESS: Is that (… a little more/a little less), or (… much more/much less)? Trust them much more Trust them a little more About the same Trust them a little less Trust them much less (SP allow DK) ASK ALL SHOWCARD L (R) Q26. I am now going to read out some statements about scientists. For each of the statements, please could you tell me the extent to which you agree or disagree? ROTATE ORDER a. Scientists make a valuable contribution to society b. Before scientific findings are announced, other scientists have checked them c. It‟s normal for scientists to disagree d. Scientists adjust their findings to get the answers they want e. In general, scientists want to make life better for the average person f. Scientists seem to be trying new things without stopping to think about the consequences g. Rules will not stop scientists doing what they want behind closed doors h. It is important to have some scientists who are not linked to businesses i. The independence of scientists is often put at risk by the interests of their funders j. Government should delay the introduction of new medicines or technologies until scientists are
completely certain there are no bad side effects k. Industry should wait until scientists are completely certain that there is no danger to their
workers before they use new methods of production l. Scientists should listen more to what ordinary people think m. Scientists should be allowed to experiment on monkeys, if this can help cure life-threatening
human diseases n. Scientists are too dependent on business and industry for funding Strongly agree Tend to agree Neither agree nor disagree Tend to disagree Strongly disagree (SP; allow DK) ASK ALL SHOWCARD M (R) Q27. In general, how good was the teaching of science at your secondary school compared with the teaching of other subjects? Just read out the letter that applies. A. Much better B. A little better C. About the same D. A little worse E. Much worse F. Didn‟t study any science subjects (SP; allow DK)

Public Attitudes to Science 2011: Main Report
113
© 2011 Ipsos MORI
ASK ALL ANSWERING CODE 1-2 AT Q27 Q28. Why do you say that the teaching of science was better than other subjects? DO NOT PROMPT PROBE FULLY Good textbooks Exams were easy Liked the teacher(s) Practicals/experiments brought it to life/liked doing them Subject was easy Subject was interesting Subject was worthwhile/important/could see the point of it Teacher(s) was very good Was good at science/performed well Other – specify (MP; allow DK) ASK ALL ANSWERING CODE 4-5 AT Q27 Q29. Why do you say that the teaching of science was worse than other subjects? DO NOT PROMPT PROBE FULLY Bad textbooks Exams were hard Didn‟t like doing practicals/experiments Didn‟t like the teacher(s) Subject was hard Subject was not interesting Subject was not worthwhile/not important/couldn‟t see the point of it Teacher(s) was not very good Was not good at science/performed badly Other – specify (MP; allow DK) ASK ALL Q30. Did your school have any science or engineering clubs while you were there? This might have been at lunch time or after school. Yes No (SP; allow DK) ASK ALL ANSWERING CODE 1 AT Q30 Q31. And did you ever go to any of these science or engineering clubs while you were at school? Yes No (SP; allow DK) ASK ALL SHOWCARD N (R) Q32. I‟m going to read out some statements about studying and working in science. For each of the statements, please could you tell me the extent to which you agree or disagree? ROTATE ORDER

Public Attitudes to Science 2011: Main Report
114
© 2011 Ipsos MORI
a. Because of science and technology there will be more work opportunities for the next generation
b. The science I learnt at school has not been useful in my everyday life c. Science is not a suitable career for a woman d. Engineering is a dying industry in the UK e. The maths I learnt at school has not been useful in my everyday life f. Young people‟s interest in science is essential for our future prosperity g. Compared to other professions, engineering offers a well paid career h. The science I learnt at school has been useful in my job i. Studying science won‟t necessarily get you a good job j. The UK needs to develop its science and technology sector in order to enhance its international
competitiveness k. Jobs in science are very interesting l. The maths I learnt at school has been useful in my job m. Jobs in engineering are very interesting n. Scientific research makes a direct contribution to economic growth in the UK Strongly agree Tend to agree Neither agree nor disagree Tend to disagree Strongly disagree (SP; allow DK) ASK ALL SHOWCARD O (R) Q33. How much effort do you think the Government is making to consult the public on science? Just read out the letter that applies. A. A great deal of effort B. A fair amount of effort C. Not very much effort D. No effort at all (SP; allow DK) ASK ALL SHOWCARD P (R) Q34. Which of these statements, if any, comes closest to your own attitude to public consultation on science issues? Just read out the letter that applies. A. I‟m not interested in public consultation on science issues, as long as scientists are doing their
jobs B. I would like to know that the public are consulted on science issues, but I don‟t want to be
involved personally C. I would like to have more of a say in science issues D. I would like to become actively involved in public consultations on science issues E. I am already actively involved in public consultations on science issues (SP; allow DK) ASK ALL SHOWCARD Q (R) Q35. Here are some things which other people have said about how science is communicated and discussed. For each of the statements, please could you tell me the extent to which you agree or disagree? ROTATE ORDER a. Public consultation events are just public relations activities and don‟t make any difference to
policy

Public Attitudes to Science 2011: Main Report
115
© 2011 Ipsos MORI
b. Public consultation events are unrepresentative of public opinion c. When publishing the results of research, scientists should always state how they were funded d. The Government should act in accordance with public concerns about science and technology e. Those who regulate science need to communicate with the public f. We have no option but to trust those governing science g. For me, it is important to be involved in decisions about science and technology h. The public is sufficiently involved in decisions about science and technology i. Experts and not the public should advise the Government about the implications of scientific
developments j. There is so much conflicting information about science it is difficult to know what to believe k. Politicians are too easily swayed by the media‟s reaction to scientific issues l. Scientists put too little effort into informing the public about their work m. The information I hear about science is generally true n. Scientists should be rewarded for communicating their research to the public o. The media sensationalises science p. I would like more scientists to spend more time than they do discussing the social and ethical
implications of their research with the general public q. We ought to hear about potential new areas of science and technology before they happen, not
afterwards r. I feel I could influence Government policy on science if I wanted to Strongly agree Tend to agree Neither agree nor disagree Tend to disagree Strongly disagree (SP; allow DK) ASK ALL ANSWERING CODE 1-2 AT Q35M Q36. You said that you agree that the information you hear about science is generally true. Why do you say that? DO NOT PROMPT PROBE FULLY It‟s checked by journalists It‟s checked by other scientists It‟s checked by someone (unspecified) It comes directly from scientists Regulation/Science is regulated Have no reason to doubt it No particular reason/That‟s my view Other – specify (MP; allow DK) ASK ALL ANSWERING CODE 4-5 AT Q35M Q37. You said that you disagree that the information you hear about science is generally true. Why do you say that? DO NOT PROMPT PROBE FULLY It‟s not checked by journalists It‟s not checked by other scientists It‟s not checked by anyone (unspecified) It does not come directly from scientists No proof/evidence/Believe it if I can see it Weak regulation/Science is not regulated Have no reason to trust it No particular reason/That‟s my view Other – specify

Public Attitudes to Science 2011: Main Report
116
© 2011 Ipsos MORI
(MP; allow DK) ASK ALL SHOWCARD R (R) Q38. Which of these, if any, would make you more likely to believe the findings of scientific studies? Just read out the letter or letters that apply. CODE NULL FOR NONE OF THESE PROBE FULLY A. If I heard the same thing from a number of different sources B. If they fitted in with other things I know already C. If I could see the original study for myself D. If my friends and family thought they were true E. If I read them in a broadsheet newspaper F. If I read them in a tabloid newspaper G. If I saw them on a TV programme H. If I saw them on the internet I. If they had been published in a scientific journal J. If the research had been done in the UK K. If I knew that the findings had been formally reviewed by other scientists L. If I had heard of the place where the research was done Other – specify (MP; allow DK and NULL) CODE WITHOUT ASKING QA Gender Male Female (SP) ASK ALL QB Exact age CODE EXACT AGE (Allow REF) ASK ALL QC Working status of respondent Working – Full time (30+ hrs) Working – Part-time (9-29 hrs) Unemployed Not working – retired Not working – looking after house/children Not working – invalid/disabled Student Other (SP; allow REF) ASK ALL SHOWCARD S QD Please indicate the highest educational or professional qualification that you have obtained to date, if any? Just read out the letter that applies. IF STILL STUDYING, CHECK FOR HIGHEST ACHIEVED SO FAR

Public Attitudes to Science 2011: Main Report
117
© 2011 Ipsos MORI
A. GCSE/O Level/CSE B. Vocational qualifications (=NVQ1+2) C. A Level or equivalent (=NVQ3) D. Bachelor Degree or equivalent (=NVQ4) E. Masters/PhD or equivalent F. Other G. No formal qualifications (SP; allow DK and REF) ASK ALL ANSWERING CODE 4 OR 5 AT QD QE DO NOT PROMPT And what was the main subject of your degree? Arts/humanities subject (literature, classics, geography, history, religion etc) Engineering subject Language subject (French etc) Medicine/Dentistry/Pharmacy etc Science/Maths subject Social science subject (economics, psychology, sociology etc) Other (SP; allow DK and REF) ASK ALL QF Occupation of Chief Income Earner PROBE FULLY FOR PENSION Position/rank/grade Industry/type of company Quals/degree/apprenticeship Number of staff responsible for WRITE IN FOR EACH CODE CODE BASED ON QF QG Social grade A B C1 C2 D E (SP; allow REF) ASK ALL QH Respondent is… Chief income earner Not chief income earner (SP; allow REF) ASK ALL QI Number of children aged 15 and under in household None 1

Public Attitudes to Science 2011: Main Report
118
© 2011 Ipsos MORI
2 3 4 or more (SP; allow DK and REF) ASK ALL ANSWERING CODES 2-5 AT QI (1 OR MORE CHILDREN IN HOUSEHOLD) QJ What ages are the children, aged 15 and under, in your household? 0-4 5-7 8-10 11-15 (MP; allow DK and REF) ASK ALL SHOWCARD T QK Which of the following applies to you and your household? Just read out the letter or letters that apply. CODE NULL FOR NONE OF THESE A. E-mail at home B. E-mail at work, place of study or elsewhere C. Internet at home D. Internet at work, place of study or elsewhere E. PC, laptop or notebook at home F. PC, laptop or notebook at work, place of study or elsewhere G. Interactive Digital TV (MP; allow DK and NULL) ASK ALL SHOWCARD U (R) QL In which of these ways have you used the Internet in the last three months? Just read out the letter or letters that apply. You can mention as many or as few as you wish. CODE NULL FOR NONE OF THESE A. For sending/receiving emails B. Download/stream movies C. Download/stream music D. Download/stream TV programmes/clips (e.g. BBC iPlayer, ITV Player, 4oD, Sky player) E. Grocery shopping online F. I have my own blog/to update my own blog G. Online dating H. Online gaming/playing for money (e.g. poker, bingo) I. Play video games online (e.g. simple/casual games or multi-player games versus other
players)/not for money gaming J. To buy products/services online (not groceries) K. To check on my bank account and other financial holdings L. To look for a job/search job (recruitment) sites M. To visit sites for information on hobbies and personal interests N. To visit sites for information on products/services I am thinking of buying O. To visit social networking sites (such as Facebook, Twitter, Bebo or Friends Reunited), or to
look at or/and to take part in discussion forums or blogs P. Voice Over IP (e.g. making a telephone call using an internet connection/making calls over the
internet using a service such as Skype but excluding MSN Messenger) Q. For something else (MP; allow DK) ASK ALL

Public Attitudes to Science 2011: Main Report
119
© 2011 Ipsos MORI
SHOWCARD V (R) QM Which, if any, of the following applies to you? Just read out the letter or letters that apply. CODE NULL FOR NONE OF THESE A. Been a member of a science organisation in the last 5 years B. Currently subscribe to a science magazine C. Have (ever) worked as a scientist or engineer D. Have bought a science magazine in the past year E. Have studied science to GCSE/O Level F. Have studied science to A Level G. Have taught a science subject H. I am a scientist I. I am an engineer J. I have never met a scientist or engineer K. I have scientists or engineers among my friends and relatives L. I meet scientists or engineers frequently (i.e. at least once a month) M. I meet scientists or engineers infrequently (less than once a year) N. I work with scientists or engineers O. Member of a science organisation P. Once subscribed to a science magazine but don‟t now Q. I have looked up scientific information on the internet R. I regularly read science blogs (i.e. at least once a week) S. I regularly read other internet websites (not blogs) on science and technology (i.e. at least once
a week) (MP; allow DK and NULL) ASK ALL SHOWCARD W QN Which of the groups on this card do you consider you belong to? Again, just read out the letter that applies. A. British B. Irish C. Any other white background (PLEASE WRITE IN) D. Indian E. Pakistani F. Bangladeshi G. Any other Asian background (PLEASE WRITE IN) H. Caribbean I. African J. Any other black background (PLEASE WRITE IN) K. White and Black Caribbean L. White and Black African M. White and Asian N. Any other mixed background (PLEASE WRITE IN) O. Chinese P. Any other background (PLEASE WRITE IN) (SP; allow REF) ASK ALL SHOWCARD X (R) QO Here is a list of daily newspapers. Which, if any, of these do you read or look at regularly? By regularly I mean on average at least three out of four issues. CODE NULL FOR NONE OF THESE A. Daily Express B. Daily Mail C. Daily Mirror

Public Attitudes to Science 2011: Main Report
120
© 2011 Ipsos MORI
D. Daily Record E. Daily Telegraph F. Financial Times G. The Guardian H. The Herald (Glasgow) I. The Independent J. Metro K. The Scotsman L. Daily Star M. The Sun N. The Times O. Evening Standard Other (MP allow NULL) ASK ALL SHOWCARD Y (R) QP And which, if any, of these Sunday newspapers do you read or look at regularly? By regularly I mean on average at least three out of four issues. CODE NULL FOR NONE OF THESE A. News of the World B. Daily Star Sunday C. Sunday Express D. Sunday Mail (Scotland only) E. Sunday Mirror F. Sunday Post G. The Sunday Telegraph H. The Mail on Sunday I. The Observer J. Sunday People K. The Sunday Times L. Scotland on Sunday M. The Independent on Sunday N. Sunday Business O. Sunday Herald Other (MP allow NULL) THANK RESPONDENT AND CLOSE WITH “Ipsos MORI is conducting this research on behalf of the Government Department for Business, Innovation and Skills”.

Public Attitudes to Science 2011: Main Report
121
© 2011 Ipsos MORI
Appendix G: List of Scientists Attending Workshops
The British Science Association (BSA) recruited two scientists to attend each workshop. We applied flexible recruitment quotas to ensure that the scientists represented a range of fields (including social science fields) and worked for a range of different institutions. In the table below, we provide details of the scientists that attended each workshop.
Location Date Scientist52 Field
London
11 September
Dr Kate Mandeville Public health
Dr Lewis Dartnell Astrobiology
25 September
Dr Jennifer Wild Psychology
Dr James Kneale Human geography
Beverley
11 September
Dr Caroline Branigan Plant biochemistry
Dr Martin Hegarty Chemistry/engineering
25 September
Dr Sarah Elton Anthropology
Dr David Jenkins Nuclear physics
Cardiff
27 November
Peter Coles Astrophysics and cosmology
Dr Vicki Stevenson Energy research
11 December
Cerys Ponting Social sciences sustainability research
Dr Kelly Bérubé Environmental toxicology
Birmingham
27 November
- Cell biology/cancer
Dr Joanna Lumsden Human computer interaction/computer science
11 December
Professor Alison Hodge MBE
Business/university interactions in science and engineering
Tulpesh Patel Cognitive neurosciences
52
We have only included scientists‟ names where they have given permission to do so.

Public Attitudes to Science 2011: Main Report
122
© 2011 Ipsos MORI
Appendix H: List of PAS Steering Group Members
Below, we provide a list of those in the PAS steering group (in alphabetical order) and their respective institutions. The steering group was chaired by Karen Folkes from BIS.
Name Institution
Professor Martin Bauer London School of Economics (LSE)
Dr Marilyn Booth Science and Society, BIS
Dr Cate Dobson Science and Society, BIS
Dr Robert Doubleday Department of Geography, University of Cambridge
Professor Peter Elias Institute for Employment Research (IER), University of Warwick
Dr Rosa Fernandez Science & Innovation Analysis, BIS
Karen Folkes Deputy Head, Science and Society, BIS
Sally Gold Shell
Sir Roland Jackson British Science Association (BSA)
Sarah Jones Association of the British Pharmaceutical Industry (ABPI)
Dr Suzanne King People, Science & Policy (PSP)
Dr Kerry Leslie Research Councils UK (RCUK)
Dr Rebecca Lumsden ABPI
Dr Lesley Paterson Royal Academy of Engineering
Ruth Potter RCUK
Neil Randerson EngineeringUK
Chloe Sheppard RCUK
Dr Jack Stilgoe Royal Society
Dr Ed Sykes Science Media Centre
