public comment draft - new mexico environment ... comment draft total maximum daily load (tmdl) for...
TRANSCRIPT

PUBLIC COMMENT DRAFT TOTAL MAXIMUM DAILY LOAD (TMDL)
FOR GALISTEO CREEK
APRIL 3, 2017

Prepared by New Mexico Environment Department, Surface Water Quality Bureau
Monitoring, Assessments, and Standards Section Public Draft Released: April 3, 2017
Water Quality Control Commission Approval Date: DATE U.S. EPA Approval Date: DATE
Effective Date: DATE Revision Date(s): ______________________________
___________________________________________ For Additional Information please visit:
www.env.nm.gov/swqb/index.html ~or~
1190 St. Francis Drive Santa Fe, New Mexico 87505
Cover photo: Galisteo River at Cerrillos, New Mexico, April 27, 2010. Photo credit: SWQB staff.

TABLE OF CONTENTS
EXECUTIVE SUMMARY 1
1.0 BACKGROUND 3 1.1 Watershed Description 3 1.2 Water Quality Standards 8 1.3 Antidegradation and TMDLs 9 1.4 Field Survey 9 1.5 Hydrologic Conditions 11
2.0 TEMPERATURE TOTAL MAXIMUM DAILY LOAD 12 2.1 Target Loading Capacity 12 2.2 Flow 13 2.3 Load Calculations 14 2.4 Margin of Safety (MOS) 17 2.5 Waste Load Allocation 17 2.6 Load Allocation 18 2.7 Identification and Description of Pollutant Sources 21 2.8 Consideration of Seasonal Variation 23 2.9 Future Growth 23
3.0 APPLICABLE REGULATIONS 24
4.0 PUBLIC PARTICIPATION 26
5.0 REFERENCES 27
APPENDIX A. Source Documentation APPENDIX B. SSTEMP Input Data and Sensitivity Analysis APPENDIX C. Response to Comments

LIST OF TABLES Table ES-1. Total Maximum Daily Load for Galisteo Creek (Perennial prt 2.2 mi abv Lamy to hdwts)……………………………………………………………………….
2
Table ES-2. Total Maximum Daily Load for Galisteo creek (Perennial prt Kewa bnd to 2.2 mi abv Lamy)…………………………………………………………………………
2
Table 1.1 SWQB Galisteo Creek Watershed Assessment Units and Sampling Stations used in TMDL Development…………………………………………………….. 10 Table 2.1 Aquatic Life Use Temperature Criteria (°C)…………………………….
13
Table 2.2 Thermograph Records Used to Assess Galisteo Creek Aquatic Life Use Attainment…………………………………………………………………………………….
13
Table 2.3 Critical Low Flow…………………………………………………………... 14
Table 2.4 Galisteo Creek (Perennial prt 2.2 mi abv Lamy to hdwts) – HQCW…… 19
Table 2.5 Galisteo Creek (Perennial prt Kewa bnd to 2.2 mi abv Lamy) – CoolW.. 20
Table 2.6 Probable Source Summary for Temperature ……………………………. 21
LIST OF FIGURES Figure 1.1. Location of the Galisteo Creek watershed in New Mexico…………………... 3
Figure 1.2. Land Use in the Galisteo Creek watershed…………………………………… 4
Figure 1.3. Land Ownership in the Galisteo Creek watershed…………………………… 5
Figure 1.4 Geology of the Galisteo Creek Watershed…………………………………… 7
Figure 1.5 Galisteo Creek Assessment Units and Monitoring Stations. ………………. 10
Figure 2.1. Example of SSTEMP output for AU NM-118.A_10………………………… 15
Figure 2.2 Example of SSTEMP output for AU NM-118.A_12………………………… 16
Figure 2.3 Factors Impacting Stream Temperature……………………………………… 22

LIST OF ABBREVIATIONS
4Q3 4-Day, 3-year low-flow frequency
6T3 Temperature not to be exceeded for 6 or more consecutive hours on more than 3 consecutive days
AU Assessment Unit BMP Best management practices CFR Code of Federal Regulations cfs Cubic feet per second cfu Colony forming units CGP Construction general storm water permit CoolWAL Cool Water Aquatic Life CWA Clean Water Act CWAL Cold Water Aquatic Life oC Degrees Celsius oF Degrees Fahrenheit HUC Hydrologic unit code j/m2/s Joules per square meter per second km2 Square kilometers LA Load allocation lbs/day Pounds per day mgd Million gallons per day mg/L Milligrams per Liter mi2 Square miles mL Milliliters MCWAL Marginal Coldwater Aquatic Life MOS Margin of safety MOU Memorandum of Understanding MS4 Municipal separate storm sewer system MSGP Multi-sector general storm water permit NM New Mexico NMAC New Mexico Administrative Code NMED New Mexico Environment Department NPDES National Pollutant Discharge Elimination System NPS Nonpoint source QAPP Quality Assurance Project Plan RFP Request for proposal SEE Standard Error of the Estimate SLO State Land Office SSTEMP Stream Segment Temperature Model SWPPP Storm water pollution prevention plan SWQB Surface Water Quality Bureau TMDL Total Maximum Daily Load UAA Use Attainability Analysis USEPA U.S. Environmental Protection Agency USFS U.S. Forest Service USGS U.S. Geological Survey WBP Watershed-based plan WLA Waste load allocation WQCC Water Quality Control Commission WQS Water quality standards (20.6.4 NMAC as amended through March 2, 2017)

1
EXECUTIVE SUMMARY
Section 303(d) of the Federal Clean Water Act, 33 U.S.C. §13131, requires states to develop Total Maximum Daily Load (TMDL) management plans for water bodies determined to be water quality limited. A TMDL is defined as “a written plan and analysis established to ensure that a waterbody will attain and maintain water quality standards including consideration of existing pollutant loads and reasonably foreseeable increases in pollutant loads” (USEPA, 1999). A TMDL defines the amount of a pollutant a waterbody can assimilate without violating a state’s water quality standards. It also allocates that load capacity to known point sources and nonpoint sources at a given flow. It further identifies potential methods, actions, or limitations that could be implemented to achieve water quality standards. TMDLs are defined in 40 Code of Federal Regulations Part 130 (40 C.F.R. §130.2(i)2) as the sum of the individual Waste Load Allocations (WLAs) for point sources and Load Allocations (LAs) for nonpoint source and background conditions. They also include a Margin of Safety (MOS) in acknowledgement of various sources of uncertainty in the analysis.
Temperature was first listed as a cause of aquatic life use (ALU) non-support for Galisteo Creek in 2004. A Use Attainability Analysis4 (UAA) for temperature criteria of ALU designations was completed in 2013. As a result of the UAA, the creek was divided into two Assessment Units (AUs). The New Mexico Environment Department (NMED) Surface Water Quality Bureau (SWQB) conducted a water quality survey of the Middle Rio Grande and its tributaries in 2014. Water quality monitoring stations were located within the Galisteo Creek watershed to evaluate the impact of tributary streams and ambient water quality conditions. Assessment of data generated during this monitoring effort confirmed temperature impairments in both the downstream and the upstream Assessment Units. This TMDL document addresses the above noted impairments as summarized in the Tables ES-1 and ES-2, below. Additional information regarding these impairments can be reviewed in the current Clean Water Act §303(d)/ §305(b) Integrated Report and List (IR)3. SWQB has not previously prepared any other TMDL documents for Galisteo Creek.
The next scheduled water quality monitoring date for the Middle Rio Grande and its tributaries is 2023-24, at which time TMDL targets will be re-examined and potentially revised, as this document is considered to be an evolving management plan. In the event that new data indicate that the targets used in this analysis are not appropriate and/or if new standards are adopted, the load capacity will be adjusted accordingly. When water quality standards have been achieved, the reach will be moved to the appropriate category in the IR.
1 http://www.epw.senate.gov/water.pdf 2 http://www.gpo.gov/fdsys/pkg/CFR-2002-title40-vol18/pdf/CFR-2002-title40-vol18-part130.pdf 3 https://www.env.nm.gov/swqb/303d-305b/ 4 https://www.env.nm.gov/swqb/UAA/Galisteo/22-UAA-Galisteo.pdf

2
Table ES-1. Total Maximum Daily Load for Galisteo Creek (Perennial prt 2.2 mi abv Lamy to hdwts) New Mexico Standards Segment 20.6.4.121
Waterbody Identifier NM-2118.A_12 Segment Length 10.0 miles Parameters of Concern temperature Uses Affected High Quality Coldwater Aquatic Life Geographic Location Rio Grande – Santa Fe USGS Hydrologic Unit Code 13020201 Scope/size of Watershed 32.3 mi2
Land Type Southern Rockies (Ecoregion 21d) Land Use/Cover 42% grassland, 35% scrub/shrub, 21% evergreen forest, 1% developed Probable Sources Logging (legacy); bridges/culverts/RR crossing; low water crossing; gravel
or dirt roads Land Management 77% private, 9% Forest Service, 7% tribal, 6% State, 2% Bureau of Land
Management IR Category 5/5B Priority Ranking High TMDL for: Temperature
WLA + LA + MOS = TMDL 0 + 53.21 + 6.26 = 59.47 J/m2/s/day
Table ES-2. Total Maximum Daily Load for Galisteo creek (Perennial prt Kewa bnd to 2.2 mi abv Lamy) New Mexico Standards Segment 20.6.4.139 Waterbody Identifier NM-2118.A_10 Segment Length 33.5 miles Parameters of Concern temperature Uses Affected Coolwater Aquatic Life Geographic Location Rio Grande – Santa Fe USGS Hydrologic Unit Code 13020201 Scope/size of Watershed 670 mi2
Land Type Arizona/New Mexico Plateau (Ecoregion 22h) Land Use/Cover 42% grassland, 35% scrub/shrub, 21% evergreen forest, 1%
developed Probable Sources Highway/road/bridge runoff; stream channel incision;
bridges/culverts/RR crossing; gravel or dirt roads; exotic species Land Management 77% private, 9% Forest Service, 7% tribal, 6% State, 2% Bureau of
Land Management IR Category 5/5C Priority Ranking High TMDL for: Temperature
WLA + LA + MOS = TMDL 0 + 183.89 + 20.72 = 204.61 J/m2/s/day

3
1.0 BACKGROUND
1.1 Watershed Description Galisteo Creek, in north central New Mexico, is part of the USGS Rio Grande-Santa Fe hydrologic unit (HUC 13020201). Most of the watershed lies in Santa Fe County; the extreme eastern edge extends into San Miguel County and the confluence with the Rio Grande occurs in Sandoval County, on lands of the Kewa (formerly Santo Domingo) pueblo (waters on tribal lands are not Waters of the State). Stream flows vary throughout the length of the stream and may be perennial, intermittent or ephemeral.
Figure 1.1. Location of the Galisteo Creek watershed in New Mexico.
Watershed land use includes 42% grassland, 35% scrub/shrub, 21% evergreen forest, and 1% developed (Figure 1.2). Mean annual precipitation at Santa Fe, the nearest town for which data is available, is 14.2 inches (http://www.usclimatedata.com/climate/santa-fe/new-mexico/united-states/usnm0292, accessed 3/22/17), however precipitation is highly variable both spatially and temporally. The upper Assessment Unit (AU) lies within Ecoregion 21d, Southern Rockies Foothill Woodlands and Shrublands. Typical vegetation for Ecoregion 21d is pinyon-juniper woodlands and shrublands dominated by sagebrush, mountain mahogany or Gambel oak, interspersed with varied grasslands. The lower AU lies within Ecoregion 22h, Arizona/New Mexico Plateau North Central New Mexico Valleys and Mesas (Griffith, 2006). Typical vegetation for Ecoregion 22h is pinyon-juniper woodland and juniper savanna with diverse

4
grasses. Land surfaces in the watershed, and stream geomorphology, have been impacted by historic and current grazing, mining, road and railroad building activities. Land on the south side of the basin has been less impacted by excessive or improper livestock use than that on the north (Jan-Willem Jansens, pers. comm.).
Figure 1.2. Land Use in the Galisteo Creek watershed. The Galisteo watershed has been settled for centuries, and impacted by many land and water uses. Current land management in the watershed is 77% private, 9% Forest Service, 7% tribal, 6% State, and 2% Bureau of Land Management. Much of the area is encompassed by several large ranches. There is one National Pollutant Discharge Elimination System (NPDES) permitted facility in the watershed: LAC Minerals is permitted to discharge into Cunningham Creek, an ephemeral tributary in the lower watershed. Water supply for residents in the watershed is currently provided by numerous wells. Overall, groundwater recharge in the watershed is less than withdrawals and thus the water table is lowering (Stephens, 2003). In an interagency report

5
on the watershed, the Office of the State Engineer (OSE) reported no current irrigation diversions (NM EMNRD, 2008).
Figure 1.3. Land Ownership in the Galisteo Creek watershed.
The Galisteo Watershed is situated within the Galisteo Basin, a sub-basin of the Espanola Basin. The Galisteo Basin is part of a series of basins along the Rio Grande Rift which is divided into basins by faults (Bauer et al, 1995). The main geologic groups are volcanic in the upper watershed, alluvium (sediment) in the middle and lower watershed, and sandstone-shale- mudstone in the eastern watershed. Advancing and retreating seas during the early Mesozoic era, and again during the late Cretaceous period, deposited sands, muds, coal, gypsum and limestone in the Cerrillos area. The Laramide Orogeny uplift of the Sangre de Cristo mountain range led to erosion of the existing surface. During Cenozoic times, a series of igneous intrusions and extrusions resulted in

6
“emplacement of a series of monzonitic stocks, plugs, laccoliths, sills, and dikes” (Disbrow and Stoll, 1957; Maynard, 2016). A system of fractures developed subsequently in the basin (Disbrow and Stoll, 1957). Veins containing economically recoverable gold, copper, lead, zinc and silver have formed in more recent ages. As the Rio Grande Rift has deepened (subsided) over the past 1.5 million years, Galisteo Creek has cut more deeply into the geologic strata (Maynard, 2016). Geologic strata surface and cross or confine the Galisteo Creek at many locations and influence whether and how alluvial groundwater can come to the surface. It is believed that the volcanic ridge that runs from the northeast to southwest north of the village of Galisteo plays an important role in the permanent flow of water in the Galisteo Creek in the village of Galisteo. There are also some springs in the Arroyo Salado on the flanks of Rowe Mesa, which are most likely fed by water stored in the forest soils on the mesa. Likewise, sandstone and volcanic rock dykes that run across the Galisteo Creek at several locations between Galisteo and Cerrillos may be the cause of small springs and seeps, patches of quicksand, and reaches with a nearly permanent flow (Earth Works Institute, 2005).

7
Figure 1.4 Geology of the Galisteo Creek Watershed

8
1.2 Water Quality Standards Water quality standards (WQS) for all assessment units in this document are set forth in the following sections of New Mexico Standards for Interstate and Intrastate Surface Waters (20.6.4 New Mexico Administrative Code [NMAC]) (NMAC, 2017):
20.6.4.121 RIO GRANDE BASIN - Perennial tributaries to the Rio Grande in Bandelier national monument and their headwaters in Sandoval county and all perennial reaches of tributaries to the Rio Grande in Santa Fe county unless included in other segments and excluding waters on tribal lands.
A. Designated uses: domestic water supply, high quality coldwater aquatic life, irrigation, livestock watering, wildlife habitat and primary contact; and public water supply on Little Tesuque creek, the Rio en Medio, and the Santa Fe river.
B. Criteria: the use-specific numeric criteria set forth in 20.6.4.900 NMAC are applicable to the designated uses, except that the following segment-specific criteria apply: specific conductance 300 µS/cm or less; the monthly geometric mean of E. coli bacteria 126 cfu/100 mL or less, single sample 235 cfu/100 mL or less.
20.6.4.139 RIO GRANDE BASIN - Perennial reaches of Galisteo creek and perennial reaches of its tributaries from Kewa pueblo upstream to 2.2 miles upstream of Lamy.
A. Designated uses: coolwater aquatic life, primary contact, irrigation, livestock watering, domestic water supply and wildlife habitat; and public water supply on Cerrillos reservoir.
B. Criteria: the use-specific numeric criteria set forth in 20.6.4.900 NMAC are applicable to the designated uses, except that the following segment-specific criteria apply: the monthly geometric mean of E. coli bacteria 126 cfu/100 mL or less, single sample 235 cfu/100 mL or less.
20.6.4.900 NMAC provides criteria applicable to existing, attainable or designated uses unless otherwise specified in an AU’s specific section. 20.6.4.13 NMAC lists general criteria that apply to all surface waters of the state at all times, unless a specified standard is provided elsewhere in the NMAC. A Use Attainability Analysis (NMED/SWQB, 2013) completed in 2013 resulted in the division of Galisteo Creek into two AUs. The downstream AU was removed from Segment 121 and included in the newly created Segment 139, with a change of designated ALU from HQCW to CoolW. The upstream AU was retained in Segment 121.

9
1.3 Antidegradation and TMDLs New Mexico’s antidegradation policy, which is based on the requirements of 40 CFR Part 131.12, describes how waters are to be protected from degradation (20.6.4.8(A) NMAC). At a minimum, the policy mandates that “the level of water quality necessary to protect the existing uses shall be maintained and protected in all surface waters of the state.” Furthermore, the policy’s requirements must be met whether or not a segment is impaired. TMDLs are consistent with this policy because implementation of a TMDL restores water quality so that existing uses are protected and water quality criteria are achieved.
The Antidegradation Policy Implementation Procedure establishes the process for implementing the antidegradation policy (Appendix A of NMED/SWQB, 2011). However, specific requirements in the Antidegradation Policy Implementation Procedure do not apply to the Water Quality Control Commission’s (WQCC) establishment of TMDLs because these types of water quality-related actions already are subject to extensive requirements for review and public participation, as well as various limitations on degradation imposed by state and federal law (NMED/SWQB, 2011).
1.4 Field Survey Galisteo Creek has been divided by the SWQB into two AUs, with the dividing point located 2.2 miles above Lamy. Temperature data were collected at the SWQB Canoncito monitoring station, representing the upper AU, and at the Galisteo monitoring station, representing the lower AU. The Canoncito location is in a perennial stretch that starts at the confluence with Deer Creek and is near the bottom of the upper AU, while the Galisteo station is about midway down the lower AU. Data from these stations were assessed against WQS using established assessment protocols (NMED/SWQB, 2013) to determine whether or not designated uses were being met (Table 1.1).
Table 1.1 Thermograph Records Used to Assess Galisteo Creek Aquatic Life Use Attainment
Station ID ALU Location Deployment Dates TMAX (°C) 4T3 (°C) 30Galist071.2
HQCW Canoncito 5/30-8/21/2014
31.8 30.1
30Galist050.4
CoolW Galisteo 7/9/-9/1/2010 29.7 NA
The Middle Rio Grande and its tributaries were intensively sampled by the SWQB in 2012-2014. A brief summary of the survey and the hydrologic conditions during the intensive sample period is provided in the following subsections. The full 2014 Middle Rio Grande Water Quality Survey Report can be found online at https://www.env.nm.gov/swqb/MAS/#Streams.
Surface water quality samples were collected monthly between March and November for the 2014 intensive SWQB study. Surface water quality monitoring stations were selected to characterize water quality of stream reaches throughout the basin (see Figure 1.5 and Table 1.2 for stations relevant to this TMDL document). Stations were located to evaluate the impact of tributary streams and to determine ambient water quality

10
conditions. Surface water grab sample from these stations were analyzed for a variety of chemical and physical parameters. Data results from grab sampling are housed in the SWQB provisional water quality database and uploaded to USEPA’s Water Quality Exchange (WQX) database. Additional physical habitat data were obtained on Galisteo Creek in 2016, in order to provide input variables for the SSTEMP computer model.
Figure 1.5 Galisteo Creek Assessment Units and Monitoring Stations.
Table 1.2 SWQB Galisteo Creek Watershed Assessment Units and Sampling Stations used in TMDL Development AU ID Assessment Unit NM-2118.A_10 Galisteo creek (Perennial prt Kewa bnd to 2.2 mi abv Lamy NM-2118.A_12 Galisteo Creek (Perennial prt 2.2 mi abv Lamy to hdwts)
Station ID Station Name 30Galist030.9 Galisteo Creek at Hwy 14 near Cerrillos - 30Galist030.9 30Galist050.4 Galisteo Creek in Galisteo - 30Galist050.4 30Galist071.2 Galisteo Creek at Spirit Valley Rd in Canoncito - 30Galist071.2

11
1.5 Hydrologic Conditions The headwaters of the 670 square mile (mi2) watershed originate on the southern slopes of the Sangre de Cristo mountains. Average watershed elevation is 6550 ft. Two high-gradient perennial tributaries - Deer Creek and Apache Canyon - join the upper part of the creek near Canoncito. The Galisteo Creek main stem is non-perennial above Deer Creek. It becomes perennial below the Deer Creek juncture through the influence of a series of natural wetlands near the confluence. Apache Canyon includes several dams, a trout raising pond and some created wetlands. The loss of beaver and extensive mining in the 19th century resulted in channel incision (Jan-Willem Jansens, pers. comm.). Around the turn of the 20th century, the population in the valley peaked at about 30,000, concentrated in the Madrid and Cerrillos areas (NMED/SWQB and EWI, 2010).
Galisteo Creek was channelized in places to protect the railroad from Las Vegas to Albuquerque because the majority of the rail line was built in the floodplain (NMED/SWQB and EWI, 2010) and crosses the creek several times. The I-25 corridor divides a natural wetland, starving it of water. Above Canoncito, Galisteo Creek is shaded only on the north bank.
The middle watershed includes the areas of Lamy, the village of Galisteo and San Cristobal Arroyo. There is a dry reach from below Canoncito to just above Galisteo (Jan-Willem Jansens, pers. comm.). Many tributaries join Galisteo Creek downstream of the village of Galisteo, including San Cristobal, Los Angeles, La Jara, Cunningham, and San Marcos Arroyos. Some of these arroyos deliver large quantities of sediment to Galisteo Creek. The San Cristobal Arroyo drainage area, which includes the Glorieta and Rowe Mesa and the White Bluffs, is more than 100,000 acres in size and the largest sub-watershed. Just below Galisteo is an irrigation dam on the main channel. Urban and exurban development is concentrated north of Galisteo Creek. In particular, the San Marcos and Gallinas sub-watersheds, covering an area of about 80 square miles, are largely built up in a mosaic of small subdivisions, surrounded by open grassland (NMED/SWQB and EWI, 2010).
The lower watershed includes Madrid, Cerrillos and part of the Kewa Pueblo. A small part extends into the Ortiz Mountains. Galisteo Creek enters the Rio Grande at an elevation of 5,180 feet. The total length of the Galisteo Creek mainstem is 53 miles. The last 10 miles above the confluence with the Rio Grande are located within the boundaries of Kewa Pueblo. Galisteo Dam, approximately 17 km upstream of the confluence with the Rio Grande, was completed by the US Army Corps of Engineers in 1970. The dam has been perforated and there is no persistent pool above it.

12
2.0 TEMPERATURE TOTAL MAXIMUM DAILY LOAD
Water temperature influences the metabolism, behavior, and mortality of fish and other aquatic organisms. Natural temperatures of a waterbody fluctuate daily and seasonally. These natural fluctuations do not eliminate indigenous populations, but may affect existing community structure and geographical distribution of species. In fact, such temperature cycles are often necessary to induce reproductive cycles and may regulate other aspects of life history (Mount, 1969). Behnke and Zarn (1976), in a discussion of temperature requirements for endangered western native trout, recognized that populations cannot persist in waters where maximum temperatures consistently exceed 21-22°C, but they may survive brief daily periods of higher temperatures (25.5-26.7°C). Anthropogenic impacts can modify these natural temperature cycles, often leading to deleterious impacts on aquatic life communities. Such modifications may contribute to changes in geographical distribution of species and their ability to persist in the presence of additional challenges such as introduced species.
Monitoring of Galisteo Creek for temperature was conducted by SWQB in 2010 and 2014. Thermographs (temperature data loggers) were set to record once every hour in July and August of 2010, at the Galisteo village monitoring station, and once every 15 minutes from May through August of 2014, at the Canoncito monitoring station. Thermograph data were assessed using Appendix E of the State of New Mexico Procedures for Assessing Standards Attainment for the Integrated CWA §303(d)/§305(b) Water Quality Monitoring and Assessment Report [Assessment Protocol] (NMED/SWQB 2013). Physical habitat data were collected in 2016 to generate stream geometry variables for input to the Stream Segment Temperature model (SSTEMP).
All sampling and assessment techniques used during the 2014 intensive and 2016 additional data SWQB surveys are detailed in the assessment protocols (NMED/SWQB, 2013) and Quality Assurance Project Plan (QAPP) (NMED/SWQB, 2016). The temperature impairment of the lower part of Galisteo Creek was documented by thermograph deployment in 2010. Thermograph deployment during the 2014 survey at that location was unsuccessful. As a result of the 2014 monitoring efforts, temperature impairment was determined for the upper part of Galisteo Creek. Accordingly these impairments were either added to or remained on the New Mexico’s 2014-2016 CWA Integrated §303 (d)/305(b) list (NMED/SWQB, 2014).
2.1 Target Loading Capacity
For this TMDL document, target values for temperature are based on the reduction in solar radiation necessary to achieve numeric criteria as predicted by a temperature model. Increases in solar radiation in a given AU can often be correlated to changes in shade and/or canopy cover. Galisteo Creek (Perennial prt 2.2 mi abv Lamy to hdwts) has a designated High Quality Cold Water (HQCW) aquatic life use. Galisteo Creek (Perennial prt Kewa bnd to 2.2 mi abv Lamy) has a designated Coolwater (CoolW) aquatic life use. Temperature criteria for aquatic life uses in New Mexico are shown on Table 2.1. New Mexico’s aquatic life temperature criteria are expressed as 4T3, 6T3 and TMAX. TMAX is the maximum recorded temperature, 4T3 means the temperature not to be exceeded for four or more consecutive hours in a 24-hour period on more than three consecutive days, and 6T3 means the temperature not to be exceeded for six or more consecutive hours in a 24-hour period on more than three consecutive days.

13
Table 2.1 Aquatic Life Use Temperature Criteria (°C)
4T3 20 - - - - - 6T3 - 20 25 - - - TMAX 23 24 29 29 32.2 32.2
2.2 Flow 40 CFR 130.7(c)(1) requires states to calculate a TMDL using critical conditions for stream flow. The highest in-stream water temperatures typically occur during the hottest times of the year when the daytime is at its longest and solar radiation is at its highest. For New Mexico, the beginning of summer (before the monsoon season) is the hottest time of the year and coincides with the dry season, and consequently the lowest stream flows. Therefore, the critical flow condition used to calculate these temperature TMDLs was obtained using a 4-day, 3-year low-flow frequency (4Q3) regression model. The 4Q3 is the minimum average four consecutive day flow that occurs with a frequency of once every three years.
When available, U.S. Geological Service (USGS) gages are used to estimate flow. There have been several USGS gaging stations in the Galisteo Creek watershed associated with the reaches presented in this document. However recent daily flow data is available only from 08317950 – Galisteo Creek below Galisteo Dam, NM. As indicated by its name, this gage is located below the dam near the bottom of the lower AU and does not reflect hydrography of the reaches above the dam. Flow at the gage is usually zero and only storm flows are reflected in the record.
Because the available gage data are not suitable to calculate the critical low flow, an analysis method developed by Waltemeyer (2002) was used to estimate the 4Q3. In Waltemeyer’s analysis, two regression equations for estimating 4Q3 were developed based on physiographic regions of NM (i.e., statewide and mountainous regions above 7,500 ft in elevation). The average elevation of the Galisteo Creek watershed above Canoncito is above 7,500 ft, so the mountainous regions regression equation was used for the upstream AU (2.2 mi above Lamy to headwaters). The following regression equation is based on data from 40 gaging stations located above 7,500 ft in elevation with non-zero discharge (Waltemeyer 2002):
4𝑄𝑄3 = 7.3287×10⁻⁵𝐷𝐷𝐷𝐷0.70𝑃𝑃𝑤𝑤3.58𝑆𝑆1.35
Where:
4Q3 = Four-day, three-year low-flow frequency (cfs) DA = Drainage area (mi2) Pw = Average basin mean winter precipitation (inches) S = Average basin slope (%)
Criterion High Quality
Coldwater
Coldwater Marginal Coldwater
Coolwater Warmwater Marginal warmwater

14
The average elevation of the Galisteo watershed above the Kewa Pueblo boundary is below 7,500 ft, so the statewide regression equation was used for the downstream AU (Kewa boundary to 2.2 mi above Lamy). The following regression equation is based on data from 50 gaging stations with non-zero discharge (Waltemeyer 2002):
4Q3 = 1.2856 x 10⁻⁴ DA0.42 Pw3.16 Where:
4Q3 = Four-day, three-year low-flow frequency (cfs) DA = drainage area (mi2) Pw = average basin mean winter precipitation (inches)
The 4Q3 values calculated using Waltemeyer’s method are presented in Table 2.2. Parameters used in the calculation were determined using Basins, a GIS application, and the USGS Stream Stats application, Version 3 (http://water.usgs.gov/osw/streamstats/new_mexico.html).
Table 2.2 Critical Flow Assessment Unit 4Q3 Flow (cfs) Galisteo Creek (Perennial prt 2.2 mi abv Lamy to hdwts) 0.1 Galisteo Creek (Perennial prt Kewa bnd to 2.2 mi abv Lamy) 0.35 It is important to remember that the TMDL is a value calculated at a defined critical condition as part of a planning process designed to achieve water quality standards. Since flows vary throughout the year in these systems, the actual load at any given time will vary based on the changing flow. Management of the load to improve stream water quality is the goal.
The specific inflow and outflow values used in the SSTEMP model are discussed in detail in Appendix B.
2.3 Load Calculations The SSTEMP Model, Version 2.0.8, developed by the USGS Biological Resource Division (Bartholow 2002) was used to predict stream temperatures based on watershed geometry, hydrology, and meteorology. The model predicts mean, minimum, and maximum daily water temperatures throughout a stream reach by estimating the heat gained or lost from a parcel of water as it passes through a stream segment (Bartholow 2002). The predicted temperature values are compared to actual thermograph readings measured in the field in order to calibrate the model. The SSTEMP model identifies current stream and/or watershed characteristics that influence stream temperatures. The model also quantifies the maximum loading capacity of the stream to meet water quality criteria for temperature (Figures 2.1 and 2.2). The model is important for estimating the effects of changes to the parameters influencing stream temperature. It can also be used to identify possible implementation activities which may be of use for reducing the water temperature, by identifying which parameters are most influential to the impairment.

15
Figure 2.1. Example of SSTEMP output for Galisteo Creek (Kewa boundary to 2.2 mi above Lamy).

16
Figure 2.2 Example of SSTEMP output for Galisteo Creek (2.2 mi above Lamy to headwaters).
A series of assumptions are associated with the SSTEMP run conditions. Running the model outside of these assumptions will often result in inaccuracies or model instability. The assumptions used in the development of SSTEMP that are most relevant to the development of the presented TMDLs are listed below. For a complete list of assumptions and model deficiencies, please see the SSTEMP user manual (Bartholow 2002).
• Water in the system is instantaneously and thoroughly mixed at all times; there is no lateral temperature distribution across channel OR vertical gradients in pools
• Stream geometry is characterized by mean conditions • Solar radiation and other meteorological and hydrological variables are 24-hour means • Distribution of lateral inflow is uniformly apportioned throughout the segment length • Manning’s n and travel time do not vary as functions of flow • Modeled/representative time periods must be long enough for water to flow the full length of the
segment

17
• SSTEMP is not able to model cumulative effects; for example, adding or deleting vegetation mathematically is not the same as in real life
2.4 Margin of Safety (MOS) The CWA requires that each TMDL be calculated with a MOS. This statutory requirement that TMDLs incorporate a MOS is intended to account for uncertainty in available data or in the actual effect controls will have on loading reductions and receiving water quality. A MOS may be expressed as unallocated assimilative capacity or conservative analytical assumptions used in establishing the TMDL (e.g., derivation of numeric targets, modeling assumptions or effectiveness of proposed management actions). The MOS may be implicit, utilizing conservative assumptions for calculation of the loading capacity, WLAs, and LAs. The MOS may also be explicitly stated as an added separate quantity in the TMDL calculation.
In order to develop this temperature TMDL, the following conservative assumptions were used to parameterize the model:
• Data from the warmest time of the year were used in order to capture the seasonality of temperature exceedences.
• Critical upstream and downstream low flows were used because assimilative capacity of the stream to absorb and disperse solar heat is decreased during these flow conditions.
As detailed in Appendix D, a variety of hydrologic, geomorphologic, and meteorological data were used to parameterize the SSTEMP model. Because of the quality of data and information that was put into this model and the continuous field monitoring data used to verify these model outputs, an explicit MOS of 10% is assigned to this TMDL. The actual calculated MOS varies slightly from exactly 10%, due to rounding of shade percent values to the nearest 1%.
2.5 Waste Load Allocation There is one active NPDES permitted point source in the watershed but it does not discharge directly to Galisteo Creek. Permit NM0028711, issued to LAC Minerals (USA), Inc., is located on Cunningham Gulch approximately 6 miles from the nearest point on the Galisteo Creek channel (Figure 1.5). The permit authorizes discharge from the mine’s open pit pool. SWQB does not believe that this facility needs a WLA for the following reasons:
1. The level of mine pit water is currently about 300 feet below the surrounding ground surface and it has never discharged to Cunningham Gulch (David Wykoff, pers. comm.).
2. Per the 18 Unclassified Non-Perennial Stream Segment Use Attainability Analysis (technically approved by EPA on January 30, 2013), Cunningham Gulch is listed as an ephemeral stream in 20.6.4.97 NMAC.
3. Even if the facility were to discharge, and the discharge entered Galisteo Creek, the flow would not constitute a substantial contribution affecting water temperature, because the volume reaching the confluence would likely be very small, and because the water temperature would likely be similar to that of Galisteo Creek.
Sediment and associated contaminants are considered components of industrial storm water discharges covered under National Pollutant Discharge Elimination System (NPDES) General Permits. Stormwater

18
discharges from construction activities are transient, occurring mainly during the construction itself, and then only during storm events. Coverage under the NPDES Construction General Permit (CGP) for construction sites greater than one acre, or less than one acre if they are part of a common plan of development, requires preparation of a Storm Water Pollution Prevention Plan (SWPPP) that includes identification and control of all pollutants associated with the construction activities to minimize impacts to water quality. The current CGP also includes state-specific requirements to implement site-specific interim and permanent stabilization, and managerial and structural solids, erosion, and sediment control Best Management Practices (BMPs), and/or other controls. BMPs and other controls are designed to prevent to the maximum extent practicable an increase in sediment load and flow velocity during and after construction compared to pre-construction conditions to the water body, or an increase in a sediment-related parameter, such as total suspended solids, turbidity, siltation, stream bottom deposits, etc., in order to assure that waste load allocations and/or applicable water quality standards, including the antidegradation policy, are met. This requirement applies both during and after construction operations.
Stormwater discharges from industrial activities and facilities, based on industrial classification codes, may be eligible for coverage under the current NPDES Multi-Sector General Permit (MSGP). The MSGP also requires preparation of a SWPPP. Some of the industrial facilities and activities covered under the MSGP have technology based effluent limitation and/or benchmark monitoring for pollutants. The current MSGP includes state-specific requirements that the benchmark values reflect State of New Mexico WQS.
It is not possible to calculate individual WLAs for facilities covered by the General Permits at this time using the available tools. While these sources are not given individual allocations, they are addressed through other means, including BMPs, and other stormwater pollution prevention conditions. Implementation of a SWPPP that meets the requirements of a General Permit is generally assumed to be consistent with this TMDL. Loads that are in compliance with the General Permits are therefore currently included as part of the LA. Therefore the WLA for this TMDL is zero.
2.6 Load Allocation Water temperature can be expressed as heat energy per unit volume. SSTEMP provides an estimate of heat energy expressed in joules per square meter per second (j/m2/s). The following information relevant to the model runs used to determine temperature TMDLs is taken from the SSTEMP documentation (Bartholow 2002). The specific flow, stream geometry, and meteorological values used in the SSTEMP model are discussed in detail in Appendix B.
The program will predict the minimum, mean, and maximum daily water temperature for the set of variables input into the model. The theoretical basis for the model is strongest for the mean daily temperature. The predicted maximum is largely an estimate and likely to vary widely with the maximum daily air temperature. The predicted minimum is computed by subtracting the difference between maximum and mean, from the mean; but the predicted minimum is always positive (Bartholow 2002).
Tables 3.4 and 3.5 detail model outputs for AUs on Galisteo Creek. SSTEMP was first calibrated against thermograph data. Initial conditions were determined. As the percent total shade was increased, the maximum 24-hour temperature decreased until the appropriate temperature criterion was achieved. The calculated 24-hour solar radiation component is the maximum solar load that can occur in order to meet the

19
WQS (i.e., the target capacity). In order to calculate the actual LA, the WLA and MOS were subtracted from the target capacity (TMDL):
𝑊𝑊𝑊𝑊𝐷𝐷 + 𝑊𝑊𝐷𝐷 + 𝑀𝑀𝑀𝑀𝑆𝑆 = 𝑇𝑇𝑀𝑀𝐷𝐷𝑊𝑊
For Galisteo Creek (Perennial prt 2.2 mi abv Lamy to hdwts), the HQCW WQS for 4T3 water temperature of 20˚C is achieved when the percent total shade is increased from 8% to 81%. According to the SSTEMP model, the actual LA of 53.21 j/m2/s, which includes an MOS of 10%, is achieved when the shade is further increased to 83% (Table 2.3).
For Galisteo Creek (Perennial prt Kewa bnd to 2.2 mi abv Lamy), the CoolW WQS for maximum water temperature of 29˚C is achieved when the percent total shade is increased from 2.4 to 21%. According to the SSTEMP model, the actual LA of 183.89 j/m2/s, which includes an MOS of 10%, is achieved when the shade is further increased to 29% (Table 2.4).
The MOS is estimated to be 10% of the target load calculated by the modeling runs. The load reductions that would be necessary to meet the target load were calculated to be the difference between the calculated target load and the measured load (i.e., current field condition), and are shown in Tables 2.4 and 2.5.
Table 2.3 Galisteo Creek (Perennial prt 2.2 mi abv Lamy to hdwts) - HQCW
WQS 4T3 (HQCW)
Model Run Date
Segment Length (miles)
Solar Radiation Component per 24-Hours (j/m2/s)
% Total Shade
Modeled Temperature (˚C)
20˚C 6/30/2014 3.6 (perennial
portion) Current Field Condition: 287.96
8 Minimum: 12.18 Mean: 19.71 Maximum: 27.25
TEMPERATURE ALLOCATIONS
(a) 24-HOUR ACHIEVEMENT OF CRITERION FOR TEMPERATURE (b) 24-HOUR LOAD ALLOCATION (LA) NEEDED TO ACHIEVE CRITERION WITH A 10% MARGIN OF SAFETY
59.47(a)
81
Minimum: 9.72 Mean: 14.82 Maximum: 19.93
53.21(b)
83 Minimum: 9.66 Mean: 14.68 Maximum: 19.69
Actual reduction in solar radiation necessary to meet surface WQS for temperature:
Current Condition –Load Allocation =
287.96 – 53.21 = 234.75 j/m2/s

20
Table 2.4 Galisteo Creek (Perennial prt Kewa bnd to 2.2 mi abv Lamy) - CoolW
WQS TMAX (CoolW)
Model Run Date
Segment Length (miles)
Solar Radiation Component per 24-Hours (j/m2/s)
% Total Shade
Modeled Temperature (˚C)
29˚C 7/20/2010 33.5 Current Field Condition: 252.78
2.4 Minimum: 17.04 Mean: 23.69 Maximum: 30.33
TEMPERATURE ALLOCATIONS
(a) 24-HOUR ACHIEVEMENT OF CRITERION FOR TEMPERATURE (b) 24-HOUR LOAD ALLOCATION (LA) NEEDED TO ACHIEVE CRITERION WITH A 10% MARGIN OF SAFETY
204.61a)
21
Minimum: 16.57 Mean: 22.76 Maximum: 28.95
183.89(b)
29 Minimum: 16.37 Mean: 22.35 Maximum: 28.33
SSTEMP may be used to compute, one at a time, the sensitivity to input values. This increases and decreases most active input by 10% and displays a screen for changes to mean and maximum temperatures. The “Relative Sensitivity” schematic graph that accompanies the display gives an indication of which variables most strongly influence the results (Bartholow 2002). Sensitivity analysis outputs for both AUs are shown in Appendix B.
The sensitivity analysis indicates that maximum air temperature and solar radiation have the most influence on the estimated maximum stream temperatures in Galisteo Creek (Perennial prt 2.2 mi abv Lamy to hdwts), with mean air temperature, relative humidity and wind speed having a secondary level of influence. Maximum air temperature, solar radiation and mean air temperature have the most influence on the estimated maximum stream temperatures in Galisteo Creek (Perennial prt Kewa bnd to 2.2 mi abv Lamy), with relative humidity and wind speed having a secondary level of influence.
Actual reduction in solar radiation necessary to meet surface WQS for temperature:
Current Condition –Load Allocation =
252.78 – 183.89 = 68.89 j/m2/s

21
2.7 Identification and Description of Pollutant Source(s) SWQB fieldwork includes an assessment of the probable sources of impairment (Appendix A). Probable Source Sheets are filled out by SWQB staff during watershed surveys and watershed restoration activities. The list of “Probable Sources” is not intended to single out any single land owner or particular land management activity and generally includes several sources per pollutant. Table 2.5 displays probable pollutant sources that have the possibility to contribute to increased temperature in each Galisteo Creek AU as determined by field reconnaissance and knowledge of watershed activities. The draft probable source list will be reviewed and modified, as necessary, with watershed group/stakeholder input during the TMDL public meeting and comment period. Probable sources of temperature impairments will be further evaluated, refined, and changed as necessary through the Watershed-Based Plan (WBP).
Table 2.5 Probable Source Summary for Temperature NM-2118.A_12
Highway/road/bridge runoff Rangeland grazing Stream channel incision Bridges/culverts/RR crossing Logging - legacy Gravel or dirt roads Abandoned mines/tailings Low water crossing
NM-2118.A_10 Highway/road/bridge runoff Stream channel incision Residences/buildings Abandoned mines/tailings Rangeland grazing Bridges/culverts/RR crossing Gravel or dirt roads Paved roads Dams/diversions
A variety of factors impact stream temperature (Figure 2.3). Decreased effective shade levels may result from reduction of riparian vegetation. When canopy densities are reduced, thermal loading increases in response to the increase in incident solar radiation. Likewise, it is well documented that past hydromodification activities have led to channel incision and widening. Wider stream channels also increase the stream surface area exposed to sunlight, thereby increasing heat transfer. Riparian area and channel morphology disturbances are attributed to past and, to some extent current, rangeland grazing practices that have resulted in reduction of riparian vegetation and streambank destabilization. These nonpoint sources of pollution primarily affect the water temperature through increased solar loading by: (1) increasing stream surface solar radiation and (2) increasing stream surface area exposed to solar radiation.

22
Figure 2.3 Factors Impacting Stream Temperature
Riparian vegetation, stream morphology, hydrology, climate, geographic location, and aspect all influence stream temperature. Although climate, geographic location, and aspect are outside of human control, the condition of the riparian area, channel morphology, and hydrology can be affected by land use activities. Specifically, the elevated summertime stream temperatures attributable to anthropogenic causes in the Animas watershed result from the following conditions:
1. Channel widening (i.e., increased width to depth ratios) that has increased the stream surface area exposed to incident solar radiation;
2. Riparian vegetation disturbance that has reduced stream surface shading, riparian vegetation height and density; and
3. Reduced summertime base flows that result from instream impoundments and withdrawals and/or inadequate riparian vegetation.
Base flows are maintained with a functioning riparian system so that loss of a functioning riparian system may lower and sometimes eliminate baseflows. Although removal of upland vegetation has been shown, in some cases, to increase water yield, studies show that removal of riparian vegetation along the stream channel subjects the water surface and adjacent soil surfaces to wind and solar radiation, partially offsetting the
Percent Effective Shade
Solar Radiation
Riparian Vegetation
due to high water surfacearea from increased
Sediment
Width Depth Ratio
Hillslope & StreambankFailures, Reduced
Riparian Vegetation
Water Temperature
result in rise above natural conditions a result of increased
from lack of
leads to
due to increased
due to reduced
leads to

23
reduction in transpiration with evaporation. In losing stream reaches, increased temperatures can result in increased streambed infiltration, which can result in lower base flow (Constrantz et al. 1994).
Vegetation density increases will provide necessary shading, as well as encourage bank-building processes in severe hydrologic events. The 83% canopy cover at which the TMDL is achieved at Galisteo Creek (2.2 mi above Lamy to headwaters in SSTEMP, may not be practically achievable in this setting. However shade is only one avenue which may be pursued to decrease water temperature and ultimately meet WQS. Changes in geomorphological parameters might also prove useful. For example, unstable channels may be characterized by excess sedimentation. SWQB encourages stakeholders to pursue whatever options seem to be the best fit for each particular watershed or project with the ultimate goal being that the stream meets the WQS.
Channel morphology improvements to the Apache Canyon tributary, and to the Galisteo Creek mainstem channel above the perennial portion, have potential to improve stability of both temperature impaired AUs. Upland watershed improvements on the north side of the watershed also hold potential to improve temperature and stability conditions in the lower AU (NMED/SWQB and EWI, 2010, and J.W. Jansens, pers. comm.).
2.8 Consideration of Seasonal Variation Section 303(d)(1) of the CWA requires TMDLs to be “established at a level necessary to implement the applicable WQS with seasonal variations.” Both stream temperature and flow vary seasonally and from year to year. Water temperatures are coolest in the winter and early spring months.
The warmest stream temperatures correspond to prolonged solar radiation exposure, warmer air temperature, and low flow conditions. These conditions occur during late summer and early fall and promote the warmest seasonal instream temperatures. It is assumed that if critical conditions are met, coverage of any potential seasonal variation will also be met.
2.9 Future Growth Galisteo Basin is part of the Jemez y Sangre water planning region, which includes all of Los Alamos County, most of Santa Fe County and small parts of Sandoval and Rio Arriba Counties. The University of New Mexico Bureau of Business and Economic Research projects that the population of the Jemez y Sangre water planning region will grow from 178,665 people in 2005 to 216,756 in 2060, with most of that growth taking place in Santa Fe County. Projected aging of the population is likely to result in a decrease of average household size (more housing units per individual) (BBER, 2008). Future growth in the Jemez y Sangre water planning region may lead to increased water temperatures in the Galisteo watershed that could be controlled with best management practices (BMPs). BMPs should continue to be utilized in this watershed to improve road conditions and grazing allotments and adhere to SWPPP requirements related to construction and industrial activities covered under the general permit.
Any future growth would be considered part of the existing load allocation, assuming persistence of the present hydrologic conditions.

24
3.0 Applicable Regulations
New Mexico’s Water Quality Act, NMSA 1978 §§ 74-6-1 to -17 (Act), authorizes the WQCC to “promulgate and publish regulation to prevent or abate water pollution in the state” and to require permits. The Act authorizes a constituent agency to take enforcement action against any person who violates a water quality standard. Several statutory provisions on nuisance law could also be applied to NPS water pollution. The Act also states in §74-6-12(a):
The Water Quality Act (this article) does not grant to the commission or to any other entity the power to take away or modify the property rights in water, nor is it the intention of the Water Quality Act to take away or modify such rights.
In addition, the State of New Mexico Surface Water Quality Standards (see 20.6.4.6.C NMAC) (NMAC, 2012) states:
Pursuant to Subsection A of Section 74-6-12 NMSA 1978, this part does not grant to the water quality control commission or to any other entity the power to take away or modify property rights in water.
New Mexico policies are in accordance with the federal Clean Water Act §101(g):
It is the policy of Congress that the authority of each State to allocate quantities of water within its jurisdiction shall not be superseded, abrogated or otherwise impaired by this Act. It is the further policy of Congress that nothing in this Act shall be construed to supersede or abrogate rights to quantities of water which have been established by any State. Federal agencies shall co-operate with State and local agencies to develop comprehensive solutions to prevent, reduce and eliminate pollution in concert with programs for managing water resources.
New Mexico’s CWA §319 Program has been developed in a coordinated manner with the State’s 303(d) process. All watersheds that are targeted in the annual §319 request for proposal process coincide with the State’s biennial impaired waters list as approved by USEPA. The State has given a high priority for funding, assessment, and restoration activities to these watersheds.
As a constituent agency, NMED has the authority under NMSA 1978 Section 74- 6-10 to issue a compliance order or commence civil action in district court for appropriate relief if NMED determines that actions of a “person” (as defined in the Act) have resulted in a violation of a water quality standard including a violation caused by a NPS. The NMED NPS water quality management program has historically strived for and will continue to promote voluntary compliance to NPS water pollution concerns by utilizing a voluntary, cooperative approach. The State provides technical support and grant monies for implementation of BMPs and other NPS prevention mechanisms through §319 of the CWA. Since portions of this TMDL will be implemented through NPS control mechanisms, the New Mexico Watershed Protection Program will target efforts to this and other watersheds with TMDLs.
In order to obtain reasonable assurances for implementation in watersheds with multiple landowners, including federal, state, and private land, NMED has established Memoranda of Understanding (MOUs) with various federal agencies, in particular the U.S. Forest Service and the Bureau of Land Management. MOUs

25
have also been developed with other state agencies, such as the New Mexico Department of Transportation. These MOUs provide for coordination and consistency in dealing with NPS issues.
The time required to attain standards for all reaches is estimated to be approximately 10-20 years. This estimate is based on a five-year time frame implementing several watershed projects that may not be starting immediately or may be in response to earlier projects. Stakeholders in this process will include SWQB, and other parties identified in the WBP. The cooperation of watershed stakeholders will be pivotal in the implementation of these TMDLs as well.

26
4.0 Public Participation
Public participation will be solicited in development of this TMDL. A Public Comment Draft Galisteo Creek TMDL report will be made available for a 30-day comment period beginning on April 3, 2017, and a public meeting will be held on April 11 at the Oliver La Farge Library in Santa Fe from 5:30 to 7:30. Response to public comments will be included as Appendix C of the final TMDL report.
Once the TMDL is approved by the WQCC and USEPA Region 6, the next step for public participation is development or revision of the WBP and implementation of watershed improvement projects including those that may be funded by CWA §319(h) grants. The WBP development and revision process is open to any member of the public who wants to participate.

27
5.0 References
Bartholow, J.M. 2002. SSTEMP for Windows: The Stream Segment Temperature Model (Version 2.0). U.S. Geological Survey computer model and documentation. Available on line at http://www.fort.usgs.gov. Revised August 2002.
Behnke, R.J. and M. Zarn. 1976. Biology and management of threatened and endangered western trouts. USDA Forest Service, General Technical Report RM-28. Fort Collins, CO. 45 pp.
Bureau of Business and Economic Research (BBER). 2008. A Report on Historical and Future Population Dynamics in New Mexico Water Planning Regions. Prepared for the New Mexico Interstate Stream Commission, August, 2008. Available online at: http://www.ose.state.nm.us/Pub/ISCreports/BBER-WPR-Estimates-Projections-Aug2008.pdf
Disbrow, A.E. and W.C. Stoll. 1957. Geology of the Cerrillos Area, Santa Fe County, New Mexico. New Mexico Bureau of Mines and Mineral Resources, Bulletin 48. Available on line at: https://geoinfo.nmt.edu/publications/monographs/bulletins/downloads/48/Bulletin48.pdf
Earth Works Institute. 2005. Watershed Restoration Action Strategy for the Galisteo Creek Watershed. Available online at: https://www.env.nm.gov/swqb/wps/WRAS/GalisteoWRAS07-01-2005.pdf
Griffith, G.E., Omernik, J.M., McGraw, M.M., Jacobi, G.Z., Canavan, C.M., Schrader, T.S., Mercer, D., Hill, R., and B.C. Moran. 2006. Ecoregions of New Mexico (color poster with map, descriptive text, summary tables, and photographs): Reston, Virginia, U.S. Geological Survey. Available on line at http://www.epa.gov/wed/pages/ecoregions/level_iii_iv.htm.
Jansens, J. December 8, 2016. Personal interview.
Maynard, Stephen R. 2016. Geology of the Cerrillos Hills. Amigos de Cerrillos Hills State Park. Available on line at: http://www.cerrilloshills.org/history/natural-history/geologic-features
Mount, D.I. 1969. Developing thermal requirements for freshwater fishes. In Biological Aspects of Thermal Pollution. Krenkel and Parker (eds.), Vanderbilt University Press, Nashville, TN.
New Mexico Administrative Code (NMAC). 2013. State of New Mexico Standards for Interstate and Intrastate Streams. 20.6.4. New Mexico Water Quality Control Commission. As amended through February 14, 2013.
New Mexico Energy, Minerals and Natural Resources Department (NM EMNRD), lead agency. 2008. Report on the Galisteo Basin. Report and recommendations of 9 state agencies implementing Executive Order 2008-004.
New Mexico Environment Department/ Surface Water Quality Bureau (NMED/SWQB). 2016. Quality Assurance Project Plan for Water Quality Management Programs. Surface Water Quality Bureau. Santa Fe, NM.
28
———. 2014. State of New Mexico 2014-2016 Clean Water Act Integrated §303(d)/ §305(b) List of Assessed Waters. May. Santa Fe, NM.
———. 2013. State of New Mexico Procedures for Assessing Standards Attainment for the Integrated §303(d)/ §305(b) Water Quality Monitoring and Assessment Report. Santa Fe, NM.
———. 2013. Use Attainability Analysis: Aquatic Life Uses for Perennial Reaches of Streams in the Galisteo Watershed. Available online at https://www.env.nm.gov/swqb/UAA/
NMED/SWQB and Earth Works Institute. 2010. Galisteo Watershed Wetlands Action Plan. September 2010. Santa Fe, NM.
Stephens, Daniel B. & Associates. 2003. Jemez y Sangre Regional Water Plan. Available online at http://www.ose.state.nm.us/isc_regional_plans3.html
Waltemeyer, Scott D. 2002. Analysis of the Magnitude and Frequency of the 4-Day Annual Low Flow and Regression Equations for Estimating the 4-Day, 3-Year Low-Flow Frequency at Ungaged Sites on Unregulated Streams in New Mexico. USGS Water-Resources Investigations Report 01-4271. Albuquerque, NM.
Wykoff, D. March 8. 2017. Email message.

29
APPENDIX A SOURCE DOCUMENTATION

30
“Sources” are defined as activities that may contribute pollutants or stressors to a water body (USEPA 1997). The list of “Probable Sources of Impairment” in the Integrated 303(d)/305(b) List, Total Maximum Daily Load documents (TMDL’s), and Watershed-Based Plans (WBP’s) is intended to include any and all activities that could be contributing to the identified cause of impairment. Data on Probable Sources is routinely gathered by Monitoring and Assessment Section staff and Watershed Protection Section staff during water quality surveys and watershed restoration projects and is housed in the Assessment Database (ADB version 2). ADB was developed by USEPA to help states manage information on surface water impairment and to generate §303(d)/ §305(b) reports and statistics. More specific information on Probable Sources of Impairment is provided in individual watershed planning documents (e.g., TMDL’s, WBP’s, etc) as they are prepared to address individual impairments by assessment unit. USEPA through guidance documents strongly encourages states to include a list of Probable Sources for each listed impairment. According to the 1998 305(b) report guidance, “…, states must always provide aggregate source category totals…” in the biennial submittal that fulfills CWA section 305(b)(1)(C) through (E) (USEPA 1997). The list of “Probable Sources” is not intended to single out any particular land owner or single land management activity and has therefore been labeled “Probable” and generally includes several sources for each known impairment. The approach for identifying “Probable Sources of Impairment” was recently modified by SWQB. Any new impairment listing will be assigned a Probable Source of “Source Unknown.” Probable Source Sheets will continue to be filled out during watershed surveys and watershed restoration activities by SWQB staff. Information gathered from the Probable Source Sheets will be used to generate a draft Probable Source list in consequent TMDL planning documents. These draft Probable Source lists will be finalized with watershed group/stakeholder input during the pre-survey public meeting, TMDL public meeting, WBP development, and various public comment periods. The final Probable Source list in the approved TMDL will be used to update the subsequent Integrated List. Literature Cited: USEPA. 1997. Guidelines for preparation of the comprehensive state water quality assessments (305(b) reports) and electronic uptakes. EPA-841-B-97-002A. Washington, D.C.

31
Figure A1. Probable Source Development Process and Public Participation Flowchart

32
Figure A2. Probable Source Identification Sheet for the Public

33
Figure A3. Probable Source & Site Condition Field Sheet for SWQB Staff

APPENDIX B SSTEMP INPUT DATA AND SENSITIVITY ANALYSIS

B 1.0 INTRODUCTION
This appendix provides site-specific hydrology, geometry, and meteorological data for input into the Stream Segment Temperature (SSTEMP) Model (Bartholow, 2002). Hydrology variables include segment inflow, inflow temperature, segment outflow, and accretion temperature. Geometry variables are latitude, segment length, upstream and downstream elevation, Width’s A-term, Width’s B-term, and Manning’s n. Meteorological inputs to SSTEMP Model include maximum air temperature, air temperature, relative humidity, windspeed, ground temperature, thermal gradient, possible sun, dust coefficient, ground reflectivity, and solar radiation. In the following sections, these parameters are discussed in detail for each assessment unit to be modeled using SSTEMP Model. The assessment units were modeled on the date of the maximum recorded water temperature on the respective thermograph records. The assessment units and modeled dates are defined as follows:
Table B.1 Modeled Dates Assessment Unit Modeled date Galisteo Creek (Perennial prt 2.2 mi abv Lamy to hdwts) 6/30/14 Galisteo Creek (Perennial prt Kewa bnd to 2.2 mi abv Lamy) 7/20/10
B 2.0 HYDROLOGY
B 2.1 Segment Inflow and Outflow
This parameter is the streamflow at the top or bottom of the stream segment. To be conservative, the lowest four-consecutive-day discharge that has a recurrence interval of three years, but that does not necessarily occur every three years (4Q3), was used instead of the mean daily flow. These critical low flows were used to reflect the decreased assimilative capacity of the stream to absorb and disperse solar energy. For the upper Galisteo Creek assessment unit, where perennial flow begins at a series of seeps or springs near the confluence with Deer Creek, the flow was entered into SSTEMP Model as 0.1 cfs, which is the same flow modelled as the 4Q3 outflow. The 4Q3 was determined for both Assessment Units using the US Geological Survey’s online tool StreamStats, Version 3.0 (https://water.usgs.gov/osw/streamstats/new_mexico.html), and Basins, an in-house GIS application.
Table B.2 Critical Inflow and Outflow Assessment Unit 4Q3 Inflow 4Q3 Outflow
Galisteo Creek (Perennial prt 2.2 mi abv Lamy to hdwts) 0.1 0.1
Galisteo Creek (Perennial prt Kewa bnd to 2.2 mi abv Lamy) 0.1 0.35
B 2.2 Inflow Temperature
This parameter represents the mean daily water temperature at the top of the segment. For upper assessment unit, in which perennial flow begins at a series of seeps or springs, the inflow temperature was entered into SSTEMP Model as the groundwater, or accretion, temperature (see below). The mean

temperature recorded on the modelled date by the thermograph deployed in 2014 at Canoncito (19.4 °C) was used as the inflow temperature for the lower Assessment Unit.
Table B.3 Inflow Temperature Assessment Unit Inflow Temperature (°C)
Galisteo Creek (Perennial prt 2.2 mi abv Lamy to hdwts) 9.4
Galisteo Creek (Perennial prt Kewa bnd to 2.2 mi abv Lamy) 19.4
B 2.4 Accretion Temperature
The temperature of the lateral inflow, barring tributaries, generally should be the same as groundwater temperature. In turn, groundwater temperature may be approximated by the mean annual air temperature. Mean annual air temperatures for 2010 and 2014, obtained from the PRISM database (http://www.prism.oregonstate.edu/), were used in the absence of measured data. The following table presents the mean annual air temperature for each assessment unit:
Table B.4 Mean Annual Air Temperature as an Estimate for Accretion Temperature Assessment Unit Mean Annual Air
Temperature (°C)
Galisteo Creek (Perennial prt 2.2 mi abv Lamy to hdwts) 9.4
Galisteo Creek (Perennial prt Kewa bnd to 2.2 mi abv Lamy) 10.9
B 3.0 GEOMETRY
B 3.1 Latitude
Latitude refers to the position of the stream segment on the earth’s surface. Latitude was obtained from the SWQB Mapper, a GIS application, by taking the average between the highest and lowest values for the stream corridor within each AU. Only the continuous perennial portion of the headwaters AU (below Deer Creek) was modelled. Latitude input values are summarized below:
Table B.5 Average Latitude Assessment Unit Latitude (decimal degrees)
Galisteo Creek (Perennial prt 2.2 mi abv Lamy to hdwts) 35.538
Galisteo Creek (Perennial prt Kewa bnd to 2.2 mi abv Lamy) 35.444

B 3.2 Dam at Head of Segment
Neither of the assessment units have a dam at the upstream end of the segment.
B 3.3 Segment Length
Only the continuous perennial portion of the headwaters AU (below Deer Creek) was modelled. Segment length was obtained from the SWQB Mapper, a GIS application (https://gis.web.env.nm.gov/SWQB/). The segment lengths are as follows:
Table B.6 Modelled Channel Length Assessment Unit Length (mi)
Galisteo Creek (Perennial prt 2.2 mi abv Lamy to hdwts) 3.6
Galisteo Creek (Perennial prt Kewa bnd to 2.2 mi abv Lamy) 33.5
B 3.4 Upstream and Downstream Elevation
The following upstream and downstream elevations were determined using a USGS topographic map layer:
Table B.7 Upstream and Downstream Elevation Assessment Unit Upstream
Elevation (m) Downstream Elevation (m)
Galisteo Creek (Perennial prt 2.2 mi abv Lamy to hdwts) 2175 2042
Galisteo Creek (Perennial prt Kewa bnd to 2.2 mi abv Lamy) 2042 1700
B 3.6 Width’s A and Width’s B Term
Width versus flow regression analyses were prepared by entering bankfull cross-section field data into a Windows-Based Stream Channel Cross-Section Analysis (WINXSPRO 3.0) Program (USDA, 2005). Field measurements were collected following the SWQB Standard Operating Procedure for Physical Habitat Measurements. Width’s B Term was calculated as the slope of the regression of the natural log of width and the natural log of flow. Theoretically, the Width’s A Term is the untransformed Y-intercept. However, because the width versus discharge relationship tends to break down at very low flows, the Width’s B Term was first calculated as the slope, and Width’s A Term was estimated by solving for the following equation:
𝑊𝑊 = 𝐷𝐷×𝑄𝑄𝐵𝐵
Where,

W =Known width (feet) A =Width’s A Term (seconds per square foot) Q =Known discharge (cfs) B =Width’s B Term (unitless) The following table summarizes Width’s A and B Terms for assessment units requiring temperature TMDLs:
Table B.8 Width’s A and B Terms Assessment Unit Width’s A Term
(s/ft2) Width’s B Term (dimensionless)
Galisteo Creek (Perennial prt 2.2 mi abv Lamy to hdwts) 6.46 0.119
Galisteo Creek (Perennial prt Kewa bnd to 2.2 mi abv Lamy) 3.10 0.424
The following figure presents the detailed calculations for the Width’s B-Term at the Canoncito and Cerrillos monitoring stations, respectively. The regression of natural log of width and natural log of flow is as follows:
Figure B1. Wetted Width versus Flow in the Lower Galisteo Creek AU
y = 0.1192x + 1.8094R² = 0.9661
0
0.5
1
1.5
2
2.5
3
-3 -2 -1 0 1 2 3 4 5
ln (W
) (ft)
ln (Q) (cfs)
Wetted Width vs. FlowGalisteo Creek (Perennial prt 2.2 mi abv Lamy to hdwts)

Figure B2. Wetted Width versus Flow in the Upper Galisteo Creek AU
B 3.7 Manning’s n or Travel Time
Site-specific values were generated by the WINXSPRO program described above. Manning’s n is a measure of channel roughness which varies with depth of flow, increasing in value at shallower stages. The Manning’s n coefficient associated with the 4Q3 flow being modelled was selected.
The following table summarizes the Manning’s n input values for each assessment unit:
Table B.9 Manning’s n values Assessment Unit Manning’s n (dimensionless)
Galisteo Creek (Perennial prt 2.2 mi abv Lamy to hdwts) 0.86
Galisteo Creek (Perennial prt Kewa bnd to 2.2 mi abv Lamy) 0.03
B 4.0 METEOROLOGICAL PARAMETERS
B 4.1 Air Temperature
Air temperature is usually the single most important factor in determining mean daily water temperatures. In the absence of measured air temperature at the thermograph stations, 24 hour mean temperature on the
y = 0.4237x + 1.3252R² = 0.9899
0
0.5
1
1.5
2
2.5
3
3.5
4
-2 -1 0 1 2 3 4 5 6 7
ln (W
) (ft)
ln (Q) (cfs)
Wetted Width vs. FlowGalisteo Creek (Perennial prt Kewa bnd to 2.2 mi abv Lamy)

modelled date at the nearest available weather station was obtained from the Weather Underground website (https://www.wunderground.com/).
Table B.10 Mean Daily Air Temperature Assessment Unit Mean Air Temperature (°C)*
Galisteo Creek (Perennial prt 2.2 mi abv Lamy to hdwts) 26.7
Galisteo Creek (Perennial prt Kewa bnd to 2.2 mi abv Lamy) 28.3 * weather station at Santa Fe Airport
B 4.2 Maximum Air Temperature
The maximum daily air temperature in SSTEMP overrides a calculated value only if the check box is checked. Since the WQS standard of concern is the TMAX, which is particularly sensitive to the maximum air temperature (Bartholow, 2002), an empirical value was entered in this field. In the absence of measured air temperature at the thermograph stations, maximum temperature on the modelled date at the nearest available weather station was obtained from the Weather Underground website.
Table B.11 Maximum Daily Air Temperature Assessment Unit Maximum Air Temperature
(°C)*
Galisteo Creek (Perennial prt 2.2 mi abv Lamy to hdwts) 36.7
Galisteo Creek (Perennial prt Kewa bnd to 2.2 mi abv Lamy) 37.2
* weather station at Santa Fe Airport
B4.3 Relative Humidity
In the absence of measured data at the thermograph stations, 24 hour mean relative humidity on the modelled date at the nearest available weather station was obtained from the Weather Underground website.
Table B.12 Mean Daily Relative Humidity
Assessment Unit Mean Relative Humidiy (%)*
Galisteo Creek (Perennial prt 2.2 mi abv Lamy to hdwts) 15
Galisteo Creek (Perennial prt Kewa bnd to 2.2 mi abv Lamy) 37
* weather station at Santa Fe Airport

B 4.4 Wind Speed
In the absence of measured data at the thermograph stations, 24 hour mean wind speed on the modelled date at the nearest available weather station was obtained from the Weather Underground website.
Table B.13 Mean Daily Wind Speed Assessment Unit Mean Daily Wind Speed
(mph)
Galisteo Creek (Perennial prt 2.2 mi abv Lamy to hdwts) 9
Galisteo Creek (Perennial prt Kewa bnd to 2.2 mi abv Lamy) 8 * weather station at Santa Fe Airport
B 4.5 Ground Temperature
Same as Accretion Temperature, above.
B 4.6 Thermal Gradient
The default value of 1.65 was used in the absence of measured data.
B 4.7 Possible Sun
Percent possible sun was obtained from the Western Regional Climate Center (http://www.wrcc.dri.edu/htmlfiles/westcomp.sun.html#NEW MEXICO). The nearest location with monthly possible sun data is Albuquerque. The percent possible sun is 83 for the month of June and 76 for the month of July.
B 4.8 Dust Coefficient
If a value is entered for solar radiation, SSTEMP Model will ignore the dust coefficient and ground reflectivity and “override” the internal calculation of solar radiation.
B 4.9 Ground Reflectivity
If a value is entered for solar radiation, SSTEMP Model will ignore the dust coefficient and ground reflectivity and “override” the internal calculation of solar radiation.
B 4.10 Solar Radiation
24 hour mean solar radiation data for the model dates were obtained from the National Oceanic and Atmospheric Administration’s Climate Reference Network (https://www.ncdc.noaa.gov/news/national-centers-environmental-information). The closest weather station with available daily solar radiation data
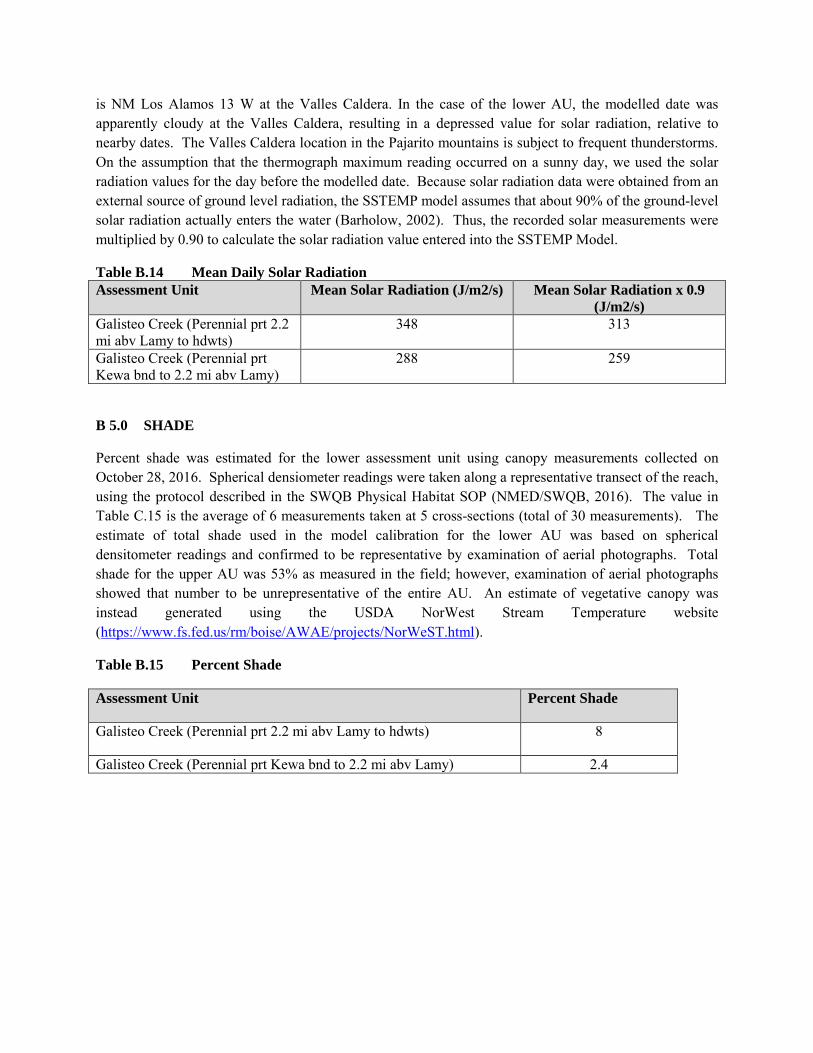
is NM Los Alamos 13 W at the Valles Caldera. In the case of the lower AU, the modelled date was apparently cloudy at the Valles Caldera, resulting in a depressed value for solar radiation, relative to nearby dates. The Valles Caldera location in the Pajarito mountains is subject to frequent thunderstorms. On the assumption that the thermograph maximum reading occurred on a sunny day, we used the solar radiation values for the day before the modelled date. Because solar radiation data were obtained from an external source of ground level radiation, the SSTEMP model assumes that about 90% of the ground-level solar radiation actually enters the water (Barholow, 2002). Thus, the recorded solar measurements were multiplied by 0.90 to calculate the solar radiation value entered into the SSTEMP Model.
Table B.14 Mean Daily Solar Radiation Assessment Unit Mean Solar Radiation (J/m2/s) Mean Solar Radiation x 0.9
(J/m2/s) Galisteo Creek (Perennial prt 2.2 mi abv Lamy to hdwts)
348 313
Galisteo Creek (Perennial prt Kewa bnd to 2.2 mi abv Lamy)
288 259
B 5.0 SHADE
Percent shade was estimated for the lower assessment unit using canopy measurements collected on October 28, 2016. Spherical densiometer readings were taken along a representative transect of the reach, using the protocol described in the SWQB Physical Habitat SOP (NMED/SWQB, 2016). The value in Table C.15 is the average of 6 measurements taken at 5 cross-sections (total of 30 measurements). The estimate of total shade used in the model calibration for the lower AU was based on spherical densitometer readings and confirmed to be representative by examination of aerial photographs. Total shade for the upper AU was 53% as measured in the field; however, examination of aerial photographs showed that number to be unrepresentative of the entire AU. An estimate of vegetative canopy was instead generated using the USDA NorWest Stream Temperature website (https://www.fs.fed.us/rm/boise/AWAE/projects/NorWeST.html).
Table B.15 Percent Shade
Assessment Unit Percent Shade
Galisteo Creek (Perennial prt 2.2 mi abv Lamy to hdwts) 8
Galisteo Creek (Perennial prt Kewa bnd to 2.2 mi abv Lamy) 2.4

B 7.0 SENSITIVITY ANALYSIS
Figure B.3 SSTEMP Maximum Temperature Sensitivity Analysis for the Upper Galisteo Creek AU.
Figure B.4 SSTEMP Maximum Temperature Sensitivity Analysis for the Lower Galisteo Creek AU.

B 6.0 REFERENCES
Bartholow, J.M. 2002. SSTEMP for Windows: The Stream Segment Temperature Model (Version 2.0). U.S. Geological Survey computer model and documentation. Available on the internet at http://www.fort.usgs.gov. Revised August 2002.
New Mexico Environment Department/Surface Water Quality Bureau (NMED/SWQB). 2016. State of New Mexico Standard Operating Procedures. Available on the internet at http://www.nmenv.state.nm.us/swqb/SOP/.
U.S. Department of Agriculture (USDA). 2005. WinXSPRO 3.0. A Channel Cross Section Analyzer. WEST Consultants Inc. San Diego, CA & Utah State University.

APPENDIX C RESPONSE TO COMMENTS