public communication and collusion in the · public communication and collusion in the airline...
TRANSCRIPT
Public Communication and Collusion in the
Airline Industry∗
Gaurab Aryal† , and Benjamin T. Leyden§, Federico Ciliberto‡
September 19, 2018
Abstract
We investigate whether legacy U.S. airlines communicated via earn-
ings calls to coordinate with other legacy airlines in offering fewer seats
on competitive routes. Using text analytics, we build a novel dataset on
communication. Our estimates show that when all legacy airlines in a
market discuss the concept of “capacity discipline,” they reduce offered
seats by between 1.13% to 1.45%. We verify that this reduction materi-
alizes when airlines communicate concurrently, and that it cannot be ex-
plained by the possibility that airlines are simply following through with
their announcements. Additional evidence from conditional-exogeneity
tests and control function estimates confirms our interpretation.
(JEL: D22, L13, L41, L93)
∗We thank Yu Awaya, David Byrne, Karim Chalak, Marco Cosconati, Kenneth G.
Elzinga, Leslie Marx, Robert Porter, Mar Reguant, D. Daniel Sokol, and the semi-
nar/conference participants at the DOJ, University of Florida, UVa, the 16th IIOC, the
2018 BFI Media and Communication Conference, 2018 DC IO Day, the NBER IO SI 2018,
and EARIE 2018 for their constructive feedback. We thank the Buckner W. Clay Dean of
A&S and the VP for Research at UVa for financial support. We also thank Divya Menon
for outstanding research assistance. †Department of Economics, University of Virginia, [email protected] ‡Department of Economics, University of Virginia, [email protected] §Dyson School of Applied Economics and Management, Cornell University, ley-
1

1 Introduction
In all OECD countries, there are two legal paradigms that are meant to pro-
mote market efficiency but that are potentially at odds with each other. On
the one hand, antitrust laws forbid firms from communicating their strategic
choices with each other so as to deter collusion. On the other hand, financial
regulations promote open and transparent communication between publicly
traded firms and their investors. While these latter regulations are intended
to level the playing field among investors, policy makers have raised concerns
in recent years that they may also facilitate anticompetitive behavior. For
example, the OECD Competition Committee noted that while there are pro-
competitive benefits from increased transparency, increased transparency can
also facilitate collusion because “information exchanges can ... offer firms
points of coordination or focal points,” while also “allow[ing] firms to monitor
adherence to the collusive arrangement” [OECD, 2011].1 Thus, firms can be
transparent about their future strategies in their public communications to
investors—e.g., by announcing their intention to rein in capacity—which, in
turn, can spur and sustain collusion on capacity.2
In this paper, we contribute to this overarching research and policy issue
by investigating whether the top managers of all legacy U.S. airlines used their
quarterly earnings calls to communicate with other legacy airlines in reducing
1Similar situations, where one set of laws is at odds with another, generating unan-ticipated consequences, often in the form of antitrust violations, are observed in many industries. For example, in the U.S. pharmaceutical industry, the tension between the FDA laws and patent law led to the Drug Price Competition and Patent Term Restoration Act (colloquially known as the Hatch-Waxman Act). This Act was intended to reduce entry barriers for generic drugs, but it incentivized incumbent firms to Pay-for-Delay of generic drugs and stifle competition. For more, see Feldman and Frondorf [2017]. In another ex-ample, Byrne and de Roos [Forthcoming] document that gasoline retailers in Australia used the price transparency program called Fuelwatch to initiate and sustain collusion.
2There is a subtle difference between economists and lawyers when it comes to the use of the term “tacit” to refer to a collusion; see Green, Marshall and Marx [2014]. For lawyers, collusion is explicit only if there was an “agreement,” which has a special meaning; otherwise it is tacit. For economists, collusion is explicit if it involves communication, which includes cheap talk and/or transfers, otherwise the collusion is tacit. Thus, we are in the world of explicit collusion, henceforth collusion. We thank Leslie Marx for clarifying this distinction.
2

the number of seats offered in the U.S.3 We show that these airlines used
keywords associated with the notion of “capacity discipline” in their earnings
calls to communicate to their counterparts their willingness to reduce offered
seats in markets where they compete head-to-head.4 In particular, we find
that when all legacy carriers serving a market discussed capacity discipline,
they subsequently reduce their capacity in that market by between 1.13% and
1.45%.
The airline industry is a good testing ground to study this problem for
at least two reasons. First, the airline industry is characterized by stochastic
demand with private and noisy monitoring, which typically makes coordina-
tion infeasible. However, Awaya and Krishna [2016, 2017] and Spector [2018]
have shown that firms can use cheap talk (unverifiable and non-binding com-
munication) to sustain collusion even in such an environment.5 Second, the
airline industry has used communication to coordinate behavior in the past.
In particular, in 1992, the U.S. Department of Justice filed a lawsuit against
eight major domestic airlines and the Airline Tariff Publishing Company in
order to reduce opportunities for collusion in the industry [Borenstein, 2004;
Miller, 2010].
In our context, airlines have access to a public communication technology
(quarterly earnings calls) through which they have the ability to signal to oth-
ers about their residual demand, e.g., whether it is high or low. For instance
when all airlines simultaneously communicate that their (residual) demand
is low, it signals to others that their revenue is low due to low demand and
3Earnings calls are teleconferences in which a publicly traded company discusses its performance and future expectations with financial analysts and news reporters. Legacy carriers are Alaska Airlines (AS), American Airlines (AA), Continental Airlines (CO), Delta Airlines (DL), Northwest Airlines (NW), United Airlines (UA) and US Airlines (US), and the low-cost carriers (LCC) are AirTran Airways (FL), JetBlue (B6), Southwest (WN) and Spirit Airlines (NK).
4The idea of using “capacity discipline” as a message sent by airlines to signal their intention to restrict supply is also applied in the recent class-action lawsuits filed against a few airlines (c.f. Section 3.1). Sharkey [2012] and Glusac [2017] provide coverage of this concept in the popular press. Also see Rosenfield, Carlton and Gertner [1997] and Kaplow [2013] for antitrust issues related to communication among competing firms.
5There is a vast literature on firms’ market conduct and the behavior of cartels; see, e.g., Harrington [2006], Mailath and Samuelson [2006], and Marshall and Marx [2014].
3

not because someone cheated. Such a communication strategy can potentially
allow airlines to circumnavigate the difficulty they face when trying to coor-
dinate, a difficulty that is particularly strong in airline industry because the
demand is affected by exogenous local events, such as weather or unforeseen
events at the airport, and cross-market events like political events and oil price
shocks. Moreover, because airlines use connecting passengers to manage their
load factors, monitoring one another is especially difficult, as the process of
inferring a competitor’s ticket fare by segments of a trip is at best noisy and
lengthy.
In trying to determine whether legacy U.S. carriers are using their earnings
calls to coordinate capacity reduction, we face two primary challenges. First,
seeing a reduction in capacity after carriers discuss capacity discipline may
just be an evidence that earnings calls are operating as intended: Airline
executives are using the calls to make forward-looking statements that keep
investors informed about the company’s direction. Second, airline markets
are highly differentiated, and communication about capacity discipline may
be correlated with one of the many reasons capacity might change month-to-
month in a given market raising possible concerns about endogeneity.
In light of these two issues, we take a three-step approach to determining
whether US carriers are using their earnings calls to coordinate capacity re-
ductions. In the first step, we present our primary finding. Namely, when all
legacy carriers serving a given market talk about capacity discipline, they sub-
sequently reduce their capacity. In the second step, we show that discussion
of capacity discipline is not consistent with the ostensible reason for earnings
calls: providing financial transparency. That is, we show that discussion of
capacity discipline is not always a bona fide exercise in informing investors
about future plans because legacy carriers do not reduce capacity when they
talk about capacity discipline but their competitors do not. Similarly, legacy
carriers do not lower capacity in monopoly markets after expressing a desire
to engage in capacity discipline. These latter findings, combined with our pri-
mary result, rule out the possibility that we are simply picking up on earnings
calls being used for the purpose of financial transparency.
4
In the third and final step, we address endogeneity concerns in two ways.
First, we develop a novel approach for addressing conditional exogeneity of our
measure of communication among legacy airlines in a market in the presence
of text data. Following that, we show that our result is robust to using a
control function approach to address the potential endogeneity of our variable
of interest. After completing these three steps, we conclude that U.S. carriers
are using their quarterly earnings calls to coordinate capacity reductions in
the shared markets.
We estimate the effect of communication on the carriers’ market-level ca-
pacity decisions using data from the T-100 domestic segment for U.S. carriers
at the monthly and non-stop route level. To that end, we run a fixed-effect re-
gression of the log number of seats offered by an airline in a market in a month
on an indicator of whether all legacy carriers that are operating in the market
discuss capacity discipline. Given that airlines’ capacity decisions depend on
a wide variety of market-specific and overall economic conditions, our analysis
includes a rich set of covariates to control for such variation across markets
and carriers over time.
To estimate this effect, we build an original and novel dataset on the public
communication content in the earnings calls. The Securities and Exchange
Commission (SEC) requires all publicly traded companies in the U.S. to file
a quarterly report, which is usually accompanied by an earnings call, a public
conference call where top executives discuss the content of the report with
analysts and financial journalists. We collected transcripts of these calls for
11 airlines from 2002:Q4 to 2016:Q4. Then we classified each earnings call as
pertinent or as not pertinent, depending on whether the executives on the call
declared their intention of engaging in capacity discipline.6
6Consider the following statement by Alaska in 2003:Q3:
“I think what we’ve concluded is that there’s enough noise in the markets with adjustments to capacity in many of the markets that we serve that we are seeing strength in demand, which is more a function of the changes in capacity than it is changes to the price.”
Clearly, there is a fine line between managing capacity to provide adequate service to satisfy demand while engaging in capacity discipline, whereby the airlines restrict the number of seats made available in a market even when there would be demand for more seats. We
5

We find that when all legacy carriers operating in an airport-pair market,
with at least two legacy carriers, communicate about capacity discipline in
given quarter, the average number of seats offered in those markets decreased
by 1.45% in the subsequent quarter.7 Moreover, if we decompose the average
effect by the type of airline (legacy or LCC), we find no evidence of capacity
restrictions by the LCCs, and that all effects are due to legacy carriers.8
To put the 1.45% overall decrease in perspective, consider the fact that
the average change in capacity among all legacy carriers in our entire sample
is 3.78%. So, the 1.45% decline in capacity associated with the use of the
phrase capacity discipline accounts for more than one-third of this average
change. In this light, it is clear that the effect is economically significant.
Thus, we find evidence to support the hypothesis that legacy airlines used
public communication to reduce their offered capacity.
We then turn to the two key concerns that need to be addressed. First,
there can be a simpler alternative explanation for our findings. It might be
the case that airline executives are communicating their intention to reduce
capacity as a best response to negative demand forecasts. In other words, our
results may just be an evidence that the earnings call is serving its ostensible
purpose. We address this concern in two ways. To begin, we show that legacy
carriers who have discussed capacity discipline do not reduce their capacity
when all of the other legacy carriers serving that market did not discuss ca-
pacity discipline. Next, we show that legacy carriers who discuss capacity
discipline do not subsequently decrease their capacities in monopoly markets.
If discussion of capacity discipline was meant to inform investors about the
carrier’s future actions, we would expect to see a reduction in one or both of
these cases. The fact that we do not in either case is consistent with the view
that legacy airlines were using discussion of capacity discipline to coordinate
return to this issue in Section 3.2. 7We also show that the results are robust to defining airline markets with city-pairs
instead of airport-pairs. The results are in presented in the Appendix A. 8In Appendix A we also explore whether the effect of communication varies by market
size and by the share of business travelers in the market. We find that the reduction is larger (4.25%) in smaller markets and larger (2.74%) in low business markets.
6

with their legacy competitors.
We also must consider the possibility that omitted variables and endoge-
nous market structure may affect our findings. We address this possibility in
two ways. First, we implement a test of conditional exogeneity that is based
on White and Chalak [2010]. In order to conduct this test, we employ the
word2vec model, a neural network model that is commonly used in compu-
tational linguistics [Mikolov et al., 2013], to identify words in the corpus of
earnings call transcripts that are likely to occur when carriers discuss capacity
discipline. We identify a set of six such words, and, using those words, we
are able to run a test where a null result is consistent with our assumption of
conditional exogeneity. Indeed, our results provide additional assurance that
this assumption is reasonable.
We then consider the scenario where our findings are confounded by the
endogeneity of market structure (the set of airlines serving a market). Market
structure can be endogenous because the same unobserved factors that explain
capacity decisions also explain the decision of firms to serve a market. And
if market structure is endogenous then our measure of communication will be
endogenous as well. To address the endogeneity of market structure we use
a control function approach where the excluded variables are functions of the
geographical distances between a market’s endpoints and the closest hub of a
carrier. The maintained identification assumption is that these distances are
proxies for the fixed cost that a carrier has to face to serve that market, and
thus explain the entry decision of firms [Ciliberto and Tamer, 2009], but do not
enter directly in the capacity decisions. Our control function approach consists
of predicting the likelihood that an airline serves the market and using these
probabilities to estimate the effect of communication on capacity. When using
our control function approach, we find that legacy carriers significantly reduce
their seats, next quarter, by 1.13%, on average, when when they communicate.9
9We discuss our control function approach in Section 4.3.2, and provide additional details on this approach in Appendix B.
7

2 Related Literature
We contribute to a very rich literature in economics on collusion that goes
back to at least Stigler [1964]. For a comprehensive overview, see Viscusi,
Harrington and Vernon [2005] and Marshall and Marx [2014]. One important
class of models, including Green and Porter [1984] and Abreu, Pearce and
Stacchetti [1986], considers collusion when the output of individual firms is
not observed by other firms, and instead a noisy signal, in the form of market
clearing price, is publicly observed. In an important empirical paper, Porter
[1983] tests the prediction from Green and Porter [1984] using data from the
Joint Executive Committee railroad cartel. In this regard, our paper is similar
in spirit to Porter [1983] because we test whether there is evidence of collusion
maintained by the use of public communication in the U.S. airline industry.10
And, as far as we know, this is the first empirical paper that links the theory
of communication with collusion in capacity using field data.
We also complement the literature on law and economics of collusion, such
as Miller [2010], that studies the airline industry in the context of the DOJ’s
litigation of collusion against 8 airlines and a clearing house that publishes
airfares and restrictions among all airlines. As described in Borenstein [2004],
the DOJ alleges that the airlines used the electronic fare system from the
aforementioned clearing house to communicate and sustain collusion.
There is a rich literature in game theory that studies the role of commu-
nication in noncooperative games; see Myerson [1997], Chapter 6. The main
finding is that with communication players achieve (ex-ante) higher payoffs
than they would without communication. There is, however, scant empiri-
cal evidence that supports this result. Ability to communicate can be even
more beneficial under imperfect monitoring, where collusion would be infeasi-
ble without communication. This paper provides empirical evidence for this
claim in the context of the airlines industry.
Lastly, our paper is also related to the growing economic and computational
10In Porter [1983] and Green and Porter [1984], all firms observe the same (noisy signal) price, and access to communication technology does not change anything because the profits from public perfect equilibrium is the same with and without communication.
8

social science literature that uses text as data. As more and more communi-
cation and market interactions are recorded digitally, the use of large-scale,
unstructured text data in empirical research in and outside of industrial orga-
nization is likely to become even more important. For instance, Leyden [2018]
considers the problem of defining relevant markets for smartphone and tablet
applications using text descriptions of the applications. Other examples of
papers that use text as data include Gentzkow and Shapiro [2014], who use
phrases from the Congressional Record to measure the slant of news media
and Hoberg and Philips [2016], who use the text descriptions of businesses
included in financial filings to define markets. For a survey of the topic see
Gentzkow, Kelly and Taddy [2017].
3 Institutional Analysis and Data
In this section we introduce the legal cases that motivate our approach, ex-
plain how we use Natural Language Processing (NLP) techniques to quantify
communication among airlines, and finally present our data on the airline
industry.
3.1 Legal Case
On July 1, 2015, the Washington Post reported that the DOJ was investigating
possible collusion to limit available seats and maintain higher fares in U.S.
domestic airline markets by American, Delta, Southwest Airlines, and United
(Continental) [Harwell, Halsey III and Moore, 2015]. It was also reported that
the major carriers had received Civil Investigative Demands (CID) from the
DOJ requesting copies, dating back to January 2010, of all communications
the airlines had with each other, Wall Street analysts, and major shareholders
concerning their plans for seat capacity and any statements to restrict it. The
CID requsts were subsequently confirmed by the airlines in their quarterly
reports.
Concurrently, several consumers filed lawsuits accusing American, Delta,
9

Southwest, and United of fixing prices, which were later consolidated in a
multi-district litigation. The case is currently being tried in the U.S. District
Court for the District of Columbia.11 Another case, filed on August 24, 2015,
in the U.S. District Court of Minnesota against American, Delta, Southwest
Airlines, and United/Continental, alleges that the companies conspired to fix,
raise, and maintain the price of domestic air travel services in violation of
Section 1 of the Sherman Antitrust Act.12
The lawsuits allege that the airline carriers collusively impose “capacity
discipline” in the form of limiting flights and seats despite increased demand
and lower costs, and that the four airlines implement and police the agree-
ment through public signaling of future capacity decisions.13 In particular,
one of the consumers’ lawsuits reported several statements made by the top
managers of American, Delta, Southwest, United, and other airlines (such as
Alaska Airlines). The statements were made during quarterly earnings calls
and various conferences.14
These lawsuits provide the foundation to build a vocabulary from the earn-
ings calls that can capture legacy airlines’ (alleged) intention to restrict their
offered capacity. To that end, we have to consider both the semantics (air-
11This case is “Domestic Airline Travel Antitrust Litigation,” numbered 1:15-mc-01404 in the US District Court, DC.
12Case 0:15-cv-03358-PJS-TNL, filed 8/24/2015 in the US District Court, District of Minnesota. In November 2015, this case was transferred to the District Court in DC. At the time of this writing, American Airlines and Southwest have settled the class action lawsuits.
13The consumers’ lawsuits also stress the role of financial analysts who participate at the quarterly earnings call. See Azar, Schmalz and Tecu [2018] for a recent work on the role of institutional investors on market conduct. We instructed our research assistant (RA) to find all instances where institutional investors were the first to bring up capacity discipline. The RA found only three such instances. Therefore, we decided not to consider the role of institutional investors as the ones leading the firms to collude. See Appendix D for more details.
14For example, during the US Airways 2012:Q1 earnings call, the CFO of US Airways Derrick Kerr and Delta’s CEO Richard Anderson said, respectively,
“.. mainline passenger revenue were $2.1 billion, up 11.4% as a result of the strong pricing environment and continued industry capacity discipline.” – US Airways. “You’ve heard us consistently state that we must be disciplined with capacity.” – Delta
10

lines’ intention to rein in capacity) and the syntax (which keywords are used)
of the earnings call reports. Next, we explain the steps we take to measure
communication.
3.2 Earnings Call Text as Data
All publicly traded companies in the U.S. are required to file a quarterly report
with the SEC. These reports are typically accompanied by an earnings call,
which is a publicly available conference call between the firm’s top manage-
ment and the analysts and reporters covering the firm. Earnings calls begin
with statements from some or all of the corporate participants followed by a
question-and-answer session with the analysts on the call. Transcripts of calls
are readily available, and we assume that carriers observe their competitors’
calls.
We collected earnings call transcripts for 11 airlines, for all quarters from
2002:Q4 to 2016:Q4 from LexisNexis (an online database service) and Seeking
Alpha (an investment news website). Figure 1 indicates the availability of
transcripts in our sample for each of the 11 airlines. As the figure shows, tran-
scripts are available for most of the quarters except under (i) Bankruptcy—five
carriers entered bankruptcy at least once during the sample period; (ii) Merg-
ers and acquisitions—airlines did not hold earnings calls in the interim between
the announcement of a merger and the full operation of the merger; (iii) Pri-
vate airlines—Spirit Airlines, which was privately held until May 2011, neither
submitted reports nor conducted earnings calls prior to its initial public offer-
ing; and (iv) Other reasons—there are a few instances when the transcripts
were unavailable for an unknown reason. In all cases where a call is unavail-
able, we assume the carrier is unable to communicate to its competitors and
engage in any potential cheap talk messaging.
The key step of our empirical analysis is to codify the informational content
in these quarterly earnings calls into a dataset that can be used to see how
capacity choices change over time in response to communication among legacy
carriers. Before delving into the conceptual challenges, there are two prelimi-
11
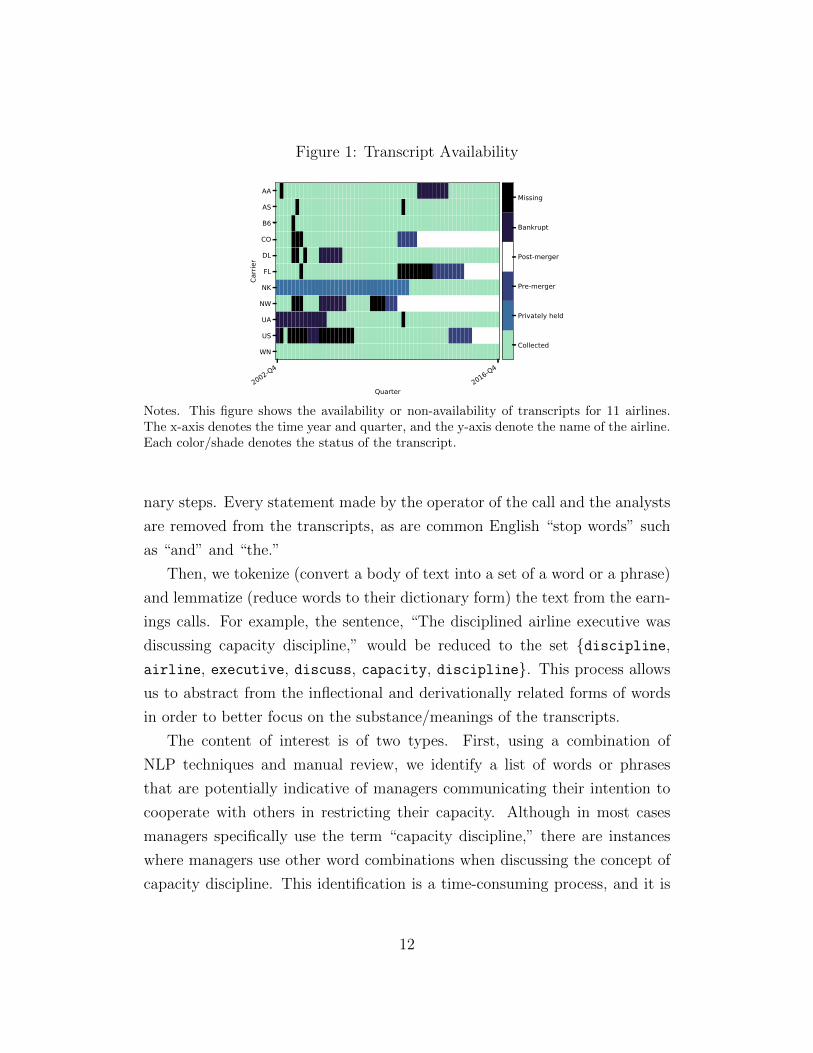
Figure 1: Transcript Availability
2002-Q42016-Q4
Quarter
AA
AS
B6
CO
DL
FL
NK
NW
UA
US
WN
Carri
er
Collected
Privately held
Pre-merger
Post-merger
Bankrupt
Missing
Notes. This figure shows the availability or non-availability of transcripts for 11 airlines. The x-axis denotes the time year and quarter, and the y-axis denote the name of the airline. Each color/shade denotes the status of the transcript.
nary steps. Every statement made by the operator of the call and the analysts
are removed from the transcripts, as are common English “stop words” such
as “and” and “the.”
Then, we tokenize (convert a body of text into a set of a word or a phrase)
and lemmatize (reduce words to their dictionary form) the text from the earn-
ings calls. For example, the sentence, “The disciplined airline executive was
discussing capacity discipline,” would be reduced to the set {discipline, airline, executive, discuss, capacity, discipline}. This process allows us to abstract from the inflectional and derivationally related forms of words
in order to better focus on the substance/meanings of the transcripts.
The content of interest is of two types. First, using a combination of
NLP techniques and manual review, we identify a list of words or phrases
that are potentially indicative of managers communicating their intention to
cooperate with others in restricting their capacity. Although in most cases
managers specifically use the term “capacity discipline,” there are instances
where managers use other word combinations when discussing the concept of
capacity discipline. This identification is a time-consuming process, and it is
12

the focus of the remainder of this section. Second, we use NLP to identify
words that can be used for our conditional-exogeneity test; we discuss this
type of content in Section 4.3.
To codify the use of the phrase “capacity discipline” and other combina-
tions of words that carry an analogous meaning, we begin by coding “capac-
ity discipline” with a categorical variable Carrier-Capacity-Disciplinej,t,
which takes the value 1 if that phrase appears in the earnings call transcript
of carrier j in year-quarter preceding the month t and 0 otherwise.
In many instances, however, airline executives do not use the exact phrase
“capacity discipline,” but the content of their statements are closely related
to the notion of capacity discipline, as is illustrated in the following text:
“We intend to at least maintain our competitive position. And so,
what’s needed here, given fuel prices, is a proportionate reduction
in capacity across all carriers in any given market. And as we said
in the prepared remarks, we’re going to initiate some reductions
and we’re going to see what happens competitively. And if we find
ourselves going backwards then we will be very capable of reversing
those actions. So, this is a real fluid situation but clearly what has
to happen across the industry is more reductions from where we
are given where fuel is running.” – Alaska Airlines, 2008:Q2.
Our view is that this instance and other similar ones should be interpreted
as conceptually analogous to uses of the phrase capacity discipline. Yet, in
other cases it is arguable whether the content is conceptually analogous to the
one of “capacity discipline,” even though the wording would suggest so. For
example, consider the following cases:
“We are taking a disciplined approach to matching our plan capac-
ity levels with anticipated levels of demand” – American Airlines,
2017:Q3
13

“We will remain disciplined in allocating our capacity in the mar-
kets that will generate the highest profitability.” – United Airlines,
2015:Q4
These statements, and others like these, cannot be easily categorized as a
clear intention of the airline to reduce capacity below the GDP growth levels.
On one hand, the “anticipated levels of demand” depend on the competitors’
decisions, and thus one could interpret this statement as a signal to competitors
to maintain capacity discipline. On the other hand, an airline should not put
more capacity than what is demanded because that implies higher costs and
lower profits.
We take a conservative approach and code all these instances as ones where
the categorical variable Carrier-Capacity-Disciplinej,t is equal to 1. This
approach is conservative because it assumes that the airlines are coordinating
their strategic choices more often than their words would imply, and would
work against finding a negative relation. In other words, we design our coding
to err to find false negatives (failing to reject the null hypothesis that commu-
nication does not affect capacity), rather than erring on the side of finding false
positives. We take this approach because our analysis includes variables that
control for year, market, and year-quarter-carrier specific effects that control
for any unobserved heterogeneity that might explain a reduction of capacity
driven by a softening of demand. Therefore, our coding approach attenuates
the effect of “capacity discipline” and makes us less likely to find evidence of
collusion when collusion is true.
In practice, to identify all the instances where the notion of capacity dis-
cipline was present but the phrase “capacity discipline” was not used, we
used NLP to process all transcripts and flag those transcripts where the
word “capacity” was used in conjunction with either the word “demand” or
“GDP.” This filter identified 248 transcripts, which we read manually to clas-
sify as either pertinent or not pertinent for capacity discipline. If the tran-
script was identified by all three of us as pertinent, then we set the variable
Carrier-Capacity-Disciplinej,t = 1, and zero otherwise. Out of the 248
14

Table 1: Frequency of Communication
Communication N
Legacy 0.541 253 (0.499)
LCC 0.131 160 (0.339)
Jet Blue 0.111 54 (0.317)
Southwest 0.073 55 (0.262)
All 0.383 413 (0.487)
Notes. Fraction of earnings calls where Carrier-Capacity-Discipline is equal to one. The standard deviations are presented in the parentheses.
transcripts, 105 contained statements that we deemed pertinent.15
Table 1 presents the summary statistics of Carrier-Capacity-Disciplinej,t.
We have 253 earnings calls transcripts for the legacy carriers, and 54.1% in-
clude content associated with the notion of capacity discipline. We have fewer
transcripts for LCCs, JetBlue and Southwest, and content associated with ca-
pacity discipline is much less frequent. Overall, we have 413 transcripts and
Carrier-Capacity-Disciplinej,t = 1 in 38.3% of them. Table 1 suggests
that the LCCs, including Southwest (WN), are much less likely to publicly
talk about capacity discipline. In view of this data feature, in our empirical
exercise, we focus only on communication by legacy carriers.
3.3 Airline Data
We use two datasets for the airline industry: the T-100 Domestic Segment
for U.S. carriers and a selected sample from the OAG Market Intelligence-
15In addition to the coding approach described above, we had an RA independently code all transcripts, and coded all transcripts only using an automated approach. We discuss these approaches, and the results of estimating our primary model with these datasets in Appendix D.
15

Schedules dataset. We consider the months between 2003:Q1 and 2016:Q3
(inclusive). The Bureau of Transportation Statistics’ T-100 Domestic Segment
for U.S. carriers contain domestic non-stop segment (i.e., route) data reported
by U.S. carriers, including the operating carrier, origin, destination, available
capacity, and load factor.
In many instances, there are also regional carriers, such as SkyWest or PSA,
that operate on behalf of the ticketing carriers. The regional carriers might
be subsidiaries that are fully owned by the national airlines, e.g., Piedmont,
which is owned by American (and prior to that by U.S. Airways), or they might
operate independently but contract with one or more national carrier(s), e.g.,
SkyWest. In order to allocate capacity to the ticketing carriers, we merge
our data with the data from the OAG Market Intelligence, which contains
information about the operating and the ticketing carrier for each segment
at the quarterly level. Using this merged dataset, we allocate the available
capacity in each route in the U.S. to the ticketing carriers, which will be the
carriers of interest. We consider only routes between airports that are located
in the proximity of a Metropolitan Statistical Area in the U.S.16
3.4 Variable Definitions
We say that legacy airlines are communicating with each other when all of
those legacy airlines that are serving a non-monopoly market discuss capacity Legacydiscipline. Defining Jm,t as the set of legacy carriers in market m at time t,
we define a new variable, only for the legacy carriers,
Capacity-Disciplinem,t = ⎧ �⎨ Legacy Legacy1 Carrier-Capacity-Disciplinej,t = 1 ∀j ∈ Jm,t , |Jm,t | ≥ 2 ⎩ Legacy0 , |J | < 2m,t
16We use the U.S. DOC’s 2012 data to identify Metropolitan Statistical Areas in the U.S. See Appendix A for a detailed discussion of market definition. In that section we also run the empirical analysis where markets are defined by the origin and destination cities, rather than airports.
16

Figure 2: Prevalence of “Capacity Discipline” in Earnings Call Transcripts
2002-Q42016-Q4
Quarter
AA
AS
B6
CO
DL
FL
NK
NW
UA
US
WN
Carri
er
Collected (Talk)
Collected (No Talk)
Privately held
Pre-merger
Post-merger
Bankrupt
Missing
Notes. This figure shows the availability of transcripts and the prevalence of “Capacity Discipline” for 11 airlines. The x-axis denotes years and quarters, and the y-axis denotes the name of the airlines. Each color/shade denotes the status of the transcript. Collected (Talk) means the transcript is available and the airline discussed capacity discipline, and Collected (No Talk) means the transcript is available but the airline did not discuss capacity discipline.
Thus, Capacity-Disciplinem,t indicates whether all of the legacy carriers
in m discussed capacity discipline that quarter, conditional on two or more
legacy carriers serving that market. In cases where less than two legacy
carriers serve a market, Capacity-Disciplinem,t is set equal to 0. While
Carrier-Capacity-Disciplinej,t varies by year-month and carrier, our treat-
ment Capacity-Disciplinem,t varies by market and year-month. This is an
important distinction for the empirical analysis, where the observations will
be at the market-carrier-year-month level.
Figure 2 shows the occurrence of Carrier-Capacity-Disciplinej,t in our
data. Each row corresponds to one airline and shows the periods for which
each carrier discussed capacity discipline. There is significant variation in
communication across both airlines and time, which is necessary for identifica-
tion. Even though the reports do not vary within a quarter, the composition
of airlines operating in markets—market structure—vary both within a quar-
ter and across quarters, providing enough variation in the dummy variable
Capacity-Disciplinem,t.
17

Table 2: Summary Statistics
Seats Cap. Discipline Talk Eligible Monopoly Market Missing Report
Mean SD Median Mean SD Mean SD Mean SD Mean SD N
Carrier Type Legacy LCC
11,783.793 11,407.016
12,297.048 10,626.587
7,374.000 8,220.000
0.087 0.031
0.281 0.175
0.308 0.105
0.462 0.306
0.549 0.473
0.498 0.499
0.267 0.097
0.442 0.296
561,008 279,141
Total 11,658.608 11,769.699 7,809.000 0.068 0.252 0.241 0.428 0.524 0.499 0.210 0.408 840,149
Notes. Table of summary statistic for all key variables. Observations are at the carrier-market-month level for airport-pair markets.
Table 2 provides a summary of this airline data. Legacy carriers offer, on
average, 11,783.8 seats in a month, while LCCs offer 11,407. Both airlines
offer similar number of seats, but we also see that legacy airlines tend to serve
monopoly routes slightly more (55%) often than the LCCs (47%). Legacy car-
riers use Capacity-Disciplinem,t almost three times (8.7%) more frequently
than the LCC (3.1%). Consistent with our focus on the communication of
legacy carriers, as opposed to LCCs, we find that legacy carriers are far more
likely to be in a market where Capacity-Discipline is equal to 1.
We define the categorical variable Talk-Eligible ∈ {0, 1} to be equal m,t
to 1 if there are at least two legacy carriers in market m in period t and
0 otherwise. This variable controls for the possibility that markets where
legacy carriers could engage in coordinating communication may be funda-
mentally different from markets where such communications are not possible.
Not including this control variable would confound the effect of talking on
seats. Table 2 shows that, on average, 24% of the observations in our sample
have the potential for coordinating communications. In a similar vein, markets
served by a single carrier could differ from non-monopoly markets. We account
for this possibility by introducing the categorical variable MonopolyMarketm,t,
which is equal to 1 if market m in period t is served by only one firm and equal
to 0 otherwise. Table 2 shows that, on average, 52.4% of the observations are
monopoly markets and that legacy carriers are more likely to serve a monopoly
market than LCCs.
As discussed above, we take special note of markets where we were unable
18

to collect an earnings call transcript.17 To account for that, we introduce a
categorical variable MissingReportm,t ∈ {0, 1} is equal to 1 if at least one of
the carriers serving market m in period t is not holding an earnings call at
time t − 1. Table 2 shows that legacy carriers are more likely to be missing a
report—a result of the bankruptcy periods of many of the legacies.
3.5 Flexible Capacity
One of the prerequisites for airlines to coordinate capacity decisions is that the
capacity is non-binding and airlines have sufficient flexibility across markets.
To get a quantitative sense of the ability of carriers to change capacity and
move planes across markets, we used the OAG dataset to count the number of
unique markets that each aircraft serves in a month. We find that, on average,
an aircraft (identified by its tail number) operates in 79 unique markets in a
month. This finding suggests that airlines do not face capacity constraints at
the quarterly level. Airline carriers can change the capacity across markets in
multiple ways. They can remove a plane from a domestic market and park
it in a hangar, they can move that plane to serve an international route, or
they can reallocate that plane to another domestic market. The airlines can
also change the “gauge” of an aircraft, i.e., increase or decrease the number of
seats or change the ratio of business to coach seats.
4 Empirical Analysis
In this section we take a three-step approach to determining whether U.S.
carriers are using their earnings calls to coordinate capacity reductions.
In Section 4.1, we present our empirical model and discuss our primary
finding. Namely, we find that when all legacy carriers in a given market discuss
capacity discipline, they subsequently reduce capacity by 1.45%. Furthermore,
17See Section 3.2 for a discussion of when and why we were unable to collect a transcript. Transcripts are missing for legacy carriers more often than for LCCs, largely due to the increased prevalence of bankruptcies in the legacy carriers.
19

Figure 3: Density of Log Seats in Non-Monopoly Markets 0
.1.2
.3.4
.5
4 6 8 10 12Log Seats
Capacity Discipline = 0 Capacity Discipline = 1
0.1
.2.3
.4.5
4 6 8 10 12Log Seats
Capacity Discipline = 0 Capacity Discipline = 1
0.1
.2.3
.4.5
4 6 8 10 12Log Seats
Capacity Discipline = 0 Capacity Discipline = 1
(a) All Markets (b) Mixed Markets (c) Legacy Markets
Notes. Plots reflect the densities of log seats across market-months for non-monopoly mar-kets. Vertical lines mark the mean of each density.
this effect appears to be entirely due to capacity reductions by legacy carriers,
as opposed to LCCs.
An innocuous explanation for this finding is that carriers are simply an-
nouncing future plans to their investors and are then following through with
those announcements. In Section 4.2, we show that this is not the case. When
a legacy carrier discusses capacity discipline but its competitors do not, the
carrier does not reduce capacity. Similarly, carriers that discuss capacity dis-
cipline do not subsequently reduce their capacities in monopoly markets.
Finally, in Section 4.3, we address the causal interpretation of our results
using both a test of conditional exogeneity and a control function approach.
In both cases, we find support for a causal interpretation of our finding that
U.S. carriers are using discussion of capacity discipline during their quarterly
earnings calls to coordinate capacity reductions.
4.1 Primary Model and Results
We examine the relationship between communication among legacy airlines
and the seats they offer between 2003:Q1 and 2016:Q3 (inclusive). We begin
by considering the relationship observed in the raw data between log-seats and
whether every legacy carrier operating in a given market communicated their
intention to engage in capacity discipline. In Fig. 3 we show the densities of
log-seats in non-monopoly markets by whether Capacity-Discipline is 0 or
20

1. We find that capacity is on average 3.2% lower when legacy airlines talk
about capacity discipline in all markets (Fig. 3a). When all legacy airlines
talk in mixed-markets, which are markets served by both legacy and LCCs,
there is a 13% increase in offered seats, but if we consider legacy markets—
markets served only by legacy carriers—then communication is correlated with
a 7.0% decrease in offered seats (Figs. 3b and 3c, respectively). These numbers
suggests that coordination, if present, is not all-inclusive, and occurs only
among the legacy carriers.
We next estimate these effects after controlling for all relevant confounding
factors. To that end, we use the airline panel to estimate the following model
for airline j in market m in month t
ln(seatsj,m,t) =β0 × Capacity-Disciplinem,t + β1 × Talk-Eligiblem,t
+ β2 × Monopolym,t + β3 × MissingReportm,t
+ µj,m + µj,yr,q + γorigin,t + γdestination,t + εj,m,t, (1)
where the dependent variable ln(seatsj,m,t) is the log of total seats made
available by airline j in (airport-pair) market m in month t. We estimate this
model using a within-group estimator.
The main variable of interest is Capacity-Disciplinem,t, which is the
dummy variable introduced in Section 3.2 that is equal to 1 if there are at
least two legacy carriers in market m and they all communicate about ca-
pacity discipline in their previous quarter’s earnings calls, and 0 otherwise.
Talk-Eligiblem,t is equal to 1 if there are at least two legacy carriers in mar-
ket m in period t, and 0 otherwise. This captures the fact that markets with
two or more legacy carriers may be systematically different from those where
legacy carriers do not compete head-to-head. Monopolym,t is equal to 1 if
only one airline serves market m in month t, and captures the possibility that
monopoly markets may be inherently different from non-monopoly markets.
In some cases, earnings call reports are missing (for reasons that are unknown
to us), and we account for that by including MissingReportm,t equal to 1 if
report for any carrier serving market m in period t is missing.
21

Table 3: Identification of The Effect of Capacity Discipline
market market structure DL reports communicating Cap-Dis Report Monopoly Talk-Eligible parameters 1 {DL} no n/a 0 1 1 0 β3 + β2
2 {DL} yes n/a 0 0 1 0 β2
3 {DL, UA} yes {DL, UA} 1 0 0 1 β0 + β1
4 {DL, UA, US} no {US} or {UA} or {US, UA} 0 1 0 1 β3 + β1
5 {DL, UA, US} yes {US, UA} 0 0 0 1 β1
6 {DL, UA, US} yes {DL, UA, US} 1 0 0 1 β0 + β1
7 {DL, UA, US, F9} yes {DL, UA, US} 1 0 0 1 β0 + β1
8 {DL, F9} yes n/a 0 0 0 0 -
Notes. An example to show identification from the perspective of Delta, i.e., when j = DL, and here UA and US are legacy carriers while F9 is an LCC.
The idea behind capacity discipline is that airlines restricted seats even
when there was adequate demand, which itself can vary across both markets
and time. To control for these unseen factors, we include airline-market and
airline-year-quarter fixed effects. These fixed effects allow airlines to provide
different levels of capacity across different markets and time. Lastly, to control
for time-dependent changes in demand we use origin- and destination-airport
specific time trends, γorigin,t and γdestination,t. These controls are important in
isolating the direct effect of communication on available seats.
Next, we explain the identification strategy behind our estimation. To
highlight the key sources of variation in the data, we fix an airline—say, Delta
(i.e., j = DL)—and consider different potential market structures and com-
munication scenarios in Table 3. In markets m = 1, 2, only DL operates,
so the concept of communication is moot and Capacity-Discipline1,t =
Capacity-Discipline2,t = 0. Then we can use variation in whether a re-
port is available (for m = 2) or not (for m = 1) to identify β2 and β3, as shown
in the last column. Market m = 3 is served by both DL and UA and both use
“capacity discipline” in the previous quarter, so Capacity-Discipline3,t = 1,
which identifies β0 + β1. The same identification argument applies to identify-
ing β0 + β1 in markets m = 6, 7 where every airline in the market talks and a
report for DL is available, even when an LCC is present (m = 7). In contrast,
for market m = 4, even when both US and UA use cheap talk, we identify
β1 + β3 because DL did not have a transcript. Lastly, we identify the fixed-
effects using the deviation from the mean. Therefore, one of the key sources
of identification is the variation in Capacity-Discipline across markets and
22
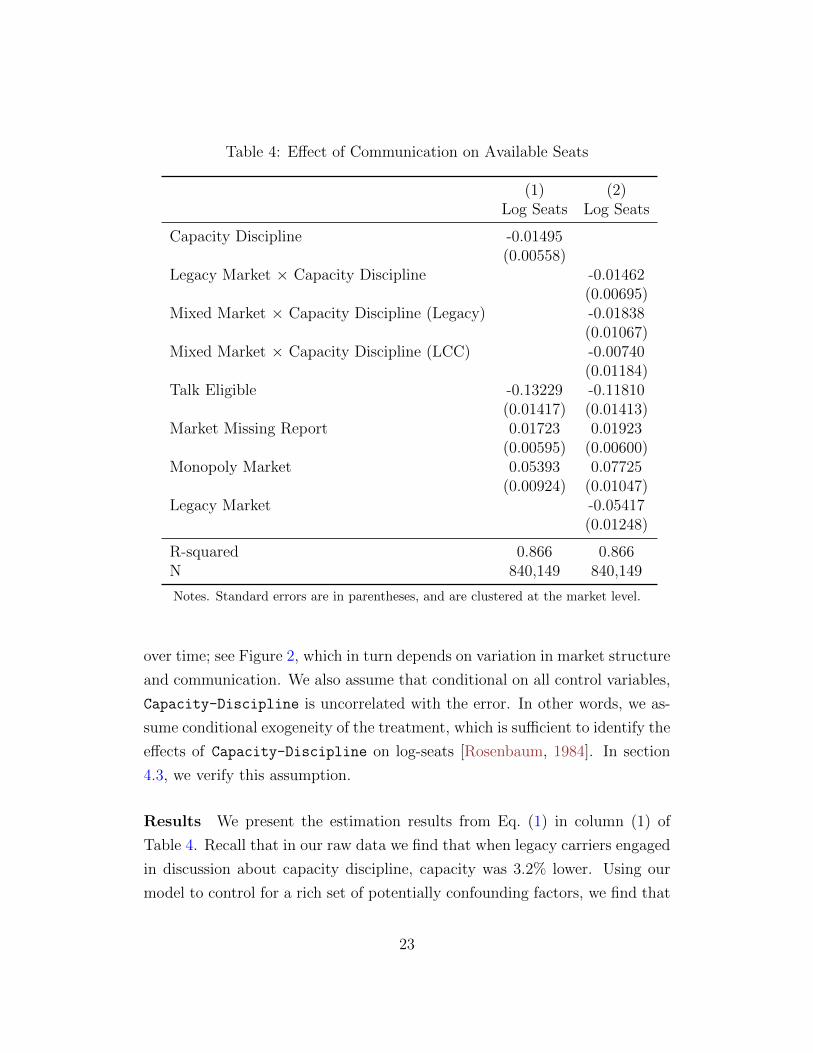
Table 4: Effect of Communication on Available Seats
(1) (2) Log Seats Log Seats
Capacity Discipline -0.01495 (0.00558)
Legacy Market × Capacity Discipline -0.01462 (0.00695)
Mixed Market × Capacity Discipline (Legacy) -0.01838 (0.01067)
Mixed Market × Capacity Discipline (LCC) -0.00740 (0.01184)
Talk Eligible -0.13229 -0.11810 (0.01417) (0.01413)
Market Missing Report 0.01723 0.01923 (0.00595) (0.00600)
Monopoly Market 0.05393 0.07725 (0.00924) (0.01047)
Legacy Market -0.05417 (0.01248)
R-squared 0.866 0.866 N 840,149 840,149
Notes. Standard errors are in parentheses, and are clustered at the market level.
over time; see Figure 2, which in turn depends on variation in market structure
and communication. We also assume that conditional on all control variables,
Capacity-Discipline is uncorrelated with the error. In other words, we as-
sume conditional exogeneity of the treatment, which is sufficient to identify the
effects of Capacity-Discipline on log-seats [Rosenbaum, 1984]. In section
4.3, we verify this assumption.
Results We present the estimation results from Eq. (1) in column (1) of
Table 4. Recall that in our raw data we find that when legacy carriers engaged
in discussion about capacity discipline, capacity was 3.2% lower. Using our
model to control for a rich set of potentially confounding factors, we find that
23

when all of the legacy carriers in a talk-eligible market communicate with
each other about capacity discipline, they subsequently decrease the number
of seats offered by 1.45%.18 This effect is an average effect across all markets,
time, and types of carriers. The standard errors we report are clustered at
the market level, and, as can be seen, the decline in capacity is statistically
significant at the 1% level.
To get a sense of whether this effect is economically meaningful, it is helpful
to compare it to the average percentage change in capacity for legacy airlines
in our sample. The average percentage change is 3.78%, while the use of the
phrase “capacity discipline” results in a 1.45% percentage drop in capacity.
This means whenever legacy airlines communicate, their capacity drops by
38% of the average change in capacity, which is a significant effect.
Interestingly, we find that if a market is Talk-Eligible—i.e., there are
two or more legacy carriers serving the market—there is a 12.55% decrease
in number of seats offered on average, regardless of whether simultaneous
communication occurred. This finding shows that it is important to control for
market heterogeneity, and the estimate shows that in some markets, the offered
capacity can be lower for reasons that are not associated with communication.
In summary, we can reject our null hypothesis that communication regarding
capacity discipline does not affect carriers’ capacity decisions. That is, we find
evidence in support of the claim that carriers are using this communication to
coordinate capacity decisions.
The features of the data that (i) the effect is negative only for the legacy
markets and (ii) legacy carriers communicate about capacity discipline more
frequently than LCCs (see Table 1) suggest that the average effect we find
among all airlines is driven primarily by the legacy carriers. To determine
that, we extend our basic model and allow the effect of public communication
to vary by carrier type and by whether the market is a legacy-only or a mixed
market, i.e., made up of just legacy carriers or both legacy and LLC carriers.
18If the estimate of the coefficient of a dummy variable in a semilogarithmic regression is β, then the percentage impact of the dummy variable on the outcome variable equal to 100 × (exp(β) − 1)%.
24
With this in mind, we estimate the following model:
legacy, LM ln(seatsj,m,t) =β × Capacity-Discipline × LMm,t0 m,t
legacy, MM + β0 × Capacity-Disciplinem,t × MMm,t
+ βLCC, MM 0 × Capacity-Disciplinem,t × MMm,t
+ β1 × Talk-Eligiblem,t + β2 × Monopolyj,m,t
+ β3 × MissingReportj,m,t
+ µj,m + µj,yr,q + γorigin,t + γdestination,t + εj,m,t.
where LM and MM are indicators for whether market m in month t is a legacy
or mixed market. The identifying assumption for (1) applies verbatim here.
We present the results in Table 4, column (2). The three variables of
importance are in the second, third, and fourth rows. As we can see, in
markets that are served by only legacy carriers, communication leads to a
1.45% decrease in the number of seats offered. This result is statistically
significant at 1% and is also similar in magnitude to the estimates in column
(1). This result also suggests that the average effect we found earlier must be
driven entirely by the effect among legacy carriers. To assess that hypothesis,
consider the third and the fourth rows, where we show that, indeed, the effect
of communication among legacy carriers in markets served by both types of
carriers is a 1.82% decrease in seats offered, whereas we find no evidence of a
significant effect on seats offered by LCCs.
4.2 Financial Transparency or Coordination
We have shown that when all legacy carriers in a market discuss capacity
discipline, they lower capacity. Of course, it could be that airlines are not
coordinating these reductions, but, instead, are simply announcing their uni-
lateral intentions to reduce capacity in response to demand forecasts, or for
other reasons. If this is the case, it follows that the number of seats offered
by an airline would also fall by approximately 1.45% when the airline is com-
municating, but its competitors are not. That is not what we find. We find
25

that when a legacy carrier discusses capacity discipline, but its legacy com-
petitors do not, the airline does not reduce capacity. Additionally, carriers do
not reduce capacity in monopoly markets, where we would also expect to find
capacity reductions. Finally, we find no evidence of capacity reductions when
all but one of the legacy carriers serving a market discuss capacity discipline.
To investigate whether airlines decrease capacity when they are the only
one discussing capacity discipline, we estimate the following variation of Eq. (1):
ln(seatsj,m,t) =β0 × Only-j-Talksj,m,t + β1 × Talk-Eligiblem,t
+ β2 × Monopoly + β3 × MissingReport (2)m,t m,t
+ µj,m + µj,yr,q + γorigin,t + γdestination,t + εj,m,t,
where our variable of interest is Only-j-Talksj,m,t and is defined as
Only-j-talksm,t
1 Carrier-Capacity-Disciplinej,t = 1 Legacy∧ Carrier-Capacity-Disciplinek,t = 0 |J | ≥ 2m,t
Legacy∀k 6= j ∈ Jm,t
⎧
Legacy0 |J | < 2m,t
= �⎪⎪⎪⎪⎪⎪⎨ ⎪⎪⎪⎪⎪⎪⎩
That is, Only-j-Talksj,m,t indicates whether carrier j is the only legacy car-
rier in market m that discussed capacity discipline, conditional on there being
at two or more legacy carriers, i.e., when Talk-Eligiblem,t = 1. The param-
eter β0 will show the extent to which a legacy carrier that discusses capacity
discipline when none of its market-level competitors discussed capacity disci-
pline changes capacity. If discussion of capacity discipline is simply meant to
inform investors about future strategic behavior, then β0 should be negative,
and, likely, close to -0.01495, the estimate of β0 in (1) as shown in Table 4.
We present the estimation results from Eq. (2) in Table 5. As we can
see, we find no evidence of a decline in capacity associated with unilateral
discussion of capacity discipline. In fact, we find the opposite effect. When
airlines communicate unilaterally, they increase offered seats.
26

Table 5: Effect of Unilateral Communication on Available Seats
(1) Log Seats
(2) Log Seats
Only j Talks
Talk Eligible
Missing Market Report
Monopoly Market
0.05511 (0.00681)
-0.00150 (0.00549) 0.09590 (0.00948)
0.02933 (0.00570) -0.05785 (0.00822) -0.02111 (0.00647) 0.08349 (0.00925)
R-squared N
0.866 840,149
0.866 840,149
Notes. Standard errors are in parentheses, and are clustered at the market level.
A second approach to addressing this concern is to look at capacity deci-
sions in monopoly markets. If carriers are using discussion of capacity disci-
pline simply to inform investors about plans to reduce capacity, then we should
expect to see reductions in monopoly markets following those discussions. We
find no evidence of capacity reductions in monopoly markets following a car-
rier’s discussion of capacity discipline.
In column (1) of Table 6, we show the results of estimating our pri-
mary model (1), but using the treatment Monopoly-Capacity-Disciplinem,t,
which is equal to 1 when a carrier in a monopoly market discussed capacity dis-
cipline, and 0 otherwise. In column (2) of Table 6, we present the results when
we limit our sample to include only monopoly markets. In both cases, we fail
to find evidence that carriers reduce capacity in monopoly markets after dis-
cussion capacity discipline. In fact, we again find evidence that they actually
increase capacity, by between 0.84% to 1.97%, depending on the specification,
following such discussions.
Finally, we consider whether carriers reduce capacity in cases where all but
one of the legacy carriers serving the market reduce capacity. To do so, we
27
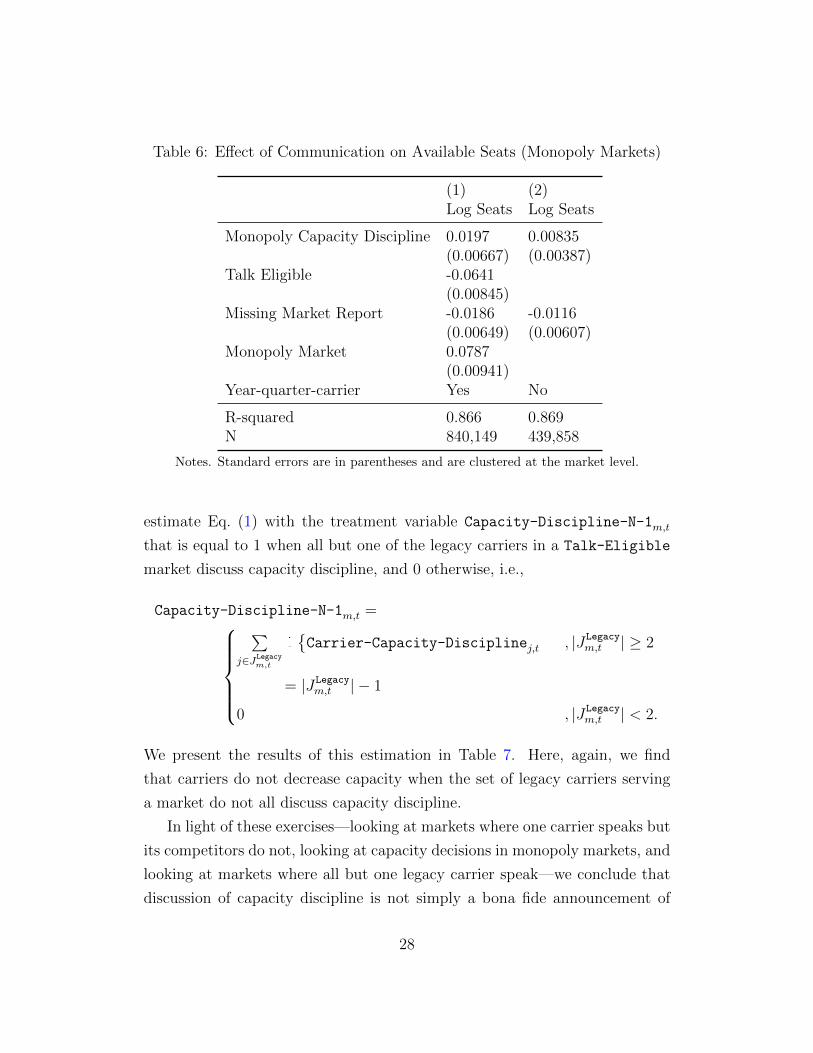
Table 6: Effect of Communication on Available Seats (Monopoly Markets)
(1) Log Seats
(2) Log Seats
Monopoly Capacity Discipline
Talk Eligible
Missing Market Report
Monopoly Market
Year-quarter-carrier
0.0197 (0.00667) -0.0641 (0.00845) -0.0186 (0.00649) 0.0787 (0.00941) Yes
0.00835 (0.00387)
-0.0116 (0.00607)
No
R-squared N
0.866 840,149
0.869 439,858
Notes. Standard errors are in parentheses and are clustered at the market level.
estimate Eq. (1) with the treatment variable Capacity-Discipline-N-1m,t
that is equal to 1 when all but one of the legacy carriers in a Talk-Eligible
market discuss capacity discipline, and 0 otherwise, i.e.,
Capacity-Discipline-N-1m,t = �P⎧ 1⎪⎪⎪⎪⎨ ⎪⎪⎪⎪⎩
Legacyj∈Jm,t
Legacy= |J | − 1m,t
LegacyCarrier-Capacity-Disciplinej,t , |J | ≥ 2m,t
Legacy0 , |J | < 2.m,t
We present the results of this estimation in Table 7. Here, again, we find
that carriers do not decrease capacity when the set of legacy carriers serving
a market do not all discuss capacity discipline.
In light of these exercises—looking at markets where one carrier speaks but
its competitors do not, looking at capacity decisions in monopoly markets, and
looking at markets where all but one legacy carrier speak—we conclude that
discussion of capacity discipline is not simply a bona fide announcement of
28
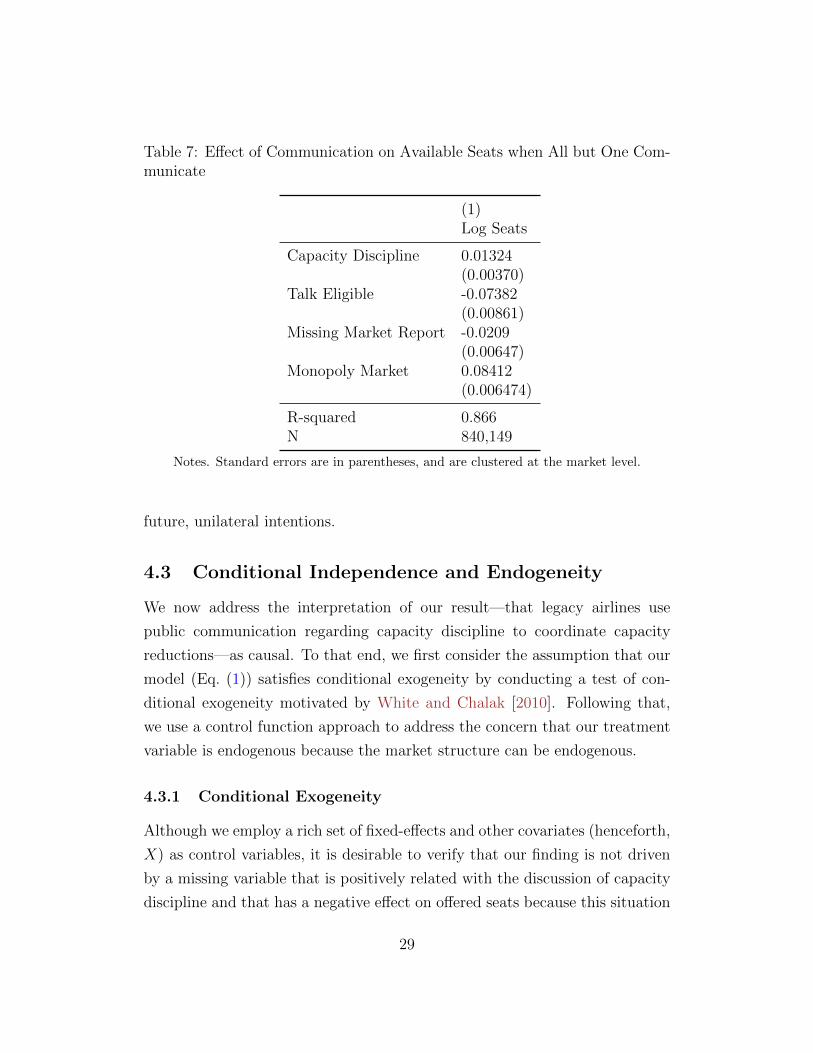
Table 7: Effect of Communication on Available Seats when All but One Com-municate
(1) Log Seats
Capacity Discipline
Talk Eligible
Missing Market Report
Monopoly Market
0.01324 (0.00370) -0.07382 (0.00861) -0.0209 (0.00647) 0.08412 (0.006474)
R-squared N
0.866 840,149
Notes. Standard errors are in parentheses, and are clustered at the market level.
future, unilateral intentions.
4.3 Conditional Independence and Endogeneity
We now address the interpretation of our result—that legacy airlines use
public communication regarding capacity discipline to coordinate capacity
reductions—as causal. To that end, we first consider the assumption that our
model (Eq. (1)) satisfies conditional exogeneity by conducting a test of con-
ditional exogeneity motivated by White and Chalak [2010]. Following that,
we use a control function approach to address the concern that our treatment
variable is endogenous because the market structure can be endogenous.
4.3.1 Conditional Exogeneity
Although we employ a rich set of fixed-effects and other covariates (henceforth,
X) as control variables, it is desirable to verify that our finding is not driven
by a missing variable that is positively related with the discussion of capacity
discipline and that has a negative effect on offered seats because this situation
29

would then lead us to overstate the (negative) effect of communication on ca-
pacity. In other words, we want to verify that our data satisfies conditional
exogeneity—i.e., the treatment Capacity-Disciplinem,t is uncorrelated with
the error conditional on X—because conditional exogeneity ensures uncon-
foundedness, which is sufficient to identify the causal effect of communication
on capacity. This is a feasible approach for addressing concerns about endo-
geneity, as finding an instrument for the communication itself is difficult be-
cause any variable affecting communication will also directly affect the choice
of capacity.
To address the conditional independence, we conduct a test motivated by
White and Chalak [2010]. The test is useful because rejecting unconfounded-
ness implies a rejection of conditional exogeneity. To elaborate further, sup-
pose we have a binary random variable Zm,t ∈ {0, 1} that is a function of our
covariates X and is positively correlated with Capacity-Disciplinem,t. Let
ρ(·) be a structural equation such that Z = ρ(Capacity-Discipline, X, ν),
where ν is an unobserved error. If such a Z exists, and if it is negatively
correlated with the capacity choice, then that would mean our estimates
are not causal effect of communication. To test whether our model sat-
isfies conditional exogeneity, i.e., (Capacity-Discipline ⊥ ε|X), we first
note that the statement if (Capacity-Discipline ⊥ ε|X) then (ln(seats) ⊥
Z|(Capacity-Discipline, X)) is true, which implies that if (ln(seats) 6⊥
Z|(Capacity-Discipline, X)) then (Capacity-Discipline 6⊥ ε|X) is also
true. So, following White and Chalak [2010] we test the hypothesis that
ln(seats) ⊥ Z|(Capacity-Discipline, X).
We have to carefully determine a random variable Z that is positively
related to Capacity-Discipline but has a negative effect on log seats. In
our context of communication, we proceed as follows. We identify tokens or
keywords that (i) are contextually “close” to a discussion of capacity discipline
and (ii) occur approximately as frequently as capacity discipline.19 Then for
each token, we define a dummy variable Zm,t equal to 1 only if all legacy
carriers in market m use it in period t and include it as an additional regressor
19We discuss these conditions in more detail in Appendix C.
30

Table 8: Estimates for Conditional Exogeneity
Z slow weakness domestically internationally stable pace
Coefficients of Z -0.00514 0.01520 0.01914 0.00525 0.00937 0.00264 (0.00479) (0.00546) (0.00511) (0.00443) (0.00751) (0.00578)
Capacity-Discipline -0.01417 -0.01539 -0.01461 -0.01518 -0.01551 -0.01525 (0.00536) (0.00554) (0.00558) (0.00559) (0.00562) (0.00554)
Notes. Estimation results from including new tokens as additional regressors in (1). The table shows the coefficient estimates for each token and for Capacity-Discipline. Standard errors are in parentheses and are clustered at the market level.
in (1). If the estimated coefficient for each Zm,t is not statistically different
from zero then our model satisfies conditional exogeneity.
We discuss in detail how we identify these tokens in Appendix C. In short,
we first identify three tokens that are essential to the concept of capacity
discipline: “capacity discipline,” “demand,” and “gdp.” We then identify
tokens that are contextually close to these three tokens. To do so, we use
the word2vec model from the computational linguistics literature [Mikolov
et al., 2013]. word2vec allows us to map the vocabulary from the earnings
calls to a vector space, where we can use the cosine similarity metric as a
measure of the contextual similarity between words.20 That is, the higher
the cosine similarity between two tokens, the more likely that one appears in
close proximity conditional on the other occurring. Importantly, we train the
word2vec model directly using our transcript data, so the derived relationships
between words are specific to the context of the airlines’ earnings calls, as
opposed to a more general context. For example, if airline executives use the
word “discipline” in a contextually different manner than it is typically used
in more general conversation, our method accounts for that.
In Table 8, we present all the tokens that satisfy the above two criteria. For
each token, we define Zm,t as we did for Capacity-Disciplinem,t and use it as
an additional regressor in Eq. (1). The estimated coefficients for the tokens are
in the first row, with the estimated coefficient for Capacity-Disciplinem,t in
20Cosine similarity is the cosine of the angle between two tokens’ vectors. Thus when vectors are similar, their cosine similarity is close to one, and when they are perpendicular the value is zero.
31

the second row. As can be seen, only one token, “slow,” has a slight negative
effect on log seats but is also not statistically significant at the 10% level, while
the rest either do not show a statistically significant effect or have a positive
effect. The cases that find a positive, non-zero relationship between Zm,t and
capacity show that, if anything, our results understate the true effect of the
relationship between the discussion of capacity discipline and capacity. What
is also reassuring is the fact that the estimates for Capacity-Discipline are
stable, negative, and statistically significant, with effects that are very close
to the estimates from our primary model.
4.3.2 Control Function Estimate
In this section, we use a control function approach to estimate our model.
Our treatment, Capacity-Disciplinem,t, can be expressed as the product
of two variables: (i) Talk-Eligiblem,t that reflects the market structure of
market m in month t, and (ii) whether all of the legacy carriers in m dis-
cussed capacity discipline in their most recent earnings calls. By construction,
Talk-Eligiblem,t is a function of the market structure (the set of airlines who
serve market m in t). An airline’s decision to serve a market will depend on the
cost of serving the market, which is unobserved and might not be captured by
the fixed effects. So there is the possibility that Talk-Eligible is endogenous,
which in turn means Capacity-Discipline could also be endogenous. And
because Talk-Eligible , and hence Capacity-Discipline , is negatively m,t m,t
correlated with the cost of serving m in period t, our fixed-effect estimate in
Eq. (1) will exaggerate the negative effect of communication on capacity.
To address this concern we use distances of an airport to carriers’ nearest
hubs as instruments for Talk-Eligible and, in turn, Capacity-Discipline. 21
For each airline, we compute the distance (defined below) of an airport to the
21We thank Mar Reguant for suggesting this approach, of using one of the two variables as an instrument for the product, to address endogeneity. It is similar to the approach used in Fabra and Reguant [2014]. One additional remark: our approach also controls for the (unlikely) event that all of the legacy carriers discussed capacity is correlated with the market-specific unobserved cost of serving a market, as long as that event is not correlated with the instrumental variable.
32

nearest hub for that airline.22 The distance of the market’s endpoints to the
closest hub is here interpreted as a proxy for the fixed cost that a carrier has
to face to serve that market [Ciliberto and Tamer, 2009]. This is the direct
effect of the distance on an airline’s decision to serve a market. Distances
to the hubs also have indirect effect on the market structure through compe-
tition: An airline’s probability of serving a market should increase with its
competitors’ distances.
Overall, geographical distances of the endpoint airports from the airlines’
hubs are correlated with the market structure. As far as the exclusion restric-
tion is concerned, the fact that we are measuring the impact of communication
on market-level capacity choice, and not on the aggregate capacity of an air-
line, suggests the distance does not directly affect the capacity choice.
To implement this procedure, we take the sum of the air-distances between
each endpoint airport in market m and carrier j’s nearest hub for each airline
j serving m, which we denote by Dj,m,t. We denote an airport for a carrier
as a hub if the airport has a minimum level of connectedness in the network
of markets served by an airline.23 Then, for every period t, we determine the
set Am,t of all airlines operating in any market and use a multinomial logit
model to estimate the probability Pj,m,t that an airline j will serve a market
m at time t as a function of all distances {Dj,m,t : j = 1, . . . , N} of market m
to the airlines’ nearest hubs.24 . Finally, using these predicted probabilities as
instruments, we employ a control function approach to estimate the effect of
communication on capacity.
In particular, once we have estimated the probabilities Pj,m,t, we use a two-
step procedure that includes the control function. In the first stage, we regress
Talk-Eligible on {Pj,m,t : j serves market m in t} and the same covariates m,t
as used in Eq. (1), and recover the residuals rj,m,t. Then, in the second stage,
we re-estimate the parameters in Eq. (1) with rj,m,t as an additional covariate.
22See Appendix B for a discussion of how we determine the set of hubs for each airline. 23The concept of connectedness is borrowed from the theoretical literature on networks.
See Appendix B for the formal definition. 24This corresponds to the first stage in the methodology proposed by [Ciliberto and
Tamer, 2009]
33

Table 9: Control Function Estimates of the Effect of Communication on Avail-able Seats
(1) Log Seats
Capacity Discipline
Talk Eligible
Missing Market Report
Monopoly Market
Residual
-0.01144 (0.00658) -0.01098 (0.07145) 0.01423 (0.01707) 0.06690 (0.03014) -0.02552 (0.05393)
R-squared N
0.864 598,110
Notes. Bootstrapped standard errors, clustered at the market level, are in parentheses.
We present the second stage results in Table 9, and we can see that when
legacy carriers communicate they reduce their capacity by 1.13%. This result
is consistent with our hypothesis that when market structure is endogenous
we might exaggerate the effect of communication. Nonetheless, we still find
strong evidence that airlines use earnings calls to coordinate in reducing their
capacities. In summary, we believe the effect of communication on capacity
falls between our estimates of 1.13% and 1.45%.
5 Conclusion
In this paper, we investigate whether legacy airlines use public communica-
tion to sustain collusion in offering fewer seats in a market. We maintain that
airlines communicated with each other whenever all legacy carriers serving a
market talked about capacity discipline in their earnings calls. Using methods
from natural language. processing, we convert the text data into numeric data
34

to measure communication among legacy carriers. We estimate that commu-
nication leads to a significant drop in seats offered, which ranges between an
average of −1.13% (control function estimate) to −1.45% (OLS) across airlines
and markets.
We confirm that our estimated reduction in capacity after carriers discuss
capacity discipline is indeed a result of coordination, and not just evidence
that earnings calls are serving their intended purpose of making markets more
transparent. We also test and find that our model is consistent with condi-
tional exogeneity, and we use a control function approach to confirm that our
estimates are not affected by endogenous market structure. Thus, we conclude
that public communication help legacy airlines collude.
Our finding is relevant for the current policy debate about the correct
response to increasing information about firms in social media and increas-
ing market concentration across industries. Thus, in the airline industry, the
SEC’s transparency regulations are at odds with antitrust laws—a fact that
policy makers must be cognizant of. While the value of public quarterly earn-
ings calls remains debatable, the public disclosure of information through these
calls is generally viewed as beneficial for investors. At the same time, the com-
petitive effects of this increased transparency are theoretically ambiguous and
under-studied. In this paper we contribute to this literature, and we hope that
this paper will spur further research.
While it is known that, in some cases, communication helps in equilib-
rium selection, its broader implications for prices and welfare are unknown.
Answers to these questions will help design laws that are related to public
communication and antitrust. That, however, requires estimating structural
model of dynamic oligopoly with communication, which is left to future work.
35

References
Abreu, Dilip, David Pearce, and Einno Stacchetti. 1986. “Optimal
Cartel Equilibria with Imperfect Monitoring.” Journal of Economic Theory,
39: 251–269.
Awaya, Yu, and Vijay Krishna. 2016. “On Communication and Collu-
sion.” American Economic Review, 106(2): 285–315.
Awaya, Yu, and Vijay Krishna. 2017. “Communication and Cooperation
in Repeated Games.” Mimeo.
Azar, Jose, Martin C. Schmalz, and Isabel Tecu. 2018. “Anticompeti-
tive Effects of Common Ownership.” Journal of Finance, 73(4): 1513–1565.
Borenstein, Severin. 2004. “Rapid Price Communication and Coordina-
tion: The Airline Tariff Publishing Case.” In The Antitrust Revolution: Eco-
nomics, Competition and Policy. . 4 ed., , ed. John Kwoka Jr. and Lawrence
White, 223–51. Oxford University Press.
Byrne, David, and Nicolas de Roos. Forthcoming. “Learning to coordi-
nate: A study in retail gasoline.” American Economic Review.
Ciliberto, Federico, and Elie Tamer. 2009. “Market Structure and Mul-
tiple Equilibria in Airline Markets.” Econometrica, 77(6): 1791–1828.
Fabra, Natalia, and Mar Reguant. 2014. “Pass-Through of Emissions
Costs in Electricity Markets.” American Economic Review, 104(9): 2872–
2899.
Feldman, Robin, and Evan Frondorf. 2017. Drug Wars: How Big Pharma
Raises Prices and Keeps Generics off the Market. Cambridge University
Press.
Gentzkow, Matthew, and Jessie Shapiro. 2014. “What Drives Media
Slant? Evidence from U.S. Daily Newspapers.” Econometrica, 62(1): 35–
71.
36

Gentzkow, Matthew, Bryan T. Kelly, and Matt Taddy. 2017. “Text as
Data.” Journal of Economic Literature, forthcoming.
Glusac, Elaine. 2017. “In the Air That Uneasy Feeling of Us vs. Them.” The
New York Times.
Goldberg, Y., and O. Levy. 2014. “word2vec Explained: deriving Mikolov
et al.’s negative-sampling word-embedding method.” ArXiv e-prints.
Green, Edward J., and Robert H. Porter. 1984. “Noncooperative Col-
lusion under Imperfect Price Information.” Econometrica, 52(1): 87–100.
Green, Edward J., Robert C. Marshall, and Leslie M. Marx. 2014.
“Tacit Collusion in Oligopoly.” In The Oxford Handbook of International
Antitrust Economics. , ed. Roger D. Blaier and D. Daniel Sokol, Chapter
19. Oxford University Press.
Harrington, Joseph E. 2006. How do Cartles Operate? Foundations and
Trends in Microeconomics, Now Publishers Inc.
Hoberg, Gerard, and G. Philips. 2016. “Text-Based Network Industries
and Endogenous Product Differentiation.” Journal of Political Economy,
124(5): 1423–1465.
Kaplow, Louis. 2013. Competition Policy and Price Fixing. Princeton Uni-
versity Press.
Leyden, Benjamin T. 2018. “There’s an App (Update) for That: Under-
standing Product Updating Under Digitization.” Working Paper.
Mailath, George J., and Larry Samuelson. 2006. Repeated Games and
Reputations: Long-Run Relationships. Oxford University Press.
Marshall, Robert C., and Leslie M. Marx. 2014. The Economics of
Collusion: Cartels and Bidding Rings. MIT Press.
Mikolov, T., K. Chen, G. Corrado, and J. Dean. 2013. “Efficient Esti-
mation of Word Representations in Vector Space.” ArXiv e-prints.
37

Miller, Amalia R. 2010. “Did the Airline Tariff Publishing Case Reduce
Collusion?” The Journal of Law and Economics, 53(3): 569–586.
OECD. 2011. “Information Exchanges Between Competitors under Compe-
tition Law.” https://www.oecd.org/competition/cartels/48379006.pdf.
Porter, Robert H. 1983. “A Study of Cartel Stability: The Joint Executive
Committee, 1880-1886.” The Bell Journal of Economics, 14(2): 301–314.
Reh rek, Radim, and Petr Sojka. 2010. “Software Framework for Topic uˇ
Modelling with Large Corpora.” 45–50. ELRA.
Rosenbaum, P. 1984. “From Association to Causation in Observational Stud-
ies: The Tole of Tests of Strongly Ignorable Treatment Assignment.” Journal
of American Statistical Association, 79: 41–48.
Rosenfield, Andrew M., Dennis W. Carlton, and Robert H. Gertner.
1997. “Communication Among Competitirs: Game Theory and Antitrust
Application of Game Theory to Antritrust.” George Mason Law Review,
5(3): 423–440.
Sharkey, Joe. 2012. “Expect Fewer Seats, Even for Overseas Flights.” The
New York Times.
Spector, David. 2018. “Cheap Talk, Monitoring and Collusion.” Mimeo.
Stigler, G. 1964. “A Theory of Oligopoly.” Journal of Political Economy,
74: 44–61.
Viscusi, W. Kip, Joseph E. Harrington, and John M. Vernon, ed.
2005. Economics of Regulation and Antitrust. . 4 ed., MIT Press.
White, Halbert, and Karim Chalak. 2010. “Testing a Conditional Form
of Exogeneity.” Economic Letters, 109: 88–90.
38

Appendix A Further Analysis
Here, we explore the role of market size and whether the market is business
traveler heavy (a proxy for low price elasticity) on the extent of collusion.
Lastly, we also explore the effect on our estimates of using city-pairs as opposed
to airport-pairs, as the definition of a market.
Market Size
In this section we explore whether airlines’ reductions in capacity differ by
market size. Carriers’ ability to collude can vary by market, depending on
the ability of legacy airlines to monitor each other and on the contestability of
their markets. If larger markets (defined below) have greater demand volatility
than the smaller markets, then, ceteris paribus, it will be easier to sustain
collusion in the smaller markets. In addition, larger markets can accommodate
more firms [Bresnahan and Reiss, 1991], and, given that our estimates suggest
that this is not an all-inclusive cartel, legacy airlines face stiffer competition
from LCCs, and therefore they might not reduce capacity as much as they
would have in the absence of LCCs. We investigate if we find evidence of this
hypothesis in our data.
We follow Berry, Carnall and Spiller [2006] and define market size as the
geometric mean of the Core-based statistical area population of the end-point
cities. The annual population data is from the U.S. Census Bureau. We define
markets with a population that is larger than the 75th percentile of the market
population distribution as large, markets with a population in the range of
(25th , 75th] percentiles of the population as medium, and those below the 25th
percentile as small markets.25
Table A.1 shows that the average number of seats a carrier offers, the
likelihood of the treatment Capacity-Discipline = 1, and the likelihood
of Talk Eligible = 1 are all increasing with the size of a market. Perhaps
unsurprisingly, the likelihood that a market is a monopoly market is decreasing
25When classifying markets as small, medium, or large, we use the average market pop-ulation over our sample period, so that a market’s size classification is fixed across time.
39
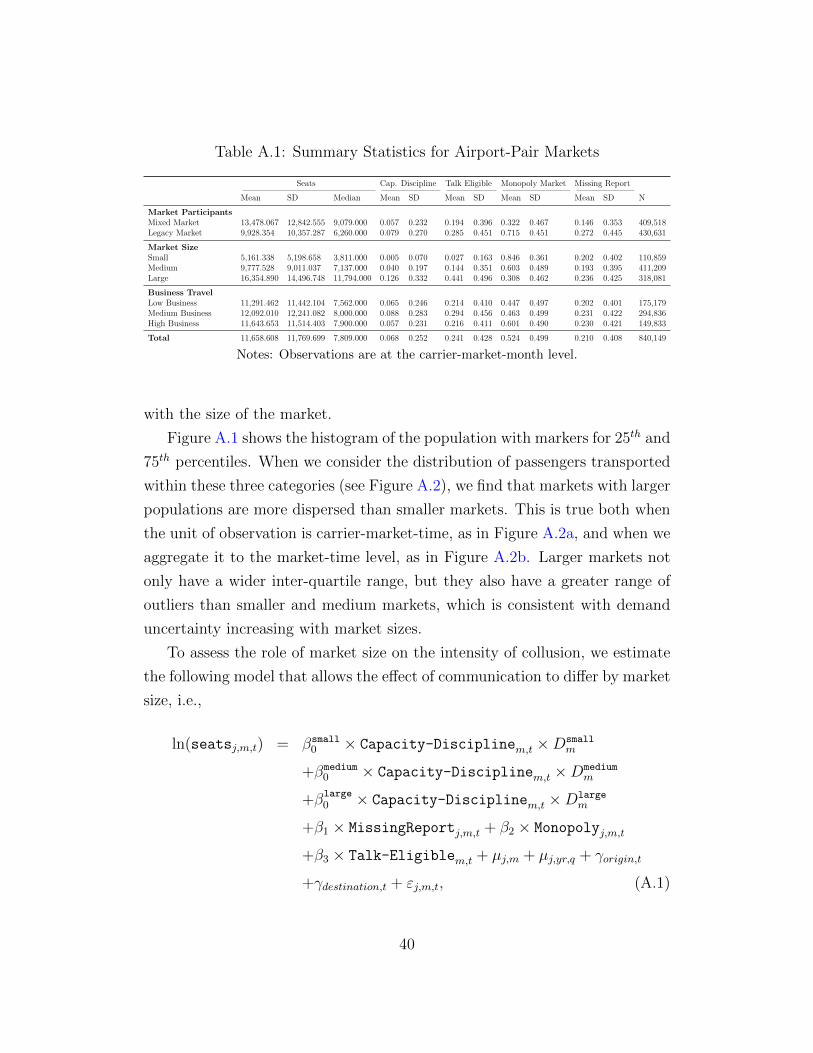
Table A.1: Summary Statistics for Airport-Pair Markets
Seats Cap. Discipline Talk Eligible Monopoly Market Missing Report
Mean SD Median Mean SD Mean SD Mean SD Mean SD N
Market Participants Mixed Market 13,478.067 12,842.555 9,079.000 0.057 0.232 0.194 0.396 0.322 0.467 0.146 0.353 409,518 Legacy Market 9,928.354 10,357.287 6,260.000 0.079 0.270 0.285 0.451 0.715 0.451 0.272 0.445 430,631
Market Size Small 5,161.338 5,198.658 3,811.000 0.005 0.070 0.027 0.163 0.846 0.361 0.202 0.402 110,859 Medium 9,777.528 9,011.037 7,137.000 0.040 0.197 0.144 0.351 0.603 0.489 0.193 0.395 411,209 Large 16,354.890 14,496.748 11,794.000 0.126 0.332 0.441 0.496 0.308 0.462 0.236 0.425 318,081
Business Travel Low Business 11,291.462 11,442.104 7,562.000 0.065 0.246 0.214 0.410 0.447 0.497 0.202 0.401 175,179 Medium Business 12,092.010 12,241.082 8,000.000 0.088 0.283 0.294 0.456 0.463 0.499 0.231 0.422 294,836 High Business 11,643.653 11,514.403 7,900.000 0.057 0.231 0.216 0.411 0.601 0.490 0.230 0.421 149,833
Total 11,658.608 11,769.699 7,809.000 0.068 0.252 0.241 0.428 0.524 0.499 0.210 0.408 840,149
Notes: Observations are at the carrier-market-month level.
with the size of the market.
Figure A.1 shows the histogram of the population with markers for 25th and
75th percentiles. When we consider the distribution of passengers transported
within these three categories (see Figure A.2), we find that markets with larger
populations are more dispersed than smaller markets. This is true both when
the unit of observation is carrier-market-time, as in Figure A.2a, and when we
aggregate it to the market-time level, as in Figure A.2b. Larger markets not
only have a wider inter-quartile range, but they also have a greater range of
outliers than smaller and medium markets, which is consistent with demand
uncertainty increasing with market sizes.
To assess the role of market size on the intensity of collusion, we estimate
the following model that allows the effect of communication to differ by market
size, i.e.,
βsmall × Dsmall = × Capacity-Disciplineln(seatsj,m,t) 0 m,t m
+βmedium × Dmedium× Capacity-Discipline0 m,t m
large × Dlarge+β × Capacity-Discipline0 m,t m
+β1 × MissingReportj,m,t + β2 × Monopolyj,m,t
+β3 × Talk-Eligiblem,t + µj,m + µj,yr,q + γorigin,t
+γdestination,t + εj,m,t, (A.1)
40

Figure A.1: Histogram of Market Sizes
01.
0e-0
72.
0e-0
73.
0e-0
7D
ensi
ty
0 5000000 1.00e+07 1.50e+07Population
25th Percentile 75th Percentile
Airport-Pair
Notes. Market size is defined as the geometric mean of the MSA population of the end-point cities. Source for population data is the U.S. Census Bureau.
Figure A.2: Box plot of Passengers by Market Size
(a) Carrier-Market-Time (b) Market-Time
Notes. These are the box-plots with whiskers of sales of tickets by market sizes. On the x-axis are the market sizes, small, medium, and large, and on the y-axis is the total number of passengers transported in that market. The unit of observations in subfigure (a) is carrier-market-time, whereas the unit of observation in subfigure (b) is market-time.
41

Table A.2: Fixed Effects Estimates of Communication on Available Seats Sep-arated by Market Sizes
(1) (2) Log Seats Log Seats
Small Population × Capacity Discipline -0.04302 (0.02505)
Medium Population × Capacity Discipline -0.01970 (0.01169)
Large Population × Capacity Discipline -0.01256 (0.00629)
Capacity Discipline -0.01465 (0.00559)
Log Population 1.32447 (0.16797)
Talk Eligible -0.13215 -0.13410 (0.01416) (0.01413)
Market Missing Report 0.01724 0.01436 (0.00595) (0.00595)
Monopoly Market 0.05384 0.05356 (0.00924) (0.00922)
R-squared 0.866 0.866 N 840,149 840,149
Notes. Standard errors are in parentheses and are clustered at the market level.
where Ds ∈ {0, 1} is equal to one if the size of market m is s ∈ {small, medium, large}.m
We present the estimation results from Eq. (A.1) in column (1) in Ta-
ble A.2. We find that communication among legacy carriers leads to a large
4.21% reduction (after the correction as defined in Footnote 18) in seats sup-
plied in smaller markets on average. The fact that we find that the effectiveness
of communication is stronger in smaller markets is consistent with colluding
being easier and more profitable in smaller markets. Moreover, we find that
the negative effect of communication on available seats decreases to 1.95%
and 1.25% in medium and large markets. This suggests, that at least in air-
lines industry, the level of collusion is inversely proportional to the size of the
markets.
An alternative way to control for market size is to treat market size as
42

Table A.3: Fixed Effects Estimates of Communication on Available Seats Sep-arated by Level of Business Travel
(1) Log Seats
Low Business × Capacity Discipline -0.02778 (0.01167)
Medium Business × Capacity Discipline -0.02189 (0.00884)
High Business × Capacity Discipline 0.01510 (0.01516)
Talk Eligible -0.12767 (0.01593)
Market Missing Report 0.01203 (0.00691)
Monopoly Market 0.05296 (0.01037)
R-squared 0.863 N 619,848
Notes. Standard errors are in parentheses and are clustered at the market level.
a continuous control variable and add it (after taking log) in the primary
regression model, Eq. (1). The results from this model are presented in the
second column of Table A.2. As can be seen, we find that the legacy carriers
reduced their capacity by a larger number in smaller markets than they did in
medium or larger markets.
Business Markets
Next, we investigate the role of price-elasticity on collusion. In particular
we investigate whether the composition of the market demand in business and
leisure travelers affects the degree to which carriers respond to communication.
Larger markets tend to have a higher share of for-business travelers, who tend
to have a higher willingness to pay for a ticket; ceteris paribus, i.e., they have
(relatively) more inelastic demand for air travel than those who travel for
leisure. This means larger markets should have higher mark-ups than smaller
43
markets, and thus be more attractive for collusion.
We follow Borenstein [2010] and Ciliberto and Williams [2014] and use
a business index that is constructed using the 1995 American Travel Survey
(ATS). The ATS was conducted by the Bureau of Transportation Statistics
(BTS) to obtain information about the long-distance travel of people living in
the U.S., and it collected quarterly information related to the characteristics of
persons, households, and trips of 100 miles or more for approximately 80,000
American households. We use the survey to compute an index that captures
the percentage of travelers out of an origin that are traveling for business.
We define a market’s business travel index to be the computed travel index
for the market’s origin airport. In classifying markets based on their level of
business travel, we follow the same approach as in our market size classifica-
tions. Low business markets are those with an index value at or below the
25th percentile, medium business markets have an index value in the (25th , 75th]
percentiles, and high business markets are those with an index above the 75th
percentile. The average number of seats offered in a market is fairly constant
across our business travel classifications, but coordinated communication is
more common in low and medium business markets than in high business
markets. Then we estimate the same model as (A.1) except now we replace
the market size dummies with the business-size dummies.
We present the results from this regression in the third column, in Ta-
ble A.3. The first row corresponds to the effect on low-business markets, and,
as we can see, we find that communication is associated with a 2.74% decrease
in the number of seats offered. What is interesting is that the effects of commu-
nication are smaller for medium-business markets at -2.17%, and, in fact, they
lead to an increase in the number of offered seats by 1.52% in high-business
markets. Although the effects on low and medium-business markets are sta-
tistically significant at 1%, the difference between the two are not statistically
significant. Thus, we cannot reject the null that the effects in these two mar-
kets are similar.26 On the other hand, the effect on high-business markets is
26When we allow the estimates to differ by both market size and carrier type, the quali-tative results do not change.
44
statistically different from the other two, and the fact that we find a positive
effect of communication means that when it comes to collusion, the differences
in elasticity are less important than the threat of entry by LCCs and demand
uncertainty.
City Pairs
So far, we have followed Borenstein [1989]; Kim and Singal [1993]; Borenstein
and Rose [1994]; Gerardi and Shapiro [2009]; Ciliberto and Tamer [2009]; Berry
and Jia [2010]; Ciliberto and Williams [2010]; and Ciliberto and Williams
[2014], and defined a market by the origin and destination airport pairs. An
alternative argument maintains that markets should be defined by the origin
and destination cities, rather than airports. This alternative market definition
has been followed, among others, by Berry [1990, 1992]; Brueckner and Spiller
[1994]; Evans and Kessides [1994]; and Bamberger, Carlton and Neumann
[20004].
For illustration, consider two flights flying out of Reagan National Air-
port, located in Northern Virginia, with one flying to O’Hare International
Airport and the other flying to Midway International Airport, both located
in Chicago. Under the airport-pair market definition, these flights operate in
separate markets—the first is in the Reagan-O’Hare market, and the second is
in the Reagan-Midway market. Under the city-pair method of defining mar-
kets, we treat these flight as operating in the same market, because they both
serve the Washington D.C. to Chicago market.27
How to define airline markets is of key interest for antitrust matters. While
the airport-pair approach is often used in academic research on the airline
industry, the city-pair approach is particularly important for antitrust practi-
tioners. This is because using the city-pair approach leads to larger markets,
which, for antitrust purposes, provides a stronger basis for government inter-
vention if evidence of anticompetitive effects is found.
In Table A.4 we present the city-pair analogue of Tables A.1 and 2. While
27In our empirical analysis, we follow Brueckner, Lee and Singer [2014] to determine which airports should be grouped in the same city for the city-pair definition approach.
45

Table A.4: Summary Statistics for City-Pair Markets
Seats Cap. Discipline Talk Eligible Monopoly Market Missing Report
Mean SD Median Mean SD Mean SD Mean SD Mean SD N
Carrier Type Legacy LCC
13,095.678 12,178.875
16,094.787 15,019.836
7,420.000 8,220.000
0.108 0.077
0.311 0.267
0.401 0.279
0.490 0.449
0.441 0.285
0.497 0.451
0.285 0.168
0.452 0.374
504,644 261,102
Total 12,783.069 15,742.496 7,809.000 0.098 0.297 0.359 0.480 0.388 0.487 0.245 0.430 765,746
Seats Cap. Discipline Talk Eligible Monopoly Market Missing Report
Mean SD Median Mean SD Mean SD Mean SD Mean SD N
Market Participants Mixed Market 15,537.611 18,078.250 9,472.000 0.115 0.320 0.424 0.494 0.160 0.366 0.224 0.417 465,353 Legacy Market 8,515.877 9,771.681 5,382.000 0.070 0.255 0.259 0.438 0.741 0.438 0.277 0.448 300,393
Market Size Small 4,685.647 4,695.543 3,536.000 0.006 0.078 0.032 0.176 0.848 0.359 0.204 0.403 78,831 Medium 8,535.886 7,961.011 5,932.000 0.046 0.210 0.161 0.367 0.562 0.496 0.202 0.401 319,331 Large 18,209.271 19,932.548 11,820.000 0.162 0.368 0.602 0.489 0.138 0.345 0.291 0.454 367,584
Total 12,783.069 15,742.496 7,809.000 0.098 0.297 0.359 0.480 0.388 0.487 0.245 0.430 765,746
Notes. Table of summary statistic for all key variables. Observations are at the carrier-market-month level for city-pair markets.
there are quantitative differences in the frequency of Capacity-Disciplinem,t =
1 between airport and city markets, the qualitative result holds: legacy car-
riers are more likely to be in markets where pertinent communications take
place.
Next, we use the same specification as Eq. (1), except with the city-pair
definition of the markets. The results are in the first column of Table A.5. The
interpretation of all variables is the same, and the coefficient of interest for us
is the first row, which shows that communication does not decrease offered
seats. Next, we allow the effect to vary by market sizes and, as mentioned
above, by whether the city is served by less than three airports. The results
are in second column of Table A.5. The most important result is that in small
markets that have less than three airports, we see that communication leads
to 4.16% fewer offered seats, and this effect is statistically significant at 10%.
What is important to note is that this effect is similar to the effect we found
for the airport-pair markets. When we consider medium-sized markets with
less than three airports, the effect is slightly smaller at −1.36%. However, for
larger markets or markets with more than three airports, we cannot reject the
null that communication about capacity discipline has no effect on the number
46
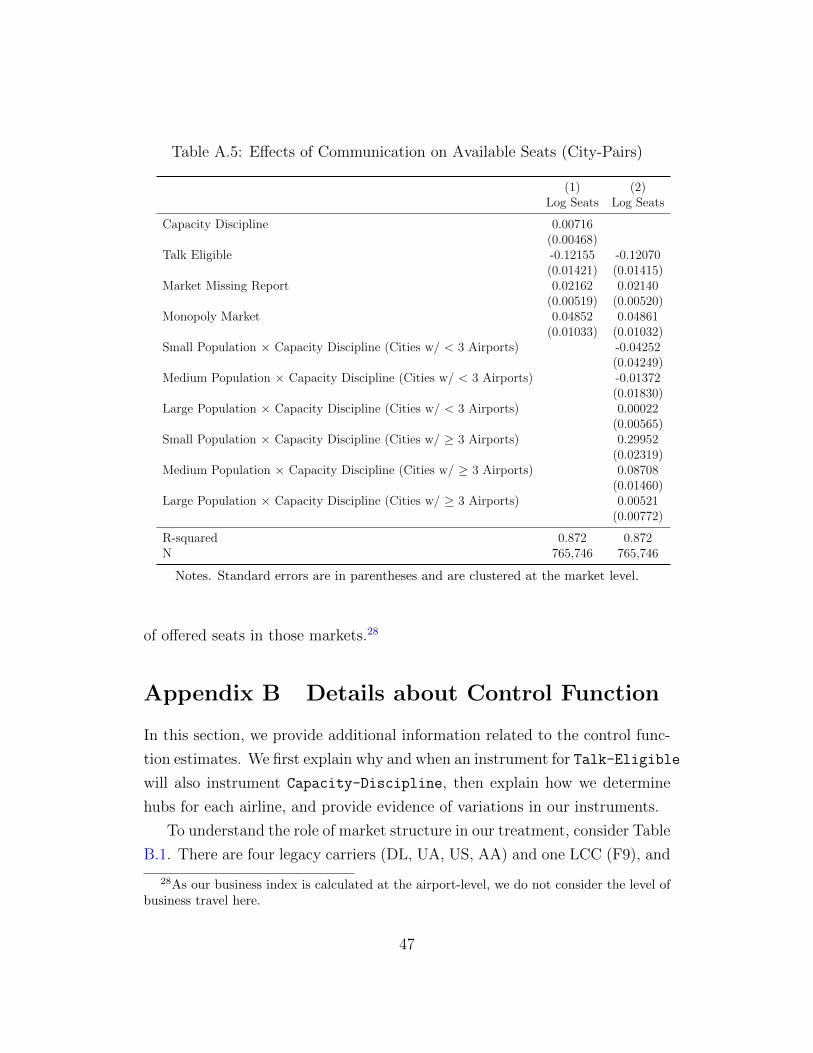
Table A.5: Effects of Communication on Available Seats (City-Pairs)
(1) (2) Log Seats Log Seats
Capacity Discipline 0.00716 (0.00468)
Talk Eligible -0.12155 -0.12070 (0.01421) (0.01415)
Market Missing Report 0.02162 0.02140 (0.00519) (0.00520)
Monopoly Market 0.04852 0.04861 (0.01033) (0.01032)
Small Population × Capacity Discipline (Cities w/ < 3 Airports) -0.04252 (0.04249)
Medium Population × Capacity Discipline (Cities w/ < 3 Airports) -0.01372 (0.01830)
Large Population × Capacity Discipline (Cities w/ < 3 Airports) 0.00022 (0.00565)
Small Population × Capacity Discipline (Cities w/ ≥ 3 Airports) 0.29952 (0.02319)
Medium Population × Capacity Discipline (Cities w/ ≥ 3 Airports) 0.08708 (0.01460)
Large Population × Capacity Discipline (Cities w/ ≥ 3 Airports) 0.00521 (0.00772)
R-squared 0.872 0.872 N 765,746 765,746
Notes. Standard errors are in parentheses and are clustered at the market level.
of offered seats in those markets.28
Appendix B Details about Control Function
In this section, we provide additional information related to the control func-
tion estimates. We first explain why and when an instrument for Talk-Eligible
will also instrument Capacity-Discipline, then explain how we determine
hubs for each airline, and provide evidence of variations in our instruments.
To understand the role of market structure in our treatment, consider Table
B.1. There are four legacy carriers (DL, UA, US, AA) and one LCC (F9), and
28As our business index is calculated at the airport-level, we do not consider the level of business travel here.
47

Table B.1: Instruments and Market Structure
Market Market structure Communicating Capacity-Discipline 1 {DL, F9} {DL, UA, US} 0 2 {DL, F9, UA} {DL, UA, US} 1 3 {DL, UA} {DL, UA, US} 1 4 {DL, UA, AA} {DL, UA, US} 0 5 {DL, UA, AA} {DL, UA, US} 0 6 {DL, UA, US} {DL, UA, US} 1
Notes. An example to discuss the source of identification for the instruments.
suppose that except AA other three legacy carriers use capacity discipline (see
column 3). For the purpose of this discussion we keep this communication
fixed. When we compare markets 1 and 2, we see that the only difference is
in the market structure, only market 2 is Talk-Eligible because it has at
least two legacy carriers, so the treatment Capacity-Discipline = 1 only
for market 2 (see column 4). So any variable that increases the likelihood
of UA serving a market will be correlated with the treatment. Similarly,
when we compare markets 3 and 4, we see that any variable that reduces
the likelihood of AA serving a market would make the treatment 1, because
AA is not communicating. Likewise for markets 5 and 6, whether or not the
market is treated depends on whether it is served by US or by AA. So, any
variable that is correlated with the market structure will be correlated with
Talk-Eligible and hence Capacity-Discipline.
To control for the endogeneity of the market structure, we need to find
variables that affect market structure (relevance) but do not influence the ca-
pacity decisions (exclusion restriction). A natural candidate are the variables
that affect the fixed (entry) costs of serving a market. Measures of fixed costs
are not available, so, we follow Ciliberto and Tamer [2009] and maintain that
the sum of the geographical distances between a market’s endpoints and the
closest hub of a carrier are proxies for the cost that a carrier has to face to serve
that market. Data on the distances between airports, which are also used to
construct the variable close airport are from the data set Aviation Support Ta-
bles: Master Coordinate, available from the National Transportation Library.
48

Figure B.1: Network for an Airline
SFO LAX CLT CHO
ORD JFK
DFW
PHX
Notes. A schematic representation of airpots-network served by an airline.
In order to identify hubs over time, we adopt the methodology in Ciliberto,
Cook and Williams [2018], who find that the betweenness centrality measure
from graph-theory, which is based on shortest path between two airports, is
good at identifying hub airports.
To illustrate this measure of centrality consider Figure B.1, which displays
a network of airports served by an airline. Betweenness centrality for CHO
measures the number of times CHO is the shortest connection between any
two other airports. In this example, CHO is never in the shortest path between
any two airports, so the betweenness centrality for CHO is zero. Similarly, the
betweenness centrality for PHX is also zero. DFW, however, will have higher
betweenness centrality because it is in a stop of multiple airports, like PHX
and SFC. Similarly, the betweenness centrality for CLT and LAX will be high.
Formally, the betweenness measure for an airport k, for airline j is
j X 1 Pk
j (`, 0)Bk := ,
(Nj − 1)(Nj − 2) P j (`, 0)`6=`0,k 6∈{`,`0}
where Nj is the number of airports served by airline j, Pkj (`, 0) is the number
of shortest paths between airports ` and `0 with a stop at k, and P j (`, 0)
49

`0is the total number of shortest paths between ` and . If there is only one
shortest path between ` and `0 then the ratio is 1, and if there are multiple
paths then this measure gives equal weight to each path. The measure is
rescaled by dividing through by the number of pairs of nodes not including
k, so that Bkj ∈ [0, 1]. Using this measure of betweenness centrality, for every
airline j and for every period t we choose the airports with the betweenness
centrality that is at least 0.1 and denote these airports as the j’s “hubs.” By
this definition, the hubs in Figure B.1 are {DF W, CLT, LAX}. As mentioned in the Section 4.3.2 the next step is to determine, for every
carrier, the distances of airports to their nearest carrier-hub. There are two
advantages of determining hubs this way. A hub is not only defined at a
national level, because it uses the entire network, while seats are at the market
level, which preserves exclusion restriction. Second, it allows hubs to vary over
time, which in turn will lead to variations in the distances, which is necessary
for identification.
Figure B.2: Histogram of the Variance in Distances across Carrier-Markets
0.2
.4.6
.8
0 200000 400000 600000 800000
0.1
.2.3
0 200000 400000 600000 800000
(a) All Values (b) Positive Values
Notes. Observations are carrier-markets.
In Fig. B.2 we display the histograms for these distances across carriers and
markets. Figure Fig. B.2a displays the entire sample while Fig. B.2b restricts
the sample to only those with positive variance in distances. We also present
the summary statistics of these distances by carriers in Table B.2. Both these
figures and table show that there is substantial variation in distances.
50

Table B.2: Summary Statistic of Distances by Carriers
Carrier Mean SD Median N
AA 1,275.208 630.951 1,191.541 651,662 AS 3,547.695 1,112.139 3,798.087 651,662 CO 1,326.389 767.240 1,165.600 387,094 DL 1,066.626 523.742 987.370 651,662 LCC 1,614.684 1,024.751 1,325.646 2,331,623 NW 1,258.117 710.675 1,054.423 345,777 US 1,231.246 770.058 1,072.093 531,045 UA 1,097.282 545.129 1,043.867 651,662
Total 1,599.466 1,109.638 1,252.665 6,202,187
Notes. Each row displays the mean, standard deviation, median and number of observations of air-distances to closest hubs for a carrier. LCC is the average of distances for all LCCs.
The next step is to use these distances to estimate the probability of observ-
ing a market structure given the distances, using multinomial logistic regres-
sion. In total there are more than 120 unique market structures in our samples,
although the number varies a but by market and month. For instance after
the UA and CO merger, we remove all market structure that include CO. And
for every market and every month we separately estimate the probability that
one of these market structure will be realized for that market in that month,
given the vector of distances for that market. We present the estimation re-
sults from the “first-stage” regression of Talk-Eligible on the instruments
in Table B.3. For the lack of space we present the estimated probabilities of
market structure for only 5 market structures.29
Appendix C Text Processing for Conditional
Exogeneity Test
In order to construct a set of tokens, we identify three tokens that are essential
to the concept of capacity discipline: “capacity discipline,” “demand,” and
29The estimated probabilities for all other market structures are available upon request.
51

Table B.3: Control Function Approach: First Stage Results
(1)
{US} -0.11393 (0.05144)
{NW, US, WN} -0.41836 (.2821339)
{AA, LCC} -0.10094 (0.05675)
{ AA, LCC, US} -0.09720 (0.06310)
{AA, LCC, NW} -0.01785 (0.0799536)
. . . . . . F -stat 724
“gdp.” Then to be as objective as possible in determining a token that satisfy
the first criteria we employ the word2vec model from computational linguistics
[Mikolov et al., 2013] and determine a token that is close to (defined below)
one for all three tokens “capacity discipline”, “gdp” and “demand.”30
Broadly, the word2vec model maps each unique token we observe in the
earnings call transcripts to an N -dimensional vector space (in our analysis,
N = 300), in such a way as to preserve the contextual relationships between
the tokens. The vector representation of each token is such that tokens that
are semantically similar are located “close” to each other, and tokens that
are more dissimilar are located “farther” away from each other. This sense of
“closeness” reflects the likelihood that the given tokens appear near to each
other. Thus, if “discipline” and “stable” are found to be close, then discussion
of one term in a earnings call is likely given discussion of the other. We
directly train the word2vec model using our transcript data, so the derived
relationships between words are specific to the context of airlines’ earnings
30The word2vec model was developed at Google in 2013 [Mikolov et al., 2013] to analyze text data. For an intuitive and accessible explanation see Goldberg and Levy [2014]. We use the gensim implementation of the word2vec model [ Rehˇ urek and Sojka, 2010].
52

calls, as opposed to a more general context. Thus, for example, if airline
executives use the word “discipline” in a contextually different manner than
it is used in in more general conversation or writing, our model will account
for that.
To measure the similarity of two tokens in the word2vec vector space,
we use a commonly used metric called the cosine similarity metric, which is
defined as the cosine of the angle between the vector representation of the two
tokens; see, for example, Singhal [2001]. Given the normalized vectors for two
tokens, k and `, this measure of similarity is defined as
kT dcos(`, k) = ,
||k|| · ||`||
where || · || is the L2 norm. When two vectors are the same, cosine similarity
is 1; when they are totally independent (perpendicular) to each other, then it
is 0; and when the angle is 180 degrees apart, the cosine similarity is −1.31
To understand our use of cosine similarity, consider Fig. C.1, which displays
a hypothetical example of training the word2vec model in a 2-dimensional
space. The word2vec model maps all of the tokens in our vocabulary to this
space. For example, the token “capacity discipline” is represented by the vec-
tor (5, 0), and the token “holiday” is represented by the vector (−8, 8). Our
measure of similarity between these two tokens is the cosine of the angle be-
tween these two vectors, θ = 135◦, so dcos(holiday, capacity discipline) =
−0.707, and thus “holiday” is very dissimilar to “capacity discipline.”
For each of these tokens k ∈ {capacity discipline, demand, gap}, we define the set: �
Lk(d, d) = ` ∈ L : d ≤ dcos(`, k) ≤ d ,
where L is the set of all tokens. In order to satisfy the second criteria, we
restrict the token to be such that at least 50% of the time it appears in the
same report as these three keywords.
31Note that the cosine metric is a measure of orientation and not magnitude. This metric is appropriate in our cases, as we are interested in comparing the contextual meaning of the words, not in comparing the frequency of the words.
53
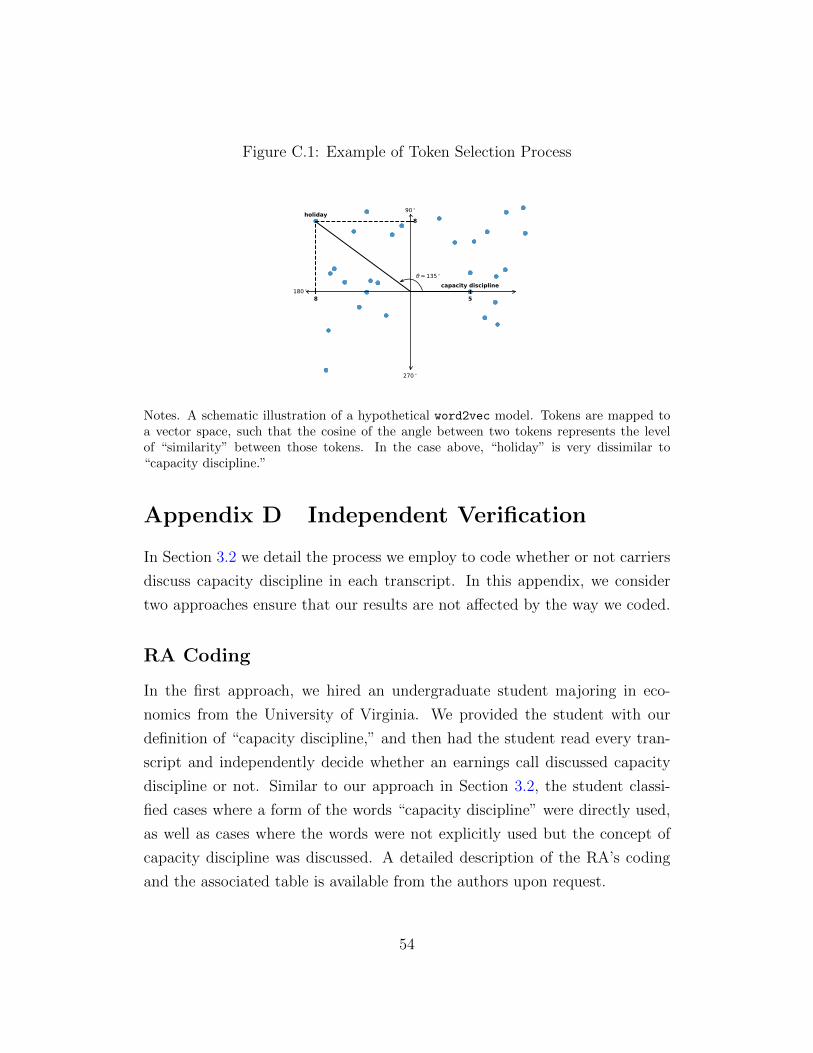
Figure C.1: Example of Token Selection Process
capacity discipline
holiday
= 135
90
180
270
8
8 5
Notes. A schematic illustration of a hypothetical word2vec model. Tokens are mapped to a vector space, such that the cosine of the angle between two tokens represents the level of “similarity” between those tokens. In the case above, “holiday” is very dissimilar to “capacity discipline.”
Appendix D Independent Verification
In Section 3.2 we detail the process we employ to code whether or not carriers
discuss capacity discipline in each transcript. In this appendix, we consider
two approaches ensure that our results are not affected by the way we coded.
RA Coding
In the first approach, we hired an undergraduate student majoring in eco-
nomics from the University of Virginia. We provided the student with our
definition of “capacity discipline,” and then had the student read every tran-
script and independently decide whether an earnings call discussed capacity
discipline or not. Similar to our approach in Section 3.2, the student classi-
fied cases where a form of the words “capacity discipline” were directly used,
as well as cases where the words were not explicitly used but the concept of
capacity discipline was discussed. A detailed description of the RA’s coding
and the associated table is available from the authors upon request.
54
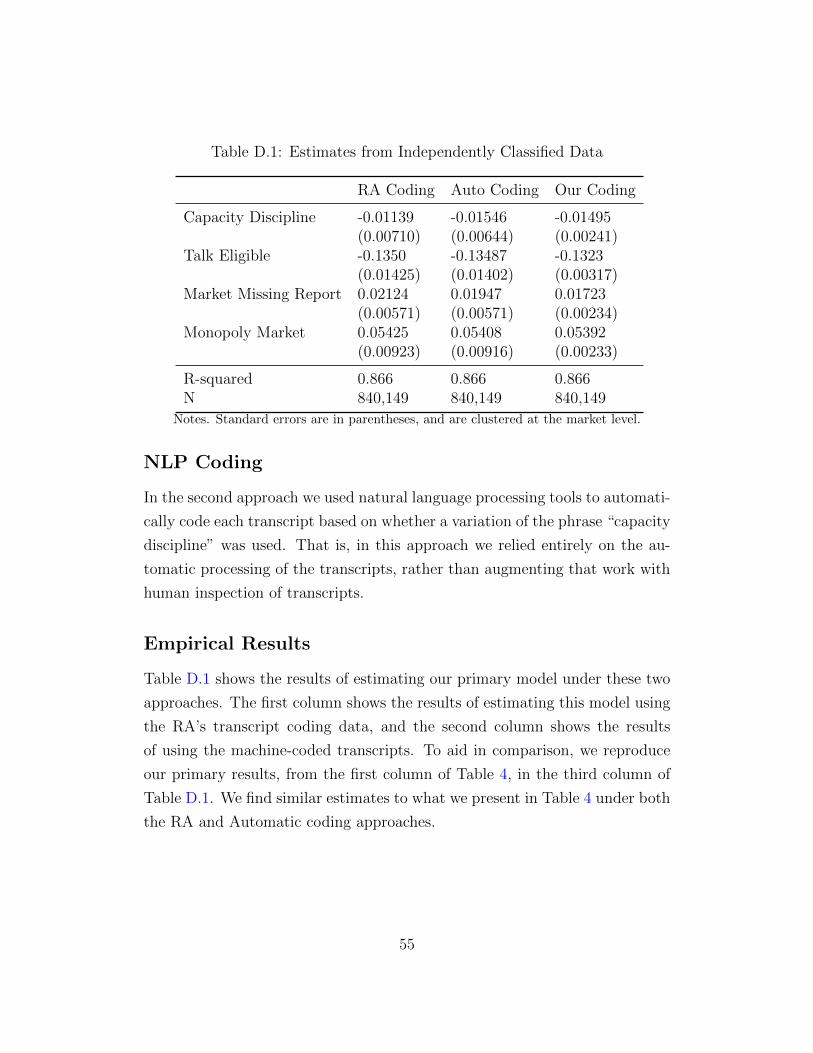
Table D.1: Estimates from Independently Classified Data
RA Coding Auto Coding Our Coding
Capacity Discipline -0.01139 -0.01546 -0.01495 (0.00710) (0.00644) (0.00241)
Talk Eligible -0.1350 -0.13487 -0.1323 (0.01425) (0.01402) (0.00317)
Market Missing Report 0.02124 0.01947 0.01723 (0.00571) (0.00571) (0.00234)
Monopoly Market 0.05425 0.05408 0.05392 (0.00923) (0.00916) (0.00233)
R-squared 0.866 0.866 0.866 N 840,149 840,149 840,149
Notes. Standard errors are in parentheses, and are clustered at the market level.
NLP Coding
In the second approach we used natural language processing tools to automati-
cally code each transcript based on whether a variation of the phrase “capacity
discipline” was used. That is, in this approach we relied entirely on the au-
tomatic processing of the transcripts, rather than augmenting that work with
human inspection of transcripts.
Empirical Results
Table D.1 shows the results of estimating our primary model under these two
approaches. The first column shows the results of estimating this model using
the RA’s transcript coding data, and the second column shows the results
of using the machine-coded transcripts. To aid in comparison, we reproduce
our primary results, from the first column of Table 4, in the third column of
Table D.1. We find similar estimates to what we present in Table 4 under both
the RA and Automatic coding approaches.
55
Appendix References
Bamberger, Gustavo E., Dennis W. Carlton, and Lynette R. Neu-
mann. 20004. “An Empirical Investigation of the Competitive Effects of
Domestic Airline Alliances.” The Journal of Law and Economics, 47(1): 195–
222.
Berry, Steven, and Panle Jia. 2010. “Tracing the Woes: An Empirical
Analysis of the Airline Industry.” AEJ: Microeconomics, 2: 1–43.
Berry, Steven, Michael Carnall, and Pablo T. Spiller. 2006. “Airline
Hubs: Costs, Markups and the Implications of Consumer Heterogeneity.” In
Advances in Airline Economics: Competition Policy and Antitrust. Vol. 1, ,
ed. Darin Lee, 183–214. Amsterdam: Elsevier.
Berry, Steven T. 1990. “Airport Presence as Product Differentiation.” Amer-
ican Economic Review, 80(2): 394–399.
Berry, Steven T. 1992. “Estimation of a Model of Entry in the Airline
Industry.” Econometrica, 60(4): 889–917.
Borenstein, S. 2010. “An Index of Inter-City Business Travel for Use in
Domestic Airline Competition Analysis.” NBER Working Paper.
Borenstein, Severin. 1989. “Hubs and High Fares: Dominance and Mar-
ket Power in the U.S. Airline Industry.” RAND Journal of Economics,
20(3): 344–365.
Borenstein, Severin, and Nancy Rose. 1994. “Competition and Price
Dispersion in the U.S. Airline Industry.” Journal of Political Economy,
102(4): 653–683.
Bresnahan, Timothy F., and Peter C. Reiss. 1991. “Entry and Compe-
tition in Concentrated Markets.” Journal of Political Economy, 99(5): 977–
1009.
56
Brueckner, Jan K., and Pablo T. Spiller. 1994. “Economies of Traf-
fic Density in the Deregulated Airline Industry.” Journal of Law and Eco-
nomics, 37(2): 379–415.
Brueckner, Jan K., Darin Lee, and Ethan Singer. 2014. “City-Pairs
Versus Airport-Pairs: A Market-Definition Methodology for the Airline In-
dustry.” Review of Industrial Organization, 44(1): 1–25.
Ciliberto, Federico, and Elie Tamer. 2009. “Market Structure and Mul-
tiple Equilibria in Airline Markets.” Econometrica, 77(6): 1791–1828.
Ciliberto, Federico, and Jonathan W. Williams. 2010. “Limited access
to airport facilities and market power in the airline industry.” Journal of
Law and Economics, 53(3): 467–495.
Ciliberto, Federico, and Jonathan W. Williams. 2014. “Does Multimar-
ket Contact Facilitate Tacit Collusion? Inference on Conduct Parameters
in the Airline Industry.” RAND Journal of Economics, 45(4): 764–791.
Ciliberto, Federico, Emily E. Cook, and Jonathan W. Williams. 2018.
“Network Structure and Consolidation in the US Airline Industry, 1990-
2015.” Review of Industrial Organization.
Evans, W.N., and I. N. Kessides. 1994. “Living By The ’Golden Rule’:
Multimarket Contact in the U.S. Airline Industry.” Quarterly Journal of
Economics, 109: 341–366.
Gerardi, Krisopher S., and Adam Hale Shapiro. 2009. “Does compe-
tition reduce price dispersion? New evidence from the airline industry.”
Journal of Political Economy, 117(1): 1–37.
Harwell, Drew, Ashley Halsey III, and Thad Moore. 2015. “Jus-
tice Dept. Investigating Potential Airline Price Collusion.” The Washington
Post.
57

Kim, E. Han, and Vijay Singal. 1993. “Mergers and Market Power: Evi-
dence from the Airline Industry.” American Economic Review, 83(3): 546–
569.
Myerson, Roger B. 1997. Game Theory: Analysis of Conflict. Harvard Uni-
versity Press.
Singhal, Amit. 2001. “Modern Information Retrieval: A Brief Overview.”
Bulletin of the IEEE Computer Society Technical Committee on Data En-
gineering, 24(4): 35–42.
58