public debt - finance · 2018-04-26 · chapter 9 public debt 9.1 introduction developing prudent...
TRANSCRIPT

Chapter 9
Public Debt
9.1 Introduction Developing prudent and sound debt management strategy is paramount especially when debt flows are being channeled to pursue accelerated development goals. Over long term horizon, efforts are geared towards increasing the country’s economic footprint in-line with macro-economic objectives which eventually provide support towards debt re-payment capacity through modernized infrastructure. Given the current paradigm, Pakistan has to maintain a delicate balance – it needs to borrow in order to facilitate its development process while ensuring that debt level is prudently managed keeping in view the country’s repayment capacity.
Pakistan's public debt dynamics witnessed various positive developments during the ongoing fiscal year, some of them are highlighted below:
• Government continued to adhere to the targets set forth in Medium Term Debt Management Strategy (MTDS) to ensure public debt sustainability;
• Weighted average interest rate on the domestic debt portfolio has reduced further while cost of external loans contracted by the government are mostly concessional as well as dominated by long term funding;
• Government successfully raised US$ 2.5 billion in December 2017 through a 5-year Sukuk and 10-year conventional bond with the latter issued at the lowest rate for a Pakistan bond;
• In order to facilitate the investors, Central Directorate of National Savings (CDNS) has launched a non-financial version of mobile application called “Qoumi Bachat Digital” which enable customers to view their profits, investments in the certificates and accounts, receive notifications on
transactions, transaction history and also save prize bond numbers to be searched in the Prize Bond draws. CDNS is also in the process of launching a financial version of the mobile application along with the Card Management System and Mobile Wallet for investors.
9.2 Public Debt Total public debt is defined as debt of the government (including Federal Government and Provincial Governments) serviced out of consolidated fund and debts owed to the International Monetary Fund. Total Debt of the Government is public debt less accumulated deposits of the Federal and Provincial Governments with the banking system. Public debt has two main components, namely domestic debt (incurred principally to finance fiscal deficit) and external debt (raised primarily to finance development expenditures).
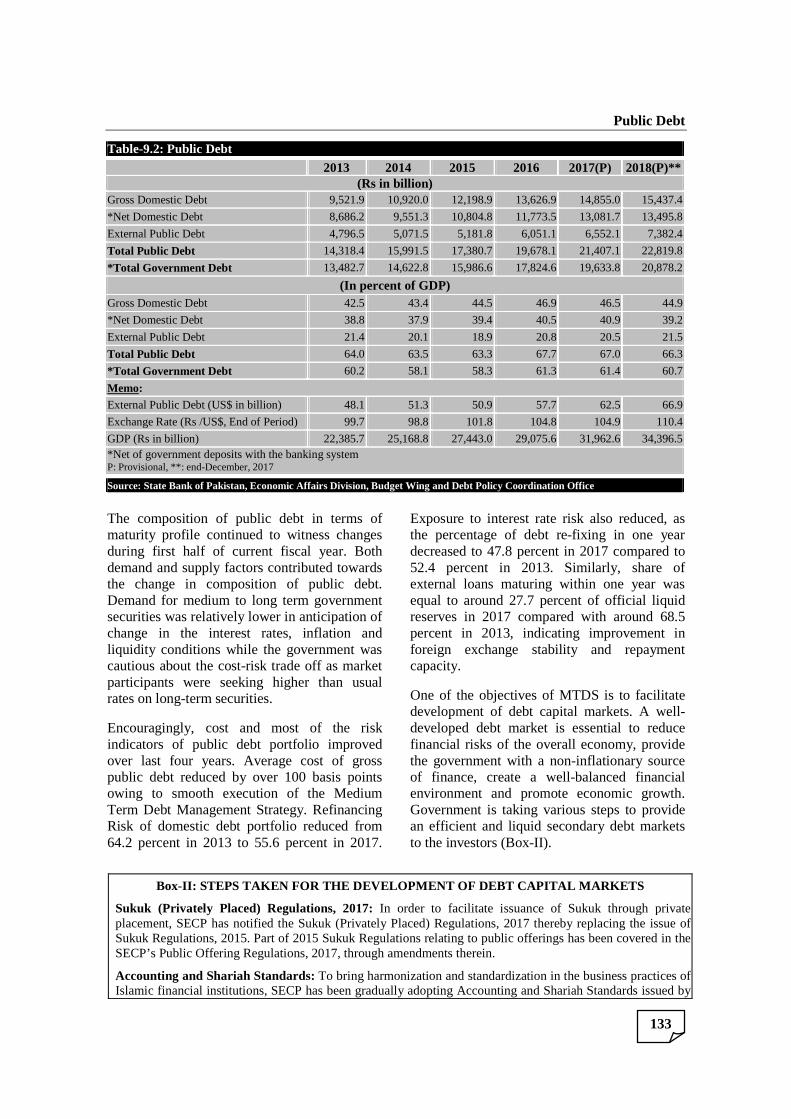
Total public debt stood at Rs 22,820 billion at end December 2017 while Total Debt of the Government was Rs 20,878 billion. Total public debt recorded an increase of Rs 1,413 billion during first six months of current fiscal year. The bifurcation of this increase is explained below:
• Domestic debt registered an increase of Rs 582 billion while government borrowing for financing of fiscal deficit from domestic sources was Rs 412 billion, indicating an increase in government credit balances with the banking system during the period under review; and
• Increase in external debt contributed Rs 830 billion to the public debt while government borrowing for financing of fiscal deficit from external sources was Rs 384 billion. Therefore, the increase in external debt signifies both borrowings for financing of fiscal deficit as well as revaluation losses due to Pak Rupee depreciation against US
Pakistan Economic Survey 201
132
Dollar as well as appreciation of other currencies against US Dollar. It is worth noting that depreciation increases the rupee value of external debt, but does not add much to foreign currency liability of the country i.e. any negative
Table-9.1: Year Wise Public Debt Position
Year Domestic Debt
External Debt
Public Debt
1971 14 16
1972 17 38
1973 20 40
1974 19 44
1975 23 48
1976 28 57
1977 34 63
1978 41 71
1979 52 77
1980 60 86
1981 58 87
1982 81 107
1983 104 123
1984 125 132
1985 153 156
1986 203 187
01,0002,0003,0004,0005,0006,0007,0008,0009,000
10,00011,00012,00013,00014,00015,00016,000
19
71
19
73
19
75
19
77
19
79
19
81
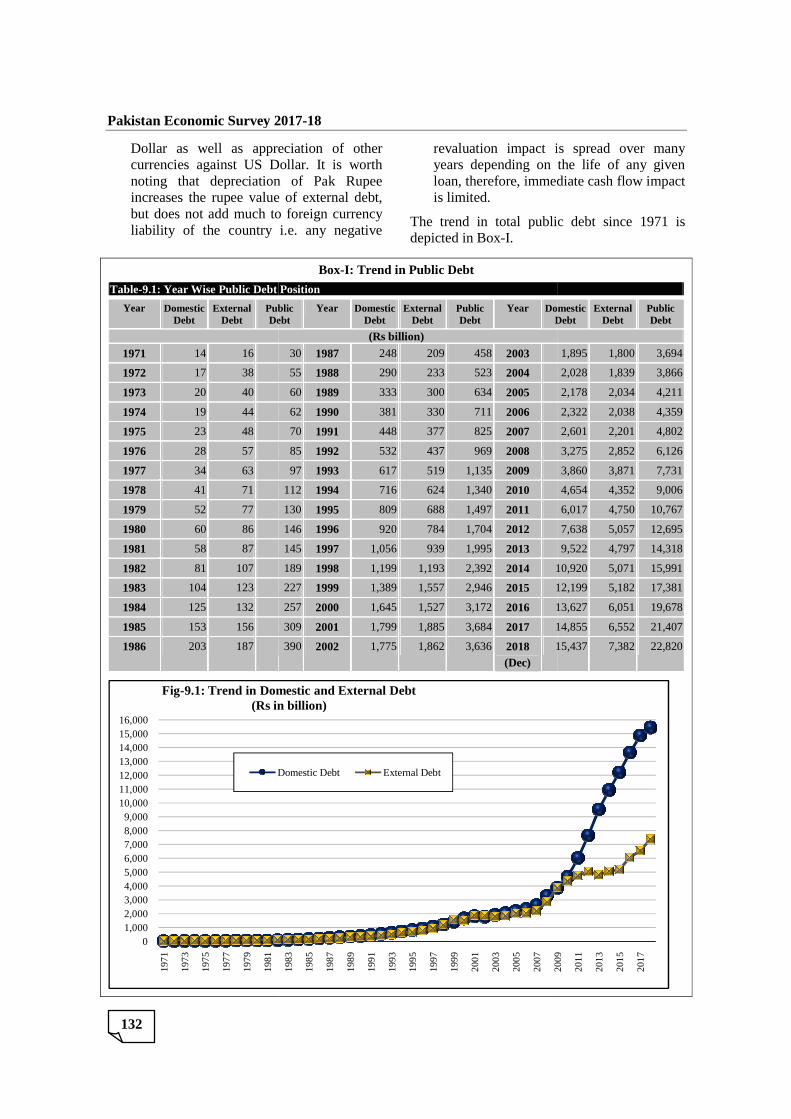
Fig-9.1: Trend in Domestic and External Debt(Rs in billion)
Domestic Debt
Pakistan Economic Survey 2017-18
Dollar as well as appreciation of other currencies against US Dollar. It is worth noting that depreciation of Pak Rupee increases the rupee value of external debt, but does not add much to foreign currency liability of the country i.e. any negative
revaluation impact is spread over many years depending on the life of any given loan, therefore, immediate cash flow impact is limited.
The trend in total public debt since 1971 is depicted in Box-I.
Box-I: Trend in Public Debt
ebt Position
Public Debt
Year Domestic Debt
External Debt
Public Debt
Year Domestic Debt
(Rs billion) 30 1987 248 209 458 2003
55 1988 290 233 523 2004
60 1989 333 300 634 2005
62 1990 381 330 711 2006
70 1991 448 377 825 2007
85 1992 532 437 969 2008
97 1993 617 519 1,135 2009
112 1994 716 624 1,340 2010
130 1995 809 688 1,497 2011
146 1996 920 784 1,704 2012
145 1997 1,056 939 1,995 2013
189 1998 1,199 1,193 2,392 2014 10,920
227 1999 1,389 1,557 2,946 2015 12,199
257 2000 1,645 1,527 3,172 2016 13,627
309 2001 1,799 1,885 3,684 2017 14,855
390 2002 1,775 1,862 3,636 2018 (Dec)
15,437
19
83
19
85
19
87
19
89
19
91
19
93
19
95
19
97
19
99
20
01
20
03
20
05
20
07
20
09
9.1: Trend in Domestic and External Debt(Rs in billion)
Domestic Debt External Debt
aluation impact is spread over many years depending on the life of any given loan, therefore, immediate cash flow impact
public debt since 1971 is
Domestic Debt
External Debt
Public Debt
1,895 1,800 3,694
2,028 1,839 3,866
2,178 2,034 4,211
2,322 2,038 4,359
2,601 2,201 4,802
3,275 2,852 6,126
3,860 3,871 7,731
4,654 4,352 9,006
6,017 4,750 10,767
7,638 5,057 12,695
9,522 4,797 14,318
10,920 5,071 15,991
12,199 5,182 17,381
13,627 6,051 19,678
14,855 6,552 21,407
15,437 7,382 22,820
20
09
20
11
20
13
20
15
20
17
Public Debt
133
Table-9.2: Public Debt 2013 2014 2015 2016 2017(P) 2018(P)**
(Rs in billion) Gross Domestic Debt 9,521.9 10,920.0 12,198.9 13,626.9 14,855.0 15,437.4
*Net Domestic Debt 8,686.2 9,551.3 10,804.8 11,773.5 13,081.7 13,495.8
External Public Debt 4,796.5 5,071.5 5,181.8 6,051.1 6,552.1 7,382.4
Total Public Debt 14,318.4 15,991.5 17,380.7 19,678.1 21,407.1 22,819.8
*Total Government Debt 13,482.7 14,622.8 15,986.6 17,824.6 19,633.8 20,878.2
(In percent of GDP) Gross Domestic Debt 42.5 43.4 44.5 46.9 46.5 44.9
*Net Domestic Debt 38.8 37.9 39.4 40.5 40.9 39.2
External Public Debt 21.4 20.1 18.9 20.8 20.5 21.5
Total Public Debt 64.0 63.5 63.3 67.7 67.0 66.3
*Total Government Debt 60.2 58.1 58.3 61.3 61.4 60.7
Memo: External Public Debt (US$ in billion) 48.1 51.3 50.9 57.7 62.5 66.9
Exchange Rate (Rs /US$, End of Period) 99.7 98.8 101.8 104.8 104.9 110.4
GDP (Rs in billion) 22,385.7 25,168.8 27,443.0 29,075.6 31,962.6 34,396.5 *Net of government deposits with the banking system P: Provisional, **: end-December, 2017
Source: State Bank of Pakistan, Economic Affairs Division, Budget Wing and Debt Policy Coordination Office
The composition of public debt in terms of maturity profile continued to witness changes during first half of current fiscal year. Both demand and supply factors contributed towards the change in composition of public debt. Demand for medium to long term government securities was relatively lower in anticipation of change in the interest rates, inflation and liquidity conditions while the government was cautious about the cost-risk trade off as market participants were seeking higher than usual rates on long-term securities.
Encouragingly, cost and most of the risk indicators of public debt portfolio improved over last four years. Average cost of gross public debt reduced by over 100 basis points owing to smooth execution of the Medium Term Debt Management Strategy. Refinancing Risk of domestic debt portfolio reduced from 64.2 percent in 2013 to 55.6 percent in 2017.
Exposure to interest rate risk also reduced, as the percentage of debt re-fixing in one year decreased to 47.8 percent in 2017 compared to 52.4 percent in 2013. Similarly, share of external loans maturing within one year was equal to around 27.7 percent of official liquid reserves in 2017 compared with around 68.5 percent in 2013, indicating improvement in foreign exchange stability and repayment capacity.
One of the objectives of MTDS is to facilitate development of debt capital markets. A well-developed debt market is essential to reduce financial risks of the overall economy, provide the government with a non-inflationary source of finance, create a well-balanced financial environment and promote economic growth. Government is taking various steps to provide an efficient and liquid secondary debt markets to the investors (Box-II).
Box-II: STEPS TAKEN FOR THE DEVELOPMENT OF DEBT CAP ITAL MARKETS
Sukuk (Privately Placed) Regulations, 2017: In order to facilitate issuance of Sukuk through private placement, SECP has notified the Sukuk (Privately Placed) Regulations, 2017 thereby replacing the issue of Sukuk Regulations, 2015. Part of 2015 Sukuk Regulations relating to public offerings has been covered in the SECP’s Public Offering Regulations, 2017, through amendments therein.
Accounting and Shariah Standards: To bring harmonization and standardization in the business practices of Islamic financial institutions, SECP has been gradually adopting Accounting and Shariah Standards issued by
Pakistan Economic Survey 2017-18
134
Accounting and Auditing Organization for Islamic Financial Institutions (AAOIFI). In February 2018, SECP has notified three Shariah Standards of AAOIFI for adoption in Pakistan, i.e.
Shariah Standard No. 17 - Investment Sukuk, Shariah Standard; Shariah Standard No. 18- Possession (Qabd); and Shariah Standard No. 23 - Agency and the Act of an un-commissioned agent (Fodooli).
Introduction and implementation of centralized E-IPO System (CES): In order to facilitate general public during IPOs, Centralized E-IPO System (CES) has been developed through CDC, in collaboration with 1-Link (G) Limited. Through CES, investors can submit applications electronically via internet, ATMs and mobile phones for subscription of securities of companies offered to the public. The main objectives of CES are to:
(i) bring efficiency in IPOs; (ii) reduce cost of IPOs; (iii) increase outreach of IPOs; (iv) make investment through IPOs hassle free; (v) promote culture of holding securities in book-entry form; and (vi) increase investor base.
So far, eight (08) banks have been integrated with CES whereas 03 banks are providing E-IPO services through their own independent E-IPO facilities.
Future plans with regard to development of debt capital markets: Revamping of the Companies (Asset Backed Securitization) Rules, 1999; Formulation of regulations for listing and trading privately placed debt securities; and Facilitation of Pakistan Mortgage Refinance Company (PMRC) in fund raising from debt capital markets.
Source: Securities and Exchange Commission of Pakistan
Comprehensive public debt analysis may fall short of full disclosure without review of government’s contingent liabilities. These liabilities originate out of guarantees issued on behalf of Public Sector Enterprises (PSEs) and by their contingent nature, do not form part of country’s overall debt. Therefore, to ensure utmost fiscal transparency, information regarding these contingent liabilities remains an essential component of public disclosure. During first half of current fiscal year, the government issued fresh/rollover guarantees aggregating to Rs 66 billion or 0.2 percent of GDP. The outstanding stock of government guarantees at end December 2017 was Rs 1,004 billion.
9.3 Progress on Medium Term Debt Management Strategy (2015/16 - 2018/19)
Government has updated its Medium Term Debt Management Strategy (2015/16-2018/19) which contains a policy advice on appropriate mix of financing from different sources with the spirit to uphold the integrity of the Fiscal Responsibility and Debt Limitation Act, 2005. Accordingly, the government needs to lengthen the maturity profile of its domestic debt and mobilize sufficient external inflows in the medium term keeping in view cost risks trade-off while remaining within the indicative risk ranges.
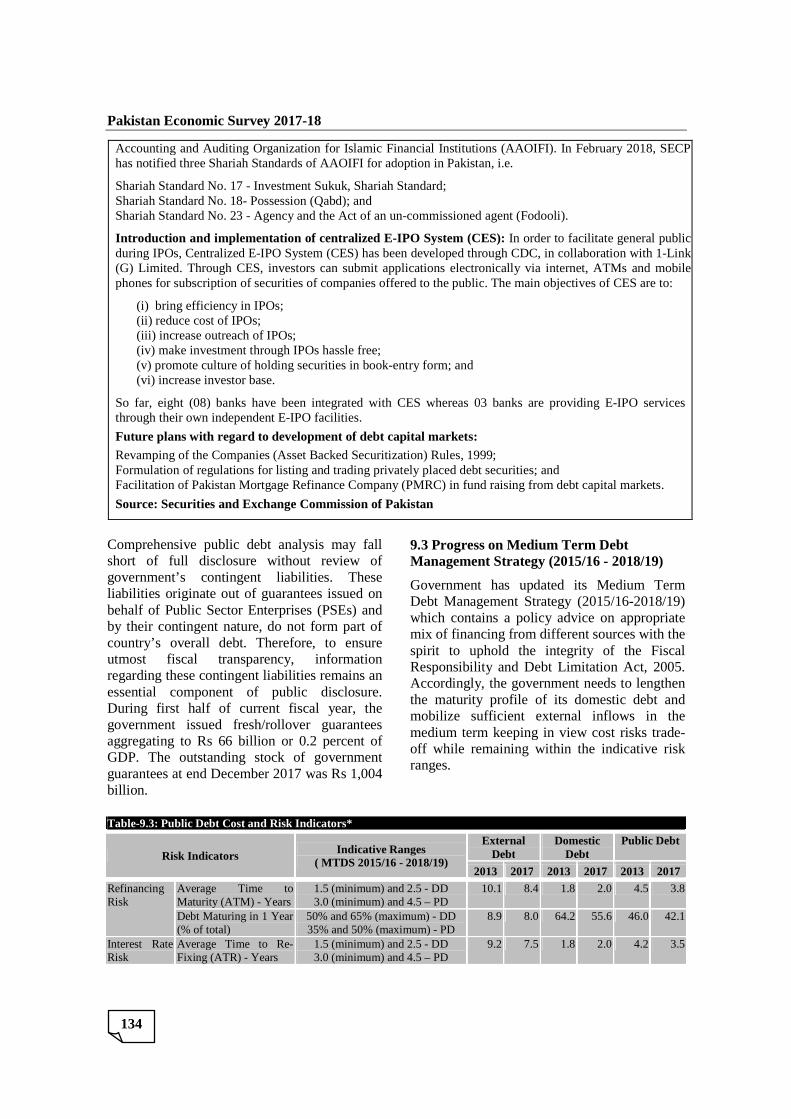
Table-9.3: Public Debt Cost and Risk Indicators*
Risk Indicators Indicative Ranges
( MTDS 2015/16 - 2018/19)
External Debt
Domestic Debt
Public Debt
2013 2017 2013 2017 2013 2017
Refinancing Risk
Average Time to Maturity (ATM) - Years
1.5 (minimum) and 2.5 - DD 3.0 (minimum) and 4.5 – PD
10.1 8.4 1.8 2.0 4.5 3.8
Debt Maturing in 1 Year (% of total)
50% and 65% (maximum) - DD 35% and 50% (maximum) - PD
8.9 8.0 64.2 55.6 46.0 42.1
Interest Rate Risk
Average Time to Re-Fixing (ATR) - Years
1.5 (minimum) and 2.5 - DD 3.0 (minimum) and 4.5 – PD
9.2 7.5 1.8 2.0 4.2 3.5
Public Debt
135
Table-9.3: Public Debt Cost and Risk Indicators*
Risk Indicators Indicative Ranges
( MTDS 2015/16 - 2018/19)
External Debt
Domestic Debt
Public Debt
2013 2017 2013 2017 2013 2017
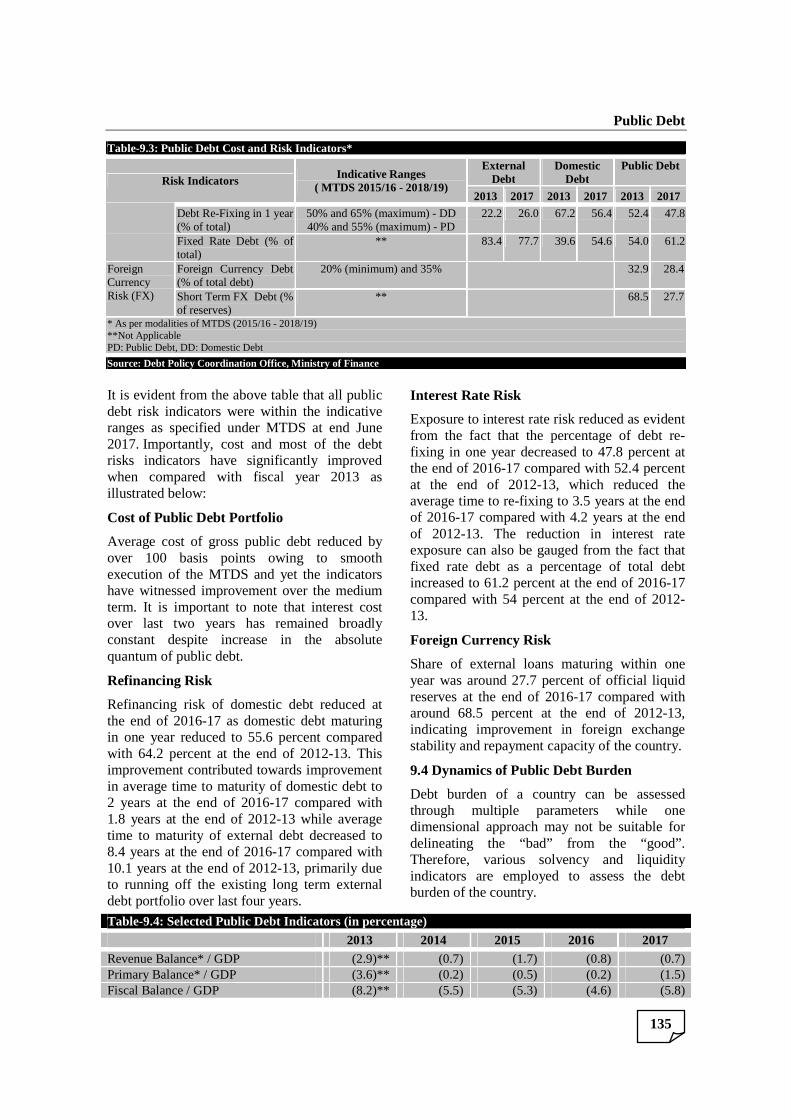
Debt Re-Fixing in 1 year (% of total)
50% and 65% (maximum) - DD 40% and 55% (maximum) - PD
22.2 26.0 67.2 56.4 52.4 47.8
Fixed Rate Debt (% of total)
** 83.4 77.7 39.6 54.6 54.0 61.2
Foreign Currency Risk (FX)
Foreign Currency Debt (% of total debt)
20% (minimum) and 35% 32.9 28.4
Short Term FX Debt (% of reserves)
** 68.5 27.7
* As per modalities of MTDS (2015/16 - 2018/19) **Not Applicable PD: Public Debt, DD: Domestic Debt
Source: Debt Policy Coordination Office, Ministry of Finance
It is evident from the above table that all public debt risk indicators were within the indicative ranges as specified under MTDS at end June 2017. Importantly, cost and most of the debt risks indicators have significantly improved when compared with fiscal year 2013 as illustrated below:
Cost of Public Debt Portfolio
Average cost of gross public debt reduced by over 100 basis points owing to smooth execution of the MTDS and yet the indicators have witnessed improvement over the medium term. It is important to note that interest cost over last two years has remained broadly constant despite increase in the absolute quantum of public debt.
Refinancing Risk
Refinancing risk of domestic debt reduced at the end of 2016-17 as domestic debt maturing in one year reduced to 55.6 percent compared with 64.2 percent at the end of 2012-13. This improvement contributed towards improvement in average time to maturity of domestic debt to 2 years at the end of 2016-17 compared with 1.8 years at the end of 2012-13 while average time to maturity of external debt decreased to 8.4 years at the end of 2016-17 compared with 10.1 years at the end of 2012-13, primarily due to running off the existing long term external debt portfolio over last four years.
Interest Rate Risk
Exposure to interest rate risk reduced as evident from the fact that the percentage of debt re-fixing in one year decreased to 47.8 percent at the end of 2016-17 compared with 52.4 percent at the end of 2012-13, which reduced the average time to re-fixing to 3.5 years at the end of 2016-17 compared with 4.2 years at the end of 2012-13. The reduction in interest rate exposure can also be gauged from the fact that fixed rate debt as a percentage of total debt increased to 61.2 percent at the end of 2016-17 compared with 54 percent at the end of 2012-13.
Foreign Currency Risk
Share of external loans maturing within one year was around 27.7 percent of official liquid reserves at the end of 2016-17 compared with around 68.5 percent at the end of 2012-13, indicating improvement in foreign exchange stability and repayment capacity of the country.
9.4 Dynamics of Public Debt Burden
Debt burden of a country can be assessed through multiple parameters while one dimensional approach may not be suitable for delineating the “bad” from the “good”. Therefore, various solvency and liquidity indicators are employed to assess the debt burden of the country.
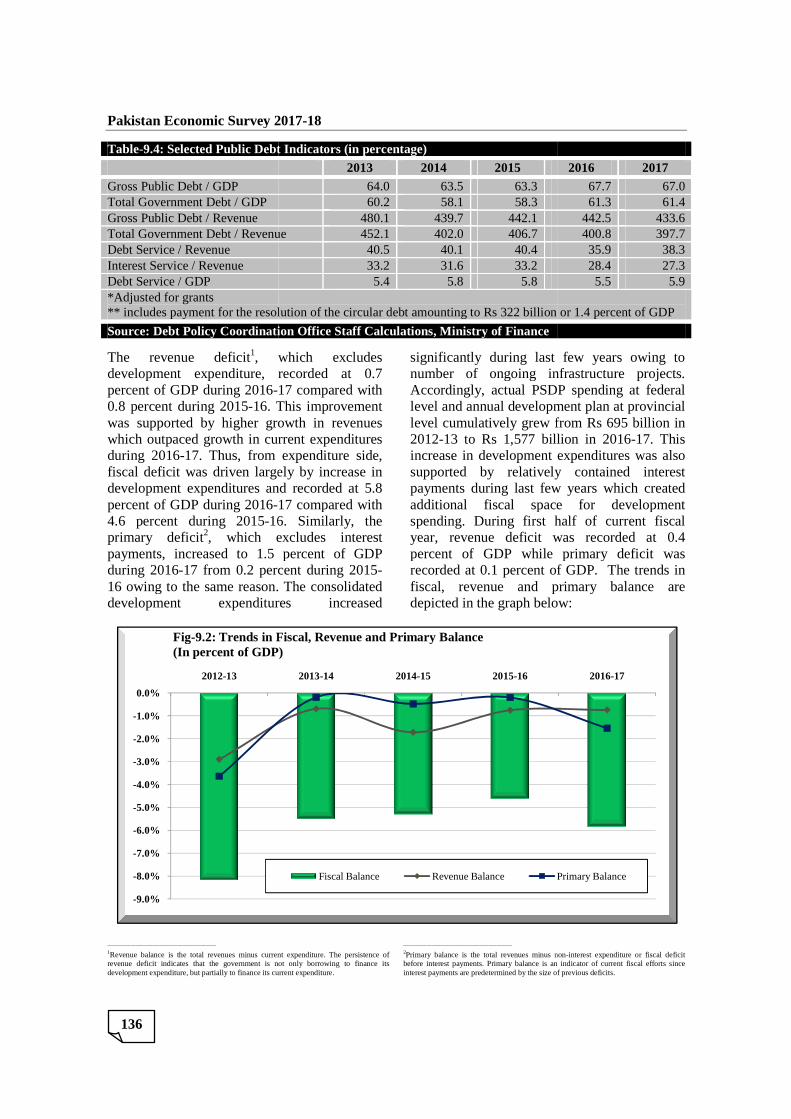
Table-9.4: Selected Public Debt Indicators (in percentage) 2013 2014 2015 2016 2017 Revenue Balance* / GDP (2.9)** (0.7) (1.7) (0.8) (0.7) Primary Balance* / GDP (3.6)** (0.2) (0.5) (0.2) (1.5) Fiscal Balance / GDP (8.2)** (5.5) (5.3) (4.6) (5.8)
Pakistan Economic Survey 201
136
Table-9.4: Selected Public Debt Indicators (in percentage)
Gross Public Debt / GDP Total Government Debt / GDP Gross Public Debt / Revenue Total Government Debt / RevenueDebt Service / Revenue Interest Service / Revenue Debt Service / GDP *Adjusted for grants ** includes payment for the resolution of the circular debt amounting to
Source: Debt Policy Coordination Office Staff Calculations, Ministry of Finance
The revenue deficit1, which excludes development expenditure, recorded at 0.7 percent of GDP during 2016-17 compared with 0.8 percent during 2015-16. This improvement was supported by higher growth in revenuewhich outpaced growth in current expenditureduring 2016-17. Thus, from expenditure side, fiscal deficit was driven largely by increase in development expenditures and recorded at 5.8 percent of GDP during 2016-17 compared with 4.6 percent during 2015-16. Similarly, the primary deficit2, which excludes interest payments, increased to 1.5 percent of GDP during 2016-17 from 0.2 percent during 201516 owing to the same reason. The consolidated development expenditures increased
__________________________________________
1Revenue balance is the total revenues minus current expenditure. The persistence of revenue deficit indicates that the government is not only borrowing to finance its development expenditure, but partially to finance its current expenditure.
-9.0%
-8.0%
-7.0%
-6.0%
-5.0%
-4.0%
-3.0%
-2.0%
-1.0%
0.0%
2012-13
Fig-9.2: Trends in Fiscal, Revenue and Primary Balance(In percent of GDP)
Pakistan Economic Survey 2017-18
9.4: Selected Public Debt Indicators (in percentage)
2013 2014 2015 64.0 63.5 63.3 60.2 58.1 58.3
480.1 439.7 442.1 Total Government Debt / Revenue 452.1 402.0 406.7
40.5 40.1 40.4 33.2 31.6 33.2 5.4 5.8 5.8
** includes payment for the resolution of the circular debt amounting to Rs 322 billion or 1.4 percent of GDP
Source: Debt Policy Coordination Office Staff Calculations, Ministry of Finance
, which excludes development expenditure, recorded at 0.7
17 compared with 16. This improvement
was supported by higher growth in revenues which outpaced growth in current expenditures
Thus, from expenditure side, fiscal deficit was driven largely by increase in development expenditures and recorded at 5.8
17 compared with 16. Similarly, the
, which excludes interest ments, increased to 1.5 percent of GDP
17 from 0.2 percent during 2015-16 owing to the same reason. The consolidated development expenditures increased
significantly during last few years owing to number of ongoing infrastructure projects. Accordingly, actual PSDP spending at federal level and annual development plan at provincial level cumulatively grew from 2012-13 to Rs 1,577 billion in 2016increase in development expenditures was also supported by relatively contapayments during last few years which created additional fiscal space for development spending. During first half of current fiscal year, revenue deficit was recorded at 0.4 percent of GDP while primary deficit was recorded at 0.1 percent of Gfiscal, revenue and primary balance are depicted in the graph below:
Revenue balance is the total revenues minus current expenditure. The persistence of vernment is not only borrowing to finance its
development expenditure, but partially to finance its current expenditure.
__________________________________________
2Primary balance is the total revenues minus nonbefore interest payments. Primary balance is an indicator of current fiscal efforts since interest payments are predetermined by the size of previous deficits.
2013-14 2014-15 2015-16
9.2: Trends in Fiscal, Revenue and Primary Balance(In percent of GDP)
Fiscal Balance Revenue Balance Primary Balance
2016 2017 67.7 67.0 61.3 61.4
442.5 433.6 400.8 397.7 35.9 38.3 28.4 27.3 5.5 5.9
322 billion or 1.4 percent of GDP
significantly during last few years owing to number of ongoing infrastructure projects.
rdingly, actual PSDP spending at federal level and annual development plan at provincial level cumulatively grew from Rs 695 billion in
1,577 billion in 2016-17. This increase in development expenditures was also supported by relatively contained interest payments during last few years which created additional fiscal space for development
During first half of current fiscal year, revenue deficit was recorded at 0.4 percent of GDP while primary deficit was recorded at 0.1 percent of GDP. The trends in fiscal, revenue and primary balance are depicted in the graph below:
Primary balance is the total revenues minus non-interest expenditure or fiscal deficit ore interest payments. Primary balance is an indicator of current fiscal efforts since
interest payments are predetermined by the size of previous deficits.
2016-17
Primary Balance
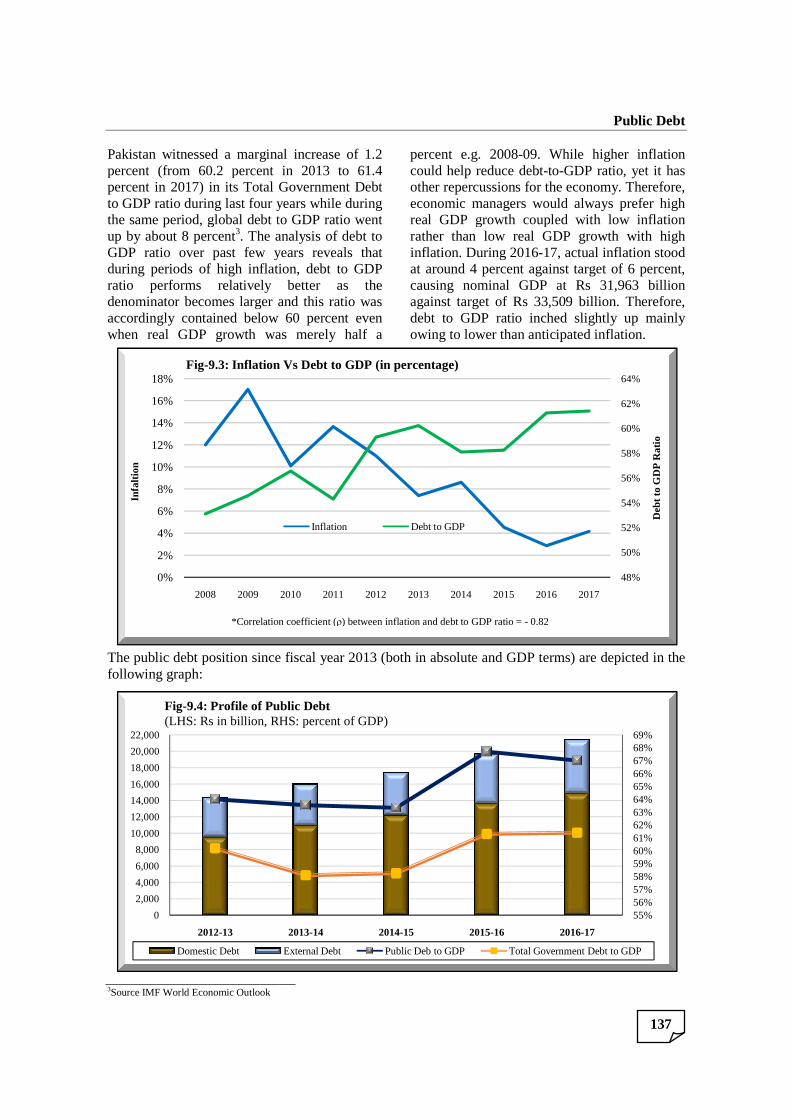
Pakistan witnessed a marginal increase of 1.percent (from 60.2 percent in 2013 to 61.percent in 2017) in its Total Gto GDP ratio during last four years while during the same period, global debt to GDP ratio up by about 8 percent3. The analysis of debt to GDP ratio over past few years reveals that during periods of high inflation, debt ratio performs relatively better as the denominator becomes larger and this ratio accordingly contained below 60 percent even when real GDP growth was merely half a
The public debt position since fiscal year 2013 (both in absolute and GDP terms) are depicted in the following graph:
3Source IMF World Economic Outlook
0%
2%
4%
6%
8%
10%
12%
14%
16%
18%
2008 2009
Infa
ltion
Fig-9.3: Inflation Vs Debt to GDP (in percentage)
0
2,000
4,000
6,000
8,000
10,000
12,000
14,000
16,000
18,000
20,000
22,000
2012-13
Fig-9.4: Profile of Public Debt(LHS: Rs in billion, RHS: percent of GDP)
Domestic Debt
*Correlation coefficient (
Pakistan witnessed a marginal increase of 1.2 percent (from 60.2 percent in 2013 to 61.4
Government Debt to GDP ratio during last four years while during
global debt to GDP ratio went The analysis of debt to
years reveals that flation, debt to GDP
relatively better as the denominator becomes larger and this ratio was
below 60 percent even when real GDP growth was merely half a
percent e.g. 2008-09. While highcould help reduce debt-toother repercussions for the economy. Therefore, economic managers would always prefer high real GDP growth coupled with low inflation rather than low real GDP growth with high inflation. During 2016-17, actual inflation stood at around 4 percent against target of 6 percent, causing nominal GDP at against target of Rs 33,509 billion. Therefore, debt to GDP ratio inched owing to lower than anticipated inflation.
e fiscal year 2013 (both in absolute and GDP terms) are depicted in the
2010 2011 2012 2013 2014 2015 2016
Inflation Vs Debt to GDP (in percentage)
Inflation Debt to GDP
2013-14 2014-15 2015-16
9.4: Profile of Public Debt(LHS: Rs in billion, RHS: percent of GDP)
External Debt Public Deb to GDP Total Government Debt to GDP
*Correlation coefficient (ρ) between inflation and debt to GDP ratio = - 0.82
Public Debt
137
09. While higher inflation to-GDP ratio, yet it has
other repercussions for the economy. Therefore, economic managers would always prefer high real GDP growth coupled with low inflation rather than low real GDP growth with high
17, actual inflation stood around 4 percent against target of 6 percent,
causing nominal GDP at Rs 31,963 billion 33,509 billion. Therefore,
ratio inched slightly up mainly owing to lower than anticipated inflation.
e fiscal year 2013 (both in absolute and GDP terms) are depicted in the
48%
50%
52%
54%
56%
58%
60%
62%
64%
2017
Deb
t to
GD
P R
atio
55%56%57%58%59%60%61%62%63%64%65%66%67%68%69%
2016-17
Total Government Debt to GDP
Pakistan Economic Survey 2017-18
138
The table below shows summary of debt to GDP ratio of few developed and developing economies:
Table-9.5: Country Wise Total Government Debt to GDP Ratio (in percentage)
Country 2013 2014 2015 2016 2017 United States 81.5 80.9 80.5 81.4 82.4
United Kingdom 77.7 79.6 80.4 80.7 80.4
Japan 117.3 118.9 118.3 119.7 119.9
India 68.5 68.5 69.5 69.5 67.7
Srilanka 70.8 70.7 76.0 77.3 79.5
Egypt 73.7 77.1 78.8 88.1 93.6
Pakistan 60.2 58.1 58.3 61.3 61.4
Source: IMF World Economic Outlook It is evident from the table above that developed countries like USA, UK and Japan also carry significant debt and maintain levels as high as 80 to over 100 percent of their GDPs, well over Pakistan’s debt to GDP levels. Even in the developing country peer group, Egypt, Srilanka and India carry higher debt to GDP levels than that of Pakistan.
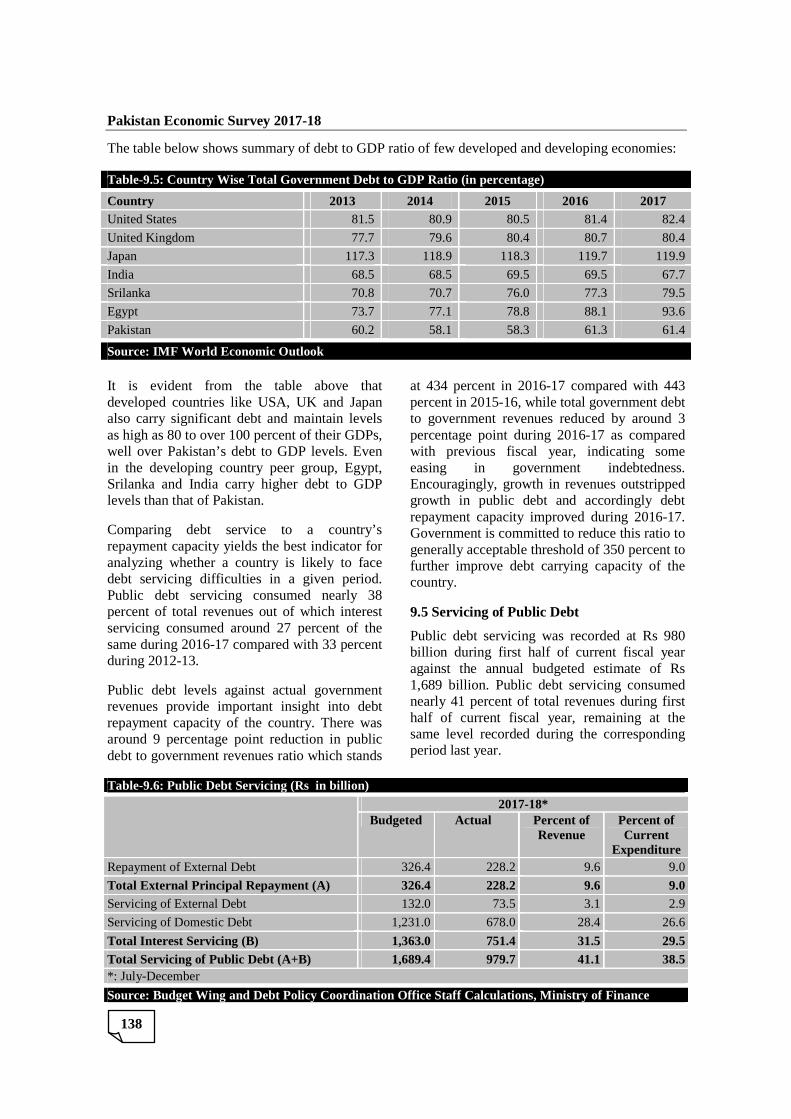
Comparing debt service to a country’s repayment capacity yields the best indicator for analyzing whether a country is likely to face debt servicing difficulties in a given period. Public debt servicing consumed nearly 38 percent of total revenues out of which interest servicing consumed around 27 percent of the same during 2016-17 compared with 33 percent during 2012-13.
Public debt levels against actual government revenues provide important insight into debt repayment capacity of the country. There was around 9 percentage point reduction in public debt to government revenues ratio which stands
at 434 percent in 2016-17 compared with 443 percent in 2015-16, while total government debt to government revenues reduced by around 3 percentage point during 2016-17 as compared with previous fiscal year, indicating some easing in government indebtedness. Encouragingly, growth in revenues outstripped growth in public debt and accordingly debt repayment capacity improved during 2016-17. Government is committed to reduce this ratio to generally acceptable threshold of 350 percent to further improve debt carrying capacity of the country.
9.5 Servicing of Public Debt
Public debt servicing was recorded at Rs 980 billion during first half of current fiscal year against the annual budgeted estimate of Rs 1,689 billion. Public debt servicing consumed nearly 41 percent of total revenues during first half of current fiscal year, remaining at the same level recorded during the corresponding period last year.
Table-9.6: Public Debt Servicing (Rs in billion)
2017-18* Budgeted Actual Percent of
Revenue Percent of Current
Expenditure Repayment of External Debt 326.4 228.2 9.6 9.0
Total External Principal Repayment (A) 326.4 228.2 9.6 9.0 Servicing of External Debt 132.0 73.5 3.1 2.9
Servicing of Domestic Debt 1,231.0 678.0 28.4 26.6
Total Interest Servicing (B) 1,363.0 751.4 31.5 29.5 Total Servicing of Public Debt (A+B) 1,689.4 979.7 41.1 38.5 *: July-December
Source: Budget Wing and Debt Policy Coordination Office Staff Calculations, Ministry of Finance
Domestic interest payments constituted around 69 percent of total debt servicing due to higher volume of domestic debt in portfolio. Domestic interest payments were recorded at Rs 678 billion during the current fiscal year primarily payments made against Pakistan Investment Bonds (Rs 229 billion), National Savings Schemes (Rs 169 billion), Bills (Rs 151 billion) and Market Related Treasury Bills (Rs 87 billion).
9.6 Domestic Debt
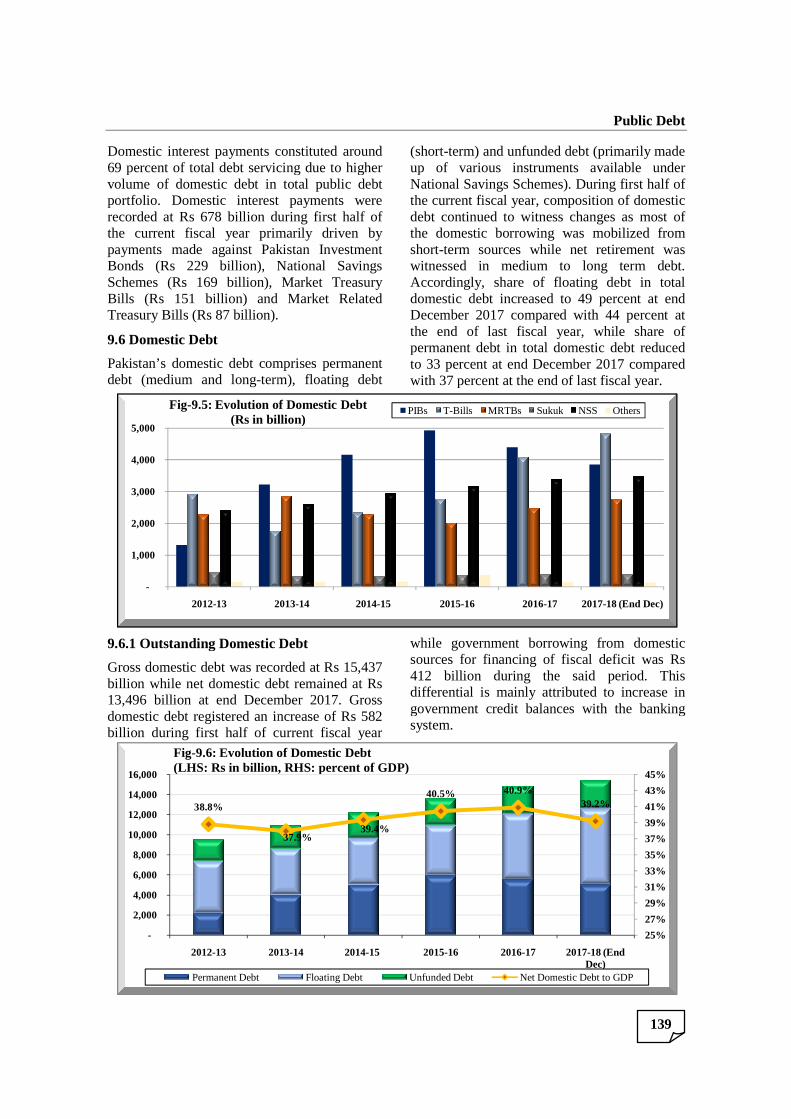
Pakistan’s domestic debt comprises permanent debt (medium and long-term), floating debt
9.6.1 Outstanding Domestic Debt
Gross domestic debt was recorded at billion while net domestic debt 13,496 billion at end December 2017domestic debt registered an increase of billion during first half of current fiscal year
-
1,000
2,000
3,000
4,000
5,000
2012-13 2013
Fig-9.5: Evolution of Domestic Debt(Rs in billion)
38.8%
-
2,000
4,000
6,000
8,000
10,000
12,000
14,000
16,000
2012-13 2013
Fig-9.6: Evolution of Domestic Debt(LHS: Rs in billion, RHS: percent of GDP)
Permanent Debt
Domestic interest payments constituted around percent of total debt servicing due to higher
volume of domestic debt in total public debt portfolio. Domestic interest payments were
billion during first half of primarily driven by Pakistan Investment
billion), National Savings billion), Market Treasury
billion) and Market Related billion).
akistan’s domestic debt comprises permanent term), floating debt
(short-term) and unfunded debt (primarily made up of various instruments available under National Savings Schemes). the current fiscal year, composidebt continued to witnessthe domestic borrowing was mobilized short-term sources while net retirement was witnessed in medium to long term debt. Accordingly, share of floating debt in total domestic debt increased December 2017 compared with 44 percent at the end of last fiscal yearpermanent debt in total domestic debt to 33 percent at end December 2017 compared with 37 percent at the end of last fiscal year.
utstanding Domestic Debt
recorded at Rs 15,437 billion while net domestic debt remained at Rs
billion at end December 2017. Gross an increase of Rs 582
first half of current fiscal year
while government borrowing from domestic sources for financing of fiscal deficit was 412 billion during the said period. Thisdifferential is mainly attributed to increase in government credit balances with the banking system.
2013-14 2014-15 2015-16 2016-17
9.5: Evolution of Domestic Debt(Rs in billion)
PIBs T-Bills MRTBs Sukuk
37.9%39.4%
40.5% 40.9%
2013-14 2014-15 2015-16 2016-17
9.6: Evolution of Domestic Debt(LHS: Rs in billion, RHS: percent of GDP)
Floating Debt Unfunded Debt Net Domestic Debt to GDP
Public Debt
139
term) and unfunded debt (primarily made up of various instruments available under National Savings Schemes). During first half of
composition of domestic continued to witness changes as most of
domestic borrowing was mobilized from while net retirement was
witnessed in medium to long term debt. Accordingly, share of floating debt in total domestic debt increased to 49 percent at end December 2017 compared with 44 percent at
end of last fiscal year, while share of permanent debt in total domestic debt reduced to 33 percent at end December 2017 compared with 37 percent at the end of last fiscal year.
while government borrowing from domestic sources for financing of fiscal deficit was Rs
during the said period. This differential is mainly attributed to increase in government credit balances with the banking
17 2017-18 (End Dec)
Sukuk NSS Others
39.2%
25%
27%
29%
31%
33%
35%
37%
39%
41%
43%
45%
2017-18 (End Dec)
Net Domestic Debt to GDP

Pakistan Economic Survey 201
140
The following section highlights the developments in various components of domestic debt during first six months of current fiscal year:
I. Permanent Debt
Permanent debt mainly consists of medium to long term instruments (Pakistan Investment Bonds (PIBs), Government Ijara SuPrize Bond etc.). PIBs are noninstruments with fixed and semipayment with tenors of 3, 5, 10 and 20 years. Whereas, Government Ijara Sukuk are medium term Shariah compliant bonds currently issued in 3 years’ tenor to raise money from Islamic financial institutions which have grown substantially in Pakistan in the
Permanent debt was recorded at billion at end December 2017, representing a
As depicted in the graph above, against the target of Rs 500 billion, government received participation of Rs 162 billion government accepted only Rs
-
20
40
60
80
100
120
Rs
billi
on
Auction Target (Rs. in billion)
Auction Participation (Rs. in billion)
Amount Accepted (Rs. in billion)
Fig
Pakistan Economic Survey 2017-18
on highlights the developments in various components of
six months of current
Permanent debt mainly consists of medium to (Pakistan Investment
, Government Ijara Sukuk (GIS), . PIBs are non-callable
instruments with fixed and semi-annual coupon tenors of 3, 5, 10 and 20 years.
Government Ijara Sukuk are medium term Shariah compliant bonds currently issued
se money from Islamic financial institutions which have grown
the past few years.
was recorded at Rs 5,038 billion at end December 2017, representing a
decrease of Rs 495 billion ongoing fiscal year. Over this period, the government set the auction billion against the sale of PIBs in anticipation of upcoming maturities. These attracted subdued response participants as the market was expecting monetary tightening, however, premained unchanged during the said period i.e. except for July 2017, all bids received against PIBs auctions during first half fiscal year were rejected as the rates quoted by commercial banks were on a higher sias amounts were not substantial. Any acceptance in these PIBs auctions may have signaled reversal in long term interest rates, which, in turn, would have had implications for the market’s short term expectations.
n the graph above, against the 500 billion, government received
162 billion out of which Rs 56 billion during
first half of the current fiscal year. The months T-bills, 3, 5 and 10 year PIJuly 2013 to December 2017 are depicted through following Graph:
Jul-17 Aug-17 Sep-17 Oct-17 Nov
100 100 100 100 50
76 25 6 25 24
56 - - -
Fig-9.7: PIBs Auction Profile 2017-18 (July -December)
495 billion during first half of Over this period, the
set the auction target of Rs 500 billion against the sale of PIBs in anticipation of upcoming maturities. These auctions
subdued response from market the market was expecting
tening, however, policy rate during the said period i.e.
ll bids received against first half of the ongoing
were rejected as the rates quoted by commercial banks were on a higher side as well
amounts were not substantial. Any acceptance in these PIBs auctions may have signaled reversal in long term interest rates, which, in turn, would have had implications for the market’s short term interest rate
current fiscal year. The yields (6 bills, 3, 5 and 10 year PIBs) from
to December 2017 are depicted
Nov-17 Dec-17
50 50
24 6
- -
December)

II. Floating Debt
Floating debt comprises short term domestic borrowing instruments such as Market Treasury Bills (MTBs) and State Bank borrowing through purchase of Market RelaBills (MRTBs). MTBs are zero coupon or discounted instruments issued in tenors of 3 months (introduced in 1997), 6 months (introduced in 1990) and 12 months (introduced in 1997). In order to raise short term liquidity, the government borrows from the domestic banks through auction of MTBsarranged by SBP twice a month.
Floating debt recorded an increase of billion during first half of current fiscal year and stood at Rs 7,589 billion at end December 2017. The increase in floating debt was higher than the overall change in domestic debt as the government retired medium to longduring first half of current fiscal year. The share
5.5 6.0 6.5 7.0 7.5 8.0 8.5 9.0 9.5
10.0 10.5 11.0 11.5 12.0 12.5 13.0 13.5 14.0
Jul 1
3A
ug 1
3S
ep 1
3N
ov 1
3D
ec 1
3Ja
n 13
Feb
14
Mar
14
Apr
14
May
14
Jun
14Ju
l 14
Fig-9.8: T-Bills PIBs Yields (6 Months, 3, 5 & 10 Years)
0
500
1,000
1,500
2,000
2,500
Rs
bilio
n
Auction Target (Rs. in billion)
Auction Participation (Rs. in billion)
Amount Accepted (Rs. in billion)
6 month T-Bill Yield (%)
Fig
Floating debt comprises short term domestic borrowing instruments such as Market Treasury Bills (MTBs) and State Bank borrowing through purchase of Market Related Treasury Bills (MRTBs). MTBs are zero coupon or discounted instruments issued in tenors of 3 months (introduced in 1997), 6 months (introduced in 1990) and 12 months (introduced in 1997). In order to raise short term liquidity,
rom the domestic banks through auction of MTBs which is arranged by SBP twice a month.
Floating debt recorded an increase of Rs 1,032 billion during first half of current fiscal year
7,589 billion at end December ting debt was higher
than the overall change in domestic debt as the government retired medium to long-term debt during first half of current fiscal year. The share
of floating debt in overall public debt and domestic debt stood at 33 percent and 49 percent respectively at end December 2017 while it was 36 percent and 55 percent respectively at the end of 2012
The interest rate cycle exhibited some reversal after bottoming out of policy rates and flattening of the yield curve which led the banks to reduce the duration of their fixed income portfolio to contain the effects of repricing risk while keeping intacpreference to invest at higher ratebanks opted to tilt their portfolio towards short term MTBs. Government received significanparticipation of Rs 9,288 billion in the auctions of MTBs against the target of however, the government mobilized billion. The auction wise details and relevant ratios related to MTBs are depicted through following graphs:
Jul 1
4A
ug 1
4S
ep 1
4O
ct 1
4N
ov 1
4D
ec 1
4Ja
n 15
Feb
15
Mar
15
Apr
15
May
15
Jun
15Ju
l 15
Aug
15
Sep
15
Oct
15
Nov
15
Dec
15
Jan
16F
eb 1
6M
ar 1
6A
rp 1
6M
ay 1
6Ju
n 16
Jul 1
6A
ug 1
6S
ep 1
6O
ct 1
6N
ov 1
6D
ec 1
6Ja
n 17
Bills PIBs Yields (6 Months, 3, 5 & 10 Years) - In Percent
10 Years Yield 5 Years Yield 3 Years Yield
Jul-17 Aug-17 Sep-17 Oct-17 Nov-17
1,300 1,550 1,050 1,300 1,200
1,747 1,981 896 1,924 1,916
1,646 1,902 858 1,554 1,335
5.82 5.90 5.90 5.90 5.94
Fig-9.9: T-Bills Auction Profile 2017-18 (July-December)
Public Debt
141
of floating debt in overall public debt and domestic debt stood at 33 percent and 49
t respectively at end December 2017 while it was 36 percent and 55 percent respectively at the end of 2012-13.
The interest rate cycle exhibited some reversal after bottoming out of policy rates and flattening of the yield curve which led the
ce the duration of their fixed income portfolio to contain the effects of repricing risk while keeping intact their
at higher rates. Therefore, banks opted to tilt their portfolio towards short term MTBs. Government received significant
9,288 billion in the auctions of MTBs against the target of Rs 7,500 billion, however, the government mobilized Rs 8,007 billion. The auction wise details and relevant ratios related to MTBs are depicted through
Jan
17F
eb 1
7M
ar 1
7A
pr-1
7M
ay-1
7Ju
n-17
Jul-
17A
ug-1
7S
ep-1
7O
ct-1
7N
ov-1
7D
ec-1
7
10 Years Yield 5 Years Yield 3 Years Yield
5.5
5.7
5.9
6.1
6.3
6.5
6.7
6.9
perc
enta
ge
17 Dec-17
1,100
825
712
5.98
December)
Pakistan Economic Survey 201
142
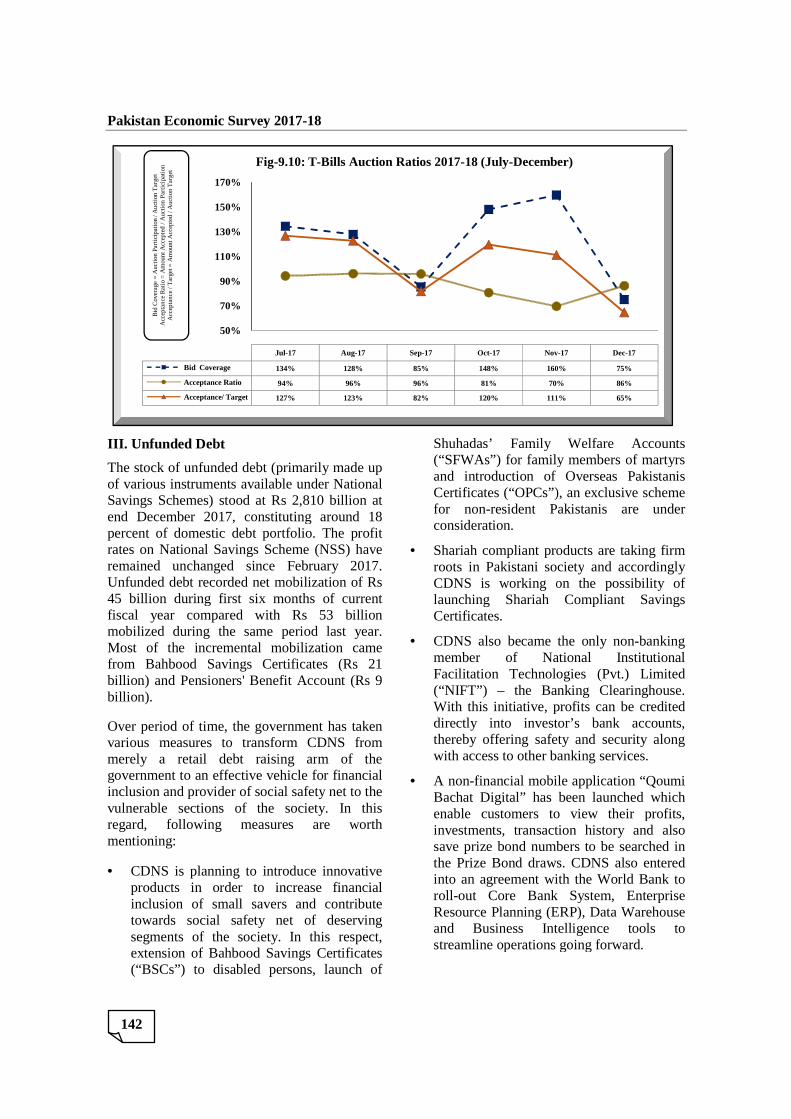
III. Unfunded Debt
The stock of unfunded debt (primarily made up of various instruments available under National Savings Schemes) stood at Rs end December 2017, constituting percent of domestic debt portfolio. The profit rates on National Savings Scheme (NSS) have remained unchanged since February 2017. Unfunded debt recorded net mobilization of 45 billion during first six months of current fiscal year compared with mobilized during the same period last year. Most of the incremental mobilization came from Bahbood Savings Certificates (billion) and Pensioners' Benefit Account (billion).
Over period of time, the government has taken various measures to transform CDNS from merely a retail debt raising argovernment to an effective vehicle for financial inclusion and provider of social vulnerable sections of the society. In this regard, following measures are worth mentioning:
• CDNS is planning to introduce innovative products in order to increase financial inclusion of small savers and contribute towards social safety net of deserving segments of the society. In this respect, extension of Bahbood Savings Certificates (“BSCs”) to disabled persons, launch of
50%
70%
90%
110%
130%
150%
170%
Jul
Bid Coverage 134%
Acceptance Ratio 94%
Acceptance/ Target 127%
Fig-9.10: TB
id C
over
age
= A
uctio
n P
art
icip
atio
n /
Au
ctio
n T
arg
et
Acc
epta
nce
Ra
tio =
Am
oun
t Acc
epte
d /
Auc
tion
Pa
rtic
ipa
tion
Acc
epta
nce
/ T
arge
t = A
mou
nt A
ccep
ted
/ A
uctio
n T
ar
get
Pakistan Economic Survey 2017-18
The stock of unfunded debt (primarily made up of various instruments available under National
Rs 2,810 billion at constituting around 18
portfolio. The profit on National Savings Scheme (NSS) have
remained unchanged since February 2017. et mobilization of Rs
45 billion during first six months of current fiscal year compared with Rs 53 billion mobilized during the same period last year.
st of the incremental mobilization came Certificates (Rs 21
billion) and Pensioners' Benefit Account (Rs 9
government has taken various measures to transform CDNS from merely a retail debt raising arm of the government to an effective vehicle for financial inclusion and provider of social safety net to the vulnerable sections of the society. In this regard, following measures are worth
CDNS is planning to introduce innovative order to increase financial
inclusion of small savers and contribute towards social safety net of deserving segments of the society. In this respect, extension of Bahbood Savings Certificates (“BSCs”) to disabled persons, launch of
Shuhadas’ Family Welfare(“SFWAs”) for family members of martyrs and introduction of Overseas Pakistanis Certificates (“OPCs”), an exclusive scheme for non-resident Pakistanis are under consideration.
• Shariah compliant products are taking firm roots in Pakistani societyCDNS is working on the possibility of launching Shariah Compliant Savings Certificates.
• CDNS also became the only nonmember of National Institutional Facilitation Technologies (Pvt.) Limited (“NIFT”) – the Banking Clearinghouse. With this initiative, profits can be credited directly into investor’s bank accounts, thereby offering safety and security along with access to other banking services.
• A non-financial mobile application “Qoumi Bachat Digital” has been launched which enable customers to view their profits, investments, transaction history and also save prize bond numbers to be searched in the Prize Bond draws. CDNS also entered into an agreement with the World Bank to roll-out Core Bank System, Enterprise Resource Planning (ERP), Data Warehouse and Business Intelligence tools to streamline operations going forward.
Jul-17 Aug-17 Sep-17 Oct-17 Nov
134% 128% 85% 148% 160%
94% 96% 96% 81% 70%
127% 123% 82% 120% 111%
9.10: T-Bills Auction Ratios 2017-18 (July-December)
Shuhadas’ Family Welfare Accounts (“SFWAs”) for family members of martyrs and introduction of Overseas Pakistanis Certificates (“OPCs”), an exclusive scheme
resident Pakistanis are under
Shariah compliant products are taking firm roots in Pakistani society and accordingly CDNS is working on the possibility of launching Shariah Compliant Savings
CDNS also became the only non-banking member of National Institutional Facilitation Technologies (Pvt.) Limited
the Banking Clearinghouse. With this initiative, profits can be credited directly into investor’s bank accounts, thereby offering safety and security along with access to other banking services.
financial mobile application “Qoumi Bachat Digital” has been launched which
customers to view their profits, investments, transaction history and also save prize bond numbers to be searched in the Prize Bond draws. CDNS also entered into an agreement with the World Bank to
out Core Bank System, Enterprise ERP), Data Warehouse
and Business Intelligence tools to streamline operations going forward.
Nov-17 Dec-17
160% 75%
70% 86%
111% 65%
December)

Public Debt
143
Table-9.7: Outstanding Domestic Debt (Rs billion) 2013 2014 2015 2016 2017(P) 2018(P) * Permanent Debt 2,179.2 4,005.3 5,016.0 5,944.2 5,533.1 5,038.0 Market Loans 2.9 2.9 2.8 2.8 2.8 2.8 Government Bonds 0.7 0.7 0.7 0.7 0.7 0.7 Prize Bonds 389.6 446.6 522.5 646.4 747.1 792.7 Foreign Exchange Bearer Certificates 0.1 0.1 0.1 0.1 0.1 0.1 Bearer National Fund Bonds 0.0 0.0 0.0 0.0 0.0 0.0 Federal Investment Bonds 0.0 0.0 0.0 0.0 0.0 0.0 Special National Fund Bonds 0.0 0.0 0.0 0.0 0.0 0.0 Foreign Currency Bearer Certificates 0.0 0.0 0.0 0.0 0.0 0.0 U.S. Dollar Bearer Certificates 0.0 0.0 0.1 0.1 0.1 0.1 Special U.S. Dollar Bonds 4.2 4.4 4.4 4.5 4.5 4.7 Government Bonds Issued to SLIC 0.6 0.6 0.6 0.6 0.6 0.6 Pakistan Investment Bonds (PIBs) 1,321.8 3,223.5 4,158.3 4,925.0 4,391.8 3,850.8 GOP Ijara Sukuk 459.2 326.4 326.4 363.9 385.4 385.4 Floating Debt 5,196.2 4,610.9 4,612.6 5,001.8 6,556.6 7,589.1 Treasury Bills through Auction 2,921.0 1,758.6 2,331.3 2,771.6 4,087.7 4,829.7 Rollover of Treasury Bills discounted SBP 0.5 0.5 0.5 0.5 0.5 0.5 Market Related Treasury Bills (MRTBs) 2,274.7 2,851.8 2,280.9 2,017.1 2,468.4 2,551.6 Outright Sale of MRTBs to Banks - - - - - 207.3 Bai Muajjal - - - 212.6 - - Unfunded Debt 2,146.5 2,303.8 2,570.3 2,680.9 2,765.3 2,810.4 Defence Savings Certificates 271.7 284.6 300.8 308.9 325.5 331.6 Khas Deposit Certificates and Accounts 0.6 0.6 0.6 0.6 0.5 0.5 National Deposit Certificates 0.0 0.0 0.0 0.0 0.0 0.0 Savings Accounts 22.3 22.6 26.4 29.2 34.9 35.9 Mahana Amdani Account 2.0 1.9 1.8 1.8 1.7 1.7 Postal Life Insurance 67.1 67.1 67.1 67.1 45.8 46.1 Special Savings Certificates and Accounts 734.6 738.8 867.5 896.5 922.4 926.3 Regular Income Scheme 262.6 325.4 376.0 359.8 338.8 343.9 Pensioners' Benefit Account 179.9 198.4 214.1 234.7 253.4 262.7 Bahbood Savings Certificates 528.4 582.4 628.3 692.1 749.5 770.7 National Savings Bonds 0.2 0.2 0.1 0.1 0.1 0.1 G.P. Fund 73.1 80.5 85.8 88.3 88.8 87.2 Short Term Savings Certificates 4.0 1.3 1.7 1.9 3.7 3.6 Total Domestic Debt 9,521.9 10,920.0 12,198.9 13,626.9 14,855.0 15,437.4 P: Provisional, *end-December, 2017
Source: Budget Wing, Finance Division and State Bank of Pakistan 9.6.2 Secondary Market Activities in the Marketable Government Securities:
Pakistan has a mature and vibrant secondary market for marketable government debt securities. During first eight months of 2017-18, the secondary market trading volumes witnessed significant increase. Overall, trading volume of government securities was Rs 18,612 billion during July-February, 2017-18 as against Rs 14,779 billion during complete year
in 2016-17. Consequently, average daily trading volume increased to Rs 113 billion in July-February 2017-18 from Rs 60 billion in 2016-17. Accordingly, the turnover ratio also surged to 2.01 in 2017-18 (July-February) from 1.64 in 2016-17. The significant increase in secondary market trading volumes and turnover ratio is explained primarily by higher issuances of liquid 03-months MTBs and lower issuances of PIBs and GIS, which exhibits greater buy-and-hold behavior of long-horizon investors.
Pakistan Economic Survey 201
144
Table 9.8: Secondary Market Trading Volumes
Government Security
Treasury Bill - 3 Months Treasury Bill - 6 Months Treasury Bill - 12 Months Sub Total Pakistan Investment Bonds - 3 YearsPakistan Investment Bonds - 5 YearsPakistan Investment Bonds - 10 YearsPakistan Investment Bonds - 15 YearsPakistan Investment Bonds - 20 YearsSub Total Government Ijara Sukuk Grand Total Daily Average volume End Period Stock Turnover ratio
Source: State Bank of Pakistan
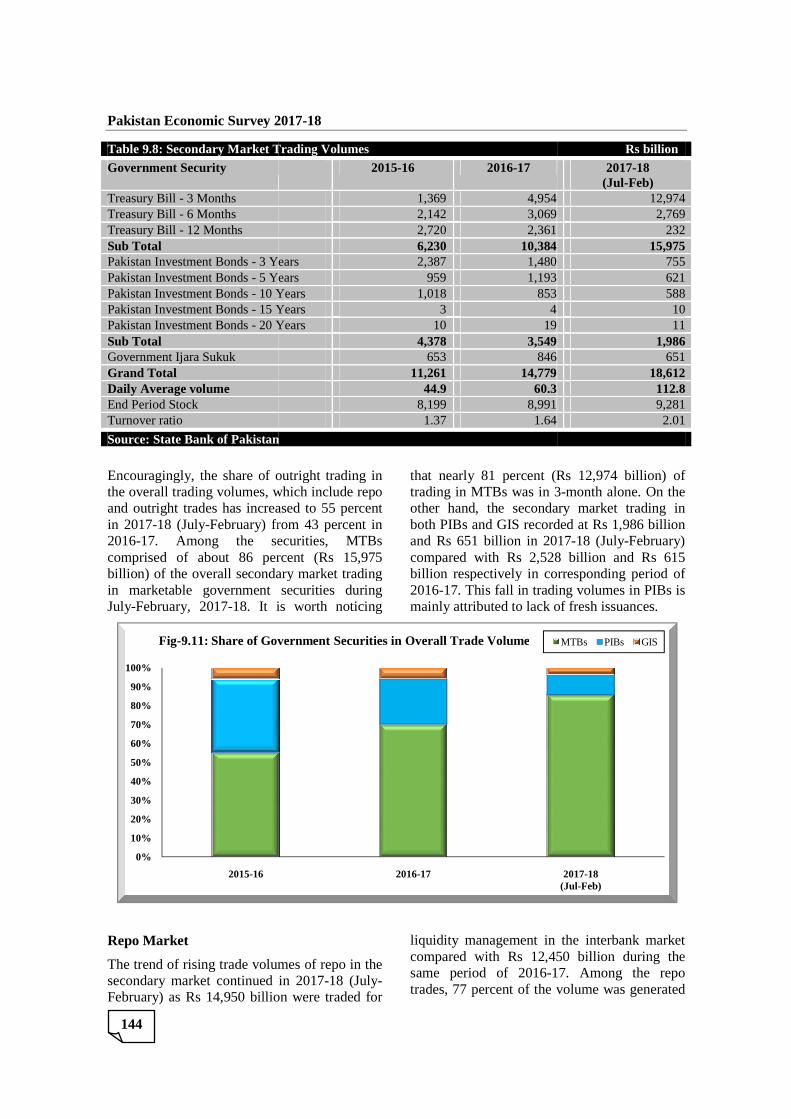
Encouragingly, the share of outright trading in the overall trading volumes, which include repo and outright trades has increased to 55 percent in 2017-18 (July-February) from 43 percent in 2016-17. Among the securities, MTBscomprised of about 86 percentbillion) of the overall secondary market trading in marketable government securities during July-February, 2017-18. It i
Repo Market
The trend of rising trade volumes of repo in the secondary market continued in February) as Rs 14,950 billion
0%
10%
20%
30%
40%
50%
60%
70%
80%
90%
100%
2015-16
Fig-9.11: Share of Government Securities in Overall Trade Volume
Pakistan Economic Survey 2017-18
Table 9.8: Secondary Market Trading Volumes
2015-16 2016-17
1,369 4,954 2,142 3,069 2,720 2,361 6,230 10,384
3 Years 2,387 1,480 5 Years 959 1,193 10 Years 1,018 853 15 Years 3 4 20 Years 10 19
4,378 3,549 653 846
11,261 14,779 44.9 60.3
8,199 8,991 1.37 1.64
Source: State Bank of Pakistan
ncouragingly, the share of outright trading in the overall trading volumes, which include repo
has increased to 55 percent ) from 43 percent in
Among the securities, MTBs comprised of about 86 percent (Rs 15,975 billion) of the overall secondary market trading in marketable government securities during
18. It is worth noticing
that nearly 81 percent (Rs trading in MTBs was in 3other hand, the secondary market trading in both PIBs and GIS recorded at and Rs 651 billion in 2017compared with Rs 2,528 billion and billion respectively in corre2016-17. This fall in trading volumes in PIBmainly attributed to lack of fresh issuances.
The trend of rising trade volumes of repo in the secondary market continued in 2017-18 (July-
14,950 billion were traded for
liquidity management in the interbank market compared with Rs 12,450 billion same period of 2016-17. Among the repo trades, 77 percent of the volume was generated
2016-17
9.11: Share of Government Securities in Overall Trade Volume
Rs billion
2017-18 (Jul-Feb)
12,974 2,769 232
10,384 15,975 755 621 588 10 11 1,986 651
14,779 18,612 112.8
8,991 9,281 2.01
Rs 12,974 billion) of trading in MTBs was in 3-month alone. On the
secondary market trading in recorded at Rs 1,986 billion
2017-18 (July-February) 2,528 billion and Rs 615
billion respectively in corresponding period of 17. This fall in trading volumes in PIBs is
mainly attributed to lack of fresh issuances.
liquidity management in the interbank market 12,450 billion during the
17. Among the repo of the volume was generated
2017-18(Jul-Feb)
MTBs PIBs GIS
in the overnight repo market. The significantly large trade volumes and high liquidity in the repo market for government securities mean
Table 9.9: Government Securities Based Transactions
Type Volumes ( PKR billion)2015-16 2016
Repo 13,469 Outright 11,261 Total 24,730 *The table provides full year data for 2016traded in repo market.
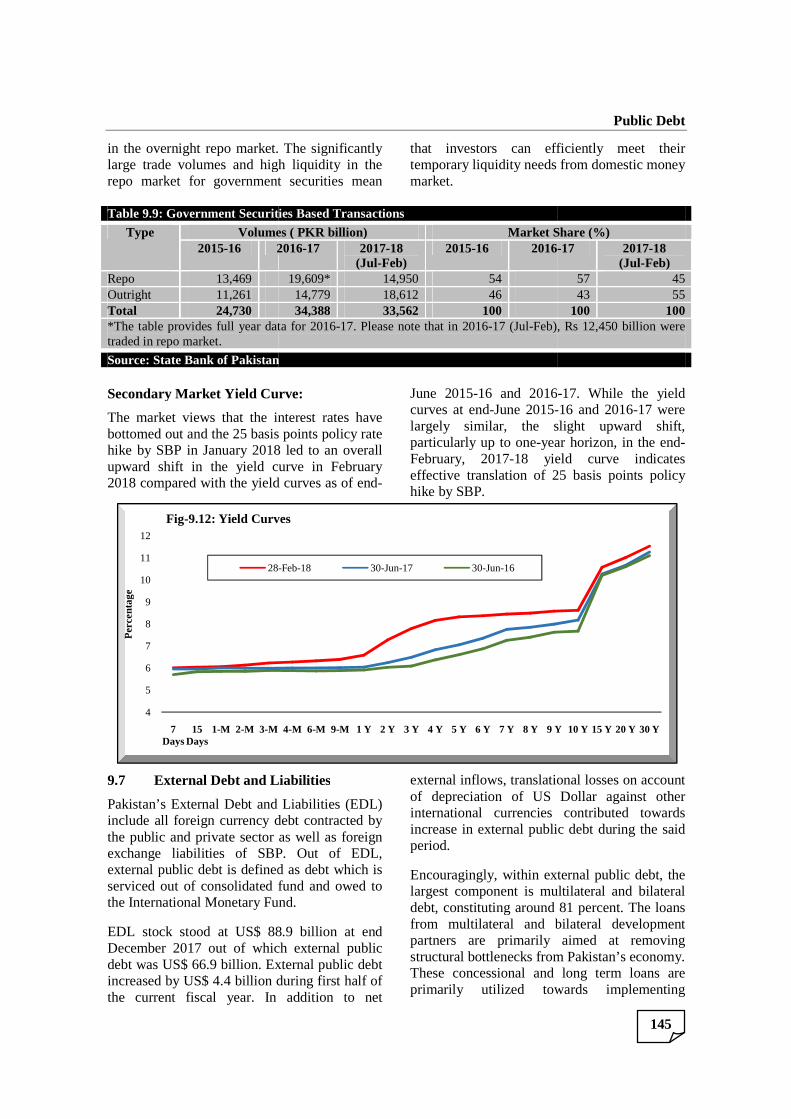
Source: State Bank of Pakistan Secondary Market Yield Curve:
The market views that the interest rates have bottomed out and the 25 basis points policy rate hike by SBP in January 2018 led to an overall upward shift in the yield curve in February 2018 compared with the yield curves as of end
9.7 External Debt and Liabilities
Pakistan’s External Debt and Liabilities (EDL) include all foreign currency debtthe public and private sector as well as foreign exchange liabilities of SBP. Out of EDL, external public debt is defined as debt which is serviced out of consolidated fund and owed to the International Monetary Fund.
EDL stock stood at US$ 88.9 billion at end December 2017 out of which external public debt was US$ 66.9 billion. External public debt increased by US$ 4.4 billion during first half of the current fiscal year. In addition to ne
4
5
6
7
8
9
10
11
12
7 Days
15 Days
1-M 2-M 3-M
Per
cent
age
Fig-9.12: Yield Curves
28-
in the overnight repo market. The significantly s and high liquidity in the
repo market for government securities mean
that investors can efficiently meet their temporary liquidity needs from domestic money market.
Table 9.9: Government Securities Based Transactions
Volumes ( PKR billion) Market Share (%)2016-17 2017-18
(Jul-Feb) 2015-16 2016
19,609* 14,950 54 14,779 18,612 46 34,388 33,562 100
*The table provides full year data for 2016-17. Please note that in 2016-17 (Jul-Feb), Rs
Source: State Bank of Pakistan
Secondary Market Yield Curve:
The market views that the interest rates have bottomed out and the 25 basis points policy rate
ry 2018 led to an overall upward shift in the yield curve in February 2018 compared with the yield curves as of end-
June 2015-16 and 2016curves at end-June 2015-largely similar, the slight upward shift, particularly up to one-year horizon, in the endFebruary, 2017-18 yield curve indicates effective translation of 25 basis points policy hike by SBP.
External Debt and Liabilities
Pakistan’s External Debt and Liabilities (EDL) include all foreign currency debt contracted by the public and private sector as well as foreign exchange liabilities of SBP. Out of EDL, external public debt is defined as debt which is serviced out of consolidated fund and owed to the International Monetary Fund.
88.9 billion at end December 2017 out of which external public debt was US$ 66.9 billion. External public debt increased by US$ 4.4 billion during first half of
In addition to net
external inflows, translational losses on account of depreciation of US Dollar against other international currencies contributed toincrease in external public debt during period.
Encouragingly, within external public debt, the largest component is multilateral and bilateral debt, constituting around 81 percent. The loans from multilateral and bilateral development partners are primarily aimed at removing structural bottlenecks from Pakistan’s economy. These concessional and long term primarily utilized towards implementing
4-M 6-M 9-M 1 Y 2 Y 3 Y 4 Y 5 Y 6 Y 7 Y 8 Y 9 Y
9.12: Yield Curves
-Feb-18 30-Jun-17 30-Jun-16
Public Debt
145
that investors can efficiently meet their temporary liquidity needs from domestic money
Share (%) -17 2017-18
(Jul-Feb) 57 45 43 55
100 100 Feb), Rs 12,450 billion were
16 and 2016-17. While the yield -16 and 2016-17 were
largely similar, the slight upward shift, year horizon, in the end-
18 yield curve indicates effective translation of 25 basis points policy
external inflows, translational losses on account of depreciation of US Dollar against other international currencies contributed towards increase in external public debt during the said
Encouragingly, within external public debt, the largest component is multilateral and bilateral
ting around 81 percent. The loans from multilateral and bilateral development partners are primarily aimed at removing structural bottlenecks from Pakistan’s economy.
and long term loans are primarily utilized towards implementing
9 Y 10 Y 15 Y 20 Y 30 Y

Pakistan Economic Survey 2017-18
146
structural reforms in areas of energy, taxation, doing business, trade facilitation, education and promotion of small and medium enterprises (SMEs). Such concessional lending programs are instrumental in enhancing Pakistan’s
potential output by promoting efficiency and productivity. These development loans are, thus, simultaneously adding to the debt repayment capacity of the country.
Table-9.10: Pakistan External Debt and Liabilities (US Dollar in billion) 2013 2014 2015 2016 2017
(P) 2018 (P)*
PUBLIC EXTERNAL DEBT 1. Public Debt (i+ii+iii)** 48.1 51.3 50.9 57.7 62.5 66.9 i). Medium and Long Term(>1 year) 43.5 47.7 45.8 50.0 55.5 59.4 Paris Club 13.5 13.6 11.7 12.7 12.0 11.9 Multilateral 24.2 25.8 24.3 26.4 27.6 27.9 Other Bilateral 2.9 3.4 3.9 4.4 5.8 6.5 Euro Bonds/Saindak Bonds 1.6 3.6 4.6 4.6 4.8 7.3 Military Debt 0.1 0.0 - - - - Commercial Loans/Credits - 0.2 0.3 0.9 4.8 5.3 Local Currency Bonds** 0.0 0.0 0.0 0.0 - - Saudi Fund for Development 0.2 0.1 0.1 0.1 0.0 0.0 SAFE China Deposits 1.0 1.0 1.0 1.0 0.5 0.5 NBP/BOC Deposits - - - - - - ii). Short Term (<1 year) 0.3 0.7 1.0 1.7 0.9 1.2 Commercial Loans/Credits - 0.2 - 0.6 - 0.3 Multilateral 0.3 0.4 1.0 1.1 0.8 0.9 Local Currency Securities** 0.0 0.1 0.0 0.0 0.1 - iii). IMF 4.4 3.0 4.1 6.0 6.1 6.3 of which Central Government 1.5 0.7 0.1 - - - Monetary Authorities 2.9 2.4 4.1 6.0 6.1 6.3
PUBLICLY GUARANTEED DEBT 2) Publicly Guaranteed Debt 0.6 0.5 1.0 1.3 1.2 1.4 i). Medium and Long Term(>1 year) 0.6 0.5 1.0 1.3 1.2 1.4 Paris Club - - - - - - Multilateral 0.0 0.0 0.0 0.0 0.0 0.0 Other Bilateral 0.6 0.5 1.0 1.3 1.2 1.2 Commercial Loans/Credits - - - - - 0.2 Saindak Bonds - - - - - - ii). Short Term (<1 year) - - - - - -
NON PUBLIC DEBT 3. Private Sector Debt 3.1 3.1 3.0 4.1 6.5 7.2 4. Public Sector Enterprises (PSEs Debt) 1.2 1.5 1.5 1.5 1.5 1.5 5. Banks 1.6 2.0 2.3 2.7 4.5 4.7 Borrowing 0.7 1.1 1.3 1.6 3.3 3.5 Non-resident Deposits (LCY & FCY) 0.8 0.9 1.0 1.1 1.2 1.2 6. Debt liabilities to direct investors - intercompany debt 3.1 3.4 2.7 3.0 3.3 3.5 Total External Debt (1 through 6) 57.8 62.0 61.5 70.3 79.5 85.2
FOREIGN EXCHANGE LIABILITIES 7. Foreign Exchange Liabilities 3.1 3.3 3.7 3.6 3.6 3.7 Total External Debt & Liabilities (1 through 7) 60.9 65.3 65.2 73.9 83.1 88.9 P: Provisional *end-December, 2017 **excluding local currency bonds/securities since they are already included in domestic debt
Source: Economic Affairs Division &State Bank of Pakistan Gross external loan disbursements recorded at US $5,692 million during first half of the current fiscal year, registered an increase of 44 percent compared with corresponding period of last year. The details of gross external inflows
from main creditors during first half of 2017-18 are as follows:
• Disbursements from multilateral and bilateral development partners were US$

2,028 million. Within multilateral loans, inflows were largely for the purpose of energy and infrastructure projects while inflows from bilateral loans were mainly received from China against CPEC projects.
• Government raised US$ 2,500
Table-9.11: Creditor Wise Disbursements Details (July
Financing Source Donor
Multilateral Islamic Development BankAsian DevelopmInternational Development AssociationInternational Bank for Reconstruction and DevelopmentOthers
Multilateral Total (A) Bilateral China
Japan Saudi ArabiaOthers
Bilateral Total (B) Eurobonds/Sukuk (C) Eurobond/Pakistan International SukukCommercial Banks ICBC-China
Citi BankSUISSE AG,UBL,ABLSCB (London)
Commercial Banks Total (D) Grand Total (A+B+C+D)
Source: Economic Affairs Division The trends in gross disbursement of external loans from 2014 are shown in the graph below:
-
2,000
4,000
6,000
8,000
10,000
12,000
2013-14
Fig-9.13: Trends in Gross Disbursement of External Public Debt
Multilateral
2,028 million. Within multilateral loans, inflows were largely for the purpose of energy and infrastructure projects while inflows from bilateral loans were mainly
ed from China against CPEC
Government raised US$ 2,500 million in
December 2017 through a 5and 10-year conventional bond;
• Remaining funds were mobilized from commercial banks aimed at diversifying avenues for future funding needs.
The creditor wise disbursements are presented in the table below:
9.11: Creditor Wise Disbursements Details (July-December, 2017-18)
Donor
Islamic Development Bank Asian Development Bank International Development Association International Bank for Reconstruction and Development
Saudi Arabia
Eurobond/Pakistan International Sukuk China
Citi Bank SUISSE AG,UBL,ABL SCB (London)
Source: Economic Affairs Division
The trends in gross disbursement of external loans from 2014 are shown in the graph below:
2014-15 2015-16 2016-17
9.13: Trends in Gross Disbursement of External Public Debt(US$ in million)
Multilateral Bilateral Commercial Bonds IMF
Public Debt
147
December 2017 through a 5-year Sukuk year conventional bond;
Remaining funds were mobilized from commercial banks aimed at diversifying avenues for future funding needs.
he creditor wise disbursements are presented
Disbursements (US$ in million)
750 443 132 87 25
1,437 507 47 23 14
591 2,500
500 267 255 142
1,164 5,692
The trends in gross disbursement of external loans from 2014 are shown in the graph below:
2017-18 (Jul - Dec)

Pakistan Economic Survey 201
148
.
9.7.1 External Debt Servicing
External public debt servicing went up by 48 percent to settle at US$ 6,440 million during 2016-17 compared with US$ 4,340 million during the preceding fiscal year. The higher Table-9.12: External Public Debt Servicing
Years
2012-13 2013-14 2014-15 2015-16 2016-17 2017-18* *July-December, 2017
Source: Source: SBP, Economic Affairs Division and Debt Policy C During first half of the current fiscal year, servicing of external public debt was recorded at US$ 2,865 million. Segregation of this aggregate number shows repayment of US$ 2,083 million towards maturing external pudebt stock while interest payments were US$
A country can achieve external debt sustainability if it can meet its current and future external debt service obligations, without debt rescheduling or accumulation of arrears and without compromising growth. Externalpublic debt repayment obligations are not more than an average of US$ 5.5 billion per annum until 2023. Keeping in view the track record of the country, thshould not raise any concern as Pakistan has successfully met higher repaym
-
1,000
2,000
3,000
4,000
5,000
6,000
2013-14
Fig-9.14: Trends in Debt Servicing of External Public Debt
Multilateral
Pakistan Economic Survey 2017-18
External Debt Servicing
External public debt servicing went up by 48 US$ 6,440 million during
17 compared with US$ 4,340 million during the preceding fiscal year. The higher
repayments against multilateral loans, Eurobonds, Paris Club Countries and commercial loans mainly led to this increase. In addition, the government repaid Safe China Deposits amounting US$ 500 million.
9.12: External Public Debt Servicing
Principal Interest Amount Rolled Over
(US Dollar in million) 4,794.6 800.4 500.0 5,220.0 774.6 1,000.0 3,500.3 974.5 1,000.0 3,213.1 1,126.7 1,248.3 5,126.7 1,313.2 500.02,082.5 782.6
Source: Source: SBP, Economic Affairs Division and Debt Policy Coordination Office , M/o of Finance
current fiscal year, servicing of external public debt was recorded at US$ 2,865 million. Segregation of this aggregate number shows repayment of US$ 2,083 million towards maturing external public debt stock while interest payments were US$
783 million. The main components of debt servicing were repayment against multilateral and bilateral loans which amounted to US$ 1,069 million during the period. external debt servicing from 20the graph below:
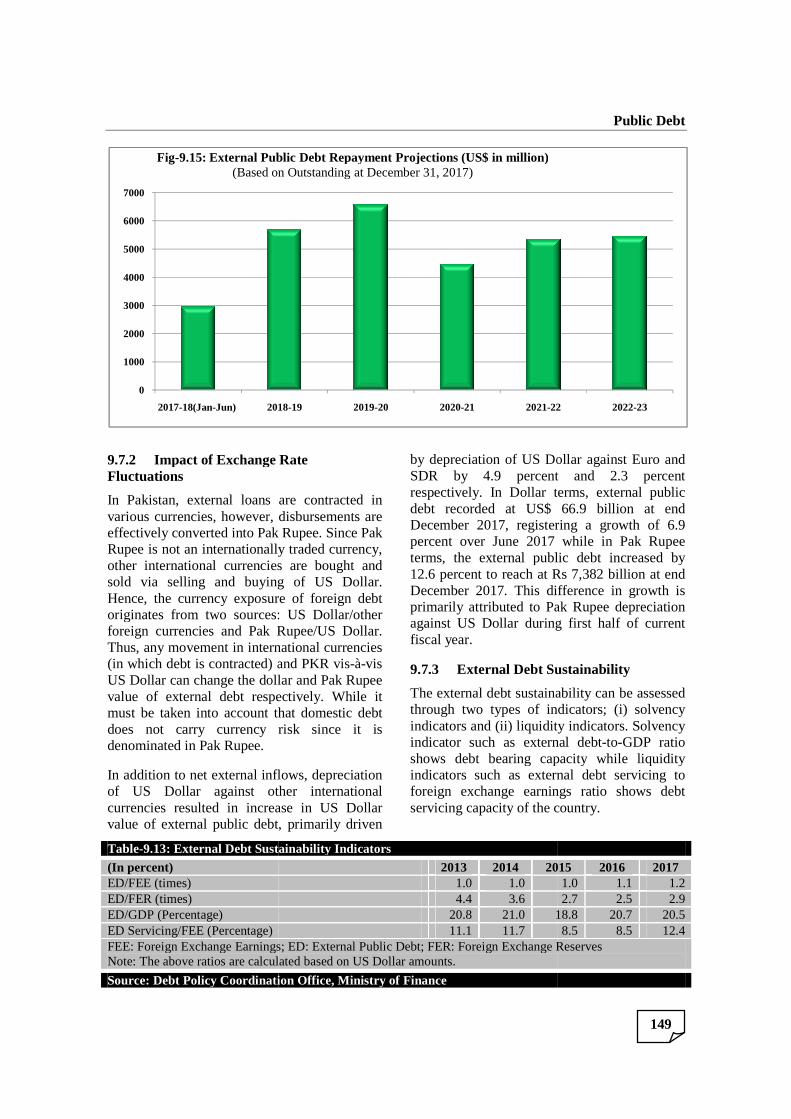
A country can achieve external debt sustainability if it can meet its current and future external debt service obligations, without debt rescheduling or accumulation of arrears and without compromising growth. External public debt repayment obligations of Pakistan are not more than an average of US$ 5.5 billion
. Keeping in view the track record of the country, the repayments should not raise any concern as Pakistan has successfully met higher repayment obligations
even with much lower volume of foreign exchange reserves. Furthermore, external inflows are expected to be sufficient to meet these repayment obligations. Government is cognizant of developing trends in balance of payments and has taken sevmeasures to keep current account deficit within manageable limits. The projectedpublic debt repayment based on outstanding at December 31, 2017 is presented through the graph below:
2014-15 2015-16 2016-17
9.14: Trends in Debt Servicing of External Public Debt(US$ in million)
Bilateral Commercial Bonds
repayments against multilateral loans, Eurobonds, Paris Club Countries and commercial loans mainly led to this increase. In
ent repaid Safe China Deposits amounting US$ 500 million.
Amount Rolled
Total
500.0 6,095.1 1,000.0 6,994.5 1,000.0 5,474.8 1,248.3 5,588.1
500.0 6,939.9 - 2,865.1
oordination Office , M/o of Finance
783 million. The main components of debt servicing were repayment against multilateral and bilateral loans which amounted to US$ 1,069 million during the period. The trends in external debt servicing from 2014 are shown in
even with much lower volume of foreign exchange reserves. Furthermore, external inflows are expected to be sufficient to meet
repayment obligations. Government is cognizant of developing trends in balance of
and has taken several remedial measures to keep current account deficit within
. The projected external based on outstanding at
December 31, 2017 is presented through the
2017-18 (Jul - Dec)
IMF
9.7.2 Impact of Exchange Rate Fluctuations
In Pakistan, external loans are contracted in various currencies, however, disbursements are effectively converted into Pak Rupee. Since Pak Rupee is not an internationally traded currency, other international currencies are bought and sold via selling and buying of US Dollar. Hence, the currency exposure of foreign debt originates from two sources: US Dollar/other foreign currencies and Pak Rupee/US Dollar. Thus, any movement in international currencies (in which debt is contracted) and PKR visUS Dollar can change the dollar and Pak Rupee value of external debt respectively. While it must be taken into account thatdoes not carry currency risk since it is denominated in Pak Rupee.
In addition to net external inflows, depreciation of US Dollar against other international currencies resulted in increase in US Dollar value of external public debt, primarily driven
Table-9.13: External Debt Sustainability Indicators
(In percent) ED/FEE (times) ED/FER (times) ED/GDP (Percentage) ED Servicing/FEE (Percentage) FEE: Foreign Exchange Earnings; Note: The above ratios are calculated based on US Dollar amounts.
Source: Debt Policy Coordination Office,
0
1000
2000
3000
4000
5000
6000
7000
2017-18(Jan-Jun) 2018
Fig-9.15: External Public Debt Repayment Projections (US$ in million)(Based on Outstanding at December 31, 2017)
Impact of Exchange Rate
n Pakistan, external loans are contracted in various currencies, however, disbursements are effectively converted into Pak Rupee. Since Pak Rupee is not an internationally traded currency, other international currencies are bought and
buying of US Dollar. Hence, the currency exposure of foreign debt originates from two sources: US Dollar/other foreign currencies and Pak Rupee/US Dollar. Thus, any movement in international currencies (in which debt is contracted) and PKR vis-à-vis
lar can change the dollar and Pak Rupee value of external debt respectively. While it
that domestic debt does not carry currency risk since it is
In addition to net external inflows, depreciation ollar against other international resulted in increase in US Dollar
value of external public debt, primarily driven
by depreciation of US Dollar against Euro and SDR by 4.9 percent and 2.3 percent respectively. In Dollar terms, external public debt recorded at US$ 66.9 billion at end December 2017, registering a growth of 6.9 percent over June 2017 while in Pak Rupee terms, the external public debt increased by 12.6 percent to reach at Rs December 2017. This difference in groprimarily attributed to Pak Rupee depreciation against US Dollar during first half of current fiscal year.
9.7.3 External Debt Sustainability
The external debt sustainability can be assessed through two types of indicators; (i) solvency indicators and (ii) liquidity indicators. Solvency indicator such as external debtshows debt bearing capacity while liquidity indicators such as external debt servicing to foreign exchange earnings ratio shows debt servicing capacity of the country.
9.13: External Debt Sustainability Indicators
2013 2014 20151.0 1.0 4.4 3.6
20.8 21.0 18.8 11.1 11.7
Foreign Exchange Earnings; ED: External Public Debt; FER: Foreign Exchange ReservesNote: The above ratios are calculated based on US Dollar amounts.
Source: Debt Policy Coordination Office, Ministry of Finance
2018-19 2019-20 2020-21 2021-22
9.15: External Public Debt Repayment Projections (US$ in million)(Based on Outstanding at December 31, 2017)
Public Debt
149
by depreciation of US Dollar against Euro and SDR by 4.9 percent and 2.3 percent respectively. In Dollar terms, external public ebt recorded at US$ 66.9 billion at end
December 2017, registering a growth of 6.9 percent over June 2017 while in Pak Rupee terms, the external public debt increased by
Rs 7,382 billion at end December 2017. This difference in growth is primarily attributed to Pak Rupee depreciation against US Dollar during first half of current
External Debt Sustainability
The external debt sustainability can be assessed two types of indicators; (i) solvency
nd (ii) liquidity indicators. Solvency indicator such as external debt-to-GDP ratio shows debt bearing capacity while liquidity indicators such as external debt servicing to foreign exchange earnings ratio shows debt servicing capacity of the country.
2015 2016 2017 1.0 1.1 1.2 2.7 2.5 2.9 18.8 20.7 20.5 8.5 8.5 12.4
Foreign Exchange Reserves
22 2022-23
Pakistan Economic Survey 2017-18
150
External public debt to GDP ratio decreased to 20.5 percent at the end of 2016-17 from 20.7 percent at the end of 2015-16 while it was 20.8 percent at the end of 2012-13, indicating relative reduction in external debt burden of the country. Higher repayments coupled with translational gain on account of appreciation of US Dollar against other international currencies resulted in reduction of this ratio at the end of 2016-17. By end December 2017, this ratio stood at 21.4 percent.
ED to FEE ratio increased marginally and settled at 1.2 times during 2016-17 compared with 1.1 times during 2015-16. Similarly, ED Servicing to FEE ratio increased to 12.4 percent in 2016-17 from 8.5 percent in 2015-16 while this ratio stood at around 10.7 percent during first half of current fiscal year. The lower growth in FEE during 2016-17 led to increase in these ratios which can be mainly attributed to:
• Stagnation in exports largely due to global economic conditions, low commodity prices and bottlenecks in the energy and infrastructure sectors of the economy; and
• Workers' remittances remained marginally lower than the preceding fiscal year due to adverse economic conditions in the Middle East, stringent USA regulations and impact of Brexit.
Reduction in external debt in relation to foreign exchange reserves reflects consolidation of foreign exchange reserves and general improvement in country’s repayment capacity. This ratio started improving since 2012-13 from 4.4 times towards 2.9 times at the end of 2016-17. While moderate decline in foreign exchange reserves on account of increase in current account deficit during 2016-17 led to a slight decline in this ratio during the said period. It is important to note that increase in current account deficit was mainly due to increase in imports of machinery, industrial raw material and petroleum products. These imports are enhancing the productive capacity of the economy for higher output and exports in future. At end December 2017, this ratio
increased and recorded at 3.3 times.
9.8 Pakistan’s Link with International Capital Market
The issuance of Eurobonds has had great significance for Pakistan as it not only introduced Pakistan back into international capital market but has also allowed access to foreign sources for building country’s reserves that paved the way for exchange rate stability. Further, the proceeds from Eurobonds were utilized to retire the expensive domestic debt.
Pakistan tapped the international capital markets in December 2017, raising US$2.5 billion via a dual tranche issuance which included a US$1 billion 5-year Sukuk and a landmark US$1.5 billion 10-year conventional bond. The conventional issuance was important, being the largest single tranche ever raised by Pakistan at the lowest coupon rate of 6.875 percent for a 10-year bond. The order book for Pakistan’s sovereign paper was over US$ 8 billion. However, the government decided to pick up only US$ 2.5 billion in order to ensure low final yields on Sukuk and Eurobond. Such oversubscription and overwhelming response of global investors is evidence of trust and confidence of international capital markets in the economic policies of the government. The orders were placed by numerous blue chip institutional international investors from all across the globe. Around 44 percent of the orders were placed by investors from Europe, 24 percent from Asia, 20 percent from North America, 8 percent Middle East and 12 percent from other regions.
Pakistan’s international Eurobonds and Sukuk have generally traded well since 2015 till end 2017, with Pakistan 2016, 2017, 2019, 2024 and 2036 bonds broadly trading at a premium during this period. Since February 2018, there has been a change in global markets, with 10-year UST benchmark briefly touching a 4-year high and subsequent increase in rates by the US Fed adding to the volatility. As a result of contractionary monetary policy environment and other market factors coupled with macro-economic developments, there has been an increase in yields of Pakistan bonds and Sukuk in the secondary market with all instruments apart from Pakistan 2024 and 2025 are
Public Debt
151
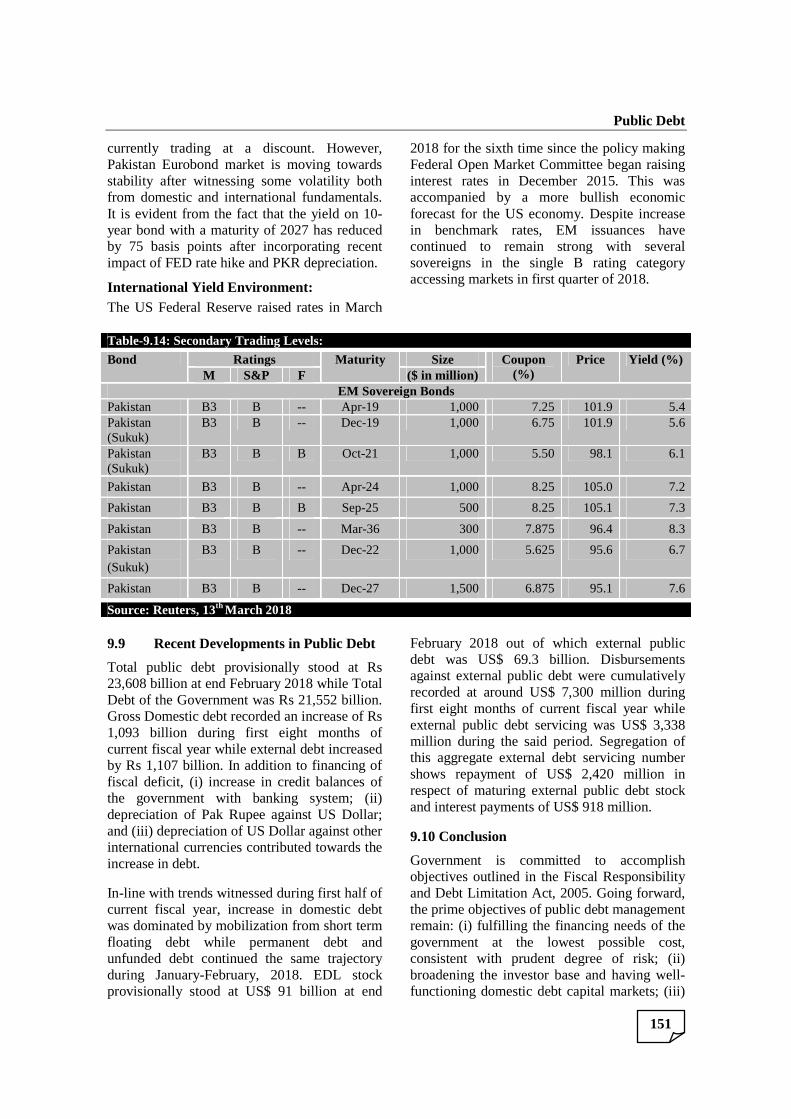
currently trading at a discount. However, Pakistan Eurobond market is moving towards stability after witnessing some volatility both from domestic and international fundamentals. It is evident from the fact that the yield on 10-year bond with a maturity of 2027 has reduced by 75 basis points after incorporating recent impact of FED rate hike and PKR depreciation.
International Yield Environment: The US Federal Reserve raised rates in March
2018 for the sixth time since the policy making Federal Open Market Committee began raising interest rates in December 2015. This was accompanied by a more bullish economic forecast for the US economy. Despite increase in benchmark rates, EM issuances have continued to remain strong with several sovereigns in the single B rating category accessing markets in first quarter of 2018.
Table-9.14: Secondary Trading Levels:
Bond Ratings Maturity Size Coupon (%)
Price Yield (%) M S&P F ($ in million)
EM Sovereign Bonds Pakistan B3 B -- Apr-19 1,000 7.25 101.9 5.4 Pakistan (Sukuk)
B3 B -- Dec-19 1,000 6.75 101.9 5.6
Pakistan (Sukuk)
B3 B B Oct-21 1,000 5.50 98.1 6.1
Pakistan B3 B -- Apr-24 1,000 8.25 105.0 7.2
Pakistan B3 B B Sep-25 500 8.25 105.1 7.3
Pakistan B3 B -- Mar-36 300 7.875 96.4 8.3
Pakistan (Sukuk)
B3 B -- Dec-22 1,000 5.625 95.6 6.7
Pakistan B3 B -- Dec-27 1,500 6.875 95.1 7.6
Source: Reuters, 13th March 2018
9.9 Recent Developments in Public Debt
Total public debt provisionally stood at Rs 23,608 billion at end February 2018 while Total Debt of the Government was Rs 21,552 billion. Gross Domestic debt recorded an increase of Rs 1,093 billion during first eight months of current fiscal year while external debt increased by Rs 1,107 billion. In addition to financing of fiscal deficit, (i) increase in credit balances of the government with banking system; (ii) depreciation of Pak Rupee against US Dollar; and (iii) depreciation of US Dollar against other international currencies contributed towards the increase in debt.
In-line with trends witnessed during first half of current fiscal year, increase in domestic debt was dominated by mobilization from short term floating debt while permanent debt and unfunded debt continued the same trajectory during January-February, 2018. EDL stock provisionally stood at US$ 91 billion at end
February 2018 out of which external public debt was US$ 69.3 billion. Disbursements against external public debt were cumulatively recorded at around US$ 7,300 million during first eight months of current fiscal year while external public debt servicing was US$ 3,338 million during the said period. Segregation of this aggregate external debt servicing number shows repayment of US$ 2,420 million in respect of maturing external public debt stock and interest payments of US$ 918 million.
9.10 Conclusion
Government is committed to accomplish objectives outlined in the Fiscal Responsibility and Debt Limitation Act, 2005. Going forward, the prime objectives of public debt management remain: (i) fulfilling the financing needs of the government at the lowest possible cost, consistent with prudent degree of risk; (ii) broadening the investor base and having well-functioning domestic debt capital markets; (iii)
Pakistan Economic Survey 2017-18
152
lengthening of maturity profile of its domestic debt portfolio to reduce re-financing and interest rate risks; and (iv) mobilization of maximum available concessional external financing to enhance potential output of the economy by promoting efficiency and productivity, thus, simultaneously adding to the
debt repayment capacity of the country. Further, it is important for the government to adopt an integrated approach for economic revival and debt reduction. Thus, implementing structural reforms that boost potential growth remain key to ensure public debt sustainability.