public debt and fiscal vulnerability in the middle … · public debt and fiscal vulnerability in...
TRANSCRIPT

WP/07/12
Public Debt and Fiscal Vulnerability in theMiddle East
Manal Fouad, Wojciech Maliszewski,
Martin Hommes, Hanan Morsy, Martin Petri, and Ludvig Söderling


© 2007 International Monetary Fund WP/07/12 IMF Working Paper Fiscal Affairs and Middle East and Central Asia Departments
Public Debt and Fiscal Vulnerability in the Middle East
Prepared by Manal Fouad, Wojciech Maliszewski, Martin Hommes, Hanan Morsy, Martin Petri, and Ludvig Söderling1
Authorized for distribution by James Daniel and John Wakeman-Linn
January 2007
Abstract
This Working Paper should not be reported as representing the views of the IMF. The views expressed in this Working Paper are those of the author(s) and do not necessarily represent those of the IMF or IMF policy. Working Papers describe research in progress by the author(s) and are published to elicit comments and to further debate.
Public debt in the Middle East increased during the mid-1990s mainly because of fiscal expansions. It decreased in recent years, thanks to high oil revenue, economic growth, some primary non-oil fiscal adjustment, and debt relief. While countries in the Middle East appear to have adequately reacted to high indebtedness in the past, public debt levels remain uncomfortably high in many, particularly non-oil producing countries and middle income oil producers. Non-oil countries adjust mainly by increasing revenues, whereas oil countries adjust expenditure. For non-oil producing countries, substantial fiscal adjustment would be needed to bring debt down to below 50 percent of GDP. Oil producers as a group appear to follow sustainable, though procyclical, fiscal policies. Middle-income (but not high-income) oil producing countries would need to adjust somewhat to bring their policies in line with the permanent oil income benchmark. JEL Classification Numbers: Keywords: Middle East, Public Debt, Fiscal Policy, Oil Author’s E-Mail Address: [email protected], [email protected], [email protected],
[email protected], [email protected]
1 The authors would like to thank James Daniel, Richard Hemming, John Wakeman-Linn for providing guidance and comments, Juan Francisco Yépez for excellent research assistance. Thanks are also due to Klaus Enders, Erik de Vrijer, and Miguel Savastano, as well as the MCD desk economists for helpful comments.

2
Contents Page
I. Introduction....................................................................................................................4
II. Why Has Public Debt Been High?.................................................................................5 A. Oil Dependence and the Origins of Public Debt................................................8 B. What Shaped the Evolution of Debt (1999–2005)? .........................................11 C. Why Has There Been No Crisis? .....................................................................15
III. Is the Public Debt Level Sustainable? .........................................................................19 A. Are Historical Primary Balances Sustainable? ................................................19 B. Are Historical Fiscal Policy Responses Sustainable?......................................22 C. What Are Current Vulnerabilities? ..................................................................26
IV. Conclusions..................................................................................................................27 Boxes 1. Evolution of Debt in the Middle-East Since the Early 1990s by Country Groups ................7 2. The Role of Regional characteristics in Shaping Debt Dynamics.......................................10 3. Pakistan—How Public Debt Was Reduced .........................................................................15 4. Lebanon—Living with High Public Debt............................................................................18 Tables 1. Paris Club Reschedulings ....................................................................................................16 2. Regression Results for Non-Oil Countries ..........................................................................24 3. Regression on Results for Oil-Producing Countries............................................................26 Figures 1. Total Public Debt: Middle East vs. Emerging Markets ........................................................4 2. Composition of Total Debt to GDP in 2003 .........................................................................6 3. Debt by Origin ......................................................................................................................6 4. Oil Export and Government Revenue in Oil Producing Countries.......................................8 5. Overall Balance.....................................................................................................................8 6. Revenue, Expenditure, Assets and External Debt ................................................................9 7. Debt and Non-Oil Fiscal Balances in Oil-Producing Countries .........................................11 8. High Income Oil Producers: Contributions to the Change in Public Debt Stock...............12 9. Middle-Income Oil Producers: contributions to the Change in Public Debt Stock............13 10. Middle-Income Non-Oil Producers: Contributions to the Change in Public Debt Stock..14 11. Low Income Non-Oil Produers: Contributions to the Change in Public Debt Stock ........14 12. Primary Balance: Historical Average and the Range of Estimates Consistent with Sustainability ........................................................................................................21 13. Non-Oil Primary Balance: Actual and the Range of Estimates Consistent with POIM....22

3
Appendices I. Data Issues............................................................................................................................28 II. Specification of the Fiscal Policy and the Revenue/Expenditure Reaction Functions .......30 References................................................................................................................................35
4
PUBLIC DEBT AND FISCAL VULNERABILITY IN THE MIDDLE EAST
I. INTRODUCTION
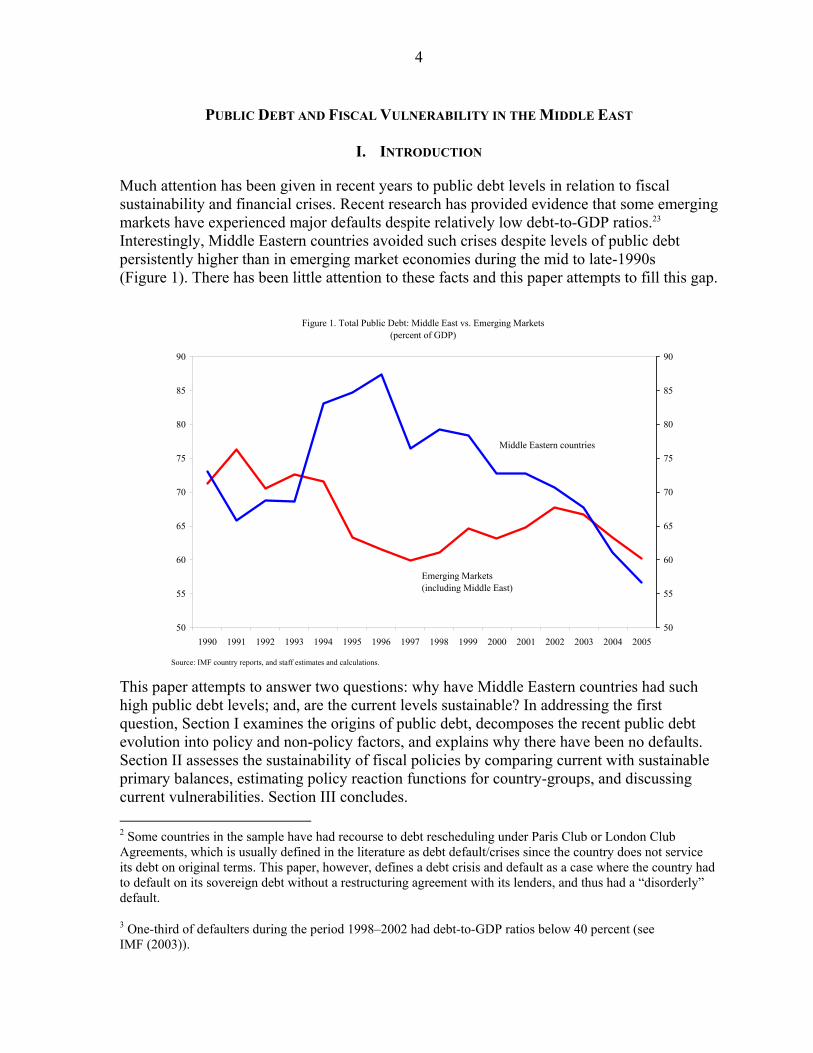
Much attention has been given in recent years to public debt levels in relation to fiscal sustainability and financial crises. Recent research has provided evidence that some emerging markets have experienced major defaults despite relatively low debt-to-GDP ratios.23 Interestingly, Middle Eastern countries avoided such crises despite levels of public debt persistently higher than in emerging market economies during the mid to late-1990s (Figure 1). There has been little attention to these facts and this paper attempts to fill this gap.
Figure 1. Total Public Debt: Middle East vs. Emerging Markets
(percent of GDP)
50
55
60
65
70
75
80
85
90
1990 1991 1992 1993 1994 1995 1996 1997 1998 1999 2000 2001 2002 2003 2004 200550
55
60
65
70
75
80
85
90
Emerging Markets (including Middle East)
Middle Eastern countries
Source: IMF country reports, and staff estimates and calculations.
This paper attempts to answer two questions: why have Middle Eastern countries had such high public debt levels; and, are the current levels sustainable? In addressing the first question, Section I examines the origins of public debt, decomposes the recent public debt evolution into policy and non-policy factors, and explains why there have been no defaults. Section II assesses the sustainability of fiscal policies by comparing current with sustainable primary balances, estimating policy reaction functions for country-groups, and discussing current vulnerabilities. Section III concludes. 2 Some countries in the sample have had recourse to debt rescheduling under Paris Club or London Club Agreements, which is usually defined in the literature as debt default/crises since the country does not service its debt on original terms. This paper, however, defines a debt crisis and default as a case where the country had to default on its sovereign debt without a restructuring agreement with its lenders, and thus had a “disorderly” default.
3 One-third of defaulters during the period 1998–2002 had debt-to-GDP ratios below 40 percent (see IMF (2003)).

5
Although countries in the Middle Eastern region are similar in many respects, they can be divided into groups to better account for their specific characteristics. The study covers 19 Middle-Eastern countries consisting of all the Arab countries (except the “post-conflict” countries, Iraq, Sudan, West Bank and Gaza, and Somalia, for which consistent data series were not available), as well as Iran and Pakistan.4 Four sub-groups are further distinguished to take into account differences in per capita income and the degree of exposure to oil:5 • high-income oil producers: Bahrain, Kuwait, Oman, Qatar, Saudi Arabia, and the
UAE (corresponding to the Gulf Cooperation Council);
• middle-income oil producers: Algeria, Iran, Libya, Syria, and Yemen;
• middle-income non-oil producers: Egypt,6 Jordan, Lebanon, Morocco, and Tunisia; and
• low-income non-oil producers: Djibouti, Pakistan, and Mauritania7.
The data are drawn from IMF staff reports and country desks, and are supplemented by other sources (World Bank, World Economic Outlook, and International Financial Corporation) for the analysis of long-term trends. Data issues are important in some countries and are discussed in Appendix I. Public debt is defined as broadly as each country’s data allows.8
II. WHY HAS PUBLIC DEBT BEEN HIGH?
In 2003,9 about half of the Middle-Eastern countries had a debt level above the emerging markets’ mean of about 60 percent of GDP, and more than two-thirds (including all non-oil producing countries) were above the 50 percent benchmark, corresponding to the median debt level of vulnerable emerging market economies (Figure 2).10 Debt was highest in non-oil
4 The terms Middle East or Middle-Eastern refer to the 19 countries covered in the analysis.
5 Unless noted otherwise, we use the term oil to denote all hydrocarbon resources of a country, including natural gas. Income levels are defined according to the World Bank definitions.
6 During the period under consideration Egypt was a net oil importer on average. It continues to be a net importer for oil and oil products, but has become an energy exporting country (gas) on a net basis.
7 Mauritania will become a net oil exporter in 2006.
8 Thus the data reported for Egypt, Libya, Oman, Saudi Arabia, and UAE is for the public sector; for Jordan, Pakistan and Tunisia is for the general government; and the remainder is for central government. Unless otherwise indicated, debt is defined as gross debt without any adjustments for bank deposits or other assets.
9 2003 was chosen because as it is a turning point before the recent oil price hikes.
10 IMF (2003) found that the median public debt-to-GDP ratio for defaulting emerging countries was 50 percent one year prior to default. It also found that emerging market economies as a whole did not respond to further debt increases in a sustainable way once public debt ratios rose above 50 percent of GDP.

6
countries, but gross public debt in some oil-producing countries, such as Saudi Arabia and Qatar, was also high.
Figure 2. Composition of Total Debt to GDP in 2003
0
20
40
60
80
100
120
140
160
180
200
Maurita
nia
Leban
on
Egypt
Jorda
n
Djibou
ti
Saudi
Arabia
Pakist
an
Syria
Morocco
Tunisi
a Qata
r
Yemen
Algeria
Bahrai
n Liby
a
Kuwait
Ira
n
Oman
UAE
0
20
40
60
80
100
120
140
160
180
200
External Domestic
1/ For Kuwait, the 2002 debt data was used (2003 was not available)Source: IMF country reports, and staff estimates and calculations.
During 1990–2005, public debt ratios in the Middle East initially increased, but a decline started in the mid-1990s and accelerated in the last few years (Box 1). Over the whole period, debt declined by about 26 percentage points of GDP to around 55 percent (Figure 3). The bulk of the reduction was from external public debt— domestic debt remained fairly constant at about 30 percent of GDP.
Figure 3. Debt by Origin (percent of GDP)
0
10
20
30
40
50
60
70
80
90
100
1990 1991 1992 1993 1994 1995 1996 1997 1998 1999 2000 2001 2002 2003 2004 20050
10
20
30
40
50
60
70
80
90
100
Total Debt
External Debt
Source: IMF country reports, and staff estimates and calculations.
Domestic Debt

7
Middle Income oil producers(debt as percentage of GDP)
0
20
40
60
80
100
120
1991
1992
1993
1994
1995
1996
1997
1998
1999
2000
2001
2002
2003
2004
2005
0
20
40
60
80
100
120Total DebtExternal DebtDomestic Debt
Source: IMF country reports, and staff estimates and calculations.
Middle Income non-oil producers(debt as percentage of GDP)
0
20
40
60
80
100
120
140
160
19911992
19931994
19951996
19971998
19992000
20012002
20032004
2005
0
20
40
60
80
100
120
140Total DebtExternal DebtDomestic Debt
Source: IMF country reports, and staff estimates and calculations.
Low Income non-oil producers(debt as percentage of GDP)
0
20
40
60
80
100
120
140
160
1991
1992
1993
1994
1995
1996
1997
1998
1999
2000
2001
2002
2003
2004
2005
0
20
40
60
80
100
120
140
160Total DebtExternal DebtDomestic Debt
Source: IMF country reports, and staff estimates and calculat ions.
Higher Income oil producers 1/(debt as percentage of GDP)
0
10
20
30
40
50
60
70
1991
1992
1993
1994
1995
1996
1997
1998
1999
2000
2001
2002
2003
2004
2005
0
10
20
30
40
50
60
70
Total DebtExternal DebtDomestic Debt
Source: IMF country reports, and staff estimates and calculat ions.1/ Average domestic debt for 1990 was too low due to the lack of data. Therefore, the year 1990 is not shown on the graph.
Box 1. Evolution of Debt in the Middle-East Since the Early 1990s by Country Groups
High income oil producers’ debt peaked in 1998. They relied mainly on domestic debt to finance their deficits.
Middle income non-oil countries’ debt fell at the beginning of the 1990s, partly in response to debt relief, but increased steadily thereafter as domestic debt accumulation outpaced the decline in external debt.
In the early 1990s, middle income oil producers had worse debt ratios than their higher income neighbors, and these levels continued to rise due to external debt accumulation. However, debt reduction since then was much sharper.
Low income non-oil producing countries’ debt ratios remained very high in the 1990s, but have declined somewhat since then.

8
A. Oil Dependence and the Origins of Public Debt
The Middle East is highly dependent on oil—directly or indirectly—which is a main factor driving the regional debt dynamics. Oil producers heavily rely on oil revenue, but non-oil countries are also affected by developments in the oil market through grants, remittances, regional trade, financial services, and tourism. Thanks to oil proceeds, average revenue ratios in the region are well above the emerging market average. High-income oil producers recorded an average as high as 40 percent of GDP, driven by oil proceeds (Figure 4). Yet the region has consistently recorded fiscal deficits—surpluses were only run by oil producers since the turn of the century (Figure 5).
Figure 4. Oil Export and Government Revenue in Oil-Producing Countries
(percent of GDP)
20
25
30
35
40
45
1990
1992
1994
1996
1998
2000
2002
2004
20
25
30
35
40
45
Oil exports
Revenue
Source: Staff estimates based on IMF, IFS,WEO, Lane and Milesi-Ferreti (2005) and WB GDF.
Figure 5. Overall Balance (percent of GDP)
-15
-10
-5
0
5
10
15
20
19901992
19941996
19982000
20022004
-15
-10
-5
0
5
10
15
20Higher Income Oil
Producers
Middle Income Oil Producers
Middle Income Non-Oil Producers
Low Income Non-Oil Producers
Source: IMF country reports, and staff estimates and calculations. The averages, however, conceal wide fluctuations in government deficits due to volatility in oil revenue and slow adjustments in expenditures and in other revenue (Figure 6).11 The oil boom in the 1970s increased spending to the current high levels, both in oil and non-oil producing countries. Non-oil and middle-income oil producers financed higher expenditures by accumulating debt, which accelerated when oil prices declined. High-income oil-producers managed to build up assets despite higher spending, but the situation worsened in some countries due to large military and reconstruction expenditures during the first Gulf War (typically outside the budget). In addition to oil dependence, common structural characteristics of the economies in the region have created an environment that may have been propitious to accumulating debt. In particular, rigidities in expenditure, a volatile revenue base, and weak fiscal institutions have made a prompt fiscal response to shocks difficult, thus debt financing dominated over adjustment (Box 2). 11 Figure 6 reports only external debt, as data limitations did not allow for constructing long total debt series. See Appendix I for details.

9
Figure 6. Revenue, Expenditure, Financial Assets and External Debt 1/
Source: Staff Estimates based on IMF IFS, IMF WEO, Lane and Milesi-Ferretti (2005), WB GDF and IMF country reports.1/ External debt data is not available for high income oil producers. Non-oil producing countries do not have significant government financial assets. Government financial assets are proxied by the country's total external assets (excluding central bank reserves).
High-income oil producers (percent of GDP)
0
50
100
150
200
250
1970 1972 1974 1976 1978 1980 1982 1984 1986 1988 1990 1992 1994 1996 1998 2000 2002 20040
50
100
150
200
250
Government revenueGovernment expenditureAssets
Middle-income oil producers (percent of GDP)
0
10
20
30
40
50
60
1970 1972 1974 1976 1978 1980 1982 1984 1986 1988 1990 1992 1994 1996 1998 2000 2002 20040
10
20
30
40
50
60
Government revenue
Government expenditure
Assets
External Debt
Non-oil producing countries (percent of GDP)
15
25
35
45
55
65
75
85
1970 1972 1974 1976 1978 1980 1982 1984 1986 1988 1990 1992 1994 1996 1998 2000 2002 200415
25
35
45
55
65
75
85
Government expenditure
Government revenue
External Debt (WB)

10
Wages & Salaries (percent of non-oil GDP)
5
7
9
11
13
15
17
19
21
23
25
1990 1991 1992 1993 1994 1995 1996 1997 1998 1999 2000 2001 2002 2003 2004 20055
7
9
11
13
15
17
19
21
23
25
Higher Income Oil Producers
Middle Income Oil Producers
Middle Income Non-Oil Producers Low Income Non-Oil Producers
Source: IMF country reports, and staff estimates and calculations.
0
5
10
15
20
25
30
35
1990 1991 1992 1993 1994 1995 1996 1997 1998 1999 2000 2001 2002 2003 2004 20050
5
10
15
20
25
30
35
Source: IMF country reports, and staff estimates and calculations.
Grants
Non-oil revenue(oil producers)
Revenue(non-oil producers)
Revenue and Grants(percent of GDP)
Box 2. The Role of Regional Characteristics in Shaping Debt Dynamics The following common structural characteristics of the economies have created an environment that may have been propitious to accumulating debt. Rigidities in expenditure The structure of expenditures points to rigidities that make it difficult to reverse expansions when needed. For example, the wage bill averaged 15 percent of non-oil GDP (and was particularly high for oil producers), compared to an average of 7 percent of GDP in 1997-2004 in emerging markets. Uncertain and volatile revenue Non-oil tax revenue was low and stagnating, averaging 11 percent of non oil GDP, or about half the average for emerging markets. There is a strong reliance on grants in some non-oil producing countries—a very volatile source of revenue. In Djibouti and Jordan—countries with the highest exposure—grants were on average above 6 percentage points of GDP per year, with a standard deviation of 3 percentage points, and annual ranges from 2 percent of GDP to 14 percent. Weak fiscal institutions complicate the ability of fiscal policy to respond to shocks. Public financial management systems in the region share many weaknesses. There is still large budget fragmentation resulting from centrally- planned systems, where the investment budget is separate from the current budget, extra-budgetary funds are widespread, or off budget spending is pervasive. A particular challenge has been to manage oil revenue in a way that ensures the appropriate spending within a medium-term sustainable context. Budget execution and monitoring also suffer deficiencies. In the area of revenue administration, there has been some progress with VAT implementation, function-based tax administrations, establishment of Large Taxpayers Offices and customs modernization (Crandall and Bodin (2005)). However, important challenges for countries remain notably the low level of compliance with tax laws, insufficient political commitment, lack of capacity, expertise and resource, and lack of effectiveness in customs administration. Also, until recently, some countries, such as, Egypt , and Yemen, have been reluctant to implement a full-fledged modern VAT. Data limitations hamper policy formulation. The coverage of the public sector is narrow compared to other regions, particularly Latin America, and off-budget operations widespread. Data on contingent liabilities such as future pension obligations, potential costs of bank restructuring, or guarantees in public private partnerships (PPPs) are often not available. In addition, data on public assets are seldom reported. (Appendix I discusses data limitations in more detail). The countries in the region also have relatively weak governance and transparency. For example the Corruption Perception Index of Transparency International shows seven countries out of the sample in the top one-third of the ranking—of which five are rich oil producers. In general, countries with large debt tend to have weaker institutional indicators.

11
Figure 7. Debt and Non-Oil Fiscal Balances in Oil-Producing Countries(Percent of non-oil GDP)
Source: IMF country reports, and staff estimates and calculations.
Debt by group (percent of non-oil GDP)
0
20
40
60
80
100
120
140
160
1990 1992 1994 1996 1998 2000 2002 20040
20
40
60
80
100
120
140
160
Middle-income oil producers
High-income oil producers
Non-Oil Overall Balance (percent of non-oil GDP)
-70
-60
-50
-40
-30
-20
-10
0
1990 1992 1994 1996 1998 2000 2002 2004-70
-60
-50
-40
-30
-20
-10
0
Middle-income oil producers
High-income oil producers
Oil producers in the region ran large non-oil fiscal deficits12 throughout the period (as high as 60 percent of non-oil GDP on average in Oman, closely followed by Saudi Arabia). Average non-oil primary deficits were also high at 23 percent of GDP, improving for rich oil producers at the end of the sample period, but deteriorating in middle income oil countries in part because of higher oil prices (Figure 7).
B. What Shaped the Evolution of Debt (1999–2005)?
To identify factors behind the evolution of debt, the debt dynamics are decomposed into policy and macroeconomic factors for the 1999–2005 period (data limitations do not allow for decomposition in the full 1990–2005 sample). The non-oil primary balance, as the only variable that policymakers can directly control, is treated as a policy factor in the decomposition.13 To capture the effect of the recent oil price hikes since 2003, the analysis is split into 2 separate periods: 1999–2003 and 2004–05. In the four groups of countries there was a reduction in debt in the 2004–05 period. In the first sub-period (1999–2003) the reduction was less pronounced, and debt even increased in the middle-income non-oil producers.
12 Because oil is a non-renewable resource, and due to the volatility of oil prices, non-oil balances are a good measure of the fiscal policy stance in hydrocarbon-rich countries (conceptually, oil revenue is treated as a financing item, see Ossowski and Barnett, 2002). The paper therefore focuses on non-oil balances and uses non-oil GDP for calculating relevant ratios in oil producing countries, as well as for comparisons with other regions.
13 The non-oil primary balance and oil revenue enter the decomposition separately, with the latter treated as a financing item.

12
Oil producing countries In oil producing countries, the increase in oil revenue explains most of the reduction in debt (Figures 8 and 9). Most of the debt developments for oil countries are driven by the non-oil primary deficit and oil revenues.14 The contribution from oil revenue exceeded the impact of non-oil primary deficit expansions in high-income countries by a wide margin throughout the sample. • While in 1999–2003 oil revenues were primarily used to finance the non-oil primary
deficit in oil-producing countries, in the last two years the higher oil revenue financed a larger reduction in gross debt and the building up of financial assets (for example Algeria prepaid a large part of its debt to bilateral, multilateral and private creditors since 2004).
• The higher contribution of oil revenue in middle-income oil producers in 2004–05 compared to high-income oil producers was partly offset by a wider non-oil primary deficit for middle-income oil producers (while higher-income producers kept their non-oil primary balance roughly unchanged).
Source: IMF country reports, and staff estimates and calculations.
(percentage of non-oil GDP)Figure 8. High Income Oil Producers: Contributions to the Change in Public Debt Stock 1999 to 2003 vs. 2004 to 2005
-75
-65
-55
-45
-35
-25
-15
-5
5
15
25
35
45
55
1 2-75
-65
-55
-45
-35
-25
-15
-5
5
15
25
35
45
55
Total Change in Gross Debt
Oil Revenue Contribution
Primary Non-Oil Balance Contribution
Growth Contribution
Interest Rate Contribution
RER Contribution
Other
1999-2003 2004-2005
14 There is a large “other” category that includes factors such as privatization revenue, debt relief, and asset accumulation. It is significant for most countries, mainly reflecting asset accumulation.

13
Source: IMF country reports, and staff estimates and calculations.
(percentage of non-oil GDP)Figure 9. Middle Income Oil Producers: Contributions to the Change in Public Debt Stock 1999 to 2003 vs. 2004 to 2005
-75
-65
-55
-45
-35
-25
-15
-5
5
15
25
35
45
55
1999-2003 2004-2005-75
-65
-55
-45
-35
-25
-15
-5
5
15
25
35
45
55
Total Change in Gross
Debt
Oil Revenue Contribution
Primary Non-Oil Balance Contribution
Growth Contribution
Interest Rate Contribution
RER Contribution
Other
Non-oil producing countries • Debt declined modestly in middle-income non-oil countries in 2004–05, while it
increased in the prior period (Figure 10).15 Economic growth was a strong driving force in reducing debt in both periods, but high interest cost and real effective depreciation more than offset the gain from economic growth, resulting in an increase in average debt ratios of 3 percent of GDP in 1999–2003. It is interesting to note the relatively small impact of the primary balance in both periods. The result in 1999–2003 is dominated by the poor performance of Lebanon and Egypt, while Jordan and Morocco were able to reduce their debt by 6–7 percentage points of GDP, with Tunisia’s debt essentially unchanged. In both Jordan and Morocco, the main contributors to the reduction of debt were strong growth performance and privatization proceeds.
• Low-income non-oil countries achieved a large reduction in debt benefiting from good economic growth and low interest rates (Figure 11). The reduction in debt in both sub-periods was mostly triggered by strong growth, but negative real interest rates also contributed. Primary deficits added to debt, but the primary position mildly improved towards the end of the period and in some countries played a significant role in reducing debt (Box 3 on Pakistan). The impact of real effective depreciation turned from positive (increasing debt) in the first sub-period to negative in the second.
15 Egypt is excluded from the debt decomposition exercise for the lack of consistent data covering the 1999-2005 period.

14
Source: IMF country reports, and staff estimates and calculations.
(percentage of GDP)Figure 10. Middle Income Non-Oil Producers : Contributions to the Change in Public Debt Stock 1999 to 2003 vs. 2004 to 2005
-8
-6
-4
-2
0
2
4
6
8
1999-2003 2004-2005-8
-6
-4
-2
0
2
4
6
8
Total Change in Gross Debt
Primary Non-Oil Balance Contribution
Growth Contribution
RER Contribution
Interest Rate Contribution Other
Source: IMF country reports, and staff estimates and calculations.
Figure 11. Low Income non-oil producers: Contributions to the Change in Public Debt Stock 1999 to 2003 vs. 2004 to 2005 (percentage of GDP)
-10
-8
-6
-4
-2
0
2
4
6
8
1999-2003 2004-2005-10
-8
-6
-4
-2
0
2
4
6
8
Total Change in Gross Debt
Primary Non-Oil Balance Contribution
Growth Contribution
Interest Rate Contribution
RER Contribution
Other

15
C. Why Has There Been No Crisis?
In spite of the high debt levels compared to emerging market economies, the Middle Eastern region has avoided major defaults and debt crises. The lack of debt crises can be explained to some extent by special financing features that may have partially insulated regional debt from typical market responses. These factors may have played a role in averting crisis and mitigating vulnerabilities, particularly in the short term.
Box 3. Pakistan—How Public Debt Was Reduced Pakistan’s debt situation today stands in sharp contrast to the late 1990s and early 2000s, when both the overall and external debt ratios were very high. At the end of June-2001, Pakistan’s public debt peaked at almost 90 percent of GDP, slightly over half of which was external debt. In an environment of anemic growth, declining reserves, and a rapidly depreciating exchange rate, the Pakistani economy was under a great deal of pressure. However, in a turnaround, Pakistan’s recent history has been characterized by a sound policy environment and favorable exogenous factors. Accelerating economic growth, a sizeable pick up in remittances and exports, low real domestic and external interest rates have contributed to a sharp reduction in public debt. A series of external developments and measures helped turn the debt dynamics around from late-2001. A Paris Club restructuring agreement in December 2001 allowed for a substantial easing of the external debt service burden, as did the simultaneous restructuring of $600 million in Eurobonds and $500 million in short-term credits held by commercial banks. Fiscal policy was tightened, and the primary surplus averaged over 2 percent of GDP between 2001/02 and 2003/04. Domestic interest rates gradually declined, allowing for a lowering of the government’s cost of borrowing at the margin. Accelerating economic activity and rising confidence in the economy created favorable conditions for the government to tap the external debt market in 2004. This made possible the retirement of existing high-interest external debt, financed by new, lower interest liabilities.
Source: IMF country reports, and staff estimates and calculations.
Pakistan: Contributions to the Change in Public Debt Stock end of 2000 to 2005(percentage of GDP)
-35
-30
-25
-20
-15
-10
-5
0
5
10
Pakistan-35
-30
-25
-20
-15
-10
-5
0
5
10Total Change in Gross
Debt
Primary Non-Oil Balance
Contribution
Growth Contribution
Interest Rate Contribution
RER Contribution
Privatization
Other

16
• Rich oil producers can relatively quickly tap their vast natural resources, which allows for an easy access to financing. The region includes three of the ten top world producers of oil, and five out of the ten top net exporters. In addition, five (including Iraq) of the top ten countries with the highest proven reserves are in the Middle East.
• Oil producers generally hold assets close to, or exceeding, their debt levels. This lowers vulnerability and improves market confidence, but raises the question of optimal fiscal management. The high levels of gross debt in oil-producing countries relative to assets can be attributed to asset management policies (e.g., to exploit positive interest rate differentials between external assets and domestic liabilities); rigidities in oil fund operations; or sterilization needs.
• There is very little marketable debt in the region—on which most defaults occur. Except for Lebanon and Qatar, most of the external debt is held by official creditors (bilateral and multilateral). Domestic debt may have non-market terms in a number of countries.
• Borrowing conditions were favorable. The effective interest rate on external debt in the countries for which data was available averaged 3 percent - low compared to levels in emerging markets. However, Lebanon, which borrowed mostly from private creditors, paid a substantially higher interest rate of 17 percent.
• Middle and low income non-oil producers have benefited from a number of Paris Club reschedulings through the nineties and early 2000s (Table 1).
Table 1. Paris Club Reschedulings
1990 1991 1992 1993 1994 1995 1996 1997 1998 1999 2000 2001 2002 Algeria √ √ Djibouti √ Egypt √ Jordan √ √ √ √ √ Mauritania √ √ √ √ Morocco √ √ Pakistan √ √ Yemen √

17
• There exists a large and dedicated regional investor base that has enhanced market confidence. This is particularly striking in the case of Lebanon where such investors have allowed the country to sustain very high levels of debt (Box 4).
• The countries in the region are highly monetized, with a broad money-to-GDP ratio of 67 percent on average during the period. By comparison, IMF (2003) found that for defaulters this ratio was on average around 30 percent, while for non-defaulters it was around 70 percent. Domestic debt as a ratio of M3 (a measure of the intermediation of the banking system) is relatively high in the region, at around 55 percent.
• There was a conscious effort of some countries (e.g., Jordan and Morocco) to replace external nonconcessional debt with domestic (local currency) debt, with a view to reducing the cost of debt service, and limiting external vulnerabilities. Eichengreen et al. (2003) show that borrowing in domestic currency reduces the risk of a debt crisis.

18
Box 4. Lebanon—Living with High Public Debt
Lebanon’s debt situation has deteriorated dramatically since 1994. Lebanon’s debt-to-GDP ratio reached 176 percent of GDP in 2005, and is expected to increase further due to the conflict with Israel; about half of the debt is denominated in foreign currency. Up to 2002, the increase in debt was mostly explained through the large primary deficits, but these have been turned into surpluses in 2003 through 2005. In addition, the negative impact from high real interest rates on debt accumulation, was moderated by the Paris II rescheduling in 2002 and generally lower interest rates since then. The pick-up in economic growth between 2002 and 2004 has also contributed to stabilizing the debt-to-GDP ratio. The public-sector balance sheet has long been the country’s key vulnerability: gross public debt (excluding monetary liabilities) of over 175 percent of GDP and gross financing needs of over 65 percent of GDP in 2005 are far beyond the ratios typically seen in emerging market countries. The structure of Lebanon’s public debt stock entails risks related to (1) the exchange rate, because foreign-currency denominated debt is high; (2) rollover, since at least one quarter of debt has a residual maturity of a year or less; and (3) interest rates, because of the short average maturity. The main rollover and interest rate risks of the public sector are borne by the domestic banking system, which constitutes the public sector’s main funding source. Less than 20 percent of the public sector’s debt is owed to nonresidents (who mostly hold foreign-currency debt). The remainder of the public debt is held by residents, mainly domestic banks. Thus, it is the domestic banking sector’s willingness to roll over its public debt holdings—without demanding a much larger risk premium—that determines the sustainability of public debt. Banks’ ability to roll over the public debt, in turn, depends on their ability to renew their own monetary liabilities. The impressive growth of the banking sector’s deposit base—to about 300 percent of GDP—has made its financing of the government possible. More fundamentally, some factors specific to Lebanon may explain the remarkable resilience of its banking system. The continuous funding of very high public financing needs through the domestic banking system is made possible by a large and dedicated depositor base (i.e., Lebanese Diaspora and Arab investors). Indeed, indications are that inflows from regional investors have increased as a result of events post-September 11. The government’s ability to mobilize extraordinary levels of official financing (such as under the donor conference of Paris II) may also play a role. Maintaining confidence in the domestic banking system is thus key to Lebanon’s financial sustainability. And, in the absence of substantial foreign assistance, the aftermath of the events of July 2006 is likely to put further strain on Lebanon’s public finances.
Lebanon: Contributions to the Change in Public Debt Stock end of 2000 to 2005(percentage of GDP)
-40
-30
-20
-10
0
10
20
30
40
50
60
Lebanon-40
-30
-20
-10
0
10
20
30
40
50
60Total Change in Gross
Debt
PrivatizationPrimary Non-Oil
Balance Contribution
Growth Contribution
Interest Rate Contribution
RER Contribution Other
Source: IMF country reports, and staff estimates and calculations.

19
III. IS THE PUBLIC DEBT LEVEL SUSTAINABLE?
Fiscal sustainability can be defined as the government’s ability to maintain its current policies while remaining solvent (Burnside, 2004).16 It is assessed in this paper by (1) measuring the primary gap, as the difference between the actual primary balance and the primary balance needed, first, to stabilize the debt-to-GDP ratio, and second, to bring the ratio down to a targeted level; and (2) assessing whether past reactions of primary balances to debt levels are consistent with solvency.
Both approaches take historical policies as an indicator of what is politically and socially feasible in the future. The first method imposes a strong assumption that primary balances and key macroeconomic variables remain constant, and constrains the debt to an arbitrary targeted limit. The second method interprets the historical policy more generally, as it takes into account past policy reactions to macroeconomic developments. It does not require specific assumptions about macroeconomic variables, and tolerates debt fluctuations above the targeted level, assuming that future government responses to the higher debt are a sufficient guarantee for investors.
The two approaches are complementary: the first allows for a country-by-country sustainability assessment but imposes stronger assumptions and constraints; the second is less stringent but, because of short time series, does not allow for a country-specific analysis.
The analysis for oil-producers assumes, in addition, that sustainability requires an optimal distribution of the government wealth across generations. But it adopts similar approaches to check the sustainability of constant primary balance paths and historical policy responses.
A. Are Historical Primary Balances Sustainable?
Non-oil producing countries For non-oil producers, sustainability is assessed by comparing average historical primary balances with a level consistent with a targeted debt ratio, given historical averages for interest and growth rates. The primary gap is first measured as the difference between the current primary balance and the level that stabilizes the debt-to-GDP ratio at the 2005 value. But even if the primary balance is sufficient to stabilize the debt ratio, higher than expected interest rates or lower growth may, for example, render policies unsustainable, forcing the government to adjust. Decreasing the debt ratio to a “safe” level reduces these vulnerabilities, and in the second exercise the primary gap is measured as the difference between the average primary balances and the level needed to bring the debt to 50 percent of GDP over an arbitrarily chosen period of ten years. While maintaining current debt ratios appears feasible with historical policies, substantial fiscal adjustments would be needed to reduce the debt to the “safe” level (Figure 12): 16 A country is broadly defined to be solvent if it is able to generate sufficient future primary surpluses to repay its existing debt.

20
• Of the eight non-oil countries in the sample, only two run average primary balances that are below the level needed to stabilize their debts at the current level (the lower bar in Figure 11). Both Djibouti and Lebanon would have to adjust by 3 percentage points of GDP compared to the historical average to stabilize their current debt levels. The significant adjustment for Lebanon is due not only to the high debt level, but also to the particularly high effective interest rates. Djibouti needs to adjust even under the assumption that the real interest rate would remain at the historically negative level.
• The 2005 debt level is above 50 percent for all non-oil countries. Only three countries, Jordan, Tunisia, and Pakistan are running “sustainable” average primary balances according to this benchmark (the upper bar in Figure 12). Lebanon would need to run a primary surplus about 17 percentage points of GDP per year higher than the historical average to reach the target ratio.
There are, of course, many caveats to this assessment, including that (1) the “safe” debt target is unknown, given uncertainties about future interest and growth rates, about possible contingent liabilities, and about governments’ ability to adjust in case of macroeconomic shocks; and (2) there are multiple primary balance paths consistent with sustainability, some more back-loaded than assumed in the analysis. And as discussed in the previous section, there seem to be good reasons to expect countries in the region to be able to finance larger debt ratios than those other regions. Oil producing countries For oil producers, debt sustainability is assessed by comparing actual non-oil primary balances with levels generated by the permanent oil income model (POIM). While the stream of revenues from oil can be distributed across generations in many ways, a sharp correction in expenditures upon exhaustion of oil reserves would likely be economically, politically and socially undesirable. In the POIM, the government smoothes oil-financed expenditures by using permanent income (a notional return from government wealth), rather than current oil revenue, to finance non-oil primary balances. The government wealth is defined as a sum of oil wealth (future oil revenues discounted by a real interest rate) and current net financial assets. Since the return on accumulated financial assets continues financing consumption once oil revenue has dried up, the POIM permanent income can indefinitely finance a constant non-oil primary balance without changing the government wealth.17 The POIM specification adopted in this paper fixes this non-oil primary balance in real terms, implying a declining non-oil-deficit-to-no-oil-GDP ratio (assuming a positive non-oil GDP growth). Appendix II derives the POIM and discusses alternative specifications.
17 The return on accumulated government financial assets continues financing consumption once oil revenue has dried up.

21
Figure 12. Primary Balance: Historical Average and the Range of Estimates Consistent with Sustainability(percent of GDP)
Average primary balance
-15
-10
-5
0
5
10
15
Djibouti Egypt Jordan Lebanon Mauritania Morocco Pakistan Tunisia -15
-10
-5
0
5
10
15Upper bound: Reducing debt/GDP ratio to 50%
Lower bound: Stabilizing debt/GDP ratio at 2005 level
Source: IMF country reports, and staff estimates and calculations. We consider a range of estimates for the present value of oil revenue under various assumptions about long-term trends in oil prices: the assumed trend growth in nominal prices is close to zero in the “conservative-price scenario”, and at the rate of U.S. inflation in the “optimistic-price scenario” (see Appendix II for details). We use total external assets (excluding central bank reserves) and data on debt collected from staff reports for calculating net financial assets. 18 While the fiscal position in most of oil producers appears comfortable, the exercise indicate risks for some countries, particularly in the middle-income group (Figure 12): • For most rich oil producers, non-oil primary balances in 2003 are close to or above
the level consistent with the POIM even under conservative oil wealth projections (upper bar in Figure 12).19 The notable exception is Oman, where the non-oil primary balance is well below the estimated sustainable level even in the optimistic scenario (lower bar in Figure 12).
18 This proxy for financial assets may be particularly weak for large off-shore financial centers such as Bahrain, which is dropped from this exercise and from the econometric analysis in the following section. Moreover, the accumulation of assets in 2005 is not included due to missing data.
19 The 2003—rather than average—primary balance is considered because under the POIM the ratio of non-oil primary balance to non-oil GDP declines with non-oil GDP. Using sample average primary balances would underestimate the required fiscal adjustment.
22
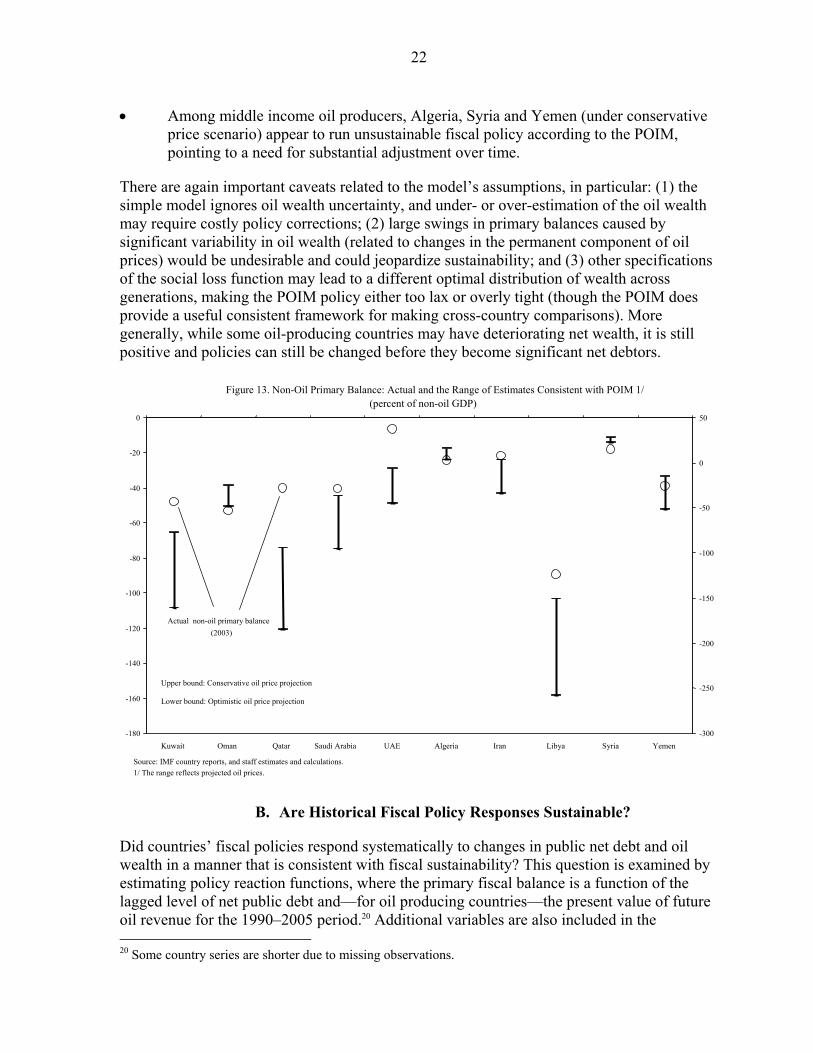
• Among middle income oil producers, Algeria, Syria and Yemen (under conservative price scenario) appear to run unsustainable fiscal policy according to the POIM, pointing to a need for substantial adjustment over time.
There are again important caveats related to the model’s assumptions, in particular: (1) the simple model ignores oil wealth uncertainty, and under- or over-estimation of the oil wealth may require costly policy corrections; (2) large swings in primary balances caused by significant variability in oil wealth (related to changes in the permanent component of oil prices) would be undesirable and could jeopardize sustainability; and (3) other specifications of the social loss function may lead to a different optimal distribution of wealth across generations, making the POIM policy either too lax or overly tight (though the POIM does provide a useful consistent framework for making cross-country comparisons). More generally, while some oil-producing countries may have deteriorating net wealth, it is still positive and policies can still be changed before they become significant net debtors.
B. Are Historical Fiscal Policy Responses Sustainable?
Did countries’ fiscal policies respond systematically to changes in public net debt and oil wealth in a manner that is consistent with fiscal sustainability? This question is examined by estimating policy reaction functions, where the primary fiscal balance is a function of the lagged level of net public debt and—for oil producing countries—the present value of future oil revenue for the 1990–2005 period.20 Additional variables are also included in the 20 Some country series are shorter due to missing observations.
Figure 13. Non-Oil Primary Balance: Actual and the Range of Estimates Consistent with POIM 1/ (percent of non-oil GDP)
Actual non-oil primary balance (2003)
-180
-160
-140
-120
-100
-80
-60
-40
-20
0
Kuwait Oman Qatar Saudi Arabia UAE Algeria Iran Libya Syria Yemen -300
-250
-200
-150
-100
-50
0
50
Upper bound: Conservative oil price projection Lower bound: Optimistic oil price projection
Source: IMF country reports, and staff estimates and calculations. 1/ The range reflects projected oil prices.

23
regressions to assess the fiscal impact of cyclical and structural factors. Revenue and expenditure equations are estimated separately to assess the mechanism of policy adjustment. This allows us to determine the relative contribution of revenue and expenditure adjustments. The analysis is again conducted separately for oil and non-oil countries: • For non-oil producers, we test whether fiscal policy is tightened in response to
increases in their debt-to-GDP ratios. A positive response of primary balances to changes in the debt ratio ensures long-term sustainability, defined as the ability to generate primary balances sufficiently high to ensure solvency in the long run. Intuitively, if the debt ratio keeps growing, fiscal policy will eventually respond by moving toward primary surpluses.21
• For oil producers, we test whether fiscal policies are consistent with the POIM, and whether they systematically react to changes in the net financial wealth-to-GDP ratio as required for sustainability in oil economies. Compared to the analysis in the previous section, the econometric approach is more general by allowing for short-term deviations from the POIM-consistent levels and, even if the POIM model is rejected, for a more general notion of sustainability (as in the analysis for non-oil countries).
Short data series preclude estimations of separate models for individual countries, which has the drawback of losing the country-specific focus. The results—for both oil and non-oil countries—hold only on average in groups, potentially masking vulnerabilities in individual countries. Non-oil producing countries In non-oil countries, the primary balance is modeled as a function of the lagged debt-to-GDP ratio and control variables, including (log) deviations of output and oil price from trend. The output gap is included to capture fiscal policy responses to cyclical fluctuations, and the oil price gap to capture potential links between oil and non-oil countries indicated in Section II.A. Structural country characteristics are captured by country dummies. A dynamic specification of the model is also estimated as a robustness check.22 The results suggest that fiscal policies are on average sustainable for non-oil countries (Table 2): • Fiscal policy reacts strongly to changes in debt level, ensuring sustainability on
average in this group. The positive and highly statistically significant value of the coefficient of public debt in all specifications ensures long-term solvency, which is necessary for sustainability as explained above. The coefficient on lagged debt in the
21 Bohn (1998) shows that a strictly positive and at least linear response of the primary balance to changes in the debt ratio is sufficient for long-term sustainability.
22 Since the dynamic specification is estimated on first-differences, it also checks against a possibility of spurious regression among the series that are likely non-stationary.

24
estimated reaction suggests that the primary balance improves between 0.5 to 0.8 percent of GDP for every 10 percentage point of GDP increase in public debt. These values also seem consistent with mean-reversibility of the debt ratio, i.e., debt ratios do not deviate from their long-run means for a prolonged period of time.23
• Countries react primarily by adjusting revenues. For every 10 percentage point increase in the debt to GDP ratio, the revenue ratio increases by 0.4 percent. Expenditures react with the correct sign, but the effect is not statistically significant.
• A systematic relationship between the output gap and the primary balance is hard to detect as cyclical fluctuations in output do not appear to strongly affect the primary balance.24 Neither the output gap, nor the oil price gap turned out statistically significant in any of the specifications. This suggests that the automatic stabilizers do not play a role in these countries, possibly due to weak tax buoyancy and a lack of well-functioning social safety nets designed to compensate the poor during temporary economic downturns. With respect to fiscal revenue, this could be due to the fact that particularly volatile economic sectors, such as agriculture and exports, are generally little taxed.25
23 Bohn (1998) shows that debt dynamics is mean-reversing if the value of the coefficient of public debt is higher than the difference between real interest rate and GDP growth rate.
24 Coefficients of output gap were low and insignificant in both the revenue and expenditure equations and have been dropped from the reported specifications
25 The correlation between the output gap and revenues is not always straightforward. For example, a downturn in agricultural production may lead to an increase in food imports, which could to be subject to high tariffs. In such a case, the expected relation between cyclical factors and tax revenue would be reversed.
Revenue / GDP Expenditure /
GDP
Debt_1 / GDP_1 0.083** 0.048*** 0.061*** 0.039*** -0.022 Output gap -0.039 0.111 Oil prices gap -0.022 Primary balance_1 / GDP_1 0.492***Output gap > 0 -0.344 Constant -0.112*** 0.000 -0.096*** 0.189*** 0.289***
R2 0.32 0.19 0.19 0.02 N 104 95 104 104 104 * p<.1; ** p<.05; *** p<.01. All specifications include fixed effect, except dynamic baseline estimated using Arellano-Bond method.
Primary balance / GDP
Table 2. Regression Results for Non-Oil Countries
Dependent variable

25
Oil producing countries The non-oil primary balance is modeled as a function of the present value of oil revenue and past net debt, both as ratios to non-oil GDP.26,27 This specification allows for detecting a policy consistent with the POIM, but also for a more general test for sustainability, similar to the test for non-oil countries. The policy is consistent with the POIM if coefficients of the present value of oil revenue and of the net debt are both close to the real interest rate and the constant term is zero (see Appendix II for a derivation). The policy is sustainable in a more general sense if primary fiscal balances increase with net debt. The model includes the same control variables as for the non-oil countries; a dynamic specification is also estimated.
The results show that the policies seem not to be driven by the POIM, but appear on average sustainable (Table 3): • The analysis cannot affirm that fiscal policies are consistent with POIM. The
coefficient of the present value of oil revenue has a small and insignificant sign. This may reflect a violation of some of the strong assumptions of the model: the optimal distribution of the government wealth may be different than implied by the simple POIM model; or uncertainty about future oil prices and production may limit government’s propensity to spend out of the permanent income.28 It could also imply that governments do not generally follow a policy of spreading wealth equally across generations, but rather react to the current price of oil and debt developments (see below).
• The link between the non-oil primary balance and net debt is strong, indicating that policies are sustainable. The coefficient of the net debt is positive and significantly different from zero, which is sufficient for sustainability. An increase in the net debt ratio of 10 percent of GDP will improve the primary balance by about 0.3 percent of GDP. The presence of oil does not alter this conclusion: current oil revenue provides non-debt financing (improving sustainability compared to the non-oil case), and any other financing is reflected in the accumulation of debt (or reduction of assets), which in turn leads to a future fiscal tightening as in the non-oil case.
26 The present value of oil revenue is defined as in section IIIA under the “conservative-price scenario”. Net debt is the negative of net financial assets defined above. The first specification in Table 3 allows for a different effect of debt and assets on the primary balance (Table 3). Restricting these effects to have the same absolute value is not rejected at any conventional significance level. Thus, in the subsequent specifications gross debt and assets were replaced by net debt.
27 Bahrain is excluded from the sample. Libya is also excluded, as the dynamics of primary balances and debt changed significantly after lifting UN sanctions, distorting results in the sample including this episode.
28 The time variation in the estimated oil wealth may be small if, in the government’s perception, oil prices revert to a certain mean value (are mean-stationary).

26
• The effect of cyclical changes in oil prices on the non-oil primary balance is weak. A negative and low (in absolute value) coefficient of the oil price gap29 indicates that the policy is on average pro-cyclical (a decline in oil prices triggers policy tightening), but the pro-cyclicality is weak. A decrease in the oil price gap by 10 percent increases the non-oil primary balance by 0.8 percent of non-oil GDP.30 There is no econometric evidence for an asymmetric response of non-oil balances to the oil price gap: the positively restricted oil price gap coefficient is positive but not statistically significant. Similarly, the coefficient of the non-oil output gap is insignificant.
• Expenditures react more strongly to cyclical changes in oil prices than non-oil revenues, although both responses are weak. This suggests that oil-countries adjust to changes in oil prices mainly by adjusting expenditures. The effects of oil price deviations and debt changes on revenues and expenditures seem symmetric.
C. What Are Current Vulnerabilities?
While the preceding analysis indicates that fiscal positions appear to be generally sustainable, it also points to a number of sources of vulnerability that remain of concern looking forward: • The volatility of oil revenue and grants is an important vulnerability in the region.
This is particularly important given that fiscal adjustments—particularly in non-oil producing countries—rely heavily on revenue mobilization due to rigidities in expenditures.
29 The gap is defined as a logarithmic difference between the actual price and the HP-filtered trend.
30 Since oil revenues are typically higher that the non-oil GDP, a decline in oil prices by 10 percent is often equivalent to a reduction in total revenue in excess of 10 percent. According to the estimates, a reduction of this size leads to a very modest reduction in expenditures (and even a smaller increase in non-oil revenues), leaving the non-oil primary balance only less than one percentage point of non-oil GDP stronger than before the shock.
Non-oil rev. / non- oil GDP
Expenditure / non-oil GDP
Debt_1 / non-oil GDP 0.027 Non-oil output gap -0.125Oil prices gap -0.079* -0.078** -0.058* -0.162** -0.077** 0.056** 0.152***Assets_1 / non-oil GDP -0.032***Oil wealth / non-oil GDP 0.000Net debt_1 / non-oil GDP 0.031*** 0.033*** 0.030*** 0.029*** 0.022*** -0.010*Non-oil primary balance_1 / non-oil GDP_1 0.442***Oil price gap > 0 0.195Net debt in low income countries 0.021 Constant -0.284*** -0.288*** -0.003 -0.303*** -0.295*** 0.219*** 0.517***
r2 0.221 0.219 0.239 0.225 0.198 0.199N 108 108 99 108 108 108 108
* p<.1; ** p<.05; *** p<.01. All specifications include fixed effect, except dynamic baseline estimated using Arellano-Bond method.
Table 3. Regression Results for Oil-Producing Countries
Dependent variable
Non-oil primary balance / non-oil GDP

27
• The weakness in data coverage, in particular the narrowness of coverage and large off-budget operations, and the lack of systematic data on contingent liabilities, is a major source of vulnerability, as government liabilities may arise without forewarning and preparation.
• The stable regional financing base has insulated some countries from global market reactions in the past, but a gradual opening up of the region to international capital markets may eliminate this cushion over time, although the near future will probably entail high liquidity as long as oil prices stay high.
• While rising domestic debt can be seen as a more “secure” substitute to external debt, if not managed properly, it can led to inflation, low growth, and a loss of confidence. Although debt ratios are on a declining trend, rising interest rates and crowding out of private sector investment could stifle growth and perpetuate debt since debt levels are still relatively high for non-oil producing countries.
IV. CONCLUSIONS
Public debt in the Middle East rose during the mid-nineties mainly due to large non-oil primary deficits in oil producing countries. At the time, volatile oil revenues were at a low in these countries and they did not fully adjust to this temporary shock. Debt has decreased in recent years, mainly due to high oil revenue. Thus, in oil-producing countries fiscal policy has been procyclical with respect to both oil prices and growth. In non-oil countries, growth, some primary fiscal adjustment, and debt relief contributed to a decline in debt levels. On average, fiscal policies have adequately reacted to past high indebtedness and have avoided default or debt crises. But while countries in the Middle East have fared well so far, public debt levels remain uncomfortably high in many economies, particularly in non-oil producing countries and middle income oil producers. For non-oil producing countries, a substantial adjustment of the primary balance would be needed to bring debt down to a safer level. Non-oil producing countries also adjust mainly by increasing revenues, which suggests the need to increase expenditure flexibility. Middle-income oil producing countries may need to adjust if they want to bring their policies in line with the permanent oil income model (POIM). Specific policy recommendations need take into account the uncertainties surrounding the permanent oil benchmark and country specific differences. The fiscal position in higher-income oil producers appears sustainable but not necessarily in line with the POIM.

28
Appendix I
DATA ISSUES Reliable and consistent time series data is a major requirement for studying public debt and fiscal sustainability and vulnerability. The dataset constructed for this study contains fiscal and public debt data for the 19 countries from 1990 to 2005 obtained from IMF staff reports and country economists. There were several issues in the compilation of the data set, ranging from missing series to inconsistencies and less than adequate coverage of the public sector. Notwithstanding these shortcomings, a reasonably comprehensive dataset was constructed, covering fiscal flows, and external and domestic debt stock for most countries and allowing for a cross-country analysis of debt and fiscal policy response in the region. Some of the empirical work uses a shorter period—1999–2004—because of gaps in the data prior to 1999. Data availability Data on fiscal flows (revenue, expenditure, the deficit and its financing) are typically easily available, especially for central governments, but there were a number of gaps for individual countries. In particular, there were no data for UAE prior to 1999 because of the lack of revenue figures for Abu Dhabi Investment Authority (ADIA); for Egypt data prior to 1999 were unavailable due to a structural break in the series; for Pakistan there was no breakdown of fiscal expenditures related to salaries and wages due to inconsistency of their expenditure management system with IMF economic classifications; and Qatar’s total financing data for 1990–92 are missing. In addition, data are missing for Kuwait during 1990–93 due to first Gulf War disruption. Details on official versus private external financing are lacking in the majority of sample countries. Public debt data narrowly defined to include the sum of the government’s liabilities31 are available for most countries from the beginning of the sample period (1990). Iran, Egypt and UAE, however, started producing this data in the late 1990s. Detailed data on the composition of debt are generally missing. Few countries report information on the currency denomination of debt (local or foreign), the maturity (short term and long term), and the type of interest rate (fixed or indexed). The breakdown of external debt between private and official debtors is also often not explicit.
31 Public debt should be defined as the sum of government liabilities arising from borrowing or from not paying its obligations. When assessing debt sustainability, it is useful to include contingent liabilities such as government guaranteed debt and unfunded liabilities that can generate future obligations such as pension systems and cost of bank and enterprise restructuring.

29
Data on government domestic and external assets in many cases are not available, mostly due to secrecy reasons. In particular, data on external assets for GCC countries are almost non-existent. The stock of portfolio debt securities, bank deposits and other debt instruments estimated by Lane and Milesi-Ferretti (2005) are used as a proxy. The estimates are mainly based on country’s reported international investment position, claims by non-bank domestic residents on BIS-reporting banks, and foreign assets hold by commercial banks and other banking institutions reported in IFS. Figure A1 compares series from the Lane and Milesi-Ferretti database (“LMF”) with claims by non-bank domestic residents on BIS-reporting banks, which is a more standard measure of external assets (“BIS”). Data coverage Middle Eastern countries tend to have a narrow coverage of public sector data compared to other regions, particularly Latin America. This hampers the assessment of fiscal and debt sustainability and vulnerability. For fiscal flows 2 countries report data for public sector (Iran and UAE(partially)), 2 for general government (Egypt and Pakistan,), and the remainder for central government only. Regarding public debt, 5 report data for public sector (Egypt, Libya, Oman, Saudi Arabia, and UAE), 3 for general government (Jordan, Pakistan, and Tunisia), and the remaining 11 for central government. Data on contingent liabilities such as future pension obligations, potential costs of bank restructuring, or guarantees in public private partnerships (PPPs) are not available in most instances. This is an important shortcoming not only for countries with high debt, but also for those with what appear to be benign debt profiles, as such liabilities—particularly costs of bank restructuring—can be substantial. Long-term external debt trends are analyzed based on WB GDF data. The coverage of these data is often broader than in staff reports, and includes public sector debt. Figure A1 compares data from the WB GDF (“WB”), Arab Monetary Fund (“AMF”) and staff reports (“MCD data”).
Figure A1. External Debt Data Comparison for Oil Countries(percent of non-oil GDP)
Source: Staff estimates based on IMF IFS, IMF WEO, Lane and Milesi-Ferretti (2005) and WB GDF.
15
25
35
45
55
65
75
1991 1992 1993 1994 1995 1996 1997 1998 1999 2000 2001 2002 2003 200415
20
25
30
35
40
45
50
55
External debt (MCD data)
External debt (AMF)
External debt (WB)
50
100
150
200
250
300
350
400
1991 1992 1993 1994 1995 1996 1997 1998 1999 2000 2001 2002 2003 200450
100
150
200
250
300
350
400
External assets (LMF)
External assets (BIS)

30
Appendix II
Specification of the Fiscal Policy and the Revenue/Expenditure Reaction Functions The fiscal policy reaction functions are estimated separately for non-oil and oil producing countries, covering period 1990–2005. Since some country series are incomplete, the panels are imbalanced. Specification for non-oil producers follows Bohn (1998) and IMF (2003):32 , , , 1 ,i t i i t i t i tp X bα β ρ ε−= + + + (1) where p is the primary balance, b is debt stock (both measured as percentages of GDP), X is a vector of control variables, and i and t are country and time subscripts, respectively. The parameter ρ captures the effect of the public debt stock on the primary balance, A positive coefficient guarantees fiscal sustainability as explained in the main text. The reaction function for oil producers is derived from the permanent oil income model (POIM). The POIM is derived by maximizing social welfare function, which depends on government expenditures other than financed by non-oil revenue:
{ } 1
1
1
max ( )t t
tt
pb t
U pbβ∞=
∞−
=
−∑
(where pb stands for government non-oil primary balance deflated by non-GDP deflator), subject to the government budget constraint:
1(1 )t t t tb r b pb z−= + − − where b is government net debt, z is oil revenue (both deflated by non-GDP deflator) and r is real interest rate. Imposing the usual transversality condition and assuming that (1 ) 1rb + = gives the following expression for the optimal non-oil primary government balance:
s
tsTt
tst z
rrrrbpb
−+
=− ∑ ⎟
⎠⎞
⎜⎝⎛++
−=1
111
The optimal non-oil primary balance can be expressed as a function of government wealth,
defined as a sum of net financial assets and oil wealth ( s
tsTt
tstt z
rrbw
−+
=− ∑ ⎟
⎠⎞
⎜⎝⎛++
+−=1
11
11 ):
trwpb −=
32 Kumar et al. (2005) Abiad and Baig (2005) use similar specifications.

31
While the derived optimal policy is a useful benchmark to assess the actual behavior of non-oil primary balances, it strongly depends on assumptions: • Uncertainty, particularly regarding oil wealth, requires higher primary balances if
governments are risk averse.
• Large swings in primary balances caused by significant variability in oil wealth (related to changes in the permanent component of oil prices) may be suboptimal if consumers become addicted to the level of consumption enjoyed in previous periods (“habit formation”) (Leigh and Olters, 2006).
• Other specifications of the social welfare function may lead to a different optimal distribution of wealth across generations. For instance, the welfare function could be specified in per capita terms, allocating a greater share of government wealth to younger generations (assuming a positive population growth). But younger generations are likely better off than older generations if per capita non-oil GDP growth is positive, offsetting the effect of a lower consumption from wealth in the specification proposed in our paper. Alternatively, the welfare function could be expressed in terms of non-oil GDP, which would also imply a greater share of the government wealth spent by younger generations (assuming a positive non-oil GDP growth). But again it is unlikely to be socially optimal, given that younger generations would enjoy improved living standards from the higher non-oil GDP. 33
• The inclusion of other non-financial elements of the public sector balance sheet may change the assessment of sustainability. It may also require a different treatment of government consumption and investment spending, as the latter improves the broadly defined balance sheet of the public sector.
• Empirical specification based on this model has the following form:
, , , 1 , ,i t i i t i t i t i tp X b wα β ρ γ ε−= + + + +
where p is the primary balance, b is debt stock, w is oil wealth measured as percentages of non-oil GDP at the time t (note that the optimality condition is not derived for variables expressed as ratios to non-oil GDP: dividing the variables by the non-oil GDP is to facilitate a more general test for sustainability), X is a vector of control variables, and i and t are country and time subscripts, respectively. The parameter ρ captures the effect of the public debt stock on the primary balance and γ is the effect of oil-wealth. This equation is an empirical counterpart of the optimal non-oil primary government balance function derived above, but, as explained in the main text, it also allows for a more general test for sustainability in line with Bohn (1998). The empirical specification would be consistent with 33 Engel and Valdes (2000) develop a model more fully addressing intergenerational equity concerns when government spending is financed by taxes on non-oil activities, which is growing along with per-capita non-oil GDP.

32
the optimal non-oil primary balance derived above if ,1
rrr
ρ γ= =+
and, under the
condition that the sample mean of ,i tX is zero, if country effects iα are all zeros. If average country effects (constant terms reported in tables 2 and 3 in the text) are zero, empirical results are on average consistent with the theoretical optimal non-oil primary balance specification for the sample of countries. Control variables for oil producers include non-oil output gap (defined as a relative deviation of real non-oil GDP from the Hodrick-Prescott (HP) trend) and the oil-price gap (the relative deviation of the oil price from its HP trend). The specification for non-oil producers includes output gap and oil-price gap as percentages of GDP. Extensions of the baseline model allow for non-linearities in the relationship between the primary balance on one hand, and the public debt and cyclical factors on the other. Alternative specifications permit the following: (i) asymmetric effects of positive and negative output gaps on the primary balance; (ii) asymmetric effects of above- and below-trend oil prices; and (iii) debt and oil wealth in sub-groups (due to the limited number of observations differences in sub-groups are tested only for oil producers). A different fiscal response depending on whether the public debt is beyond a certain threshold is also tested (captured by the spline coefficient determined so as to maximize the goodness of fit of the regression), but estimated effects were non-significant. The revenue and expenditure functions are specified as the baseline fiscal policy reaction functions, separately for oil producers and non-oil producers, with revenue and total expenditure as dependent variables. Oil wealth in local currency is estimated sequentially based on information available to policymakers at any given year and using the following main assumptions: • Future production levels are fixed at the last observable level in energy-equivalent
terms. Since most of the oil producing countries do not fully exploit their gas reserves, the share of gas is assumed to increase in the future production stream, maintaining the energy content unchanged. Data on oil and gas production and oil reserves, used to estimate the remaining production stream, are taken from Energy Information Administration. Gas data are transformed to oil equivalent assuming that the energy content of one barrel of oil and 5487 cubic feet of natural gas is the same.
• Future oil prices (in USD) are projected assuming that prices follow a two-factor model as in Schwartz and Smith (2000) (the model is re-estimated using 1990–2005 data for spot prices and 12 and 24 month-ahead WTI futures). The model assumes that long-run equilibrium prices follow a random walk with drift with short-term deviations following a Ornstein-Uhlenbeck process. Figure A2 presents spot and equilibrium prices and 12 month-ahead futures in the sample. The estimated drift rate is close to zero and is used in “conservative” estimates of oil wealth. Optimistic

33
estimates of oil wealth replace the estimated value with the assumed long-term rate US inflation rate at 2 percent per year (Figure A3).
• Inflation, real interest rates, and real exchange rates are constant, and PPP holds.
• Real interest rate and discount rate is 3 percent.
Figure A2. Estimated Equilibrium Prices, Spot and Future Prices in the Sample
2.40
2.60
2.80
3.00
3.20
3.40
3.60
3.80
4.00
4.20
4.40
Jan-90 Jan-91 Jan-92 Jan-93 Jan-94 Jan-95 Jan-96 Jan-97 Jan-98 Jan-99 Jan-00 Jan-01 Jan-02 Jan-03 Jan-04 Jan-052.4
2.6
2.8
3
3.2
3.4
3.6
3.8
4
4.2
4.4
oil price (log)
predicted equilibrium price (log)
12-month futures (log)
Source: Datastream and IMF staff estimates.

34
Figure A3. Oil Wealth: Range of Estimates (percent of non-oil GDP)
0
1000
2000
3000
4000
5000
6000
Kuwait Oman Qatar Saudi Arabia UAE Algeria Iran Libya Syria Yemen 0
1000
2000
3000
4000
5000
6000
7000
8000
9000Oil wealth (conservative)Oil wealth (optimistic)
Source: IMF country reports, and staff estimates and calculations.

35
References
Abiad, Abdul and Taimur Baig, 2005, “Underlying Factors Driving Fiscal Effort in Emerging Market Economies,” IMF Working Paper No. 05/106 (Washington: International Monetary Fund).
Barnett, S. and R. Ossowski, 2003, “Operational Aspects of Fiscal Policy in Oil-Producing
Countries”, in Fiscal Policy Formulation and Implementation in Oil-Producing Coutries, ed. by J. Davis, R. Ossowski, and A. Fedelino (Washington: International Monetary Fund).
Burnside, C., 2004 “Assessing New Approaches to Fiscal Sustainability Analysis.” World
Bank, mimeo, September 2004. Crandall, W. and J.-P. Bodin, 2005, “Revenue Administration Reform in Middle-Eastern
Countries, 1994-2004,” IMF Working Paper No. 05/203, (Washington: International Monetary Fund).
Creane, S. Goyal, R., Mobarak, A. M., and R. Saab, 2004, “Financial Sector Developments
in the Middle East and North Africa,” IMF Working Paper No. 04/201, (Washington: International Monetary Fund).
Bohn, Henning, 1998, “The Behavior of U.S. Public Debt and Deficits”, The Quarterly
Journal of Economics, August 1998, 949-963. Eichengreen, B, Hausmann, R, and U. Panizza, 2003 , “Currency Mismatches, Debt
Intolerance and Original Sin: Why They Are Not the Same and Why it Matters”, National Bureau of Economic Research, Inc, NBER Working Papers: 10036.
E. Engel and R. Valdes, “Optimal Fiscal Strategy for Oil Exporting Countries”, Working
Paper No. 78, Center of Applied Economics (CEA), Dep. Ind. Engineering, U. of Chile, June 2000.
Hakura, D., 2004, “Growth in the Middle East and North Africa,” IMF Working Paper
No. 04/56, (Washington: International Monetary Fund). International Monetary Fund, 2003, “Public Debt in Emerging Markets: Is it Too High”,
World Economic Outlook, September 2003, (Washington: International Monetary Fund).
M. Kumar and F. Balassone, 2005, Cyclicality of Fiscal Policy and Cyclically Adjusted
Fiscal Balances, SM/05/393.
36
Leigh, Daniel and Olters, Jan-Peter, 2006, Natural-Resource Depletion, Habit Formation, and
Sustainable Fiscal Policy: Lessons from Gabon, IMF Working Paper No. 06/193 (Washington: International Monetary Fund).
Schwartz, E. S., and J.E. Smith, 2000, “Short term-variations and long-term dynamics in
commodity prices,” Management Science, 46, 893-911.