public debt management in sri lanka
TRANSCRIPT

Public Debt Management in Sri Lanka
Performance in 2019 &
Strategies for 2020 and beyond
Public Debt DepartmentCentral Bank of Sri Lanka

Public Debt Management in Sri Lanka
Performance in 2019&
Strategies for 2020 and beyond
Public Debt DepartmentCentral Bank of Sri Lanka

PUBLIC DEBT MANAGEMENT IN SRI LANKA – 2019ii
Central Bank of Sri Lanka
Public Debt Department
P O Box 590
Colombo
Sri Lanka
Tel. : 94 11 2477277
Fax : 94 11 2477718
E-mail : [email protected]

PUBLIC DEBT MANAGEMENT IN SRI LANKA – 2019 iii
Abbreviations v
Key Government Debt Indicators vi
Key Economic Indicators vii
1. Highlights of 2019 1
1.1 Borrowing Limit and Strategy for 2019 1
1.2 Actual Borrowing and Debt Level 1
1.3 Interest cost on Public Debt 2
1.4 Interest Rates and Yield 2
1.5 Broadening the Investor Base 2
1.6 Infrastructure Developments 2
1.7 Market Development Activities 3
1.8 Awareness Programmes 3
2. Public Debt Management in 2019 4
2.1 Overview 4
2.2 Targets and Strategies for Government Borrowings 5
2.3 Sovereign Ratings on Sri Lanka 8
2.4 Debt Level 8
2.5 The Structure of the Public Debt Portfolio 10
3. Servicing Public Debt in 2019 15
3.1 Debt Service Payments 15
3.2 Amortization of Debt 16
3.3 Interest Cost 17
3.4 Future Debt Service Obligations 19
4. Market Operations in 2019 20
4.1 Overview 20
4.2 Treasury Bills Primary Market 20
Contents

PUBLIC DEBT MANAGEMENT IN SRI LANKA – 2019iv
4.3 Treasury Bonds Primary Market 21
4.4 Sri Lanka Development Bonds 22
4.5 Secondary Market Yield Rates 23
5. The Medium-Term Debt Management Strategy 2019 - 2023 24
5.1 Overview 24
5.2 Stated Objectives of the MTDS 24
5.3 Expected Benefits of the MTDS 25
5.4 MTDS and the Macroeconomic Framework 25
5.5 Implementation of the MTDS 2019 – 2023 26
5.6 Issues and Challenges of Implementing the MTDS 28
5.7 Measures Taken to Address the Issues and challenges of implementing the MTDS 29
6. Risk Management and Sustainability of Central Government Debt 31
6.1 Overview 31
6.2 Risks Pertaining to the Central Government Debt Portfolio 31
6.3 Analysis of the Risk Profile of the Central Government Debt Portfolio 31
6.4 Sustainability of External Debt 34
7. Special Appendix 39
8. Glossary 45
9. Statistical Appendix 48

PUBLIC DEBT MANAGEMENT IN SRI LANKA – 2019 v
AbbreviationsADB Asian Development Bank ALMA Active Liability Management ActATM Average Time to MaturityATR AverageTimetoRefixingBCP Business Continuity Plan BO BackOfficeBPS Basis PointsCAR Capital Adequacy Ratio CBSL Central Bank of Sri Lanka CCP Central Counterparty Settlement SystemCDS Central Depository System CPC Ceylon Petroleum Corporation CSD Central Securities DepositoryCWE Corporative Wholesale Establishment DCS Department of Cencus and StatisticsDDMC Domestic Debt Management Committee DDP Dealer Direct Participant DOD Disbursed Outstanding External Debt DRS Disaster Recovery Site DVP Delivery Versus PaymentEIB Europian Investment Bank EPF Employees’ Provident Fund ETF Employees’ Trust Fund E-Trading Electronic Trading ETP Electronic Trading PlatformFCBU Foreign Currency Banking Unit FCTFF Foreign Currency Term Financing Facility FDI Foreign Direct Investment FIQ Fixed Income Quote Fitch Fitch Ratings FO FrontOfficeGDP Gross Domestic Product GNP Gross National Product GOSL Government of Sri LankaIBRD International Bank for Reconstruction and
DevelopmentIDA International Development Agency IDR Issuer Default RatingIFAD International Fund For Agricultural
Development ILF Intraday Liquidity FacilityIMF International Monetary Fund INT Interest Service ISB International Sovereign Bond ISIN InternationalSecuritiesIdentification
Number
IT Information TechnologyLCB Licensed Commercial BankLSB Licensed Specialized BankLIBOR London Inter-Bank Offered Rate LTBO Local Treasury Bills Ordinance MLA Monetary Law Act MLDS Medium and Long-Term Debt Service MO MiddleOfficeMOF Ministry of Finance Moody’s Moody’s Investors ServiceMTDS Medium Term Debt Management StrategyMTFF Medium Term Fiscal FrameworkNPV Net Present ValueOBU Off-shore Banking Unit OED Outstanding External Debt OMO Open Market OperationsOPEC Organization of the Petroleum Exporting
CountriesPDD Public Debt DepartmentPD Primary Dealer PMWAYR Primary Market Weighted Average Yield
Rates Repo Repurchase RSSO Registered Stocks and Securities OrdinanceRTGS Real Time Gross Settlement SystemSDR Special Drawing Right S&P Standard and Poor’s SDFR Standing Deposit Facility RateSIA Securities Investment Account SLDB Sri Lanka Development Bond SLFR Standing Lending Facility RateSLNBB Sri Lanka Nation Building Bonds SMS Short Message ServiceSRR Statutory Reserve RatioSSSS Scripless Securities Settlement SystemTDS Total Debt Service T-bills Treasury billsT-bonds Treasury bondsUK United KingdomUSA United States of AmericaWATM Weighted Average Time to Maturity WAYR Weighted Average Yield Rate XGS Receipts in exports of goods and non-factor
services including workers’ remittances and compensation of employees.

PUBLIC DEBT MANAGEMENT IN SRI LANKA – 2019vi
KEY GOVERNMENT DEBT INDICATORS
2013 2014 2015 2016 2017 2018(a) 2019(b)
Borrowings
Approved Gross Borrowing Limit (Rs.bn) 1,302.5 1,478.0 1,780.0 1,699.0 1,629.0 1,893.8 2,079.0
Actual Gross Borrowing (Rs.bn) 1,301.2 1,453.3 1,695.3 1,516.3 1,631.5 1,880.7 2,077.4
Domestic Sources 952.5 1,006.3 1,139.0 942.0 1,014.8 1,109.1 1,142.3
Foreign Sources 348.7 447.0 556.3 574.3 616.7 771.6 935.1
Actual Net Borrowing (Rs.bn) 516.1 591.2 829.5 640.3 733.5 760.8 1,016.5
Domestic Sources 392.4 378.7 592.7 248.4 294.3 437.2 702.4
Foreign Sources 123.7 212.5 236.8 391.9 439.2 323.5 314.1
Outstanding Debt
Outstanding Government Debt (Rs.bn) 6,889.2 7,486.9 8,599.2 9,478.9 10,382.8 12,030.5 13,031.5
Domestic Debt 3,928.8 4,373.7 5,055.2 5,433.1 5,664.2 6,071.0 6,629.1
Foreign Debt 2,960.4 3,113.1 3,544.0 4,045.8 4,718.6 5,959.5 6,402.4
Outstanding Debt (% of GDP) 71.8 72.3 78.5 79.0 77.9 83.7 86.8
By Source (b)
Domestic Debt 40.0 41.3 45.3 44.5(a) 42.5 42.3 44.1
Foreign Debt 30.9 30.0 32.4 33.7(a) 35.4 41.5 42.6
By Currency (b)
Domestic 41.9 42.7 42.6 42.4 39.6 38.3 39.9
Foreign 29.9 29.6 35.9 36.7 38.3 45.4 46.9
ATM of Total Debt (Years) * 6.9 6.6 6.7 6.4 6.2 6.2 6.1
ATM of Domestic Debt (Years) * 4.8 5.8 6.3 6.0 5.8 5.9 5.8
Share of Domestic Debt in Total Outstanding Debt (%) 56.4 57.9 58.3 56.9 54.6 50.5 50.9
Interest Cost
Total Interest Cost (Rs.bn) 444.0(a) 436.4(a) 509.7 610.9 735.5 852.2 901.4
Domestic Debt 343.0(a) 327.9 394.3 484.2 570.6 639.5 652.8
Foreign Debt 101.0(a) 108.5(a) 115.4 126.7 164.9 212.7 248.6
Interest Cost/GDP ratio (%) (b) 4.8 4.2 4.7 5.1 5.5 5.9 6.0
Interest Cost/Government Revenue ratio (%) 40.7 37.1 33.9 40.6 40.2 44.4 47.7
Average Yield Rates (Primary Market Weighted Average)
T-bills 91 day 8.95 6.58 6.32 8.26 9.01 8.40
182 day 9.91 6.57 6.50 9.23 9.81 8.58
364 day 10.65 6.73 6.60 10.20 10.07 9.67
Overall Average
10.45 6.68 6.46 9.38 9.77 9.35
T-bonds 2-year - - 7.98 11.45 11.05 -
4-year - - 8.68 11.87 11.54 -
5-year 10.95 8.78 8.63 12.16 11.53 10.33
10-year 11.80 10.00 9.78 12.60 11.16 11.06
Overall Average
11.72 10.17 9.46 12.27 11.48 10.74
Foreign Investment in Government Securities
Non-residents’ Holdings as a % of Total Outstanding Stock - T-bonds
15.8 13.7 8.8 6.5 7.6 3.5 1.7
Non-residents’ Holdings as a % of Total Outstanding Stock - T-bills
10.6 8.0 0.8 1.6 4.0 1.6 2.7
(a) Revised(b) Provisional* The ATM calculations between 2013 to 2018 excludes the T-Bonds issued to SOBEs specified in footnote (b) under CBSL annual report Table 113. n.a – not available

PUBLIC DEBT MANAGEMENT IN SRI LANKA – 2019 vii
KEY ECONOMIC INDICATORS
2013 2014 2015 2016 2017 2018 2019(a)
Demography
Mid-year population (‘000 persons) 20,585 20,778 20,970(d) 21,203(a) 21,444(a) 21,670(a) 21,803
Growth of mid-year population (per cent) 0.8 0.9 0.9 1.1(a) 1.1(a) 1.1(a) 0.6
Population density (persons per sq.km.) 328 331 334 338(a) 342(a) 346(a) 348
Labour force (‘000 persons) 8,034 8,049 8,214 8,311 8,567 8,388 8,592
Unemployment rate (per cent of labour force) 4.4 4.3 4.7 4.4 4.2 4.4 4.8
Output
GDP at current market prices (Rs. billion) 9,592 10,361 10,951 11,996 13,328(b) 14,366(a)(b) 15,016
GNI at current market prices (Rs. billion) 9,366 10,125 10,676 11,676(a) 12,975(b) 13,977(a)(b) 14,584
Per capita GDP at market prices (Rs.) 465,976 498,660 522,204 565,773 621,531(b) 662,949(a)(b) 688,719
Per capita GDP at market prices (USD) 3,609 3,819 3,841 3,886 4,077(b) 4,079(a)(b) 3,852
Real Output (percentage change)
GNI 2.8 5.1 4.8 4.3 3.6(b) 3.2(a)(b) 2.2
GDP 3.4 5.0 5.0 4.5 3.6(b) 3.3(a)(b) 2.3
Prices and Wages (percentage change)
CCPI (2006/07 = 100) - annual average (c) 6.9 3.3 0.9 3.7 - - -
CCPI (2006/07 = 100) - year-on-year - end period
4.7 2.1 2.8 4.1 - - -
NCPI (2013 = 100) - annual average (d) - - 3.8 4.0 7.7 2.1 3.5
NCPI (2013 = 100) - year-on-year - end period - - 4.2 4.2 7.3 0.4 6.2
Producer’s Price Index (2013 Q4) Annual Average
- 101.6 105.3 107.1 125.3 133.2 137.1
GDP deflator 6.2 2.9 0.6 4.8 7.3(b) 4.3(a)(b) 2.2
External Trade
Trade balance (USD million) -7,609 -8,287 -8,388 -8,873 -9,619 -10,343 -7,997
Exports (USD million) 10,394 11,130 10,546 10,310 11,360 11,980 11,940
Imports (USD million) 18,003 19,417 18,935 19,183 20,980 22,233 19,937
External Finance
Services and primary income account (net) (USD million)
-572 72 312 678 984 1,381(b) 423
Current account balance (USD million) -2,541 -1,988 -1,883 -1,742 -2,309 -2,799(b) -1,808
Overall balance (USD million) 985 1,369 -1,489 -500 2,068 -1,103 377
Current account balance (per cent of GDP) -3.4 -2.5 -2.3 -2.1 -2.6 -3.2 -2.2
Gross official reserves (months of the same year imports)
5.0 5.1 4.6 3.8 4.6 3.7 4.6
Overall Debt Service Ratio
As a percentage of export of goods and services 26.8 21.7 28.2 25.6 23.9 28.9 29.7
Total external debt and liabilities (per cent of GDP)
53.7 54.1 55.7 56.8 59.0(b) 59.2(b) 66.6
Exchange Rates
Annual average Rs/USD 129.11 130.56 135.94 145.60 152.46 162.54 178.78
NEER (2017 = 100) (24 - currency basket) (e) 104.39 105.29 109.40 104.89 100.00 94.05(b) 88.18
REER (2017 = 100) (24 - currency basket) (e) 96.33 98.92 102.84 100.79 100.00 95.45(b) 90.30
Year-end Rs/USD 130.75 131.05 144.06 149.80 152.85 182.75 181.63
Government Finance (per cent of GDP)
Revenue & Grants 12.0 11.6 13.3 14.1 13.8 13.5 12.6
Expenditure and net lending 17.4 17.3 20.9 19.5 19.3 18.7 19.4
Primary balance -0.8 -1.5 -2.9 -0.2 0.0 0.6 -0.8
Overall fiscal balance -5.4 -5.7 -7.6 -5.3 -5.5 -5.3 -6.8

PUBLIC DEBT MANAGEMENT IN SRI LANKA – 2019viii
Monetary Aggregates (year-on-year percentage change)
Reserve money 0.9 18.3 16.5 27.1 9.8 2.3 -3.0
Domestic credit from the banking system to
Government (net) 24.5 10.3 22.5 12.1 10.0 16.1(b) 9.9
Interest Rates (per cent per annum at year end)
Standing Deposit Facility Rate (SDFR) 6.5 6.5 6.0 7.0 7.3 8.0 7.0
Standing Lending Facility Rate (SLFR) 8.5 8.0 7.5 8.5 8.8 9.0 8.0
Commercial banks’ average weighted deposit rate 9.4 6.2 6.2 8.2 9.1 8.8 8.2
NSB 12-month fixed deposit rate 9.5 6.5 7.3 11.0 11.0 10.5 9.8
Commercial banks’ average weighted lending rate 15.2 11.9 11.0 13.2 13.9 14.4 13.6
(a) Provisional (b) Revised (c) CCPI: Colombo Consumer Price Index (d) NCPI: National Consumer Price Index(e) NEER and REER indices have been rebased to 2017
PUBLIC DEBT MANAGEMENT IN SRI LANKA – 2019 1
Highlights of 20191.
1.1 Borrowing limit and strategy for 2019
• The gross borrowing made in the financial year 2019 for and on behalf ofthe Government of Sri Lanka (GOSL), provided that the balance outstanding of such borrowing at any given time during or attheendofthefinancialyear2019shallnot exceed Rs. 2,079 billion as approved by the Parliament under the Appropriation Act No. 6 of 2019.
• During the year 2019, Rs. 1,359 billion was expected to be raised from domestic sources while the balance Rs.720 billion was expected to be raised from foreign sources adhering to the gross borrowing limit.
1.2 Actual borrowing and debt level
• Actual gross borrowing was maintained within the borrowing limit approved for 2019 in the Appropriation Act No. 6 of 2019 and amounted Rs. 2,077.4 billion.
• The share of total domestic borrowing to total gross borrowing declined to 55.0 per cent in 2019 against the planned 65.4 per cent (in face value basis).
• Total outstanding debt stock stood at Rs. 13,031.54 billion at end of 2019, recording an increase of Rs. 1,001.00 billion (8.32 per cent) from the corresponding debt stock of Rs. 12,030.55 billion at end of 2018.
• As a percentage of Gross Domestic Product (GDP), total outstanding debt stock increased to 86.8 per cent at end 2019 from 83.7 per cent at end 2018. Within the debt stock, domestic debt to GDP ratio increased to 44.1 per cent at end 2019 from 42.3 per cent at end 2018.The foreign debt to GDP ratio also increased to 42.6 per cent from 41.5 per cent, during the same period under review.
• At the end of 2019, the share of domestic debt accounted for 50.87 per cent of total debt stock while foreign debt accounted for 49.13 per cent, compared to 50.46 per cent and 49.54 per cent, recorded, respectively, at end 2018.
• At the end of 2019, the share of foreign currency debt to total debt stood at 54.01 per cent compared to 54.26 per cent at end of 2018 while at the end of 2019, the share of domestic currency debt to total debt stood at 45.99 per cent compared to 45.74 per cent at end of 2018.
• Average Time to Maturity (ATM) of the domestic currency debt marginally shortened to 5.78 years in 2019 from 5.91 years in 2018, mainly due to increased issuances of medium term Treasury bonds compared to longer tenure Treasury bonds (T-bonds). ATM of the foreign currency debt stood around 6.34 years both in 2018 and 2019.

PUBLIC DEBT MANAGEMENT IN SRI LANKA – 20192
1.3 Interest cost on public debt
• In absolute terms, interest payments amounted to Rs. 901.35 billion in 2019. This was 5.77 per cent increase from Rs. 852.19 billion reported in 2018. Of the total interest payments, Rs. 652.80 billion accounted for domestic debt, while Rs. 248.56 billion accounted for foreign debt.
• Total interest cost, as a percentage of GDP, increased to 6.0 percent in 2019 from 5.9 per cent in 2018. Interest cost as a percentage of Government revenue also increased to 47.67 per cent in 2019 from 44.39 per cent in 2018.
• Primary market weighted average yield rates of Treasury bills (T-bills) issued through auctions declined to 9.06 per cent in 2019 from 9.35 per cent in 2018. Further, primary market weighted average yield rates of T-bonds issued through auctions remained same at 10.74 per cent recorded at end 2018.
1.4 Interest rates and yield
• At end 2019, the primary market weighted average yield rates of 91-day, 182-day and 364-day Treasury bills decreased by 250, 197 and 275 basis points, respectively, to 7.51 per cent, 8.02 per cent and 8.45 per cent from yield rates prevailed at end 2018.
• During 2019, T-bonds of remaining maturities ranging from 2 years to 20 years were issued in the primary market and weighted average yield rates of these T-bonds varied between 9.65 per cent and 11.43 per cent.
1.5 Broadening the investor base
• Number of investors in Government securities, as recorded in the Central Depository System (CDS) of LankaSecure, decreased by 0.08 per cent during 2019 to 93,910.
• At end 2019, total of investments by foreign investors and non-resident Sri Lankans in rupee denominated T-bills and T-bonds amounted to Rs. 23.72 billion and Rs. 80.29 billion, respectively, compared to Rs. 11.90 billion and Rs. 146.91 billion at end 2018, and Rs. 27.55 billion and Rs. 295.06 billion, respectively, at end 2017.
• Total value of the issuances of Sri Lanka Development Bonds (SLDBs) in 2019 amounted to US dollars 345.22 million against the maturing amount of US dollars 621.83 million.
1.6 Infrastructure developments
• Enhancing the predictability and transparency of the auction calendar, the scope of the auction calendar was further extended by covering a period of six months from 01.07.2019 to 31.12.2019, where it had previously covered only a quarter of a year.
• The PDD published newspaper advertisements in all three languages in both weekday and weekend newspapers highlighting the salient features of the new Treasury bond issuance system and benefitsofthenewsystemandmadepublicawareness arrangements.
• PDD continued to send periodic customer statements generated electronically through

PUBLIC DEBT MANAGEMENT IN SRI LANKA – 2019 3
e-mails, in place of printed statements for account holders who opted for e-statement facility with a view to enhance the safety of investors in government securities. Accordingly, PDD sent 1,551 e-statements during 2019.
• Procurement process of the proposed state-of-the-art Central Counterparty Settlement System (CCP), Electronic Trading Platform (ETP) and an integrated Central Securities Depository (CSD) for Government securities and domestic foreign exchange transactions is ongoing for implementation. Their implementation, a significant component of the domesticfinancial market infrastructuredevelopment strategy, will be preceded by an independent evaluation of required legal reforms and system specifications by theconsultant selected by a Cabinet Appointed Consultant Procurement Committee.
• A SMS and/or email alert facility was introduced to notify customers of each and every movement of securities in the accounts of Central Depository System in the LankaSecure system, with a view of further improving investor safety and awareness of Government securities transactions.
• In order to enhance transparency, PDD is in the process of capturing more attributes of transactions carried out in the Government securities market (secondary market) to the LankaSecure System. Accordingly, information including settlement value, price and interest rate of relevant
transactions will be recorded in the Scripless Securities Settlement System (SSSS).
1.7 Market development activities
• PDD issued a new direction under the subject ‘Directions on Primary Issuance of Treasury Bonds’ with an intention to increase the transparency of the auction process. The following enhancements were made through the direction.
i. To issue two or more T-bond series at each monthly auction.
ii. Phase III of the new T-bond issuance system will be activated only when a minimum of 70% of the total amount offered is accepted at Phase I.
iii. When calculating the successful subscription of a PD, any subscription made by such PD under Phase II up to a limit not exceeding 2 per cent of minimum successful subscription is allowed.
1.8 Awareness programmes
• During 2019, PDD continued to facilitate several investor awareness programmes and investor meetings in Sri Lanka and abroad to update the market/investors regarding the recent economic developments and prospects of the Sri Lankan economy and the Government securities market. Similarly, PDD has participated in on-site promotional activities during the year to educate the general public on investments in Government securities.

PUBLIC DEBT MANAGEMENT IN SRI LANKA – 20194
Public Debt Management in 20192.
2.1 Overview
The impetus of public debt management during the year 2019 was focussed on the successful implementation of prudent debt management strategies to achieve the lowest possible cost forGovernmentfinancing,withinaframeworkof acceptable risk levels. The Central Bank, demonstrated its commitment in this line, successfully accomplishing the broad goals set for 2019, overcoming the challenges emanated by the unfavourable conditions and the risks developed therein, in domestic and external markets.
At two Monetary Policy reviews in May and August 2019, the Central Bank maintained an accommodative monetary policy, and reduced the standing lending facility rate (upper bound of the policy interest rate corridor) by 100 basis points (BPS) in aggregate. Interest rates structure across the Government securities witnessed a downward momentum along with the policy rate reductions. A gradual decrease of benchmark 91-day, 182-day and 364-day Treasury bill yields were witnessed until mid-August 2019 mainly due to prolonged subpar economic activity exacerbated by Easter Sunday attacks followed by conservative market response to the recovery of the economy.
Several measures taken in improving the overallefficiencyandtransparencyofthedebtmanagement process amidst the challenging conditions in the domestic and external markets
were continued during the year. Accordingly, primarydealerchiefexecutiveofficers’meetingswere held quarterly and regular pre-bid meetings were held before each Treasury bond auction with the participation of representatives from licensed commercial banks, primary dealers and non-primary dealer auction participants as a measure to streamline the communication with the primary dealer community. In addition, PDD published newspaper advertisements towards latter part of 2019 in all three languages in both weekday and weekend newspapers highlighting the new Treasury bond issuance system and resulting developments. Further, PDD attended a number of public awareness programs to improve awareness on PDD functions among the general public. Moreover, at regular CBSL press conferences various aspects of the new Treasury bond issuance system and related public debt initiatives were elaborated at length. All above measures contributed to enhance the awareness among primary dealers and non-dealer bidders on the issuance process, overall issuance strategy with enhanced transparency and resource availability etc enabling smooth functioning of Treasury bill/bond auctions.
In the external front, GOSL tapped the international capital market with the issuance of new International Sovereign Bonds (ISBs) worth US dollar 4,400 million during 2019 in March and June. The Government issued its 13th ISB in March 2019 and raised US dollars 2.4
PUBLIC DEBT MANAGEMENT IN SRI LANKA – 2019 5
billion which was of two tenures (i) US dollars 1.0 billion with a 5-year maturity at a yield of 6.85 per cent and (ii) US dollars 1.4 billion with a 10-year maturity at a yield of 7.85 per cent. In June 2019, US dollars 2.0 billion in total was raised by issuing US dollars 500 million with a 5-year maturity at a yield of 6.35 per cent and US dollars 1.5 billion with a long 10-year maturity at a yield of 7.55 per cent per annum. Issuance of ISBs facilitated the management of the domestic debt issuance programme with a
driven mainly by exchange rate movements, whereas the Government budget deficit as apercentage of GDP increased to 6.8 per cent by end 2019, compared to 5.3 per cent recorded at end 2018. Meanwhile the Weighted Average Time to Maturity (ATM) of domestic public debt portfolio recorded a slight decrease by the end of 2019 to 5.78 years compared to 5.91 years at end 2018, partly owing to unfavourable domestic market developments.
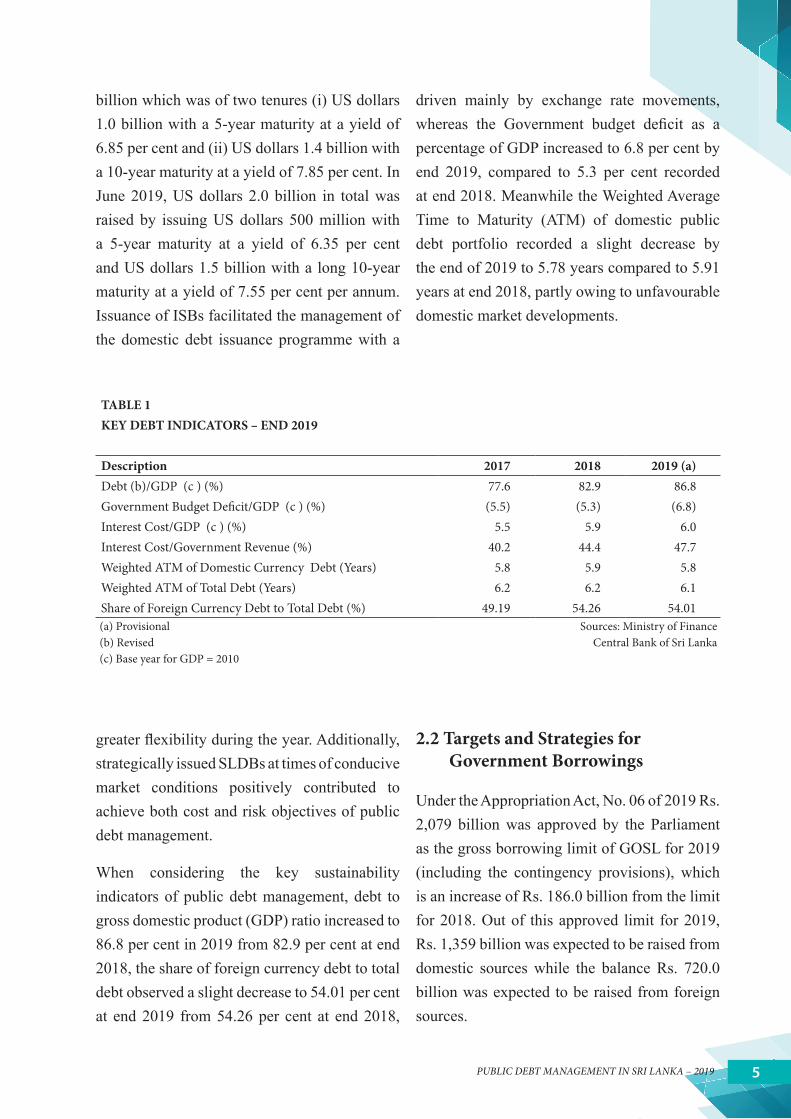
TABLE 1KEY DEBT INDICATORS – END 2019
Description 2017 2018 2019 (a)Debt (b)/GDP (c ) (%) 77.6 82.9 86.8 Government Budget Deficit/GDP (c ) (%) (5.5) (5.3) (6.8)Interest Cost/GDP (c ) (%) 5.5 5.9 6.0 Interest Cost/Government Revenue (%) 40.2 44.4 47.7 Weighted ATM of Domestic Currency Debt (Years) 5.8 5.9 5.8 Weighted ATM of Total Debt (Years) 6.2 6.2 6.1 Share of Foreign Currency Debt to Total Debt (%) 49.19 54.26 54.01 (a) Provisional Sources: Ministry of Finance(b) Revised Central Bank of Sri Lanka(c) Base year for GDP = 2010
greaterflexibilityduringtheyear.Additionally,strategically issued SLDBs at times of conducive market conditions positively contributed to achieve both cost and risk objectives of public debt management.
When considering the key sustainability indicators of public debt management, debt to gross domestic product (GDP) ratio increased to 86.8 per cent in 2019 from 82.9 per cent at end 2018, the share of foreign currency debt to total debt observed a slight decrease to 54.01 per cent at end 2019 from 54.26 per cent at end 2018,
2.2 Targets and Strategies for Government Borrowings
Under the Appropriation Act, No. 06 of 2019 Rs. 2,079 billion was approved by the Parliament as the gross borrowing limit of GOSL for 2019 (including the contingency provisions), which is an increase of Rs. 186.0 billion from the limit for 2018. Out of this approved limit for 2019, Rs. 1,359 billion was expected to be raised from domestic sources while the balance Rs. 720.0 billion was expected to be raised from foreign sources.

PUBLIC DEBT MANAGEMENT IN SRI LANKA – 20196
The aggregate actual gross borrowing in 2019 was maintained within the approved borrowing limit (with the contingency provision and book value adjustment). However, the composition of actual borrowings deviated from the initial plan due to both global and local market conditions prevailed in 2019. The actual share of gross borrowing from domestic sources was 55.0 per cent amounting to Rs. 1,142 billion against the planned 65.4 per cent of domestic borrowings while the share of actual gross borrowing from foreign sources accounted for 45.0 per cent amounting to Rs. 935 billion against the
TABLE 2GOVERNMENT BORROWINGS IN 2019)
Item Approved Limit Usage (a)
Rs. billion % Rs. billion %Net Borrowing
Domestic 450.0 65.7 702.4 69.1 Foreign 235.0 34.3 314.1 30.9
Total 685.0 100.0 1,016.5 100.0
Gross Borrowing Domestic 1,359 65.4 1,142 55.0
Rupee Loans - - Treasury Bonds (b) 768 37.0 Treasury Bills (net) (b) 139 6.7 Sri Lanka Development Bonds 62 3.0 Other 174 8.4
Foreign 720 34.6 935 45.0 International Sovereign Bonds 783 37.7 Other (c ) 153 7.3
Gross Borrowing (Including Contingenty Provision and Book Value Adjustment)
2,079 100.0 2,077 100.0
(a) Provisional Sources: Ministry of Finance(b) Includes Treasury bonds and Treasury bills issued to non-residents. Central Bank of Sri Lanka(c) Includes project loans and syndicated loans.
planned 34.6 per cent of foreign borrowings. The increase in the share of foreignfinancingwas mainly due to the issuance of ISBs in 2019. Net borrowing requirement for 2019 was estimated to be Rs. 685.0 billion, of which Rs. 450.0 billion (65.7 per cent) was expected to be borrowed from domestic sources while the remaining Rs. 235.0 billion (34.3 per cent) was expected to be borrowed from foreign sources.
The yield rates on Government securities in the primary market behaved orderly and adjusted upward during the majority of the second

PUBLIC DEBT MANAGEMENT IN SRI LANKA – 2019 7
half of 2019, through envisaged debt issuance strategies, regular communication with market participants, availability of foreign financesto the Government and improved market sentiments. Accordingly, primary market weighted average yield rates of 91-day, 182-day and 364-day Treasury bills decreased by 25, 14 and 27 basis points to 8.15 per cent, 8.44 per
TABLE 3PRIMARY MARKET WEIGHTED AVERAGE YIELD RATES OF TREASURY BILLS AND TREASURY BONDS (a)
Per centInstrument 2013 2014 2015 2016 2017 2018 2019 (b)Treasury Bills (Days)
91 8.95 6.58 6.32 8.26 9.01 8.40 8.15182 9.91 6.57 6.50 9.23 9.81 8.58 8.44364 10.65 6.73 6.60 10.20 10.07 9.67 9.40
Overall Average 10.45 6.68 6.46 9.38 9.77 9.35 9.06
Treasury Bonds (Years)2 - - 7.98 11.45 11.05 - 10.273 10.95 - 8.32 11.58 - 10.44 10.384 - - 8.68 11.87 11.54 - - 5 10.95 8.78 8.63 12.16 11.53 10.33 10.556 10.97 - 9.19 12.01 11.36 - -7 - - 8.99 12.18 12.94 10.37 -8 11.51 9.03 9.55 12.28 11.44 11.21 10.819 11.77 9.23 - 13.07 12.91 12.16 10.56
10 11.80 10.00 9.78 12.60 11.16 11.06 11.4312 12.09 - - 13.72 - - 11.2715 12.17 10.34 10.24 - - 10.49 10.5920 12.19 11.32 11.20 - - - 10.5230 12.50 11.75 11.73 - - - -
Overall Average 11.72 10.17 9.46 12.27 11.48 10.74 10.74(a) Net of 10% withholding tax. Effective from May 3, 2002, Government has im-
posed withholding tax on interest of government securities. However, effective from April 1, 2018, Government has removed the witholding tax of 10%.
Source: Central Bank of Sri Lanka
(b) Provisional
cent and 9.40 per cent, respectively, during the year in comparison to yield rates that prevailed in 2018.
Issuance of ISBs in March and June 2019 largely contributed to the decrease in WAYR of T-Bills in the primary market in 2019. However, marginal uptick in WAYRs of T-Bills was observed during the latter part of 2019.

PUBLIC DEBT MANAGEMENT IN SRI LANKA – 20198
2.3 Sovereign Rating of Sri Lanka
International sovereign rating of Sri Lanka for year 2019 as reviewed by the three leading ratingagenciesaffirmedSriLanka’ssovereigncredit rating, yet with a revised outlook. Both Fitch and S&P maintained Sri Lanka’s credit rating at ‘B’ but changed their rating outlook from ‘stable’ to ‘negative’ in December 2019 and January 2020, respectively. These revisions
of the outlook were mainly attributed to risks stemming from deteriorated fiscal position.However, Moody’s Investors Service (Moody’s) maintained its ratings at “B2” with “Stable” outlook in 2019.
2.4 Debt Level
A nominal increase of Rs. 1,001 billion (8.32 per cent) over the total debt stock was recorded
TABLE 4INCREASE IN OUTSTANDING GOVERNMENT DEBT
Rs. billionDescription 2018 2019 (a)Net Borrowing 760.8 1,016.5Effect of Parity Variance 1,063.2 12.4 Discount Effect -84.8 -25.3Other -91.5 -2.6Total Increase 1,647.7 1,001.0(a) Provisional Sources: Ministry of Finance
Central Bank of Sri Lanka
TABLE 5OUTSTANDING GOVERNMENT DEBT (AS AT END OF YEAR 2019)
2017 2018 2019 (a)Outstanding Debt (Rs. billion) - By Source Domestic 5,664.2 6,071.0 6,629.1 Foreign (b) 4,718.6 5,959.5 6,402.4 Total 10,382.8 12,030.5 13,031.5Outstanding Debt (Rs. billion) - By Currency Domestic 5,275.5 5,503.1 5,993.6 Foreign (b) 5,107.3 6,527.5 7,037.9 Total 10,382.8 12,030.5 13,031.5Outstanding Debt (% of GDP) - By Source (c ) Domestic 42.5 42.3 44.1 Foreign (b) 35.4 41.5 42.6 Total 77.9 83.7 86.8Outstanding Debt (% of GDP) - By Currency (c) Domestic 39.6 38.3 39.9 Foreign (b) 38.3 45.4 46.9 Total 77.9 83.7 86.8(a) Provisional Sources: Ministry of Finance(b) Excludes outstanding loans of projects under state-owned business enterprises
Central Bank of Sri Lanka

PUBLIC DEBT MANAGEMENT IN SRI LANKA – 2019 9
compared to end 2018 marking the outstanding Government debt at Rs. 13,031.5 billion at end 2019. Of this increase, Rs. 1,016.5 billion was due to net borrowings and Rs. 12.4 billion was due to unfavourable exchange rate movements. However, the net discount effect of Treasury bills and Treasury bonds have recorded a decrease of Rs. 25.3 billion during 2019.
Domestic debt (by source) increased by Rs. 558.1 billion (9.19 per cent) to Rs. 6,629.1 billion at end 2019 from Rs. 6,071 billion at end 2018 while foreign debt (by source) increased by Rs. 442.9 billion (7.43 per cent) to Rs. 6,402.4 billion at end 2019 from Rs. 5,959.5 billion at
end 2018. Further, rupee denominated domestic debt stock of the Government increased by Rs. 490.6 billion (8.91 per cent) to Rs. 5,993.6 billion at end 2019, compared to Rs. 5,503.1 billion at end 2018. The rupee value of foreign currency denominated Government debt stock increased by Rs. 510.4 billion (7.82 per cent) to Rs. 7,037.9 billion at end 2019 compared to Rs. 6,527.5 billion at end 2018.
The share of domestic debt in total Government debt increased to 50.87 per cent at end 2019 compared to 50.46 per cent recorded at end 2018 while an year on year increase in total domestic debt stock was recorded. Further, total
0
20
40
60
80
100
2017 2018 2019
Per
cen
t
CHART 4 COMPOSITION OF GOVERNMENT DOMESTIC DEBT (2017-2019)
Other OBUs Rupee loans SLDBs T-bonds T-bills
-
20
40
60
80
100
2017 2018 2019
Private and Other Departmental and Other Official Funds
Insuarance and Finance Companies
Savings Institutions
CHART 5 DOMESTIC DEBT BY INVESTOR - 2017 - 2019
58.8 57.3 54.6 50.5 50.9
41.2 42.7 45.4 49.5 49.1
0
20
40
60
80
100
2015 2016 2017 2018 2019
Per
cen
t
Foreign Domestic
CHART 1 COMPOSITION OF GOVERNMENT DEBT
50
60
70
80
90
100
0 1,000 2,000 3,000 4,000 5,000 6,000 7,000 8,000 9,000
10,000 11,000 12,000 13,000 14,000
2014 2015 2016 2017 2018 2019
Per
cen
t
Rs.
bill
ion
Outstanding Debt (LHS) % of GDP (RHS)
0
200
400
600
800
1,000
1,200
1,400
1 year 2 year 3 year 4 year >4 year
Rs.
bill
ion
CHART 7
MATURITY STRUCTURE OF T-BONDS & RUPEE LOANS
R-loan T-bond Total
30
35
40
45
50
55
0
1,000
2,000
3,000
4,000
5,000
6,000
7,000
2015 2016 2017 2018 2019
Per
cen
t
Rs.
bill
ion
Outstanding Domestic Debt (LHS) % of GDP (RHS)
CHART 2 DOMESTIC DEBT (BY SOURCE)
-
Per
cen
t
CHART 6
OWNERSHIP OF MAIN DEBT INSTRUMENTS
0
5
10
15
20
25
30
5-Ja
n-18
5-Fe
b-18
5-M
ar-1
8
5-A
pr-1
8
5-M
ay-1
8
5-Ju
n-18
5-Ju
l-18
5-A
ug-1
8
5-S
ep-1
8
5-O
ct-1
8
5-N
ov-1
8
5-D
ec-1
8
Rs.
bill
ion
Maturity Date
CHART 8 !WEEKLY MATURITY PROFILE OF T-BILLS
Amount (Rs. "#$%&'(!)*!$"+,-!./+&0&1(!2"3!4&&1!&5',67&7!
0
20
40
60
80
100
2017 2018 2019
Per
cen
t
CHART 4 COMPOSITION OF GOVERNMENT DOMESTIC DEBT (2017-2019)
Other OBUs Rupee loans SLDBs T-bonds T-bills
-
20
40
60
80
100
2017 2018 2019
Private and Other Departmental and Other Official Funds
Insuarance and Finance Companies
Savings Institutions
CHART 5 DOMESTIC DEBT BY INVESTOR - 2017 - 2019
58.8 57.3 54.6 50.5 50.9
41.2 42.7 45.4 49.5 49.1
0
20
40
60
80
100
2015 2016 2017 2018 2019
Per
cen
t
Foreign Domestic
CHART 1 COMPOSITION OF GOVERNMENT DEBT
50
60
70
80
90
100
0 1,000 2,000 3,000 4,000 5,000 6,000 7,000 8,000 9,000
10,000 11,000 12,000 13,000 14,000
2014 2015 2016 2017 2018 2019
Per
cen
t
Rs.
bill
ion
Outstanding Debt (LHS) % of GDP (RHS)
0
200
400
600
800
1,000
1,200
1,400
1 year 2 year 3 year 4 year >4 year
Rs.
bill
ion
CHART 7
MATURITY STRUCTURE OF T-BONDS & RUPEE LOANS
R-loan T-bond Total
30
35
40
45
50
55
0
1,000
2,000
3,000
4,000
5,000
6,000
7,000
2015 2016 2017 2018 2019
Per
cen
t
Rs.
bill
ion
Outstanding Domestic Debt (LHS) % of GDP (RHS)
CHART 2 DOMESTIC DEBT (BY SOURCE)
-
Per
cen
t
CHART 6
OWNERSHIP OF MAIN DEBT INSTRUMENTS
0
5
10
15
20
25
30
5-Ja
n-18
5-Fe
b-18
5-M
ar-1
8
5-A
pr-1
8
5-M
ay-1
8
5-Ju
n-18
5-Ju
l-18
5-A
ug-1
8
5-S
ep-1
8
5-O
ct-1
8
5-N
ov-1
8
5-D
ec-1
8
Rs.
bill
ion
Maturity Date
CHART 8 !WEEKLY MATURITY PROFILE OF T-BILLS
Amount (Rs. "#$%&'(!)*!$"+,-!./+&0&1(!2"3!4&&1!&5',67&7!
TABLE 6CHANGE IN OUTSTANDING FOREIGN CURRENCY DENOMINATED DEBT IN RUPEE TERMS - CURRENCY WISE
Rs. billion
Currency 2017 2018 2019 (a)Special Drawing Rights 73.9 125.2 -27.4Japanese Yen 19.4 106.6 2.1US Dollar 443.0 1131.2 496.1Euro 24.5 17.8 2.9Other 112.0 -139.9 -30.8Total 672.8 1240.9 442.9 Memo: Year End Exchange Rates (Sri Lankan Rupees per Unit of Foreign Currency) Special Drawing Rights 217.69 253.51 251.17 Japanese Yen 1.36 1.65 1.67 US Dollar 152.85 182.75 181.63 Euro 182.49 208.99 203.67(a) Provisional Sources: Ministry of Finance
Central Bank of Sri Lanka
PUBLIC DEBT MANAGEMENT IN SRI LANKA – 201910
domestic debt in terms of source of borrowing as a percentage of GDP increased to 44.1 per cent at end 2019 from 42.3 per cent recorded at end 2018, while the domestic debt in terms of currency as a percentage of GDP increased to 39.9 per cent at end 2019 from 38.3 per cent recorded at end 2018.
Total change in outstanding foreign currency denominated debt in rupee terms was Rs. 442.9 billion at end 2019. This change was mainly attributable to the changes in US Dollar denominated debt covering the majority of foreign debt accounting for Rs. 496.1 billion while SDR and other currencies recorded a negative change. However, year-end exchange rates of US Dollar, Japanese yen, Euro and Special Drawing Rights recorded marginal changes at end 2019.
2.5 The Structure of the Public Debt Portfolio
2.5.1 Domestic Debt
The Central Bank mobilised net funds amounting to Rs. 702.4 billion through domestic financing,specificallythroughdomesticmarketborrowings and other domestic borrowings in line with the debt strategy for 2019. The stock
of rupee loans remained static at Rs. 24.1 billion at end 2019, since rupee loans were not issued during 2019.
2.5.2 Domestic Debt by Investor Base
Banking sector, which consists of Licensed Commercial Banks (LCBs) and the Central Bank, investments in domestic debt instruments of the Government increased by Rs. 387.7 billion (16.5 per cent) to Rs. 2,739.6 billion at end 2019 compared to Rs. 2,351.9 billion held at end 2018. The amount of domestic debt held by LCBs increased to Rs. 2,428.7 billion at end 2019 from that of Rs. 2,107.8 billion held at end 2018. Out of the domestic debt held by LCBs holding of Treasury bills and Treasury bonds increased by Rs. 195.5 billion to Rs. 684.7 billion and Rs. 141.0 billion to Rs. 839.5 billion, respectively, in 2019.
The major holders in non-bank sector of domestic debt of the Government securities continued to be the Employees’ Provident Fund (EPF), savings institutions, insurance companies and other institutional investors with a holding of Rs. 3,889.5 billion (58.67 per cent) of the total domestic debt at end 2019 compared to Rs. 3,719.06 billion (61.26 per cent) at end 2018.
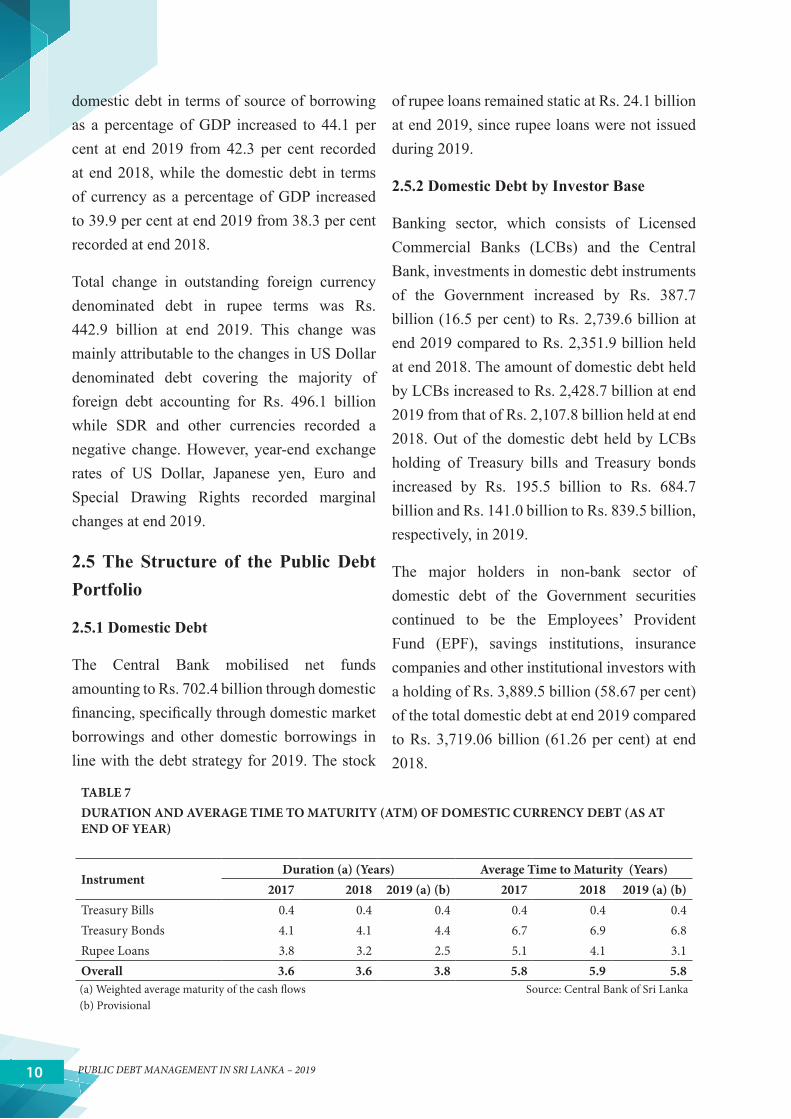
TABLE 7DURATION AND AVERAGE TIME TO MATURITY (ATM) OF DOMESTIC CURRENCY DEBT (AS AT END OF YEAR)
InstrumentDuration (a) (Years) Average Time to Maturity (Years)
2017 2018 2019 (a) (b) 2017 2018 2019 (a) (b)Treasury Bills 0.4 0.4 0.4 0.4 0.4 0.4Treasury Bonds 4.1 4.1 4.4 6.7 6.9 6.8Rupee Loans 3.8 3.2 2.5 5.1 4.1 3.1Overall 3.6 3.6 3.8 5.8 5.9 5.8(a) Weighted average maturity of the cash flows Source: Central Bank of Sri Lanka(b) Provisional

PUBLIC DEBT MANAGEMENT IN SRI LANKA – 2019 11
2.5.3 Maturity Structure of the Domestic Debt Portfolio
As a percentage of total domestic debt, short-term domestic debt increased to 19.16 per cent at end 2019 compared to 18.69 per cent recorded at end 2018. ATM of Treasury bonds decreased marginally to 6.8 years at end 2019 compared to 6.9 years recorded at end 2018. However, ATM of Treasury bills remained unchanged at 0.4 years during 2019. In general, ATM of domestic currency debt portfolio declined marginally to 5.8 years at end 2019 compared to 5.9 years recorded at end 2018.
2.5.4 Foreign Debt
Foreign debt (by source), in terms of rupee value, increased by Rs. 442.9 billion to Rs. 6,402.4 billion during 2019 from Rs. 5,959.5 billion recorded at end 2018. Accordingly, total
TABLE 8COMPOSITION OF FOREIGN DEBT
Category2018 2019 (a)
Total Equivalent Amount in Rs billion
% Total Equivalent Amount in Rs billion
%
Concessional 2,705.8 45.4 2,767.5 43.2 Bilateral 953.3 16.0 933.2 14.6 Multilateral 1,392.9 23.4 1,356.9 21.2 Other 359.7 6.0 477.4 7.5
Commercial 3,253.7 54.6 3,635.0 56.8 Sovereign Bonds 2,220.4 37.3 2,733.6 42.7 Bilateral 210.0 3.5 198.7 3.1 Multilateral 58.6 1.0 112.9 1.8 Foreign Holdings in Treasury Bills and Treasury Bonds 158.8 2.7 104.0 1.6
Other 605.9 10.2 485.7 7.6 Total 5,959.5 100.0 6,402.4 100.0 (a) Provisional Sources: Ministry of Finance
Central Bank of Sri Lanka
outstanding foreign debt stock (by source) as a percentage of GDP increased to 42.6 per cent by the end of 2019 from 41.5 per cent recorded in 2018. The increase was mainly due to subdued growth of nominal GDP and unfavourable parity adjustment owing to the depreciation of the rupee against major currencies.
2.5.6 Composition of Foreign Debt
Outstanding foreign debt from concessional and commercial sources, in terms of rupee value, stood at Rs. 2,767.5 billion (43.2 per cent) and Rs. 3,635.0 billion (56.8 per cent) respectively, at end 2019. When compared with 2018, corresponding debt from concessional and commercial sources stood at Rs. 2,705.8 billion (45.4 per cent) and Rs. 3,253.7 billion (54.6 per cent), respectively. Thus, the ratio of concessional to commercial foreign debt stock has seen a marginal decrease in 2019.
PUBLIC DEBT MANAGEMENT IN SRI LANKA – 201912
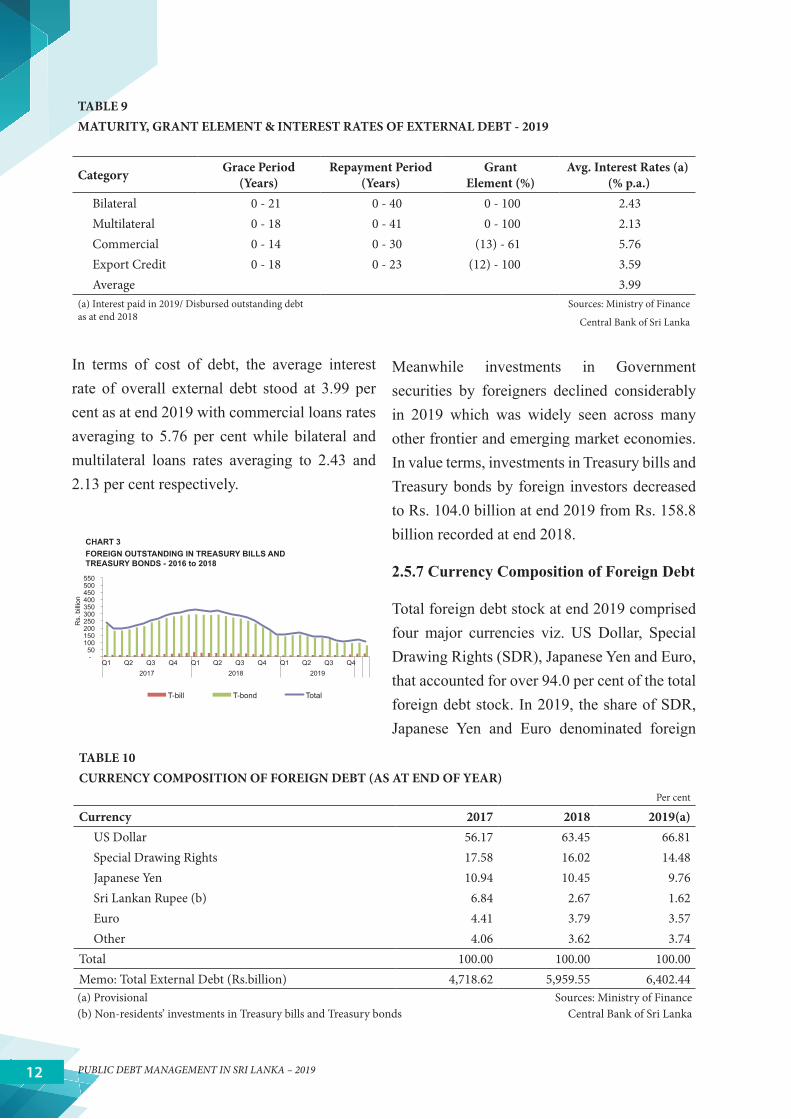
In terms of cost of debt, the average interest rate of overall external debt stood at 3.99 per cent as at end 2019 with commercial loans rates averaging to 5.76 per cent while bilateral and multilateral loans rates averaging to 2.43 and 2.13 per cent respectively.
TABLE 9MATURITY, GRANT ELEMENT & INTEREST RATES OF EXTERNAL DEBT - 2019
Category Grace Period (Years)
Repayment Period (Years)
Grant Element (%)
Avg. Interest Rates (a) (% p.a.)
Bilateral 0 - 21 0 - 40 0 - 100 2.43Multilateral 0 - 18 0 - 41 0 - 100 2.13Commercial 0 - 14 0 - 30 (13) - 61 5.76Export Credit 0 - 18 0 - 23 (12) - 100 3.59Average 3.99
(a) Interest paid in 2019/ Disbursed outstanding debt as at end 2018
Sources: Ministry of Finance
Central Bank of Sri Lanka
25.39 24.35 22.96
31.63 25.55 25.14
42.98 50.09 51.91
- 10 20 30 40 50 60 70 80 90
100
2017 2018 2019
Per
cen
t
Commercial Loans Bilateral Multilateral
45.15 45.40 43.23
54.85 54.60 56.77
- 10 20 30 40 50 60 70 80 90
100
2017 2018 2019
Per
cen
t
Non-Concessional Loans Concessional Loans
CHART 11 FOREIGN DEBT BY CONCESSIONALITY
0
200
400
600
800
1,000
2020 2025 2030 2035 2040 2045
Rs.
bill
ion
Total Repayment Interest
CHART 6 DOMESTIC CURRENCY DEBT SERVICE OBLIGATIONS
0 5 10 15 20 25 30 35 40 45
-
1,000
2,000
3,000
4,000
5,000
6,000
7,000
2015 2016 2017 2018 2019 P
er c
ent
Rs.
bill
ion
SDR USD EURO Jap.Yen LKR Other
CHART 10 FOREIGN DEBT
4
5
6
7
8
0
200
400
600
800
1000
2015 2016 2017 2018 2019
Per
cen
t
Rs.
bill
ion
Interest Cost (LHS) % of GDP (RHS)
- 50
100 150 200 250 300 350 400 450 500 550
Q1 Q2 Q3 Q4 Q1 Q2 Q3 Q4 Q1 Q2 Q3 Q4 2017 2018 2019
Rs.
bill
ion
T-bill T-bond Total
0
200
400
600
800
1,000
1,200
2020 2025 2030 2035 2040 2045 2050 2055 2060
Rs.
bill
ion
CHART 5 FOREIGN CURRENCY DEBT SERVICE OBLIGATIONS
Total (Rs. Bn) Interest (Rs. Bn)
4 5 6 7 8 9
10 11 12
4-Ja
n-19
4-A
pr-1
9
4-Ju
l-19
4-O
ct-1
9
Per
cen
t
CHART 7 T-BILL PRIMARY MARKET WEIGHTED AVERAGE YIELDS
91 day 182 day 364 day
CHART 3 FOREIGN OUTSTANDING IN TREASURY BILLS AND TREASURY BONDS - 2016 to 2018
CHART 4TOTAL INTEREST COST
Meanwhile investments in Government securities by foreigners declined considerably in 2019 which was widely seen across many other frontier and emerging market economies. In value terms, investments in Treasury bills and Treasury bonds by foreign investors decreased to Rs. 104.0 billion at end 2019 from Rs. 158.8 billion recorded at end 2018.
2.5.7 Currency Composition of Foreign Debt
Total foreign debt stock at end 2019 comprised four major currencies viz. US Dollar, Special Drawing Rights (SDR), Japanese Yen and Euro, that accounted for over 94.0 per cent of the total foreign debt stock. In 2019, the share of SDR, Japanese Yen and Euro denominated foreign
TABLE 10CURRENCY COMPOSITION OF FOREIGN DEBT (AS AT END OF YEAR)
Per cent
Currency 2017 2018 2019(a)US Dollar 56.17 63.45 66.81 Special Drawing Rights 17.58 16.02 14.48 Japanese Yen 10.94 10.45 9.76 Sri Lankan Rupee (b) 6.84 2.67 1.62 Euro 4.41 3.79 3.57 Other 4.06 3.62 3.74
Total 100.00 100.00 100.00 Memo: Total External Debt (Rs.billion) 4,718.62 5,959.55 6,402.44 (a) Provisional Sources: Ministry of Finance(b) Non-residents’ investments in Treasury bills and Treasury bonds Central Bank of Sri Lanka

PUBLIC DEBT MANAGEMENT IN SRI LANKA – 2019 13
debt declined while the share of US Dollar denominated foreign debt increased mainly influencedbythehighervolumeofissuanceofdollar denominated ISBs during the year 2019. Meanwhile the external debt denominated in Sri
Lankan rupee decreased to 1.62 per cent at end 2019 from 2.67 per cent recorded in 2018 due to decrease in foreign holdings of Treasury bills and bonds.
TABLE 11USE OF EXTERNAL DEBT BY MAJOR SECTORS (a)
Rs. billion
Economic Sector (b) 2018 % 2019 (c ) %1. Economic Services 2,874.39 48.23 2,940.72 45.93 1.1 Agricultural Development 233.03 3.91 229.06 3.58 Agriculture 52.55 0.88 52.87 0.83 Fishing 9.32 0.16 8.50 0.13 Forestry 6.20 0.10 5.58 0.09 Plantation 33.52 0.56 31.66 0.49 Irrigation & Related Activities 108.70 1.82 111.47 1.74 Livestock Development 22.75 0.38 18.97 0.30
1.2 Industrial/Construction 1,727.45 28.99 1,838.77 28.72 Energy 480.75 8.07 459.14 7.17 Water Supply 295.63 4.96 322.64 5.04 Industrial Development 29.03 0.49 26.23 0.41 Roads & Bridges 919.75 15.43 1,028.64 16.07 Other Construction 2.29 0.04 2.12 0.03
1.3 Service Sector 745.21 12.50 715.45 11.17 Telecommunications 23.05 0.39 19.75 0.31 Ports & Shipping 248.47 4.17 239.68 3.74 Ground Transport 360.52 6.05 353.48 5.52 Air Transport 41.71 0.70 37.62 0.59 Finance, Insurance, etc. 71.19 1.19 64.93 1.01 Trade 0.27 0.00 - -
1.4 Other Economic Services 168.71 2.83 157.44 2.46 Land Development 0.68 0.01 0.70 0.01 Management & Institutional Development 25.15 0.42 23.38 0.37 Information Technology Development 12.02 0.20 11.40 0.18 Private Sector Development 57.26 0.96 52.12 0.81 Rural Development 71.01 1.19 66.77 1.04 Science & Technology 2.59 0.04 3.08 0.05
2. Social Services 502.07 8.42 495.86 7.74 Education & Training 121.38 2.04 124.77 1.95 Health & Social Welfare 81.75 1.37 88.58 1.38 Environment 44.95 0.75 32.85 0.51 Housing & Urban Development 65.14 1.09 68.35 1.07 Labour & Vocational Training 35.76 0.60 35.49 0.55 Media 0.09 0.00 0.08 0.00 Rehabilitation 97.68 1.64 95.56 1.49 Sewerage 3.34 0.06 3.04 0.05 Tsunami Rehabilitation 51.98 0.87 47.14 0.74
3. Commodities & Food 63.27 1.06 52.31 0.82 Commodities 45.16 0.76 36.76 0.57 Food 18.10 0.30 15.55 0.24
4. Other Activities 2,519.82 42.28 2,913.56 45.51 Total Outstanding Debt 5,959.55 100.00 6,402.44 100.00 (a) Based on Outstanding External Debt data recorded in Commonwealth Secretariat Debt Recording & Management System (CS-DRMS) at end December 2019. Sovereign bond issues in 2010, 2011,2012,2014,2015, 2016, 2017, 2018 & 2019 and Treasury Bills and Treasury Bonds held by non-residents are recorded under other activities
Sources: Ministry of Finance Central Bank of Sri Lanka
(b) Excludes outstanding loans of Projects under state owned business enterprises(c) Provisional

PUBLIC DEBT MANAGEMENT IN SRI LANKA – 201914
2.5.8 Usage of Foreign Debt
Debt raised through external sources was mainly used for the development of economic services which accounted for 45.93 per cent of outstanding external debt at end 2019. Two main sectors thatwerebeneficialthroughsuchdevelopmentswere industrial and construction sector (28.72 per cent) and service sector (11.17 per cent). External debt was also deployed to improve
social services and in importing commodities and food, that accounted for 7.74 per cent and 0.82 per cent of the total external debt during the year respectively. Further, a substantial share of foreign debt (16.07 per cent) was utilised for the development of transportation systems including roads and bridges while development in ground transportation accounted for 5.52 per cent of the total external debt.

PUBLIC DEBT MANAGEMENT IN SRI LANKA – 2019 15
Servicing Public Debt in 20193.
3.1. Debt Service Payments
Timely debt servicing extends to all facets of efficientpublicdebtmanagement,especiallyincontinuing the unblemished record for servicing sovereign debt. Necessarily, Central Bank of Sri Lanka,fiscalagenttotheGovernment,strivestomaintain the highest standards of debt servicing tobenefitboththeborrowerandthelender.
Total debt service payments effected in 2019 amounted to Rs. 2,022.5 billion, a decrease of 3.16 per cent compared to debt servicing expense of Rs. 2,088.6 billion recorded in 2018.
During 2019, total amortisation payments amounted to Rs. 1,121.2 billion whilst interest payments amounted to Rs. 901.4 billion.
Composition of total debt servicing consisted of 55.43 per cent in amortisation payments and 44.57 per cent in interest payments.
Giventheclassificationofsourceoffundingtobe domestic and foreign, domestic debt service payments amounted to Rs. 1,199.1 billion and foreign debt service payments were Rs. 823.4 billion in 2019. Total debt servicing consisted of 59.29 per cent of domestic debt servicing and 40.71 per cent of foreign debt servicing during the year.
Total debt service payments as a percentage of government revenue remained high at 106.96 per cent during 2019, despite a marginal improvement from the previous year. The ratio was 108.78 per cent in 2018. Share of gross
TABLE 12DEBT SERVICE PAYMENTS
Rs. billion
Category 2017 2018 2019 (a)Domestic 1,213.5 1,561.4 1,199.1
Principal Payments (b) 642.9 921.9 546.3Interest Payments (c) 570.6 639.5 652.8
Foreign (d) 389.6 527.2 823.4Principal Payments (e) 224.6 314.5 574.8Interest Payments (f) 164.9 212.7 248.6
Total Payments 1,603.0 2,088.6 2,022.5(a) Provisional Sources: Ministry of Finance (b) Excludes Treasury bond amortisation payments to non-residents Central Bank of Sri Lanka(c) Excludes Treasury bills and Treasury bond interest payments to non-residents (d) Excludes debt service payments on state-owned enterprises.(e) Includes Treasury bond amortisation payments to non-residents
(f) Includes Treasury bills and Treasury bond interest payments to non-residents

PUBLIC DEBT MANAGEMENT IN SRI LANKA – 201916
domestic product (GDP) committed to debt servicing was 13.47 per cent in 2019, a decrease from 14.54 per cent in 2018.
3.2. Amortisation of Debt
Repayments, i.e. amortisation payments, amounted to Rs. 1,121.2 billion in 2019, recording a decrease of 9.32 per cent from Rs. 1,236.4 billion worth amortisation payments made in 2018. A record high growth of amortisation payments (42.52 per cent) was witnessed during 2018 due to increased capital repayments of Treasury bonds and Sri Lanka Development Bonds (SLDBs).
Share of government revenue committed to debt amortisation payments also declined to 59.29 per cent in 2019 when compared to 64.39 per cent recorded in 2018. Further, amortisation payments as a percentage of GDP declined to 7.47 per cent in 2019 compared to 8.61 per cent recorded in the previous year.
TABLE 13AMORTISATION OF DEBT
Rs. billion
Source/ Instrument 2017 2018 2019(a) Domestic Debt 642.9 921.9 546.3 Treasury Bonds (b) 355.9 510.0 427.2 Rupee Loans - - - Foreign Currency Banking Unit Loans 1.8 47.8 2.6 Sri Lanka Development Bonds 285.2 363.6 111.8 Other Domestic - 0.57 4.74 Foreign Debt (c) 224.6 314.5 574.8 Treasury Bonds held by Foreigners 5.1 7.5 2.5 Sovereign Bonds - - 269.8 Other 219.5 307.0 302.5Total Amortisation Payments 867.5 1,236.4 1,121.2(a) Provisional Sources: Ministry of Finance(b) Excludes Treasury bond amortisation payments to non-residents Central Bank of Sri Lanka(c) Includes Treasury bond amortisation payments to non-residents and excludes debt service payments on state-owned enterprises
Principal repayments on domestic debt amounted to Rs. 546.3 billion and accounted for 48.73 per cent of total amortisation. Foreign debt obligations consumed the remaining Rs. 574.8 billion, accounting for 51.27 per cent of total amortisation.
3.2.1. Amortisation of Domestic Debt
Repayment of principal owed to domestic sources of financing decreased by Rs. 375.6billion, recording a decrease of 40.74 per cent, during 2019. Total amortisation of domestic debt was Rs. 546.3 billion and Rs. 921.9 billion in 2019 and 2018, respectively.
Provided the classification of domestic debtamortisation, capital repayments on Treasury bonds amounted to Rs. 427.2 billion in 2019, recording a decrease of Rs. 82.8 billion from Rs. 510.0 billion in 2018. Similarly, capital repayments on SLDBs declined by Rs. 251.7 billion to Rs. 111.8 billion during 2019. Loans obtained from foreign currency banking units
PUBLIC DEBT MANAGEMENT IN SRI LANKA – 2019 17
(FCBUs) of domestic banks were also amortised at a reduced amount of Rs. 2.6 billion during the year. Repayment of other outstanding domestic debt increased by Rs. 4.2 billion during the year.
3.2.2. Amortisation of Foreign Debt
Total amortisation payments to foreign sources of funding amounted to Rs. 574.8 billion in rupee terms in 2019. In contrary to domestic debt, foreign debt amortisation increased by Rs. 260.4 billion or 82.79 per cent during the year.
Growth in foreign debt amortisation was mainly due to maturity of International Sovereign Bonds of USD 1,500.0 million during the year. In addition to that, repayments on other project loans and foreign currency term financialfacilitiesamountedtoRs.302.5billionrecording a marginal decrease of 1.47 per cent worth Rs. 4.5 billion in 2019. Furthermore, capital repayments to non-residents who have invested in Treasury bonds decreased by Rs.
5.0 billion in 2019. Depreciation of the rupee against major foreign currencies used for repaymentalsocontributedtoinflatetherupeevalue of repayments.
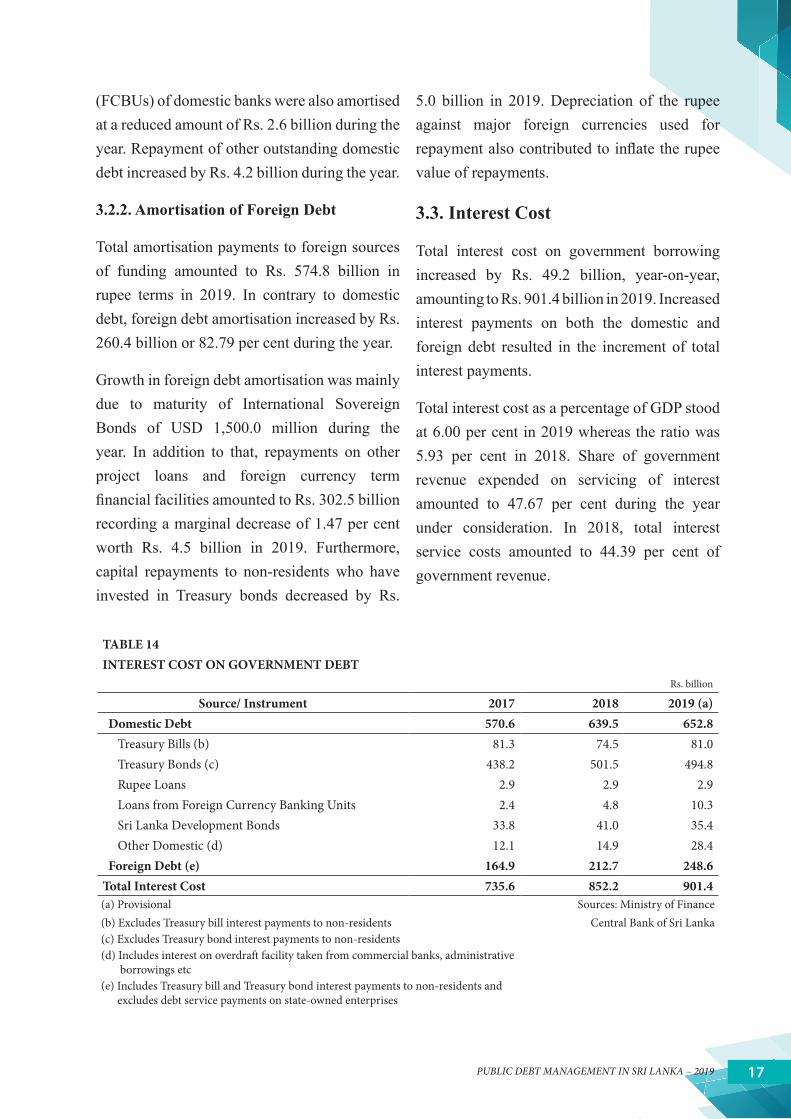
3.3. Interest Cost
Total interest cost on government borrowing increased by Rs. 49.2 billion, year-on-year, amounting to Rs. 901.4 billion in 2019. Increased interest payments on both the domestic and foreign debt resulted in the increment of total interest payments.
Total interest cost as a percentage of GDP stood at 6.00 per cent in 2019 whereas the ratio was 5.93 per cent in 2018. Share of government revenue expended on servicing of interest amounted to 47.67 per cent during the year under consideration. In 2018, total interest service costs amounted to 44.39 per cent of government revenue.
TABLE 14INTEREST COST ON GOVERNMENT DEBT
Rs. billion
Source/ Instrument 2017 2018 2019 (a) Domestic Debt 570.6 639.5 652.8 Treasury Bills (b) 81.3 74.5 81.0 Treasury Bonds (c) 438.2 501.5 494.8 Rupee Loans 2.9 2.9 2.9 Loans from Foreign Currency Banking Units 2.4 4.8 10.3 Sri Lanka Development Bonds 33.8 41.0 35.4 Other Domestic (d) 12.1 14.9 28.4 Foreign Debt (e) 164.9 212.7 248.6Total Interest Cost 735.6 852.2 901.4(a) Provisional Sources: Ministry of Finance(b) Excludes Treasury bill interest payments to non-residents Central Bank of Sri Lanka(c) Excludes Treasury bond interest payments to non-residents(d) Includes interest on overdraft facility taken from commercial banks, administrative borrowings etc(e) Includes Treasury bill and Treasury bond interest payments to non-residents and excludes debt service payments on state-owned enterprises
PUBLIC DEBT MANAGEMENT IN SRI LANKA – 201918
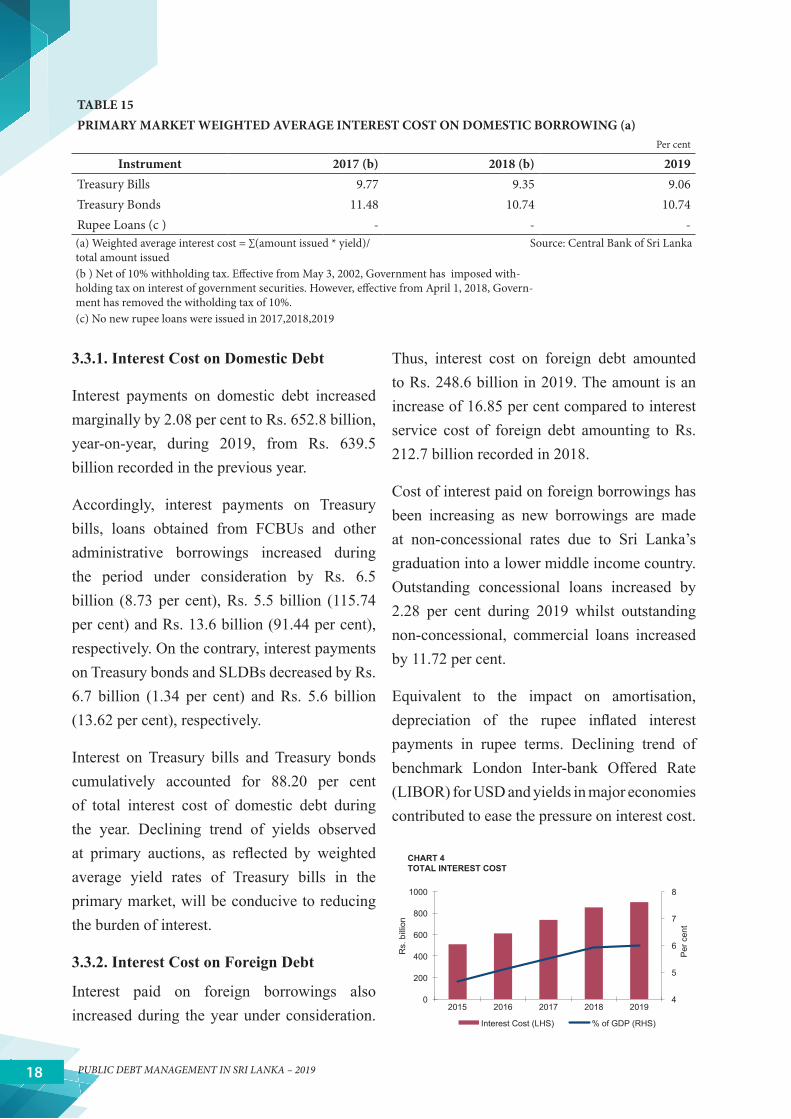
3.3.1. Interest Cost on Domestic Debt
Interest payments on domestic debt increased marginally by 2.08 per cent to Rs. 652.8 billion, year-on-year, during 2019, from Rs. 639.5 billion recorded in the previous year.
Accordingly, interest payments on Treasury bills, loans obtained from FCBUs and other administrative borrowings increased during the period under consideration by Rs. 6.5 billion (8.73 per cent), Rs. 5.5 billion (115.74 per cent) and Rs. 13.6 billion (91.44 per cent), respectively. On the contrary, interest payments on Treasury bonds and SLDBs decreased by Rs. 6.7 billion (1.34 per cent) and Rs. 5.6 billion (13.62 per cent), respectively.
Interest on Treasury bills and Treasury bonds cumulatively accounted for 88.20 per cent of total interest cost of domestic debt during the year. Declining trend of yields observed at primary auctions, as reflected by weightedaverage yield rates of Treasury bills in the primary market, will be conducive to reducing the burden of interest.
3.3.2. Interest Cost on Foreign Debt
Interest paid on foreign borrowings also increased during the year under consideration.
Thus, interest cost on foreign debt amounted to Rs. 248.6 billion in 2019. The amount is an increase of 16.85 per cent compared to interest service cost of foreign debt amounting to Rs. 212.7 billion recorded in 2018.
Cost of interest paid on foreign borrowings has been increasing as new borrowings are made at non-concessional rates due to Sri Lanka’s graduation into a lower middle income country. Outstanding concessional loans increased by 2.28 per cent during 2019 whilst outstanding non-concessional, commercial loans increased by 11.72 per cent.
Equivalent to the impact on amortisation, depreciation of the rupee inflated interestpayments in rupee terms. Declining trend of benchmark London Inter-bank Offered Rate (LIBOR) for USD and yields in major economies contributed to ease the pressure on interest cost.
TABLE 15PRIMARY MARKET WEIGHTED AVERAGE INTEREST COST ON DOMESTIC BORROWING (a)
Per cent
Instrument 2017 (b) 2018 (b) 2019Treasury Bills 9.77 9.35 9.06Treasury Bonds 11.48 10.74 10.74Rupee Loans (c ) - - - (a) Weighted average interest cost = ∑(amount issued * yield)/ total amount issued
Source: Central Bank of Sri Lanka
(b ) Net of 10% withholding tax. Effective from May 3, 2002, Government has imposed with-holding tax on interest of government securities. However, effective from April 1, 2018, Govern-ment has removed the witholding tax of 10%.(c) No new rupee loans were issued in 2017,2018,2019
25.39 24.35 22.96
31.63 25.55 25.14
42.98 50.09 51.91
- 10 20 30 40 50 60 70 80 90
100
2017 2018 2019
Per
cen
t
Commercial Loans Bilateral Multilateral
45.15 45.40 43.23
54.85 54.60 56.77
- 10 20 30 40 50 60 70 80 90
100
2017 2018 2019
Per
cen
t
Non-Concessional Loans Concessional Loans
CHART 11 FOREIGN DEBT BY CONCESSIONALITY
0
200
400
600
800
1,000
2020 2025 2030 2035 2040 2045
Rs.
bill
ion
Total Repayment Interest
CHART 6 DOMESTIC CURRENCY DEBT SERVICE OBLIGATIONS
0 5 10 15 20 25 30 35 40 45
-
1,000
2,000
3,000
4,000
5,000
6,000
7,000
2015 2016 2017 2018 2019
Per
cen
t
Rs.
bill
ion
SDR USD EURO Jap.Yen LKR Other
CHART 10 FOREIGN DEBT
4
5
6
7
8
0
200
400
600
800
1000
2015 2016 2017 2018 2019
Per
cen
t
Rs.
bill
ion
Interest Cost (LHS) % of GDP (RHS)
- 50
100 150 200 250 300 350 400 450 500 550
Q1 Q2 Q3 Q4 Q1 Q2 Q3 Q4 Q1 Q2 Q3 Q4 2017 2018 2019
Rs.
bill
ion
T-bill T-bond Total
0
200
400
600
800
1,000
1,200
2020 2025 2030 2035 2040 2045 2050 2055 2060
Rs.
bill
ion
CHART 5 FOREIGN CURRENCY DEBT SERVICE OBLIGATIONS
Total (Rs. Bn) Interest (Rs. Bn)
4 5 6 7 8 9
10 11 12
4-Ja
n-19
4-A
pr-1
9
4-Ju
l-19
4-O
ct-1
9
Per
cen
t
CHART 7 T-BILL PRIMARY MARKET WEIGHTED AVERAGE YIELDS
91 day 182 day 364 day
CHART 3 FOREIGN OUTSTANDING IN TREASURY BILLS AND TREASURY BONDS - 2016 to 2018
CHART 4TOTAL INTEREST COST
PUBLIC DEBT MANAGEMENT IN SRI LANKA – 2019 19
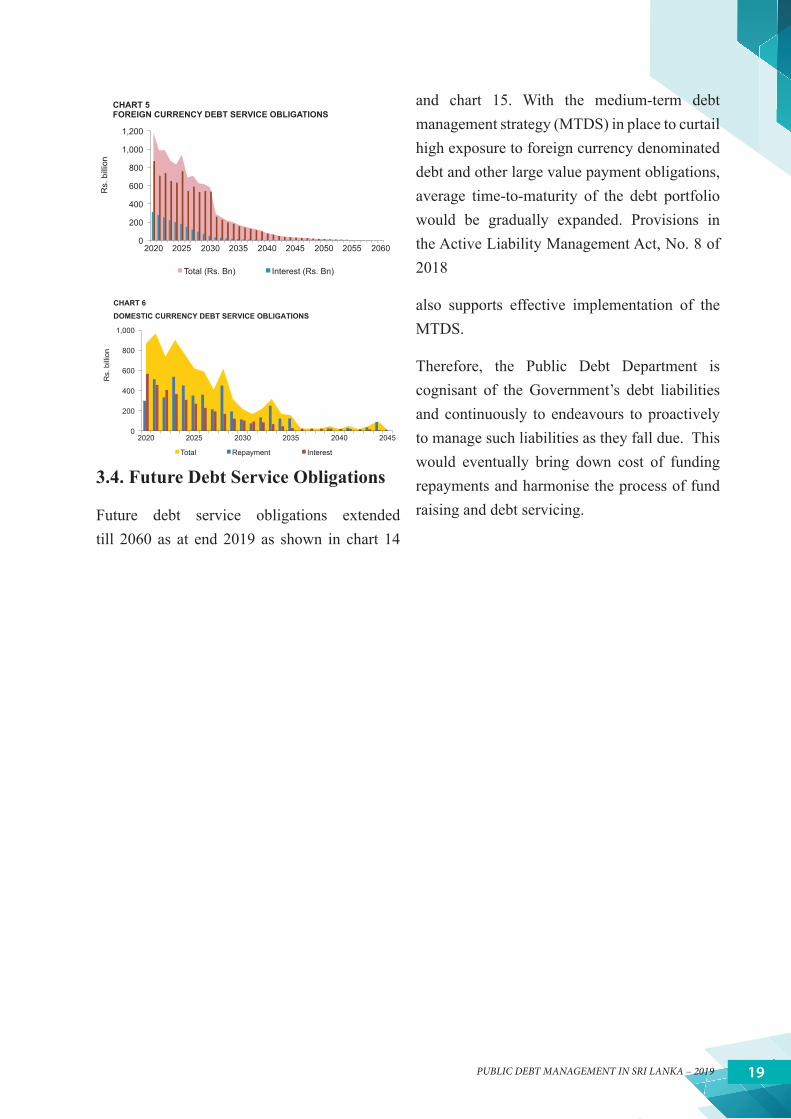
3.4. Future Debt Service Obligations
Future debt service obligations extended till 2060 as at end 2019 as shown in chart 14
25.39 24.35 22.96
31.63 25.55 25.14
42.98 50.09 51.91
- 10 20 30 40 50 60 70 80 90
100
2017 2018 2019
Per
cen
t
Commercial Loans Bilateral Multilateral
45.15 45.40 43.23
54.85 54.60 56.77
- 10 20 30 40 50 60 70 80 90
100
2017 2018 2019
Per
cen
t
Non-Concessional Loans Concessional Loans
CHART 11 FOREIGN DEBT BY CONCESSIONALITY
0
200
400
600
800
1,000
2020 2025 2030 2035 2040 2045
Rs.
bill
ion
Total Repayment Interest
CHART 6 DOMESTIC CURRENCY DEBT SERVICE OBLIGATIONS
0 5 10 15 20 25 30 35 40 45
-
1,000
2,000
3,000
4,000
5,000
6,000
7,000
2015 2016 2017 2018 2019
Per
cen
t
Rs.
bill
ion
SDR USD EURO Jap.Yen LKR Other
CHART 10 FOREIGN DEBT
4
5
6
7
8
0
200
400
600
800
1000
2015 2016 2017 2018 2019
Per
cen
t
Rs.
bill
ion
Interest Cost (LHS) % of GDP (RHS)
- 50
100 150 200 250 300 350 400 450 500 550
Q1 Q2 Q3 Q4 Q1 Q2 Q3 Q4 Q1 Q2 Q3 Q4 2017 2018 2019
Rs.
bill
ion
T-bill T-bond Total
0
200
400
600
800
1,000
1,200
2020 2025 2030 2035 2040 2045 2050 2055 2060
Rs.
bill
ion
CHART 5 FOREIGN CURRENCY DEBT SERVICE OBLIGATIONS
Total (Rs. Bn) Interest (Rs. Bn)
4 5 6 7 8 9
10 11 12
4-Ja
n-19
4-A
pr-1
9
4-Ju
l-19
4-O
ct-1
9
Per
cen
t
CHART 7 T-BILL PRIMARY MARKET WEIGHTED AVERAGE YIELDS
91 day 182 day 364 day
CHART 3 FOREIGN OUTSTANDING IN TREASURY BILLS AND TREASURY BONDS - 2016 to 2018
CHART 4TOTAL INTEREST COST
and chart 15. With the medium-term debt management strategy (MTDS) in place to curtail high exposure to foreign currency denominated debt and other large value payment obligations, average time-to-maturity of the debt portfolio would be gradually expanded. Provisions in the Active Liability Management Act, No. 8 of 2018
also supports effective implementation of the MTDS.
Therefore, the Public Debt Department is cognisant of the Government’s debt liabilities and continuously to endeavours to proactively to manage such liabilities as they fall due. This would eventually bring down cost of funding repayments and harmonise the process of fund raising and debt servicing.
PUBLIC DEBT MANAGEMENT IN SRI LANKA – 201920
Market Operations in 20194.
4.1 Overview
Functioning as the government agent responsible for the public debt management in terms of the Section 113 of the Monetary Law Act (MLA), Government’s borrowing program for 2019 was implemented by the Central Bank of Sri Lanka (CBSL), ensuring that funds were raised at the lowest possible cost and at a prudent degree of risk, subject to market conditions prevailed during 2019. Under these circumstances, CBSL issued several tradable debt instruments, namely Treasury bills, Treasury bonds and Sri Lanka Development Bonds (SLDBs) in the domestic financial market and International SovereignBonds (ISBs) in the international capital market within the overall borrowing limit specifiedunder the Appropriation Act No. 06 of 2019. In parallel, the External Resources Department of the Ministry of Finance raised external loan facilities by way of project loans, commodity loansandsyndicatedfinancingfacilitiesduringthe year.
The downward adjustment of the Treasury bill yieldratesobservedtowardstheendofthefirstquarter of 2019 could largely be attributed to the predictable issuance calendar under prudent issuance arrangements, reduction of SRR by 100 basis points to 5.00 per cent in March 2019 resulting in improved money market liquidity and increased investments in Government securities by banks propelled by subdued credit growth. Also, contributory has been the positive market sentiments emanating from the issuance
of ISB in March 2019. Further, the short-term Government securities yield rates declined in second and third quarters of 2019 owing to accommodative monetary policy stance adopted by CBSL by reducing Standing Deposit Facility Rate (SDFR) and Standing Lending Facility Rate (SLFR) by a total of 100 basis points in May and August 2019 coupled with the second ISB issuance in June 2019. This declining trend was observed in the fourth quarter as well, until the unfavourable revision of the sovereign rating outlook by rating agencies towards end 2019 andtheshiftinthefiscalpolicystancewithtaxreduction exerting marginal upward pressure on the yield rates of Government securities. Yields on Treasury bonds in the primary market too declined substantially during 2019, although the upward pressure observed on yield rates of Treasury bills during the latter part of 2019 was not observed on the yields of Treasury bonds. However, foreign inflows to the GovernmentSecurities market decreased in 2019 when comparedto2018andthenetforeignoutflowsfrom the Government securities market were aggravatedduetoweakenedinvestorconfidenceinflicted by the Easter Sunday attack inApril2019 and uncertainties in the global financialmarkets during the latter half of 2019.
4.2 Treasury Bills Primary Market
Treasury bill is the key debt instrument used by the Public Debt Department (PDD) to manage Treasury’s short-term cash-flow requirement

PUBLIC DEBT MANAGEMENT IN SRI LANKA – 2019 21
through the issuance of three standard maturities (91-day, 182-day and 364-day) during 2019.
Gross fund mobilization through the issuance of Treasury bills amounted to Rs. 1,719.3 billion on face value basis in 2019 compared to Rs. 1,653.3 billion in 2018. The face value of outstanding Treasury bills as at end 2019 was Rs. 873.9 billion in comparison to Rs. 746.8 billion recorded at end 2018. Further, 52 weekly Treasury bill auctions were conducted by the Central Bank in 2019.
The primary market Treasury bill Weighted Average Yield Rates (WAYRs) decreased during the first two quarters of 2019, demonstratingmarginal upward movement during the latter part of the year. Compared to the levels prevailed at end 2018, the yield rates of 91-day, 182-day and 364-day maturity Treasury bills decreased by 250 basis points, 197 basis points and 275 basis points, respectively, on net basis as at end
2019. Accordingly, as at end 2019, the primary market Treasury bill WAYRs of 91-day, 182-day and 364-day maturity Treasury bills were recorded at 7.51 per cent, 8.02 per cent and 8.45 per cent, respectively.
4.3 Treasury bonds Primary Market
During the year, 12 Treasury bond auctions offering multiple maturities in the range of 2-20 years were conducted, where the primary market WAYR for Treasury bonds ranged between 10.27 per cent and 11.43 per cent. Meanwhile, as at end 2019, there were 63 outstanding Treasury bond series.
The Average Time to Maturity (ATM) of Treasury bond portfolio decreased marginally to 6.8 years as at end 2019 from 6.9 years reported at end 2018 largely driven by the issuance of short to medium term maturities of Treasury bonds in 2019. Among the 24 ISINs issued at 12 Treasury bond auctions held in 2019, 8 new ISINs were issued collecting Rs. 360.0 bn while Rs. 438.0 bn was raised by issuing existing Treasury bond series.
The WAYRs of Treasury bonds issued in 2019 remained unchanged compared to the previous year at 10.74 per cent. Mixed movements in the primary WAYRs of Treasury bonds were
25.39 24.35 22.96
31.63 25.55 25.14
42.98 50.09 51.91
- 10 20 30 40 50 60 70 80 90
100
2017 2018 2019
Per
cen
t
Commercial Loans Bilateral Multilateral
45.15 45.40 43.23
54.85 54.60 56.77
- 10 20 30 40 50 60 70 80 90
100
2017 2018 2019
Per
cen
t
Non-Concessional Loans Concessional Loans
CHART 11 FOREIGN DEBT BY CONCESSIONALITY
0
200
400
600
800
1,000
2020 2025 2030 2035 2040 2045
Rs.
bill
ion
Total Repayment Interest
CHART 6 DOMESTIC CURRENCY DEBT SERVICE OBLIGATIONS
0 5 10 15 20 25 30 35 40 45
-
1,000
2,000
3,000
4,000
5,000
6,000
7,000
2015 2016 2017 2018 2019
Per
cen
t
Rs.
bill
ion
SDR USD EURO Jap.Yen LKR Other
CHART 10 FOREIGN DEBT
4
5
6
7
8
0
200
400
600
800
1000
2015 2016 2017 2018 2019 P
er c
ent
Rs.
bill
ion
Interest Cost (LHS) % of GDP (RHS)
- 50
100 150 200 250 300 350 400 450 500 550
Q1 Q2 Q3 Q4 Q1 Q2 Q3 Q4 Q1 Q2 Q3 Q4 2017 2018 2019
Rs.
bill
ion
T-bill T-bond Total
0
200
400
600
800
1,000
1,200
2020 2025 2030 2035 2040 2045 2050 2055 2060
Rs.
bill
ion
CHART 5 FOREIGN CURRENCY DEBT SERVICE OBLIGATIONS
Total (Rs. Bn) Interest (Rs. Bn)
4 5 6 7 8 9
10 11 12
4-Ja
n-19
4-A
pr-1
9
4-Ju
l-19
4-O
ct-1
9
Per
cen
t CHART 7 T-BILL PRIMARY MARKET WEIGHTED AVERAGE YIELDS
91 day 182 day 364 day
CHART 3 FOREIGN OUTSTANDING IN TREASURY BILLS AND TREASURY BONDS - 2016 to 2018
CHART 4TOTAL INTEREST COST
TABLE 16 PRIMARY MARKET WEIGHTED AVERAGE YIELD RATES OF TREASURY BILL AUCTIONS (a)
Per centPeriod End December
20182019
End Quarter 1 End Quarter 2 End Quarter 3 End Quarter 491 Days 10.01 9.39 8.24 7.62 7.51
182 Days 9.99 9.67 8.49 7.75 8.02364 Days 11.20 10.40 8.70 8.41 8.45
a) Weighted Average Yield Rate (WAYR) of each quarter end Treasury bill auction issue for each maturity
Source: Central Bank of Sri Lanka

PUBLIC DEBT MANAGEMENT IN SRI LANKA – 201922
witnessed in 2019 where a declining trend was observed in the behavior of the WAYRs of medium term Treasury bonds while the long-term Treasury bonds recorded an increase, compared to the previous year.
4.4 Sri Lanka Development Bonds
Funds raised through the issuances of Sri Lanka Development Bonds (SLDBs) in 2019 amounted to US dollars 345.2 million
while enabling CBSL to successfully manage both issuance arrangements and yield rates structure of domestic debt instruments. The US dollar denominated SLDBs were issued with maturities ranging from 1-year 6-months to 4-years3-monthsunderbothfloatingandfixedrate arrangements during 2019.
The SLDB issuances coupled with the successful issuances of 5-year and 10-year maturity ISBs amounting to US dollars 2,400
TABLE 17PRIMARY MARKET WEIGHTED AVERAGE YIELD RATES OF TREASURY BILLS AND TREASURY BONDS (a)
Per centInstrument 2013 2014 2015 2016 2017 2018 2019 (b)
Treasury Bills (Days) 91 8.95 6.58 6.32 8.26 9.01 8.40 8.15
182 9.91 6.57 6.50 9.23 9.81 8.58 8.44364 10.65 6.73 6.60 10.20 10.07 9.67 9.40
Overall Average 10.45 6.68 6.46 9.38 9.77 9.35 9.06
Treasury Bonds (Years)2 - - 7.98 11.45 11.05 - 10.273 10.95 - 8.32 11.58 - 10.44 10.384 - - 8.68 11.87 11.54 - - 5 10.95 8.78 8.63 12.16 11.53 10.33 10.556 10.97 - 9.19 12.01 11.36 - -7 - - 8.99 12.18 12.94 10.37 -8 11.51 9.03 9.55 12.28 11.44 11.21 10.819 11.77 9.23 - 13.07 12.91 12.16 10.56
10 11.80 10.00 9.78 12.60 11.16 11.06 11.4312 12.09 - - 13.72 - - 11.2715 12.17 10.34 10.24 - - 10.49 10.5920 12.19 11.32 11.20 - - - 10.5230 12.50 11.75 11.73 - - - -
Overall Average 11.72 10.17 9.46 12.27 11.48 10.74 10.74(a) Net of 10% withholding tax. Effective from May 3, 2002, Government has
imposed withholding tax on interest of government securities. However, effective from April 1, 2018, Government has removed the witholding tax of 10%.
Source: Central Bank of Sri Lanka
(b) Provisional

PUBLIC DEBT MANAGEMENT IN SRI LANKA – 2019 23
million in March 2019 at coupon rates of 6.85 per cent and 7.75 per cent, respectively, and Us dollars 2,000 million for the aforesaid maturities at coupon rates of 6.35 per cent and 7.55 per cent, respectively, in June 2019, paved way for effective implementation of strategies formulated for an orderly domestic market resulting in a low and stable domestic interest rate environment.
Meanwhile, the outstanding SLDB stock decreased to US dollar 3,084.4 million at end 2019 compared to US dollar 3,361.0 million recorded at end 2018. Licensed Commercial Banks (LCBs) were the main investors of SLDBs and majority of such investments was held to maturity by LCBs.
4.5 Secondary Market Yield Rates
Secondary market yield rates of Treasury bills reflected downward adjustment followingthe similar trend noted in the primary market yield rates during 2019. Accordingly, as per indicative quotes reported by Primary Dealers (PDs), compared to end 2018, 91-day, 182-day and 364-day secondary market Treasury bill yields decreased by 215 bps, 208 bps and 253 bps, respectively, by end 2019.
Secondary market yields of medium to longer term Treasury bonds also showed a downward adjustment. Accordingly, as per indicative
quotes reported by PDs, compared to end 2018, the secondary market yields of 2-year, 5-year, 8-year and 10-year maturity Treasury bonds decreased by 254 bps, 186 bps, 176 bps and 180 bps, respectively, by end 2019.
Total net outflowof foreign investments fromthe Government securities market of US dollars 333.7 million was recorded in 2019, compared to the net outflow of US dollars 50.3millionrecorded in 2018. Political uncertainty driven by the Presidential Election towards the latter part of 2019, spillover effects of the Easter Sunday attacks on investor confidence andunfavourable revision of the sovereign rating outlook,couldbeidentifiedasthemaindriversofacceleratingoutflowsofforeigninvestmentsin Government securities. Treasury bonds owned by foreign investors recorded a decline to Rs. 80.3 billion by end 2019 compared to Rs. 146.9 billion recorded as at end 2018. However, the outstanding foreign holdings of Treasury bills increased to Rs. 23.7 billion as at end 2019 compared to Rs. 11.9 billion recorded at end 2018 mainly due to shift in investor preference to shorter tenures instigated by weakened investorconfidence.
The total transaction volume of Government securities (Treasury bills and Treasury bonds) on an outright basis during 2019 was recorded at Rs. 7,413.8 billion compared to Rs. 6328.6 billion recorded in 2018.

PUBLIC DEBT MANAGEMENT IN SRI LANKA – 201924
The Medium-Term Debt Management Strategy 2019 - 20235.
5.1 Overview
The Medium-Term Debt Management Strategy (MTDS), enunciates the strategies and debt management framework that the Ministry of Finance, Economic and Policy Developments (MOF) and the Central Bank of Sri Lanka (CBSL) plan to execute over the medium term with the aim of implementing a prudent borrowing programme and achieving government’s debt management objectives. The MTDS is primarily aims at building an appropriate composition of debt instruments in line with medium-term policy direction announced by the Central Bank as well as the Medium Term Fiscal Framework (MTFF) of the MOF, to ensure financing thegovernment’s budgetary needs at the lowest possible cost consistent with prudent level of risk to achieve sustainable level of central government debt portfolio over the medium to long term. Further, this is a rolling plan for the period under consideration.
The MTDS for 2019-2023, articulates the government’s debt management direction to achieve the cost and risk objectives over the mediumtermwithinthedefinedriskparameters.Accordingly, considerations such as potential variation in debt servicing costs and its budgetary impact, linkages with other key macroeconomic objectives, improvements in debt sustainability measures and the development of domestic debt market have been factored in formulating the MTDS for 2019-2023.
Accordingly, the Central Bank and the MOF jointly developed the MTDS, with assistance from the International Monetary Fund and the World Bank, and published the same in the Central Bank website in April 2019. The MTDS, which initially covered the period 2019–2023, focuses mainly on containing the foreign currency debt exposure in line with the end-2018 level, improving the Average Time to Maturity (ATM) of the foreign currency debt portfolio and minimising the debt maturing within one year. The strategy has taken into account the developments in local and global economies. However, the underlying debt management targets stipulated in the current MTDS are subject to an ongoing review in line with macroeconomic and external sector developments. With the availability of Annual Budget 2021, medium-term fiscal outlookalongside the macroeconomic outlook and the impact of COVID-19 pandemic, the MTDS targets will be revisited at the latter part of 2020.
5.2 Stated objectives of the MTDS
The primary objective of the MTDS is to ensure thatthegovernment’sfinancialneedsaremetatthe lowest possible cost with a prudent degree of risk over the medium term. In addition, the followingsecondaryobjectivesarealsodefinedin the MTDS to facilitate its primary objectives.
(a) Evaluating and managing the risks involved in different debt compositions;

PUBLIC DEBT MANAGEMENT IN SRI LANKA – 2019 25
(b)Facilitating coordination with fiscal andmonetary management;
(c) Enhancing the transparency in government debt management;
(d)Enhancing theefficiencyandcompetitionof the primary market for government securities;
(e) Broadening and deepening of the secondary market for government securities;
(f) Diversificationofinvestorandinstrumentbase;
(g)Enhancingtheefficiencyofthesecondarymarket by developing a dynamic benchmark yield curve across the term structure;
(h) Enhancing debt dynamics;
(i) Publishing a Treasury bond and Treasury bill issuance/ settlement calendar on a rolling basis; and
(j) Upgrading the infrastructure of the domestic debt market supported by an e-trading platform together with a central clearing arrangement.
5.3 Expected benefits of the MTDS
The MTDS takes into consideration of the cost and associated risk of all available government financing strategies in decidingthe best combination among alternatives in selecting a suitable financing mode. After acareful evaluation of costs and risks associated with each strategy, the MTDS recommends the most prudent strategy to manage government debt portfolio. Further, the MTDS framework facilitates enhanced coordination and establishes
the link between various stakeholders in line with fiscal policy, monetary policyand other macroeconomic variables. Such improved policy coordination allows different government agencies to focus on their core objectives while maintaining clear segregation of central government debt management decisions. Similarly, a well-established MTDS helps to identify constraints affecting the debt management choices and finds ways toaddress possible constraints. Moreover, a well-structured MTDS improves the governance of debt management and enhances the consistency of the debt management process.
5.4 MTDS and the macroeconomic framework
The MTDS should be in line with the overall macroeconomic framework to achieve the specifiedMTDStargets.Itisalsoimperativethatthe interlinkages and feedback effects are well articulate and that coordination mechanisms are in place. For emerging and developing economies, interlinkages are likely to be more significant, given underdeveloped domesticdebt markets, capacity constraints and relatively weak institutional setting. Accordingly, close coordination with overall macroeconomic framework is vital to ensure more stable environments for debt management operations.
The interlinkages between the MTDS and other key policy areas to identify cost risk trade-offs to formulate a prudent MTDS for the country include;
• MTDS and fiscal planning - The requireddebtfinancingforafinancialyearismainlydetermined by the fiscal policy of the
PUBLIC DEBT MANAGEMENT IN SRI LANKA – 201926
country. Therefore, the MTDS should be formulated in line with a fully operational medium-termfiscalframework.
• MTDS and monetary policy – The debt management is not a standalone policy, but has close linkages between monetary policy. The Monetary policy mechanism plays a vital role in determining the MTDS for the country.
• MTDS, exchange rate policy and balance of payments – The exchange rate policy, the balance of payment trends and subsequent developments in the real exchange rate may have consequences for the MTDS. Accordingly, the exchange rate depreciation increases the debt servicing cost in local currency. Overall, foreign currency borrowing requires a careful analysis on balance of payments trends and exchange rate policies.
• MTDS and the development of domestic debt markets – The trade-off between domestic borrowing and the foreign borrowing is always determined by the level of development and the capacity of the domestic debt market and the private sector crowding out considerations. The MTDS helps to identify key challenges in this area and formulate strategies to address those challenges.
• MTDS and annual borrowing plan - An annual borrowing plan for the country is vital for the development of prudent debt management strategy. The MTDS should be developed in line with the annual borrowing plan and taking into account the underlying volatilityinthegovernmentcashflows.
The MTFF of the government is designed to further strengthen the fiscal consolidationprocess by reducing the budget deficit andimproving the government debt profile in themedium term. The MTFF has been formulated factoring the market disruptions caused by the Easter Sunday attacks and the COVID-19 pandemic. The government’s policy framework is geared towards striking balance between mitigating these market disruptions and maintainingfiscalandfinancialsustainabilityinthe medium term. Accordingly, the government is expected to take measures to reduce the budget deficit in themedium-term, estimatingaprimarysurplusand toreducebudgetdeficitto 5.1 per cent of the Gross Domestic Product (GDP) and the debt stock to around 81.8 per cent of GDP by 2023.
5.5 Implementation of the MTDS 2019 – 2023
5.5.1 MTDS targets and Performance
The MTDS provides a framework for a prudent borrowing programme, that is intended to be executed over the medium-term with the objective of ensuring that the government’s financial needs aremet at the lowest possiblecost with a prudent level of risk. In formulating the MTDS, factors such as potential variation in debt servicing costs and its budgetary impact and bunching issues of the debt stock are considered.
The key debt portfolio risks for Sri Lanka are foreign exchange and refinancing risks.Accordingly,specificMTDStargetsforasetofrisk indicators have been established, they help to more clearly to communicate objectives like

PUBLIC DEBT MANAGEMENT IN SRI LANKA – 2019 27
“risk” and “cost,” and the trade-offs between them. Also, they have been set to mitigate the above identified risks in the medium term.Foreign currency denominated debt as a per cent of total debt, the Average Time to Maturity (ATM) of the foreign currency debt portfolio and the amount of debt maturing within a year as a percent of total debt were therefore selected as the debt management targets to be achieved by end-2023.
The Central Bank and the government were able to achieve better outcome than envisaged in the debt dynamics referred in the MTDS in 2019 amidst extremely volatile market condition. Accordingly, the ATM of foreign currency debt and debt maturing within 1-year period improved to 7.1 years and 15.3 per cent, compared to end 2018 levels of 6.6 years and 16.4 per cent, respectively. The share of foreign currency debt was maintained at the 2018 levels.
TABLE 18THE MTDS TARGETS AND 2019 PERFORMANCE
Indicator 2018 (Baseline)
2019 (Provisional)*
Targets as at end 2023
Ratio of Foreign Currency Debt to Total Debt (%) 54.0 54.0 54.0Average Time to Maturity of Foreign Currency Debt (years)
6.6 7.1 6.6
Debt maturing within a year (percent of total debt) 16.4 15.3 15.7*Achieved better outcome than envisaged Sources: Ministry of Finance,
Central Bank of Sri Lanka
The MTDS has been formulated to achieve the
said targets within the stipulated time period. The
strategy aims to contain the exposure to foreign
currency risk over the medium term by keeping
the share of foreign currency borrowings at 2018
level or less, increasing the ATM of the foreign
currency debt at 2018 level while reducing the
share of debt maturing within a year. However,
re-aligning the debt portfolio from foreign
currency to domestic currency debt needs to be
in line with the developments of the domestic
currency denominated government securities
marketaswellasdynamicforeigninflows.This
limits the ability to implement drastic changes
infinancingframeworkinthemediumterm.
However, due to the economic and market disruption caused by COVID-19, achieving the targets for 2023 now requires revisiting with the Budget 2020/21 and medium-term fiscaloutlook of the government.
5.5.2 Strategy implementation
The MTDS is being implemented with the collaboration of the Central Bank, the MOF and other relevant agencies. These institutions will also monitor, evaluate and revise the MTDS periodically. The success of MTDS is determined solely based on the achievement of the set targets. However, the implementation of the proposed strategy will be challenging as it requires a credible commitment from the

PUBLIC DEBT MANAGEMENT IN SRI LANKA – 201928
government to ensure successful execution of the envisagedfiscalconsolidationpath.Further,therobustgrowthinnon-debtcreatinginflowssuchas exports and foreign direct investments (FDIs) with lower than expected foreign currency earnings from other economic activities may severely affect the macro-economic framework therein, creating significant pressure on theimplementation of MTDS.
5.6 Issues and challenges of
implementing the MTDS
5.6.1 Unexpected market disruptions
As an emerging economy, the country is vulnerable to internal as well as external market disruptions likely, Eater Sunday attack and COVID-19 pandemic. Eventually, such shocks have dampened the economic activity and would increase the debt burden of the country.Further,limitedfiscalspacetomanagesuch external and domestic vulnerabilities and lack of adequate buffer funds amplify the debt burden of the country. Unexpected events have also aggravated the liquidity pressures and cost of external debt servicing.
5.6.2 Lack of secondary market participation due to liquidity requirements
Since 2004, the settlement of government securities transactions in the secondary market have been made through Scripless Securities Settlement System (SSSS) and Real Time Gross Settlement System (RTGS). Accordingly, each secondary market transaction in government securities is required to be settled bilaterally and on gross basis, where market participants are expected to maintain substantial amounts of
liquidity in both security and rupee terms to effect the transactions. This liquidity requirements, hinders the growth of transaction volumes of government securities in the secondary market.
5.6.3 Lack of effective cash flow forecasting and cash balance management of the government
A prudent and timely forecast of government cashflowisessentialfortheformulationofanefficient government borrowing programme.The perplexity in timely furnishing accurate government cash flows would hinder theimplementation of the MTDS and create deviation from the envisaged path.
5.6.4 Risks of future Sovereign Rating Downgrades
Current tightened global financing conditions,macroeconomic instability and fragile fiscalposition emanated from COVID-19 outbreak would adversely impact the sovereign ratings of the country thus resulting restricted access to the international capital market, while aggravating debt sustainability concerns of the country.
5.6.5 Increased foreign currency denominated debt maturities
High reliance in short to medium term foreign currency borrowings will intensify foreign currency risk and increase bunching of maturities in short to medium term horizon. Further, continuous borrowings from international capital markets will increase the annual interest payment liability on foreign currency borrowings and resulting in increasing pressure on country’s balance of payments and external reserves.

PUBLIC DEBT MANAGEMENT IN SRI LANKA – 2019 29
5.7 Measures taken to address the issues and challenges of implementing the MTDS
5.7.1 Standardisation of market regulations and other legislations
The Central Bank has already identified theimportance of amending the existing legal framework including the market regulations and directions applicable for prudent central government debt management. Accordingly, regulations and directions issued under the Registered Stocks and Securities Ordinance (RSSO) and Local Treasury Bills Ordinance (LTBO) are being currently reviewed with a view to develop the government securities market to match the latest developments in both domestic and international financial markets.Further, this initiative will facilitate to improve theinvestorconfidenceandcreateopportunitiesto explore new debt management practices.
5.7.2 Enhancing market transparency through system reforms
In order to enhance the market transparency and create more predictability in the auctioning process, the the Central Bank has started conducting pre-bid meetings on forthcoming Treasury bond auctions and publishes an auction calendar in concurrence with the MOF, informing the market on future Treasury bond issuances on quarterly rolling basis. The scope of the quarterly rolling auction calendar was further extended to cover a period of six months during 2019 where an advanced T-bond and T-bill auction calendar covering the period from July to December 2019 was published with the concurrence of the MOF.
5.7.3 Conducting of liability management activities
The Parliament approved the Active Liability Management Act (ALMA) in March 2018. Accordingly, a resolution was passed by the Parliament in July 2019 to raise up to Rs. 480 billion for liability management purposes under the ALMA. The liability management initiatives enable the government to proactively address part of the future refinancing requirementsahead of time by reducing rollover peaks and extending the maturity duration and/or smoothening repayments structure of debt maturities. In this regard, PDD initiated raising funds and building required buffers in the domesticmarketbyexecuting itsfirst liabilitymanagement based T-bonds issuance amounting to Rs. 15 billion in October 2019 and another Rs. 15 billion in December 2019. The buffers built in 2019 were utilised for settlement of debt service obligations during early part of 2020. The government also initiated preliminary work with respect to accessing alternative Sovereign bond markets in 2019.
5.7.4 Reducing foreign currency exposure
In order to reduce the foreign currency exposure and curtail the possible impact of increased volatility in global financial market, thethreshold of foreign investments in Treasury Bills and Treasury Bonds reduced to 5 per cent from 10 per cent out of the total outstanding stock of Treasury Bills and Treasury Bonds from 27 January 2019.
5.7.5 Strengthen the secondary market for government securities
To enhance the transparency in conducting transactions of government securities in the

PUBLIC DEBT MANAGEMENT IN SRI LANKA – 201930
secondary market, a Circular was issued to all participants of the LankaSettle system on 01 October 2019 to input key attributes such as settlement value, price and interest rate of each and every transaction with effect from 01 January 2020. Further, real-time notificationfacility was introduced from 25 March 2019 to deliver Short Message Service (SMS) and/or Email, to the customers registered in the Central Depository System (CDS), for each and every movement of securities in each Securities Account in the LankaSecure System.
5.7.6 Establishing Electronic Trading Platform (ETP) and Central Counterparty Settlement System (CCP)
As a part of its on-going endeavor in upgrading the financial system infrastructure of thecountry, the Central Bank plans to establish a state-of-the-art Central Counterparty Settlement System (CCP), Electronic Trading Platform (ETP) and an integrated Central Securities Depository (CSD) to facilitate electronic trading
of secondary market government securities and domestic foreign exchange market transactions and straight-through processing of secondary market government securities transactions in the domestic financial market. Setting up ofnew IT infrastructure, including an ETP and a CCP, facilitating transparent and efficientprimary and secondary market operations in transactions of government securities has been one of the major policy measures identifiedfor development of the government securities market and modernisation of the domestic money and capital markets. Moving forward with the implementation, during 2019, the Contract terms with the consultant selected by a Cabinet Appointed Consultant Procurement Committee were finalised. The consultant isrequired to evaluate required legal reforms and system specifications for the proposed CCP,ETP and an integrated CSD for government securities and domestic foreign exchange transactions.

PUBLIC DEBT MANAGEMENT IN SRI LANKA – 2019 31
Risk Management and Sustainability of Central Government Debt6.
6.1 Overview
The management of central government debt has become one of the key policy priorities in recent years due to increasing debt stock and the high debt servicing component in the government expenditure. In order to achieve a prudent debt management framework, the Central Bank of Sri Lanka (CBSL) considers the risk management of the debt portfolio as an important aspect in achieving the strategic targets envisaged in the Medium Term Debt Management Strategy (MTDS) that entails the management of the central government debt portfolio in a prudent manner considering its impact on the annual budget, bunching issues and the requirement to maintain a sustainable debt level.
The government debt portfolio is managed in line with the government medium-term macro fiscal framework. Therefore, a robustmechanism of risk management framework with special attention to possible changes in the macro fiscal environment was formulated bythemiddleofficeofthePublicDebtDepartment(PDD) while maintaining acceptable risk tolerance levels consistent with internationally acceptedbestpracticesandnorms.Theflexiblerisk tolerance levels are important in the current circumstances of substantive overshooting of fiscal targets and lower economic growthenvironment.
6.2 Risks Pertaining to the Central Government Debt Portfolio
The CBSL has made continuous efforts in managingrefinancing(rolloverrisk)andmarketrisks (exchange rate and interest rate) of the debt portfolio in 2019. Appropriate risk management strategies were employed in order to mitigate the impact emanated through other risks, such as liquidity risk, legal risk, operating risk, and reputational risk in an environment where originallysetfiscaltargetswerechallengedbyunfavourable market developments.
6.3 Analysis of the Risk Profile of the Central Government Debt Portfolio
6.3.1 Refinancing Risk: Refinancing orrollover risk is the possibility that the existing debt would have to be reissued at an unusually high cost or, in the extreme case, inability to reissue at all. The two most widely used indicators to measure the refinance risk ofthe central government debt portfolio are the Average Time to Maturity (ATM) and the ratio of short-term debt to total outstanding debt. The overall ATM of the government debt portfolio recorded as 6.10 years at end 2019 compared to 6.16 years at end 2018. The ATM of domestic currency debt decreased to 5.78 years at end 2019 from 5.91 years at end 2018 mainly due to the issuance of Treasury bonds maturing in the medium term. The ATM of foreign currency

PUBLIC DEBT MANAGEMENT IN SRI LANKA – 201932
debt portfolio remained at the same level at 6.34 years in both 2018 and 2019.
The share of domestic currency debt with remaining maturity less than or equal to one year (short term debt) to the outstanding domestic currency debt increased marginally to 21.63 per cent at end 2019 compared to 21.07 per cent an year ago, mainly due to issuance of Treasurybillstomeetthegovernmentfinancingrequirements. The share of short-term foreign currency debt with remaining maturity less than or equal to one year (short term debt) to total foreign currency debt increased to 4.72 per cent in end 2019 compared to 3.28 per cent in end 2018 driven mainly by the higher share of short term maturing SLDB issuances in 2019 compared to 2018. Further, the total short–term debt with remaining maturity less than or equal to one year (short term debt) as a percentage of total outstanding debt increased marginally to
13.52 per cent at end 2019 compared to 13.19 per cent at end 2018 due to increase in both short term foreign and domestic currency debt.
6.3.2 Interest Rate Risk: Interest rate risk is defined as the risk associated with cost ofservicing debt due to the volatilities in market interest rates. For the purpose of measuring and managing interest rate risk in the government debt portfolio, three indicators are generally used by the Central Bank, namely, the duration of the debt stock, Average-Time to-Refixing(ATR)andtheratiooffloatinginterestratedebtto total debt.
Duration is an indicator, which measures the time taken to payback the initial investment of the debt stock in present value terms. Duration of the overall government debt portfolio increased to 4.27 years in 2019 from 4.01 years in 2018 mainly due to issuance of longer term foreign currency debt maturities including International
TABLE 19RISK ASSESSMENT INDICATORS (AS AT END OF YEAR)
IndicatorDomestic
Currency DebtForeign
Currency Debt Aggregate
2018 2019 (a) 2018 2019 (a) 2018 2019 (a)
Refinancing RiskAverage Time to Maturity (ATM) (yrs) 5.91 5.78 6.34 6.34 6.16 6.10
Short-term (remaining maturity less than or equal to one year) / Outstanding Debt (%) (a) (b)
21.07 21.59 3.28 4.72 13.19 13.52
Interest RiskDuration (yrs) 3.56 3.76 4.31 4.63 4.01 4.27AverageTimetoRe-fixing(ATR)(yrs) 5.91 5.78 5.27 4.94 5.54 5.30Floating Rate Debt / Outstanding Debt (%) - - 25.17 24.30 13.65 13.13Foreign Exchange RiskShareofForeignCurrencyCommercialDebt/OfficialReserves (%) - - - - 259.25 267.66
Share of Foreign Currency Debt / Total Debt (%) - - - - 54.26 54.01(a) Provisional Source: Central Bank of Sri Lanka(b) Foreign currency short term debt considers SLDBs and FCBUs.

PUBLIC DEBT MANAGEMENT IN SRI LANKA – 2019 33
Sovereign Bonds (ISBs) which increased the duration of the foreign currency debt to 4.63 years in 2019 from 4.31 years in 2018. Further, duration of domestic currency debt increased to 3.76 years in 2019 from 3.56 years in 2018.
ATR of the debt portfolio measures the average time in which debt coupons are re-fixed. Forzerocouponbondsorbondswithfixedcoupons,ATRistheresiduallifeofthebond.Forfloatingratebonds,ATRisthetimeleftuntilfixingofthenext coupon. ATR of the overall debt portfolio decreased to 5.30 years at end 2019 from 5.54 years at end 2018. Accordingly, the ATR for both foreign and domestic currency debt portfolios decreased to 4.94 years in 2019 from 5.27 years in 2018 and to 5.78 years by end 2019 from 5.91 years by end 2018, respectively. The exposure of government debt to interest rate changes has decreased during 2019 as indicated by the declineinoutstandingfloatinginterestratedebtto total outstanding debt to 13.13 per cent at end 2019 from 13.65 per cent at end 2018. This was evidenced by decline in floating rate foreigncurrency debt to total foreign currency debt which decreased to 24.30 per cent at end 2019 from 25.17 at end 2018.
6.3.3 Exchange Rate Risk: Exchange rate risk arises due to adverse fluctuations in theexchange rate, leading to rise of the the rupee value of debt servicing cost and the outstanding value of foreign currency denominated debt. The exchangerateriskissignificanttothegovernmentdebt portfolio as the foreign currency funding requirement remains high. Government revenue is mainly sourced through domestic currency sources which is also used to repay foreign currency debt service payments. This would intensify the gravity of exchange rate risk to the
government debt portfolio. CBSL continued to use the ratio of foreign currency debt to total debt, to assess the degree of susceptibility of the debt portfolio to exchange rate risk. The share of foreign currency denominated debt in the total debt decreased to 54.01 per cent at end 2019 from 54.26 per cent at end 2018. The share offoreigncurrencycommercialdebttoofficialreserves has increased to 267.66 per cent at end 2019 from 259.25 per cent at end 2018. This could be mainly attributed to comparatively higher increase in outstanding foreign currency commercial debt from US dollars 17,937.7 million in 2018 to US dollars 20,454.8 million in 2019 compared to increase in the officialreserves from US dollars 6,919 million in 2018 to US dollars 7,642 million in 2019.
6.3.4 Liquidity Risk: In view of enhanced liquidity risk of the government securities market, PDD implemented prudent strategies during 2019. The Treasury bond and Treasury bill primary issuance calendar for a period of six months, i.e. for the second half of 2019, was published. However, publishing the six months calendar could not be accommodated for 2020 due to the constraints of borrowing approvals and the General Treasury’s inability to estimate and forecast the future borrowing requirement due to uncertainties arising from COVID–19 pandemic and non availability of a comprehensive government budget for the fiscal year until end third quarter 2020. Theauction calendar improves market transparency, predictability, and preparedness of market participants and holds the issuer responsible to follow the announced issuance calendar.
Despite the challenges in raising funds from the international capital markets, the government

PUBLIC DEBT MANAGEMENT IN SRI LANKA – 201934
was able to issue ISBs twice amounting to US dollars 4.4 billion with a substantial over subscription in 2019 that helped building up of foreign currency reserves towards meeting foreign currency debt service obligations in early 2020.
6.3.5 Operational Risk: Operational risk is institution specific and endogenous toan institution, which cannot be measured in advance similar to other risk categories viz. rollover, interest rate, exchange rate and liquidity risks.
The operational risks of public debt management were addressed fairly in 2019 expecting such actions would improve further mitigation of operational risks. These operational risk management procedures included various stringent internal controls and those in line with the international best practices and risk management principles. The segregation of duties and responsibilities among the divisions of PDD were maintained at highest levels with theFrontOffice(FO)involvinginissuanceofdebt,theMiddleoffice(MO)inriskmanagementofdebtand theBackOffice(BO)engaging insettling debt obligations on time.
As per the continuous practice of updating the departmental operational manual of PDD, the latest update was made in 2019 with the approval of the Monetary Board , in line with the latest international best practices of portfolio risk management. The divisions of the PDD are also physically segregated with restricted access and additionally a voice recording system has been installed in the FO of PDD in order to improve the operational risk parameters.
Availability of fully automated Scripless
Securities Settlement System (SSSS) and Real time Gross Settlement System (RTGS)to facilitate Delivery versus Payment (DVP) are in operation to minimise the settlement risk associated with the government debt portfolio, while ensuring safety on transactions. A comprehensive Business Continuity Plan (BCP) isinplacewithafully-fledgedDisasterRecoverySite (DRS) to support crucial public debt management activities in case of an emergency. The BCP and DRS operations that were made mandatory for all Dealer Direct Participants (DDP) were periodically tested during 2019. A real-time notification system (byway of anSMS and/or email) was introduced in March 2019 to notify investors of every movement of government securities in the LankaSecure System to improve the investor protection and awareness.
Further, the new primary issuance system which was introduced for Treasury bonds with effect from 27th July 2017, was reviewed and the approval of the top management was granted to continue the new system with further market oriented improvements. A second review was conducted on the new issuance system for Treasury bonds introduced in 2017 and improvements were made to the existing system to enhance the market oriented features of the system, with effect from 9th July 2019.
6.4 Sustainability of External Debt
The capability to raise debt efficiently forthe purpose of issuance and service its debt liability as they fall due without restructuring, defaulting or compromising its long-term goals and objectives at the lowest possible cost while maintaining a prudent level of risk, is generally

PUBLIC DEBT MANAGEMENT IN SRI LANKA – 2019 35
defined as debt sustainability of a borrower.Maintenance of the external debt sustainability is instrumental for a country to safeguard the international investor relationships and to maintain a favourable ratings outlook.
Sustainability of external debt can be determined using various indicators, where there is no unanimity in adopting a sole indicator as each has its own strengths and weaknesses. These indicators can be thought of as measures of a country’s “solvency” in that they consider the stock of debt at certain time in relation to the its ability to generate resources to repay the outstanding balance. The sustainability of external debt is measured using five setsof indicators namely; (i) liquidity monitoring indicators, (ii) debt burden indicators, (iii) debt structure indicators, (iv) Net Present Value (NPV), and (v) debt dynamic indicators. The external debt indicators discussed in this review are mainly constructed as a proportion of receipts from exports of goods and non-factor services including workers’ remittances and compensation of employees (XGS), which are absorbed for servicing of external debt. Further, XGS indicates a country’s capability of acquiring foreign exchange.
6.4.1 Liquidity Monitoring Indicators
Liquidity monitoring indicators illustrate the capacity of a country to settle its external liabilities. These ratios measure the outflowof foreign currency for external debt service payments compared to non-debt creating foreign currency inflows, i.e., XGS excluding foreigndirect investments. Four main indicators, namely; (i) interest service ratio, (ii) medium and long-term debt service ratio, (iii) total debt
service ratio, and (iv) short-term debt ratio have been used for the analysis.
The interest ratio (INT/XGS) (%) measures the cost of external debt as a percentage of XGS, where INT represents interest payments relating to the external debt. The value of the ratio increased to 5.32 per cent in 2019 from 4.80 per cent in 2018 due to the increase in external interest payments and decline in XGS during 2019 compared to 2018. The medium and long-term debt service ratio (MLDS/XGS) (%) measures both principal and interest payments for external debt (excluding repayments for non-residents’ holdings of Treasury bills) as a percentage of XGS whereas the total debt service to XGS ratio (TDS/XGS) (%) measures both principal and interest payments for external debt (including interest payments for non-resident holdings of Treasury bills) as a percentage of XGS. The medium and long-term debt service ratio increased to 17.59 per cent in 2019 from 11.88 per cent in 2018 and the total debt service ratio (TDS/XGS) (%) also increased to 17.62 per cent in 2019 from 11.90 per cent in 2018. The short-term debt ratio (Short-term Debt/XGS) (%) increased to 0.51 per cent in 2019 from 0.27 per cent in 2018 which measures the outstanding face value of Treasury bills of non-residents compared to XGS.
6.4.2 Debt Burden Indicators
The debt burden and the debt distress imposed on an economy by external debt is measured through debt burden indicators. For this purpose,thefirstindicatorusedisacomparisonof Disbursed Outstanding External Debt (DOD) with XGS which measures the external debt level as a proportion of exports of goods and

PUBLIC DEBT MANAGEMENT IN SRI LANKA – 201936
services. The DOD/XGS shows the debt burden level over exports or the capability of acquiring foreign exchange. Further, the ratio of DOD/GNP measures the foreign debt level to the Country’s Gross National Product (GNP) while DOD/XGS shows the debt burden level over repayment capacity earned from exports.
The ratio of DOD/GNP increased to 43.90 per cent at end 2019 compared to 42.39 per cent at the end 2018 indicating a higher growth rate of DOD compared to GNP. The ratio of DOD/ XGS also increased to 137.01 per cent at end 2019 compared to 134.51 per cent at end 2018 indicating a higher growth rate of DOD relative to XGS.
6.4.3 Debt Structure Indicators
External debt portfolio has a greater impact on the level of risk exposure of a country and this risk exposure is measured by rollover ratio, which indicates the principal payments over disbursements of debt. The rollover ratio reflectstheabilityofacountrytomeetitsdebtservice obligations via external disbursements. In 2019, the rollover ratio increased to 53.31 per cent compared to 40.26 per cent in 2018 due to rise in foreign principal payments compared to foreign loan disbursements.
The short-term debt to total DOD ratio is another debt structure indicator which is the ratio of non-resident holdings of Treasury bills and the total external outstanding debt. This indicator, increased from 0.20 per cent at end 2018 to 0.37 per cent at end 2019 due to higher rate of increase of outstanding Treasury bills held by non-residents compared to the rate of increase in total external outstanding debt.
6.4.4 Net Present Value Indicators
Two types of NPV indicators are used to measure sustainability of the external debt. The first is the ratioofNPVof futuredebtserviceobligations to GNP which compares future debt service payments in present value terms, given a general level of current economic activities. The other ratio is the ratio of NPV of future debt service to XGS. The objective of using this ratio is to compare future debt service payments to country’s capability of acquiring foreign exchange. Both the NPV of debt service to GNP and the NPV of debt service to XGS ratios increased at end 2019 compared to 2018. The NPV of debt service to GNP ratio stood at 0.35 per cent at end 2019 compared to 0.33 at end 2018. The NPV of debt service to XGS ratio recorded at 1.10 per cent at end 2019 in comparison to 1.05 per cent at end 2018.
6.4.5 Debt Dynamic Indicators
Debt dynamic indicators separately compare the growth in cost of borrowings with the growth in export earnings and also with the growth in the overall economy as measured by the GNP. The average interest rate of the external debt portfolio to the rate of XGS growth recorded a negative growth of 0.95 per cent in 2019 compared to the 1.14 positive growth recorded in 2018. This is due to the negative growth rate of XGS in 2019. However, the average interest rate of the external debt portfolio declined to 4.0 per cent in 2019 compared to 4.5 per cent in 2018. The average interest rate of the external debt portfolio to the growth rate of GNP increased to 0.92 per cent in 2019 from 0.59 percent in 2018 due to relatively lower GNP growth rate in 2019 compared to 2018.

PUBLIC DEBT MANAGEMENT IN SRI LANKA – 2019 37
6.4.6 Overall Sustainability of Debt
The overall debt sustainability can be evaluated under two indicators, namely; (i) total outstanding debt to GDP ratio, and (ii) foreign debt service payments as a share of officialreserves.
The total outstanding debt to GDP ratio measures the ability of a country to pay off its total outstanding debt with the country’s total production of goods and services as measured by the GDP. This ratio increased to 86.8 per cent at end 2019 compared to 83.7 per cent at
TABLE 20 EXTERNAL DEBT SUSTAINABILITY INDICATORS (AS AT END OF YEAR) (a)
Description 2016 2017 2018 2019 (b)
Liquidity Monitoring Indicators (c)Interest Service Ratio (INT/XGS) (%) 3.52 4.12 4.80 5.32
Medium and Long-term Debt Service Ratio (MLDS/XGS) (%)
8.22 9.70 11.88 17.59
Total Debt Service Ratio (TDS/XGS) (%) 8.23 9.72 11.90 17.62
Short-term Debt Ratio (Short-term Debt/XGS) (%) 0.36 0.69 0.27 0.51
Debt Burden IndicatorsDOD/GNP (%) 35.16 36.48 42.39 43.90
DOD/XGS (%) 112.49 117.75 134.51 137.01
Debt Structure IndicatorsRollover Ratio (Principal Payments/ Disbursements) (c) (%)
23.71 25.93 40.26 53.31
Short-term Debt / Total DOD (%) 0.32 0.58 0.20 0.37
NPV Indicators (d)NPV of Debt Service/GNP 0.24 0.28 0.33 0.35
NPV of Debt Service/XGS 0.79 0.91 1.05 1.10
Dynamic Indicators (c)Avg. Rate of Interest/Rate of Growth of Export 0.26 0.54 1.14 (0.95)
Avg. Rate of Interest/Rate of Growth of GNP 0.38 0.30 0.59 0.92 (a) Based on central government debt Source: Central Bank of Sri Lanka(b) Provisional(c) Including Treasury bill and Treasury bond payments to non-residentsNote: Premature unloading of foreign investments in Treasury bonds tearted as repayments to the external sector that resulted to deteriorate several sustainability indicators such as Medium & Long term Debt Service Ratio, Total Debt Service Ratio, Rollover Ratio etc(d) NPV calculation is based on UN-ESCAP definitions and methodologyNote: DOD: total disbursed external debt outstanding
GNP: gross national productXGS: exports of goods and non factor services including workers’ remittances and compensation of employeesTDS: total external debt service paymentsINT: external interest paymentsMLDS: external medium and long-term debt service paymentsNPV: present value of the stream of future debt payments on foreign debt, discounted at CIRR.

PUBLIC DEBT MANAGEMENT IN SRI LANKA – 201938
end 2018. The decline in debt to GDP ratio was mainly due to decline in the economic activities in 2019 as a result of the Easter Sunday attack. The debt to GDP ratio is expected to be further deteriorated in 2020 due to the negative impact of COVID-19 pandemic on economic activities. The share of foreign debt service payments compared toofficial reserves alsodeteriorated
TABLE 21OVERALL DEBT SUSTAINABILITY
Per cent
Indicator 2017 2018 2019 (a)Overall Debt SustainabilityDebt/GDP 77.9 83.7 86.8
Share of Foreign Debt Service Payments /Official Reserves (b) 32.02 41.69 59.32
(a) Provisional Source: Central Bank of Sri Lanka(b) Official reserves at end of the previous year
to 59.32 in 2019 from 41.69 per cent in 2018 which indicates the capability of the country to meet external debt maturities falling due with theofficialreserveshasdeteriorated.Thiswasdue to the rate of increase in the debt maturities beinghigherthantheincreaseinofficialreservesin 2019.

PUBLIC DEBT MANAGEMENT IN SRI LANKA – 2019 39
Special Appendix
Major Developments in the Government Securities Market in Sri Lanka1923 - Enactment of the Local Treasury Bills Ordinance (LTBO) enabling the Government to borrow
through the issue of Treasury bills
1937 - Enactment of the Registered Stock and Securities Ordinance (RSSO) enabling the Government to borrow through the issue of medium and long-term government securities
1941 - Commencement of Treasury bill issues under parliamentary approval
1949 - Enactment of the Monetary Law Act (MLA) entrusting the Central Bank of Ceylon to act as the agent of the government in managing public debt
1957 - Enactment of the Foreign Loans Act
- EnactmentoftheTaxReserveCertificatesAct
1981 - Commencement of the issuance of six months (182 days) Treasury bills. Prior to 1981, only three months (91 days) Treasury bills were issued.
- Introduction of secondary market operations for Treasury bills
1982 - Enactment of the Loans (Special Provisions) Act
1986 - Commencement of weekly issues of Treasury bills. Fortnightly issues of Treasury bills on the 1st and the 15th of each month had taken place before 1986.
- IntroductionofTapsystemthroughtheregionalofficesoftheCentralBankofSriLanka(CBSL).
1989 - Issuance of Treasury bills with multiple maturities of 91-days, 182-days and 364-days
- IntroductionoftheTreasuryCertificatesofDepositAct
- Tap system extended through authorized agents
1992 - Introduction of accredited Primary Dealer (PD) system. Eleven PDs consisting of eight Licensed Commercial Banks (LCBs) and three non-bank dealers were appointed.
1993 - Introduction of repurchase agreements on Treasury bills
1994 -ReformingthePDsystem.EighteenPDsconsistingofthirteenLCBsandfivenon-bankdealerswere appointed.
1995 - Phasing out of non- competitive bidding by public sector institutional investors
- Introduction of reverse repurchase transactions on Treasury bills
- Fixing and prior announcement of Treasury bills to be issued under each maturity
- Amendment of LTBO and RSSO to facilitate the issue of scripless Treasury bills and Treasury bonds and maintenance of the Central Depository System (CDS)
1997 - Commencement of the issuance of Treasury bonds
- Formation of the Association of Primary Dealers in June 1997

PUBLIC DEBT MANAGEMENT IN SRI LANKA – 201940
1998 - Introduction of an electronic bidding facility
2000 - Introduction of the dedicated PD system, where only the dedicated companies were appointed as PDs
2001 - Issuance of Sri Lanka Development Bonds (SLDBs)
2002 - Expansion of PD system to LCBs
2003 - Enactment of the Fiscal Management (Responsibility) Act
- Introduction of a Code of Conduct for PDs
- CBSL moved from a system of ‘passive’ Open Market Operations (OMO) to an ‘active’ OMO system in order to enhance the effectiveness and market orientation of monetary policy operations.
- Introduction of a screen based trading platform for government bonds
2004 - Conversion of Treasury bills and Treasury bonds issued in scrip form into scripless form pursuant to the Regulations issued under LTBO and RSSO in 2004
- Introduction of Scripless Securities Settlement System (SSSS) (on Delivery Versus Payment (DVP) basis) and the CDS for government securities
- Issue of government securities in scripless form
2005 -Issuanceoffirstindex-linkedTreasurybonds
-IssueofthefirstSovereigncreditratingofSriLankabyStandardandPoor’s(S&P)andFitchRatings (Fitch).
2006 - Introduction of the Risk Weighted Capital Adequacy framework for PDs
- Opening up the Treasury bond market to foreign investors with an aggregate ceiling of 5 per cent of the outstanding bonds
- Issue of Sri Lanka Nation Building Bonds (SLNBB)
- Suspension of the participation of PDs in the CBSL’s OMOs
2007 - Opening of retail outlets to sell government securities
- Lifting the suspension of PDs’ participation in the CBSL’s OMOs
- Enhancement of the aggregate ceiling of 5 per cent to 10 per cent in respect of investment in Treasury bonds by foreign investors
- Issuance of the first International Sovereign Bond (ISB) of US dollars 500 million in theinternational capital market
2008 - Authorizing LCBs to invest in the ISB issued by the Government of Sri Lanka (GOSL), in the secondary market
- Opening up of the Treasury bill market to foreign investors with the aggregate ceiling of 10 per cent of the outstanding bills
- Introduction of the PC based payment and securities settlement system as part of the Business Continuity Plan (BCP) of the LankaSettle System
2009 - Issuance of the second ISB of US dollars 500 million
- Opening up of the Treasury bill and Treasury bond market to the Sri Lankan Diaspora and Migrant workforce

PUBLIC DEBT MANAGEMENT IN SRI LANKA – 2019 41
- Providing concessions in obtaining Dual Citizenship status by ex-Sri Lankans (holding foreign citizenship) who invest in Sri Lanka Government Treasury bonds subject to certain conditions
- Extending the yield curve on Government securities up to 10 years
- Increasing the maximum number of days accepted by the LankaSecure system for future value dated transactions from 31 calendar days to 364 calendar days
- Upgrading of the Sovereign credit rating outlook by S&P and Fitch
- Setting up of the Domestic Debt Management Committee (DDMC) by the Monetary Board on 05 November 2009
2010 - Introduction of participant managed Intraday Liquidity Facility to the LankaSettle and LankaSecure Systems
- Introduction of an Analytical Tool to develop a Medium-term Public Debt Management Strategy
- Conducting aworkshop for the dealers and treasury officials of PDs on the development ofdomestic and international economy
- Issuance of the third ISB of US dollars 1,000 million with 10 year maturity
-IssueoffirstSovereigncreditratingofSriLankabyMoody’sInvestorsService(Moody’s)andupgrading of the Sovereign credit rating of Sri Lanka by Fitch and S&P
2011 - Issuance of the fourth ISB of US dollars 1,000 million with 10 year maturity
- Upgrading the Sovereign credit ratings of Sri Lanka by Fitch, S&P and Moody’s
- Appointment of three new participants to LankaSecure including one PD and two LCBs namely, WealthTrust Securities Limited, Amana Bank Limited and Axis Bank Limited
- Limiting on foreign investments in Government securities was increased from 10 per cent to 12.5 per cent of the total outstanding stock of Treasury bills and Treasury bonds
2012 -IssuanceofthefifthISBofUSdollars1,000millionwith10yearmaturity
- Upgrading of LankaSettle and LankaSecure (new version 3.6) with many new features to make theday-to-daybusinessoperationsmoreefficientandeffective
- Standardization of investor information registration in the CDS in LankaSecure
- Implementation of an Electronic Trading (E-Treading) platform to promote the secondary market for Government securities
- Issuance of 20 year Treasury bonds
- FitchaffirmedSriLanka’sForeign-andLocal-CurrencyIssuerDefaultRating(IDRs)atBB-with a “Stable” outlook in May 2012.
-Moody’saffirmedSriLanka’sratingofB1witha“Positive”outlookinNovember2012.
-S&P’saffirmedSriLanka’sratingofB+with“Stable”outlookinDecember2012.
2013 - Issuance of 30 years Treasury bonds
- Half-yearly T- bond Primary Auction Calendar was published.
- Conducted investor awareness programmes and investor meetings in Europe, East Asia including mainland China, and Middle East and in the USA.
-StreamlinedinvestorrecordsinCDSbyhavinguniqueidentificationnumbersforeachparticipant
PUBLIC DEBT MANAGEMENT IN SRI LANKA – 201942
- Commenced a Survey to identify investors who wish to receive the periodic statements in the electronic form instead of printed statements sent through mail
- Measures have been initiated to put in place an E-Trading Platform and a Central Counterparty arrangementbyend2015for tradingandsettlementofdomesticfinancialmarket transactionsincluding the transactions in Government securities.
- Introduction of a new computer information system for foreign debt service payments to increase theefficiencyoftheforeigndebtservicepaymentprocess
- Simplification of Guidelines relating to investments in Government Securities by ForeignInvestors, Sri Lankan Diaspora and Migrant Workforce under Securities Investment Account (SIA) in April 2013
-IssuedtheDirectiononAssessmentofFitnessandProprietyofDirectorsandOfficersPerformingExecutive Functions of Primary Dealer Companies in May 2013
- PDs were permitted to act as market makers in corporate bonds or debentures and permitted to invest up to a limit of 5 per cent of total investments in quoted shares, quoted debentures or bonds and quoted commercial papers in July 2013.
- Pan Asia Banking Corporation PLC was appointed as a PD in terms of the RSSO and the LTBO in August 2013.
- Issued the Direction on Funds remaining unclaimed in the Customer Accounts maintained by the Dealer Direct Participants in September 2013.
- The Hong Kong & Shanghai Banking Corporation Ltd. and Perpetual Treasuries Ltd. were appointed as PDs in terms of the RSSO and the LTBO in September 2013.
- Customer Charter for PDs in Government securities was introduced in November 2013.
- PDs were permitted to engage in covered Short Selling of Treasury bills and Treasury bonds up totheamountofsuccessfulbidsacceptedandconfirmedatprimaryauctionsinDecember2013.
2014 - Issued US dollars 1,000 million 5 year ISB at a yield rate of 6.00 per cent.
- The SLDB issuance was authorized up to a limit of US dollars 750 million for 2014.
- Issued US dollars 500 million 5-year ISB at a yield rate of 5.125 per cent.
- Union Bank of Colombo PLC was appointed as a Primary Dealer in terms of the RSSO and LTBO.
2015 - The SLDB issuance was authorized up to a limit of US dollars 1,500 million for 2015.
- InadditiontoissuanceofSLDBsatfloatingrate,issuanceofSLDBsatfixedratesindifferentmaturities was approved.
- A ten year ISB was issued for US dollars 650 million at 6.125 per cent per annum.
- SLDBs issuance limit was increased from US dollars 1,500 million to US dollars 2,500 million.
- Multi-currency functionality in Lankasettle system was enabled to facilitate the Scripless trading and recording of legal ownership of SLDBs, denominated in US dollar, with the objective to promote the secondary market for SLDBs.
- Under the provision of the LTBO, the Parliament granted approval for an increase in authorized limit of Treasury bills from Rs. 850 billion to Rs.1, 250 billion.

PUBLIC DEBT MANAGEMENT IN SRI LANKA – 2019 43
- The Direction on minimum core capital requirement was revised, increasing the minimum unimpaired core capital to be maintained by the primary dealer companies from Rs. 300 million to Rs. 1,000 million.
- The direction on Capital Adequacy Ratio was revised, increasing the minimum Risk Weighted Capital Adequacy Ratio to be maintained by the primary dealer companies from 8 per cent to 10 per cent.
- A 10-year ISB was issued for US dollars 1,500 million at 6.850 per cent per annum.
- The threshold of investment in Treasury bills and Treasury bonds by foreigners reduced from 12.5 per cent to 10 per cent of the total outstanding stock of Treasury bills and Treasury bonds.
2016 - The SLDB issuance was authorized up to a limit of US dollars 2,500 million for 2016.
- Change the minimum investment amount in SLDBs from US dollars 100,000 to US dollars 10,000.
- Five year and ten-year ISB were issued for US dollars 500 million and US dollars 1,000 million at 5.75 per cent and 6.825 per cent per annum, respectively.
- A Circular was issued on “Recording of Ownership of Government Securities in the LankaSecure Central Depository System” to all Participants of LankaSettle System to ensure compliance with LankaSettle System Rules (Version 2.1)
- The regulatory and supervisory functions of the Central Bank in relation to primary dealers and other participants have been assigned to the Director, Department of Supervision of Non-Bank Financial Institutions.
- All primary dealers were directed to use the Bloomberg trading platform (FIQ) designed for Sri Lanka to conduct all inter-primary dealer outright trades and report yield rates and volumes of all outright trades carried out over-the-counter in excess of Rs. 50 million with non-primary dealer investors within 30 minutes of each trade.
- The above Circular was extended to all Licensed Commercial Banks and Licensed Specialized Banks to conduct all outright trades with other banks and primary dealers and report yield rates and volumes of all outright trades carried out over-the-counter in excess of Rs.50 million, within 30 minutes of each such trade
2017 - The SLDB issuance was authorized up to a limit of US dollars 1,500 million for 2017.
- A Circular was issued to all Licensed Commercial Banks, Licensed Specialized Banks and Primary Dealers to use the Bloomberg trading platform (Fixed Income Quote - FIQ) to:
Quote repurchase rates, tenures and volumes
Report rates, tenures and volumes of all repurchase transactions carried out over-the-counter within 30 minutes of each such trade of Rs. 100 million or above and
Report all inter participant transactions.
- The SLDB issuance limit was re-authorized up to a limit of US dollars 3,000 million for 2017.
- A ten year ISB was issued for US dollars 1,500 million with a coupon of 6.20 per cent per annum.
Introduction of a New Primary Issuance System for Treasury bonds.
2018 - The SLDB issuance was authorized up to a limit of US dollars 3,000 million for 2018.

PUBLIC DEBT MANAGEMENT IN SRI LANKA – 201944
- Issuance of ISBs was upsized up to a limit of US dollars 2,500 million for 2018.
- The Active Liability Management Act (ALMA), No. 8 of 2018 was passed by the Parliament.
2019 - The SLDB issuance was authorized up to a limit of US dollars 1,500 million for 2019.
Threshold of foreign investments in Treasury bills and Treasury bonds reduced from 10 per cent to 5 per cent out of the total outstanding stock of Treasury bills and Treasury bonds.
- Real-timenotificationfacilityforthecustomersofLankaSecurewaslaunchedtosendSMSor/ande-mailnotificationforeachandeverydebitandcreditrecordofscriplesssecuritiescarriedout in each Securities Account in the LankaSecure System.
- The Medium-Term Debt Management Strategy (MTDS) for the period 2019 - 2023 was formulated and published in the Central Bank website.
- Resolution to raise up to Rs. 480 billion as per the Active Liability Management Act (ALMA), No. 8 of 2018 was approved by the Parliament.
- Review of the new Treasury bond Issuance System to enhance the minimum acceptance level to initiate phase III of the issuance system and to recognize the phase II subscription in computing of the minimum successful participation by Primary Dealers.
- Settlement value, price and interest rate of each and every Securities transaction will be captured in the LankaSecure System, with effect from 01 January 2020. Participants of the LankaSettle system were informed of the development and requested to comply, through the Circular issued on 01 October 2019.
- Five year ISBs for US dollars 1,500 million, a ten year ISB for US dollars 1,400 million and a long-ten year ISB of US dollars 1,500 million were issued in 2019.
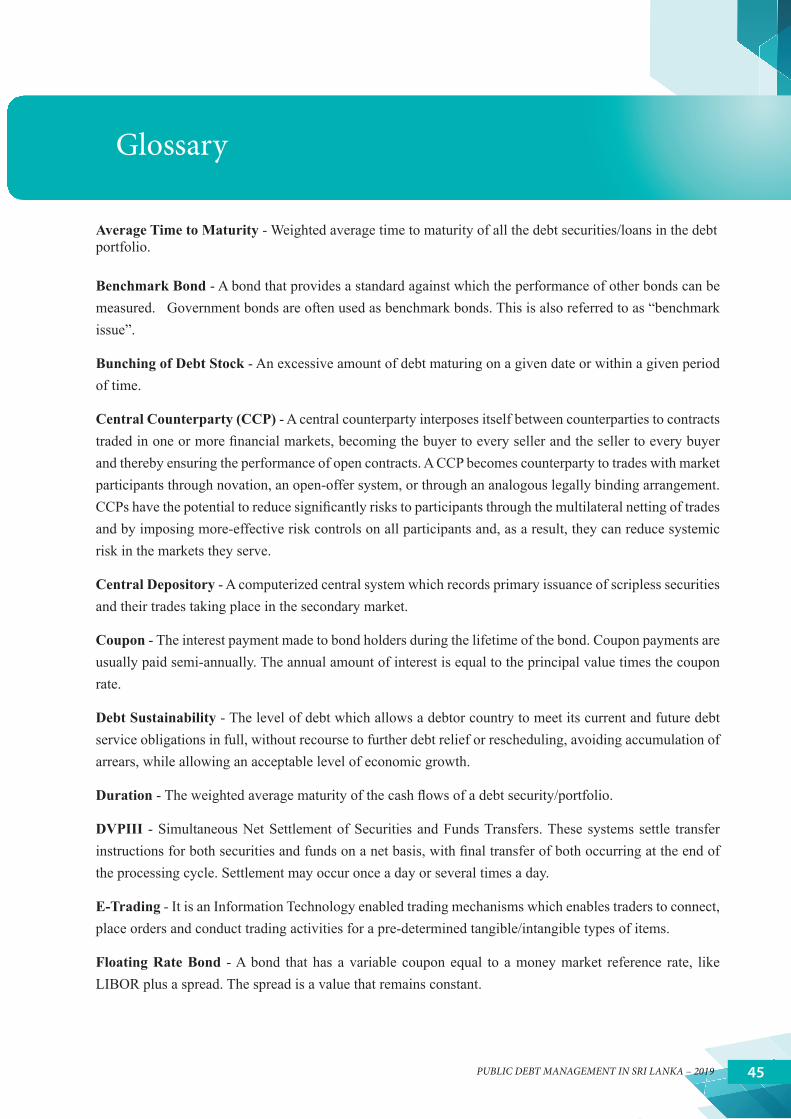
PUBLIC DEBT MANAGEMENT IN SRI LANKA – 2019 45
Glossary
Average Time to Maturity - Weighted average time to maturity of all the debt securities/loans in the debt portfolio.
Benchmark Bond - A bond that provides a standard against which the performance of other bonds can be measured. Government bonds are often used as benchmark bonds. This is also referred to as “benchmark issue”.
Bunching of Debt Stock - An excessive amount of debt maturing on a given date or within a given period of time.
Central Counterparty (CCP) - A central counterparty interposes itself between counterparties to contracts tradedinoneormorefinancialmarkets,becomingthebuyertoeverysellerandthesellertoeverybuyerand thereby ensuring the performance of open contracts. A CCP becomes counterparty to trades with market participants through novation, an open-offer system, or through an analogous legally binding arrangement. CCPshavethepotentialtoreducesignificantlyriskstoparticipantsthroughthemultilateralnettingoftradesand by imposing more-effective risk controls on all participants and, as a result, they can reduce systemic risk in the markets they serve.
Central Depository - A computerized central system which records primary issuance of scripless securities and their trades taking place in the secondary market.
Coupon - The interest payment made to bond holders during the lifetime of the bond. Coupon payments are usually paid semi-annually. The annual amount of interest is equal to the principal value times the coupon rate.
Debt Sustainability - The level of debt which allows a debtor country to meet its current and future debt service obligations in full, without recourse to further debt relief or rescheduling, avoiding accumulation of arrears, while allowing an acceptable level of economic growth.
Duration-Theweightedaveragematurityofthecashflowsofadebtsecurity/portfolio.
DVPIII - Simultaneous Net Settlement of Securities and Funds Transfers. These systems settle transfer instructionsforbothsecuritiesandfundsonanetbasis,withfinaltransferofbothoccurringattheendofthe processing cycle. Settlement may occur once a day or several times a day.
E-Trading - It is an Information Technology enabled trading mechanisms which enables traders to connect, place orders and conduct trading activities for a pre-determined tangible/intangible types of items.
Floating Rate Bond - A bond that has a variable coupon equal to a money market reference rate, like LIBOR plus a spread. The spread is a value that remains constant.

PUBLIC DEBT MANAGEMENT IN SRI LANKA – 201946
FinNet - FinancialInformationNetwork(FinNet)isacommoninterfacetosubmitfinancialinformationbybanks,financecompanies,leasingcompaniesandprimarydealers.
Grace Period - Period of time provided for in a loan agreement for commencement of repayment of the loan.
Grant Element - A measure of concessionally of a loan, calculated as the difference between the face value of the loan and the sum of discounted future debt service payments to be made by the borrower expressed as a percentage of the face value of the loan.
Index Linked Bond - A bond, which pays a coupon that, varies according to some underlying Index usually the Consumer Price Index.
Intra-day liquidity - Funds, which can be accessed during a business day and settled on the same day, usuallytoenablefinancialinstitutionstomakepaymentsonrealtime.
LIBOR - The London Inter Bank Offered Rate. This rate is used as a reference rate by the international bankingmarketsandiscommonlythebasisonwhichlending/borrowingmarginsarefixed.
Maturity - Refers to the date on which the issuer has promised to redeem the issue by paying the principal value. The number of days or years until the date of redemption is called the maturity period.
Novation - Replacement of a contract between the original counterparties with two new contracts; one between the buyer’s clearing agent and the CCP, and another between the CCP and the seller’s clearing agent.
Open Market Operations - The process of which the Central Bank buys or sells securities in the open market to control the volume of money (liquidity) or price of money (interest rates).
Outright Transactions - Transactions by which ownership (title) of the securities are transferred permanently to the buyer.
Parity Variance - Effect of the appreciation/ depreciation of foreign currencies against the local currency on the existing foreign currency debt portfolio stated in the local currency
Primary Dealer - An intermediary appointed by the CBSL to deal in government securities.
Primary Market-Marketwheresecuritiesarefirstissuedtobuyers.
Repayment Period - The period during which the debt obligation is to be repaid.
Repurchase Transaction - A transaction involving a sale of securities with an agreement to reverse the transaction on a future date.
Risk Weighted Capital Adequacy Ratio - The ratio computed by dividing available capital by the risk weighted assets.
Running Cost Ratio - The interest paid as a proportion of the outstanding debt stock at the beginning of the year.

PUBLIC DEBT MANAGEMENT IN SRI LANKA – 2019 47
Rupee Loan - A medium to long-term debt instrument issued with maturities more than two years on tap basis or as private placements by the CBSL on behalf of the government under the Registered Stock and Securities Ordinance. Interest rates of this instrument are determined administratively.
Scripless Securities - Treasury bills and Treasury bonds issued in book entry form or as paperless securities.
Secondary Market - The market where securities are traded and exchanged among buyers and sellers after the securities are issued at the primary market.
Short Selling - The sale of an asset (a security/ stock, commodity futures contract, corporate or sovereign bond) that is not owned by the seller at the time of sale. Short selling are of two kinds, namely “Naked Short Selling and “Covered Short Selling” and “Naked Short Selling”.
Special Drawing Rights - The unit of account of the IMF of which the value is based on a basket of key international currencies.
Sovereign Bond - A debt security issued by a sovereign government denominated in domestic or a foreign currency. The foreign currency most likely is a hard currency.
Sovereign Credit Rating - Sovereign Credit Rating is an assessment of the credit worthiness of a country or sovereign entity. At the request of the country, a credit rating agency will evaluate the country’s economic and political environment to determine representative credit ratings.
Statutory Reserve Ratio - Percentage of deposits, which the commercial banks should keep with the centralbank,throughwhichthecentralbankcaninfluencetheircreditcreatingability.
Treasury Bill - A short-term debt instrument issued usually on a discount basis and for maturities of 91, 182, and 364 days by the CBSL on behalf of the government under the Local Treasury Bills Ordinance.
Treasury Bond - A medium to long-term debt instrument issued by the CBSL on behalf of the government under the Registered Stock and Securities Ordinance.
Yield - The coupon or discount when expressed as a percentage of the price.
Yield Curve - A graphical depiction of the relationship between the yield on the securities and different maturities.
Zero Coupon Bond - A bond that does not pay interest during the life of the bond. Instead, investors buy a zero coupon bond at a deep discount on the face value. The face value of the bond is paid at the maturity.
PUBLIC DEBT MANAGEMENT IN SRI LANKA – 201948
Statistical Appendix
Table 1 : Central Government Outstanding Debt
Table 2 : Outstanding Central Government Debt as at end year
Table 3 : Composition of Outstanding Central Government Debt as at end year
Table 4 : Ownership of Outstanding Central Government Debt as at end year
Table 5 : Details of Outstanding Treasury bonds as at end 2019
Table 6 : Details of Outstanding Sri Lanka Development Bonds as at end 2019
Table 7 : Details of Outstanding Rupee loans as at end 2019
Table 8 : Changes in Relative Composition of Government Securities
Table9: MaturityProfileofDomesticDebtasatend2019
Table 10 : Future Domestic Currency Debt Obligations as at end 2019
Table 11 : Ownership of Treasury bills
Table 12 : Ownership of Treasury bonds
Table 13 : Ownership of Rupee loans
Table 14 : Composition of Outstanding Foreign Debt as at end 2019
Table 15 : Ownership of Outstanding Foreign Debt
Table 16 : Foreign Loans - 2019
Table 17 : Foreign Loan Disbursements by Source
Table 18 : Government Debt Repayments and Interest Payments
Table 19 : Issues and Maturities of Domestic Debt in 2017, 2018 and 2019
Table 20 : Auction and Primary Issue Details in 2017, 2018 and 2019
Table 21 : Government Borrowing Limits and Usage in 2018 and 2019 – Face Value
Table22: FinancingoftheGovernmentNetCashDeficit
Table 23 : Treasury Bills Primary Auction Yield Rates and Composite Rate - 2019
Table 24 : Treasury Bond Auctions in 2019
Table 25 : Treasury Bill Auctions in 2019

PUBLIC DEBT MANAGEMENT IN SRI LANKA – 2019 49
Table 26 : Sri Lanka Development Bonds Auctions in 2019
Table 27 : Secondary Market Transactions as Reported by Primary Dealers
Table 28 : Secondary Market Transactions Recorded in the LankaSecure
Definitions and Explanatory Notes
The following general notes supplement the footnotes given below the individual tables:
1. Inanattempttobringthematerialup-to-dateprovisionalfiguresareincludedinsometables.
2. Figures insome tableshavebeen roundedoff to thenearestfinaldigit.Hence theremaybeslightdiscrepancy between the total as shown and the sum of its components.
3. Differencesascomparedwithpreviouslypublishedfiguresareduetosubsequentrevisions.
4. Values indicated within parenthesis are negative values.
5. The following symbols have been used throughout:-
n.a. = not available
- = nil
… = negligible
6. PDindustryfinancialindicatorsfor2012havebeenadjustedtorepresenttheauditedfigures.
7. PDindustryfigureshavebeenadjusted toaccommodate thechangeforexemptingLCBsfromtherequirements on RWCAFwith effect from 14.02.2013.Therefore, adjusted figures for the capitalrequirement represent only the ‘Standalone PDs’. This change has been applied for all past years as well.

PUBLIC DEBT MANAGEMENT IN SRI LANKA – 201950

PUBLIC DEBT MANAGEMENT IN SRI LANKA – 2019 51
CENTRAL GOVERNMENT OUTSTANDING DEBTTABLE 1CENTRAL GOVERNMENT OUTSTANDING DEBT
Rs. millionYear (a) Domestic debt Foreign Debt
(b,c)Total Debt As a % of GDP (d,e)
Treasury Bills (b) Rupee Loans Treasury Bonds (c,d)
Other Total (d) Domestic Foreign Total
1954 105 782 - 66 953 211 1,164 20.1 4.4 24.5 1955 60 829 - - 889 232 1,121 17.0 4.4 21.4 1956 68 882 - - 950 258 1,208 18.6 5.1 23.7 1957 65 962 - 105 1,132 278 1,410 21.8 5.3 27.1 1958 140 1,007 - 91 1,238 293 1,531 22.5 5.3 27.9 1959 320 1,102 - 138 1,560 307 1,867 24.3 4.8 29.1 1960 550 1,217 - 170 1,937 345 2,282 28.9 5.1 34.0 1961 750 1,397 - 198 2,345 407 2,752 34.1 5.9 40.0 1962 1,000 1,515 - 179 2,694 412 3,106 38.7 5.9 44.6 1963 1,125 1,684 - 222 3,031 489 3,520 41.1 6.6 47.7 1964 1,250 1,909 - 216 3,375 549 3,924 43.3 7.0 50.3 1965 1,300 2,150 - 246 3,696 739 4,435 45.7 9.1 54.9 1966 1,425 2,475 - 295 4,195 1,074 5,269 50.3 12.9 63.2 1967 1,500 2,785 - 298 4,583 1,376 5,959 50.7 15.2 65.9 1968 1,750 3,118 - 329 5,197 1,578 6,775 48.5 14.7 63.2 1969 1,750 3,409 - 354 5,513 1,800 7,313 47.1 15.4 62.5 1970 1,950 3,925 - 420 6,295 2,394 8,689 46.1 17.5 63.6 1971 2,025 4,512 - 446 6,983 2,795 9,778 49.7 19.9 69.6 1972 2,325 5,103 - 498 7,926 2,936 10,862 52.0 19.3 71.2 1973 2,250 5,812 - 522 8,584 3,705 12,289 46.6 20.1 66.8 1974 2,250 6,591 - 604 9,445 2,859 12,304 39.7 12.0 51.8 1975 2,350 7,560 - 949 10,859 3,705 14,564 40.9 13.9 54.8 1976 2,700 9,001 - 990 12,691 4,968 17,659 42.0 16.4 58.5 1977 2,500 10,391 - 1,501 14,392 10,593 24,985 39.5 29.1 68.6 1978 2,635 12,049 - 1,684 16,368 14,583 30,951 38.4 34.2 72.5 1979 3,000 14,929 - 1,705 19,634 15,840 35,474 37.5 30.2 67.7 1980 9,800 17,611 - 1,659 29,070 22,276 51,346 43.7 33.5 77.2 1981 13,920 20,025 - 1,573 35,518 29,172 64,690 41.8 34.3 76.1 1982 17,320 25,800 - 2,147 45,267 35,267 80,534 45.6 35.5 81.1 1983 17,400 31,953 - 2,416 51,769 46,688 98,457 42.6 38.4 81.0 1984 14,860 33,228 - 3,564 51,652 53,681 105,333 33.6 34.9 68.5 1985 22,280 36,570 - 3,761 62,611 67,673 130,284 38.6 41.7 80.3 1986 26,173 39,130 - 4,196 69,499 86,208 155,707 38.7 48.0 86.8 1987 29,850 44,957 - 4,190 78,997 111,812 190,809 40.2 56.8 97.0 1988 43,700 49,797 - 5,099 98,596 125,657 224,253 44.4 56.6 101.0 1989 57,246 54,217 - 6,099 117,562 156,298 273,860 46.7 62.0 108.7 1990 67,968 54,677 - 11,251 133,896 176,883 310,779 41.6 55.0 96.6 1991 72,968 66,823 - 12,328 152,119 214,579 366,698 40.9 57.6 98.5 1992 87,096 69,180 - 13,744 170,020 235,539 405,559 40.0 55.4 95.4 1993 97,196 105,707 - 10,782 213,685 270,224 483,909 42.8 54.1 96.9 1994 98,896 137,554 - 12,669 249,119 301,812 550,931 43.0 52.1 95.1 1995 113,771 157,928 - 17,711 289,410 346,286 635,696 43.3 51.9 95.2 1996 124,996 205,975 - 25,731 356,702 359,685 716,387 46.4 46.8 93.3 1997 114,996 239,475 10,000 23,269 387,740 376,331 764,071 43.6 42.3 85.8 1998 119,996 250,570 48,915 43,945 463,426 461,273 924,699 45.5 45.3 90.8 1999 124,996 262,056 104,867 51,546 543,465 507,866 1,051,331 49.1 45.9 95.1 2000 134,996 263,888 204,124 73,652 676,660 542,040 1,218,700 53.8 43.1 96.9 2001 170,995 292,813 229,174 122,983 815,965 636,741 1,452,706 58.0 45.3 103.3 2002 210,995 287,701 347,128 102,562 948,386 721,957 1,670,343 60.0 45.6 105.6 2003 219,295 248,414 487,504 69,153 1,024,366 843,882 1,868,248 56.2 46.3 102.5 2004 243,886 164,758 647,746 91,396 1,147,786 996,138 2,143,924 54.9 47.6 102.5 2005 234,174 140,563 755,966 139,416 1,270,119 956,620 2,226,739 51.8 39.0 90.8 2006 257,732 116,713 890,369 218,813 1,483,627 1,103,418 2,587,045 50.5 37.5 88.0 2007 307,012 131,509 1,023,249 257,825 1,719,595 1,326,487 3,046,082 48.1 37.1 85.1 2008 402,600 130,009 1,286,375 325,641 2,144,625 1,448,734 3,593,359 48.6 32.8 81.5 2009 441,032 112,292 1,517,909 334,119 2,405,352 1,760,467 4,165,819 49.7 36.4 86.2 2010 514,442 87,709 1,648,284 319,624 2,570,059 2,024,583 4,594,642 40.1 31.6 71.6 2011 590,885 61,961 1,823,648 331,988 2,808,482 2,329,280 5,137,762 38.9 32.3 71.2 2012 629,070 58,386 2,177,892 450,303 3,315,651 2,767,299 6,082,950 38.0 31.7 69.7 2013 700,137 55,518 2,548,323 624,810 3,928,788 2,960,424 6,889,212 41.0 30.9 71.8 2014 694,767 55,518 2,940,017 683,444 4,373,746 3,113,116 7,486,862 42.2 30.0 72.3 2015 658,240 24,088 3,401,211 971,620 5,055,159 3,544,031 8,599,190 46.2 32.4 78.5 2016 779,581 24,088 3,806,353 823,051 5,433,073 4,045,796 9,478,869 45.3 33.7 79.0
2017 (f) 697,154 24,088 3,892,408 1,050,565 5,664,215 4,718,618 10,382,832 42.5 35.4 77.9 2018 (f) 746,887 24,088 4,197,323 1,102,702 6,071,001 5,959,547 12,030,548 42.3 41.5 83.7 2019 (g) 873,943 24,088 4,606,232 1,124,841 6,629,104 6,402,439 13,031,543 44.1 42.6 86.8
(a) From 1954 to 1973, outstanding position as at end September and since then as at end December Sources: Ministry of Finance (b) Rupee denominated Treasury bills issued to foreign investors from 2008 and to the Sri Lankan diaspora and migrant workers from 2009 are excluded from domestic debt and included in foreign debt Central Bank of Sri Lanka(c) Rupee denominated Treasury bonds issued to foreign investors from 2007 and to the Sri Lankan diaspora and migrant workers from 2009 are excluded from domestic debt and included in foreign
debt(d) Includes Treasury bonds of Rs. 4,397 million issued to the Co-operative Wholesale Establishment (CWE) in November 2003 (matured on 14 November 2016), Rs. 13,125 million issued to capitalise
SriLankan Airlines in March 2013 (matured on 01 June 2018) and Rs. 78,441 million issued to the Ceylon Petroleum Corporation (CPC) in January 2012 (of which Rs. 21,778 million matured on 01 January 2017 and the current outstanding is Rs. 56,662 million)
(e ) From 2003 to 2009, based on GDP estimates by the Department of Census and Statistics (DCS) and from 2010 onwards, the data are base on rebased GDP estimates (base year 2010) of the Department of Cencus and Statistics (DCS)
(f) Domestic debt, Foreign debt and Total debt as a % of GDP for 2017 and 2018 based on the revised GDP estimates for 2017 and 2018 released on 31 March 2020 by the DCS(g) Provisional

PUBLIC DEBT MANAGEMENT IN SRI LANKA – 201952
CENTRAL GOVERNMENT OUTSTANDING DEBT TABLE 2 OUTSTANDING CENTRAL GOVERNMENT DEBT AS AT END YEAR
Rs millionItem 2015 2016 2017 2018 2019
ProvisionalTotal Domestic Debt 5,055,159 5,433,073 5,664,215 6,071,001 6,629,104By Maturity
Short-Term 913,291 968,396 1,031,181 1,134,553 1,270,374 Treasury Bills (a) (b ) 658,240 779,581 697,154 746,887 873,943 Provisional Advances from the Central Bank 151,132 83,307 199,801 198,633 236,609 Import Bills held by Commercial Banks 4 - - - 131.00 Other Liabilities to the Banking Sector net of Bank Deposits 103,345 105,508 134,227 189,034 159,691 Other (Administrative Borrowing) 570 - - - -
Medium and Long-term 4,141,868 4,464,677 4,633,033 4,936,447 5,358,731 Rupee Loans 24,088 24,088 24,088 24,088 24,088 Treasury Bonds (b) (c ) 3,401,211 3,806,353 3,892,408 4,197,323 4,606,232 Sri Lanka Development Bonds 668,458 572,199 637,886 614,219 560,226
Other 48,111 62,037 78,652 100,817 168,184
By Debt Instrument 5,055,159 5,433,073 5,664,215 6,071,001 6,629,104 Rupee Loans 24,088 24,088 24,088 24,088 24,088 Treasury Bills (a) (b) 658,240 779,581 697,154 746,887 873,943 Treasury Bonds (b) (c ) 3,401,211 3,806,353 3,892,408 4,197,323 4,606,232 Sri Lanka Development Bonds 668,458 572,199 637,886 614,219 560,226 Provisional Advances 151,132 83,307 199,801 198,633 236,609 Other 152,031 167,545 212,879 289,851 328,006
By Institution 5,055,159 5,433,073 5,664,215 6,071,001 6,629,104 Banks 2,007,961 2,198,909 2,383,663 2,351,940 2,739,583
Central Bank By Debt Instrument 256,050 414,950 209,412 244,128 310,909 Treasury Bills (a) (b) 104,754 331,389 9,908 45,797 74,744 Treasury Bonds (b) (c ) - - - - -
Other (d) 151,296 83,560 199,504 198,331 236,165
Commercial Banks By Debt Instrument 1,751,911 1,783,959 2,174,251 2,107,811 2,428,674
Rupee Loans 15,870 15,870 15,870 15,870 15,870 Treasury Bills (a) (b ) 340,664 244,139 463,198 489,199 684,680 Treasury Bonds (b) (c ) 601,538 815,950 858,574 698,378 839,456 Sri Lanka Development Bonds 668,458 572,199 637,886 614,219 560,226 Other 125,382 135,802 198,723 290,145 328,442
Non bank sectorBy Debt Instrument 3,047,199 3,234,164 3,280,552 3,719,061 3,889,521
Rupee Loans 8,218 8,218 8,218 8,218 8,218 Treasury Bills (a) (b ) 212,822 204,052 224,048 211,891 114,519 Treasury Bonds (b) (c ) 2,799,673 2,990,403 3,033,833 3,498,945 3,766,777
Other (g) 26,485 31,490 14,453 7 7 By Institution 3,047,199 3,234,164 3,280,552 3,719,061 3,889,521 National Savings Bank 428,236 426,771 447,792 494,976 593,965 Employees’ Provident Fund 1,612,461 1,778,276 1,930,141 2,147,176 2,147,176 Other 1,006,502 1,029,117 902,619 1,076,909 1,148,380
Total Foreign Debt (e ) 3,544,031 4,045,796 4,718,618 5,959,547 6,402,439 By Type 3,544,031 4,045,796 4,718,618 5,959,547 6,402,439 Project Loans 2,180,388 2,361,118 2,610,547 3,149,905 3,231,464 Non-Project Loans 1,363,642 1,684,678 2,108,070 2,809,642 3,170,975 Commodity 71,470 69,101 62,727 63,267 52,312 Other 1,292,173 1,615,577 2,045,344 2,746,375 3,118,663
By Institution 3,544,031 4,045,796 4,718,618 5,959,547 6,402,439 Concessional Loans 1,729,895 1,897,680 2,130,482 2,705,836 2,767,459 Multi-lateral 794,485 855,998 954,662 1,392,857 1,356,925 Bi-lateral 935,410 1,041,682 1,175,820 1,312,979 1,410,534 Non-Concessional Loans 507,046 538,859 560,207 268,556 311,676 Multi-lateral 199,945 220,551 243,581 58,586 112,943 Bi-lateral 307,101 318,308 316,626 209,970 198,733 Commercial Loans 1,307,090 1,609,257 2,027,928 2,985,156 3,323,304 International Sovereign Bonds 958,014 1,220,870 1,475,049 2,220,411 2,733,592 Non-resident investments in Treasury bills 5,045 12,816 27,552 11,909 23,727 Non-resident investments in Treasury bonds 298,734 247,222 295,059 146,914 80,294 Other (f) 45,296 128,350 230,268 605,921 485,692Total Outstanding Government Debt 8,599,190 9,478,869 10,382,832 12,030,548 13,031,543(a) Outstanding Treasury bills and Treasury bonds have been adjusted for secondary market transactions Sources: Ministry of Finance (b) Excludes rupee denominated Treasury bills and bonds held by foreign investors Central Bank of Sri Lanka(c) Includes Treasury bonds of Rs. 4,397 million issued to CWE in November 2003 (matured on 14 November 2016), Rs. 13,125 million issued to capitalise SriLankan Airlines in March 2013
(matured on 01 June 2018) and Rs. 78,441 million issued to CPC in January 2012 (of which Rs. 21,778 million matured on 01 January 2017 and the outstanding as at end 2019 is Rs. 56,662 million)
(d) Includes provisional advances(e ) Excludes outstanding loans of projects under state owned business enterprises(f ) Includes outstanding defence loans(g) Includes sinking fund

PUBLIC DEBT MANAGEMENT IN SRI LANKA – 2019 53
CENTRAL GOVERNMENT OUTSTANDING DEBT TABLE 3 COMPOSITION OF OUTSTANDING CENTRAL GOVERNMENT DEBT AS AT END YEAR
Rs.millionSource 2010 2011 2012 2013 2014 2015 2016 2017 2018 2019 (a)1. Foreign Debt 2,024,583 2,329,280 2,767,299 2,960,424 3,113,116 3,544,031 4,045,796 4,718,618 5,959,547 6,402,439 1.1 Project Loans (b) 1,461,729 1,640,117 1,846,772 1,938,909 1,904,599 2,180,388 2,361,118 2,610,547 3,149,905 3,231,464 1.2 Non -Project Loans 562,854 689,163 920,527 1,021,515 1,208,516 1,363,642 1,684,678 2,108,070 2,809,642 3,170,975 Commodity 54,653 53,460 56,599 61,597 69,993 71,470 69,101 62,727 63,267 52,312 Other (c) 508,201 635,703 863,928 959,918 1,138,523 1,292,173 1,615,577 2,045,344 2,746,375 3,118,6632. Domestic Debt 2,570,059 2,808,482 3,315,651 3,928,788 4,373,746 5,055,159 5,433,073 5,664,215 6,071,001 6,629,104 2.1 Rupee Loans 87,709 61,961 58,386 55,518 55,518 24,088 24,088 24,088 24,088 24,088 2.2 Treasury Bills (d) 514,442 590,885 629,070 700,137 694,767 658,240 779,581 697,154 746,887 873,943 2.3 Treasury Bonds (e ) 1,648,284 1,823,648 2,177,892 2,548,323 2,940,017 3,401,211 3,806,353 3,892,408 4,197,323 4,606,232 2.4 Sri Lanka Development Bonds 173,877 183,845 222,994 369,215 391,083 668,458 572,199 637,886 614,219 560,226 2.5 Central Bank Advances 77,879 94,743 111,292 109,167 143,898 151,132 83,307 199,801 198,633 236,609 2.6 Other (f) 67,869 53,400 116,017 146,429 148,463 152,030 167,546 212,878 289,851 328,005
Total 4,594,642 5,137,762 6,082,950 6,889,212 7,486,862 8,599,190 9,478,869 10,382,832 12,030,548 13,031,543(a) Provisional Sources: Ministry of Finance(b) Includes outstanding balance of loans contracted with multilateral and bilateral lending partners Central Bank of Sri Lanka(c) Includes rupee denominated Treasury bonds and rupee denominated Treasury bills held by foreign investors, the international sovereign bonds, outstanding defence loans and foreign currency
term financing facility(d) Excludes rupee denominated Treasury bills held by foreign investors(e) Excludes rupee denominated Treasury bonds held by foreign investors and includes Treasury bonds of Rs. 4,397 million issued to CWE in November 2003 (matured on 14 November 2016), Rs.
13,125 million issued to capitalise SriLankan Airlines in March 2013 (matured on 01 June 2018) and Rs. 78,441 million issued to CPC in January 2012 (of which Rs. 21,778 million matured on 01 January 2017 and the outstanding as at end 2019 is Rs. 56,662 million)
(f) Includes administrative borrowings arising from foreign loans channeled through government or semi - government agencies and outstanding balance of borrowing from Offshore Banking Units (OBUs)
CENTRAL GOVERNMENT OUTSTANDING DEBT TABLE 4OWNERSHIP OF OUTSTANDING CENTRAL GOVERNMENT DEBT AS AT END YEAR (a)
Rs.million
Owner 2010 2011 2012 2013 2014 2015 2016 2017 2018 2019 (b)
1. Domestic Debt (c) (d) 2,570,059 2,808,482 3,315,651 3,928,788 4,373,746 5,055,159 5,433,073 5,664,215 6,071,001 6,629,104
1.1 Banking Sector 714,280 908,572 1,148,937 1,524,832 1,756,380 2,007,961 2,198,909 2,383,663 2,351,940 2,739,583
Central Bank 78,376 263,329 265,198 112,396 267,676 256,050 414,950 209,412 244,128 310,909
Commercial Banks 635,904 645,243 883,739 1,412,436 1,488,703 1,751,911 1,783,959 2,174,251 2,107,811 2,428,674
1.2 Non Bank Sector 1,855,779 1,899,910 2,166,714 2,403,956 2,617,366 3,047,198 3,234,164 3,280,552 3,719,061 3,889,521
Market Borrowings 1,848,101 1,898,977 2,165,780 2,390,023 2,616,796 3,046,628 3,234,164 3,280,552 3,719,061 3,889,521
Savings Institutions 286,514 314,319 330,150 358,243 379,877 428,236 426,771 447,792 494,976 593,965
Insurance Funds 32,839 34,356 33,768 30,849 30,536 50,597 57,944 72,305 67,506 55,589
Provident and Pension Funds (e ) 884,279 959,303 1,204,729 1,428,534 1,474,560 1,655,336 1,826,633 1,942,739 2,243,834 2,460,663
Official Fund (f) 167,374 161,568 178,900 202,118 221,584 252,615 271,630 289,154 317,840 324,837
Private Business and Individuals (g) 477,094 429,431 418,234 370,279 510,328 659,845 651,186 528,563 594,905 454,465
Non Market Borrowings 7,678 933 933 13,933 570 570 - - - -
2. Foreign Debt (h) 2,024,583 2,329,280 2,767,299 2,960,424 3,113,116 3,544,031 4,045,796 4,718,618 5,959,547 6,402,439
Total 4,594,642 5,137,762 6,082,950 6,889,212 7,486,862 8,599,190 9,478,869 10,382,832 12,030,548 13,031,543
(a) Outstanding Treasury bills and Treasury bonds have been adjusted for secondary market transactions Sources: Ministry of Finance(b) Provisional Central Bank of Sri Lanka(c) Excludes rupee denominated Treasury bills held by foreign investors(d) Excludes rupee denominated Treasury bonds held by foreign investors and includes Treasury bonds of Rs. 4,397 million issued to CWE in November 2003
(matured on 14 November 2016), Rs. 13,125 million issued to capitalise SriLankan Airlines in March 2013 (matured on 01 June 2018) and Rs. 78,441 million issued to CPC in January 2012 (of which Rs. 21,778 million matured on 01 January 2017 and the outstanding as at end 2019 is Rs. 56,662 million)
(e) Trusts, Benevolent, Pension and Provident Funds and the Employees’ Provident Fund(f) The Central Government, Local Authorities, State Corporations, Departmental and other official funds(g) Includes the value of Treasury Certificates of Deposits, Public Debt Sinking Funds (the Investment Fund w.e.f. September,1971) and the National Housing
Sinking Fund(h) Includes rupee denominated Treasury bills and Treasury bonds held by foreign investors

PUBLIC DEBT MANAGEMENT IN SRI LANKA – 201954
DOMESTIC DEBTTABLE 5 DETAILS OF OUTSTANDING TREASURY BONDS AS AT END 2019 (a)
Rs.millionMaturity Date Issue Date Series ISIN Face Value
1-May-20 1-May-15 LKB00520E014 09.25%2020A 110,089.0 1-Jun-20 1-Jun-12 LKB00820F015 08.00%2020A 33,896.1
1-Aug-20 1-Aug-10 LKB01020H017 06.20%2020A 71,515.9 15-Dec-20 15-Dec-15 LKB00520L159 09.50%2020A 83,590.0 1-Mar-21 1-Mar-16 LKB00521C016 10.75%2021A 109,124.0 1-May-21 1-May-12 LKB00921E014 09.00%2021A 75,778.1 1-Aug-21 1-Aug-13 LKB00821H019 11.00%2021A 125,414.1
15-Oct-21 15-Oct-14 LKB00721J157 09.45%2021A 85,456.0 15-Dec-21 15-Dec-16 LKB00521L157 11.50%2021A 117,783.0
1-Jan-22 1-Jan-12 LKB01022A018 08.00%2022A 97,934.2 15-Mar-22 15-Mar-19 LKB00322C159 10.70%2022A 15,000.0
1-Jul-22 1-Jul-13 LKB00922G017 11.20%2022A 114,772.1 1-Oct-22 1-Oct-13 LKB00922J011 10.00%2022A 104,208.4
15-Mar-23 15-Mar-18 LKB00523C152 10.00%2023A 107,000.0 15-May-23 15-May-17 LKB00623E156 11.50%2023A 103,565.0
15-Jul-23 15-Jul-18 LKB00523G153 10.20%2023A 65,000.0 1-Sep-23 1-Sep-13 LKB01023I019 11.20%2023A 99,881.3 1-Sep-23 1-Sep-12 LKB01123I017 09.00%2023A 22,428.0 1-Oct-23 1-Oct-03 LKB02023J016 07.00%2023A 67,366.0
15-Dec-23 15-Dec-18 LKB00523L153 11.60%2023A 48,000.0 1-Jan-24 1-Jan-14 LKB01024A014 11.40%2024A 102,434.8
15-Mar-24 15-Mar-19 LKB00524C150 10.90%2024A 75,000.0 15-Jun-24 15-Jun-19 LKB00524F153 10.25%2024A 75,000.0 1-Aug-24 1-Aug-16 LKB00824H013 11.00%2024A 107,327.0
15-Sep-24 15-Sep-19 LKB00524I157 9.85%2024A 85,000.0 1-Dec-24 1-Dec-14 LKB01024L011 06.00%2024A 7,000.0
15-Mar-25 15-Mar-15 LKB01025C157 10.25%2025A 106,672.0 1-May-25 1-May-13 LKB01225E019 09.00%2025A 16,986.9 1-Aug-25 1-Aug-15 LKB01025H016 11.00%2025A 132,027.0
15-Oct-25 15-Oct-17 LKB00825J156 10.35%2025A 95,000.0 1-Feb-26 1-Feb-13 LKB01326B011 09.00%2026A 21,050.0 1-Mar-26 1-Mar-11 LKB01526C014 05.35%2026A 90,586.0 1-Jun-26 1-Jun-14 LKB01226F014 11.00%2026A 112,998.2
1-Aug-26 1-Aug-16 LKB01026H014 11.50%2026A 126,237.0 20-Dec-26 20-Dec-16 LKB01026L206 05.00%2026A 9,142.2 15-Jan-27 15-Jan-19 LKB00827A151 11.40%2027A 50,000.0 15-Jun-27 15-Jun-17 LKB01027F156 11.75%2027A 112,000.0 21-Jul-27 21-Jul-17 LKB01027G212 11.00%2027A 5,000.0
15-Oct-27 15-Oct-19 LKB00827J152 10.30%2027A 40,000.0 15-Dec-27 15-Dec-17 LKB01027L154 11.25%2027A 7,500.0 15-Mar-28 15-Mar-18 LKB01028C151 10.75%2028A 133,000.0 1-May-28 1-May-13 LKB01528E016 09.00%2028B 97,783.7
1-Jul-28 1-Jul-12 LKB01628G019 09.00%2028A 94,571.2 1-Sep-28 1-Sep-13 LKB01528I017 11.50%2028A 125,084.0 1-Jan-29 1-Jan-14 LKB01529A012 13.00%2029A 83,087.5
1-May-29 1-May-14 LKB01529E014 13.00%2029B 109,785.3 15-May-30 15-May-15 LKB01530E152 11.00%2030A 114,102.0 15-Mar-31 15-Mar-19 LKB01231C151 11.25%2031A 75,000.0
1-Jan-32 1-Jan-12 LKB02032A016 08.00%2032A 99,070.5 1-Oct-32 1-Oct-12 LKB02032J017 09.00%2032A 35,294.9
15-Jan-33 15-Jan-18 LKB01533A154 11.20%2033A 105,000.0 1-Jun-33 1-Jun-13 LKB02033F013 09.00%2033A 101,455.9 1-Jul-33 1-Jul-13 LKB02033G011 13.25%2033A 23,511.8
1-Nov-33 1-Nov-13 LKB02033K013 09.00%2033B 20,008.8 1-Jan-34 1-Jan-14 LKB02034A012 13.25%2034A 77,859.0
15-Sep-34 15-Sep-19 LKB01534I155 10.25%2034A 45,000.0 15-Mar-35 15-Mar-15 LKB02035C155 11.50%2035A 124,565.0 15-Aug-39 15-Aug-19 LKB02039H156 10.50%2039A 25,000.0
1-Jan-41 1-Jan-16 LKB02541A016 12.00%2041A 29,885.0 1-Jun-43 1-Jun-13 LKB03043F011 09.00%2043A 33,809.3 1-Jan-44 1-Jan-14 LKB03044A010 13.50%2044A 10,969.9 1-Jun-44 1-Jun-14 LKB03044F019 13.50%2044B 77,861.8
1-Mar-45 1-Mar-15 LKB03045C013 12.50%2045A 10,058.0 Treasury bond outstanding as end Dec 2019 4,686,525.8
Source: Central Bank of Sri Lankaa) Includes Government Treasury bonds of Rs. 56,662 million issued to CPC in January 2012 (The amount of Treasury bonds issued to CPC was Rs. 78,441 million in January 2012. But due to maturity of Treasury bonds amounting to Rs. 21,779 million in 01st January 2017, the current outstanding is Rs. 56,662 million)

PUBLIC DEBT MANAGEMENT IN SRI LANKA – 2019 55
DOMESTIC DEBTTABLE 6DETAILS OF OUTSTANDING SRI LANKA DEVELOPMENT BONDS AS AT END 2019
USD millionMaturity Date Issue Date Series ISIN Face Value
22-Jan-20 22-Jan-18 SLDB2020D LKG00220A220 93.2 17-Mar-20 17-Mar-17 SLDB2020C LKG00320C174 208.8 17-Mar-20 17-Mar-17 SLDB2020C LKH00320C173 4.0 17-Mar-20 9-May-17 SLDB2020C LKG00320C174 44.3
1-Apr-20 1-Apr-15 SLDB2020A LKG00520D011 100.0 1-Apr-20 23-Jan-17 SLDB2020A LKG00520D011 118.0
1-May-20 1-May-18 SLDB2020E LKH00220E015 7.5 1-May-20 17-Sep-18 SLDB2020E LKH00220E015 54.4 29-Jun-20 29-Jun-15 SLDB2020B LKG00520F297 37.0 29-Jun-20 19-Oct-15 SLDB2020B LKG00520F297 50.0 29-Jun-20 30-Jun-17 SLDB2020B LKG00520F297 107.7 30-Jul-20 30-Jan-19 SLDB2020F LKG00220G300 103.5 30-Jul-20 30-Jan-19 SLDB2020F LKH00220G309 24.1 22-Jan-21 22-Jan-18 SLDB2021B LKG00321A226 114.6 22-Jan-21 24-May-19 SLDB2021B LKG00321A226 12.0 22-Jan-21 24-May-19 SLDB2021B LKH00321A225 17.7 1-May-21 2-Jul-18 SLDB2021C LKH00321E011 693.9 30-Jun-21 30-Jun-17 SLDB2021A LKG00421F306 158.1 30-Jun-21 28-Mar-18 SLDB2021A LKG00421F306 20.5 30-Jul-21 30-Jan-19 SLDB2021D LKG00321G306 16.5 30-Jul-21 30-Jan-19 SLDB2021D LKH00321G305 0.6 30-Jul-21 24-May-19 SLDB2021D LKG00321G306 36.3 30-Jul-21 24-May-19 SLDB2021D LKH00321G305 28.3 22-Jan-22 22-Jan-18 SLDB2022B LKG00422A222 113.7
16-Mar-22 16-Mar-18 SLDB2022C LKG00422C160 27.0 17-Mar-22 17-Mar-17 SLDB2022A LKG00522C175 154.2 17-Mar-22 9-May-17 SLDB2022A LKG00522C175 89.8 17-Mar-22 30-Jun-17 SLDB2022A LKG00522C175 175.3 1-May-22 1-May-18 SLDB2022D LKH00422E017 20.0 1-May-22 2-Jul-18 SLDB2022D LKH00422E017 6.1 1-May-22 17-Sep-18 SLDB2022D LKH00422E017 25.5 1-May-22 30-Jan-19 SLDB2022D LKG00422E018 13.0 1-May-22 30-Jan-19 SLDB2022D LKH00422E017 0.4 1-May-22 24-May-19 SLDB2022D LKG00422E018 36.2 22-Jan-23 22-Jan-18 SLDB2023A LKG00523A227 149.2
16-Mar-23 16-Mar-18 SLDB2023B LKG00523C165 42.1 16-Mar-23 16-Mar-18 SLDB2023B LKH00523C164 0.0 16-Mar-23 28-Mar-18 SLDB2023B LKG00523C165 104.5 1-May-23 1-May-18 SLDB2023C LKH00523E012 20.0 1-May-23 30-Jan-19 SLDB2023C LKG00523E013 21.7 1-May-23 24-May-19 SLDB2023C LKG00523E013 35.0 Total 3,084.4
Source: Central Bank of Sri Lanka
DOMESTIC DEBTTABLE 7DETAILS OF OUTSTANDING RUPEE LOANS AS AT END 2019
Rs.million
Maturity Date Issue Date Series Interest Rate Face Value2/1/23 2/1/93 12%2023 12.00 24,088.0Total 1 24,088.0
Source: Central Bank of Sri Lanka
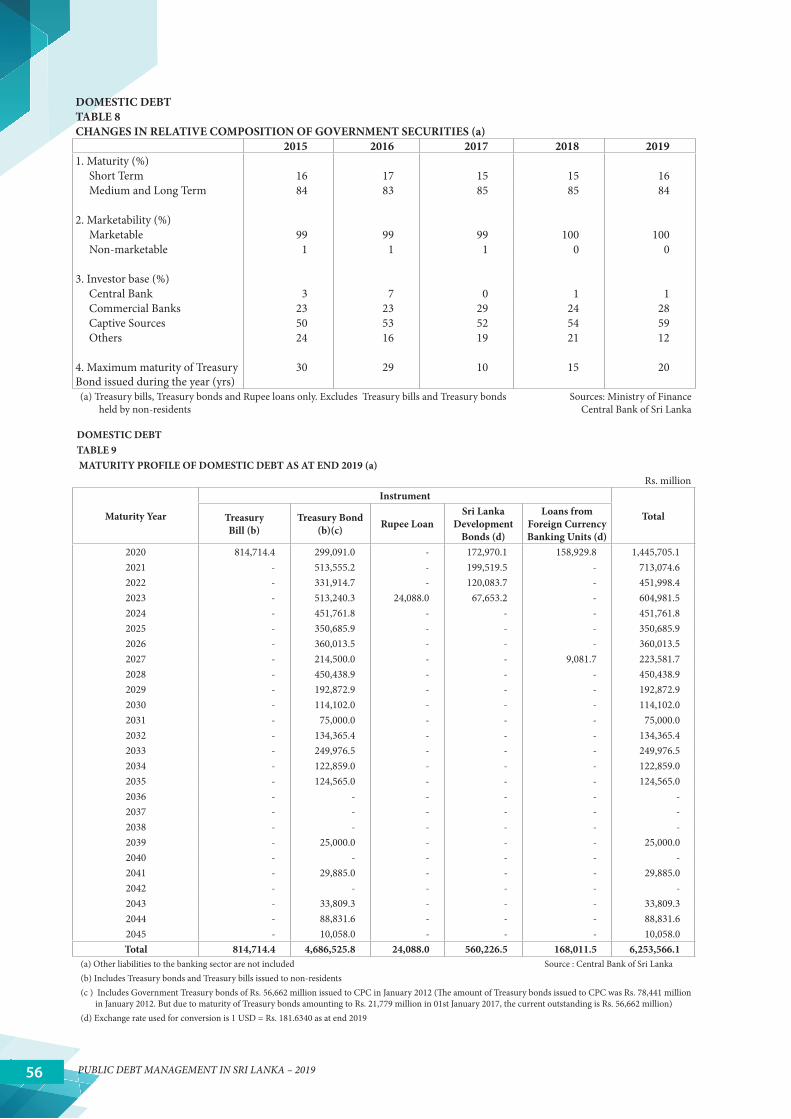
PUBLIC DEBT MANAGEMENT IN SRI LANKA – 201956
DOMESTIC DEBTTABLE 8CHANGES IN RELATIVE COMPOSITION OF GOVERNMENT SECURITIES (a)
2015 2016 2017 2018 20191. Maturity (%) Short Term 16 17 15 15 16 Medium and Long Term 84 83 85 85 84
2. Marketability (%) Marketable 99 99 99 100 100 Non-marketable 1 1 1 0 0
3. Investor base (%) Central Bank 3 7 0 1 1 Commercial Banks 23 23 29 24 28 Captive Sources 50 53 52 54 59 Others 24 16 19 21 12
4. Maximum maturity of Treasury Bond issued during the year (yrs)
30 29 10 15 20
(a) Treasury bills, Treasury bonds and Rupee loans only. Excludes Treasury bills and Treasury bonds held by non-residents
Sources: Ministry of Finance Central Bank of Sri Lanka
DOMESTIC DEBTTABLE 9 MATURITY PROFILE OF DOMESTIC DEBT AS AT END 2019 (a)
Rs. million
Maturity Year
Instrument
TotalTreasury Bill (b)
Treasury Bond (b)(c) Rupee Loan
Sri Lanka Development
Bonds (d)
Loans from Foreign Currency Banking Units (d)
2020 814,714.4 299,091.0 - 172,970.1 158,929.8 1,445,705.1 2021 - 513,555.2 - 199,519.5 - 713,074.6 2022 - 331,914.7 - 120,083.7 - 451,998.4 2023 - 513,240.3 24,088.0 67,653.2 - 604,981.5 2024 - 451,761.8 - - - 451,761.8 2025 - 350,685.9 - - - 350,685.9 2026 - 360,013.5 - - - 360,013.5 2027 - 214,500.0 - - 9,081.7 223,581.7 2028 - 450,438.9 - - - 450,438.9 2029 - 192,872.9 - - - 192,872.9 2030 - 114,102.0 - - - 114,102.0 2031 - 75,000.0 - - - 75,000.0 2032 - 134,365.4 - - - 134,365.4 2033 - 249,976.5 - - - 249,976.5 2034 - 122,859.0 - - - 122,859.0 2035 - 124,565.0 - - - 124,565.0 2036 - - - - - - 2037 - - - - - - 2038 - - - - - - 2039 - 25,000.0 - - - 25,000.0 2040 - - - - - - 2041 - 29,885.0 - - - 29,885.0 2042 - - - - - - 2043 - 33,809.3 - - - 33,809.3 2044 - 88,831.6 - - - 88,831.6 2045 - 10,058.0 - - - 10,058.0 Total 814,714.4 4,686,525.8 24,088.0 560,226.5 168,011.5 6,253,566.1
(a) Other liabilities to the banking sector are not included Source : Central Bank of Sri Lanka(b) Includes Treasury bonds and Treasury bills issued to non-residents(c ) Includes Government Treasury bonds of Rs. 56,662 million issued to CPC in January 2012 (The amount of Treasury bonds issued to CPC was Rs. 78,441 million
in January 2012. But due to maturity of Treasury bonds amounting to Rs. 21,779 million in 01st January 2017, the current outstanding is Rs. 56,662 million)(d) Exchange rate used for conversion is 1 USD = Rs. 181.6340 as at end 2019

PUBLIC DEBT MANAGEMENT IN SRI LANKA – 2019 57
DOMESTIC DEBTTABLE 10 FUTURE DOMESTIC CURRENCY DEBT OBLIGATIONS AS AT END 2019 (a) (b)
Rs. millionYear Capital Interest Grand Total2020 299,091 565,700 864,791 2021 513,555 454,647 968,202 2022 331,915 405,235 737,150 2023 537,328 364,490 901,818 2024 451,762 307,851 759,613 2025 350,686 268,729 619,414 2026 360,013 228,556 588,570 2027 214,500 194,567 409,067 2028 450,439 168,074 618,513 2029 192,873 121,092 313,965 2030 114,102 102,830 216,932 2031 75,000 92,885 167,885 2032 134,365 84,704 219,069 2033 249,977 67,119 317,095 2034 122,859 46,599 169,458 2035 124,565 29,666 154,231 2036 - 22,504 22,504 2037 - 22,504 22,504 2038 - 22,504 22,504 2039 25,000 22,504 47,504 2040 - 19,879 19,879 2041 29,885 18,085 47,970 2042 - 16,292 16,292 2043 33,809 14,771 48,580 2044 88,832 7,253 96,085 2045 10,058 629 10,687 Total 4,710,614 3,669,668 8,380,282
(a) Represents capital payments (Face values of Treasury bonds and Rupee loans) and interest payments (coupon payments of Treasury bonds, interest payments for Treasury bills and Rupee loans) as at end 2019
Source: Central Bank of Sri Lanka
(b) Treasury bill principle is considered rollover

PUBLIC DEBT MANAGEMENT IN SRI LANKA – 201958
DOMESTIC DEBTTABLE 11OWNERSHIP OF TREASURY BILLS (a)
Rs million
Ownership 2010 2011 2012 2013 2014 2015 2016 2017 2018 2019 (b)1. Bank Sector 223,351 355,552 373,753 447,004 401,792 445,418 575,528 473,106 534,996 759,424
1.1 Central Bank 2,993 169,797 154,005 3,053 123,496 104,754 331,389 9,908 45,797 74,744 1.2 Commercial Banks 220,358 185,756 219,748 443,951 278,296 340,664 244,139 463,198 489,199 684,680
2. Non Bank Sector 291,091 235,333 255,317 253,133 292,975 212,822 204,052 224,048 211,891 114,519 2.1 Employees’
Provident Fund 5,969 - 33,410 13,969 1,000 - 41,057 74,475 36,321 7,941
2.2 Other Provident Funds 15 1,279 122 45 - 162 77 49 1,091 -
2.3 Savings Institutions 52,541 58,733 61,972 68,328 47,945 67,766 18,049 38,378 21,881 21,939
2.4 Insurance and Finance Companies
12,072 11,010 19,097 28,629 47,461 47,388 57,918 58,093 64,628 71,637
2.5 Departmental and Other Official Funds
20,636 5,968 2,566 8,114 10,986 7,570 7,616 760 3,036 3,449
2.6 Private and Other 199,858 158,344 138,149 134,048 185,582 89,937 79,336 52,293 84,933 9,554 3 Foreign Investors (c) 57,317 70,123 80,184 73,916 55,500 5,045 12,816 27,552 11,909 23,727 Total 571,759 661,008 709,254 774,053 750,267 663,285 792,396 724,706 758,796 897,670 (a) Adjusted for secondary market transactions Sources: Ministry of Finance(b) Provisional Central Bank of Sri Lanka
(c) Includes rupee denominated Treasury bills held by foreign investors. Hence, figures differ from those appearing in Appendix Table 3 of this report
DOMESTIC DEBTTABLE 12 OWNERSHIP OF TRASURY BONDS (a) (b)
Rs millionOwnership 2010 2011 2012 2013 2014 2015 2016 2017 2018 2019 (c )
1. Bank Sector 184,779 228,898 333,389 477,457 681,565 601,538 815,950 858,574 698,378 839,456 1.1 Commercial Banks 184,779 228,898 333,389 477,457 681,565 601,538 815,950 858,574 698,378 839,456
2. Non Bank Sector 1,463,505 1,594,750 1,844,502 2,070,866 2,258,452 2,799,673 2,990,403 3,033,833 3,498,945 3,766,776 2.1 Employee’s Provident
Fund 814,451 927,374 1,117,360 1,356,389 1,450,144 1,612,461 1,737,219 1,855,665 2,110,855 2,382,460
2.2 Other Provident Funds 19,872 7,550 30,639 35,031 315 42,713 48,060 - 42,549 25,637
2.3 Savings Institutions 221,805 246,418 261,309 285,915 327,932 358,470 406,722 407,415 471,095 570,026 2.4 Insurance and
Finance Companies 33,624 34,410 31,711 26,636 42,742 58,808 68,124 68,305 56,937 57,122
2.5 Departmental and Other Official Funds 36,963 37,006 37,596 187,904 210,598 245,045 264,014 285,278 311,688 321,389
2.6 Private and Other 336,790 341,992 365,887 178,991 226,720 482,176 466,264 417,170 505,821 410,143 3 Foreign Investors (d) 183,538 199,531 317,604 403,486 401,710 298,734 247,222 295,059 146,914 80,294
Total 1,831,822 2,023,179 2,495,495 2,951,809 3,341,727 3,699,945 4,053,575 4,187,467 4,344,238 4,686,526 (a) Adjusted for secondary market transactions Sources: Ministry of Finance(b) Includes Treasury bonds of Rs. 4,397 million issued to CWE in November 2003 (matured on 14 November 2016), Rs.
13,125 million issued to capitalise SriLankan Airlines in March 2013 (matured on 01 June 2018) and Rs. 78,441 million issued to CPC in January 2012 (of which Rs. 21,778 million matured on 01 January 2017 and the outstanding as at end 2019 is Rs. 56,662 million)
Central Bank of Sri Lanka
(c) Provisional(d) Includes rupee denominated Treasury bonds held by foreign investors. Hence, figures differ from those appearing in
Appendix Table 3 of this report.

PUBLIC DEBT MANAGEMENT IN SRI LANKA – 2019 59
DOMESTIC DEBTTABLE 13OWNERSHIP OF RUPEE LOANS
Rs.millionOwnership 2010 2011 2012 2013 2014 2015 2016 2017 2018 2019 (a)
1. Bank Sector - Commercial Banks 17,615 16,234 15,870 15,870 15,870 15,870 15,870 15,870 15,870 15,870
2. Non Bank Sector 70,094 45,727 42,516 39,648 39,648 8,218 8,218 8,218 8,218 8,218 2.1 Savings Institutions 12,168 9,168 6,868 4,000 4,000 2,000 2,000 2,000 2,000 2,000 2.2 Departmental and Other Official Funds (b) 6,103 6,101 5,190 6,101 6,101 - - - - -
2.3 Employees’ Provident Fund 40,921 23,100 23,100 23,100 23,100 - - - - - 2.4 Other Provident Funds 10,369 7,358 7,358 6,447 6,447 6,218 6,218 6,218 6,218 6,218 2.5 Other (c ) 532 - - - - - - - - - Total 87,709 61,961 58,386 55,518 55,518 24,088 24,088 24,088 24,088 24,088 (a) Provisional Sources: Ministry of Finance(b) Including Employees’ Trust Fund Central Bank of Sri Lanka(c ) Comprises co-operative banks, other companies, institutions and individuals
FOREIGN DEBTTABLE 14COMPOSITION OF OUTSTANDING FOREIGN DEBT AS AT END 2019 (a)
Rs. millionCreditor Category/ Use of Funds Bi-lateral Multi-lateral Commercial Export Credit Total Debt % of TotalCash (b) 397 70 2,176,593 0 2,177,060 34.00 Commodity 5,896 - - 160 6,056 0.09 Food 15,554 - (0.00) 0 15,554 0.24 Goods & Services 11,875 - - 18,827 30,702 0.48 Programme 20,812 124,407 - 0 145,219 2.27 Project 1,077,377 1,329,902 1,986 676,980 3,086,245 48.20 Other ( c) 0 15,488 903,210 22,904 941,602 14.71 Total Debt 1,131,911 1,469,867 3,081,789 718,871 6,402,439 100.00 % 17.68 22.96 48.13 11.23 100.00(a) Provisional Sources: Ministry of Finance(b) Includes sovereign bond issued in 2009, 2010, 2011,2012, 2014,2015, 2016, 2017, 2018 and 2019 Central Bank of Sri Lanka(c) Includes Treasury bonds and Treasury bills held by non-residents

PUBLIC DEBT MANAGEMENT IN SRI LANKA – 201960
FOREIGN DEBTTABLE 15OWNERSHIP OF OUTSTANDING FOREIGN DEBT
Rs. millionSource 2010 2011 2012 2013 2014 2015 2016 2017 2018 2019
Provisional1. Multi-lateral 674,936 721,916 844,292 903,540 887,960 994,430 1,076,549 1,198,243 1,451,443 1,469,867 ADB 358,872 383,461 448,421 478,796 471,762 533,806 569,686 632,237 785,509 802,047 EIB 18,792 18,054 23,438 23,248 21,133 29,728 27,518 29,193 31,255 27,509 IBRD - - 322 4,530 6,987 10,382 27,760 28,462 37,008 45,769 IDA 281,217 302,244 349,997 373,085 363,052 391,149 417,636 467,832 548,283 541,074 IFAD 11,032 13,007 16,013 17,419 17,098 18,631 21,520 24,405 28,251 29,417 OPEC 1,913 2,052 2,699 2,998 4,783 7,547 9,309 12,743 17,398 20,443 Nordic Development Fund 3,110 3,099 3,403 3,464 3,145 3,187 3,119 3,370 3,741 3,480
Asian Infrastructure Investment Bank
- - - - - - - - - 127
2. Bi-lateral 739,213 842,804 1,035,907 823,180 793,196 888,971 945,754 992,157 1,163,265 1,131,911Canada 8,134 7,701 8,269 7,409 6,339 5,373 5,275 5,254 5,230 4,854France (a) 18,427 19,503 24,273 26,861 24,698 25,406 24,448 27,977 32,264 34,202Germany 50,263 47,547 51,164 52,112 43,342 40,726 39,145 43,506 46,937 43,113India 17,292 41,927 78,322 102,843 119,982 137,413 142,277 145,071 166,915 153,075Japan 478,931 529,013 547,515 468,366 416,408 457,483 486,199 506,829 613,656 617,973Kuwait 5,237 5,799 6,194 5,749 5,357 6,765 7,774 8,768 12,124 13,146Netherlands 87 - - - - - - - - - People’s Republic of China 56,459 59,497 67,434 67,154 87,743 117,284 131,604 135,728 150,939 138,720
Saudi Arabian Fund 2,338 2,544 2,648 3,868 4,982 10,724 13,255 16,722 21,752 23,725USA 42,414 40,318 41,386 38,854 35,246 34,594 31,798 28,925 28,910 24,381Other 59,633 88,957 208,702 49,963 49,100 53,205 63,978 74,007 84,537 78,724
3. Financial Markets
610,433 764,560 887,100 1,233,704 1,431,959 1,660,630 2,023,493 2,528,218 3,344,839 3,800,660
Riggs National Bank
3,140 2,984 3,064 2,922 2,651 2,607 2,336 2,110 2,262 1,986
Bankers Trust Co. 466 399 356 275 184 101 - - - - Solomon Bros. Inc. - New York
157 54 - - - - - - - -
Citi Bank/NEXI - - - - - 201.40 - - - - Export-Import Bank of China (b) - - - - 146,262.00 192,889.00 242,416.00 299,405 392,041 476,565
Other 606,670 761,124 883,680 1,230,507 1,282,863 1,464,832 1,778,741 2,226,703 2,950,536 3,322,109International Sovereign bonds 221,906 341,704 445,063 457,636 655,243 958,014 1,220,870 1,475,049 2,220,411 2,733,592
Non-resident investments in Treasury bills
57,317.00 70,123 80,184 73,916 55,500 5,045 12,816 27,552 11,909 23,727
Non-resident investments in Treasury bonds
183,538 199,531 317,604 403,486 401,710 298,734 247,222 295,059 146,914 80,294
Other (c ) 143,909 149,766 40,829 295,470 170,410 203,039 297,833 429,043 571,301 484,497Total 2,024,583 2,329,280 2,767,299 2,960,424 3,113,116 3,544,031 4,045,796 4,718,618 5,959,547 6,402,439(a) Includes loans from Financial Institutions. Sources: Ministry of Finance(b) Excludes outstanding loans of Projects under State Owned Business Enterprises Central Bank of Sri Lanka(c) Includes outstanding defence loans (up to 2016) and proceeds from foreign currency term financing facilitiy
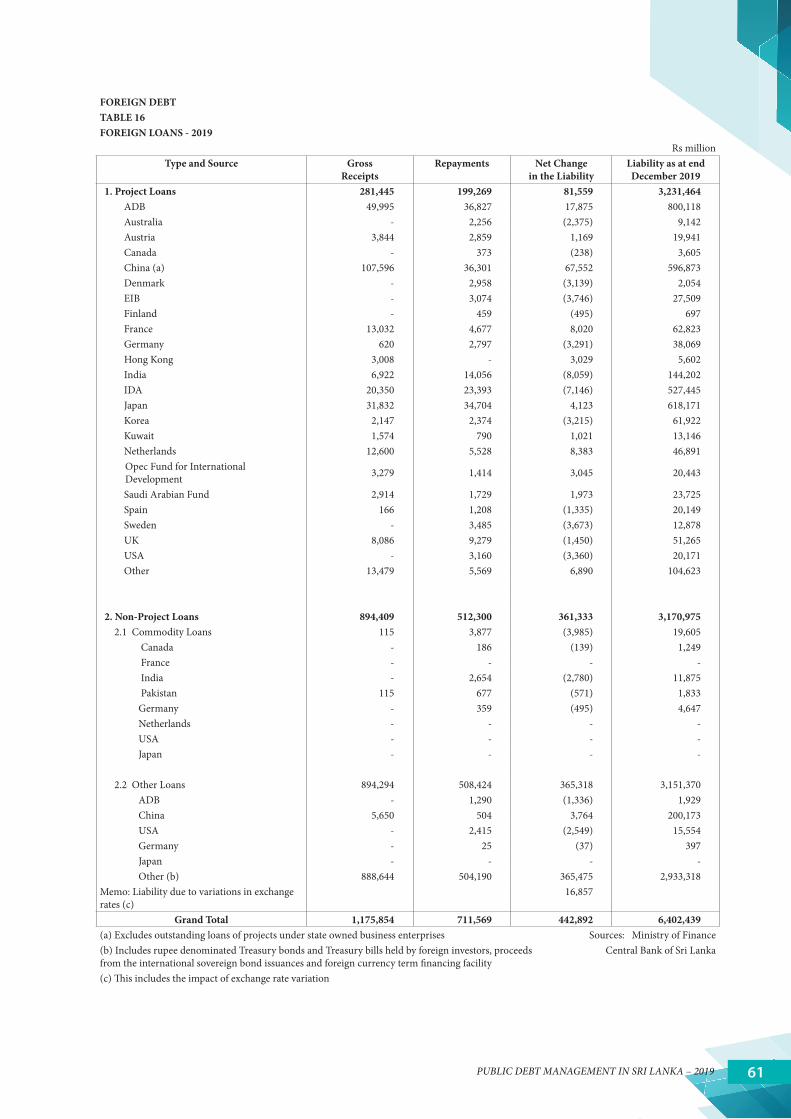
PUBLIC DEBT MANAGEMENT IN SRI LANKA – 2019 61
FOREIGN DEBTTABLE 16FOREIGN LOANS - 2019
Rs millionType and Source Gross
ReceiptsRepayments Net Change
in the LiabilityLiability as at end December 2019
1. Project Loans 281,445 199,269 81,559 3,231,464 ADB 49,995 36,827 17,875 800,118 Australia - 2,256 (2,375) 9,142 Austria 3,844 2,859 1,169 19,941 Canada - 373 (238) 3,605 China (a) 107,596 36,301 67,552 596,873 Denmark - 2,958 (3,139) 2,054 EIB - 3,074 (3,746) 27,509 Finland - 459 (495) 697 France 13,032 4,677 8,020 62,823 Germany 620 2,797 (3,291) 38,069 Hong Kong 3,008 - 3,029 5,602 India 6,922 14,056 (8,059) 144,202 IDA 20,350 23,393 (7,146) 527,445 Japan 31,832 34,704 4,123 618,171 Korea 2,147 2,374 (3,215) 61,922 Kuwait 1,574 790 1,021 13,146 Netherlands 12,600 5,528 8,383 46,891
Opec Fund for International Development 3,279 1,414 3,045 20,443
Saudi Arabian Fund 2,914 1,729 1,973 23,725 Spain 166 1,208 (1,335) 20,149 Sweden - 3,485 (3,673) 12,878 UK 8,086 9,279 (1,450) 51,265 USA - 3,160 (3,360) 20,171 Other 13,479 5,569 6,890 104,623
2. Non-Project Loans 894,409 512,300 361,333 3,170,975 2.1 Commodity Loans 115 3,877 (3,985) 19,605 Canada - 186 (139) 1,249 France - - - - India - 2,654 (2,780) 11,875 Pakistan 115 677 (571) 1,833 Germany - 359 (495) 4,647 Netherlands - - - - USA - - - - Japan - - - -
2.2 Other Loans 894,294 508,424 365,318 3,151,370 ADB - 1,290 (1,336) 1,929 China 5,650 504 3,764 200,173 USA - 2,415 (2,549) 15,554 Germany - 25 (37) 397 Japan - - - - Other (b) 888,644 504,190 365,475 2,933,318 Memo: Liability due to variations in exchange rates (c)
16,857
Grand Total 1,175,854 711,569 442,892 6,402,439 (a) Excludes outstanding loans of projects under state owned business enterprises Sources: Ministry of Finance (b) Includes rupee denominated Treasury bonds and Treasury bills held by foreign investors, proceeds from the international sovereign bond issuances and foreign currency term financing facility
Central Bank of Sri Lanka
(c) This includes the impact of exchange rate variation

PUBLIC DEBT MANAGEMENT IN SRI LANKA – 201962
FOREIGN DEBT
TABLE 17
FOREIGN LOAN DISBURSEMENTS BY SOURCE
Rs million
CategoryDisbursements
2010 2011 2012 2013 2014 2015 2016 2017 2018 2019 (a)
1. Lender 327,878 322,771 482,259 392,351 451,430 509,201 713,181 866,224 781,104 1,078,276
Bi-lateral 59,272 78,739 109,165 83,109 73,690 66,955 56,884 59,375 51,029 54,835
Multi-lateral 52,685 54,459 65,782 63,335 61,156 71,924 104,900 93,912 91,669 87,195
Commercial(b) (c ) 163,892 144,963 250,505 158,918 281,350 311,659 481,295 616,814 561,750 782,519
Export Credits 52,028 44,611 56,807 86,989 35,234 58,664 70,102 96,123 76,656 153,728
2. Use of Funds 327,878 322,771 482,259 447,465 451,430 509,201 713,181 866,224 781,104 1,078,276
Cash (c) 111,926 109,488 130,695 139,483 195,989 87,035 319,689 228,473 170,923 -
Commodity - - - - - - - - - -
Food - - - - - - - - - -
Goods and Services 126 3,254 2,316 8,195 626 1,064 344 1,330 - 115
Programme 4,788 194 - 21 - - 27,517 456 20,796 3,532
Project 158,770 174,097 227,041 272,433 164,352 190,923 201,752 246,944 193,931 285,711
Technical Assistance 302 232 210 39 241 35 - 290 374 360
Other (c ) 51,967 35,507 121,997 27,294 90,221 230,145 163,880 388,732 395,081 788,558 (a) Provisional Sources: Ministry of Finance (b) Includes Sovereign bonds issued in 2010, 2011, 2012, 2014, 2015, 2016, 2017, 2018 and 2019 Central Bank of Sri Lanka (c) Includes Treasury bonds and Treasury bills (net) issued to non-residents
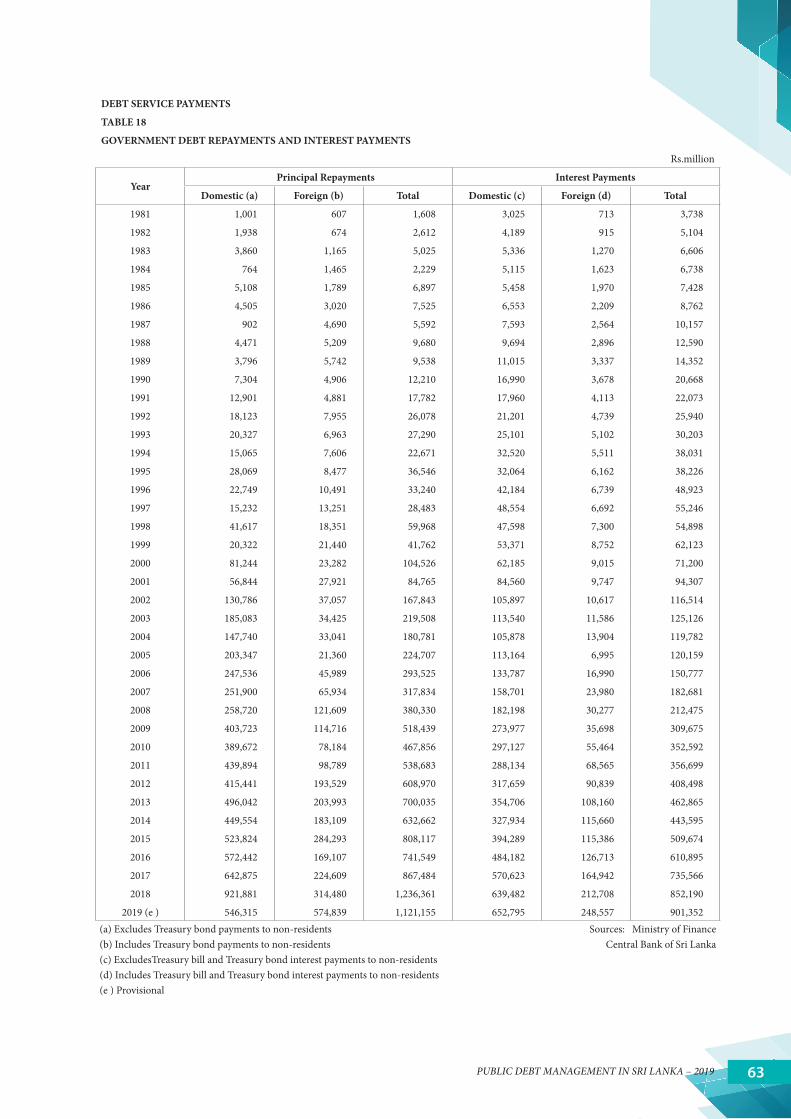
PUBLIC DEBT MANAGEMENT IN SRI LANKA – 2019 63
DEBT SERVICE PAYMENTS
TABLE 18
GOVERNMENT DEBT REPAYMENTS AND INTEREST PAYMENTS
Rs.million
Year Principal Repayments Interest Payments
Domestic (a) Foreign (b) Total Domestic (c) Foreign (d) Total
1981 1,001 607 1,608 3,025 713 3,738
1982 1,938 674 2,612 4,189 915 5,104
1983 3,860 1,165 5,025 5,336 1,270 6,606
1984 764 1,465 2,229 5,115 1,623 6,738
1985 5,108 1,789 6,897 5,458 1,970 7,428
1986 4,505 3,020 7,525 6,553 2,209 8,762
1987 902 4,690 5,592 7,593 2,564 10,157
1988 4,471 5,209 9,680 9,694 2,896 12,590
1989 3,796 5,742 9,538 11,015 3,337 14,352
1990 7,304 4,906 12,210 16,990 3,678 20,668
1991 12,901 4,881 17,782 17,960 4,113 22,073
1992 18,123 7,955 26,078 21,201 4,739 25,940
1993 20,327 6,963 27,290 25,101 5,102 30,203
1994 15,065 7,606 22,671 32,520 5,511 38,031
1995 28,069 8,477 36,546 32,064 6,162 38,226
1996 22,749 10,491 33,240 42,184 6,739 48,923
1997 15,232 13,251 28,483 48,554 6,692 55,246
1998 41,617 18,351 59,968 47,598 7,300 54,898
1999 20,322 21,440 41,762 53,371 8,752 62,123
2000 81,244 23,282 104,526 62,185 9,015 71,200
2001 56,844 27,921 84,765 84,560 9,747 94,307
2002 130,786 37,057 167,843 105,897 10,617 116,514
2003 185,083 34,425 219,508 113,540 11,586 125,126
2004 147,740 33,041 180,781 105,878 13,904 119,782
2005 203,347 21,360 224,707 113,164 6,995 120,159
2006 247,536 45,989 293,525 133,787 16,990 150,777
2007 251,900 65,934 317,834 158,701 23,980 182,681
2008 258,720 121,609 380,330 182,198 30,277 212,475
2009 403,723 114,716 518,439 273,977 35,698 309,675
2010 389,672 78,184 467,856 297,127 55,464 352,592
2011 439,894 98,789 538,683 288,134 68,565 356,699
2012 415,441 193,529 608,970 317,659 90,839 408,498
2013 496,042 203,993 700,035 354,706 108,160 462,865
2014 449,554 183,109 632,662 327,934 115,660 443,595
2015 523,824 284,293 808,117 394,289 115,386 509,674
2016 572,442 169,107 741,549 484,182 126,713 610,895
2017 642,875 224,609 867,484 570,623 164,942 735,566
2018 921,881 314,480 1,236,361 639,482 212,708 852,190
2019 (e ) 546,315 574,839 1,121,155 652,795 248,557 901,352(a) Excludes Treasury bond payments to non-residents Sources: Ministry of Finance (b) Includes Treasury bond payments to non-residents Central Bank of Sri Lanka(c) ExcludesTreasury bill and Treasury bond interest payments to non-residents (d) Includes Treasury bill and Treasury bond interest payments to non-residents(e ) Provisional

PUBLIC DEBT MANAGEMENT IN SRI LANKA – 201964
GOVERNMENT BORROWINGSTABLE 19ISSUES AND MATURITIES OF DOMESTIC DEBT IN 2017,2018 AND 2019
Rs. million
ItemMaturity 2017 2018 2019 (a)
(M) Issues Repayments Net Issues Issues Repayments Net Issues Issues Repayments Net IssuesTreasury Bills ≤ 91 days 597,024 696,540 (99,516) 753,525 783,020 (29,495) 623,167 606,601 16,566
≤ 182 days 613,672 532,270 81,401 205,632 432,123 (226,491) 243,966 188,335 55,631 ≤ 364 days 413,571 463,147 (49,576) 694,102 404,026 290,076 852,194 785,518 66,676
Total 1,624,266 1,691,957 (67,691) 1,653,259 1,619,169 34,091 1,719,327 1,580,453 138,874
Treasury Bonds1 year - - - - - - - - - 2 year 68,479 39,759 28,720 - 59,012 (59,012) 55,000 58,479 (3,479)3 year - 148,894 (148,894) 90,020 72,878 17,142 22,000 26,800 (4,800)4 year 42,183 29,910 12,273 - - - - 74,221 (74,221)5 year 102,185 157,382 (55,197) 205,000 258,970 (53,970) 283,000 170,996 112,004 6 year 55,565 38,979 16,587 - 117,652 (117,652) - 11,911 (11,911)7 year 26,605 - 26,605 95,000 48,119 46,881 - 39,707 (39,707)8 year 122,576 - 122,576 47,000 11,280 35,720 90,000 68,440 21,560 9 year 20,346 - 20,346 50,000 500 49,500 45,000 68 44,932
10 year 110,876 - 110,876 171,000 18,261 152,739 100,000 5,089 94,911 11 year - - - - 14,677 (14,677) 8,000 - 8,000 12 year - - - - - - 75,000 - 75,000 13 year - - - - - - - - - 14 year - - - 20,000 - 20,000 - - - 15 year - - - 85,000 4,900 80,100 45,000 - 45,000 16 year - - - - - - 50,000 - 50,000 19 year - - - - - - - - - 20 year - - - - - - 25,000 - 25,000 25 year - - - - - - - - - 30 year - - - - - - - - -
Total 548,815 414,923 133,892 763,020 606,249 156,771 798,000 455,712 342,288
Rupee Loans 4/7 year - - - - - - - - - 4/8 year - - - - - - - - -
3/10 year - - - - - - - - - Total - - - - - - - - -
Sri Lanka Development Bonds
<= 1 year 90,882 152,031 (61,149) - 93,533 (93,533) 23,154 - 23,154
2 year 86,271 63,606 22,665 24,395 34,271 (9,876) 19,769 102,299 (82,530)3 year 73,181 69,598 3,583 130,722 43,900 86,822 8,828 454 8,374 4 year 24,270 - 24,270 29,979 2,380 27,599 10,114 6,357 3,757 5 year 63,920 - 63,920 48,996 189,470 (140,473) - 2,729 (2,729)
Total 338,524 285,235 53,289 234,093 363,553 (129,461) 61,865 111,839 (49,974)
Loans from OBUs
<= 1 year 33,282 - 33,282 62,377 - 62,377 58,900 - 58,900
2 years - - - - - - - - - 3 years - - - - - - - - - 8 years - - - - - - 9,036 - 9,036
Total 33,282 - 33,282 62,377 - 62,377 67,937 - 67,937 Grand Total 2,544,887 2,392,115 152,772 2,712,749 2,588,971 123,778 2,581,061 2,186,720 394,341 (a) Provisional Source: Central Bank of Sri Lanka

PUBLIC DEBT MANAGEMENT IN SRI LANKA – 2019 65
GOVERNMENT BORROWINGSTABLE 20AUCTION AND PRIMARY ISSUE DETAILS IN 2017, 2018 AND 2019 (a)
Rs. million
Item2017 2018 2019 (b)
Treasury Bills
Treasury Bonds
Rupee Loans
Treasury Bills
Treasury Bonds
Rupee Loans
Treasury Bills
Treasury Bonds
Rupee Loans
Bonds AuctionsNumber of Auctions 52 16 - 51 11 - 52 12 - Amount Offered 1,293,500 598,000 - 1,012,500 741,000 - 1,103,000 798,000 - Bids Received 3,549,127 1,783,714 - 2,912,519 1,736,753 - 3,096,791 1,930,995 - Amount Accepted 1,111,174 536,315 - 928,326 763,020 - 1,087,674 798,000 -
CBSL Purchases 513,092 - - 724,934 - - 631,653 - -
Placements - 12,500 - - - - - - -
Total Issues 1,624,266 548,815 - 1,653,259 763,020 - 1,719,327 798,000 - (a) Face Value Source: Central Bank of Sri Lanka(b) Provisional
GOVERNMENT BORROWINGSTABLE 21GOVERNMENT BORROWING LIMITS AND USAGE IN 2018 AND 2019 - FACE VALUE
Rs. billion2018 2019
Approved Limit Usage Approved Limit Usage 1. Gross Borrowing (Including Contingenty Provision and Book Value Adjustment)
1,894 1,881 2,079 2,077
1.1. Domestic 1,314 1,109 1,359 1,142 1.2. Foreign 580 772 720 935
2. Sources of Financing
2.1. Domestic Financing 1,314 1,109 1,359 1,142 2.1.1 Rupee Loans - - 2.1.2. Treasury Bonds (a) 763 768 2.1.3. Treasury Bills (net) (a) 34 139 2.1.4. Sri Lanka Development Bonds 234 62 2.1.5. Other 78 174
2.2 Foreign Financing 580 772 720 935 2.2.1. International Sovereign Bonds 391 783 2.2.2. Other (b) 381 153
(a) Includes Treasury bonds and Treasury bills issued to non-residents Sources: Ministry of Finance (b) Includes project loans and syndicated loans Central Bank of Sri Lanka
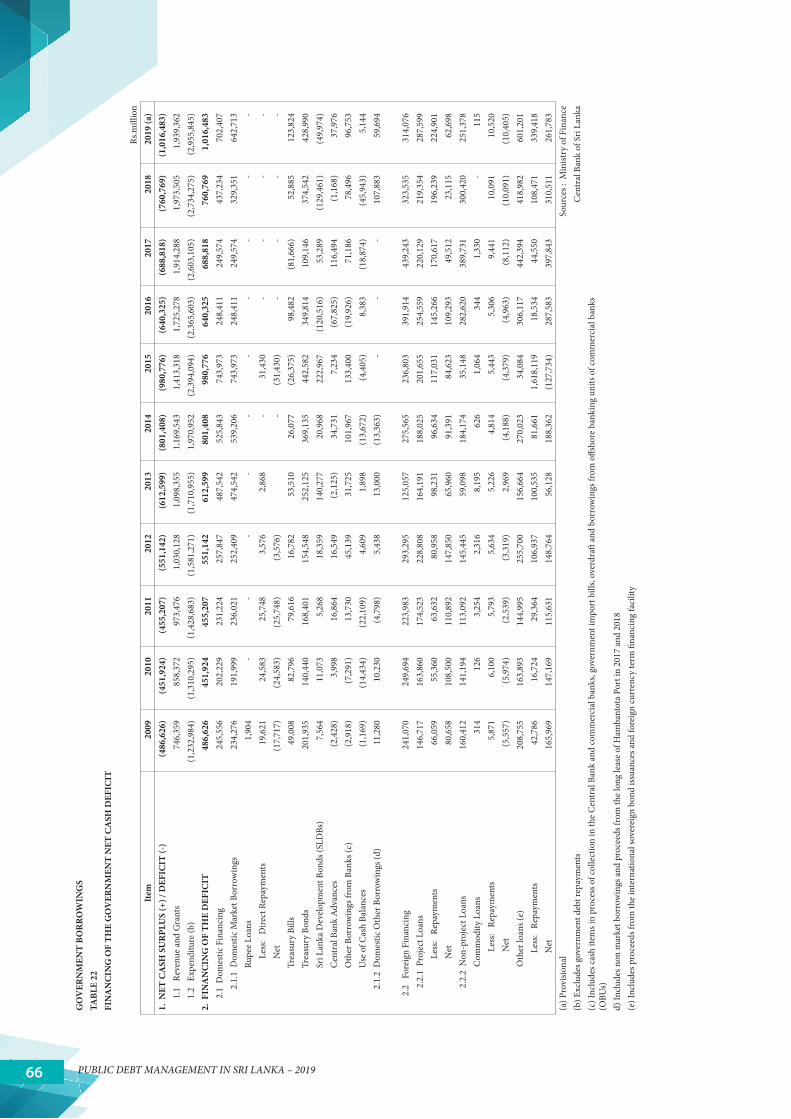
PUBLIC DEBT MANAGEMENT IN SRI LANKA – 201966
GO
VER
NM
ENT
BOR
ROW
ING
STA
BLE
22FI
NA
NC
ING
OF
THE
GO
VER
NM
ENT
NET
CA
SH D
EFIC
IT
Rs.m
illio
nIt
em20
0920
1020
1120
1220
1320
1420
1520
1620
1720
1820
19 (a
)1.
NET
CA
SH S
UR
PLU
S (+
) / D
EFIC
IT (-
) (4
86,6
26)
(451
,924
) (4
55,2
07)
(551
,142
) (6
12,5
99)
(801
,408
) (9
80,7
76)
(640
,325
) (6
88,8
18)
(760
,769
)(1
,016
,483
)1.
1 R
even
ue a
nd G
rant
s 7
46,3
59
858
,372
9
73,4
76
1,0
30,1
28
1,0
98,3
55
1,1
69,5
43
1,4
13,3
18
1,7
25,2
78
1,9
14,2
88
1,9
73,5
05
1,9
39,3
62
1.2
Exp
endi
ture
(b)
(1,2
32,9
84)
(1,3
10,2
95)
(1,4
28,6
83)
(1,5
81,2
71)
(1,7
10,9
55)
1,9
70,9
52
(2,3
94,0
94)
(2,3
65,6
03)
(2,6
03,1
05)
(2,7
34,2
75)
(2,9
55,8
45)
2. F
INA
NC
ING
OF
THE
DEF
ICIT
486
,626
4
51,9
24
455
,207
5
51,1
42
612
,599
8
01,4
08
980
,776
6
40,3
25
688
,818
7
60,7
69
1,0
16,4
83
2.1
Dom
estic
Fin
anci
ng 2
45,5
56
202
,229
2
31,2
24
257
,847
4
87,5
42
525
,843
7
43,9
73
248
,411
2
49,5
74
437
,234
7
02,4
07
2.1.
1 D
omes
tic M
arke
t Bor
row
ings
234
,276
1
91,9
99
236
,021
2
52,4
09
474
,542
5
39,2
06
743
,973
2
48,4
11
249
,574
3
29,3
51
642
,713
Ru
pee
Loan
s
1,9
04
- -
- -
- -
- -
- -
Less
: D
irect
Rep
aym
ents
19,
621
24,
583
25,
748
3,5
76
2,8
68
- 3
1,43
0 -
- -
- N
et (1
7,71
7) (2
4,58
3) (2
5,74
8) (3
,576
) -
(31,
430)
- -
- -
Trea
sury
Bill
s 4
9,00
8 8
2,79
6 7
9,61
6 1
6,78
2 5
3,51
0 2
6,07
7 (2
6,37
5) 9
8,48
2 (8
1,66
6) 5
2,88
5 1
23,8
24
Trea
sury
Bon
ds 2
01,9
35
140
,440
1
68,4
01
154
,548
2
52,1
25
369
,135
4
42,5
82
349
,814
1
09,1
46
374
,542
4
28,9
90
Sri L
anka
Dev
elop
men
t Bon
ds (S
LDBs
) 7
,564
1
1,07
3 5
,268
1
8,35
9 1
40,2
77
20,
968
222
,967
(1
20,5
16)
53,
289
(129
,461
) (4
9,97
4)C
entr
al B
ank
Adv
ance
s (2
,428
) 3
,998
1
6,86
4 1
6,54
9 (2
,125
) 3
4,73
1 7
,234
(6
7,82
5) 1
16,4
94
(1,1
68)
37,
976
Oth
er B
orro
win
gs fr
om B
anks
(c)
(2,9
18)
(7,2
91)
13,
730
45,
139
31,
725
101
,967
1
33,4
00
(19,
926)
71,
186
78,
496
96,
753
Use
of C
ash
Bala
nces
(1,1
69)
(14,
434)
(22,
109)
4,6
09
1,8
98
(13,
672)
(4,4
05)
8,3
83
(18,
874)
(45,
943)
5,1
44
2.1.
2 D
omes
tic O
ther
Bor
row
ings
(d)
11,
280
10,
230
(4,7
98)
5,4
38
13,
000
(13,
363)
- -
- 1
07,8
83
59,
694
2.2
For
eign
Fin
anci
ng 2
41,0
70
249
,694
2
23,9
83
293
,295
1
25,0
57
275
,565
2
36,8
03
391
,914
4
39,2
43
323
,535
3
14,0
76
2.2.
1 P
roje
ct L
oans
1
46,7
17
163
,860
1
74,5
23
228
,808
1
64,1
91
188
,025
2
01,6
55
254
,559
2
20,1
29
219
,354
2
87,5
99
Less
: R
epay
men
ts 6
6,05
9 5
5,36
0 6
3,63
2 8
0,95
8 9
8,23
1 9
6,63
4 1
17,0
31
145
,266
1
70,6
17
196
,239
2
24,9
01
Net
80,
658
108
,500
1
10,8
92
147
,850
6
5,96
0 9
1,39
1 8
4,62
3 1
09,2
93
49,
512
23,
115
62,
698
2.2.
2 N
on-p
roje
ct L
oans
1
60,4
12
141
,194
1
13,0
92
145
,445
5
9,09
8 1
84,1
74
35,
148
282
,620
3
89,7
31
300
,420
2
51,3
78
Com
mod
ity L
oans
314
1
26
3,2
54
2,3
16
8,1
95
626
1
,064
3
44
1,3
30
- 1
15
L
ess:
Rep
aym
ents
5,8
71
6,1
00
5,7
93
5,6
34
5,2
26
4,8
14
5,4
43
5,3
06
9,4
41
10,
091
10,
520
N
et (5
,557
) (5
,974
) (2
,539
) (3
,319
) 2
,969
(4
,188
) (4
,379
) (4
,963
) (8
,112
) (1
0,09
1) (1
0,40
5)O
ther
loan
s (e)
208
,755
1
63,8
93
144
,995
2
55,7
00
156
,664
2
70,0
23
34,
084
306
,117
4
42,3
94
418
,982
6
01,2
01
L
ess:
Rep
aym
ents
42,
786
16,
724
29,
364
106
,937
1
00,5
35
81,
661
1,6
18,1
19
18,
534
44,
550
108
,471
3
39,4
18
N
et 1
65,9
69
147
,169
1
15,6
31
148
,764
5
6,12
8 1
88,3
62
(127
,734
) 2
87,5
83
397
,843
3
10,5
11
261
,783
(a
) Pro
visio
nal
Sour
ces :
Min
istry
of F
inan
ce(b
) Exc
lude
s gov
ernm
ent d
ebt r
epay
men
tsC
entr
al B
ank
of S
ri La
nka
(c) I
nclu
des c
ash
item
s in
proc
ess o
f col
lect
ion
in th
e C
entr
al B
ank
and
com
mer
cial
ban
ks, g
over
nmen
t im
port
bill
s, ov
erdr
aft a
nd b
orro
win
gs fr
om o
ffsho
re b
anki
ng u
nits
of c
omm
erci
al b
anks
(O
BUs)
d) In
clud
es n
on m
arke
t bor
row
ings
and
pro
ceed
s fro
m th
e lo
ng le
ase
of H
amba
ntot
a Po
rt in
201
7 an
d 20
18(e
) Inc
lude
s pro
ceed
s fro
m th
e in
tern
atio
nal s
over
eign
bon
d iss
uanc
es a
nd fo
reig
n cu
rren
cy te
rm fi
nanc
ing
faci
lity
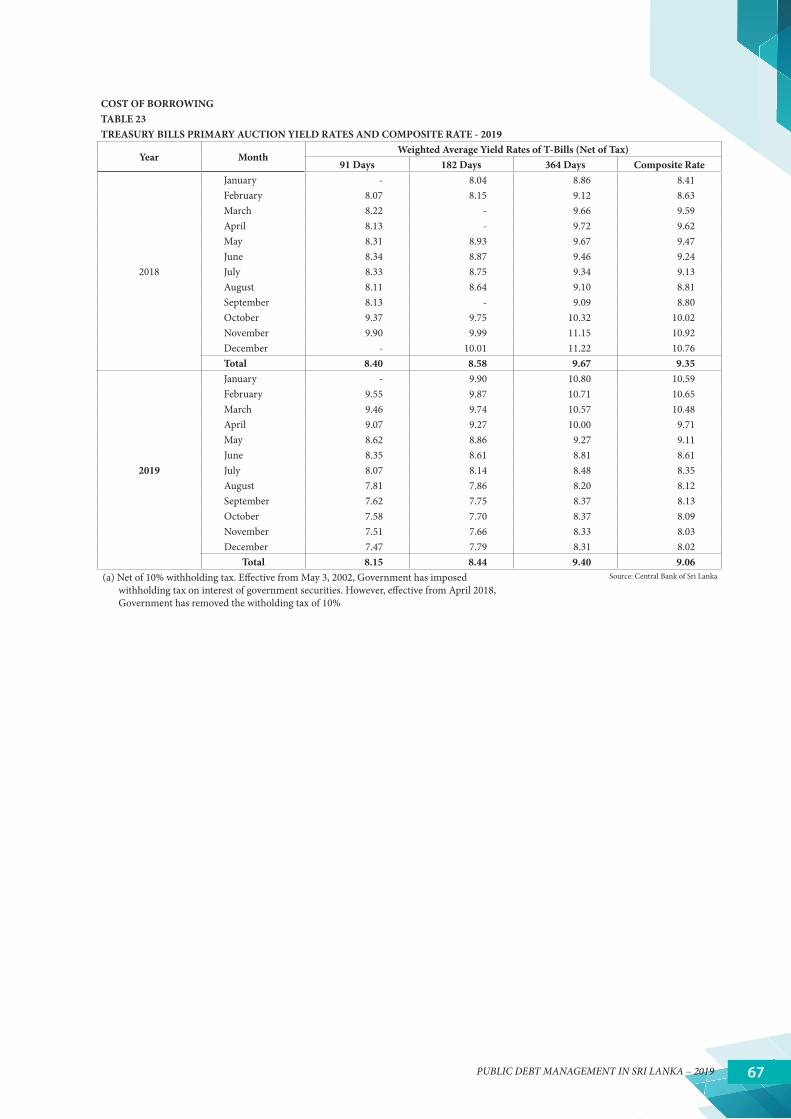
PUBLIC DEBT MANAGEMENT IN SRI LANKA – 2019 67
COST OF BORROWINGTABLE 23TREASURY BILLS PRIMARY AUCTION YIELD RATES AND COMPOSITE RATE - 2019
Year MonthWeighted Average Yield Rates of T-Bills (Net of Tax)
91 Days 182 Days 364 Days Composite Rate
2018
January - 8.04 8.86 8.41February 8.07 8.15 9.12 8.63March 8.22 - 9.66 9.59April 8.13 - 9.72 9.62May 8.31 8.93 9.67 9.47June 8.34 8.87 9.46 9.24July 8.33 8.75 9.34 9.13August 8.11 8.64 9.10 8.81September 8.13 - 9.09 8.80October 9.37 9.75 10.32 10.02November 9.90 9.99 11.15 10.92December - 10.01 11.22 10.76Total 8.40 8.58 9.67 9.35
2019
January - 9.90 10.80 10.59February 9.55 9.87 10.71 10.65March 9.46 9.74 10.57 10.48April 9.07 9.27 10.00 9.71May 8.62 8.86 9.27 9.11June 8.35 8.61 8.81 8.61July 8.07 8.14 8.48 8.35August 7.81 7.86 8.20 8.12September 7.62 7.75 8.37 8.13October 7.58 7.70 8.37 8.09November 7.51 7.66 8.33 8.03December 7.47 7.79 8.31 8.02
Total 8.15 8.44 9.40 9.06(a) Net of 10% withholding tax. Effective from May 3, 2002, Government has imposed
withholding tax on interest of government securities. However, effective from April 2018, Government has removed the witholding tax of 10%
Source: Central Bank of Sri Lanka

PUBLIC DEBT MANAGEMENT IN SRI LANKA – 201968
COST OF BORROWINGTABLE 24TREASURY BOND AUCTIONS IN 2019
Series Settlement Date
Maturity Date
Maturity Period (Years)
Amount Offered
(Rs. million)
Bids Received
(Rs. million)
Amount Accepted
(Rs. million)
Coupon Rate (%)
Weighed Average
Yield Rate (%)
11.60%2023A 16-Jan-19 15-Dec-23 5 48,000.00 110,113.00 48,000.00 11.60 11.5811.50%2028A 16-Jan-19 1-Sep-28 10 50,000.00 129,500.00 50,000.00 11.50 11.7311.00%2021A 5-Feb-19 1-Aug-21 2 25,000.00 67,982.00 25,000.00 11.00 10.8511.40%2027A 5-Feb-19 15-Jan-27 8 25,000.00 102,291.00 25,000.00 11.40 11.3010.90%2024A 15-Mar-19 15-Mar-24 5 30,000.00 57,114.00 30,000.00 10.90 11.0413.00%2029B 15-Mar-19 1-May-29 10 40,000.00 79,867.00 40,000.00 13.00 11.3510.70%2022A 4-Apr-19 15-Mar-22 3 15,000.00 43,135.00 15,000.00 10.70 10.7211.40%2027A 4-Apr-19 15-Jan-27 8 25,000.00 65,826.00 25,000.00 11.40 11.2410.90%2024A 2-May-19 15-Mar-24 5 45,000.00 108,862.00 45,000.00 10.90 10.9811.25%2031A 2-May-19 15-Mar-31 12 75,000.00 162,560.00 75,000.00 11.25 11.2709.45%2021A 17-Jun-19 15-Oct-21 2 30,000.00 89,327.00 30,000.00 09.45 9.7910.75%2028A 17-Jun-19 15-Mar-28 9 40,000.00 104,755.00 40,000.00 10.75 10.6310.25%2024A 1-Jul-19 15-Jun-24 5 75,000.00 132,237.00 75,000.00 10.25 9.8311.50%2035A 1-Jul-19 15-Mar-35 16 50,000.00 110,195.00 50,000.00 11.50 10.5909.00%2028B 15-Aug-19 1-May-28 9 5,000.00 22,495.00 5,000.00 09.00 10.0010.50%2039A 15-Aug-19 15-Aug-39 20 10,000.00 37,236.00 10,000.00 10.50 10.2909.85%2024A 16-Sep-19 15-Sep-24 5 70,000.00 117,101.00 70,000.00 09.85 10.2710.25%2034A 16-Sep-19 15-Sep-34 15 45,000.00 67,765.00 45,000.00 10.25 10.5910.00%2023A 15-Oct-19 15-Mar-23 3 7,000.00 48,606.00 7,000.00 10.00 9.6511.00%2030A 15-Oct-19 15-May-30 11 8,000.00 43,641.00 8,000.00 11.00 10.4610.30%2027A 1-Nov-19 15-Oct-27 8 40,000.00 85,804.00 40,000.00 10.30 10.2410.50%2039A 1-Nov-19 15-Aug-39 20 15,000.00 48,805.00 15,000.00 10.50 10.6809.85%2024A 16-Dec-19 15-Sep-24 5 15,000.00 53,753.00 15,000.00 09.85 9.8711.00%2030A 16-Dec-19 15-May-30 10 10,000.00 42,025.00 10,000.00 11.00 10.23
Source: Central Bank of Sri Lanka

PUBLIC DEBT MANAGEMENT IN SRI LANKA – 2019 69
COST OF BORROWINGTABLE 25TREASURY BILL AUCTIONS IN 2019
Issue DateAmount Offered
(Rs. million) Amount Bids Received
(Rs. million)Amount Bids Accepted
(Rs. million) Weighted Average Yield Rate
(%) 91 Days 182 Days 364 Days 91 Days 182 Days 364 Days 91 Days 182 Days 364 Days 91 Days 182 Days 364 Days
4-Jan-19 - 7,000.0 8,500.0 - 14,500.0 51,000.0 - 4,705.0 8,795.0 - 9.95 10.99 11-Jan-19 - 8,000.0 12,000.0 - 13,950.0 41,888.0 - 2,450.0 17,550.0 - 9.94 10.85 18-Jan-19 - 10,000.0 16,000.0 - 19,212.0 50,539.0 - 10,000.0 16,000.0 - 9.87 10.75 25-Jan-19 - 5,000.0 18,500.0 - 7,562.0 50,680.0 - 2,550.0 20,950.0 - 9.87 10.70 1-Feb-19 - 5,000.0 16,000.0 - 6,750.0 52,435.0 - - 21,000.0 - - 10.69 8-Feb-19 2,000.0 6,000.0 16,000.0 3,276.0 7,941.0 46,452.0 1,851.0 1,422.0 20,727.0 9.55 9.87 10.69
15-Feb-19 3,500.0 3,500.0 14,000.0 4,850.0 4,750.0 43,677.0 - - 21,000.0 - - 10.72 22-Feb-19 6,000.0 6,000.0 10,500.0 7,600.0 8,100.0 44,501.0 - 2,091.0 20,409.0 - 9.87 10.73 1-Mar-19 3,000.0 6,000.0 15,000.0 3,765.0 9,270.0 50,346.0 - - 24,000.0 - - 10.67 8-Mar-19 4,000.0 6,000.0 14,000.0 4,800.0 9,300.0 60,258.0 - - 24,000.0 - - 10.64
15-Mar-19 3,000.0 5,000.0 16,000.0 4,000.0 6,700.0 51,332.0 1,520.0 485.0 21,995.0 9.55 9.87 10.58 22-Mar-19 2,000.0 2,000.0 20,000.0 4,900.0 5,000.0 56,837.0 2,000.0 2,000.0 20,000.0 9.49 9.79 10.52 29-Mar-19 2,500.0 2,500.0 20,000.0 5,700.0 5,700.0 74,687.0 2,500.0 2,500.0 20,000.0 9.39 9.67 10.40
5-Apr-19 4,000.0 4,000.0 20,000.0 9,400.0 9,852.0 87,055.0 4,000.0 4,000.0 20,000.0 9.24 9.50 10.15 12-Apr-19 5,000.0 5,000.0 15,000.0 11,550.0 13,105.0 53,772.0 5,000.0 5,000.0 15,000.0 9.09 9.29 9.99 19-Apr-19 4,000.0 5,000.0 15,000.0 9,400.0 11,604.0 54,953.0 4,000.0 5,000.0 15,000.0 9.00 9.19 9.91 26-Apr-19 4,000.0 5,000.0 16,000.0 8,400.0 10,500.0 45,282.0 4,000.0 5,000.0 16,000.0 8.94 9.14 9.91 3-May-19 3,000.0 6,000.0 18,000.0 6,650.0 12,793.0 67,931.0 3,000.0 6,000.0 18,000.0 8.89 9.09 9.81
10-May-19 4,000.0 4,000.0 14,000.0 9,822.0 13,558.0 85,713.0 4,000.0 4,000.0 14,000.0 8.51 9.00 9.44 17-May-19 4,000.0 4,000.0 13,000.0 8,400.0 14,815.0 58,310.0 4,000.0 4,000.0 13,000.0 8.52 8.88 9.18 24-May-19 2,500.0 4,500.0 13,000.0 5,352.0 15,583.0 60,152.0 - 4,500.0 15,500.0 - 8.71 8.90 31-May-19 2,000.0 4,000.0 14,000.0 4,352.0 15,823.0 28,954.0 - 6,000.0 14,000.0 - 8.63 8.88
7-Jun-19 2,000.0 4,000.0 14,000.0 4,300.0 13,950.0 30,777.0 2,333.0 10,440.0 7,227.0 8.38 8.63 8.88 14-Jun-19 3,000.0 5,000.0 11,000.0 9,550.0 20,266.0 22,900.0 6,800.0 10,934.0 - 8.38 8.63 - 21-Jun-19 6,000.0 4,000.0 9,000.0 16,850.0 18,755.0 25,665.0 6,000.0 4,000.0 9,000.0 8.38 8.60 8.86 28-Jun-19 3,000.0 5,000.0 8,500.0 12,500.0 20,820.0 47,205.0 3,000.0 5,000.0 8,500.0 8.24 8.49 8.70
5-Jul-19 7,500.0 3,500.0 12,000.0 18,687.0 13,050.0 30,820.0 7,500.0 3,500.0 12,000.0 8.17 8.32 8.59 12-Jul-19 3,000.0 5,000.0 14,500.0 17,850.0 20,975.0 44,050.0 3,000.0 5,000.0 14,500.0 8.09 8.21 8.54 19-Jul-19 3,000.0 4,000.0 16,500.0 13,820.0 17,475.0 40,900.0 3,000.0 4,000.0 16,500.0 7.99 8.09 8.46 26-Jul-19 3,000.0 4,000.0 18,000.0 13,805.0 16,952.0 47,378.0 3,000.0 4,000.0 18,000.0 7.89 7.96 8.38 2-Aug-19 6,500.0 2,500.0 13,000.0 12,896.0 4,616.0 42,716.0 6,500.0 1,166.0 14,334.0 7.85 7.94 8.21 9-Aug-19 2,500.0 1,500.0 14,500.0 6,700.0 4,087.0 29,310.0 2,500.0 1,500.0 14,500.0 7.75 7.85 8.11
16-Aug-19 4,000.0 2,000.0 16,000.0 6,600.0 2,620.0 23,115.0 2,687.0 - 16,000.0 7.80 - 8.17 23-Aug-19 1,500.0 1,500.0 15,000.0 3,103.0 2,700.0 28,350.0 1,610.0 1,542.0 14,848.0 7.84 7.89 8.31 30-Aug-19 1,000.0 1,000.0 10,500.0 5,802.0 4,086.0 27,100.0 1,000.0 1,000.0 10,500.0 7.63 7.70 8.22
6-Sep-19 1,000.0 1,000.0 13,000.0 3,204.0 2,204.0 26,700.0 - - 15,000.0 - - 8.33 13-Sep-19 1,000.0 2,000.0 19,000.0 6,505.0 9,304.0 33,250.0 2,592.0 7,300.0 12,108.0 7.61 7.75 8.36 20-Sep-19 2,000.0 1,000.0 5,500.0 6,100.0 5,104.0 17,458.0 - - 8,500.0 - - 8.41 27-Sep-19 5,000.0 3,000.0 12,000.0 14,247.0 9,200.0 26,202.0 7,848.0 5,144.0 7,008.0 7.62 7.75 8.41 4-Oct-19 2,500.0 1,000.0 8,500.0 9,500.0 5,104.0 24,314.0 4,000.0 2,483.0 5,517.0 7.60 7.73 8.41
11-Oct-19 1,500.0 8,000.0 12,000.0 5,500.0 16,052.0 28,415.0 1,500.0 8,000.0 12,000.0 7.58 7.73 8.41 18-Oct-19 3,000.0 6,500.0 12,500.0 5,500.0 15,058.0 36,352.0 2,250.0 3,825.0 15,925.0 7.56 7.69 8.35 25-Oct-19 1,000.0 6,000.0 15,000.0 6,301.0 15,311.0 27,200.0 1,000.0 7,200.0 13,800.0 7.50 7.66 8.34 1-Nov-19 1,500.0 3,000.0 11,500.0 5,912.0 10,533.0 17,590.0 4,407.0 6,807.0 4,786.0 7.49 7.65 8.35 8-Nov-19 2,000.0 8,000.0 10,000.0 7,414.0 15,208.0 14,500.0 5,773.0 7,438.0 6,789.0 7.49 7.67 8.41
15-Nov-19 4,000.0 8,000.0 8,000.0 9,204.0 8,904.0 13,940.0 6,454.0 - 11,790.0 7.56 - 8.51 22-Nov-19 4,000.0 5,000.0 10,000.0 8,702.0 8,878.0 60,555.0 1,195.0 1,500.0 16,305.0 7.47 7.58 8.22 29-Nov-19 1,000.0 9,000.0 18,000.0 5,777.0 14,853.0 41,137.0 2,846.0 4,436.0 20,718.0 7.45 7.67 8.29
6-Dec-19 1,000.0 7,500.0 15,000.0 3,621.0 14,424.0 37,065.0 1,250.0 6,250.0 16,000.0 7.45 7.60 8.22 13-Dec-19 1,000.0 12,000.0 14,000.0 4,198.0 23,338.0 24,460.0 3,387.0 13,992.0 9,621.0 7.45 7.65 8.23 20-Dec-19 2,500.0 10,000.0 12,500.0 3,311.0 14,126.0 23,390.0 511.0 3,884.0 13,614.0 7.51 7.97 8.45 27-Dec-19 1,000.0 5,000.0 7,500.0 7,072.0 19,762.0 16,392.0 1,315.0 10,985.0 1,200.0 7.51 8.02 8.45
Source: Central Bank of Sri Lanka

PUBLIC DEBT MANAGEMENT IN SRI LANKA – 201970
COST OF BORROWINGTABLE 26 SRI LANKA DEVELOPMENT BONDS AUCTIONS IN 2019
Date of Issue
Amount Accepted (USD million)
Maturity Period (Years)
Spread Date of Issue
Amount Accepted (USD
million)
Maturity Period (Years)
Spread
30-Jan-19 1.00 1 2.35 24-May-19 0.30 2 5.6530-Jan-19 1.00 1 2.45 24-May-19 0.30 2 5.7030-Jan-19 2.00 1 2.50 24-May-19 0.07 2 5.8030-Jan-19 3.00 1 2.55 24-May-19 5.00 2 5.8830-Jan-19 4.00 1 2.60 24-May-19 0.25 2 5.9030-Jan-19 9.00 1 2.65 24-May-19 5.00 2 5.9230-Jan-19 14.00 1 2.70 24-May-19 2.25 2 5.9530-Jan-19 8.00 1 2.90 24-May-19 2.27 2 6.0030-Jan-19 3.00 1 3.10 24-May-19 2.25 2 6.0530-Jan-19 1.00 1 3.15 24-May-19 0.20 2 3.4030-Jan-19 1.00 1 3.30 24-May-19 0.20 2 3.4530-Jan-19 10.00 1 3.40 24-May-19 7.20 2 3.5030-Jan-19 5.00 1 3.65 24-May-19 2.20 2 3.5530-Jan-19 1.00 1 3.75 24-May-19 0.20 2 3.6030-Jan-19 5.00 1 3.90 24-May-19 2.00 2 3.6530-Jan-19 0.50 1 4.00 24-May-19 2.00 2 5.5030-Jan-19 15.00 1 4.10 24-May-19 2.00 2 5.6030-Jan-19 5.00 1 4.15 24-May-19 2.00 2 5.6530-Jan-19 5.00 1 4.30 24-May-19 2.00 2 5.7030-Jan-19 10.00 1 4.40 24-May-19 5.30 2 5.9530-Jan-19 5.00 1 5.65 24-May-19 5.00 2 5.9730-Jan-19 5.30 1 5.75 24-May-19 10.00 2 5.9930-Jan-19 5.35 1 5.80 24-May-19 2.50 2 2.9530-Jan-19 0.35 1 5.85 24-May-19 7.50 2 3.0030-Jan-19 0.35 1 5.90 24-May-19 2.50 2 3.0530-Jan-19 0.35 1 5.95 24-May-19 7.50 2 3.1030-Jan-19 7.35 1 6.00 24-May-19 2.50 2 3.1530-Jan-19 1.00 2 2.55 24-May-19 2.50 2 3.2030-Jan-19 0.50 2 3.00 24-May-19 5.00 2 3.2530-Jan-19 5.01 2 3.25 24-May-19 1.00 2 3.5030-Jan-19 2.00 2 3.35 24-May-19 0.10 2 3.6530-Jan-19 5.02 2 3.40 24-May-19 0.10 2 3.7030-Jan-19 2.00 2 3.50 24-May-19 5.10 2 3.7530-Jan-19 1.00 2 3.90 24-May-19 2.50 3 3.1030-Jan-19 0.60 2 5.75 24-May-19 2.50 3 3.1530-Jan-19 1.00 3 2.90 24-May-19 2.50 3 3.2030-Jan-19 2.00 3 3.35 24-May-19 2.50 3 3.2530-Jan-19 2.00 3 3.45 24-May-19 2.50 3 3.3530-Jan-19 2.00 3 3.50 24-May-19 2.50 3 3.4030-Jan-19 2.00 3 3.55 24-May-19 2.50 3 3.4530-Jan-19 1.00 3 3.60 24-May-19 2.50 3 3.5030-Jan-19 1.00 3 3.65 24-May-19 2.50 3 3.5530-Jan-19 1.00 3 3.75 24-May-19 2.50 3 3.6030-Jan-19 1.00 3 4.00 24-May-19 6.00 3 3.6530-Jan-19 0.10 3 6.25 24-May-19 0.10 3 3.8030-Jan-19 0.20 3 6.30 24-May-19 5.10 3 3.9030-Jan-19 0.10 3 6.35 24-May-19 5.00 4 3.6030-Jan-19 0.65 4 3.15 24-May-19 2.50 4 3.7030-Jan-19 2.00 4 3.60 24-May-19 2.50 4 3.7530-Jan-19 2.00 4 3.70 24-May-19 2.50 4 3.8030-Jan-19 2.00 4 3.75 24-May-19 2.50 4 3.9030-Jan-19 2.00 4 3.80 24-May-19 2.50 4 3.9530-Jan-19 1.00 4 3.85 24-May-19 2.50 4 4.0030-Jan-19 6.00 4 3.95 24-May-19 2.50 4 4.0530-Jan-19 2.00 4 4.00 24-May-19 7.50 4 4.1030-Jan-19 2.00 4 4.20 24-May-19 2.50 4 4.1530-Jan-19 2.00 4 4.25 24-May-19 2.50 4 4.20
Source: Central Bank of Sri Lanka

PUBLIC DEBT MANAGEMENT IN SRI LANKA – 2019 71
SECONDARY MARKET OPERATIONSTABLE 27SECONDARY MARKET TRANSACTIONS AS REPORTED BY PRIMARY DEALERS
Rs.million2012 2013 2014 2015 2016 2017 2018 2019 (a)
1. Outright Transactions 1,584,095 2,070,161 3,839,729 3,600,294 2,872,317 2,024,446 1,994,100 2,690,8951.1. Treasury Bills
Purchased 374,597 345,516 322,216 228,769 299,261 362,496 319,689 596,981 Sold 672,438 683,458 710,446 689,602 554,792 546,045 534,508 523,950 Total 1,047,035 1,028,973 1,032,662 918,371 854,053 908,541 854,197 1,120,931
1.2. Treasury Bonds Purchased 259,999 509,585 1,370,621 1,181,621 885,600 468,991 511,038 758,764 Sold 277,061 531,603 1,436,446 1,500,302 1,132,664 646,914 628,865 811,200 Total 537,060 1,041,187 2,807,067 2,681,923 2,018,264 1,115,905 1,139,903 1,569,964
2. Repurchase Transactions 6,246,422 10,235,395 8,223,558 11,763,524 18,095,909 13,611,491 12,138,303 10,206,9182.1. Treasury Bills
Repo 1,510,151 2,078,440 1,319,875 2,294,059 2,983,674 2,101,970 1,843,858 1,256,292 Reverse Repo 219,855 650,290 436,778 794,382 474,593 140,844 69,669 47,200 Total 1,730,006 2,728,731 1,756,653 3,088,441 3,458,267 2,242,814 1,913,527 1,303,492
2.2 Treasury bonds Repo 3,989,074 6,761,249 5,409,509 6,720,895 9,321,832 7,428,325 8,089,681 7,548,481 Reverse Repo 527,341 745,416 1,057,396 1,954,188 5,315,810 3,940,352 2,135,095 1,354,945 Total 4,516,416 7,506,664 6,466,905 8,675,083 14,637,642 11,368,677 10,224,776 8,903,426
3. Total Transactions 7,830,517 12,305,556 12,063,287 15,363,818 20,968,226 15,635,937 14,132,403 12,897,813 (a) Provisional Source: Central Bank of Sri Lanka
SECONDARY MARKET OPERATIONS
TABLE 28
SECONDARY MARKET TRANSACTIONS RECORDED IN THE LANKASECURE (a)
Rs. million
2015 2016 2017 2018 2019
1 Treasury bills
1.1 Outright Purchases / Sales 1,357,827 1,397,399 1,030,508 1,050,040 895,740
1.2 Repo / Rev. Repo 8,731,226 8,682,167 10,370,688 7,493,916 8,824,859
Total 10,089,053 10,079,566 11,401,196 8,543,956 9,720,598
2 Treasury bonds
2.1 Outright Purchases / Sales 4,020,581 4,402,623 3,603,279 5,278,590 6,518,022
2.2 Repo / Rev. Repo 34,385,232 42,288,083 33,571,531 31,184,585 23,303,763
Total 38,405,813 46,690,706 37,174,809 36,463,175 29,821,784
Total Transactions 48,494,866 56,770,272 48,576,005 45,007,131 39,542,382
(a) Note: Source: Central Bank of Sri Lanka
- All transactions have been recorded in the LankaSecure System in Face Value basis
- Accuracy of the information is subject to the accuracy of the data recorded by the system participants in the LankaSecure System