public disclosure authorized debt report...
TRANSCRIPT
DEBT REPORT
2020 EDITION I
January 2020
--
Pub
lic D
iscl
osur
e A
utho
rized
Pub
lic D
iscl
osur
e A
utho
rized
Pub
lic D
iscl
osur
e A
utho
rized
Pub
lic D
iscl
osur
e A
utho
rized

1
DEBT Report 2020
About the Report
This is the first of a new series of Debt Reports for 2020 to be published online, at regular intervals,
over the course of the year. Their aim is to provide users with analyses of evolving trends and developments
related to external debt and public debt in individual countries and regional groups, with primary emphasis
on low- and middle-income countries, and to keep users abreast of debt-related issues and initiatives.
The reports will:
• Complement the summary overview of borrowing trends in 122 low- and middle-income
countries presented in International Debt Statistics (IDS 2020), published in October 2019
with regional and country specific analyses on the composition and characteristics of
external debt stocks and flows. The analyses will be underpinned by the detailed loan-by-
loan data on stocks, transactions (commitments, disbursements and debt service payments)
and loan terms captured by the World Bank Debtor Reporting System (DRS);
• Draw from the high-frequency, Quarterly External Debt Statistics (QEDS) and quarterly
Public Debt Statistics (PSDS) databases to provide users with syntheses of emergent trends
in external and public debt, including borrowing patterns and current debt levels in both
high-income countries and low- and middle-income countries;
• Provide users with information briefs on current issues and ongoing initiatives aimed at
improving external and public debt measurement and monitoring, filling data gaps, and
enhancing the coverage and harmonization of international datasets and related data
dissemination.
Debt Report Edition I presents an overview of the evolution of external debt stocks and net financial
flows (debt and equity) from the regional perspective and draws out the main messages from the regional
and country specific data available to users at https://data.worldbank.org/products/ids.
2
Regional Overview 2018
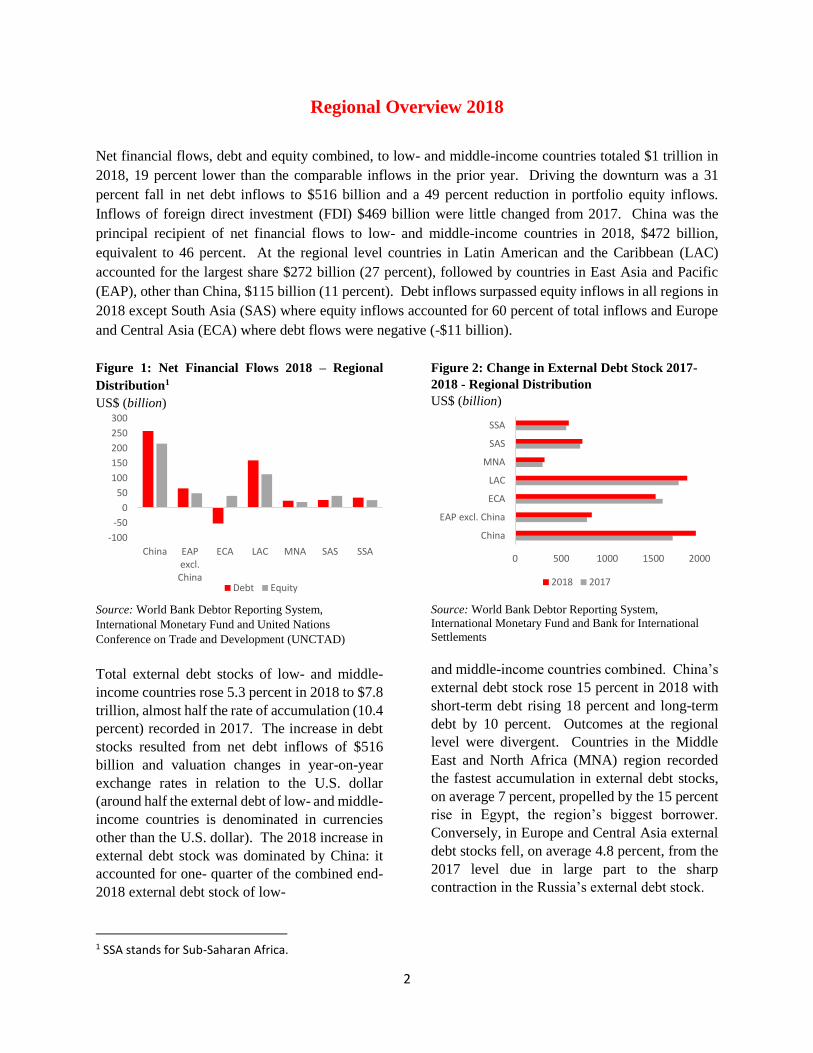
Net financial flows, debt and equity combined, to low- and middle-income countries totaled $1 trillion in
2018, 19 percent lower than the comparable inflows in the prior year. Driving the downturn was a 31
percent fall in net debt inflows to $516 billion and a 49 percent reduction in portfolio equity inflows.
Inflows of foreign direct investment (FDI) $469 billion were little changed from 2017. China was the
principal recipient of net financial flows to low- and middle-income countries in 2018, $472 billion,
equivalent to 46 percent. At the regional level countries in Latin American and the Caribbean (LAC)
accounted for the largest share $272 billion (27 percent), followed by countries in East Asia and Pacific
(EAP), other than China, $115 billion (11 percent). Debt inflows surpassed equity inflows in all regions in
2018 except South Asia (SAS) where equity inflows accounted for 60 percent of total inflows and Europe
and Central Asia (ECA) where debt flows were negative (-$11 billion).
Figure 1: Net Financial Flows 2018 – Regional
Distribution1
US$ (billion)
Source: World Bank Debtor Reporting System,
International Monetary Fund and United Nations
Conference on Trade and Development (UNCTAD)
Total external debt stocks of low- and middle-
income countries rose 5.3 percent in 2018 to $7.8
trillion, almost half the rate of accumulation (10.4
percent) recorded in 2017. The increase in debt
stocks resulted from net debt inflows of $516
billion and valuation changes in year-on-year
exchange rates in relation to the U.S. dollar
(around half the external debt of low- and middle-
income countries is denominated in currencies
other than the U.S. dollar). The 2018 increase in
external debt stock was dominated by China: it
accounted for one- quarter of the combined end-
2018 external debt stock of low-
Figure 2: Change in External Debt Stock 2017-
2018 - Regional Distribution
US$ (billion)
Source: World Bank Debtor Reporting System,
International Monetary Fund and Bank for International
Settlements
and middle-income countries combined. China’s
external debt stock rose 15 percent in 2018 with
short-term debt rising 18 percent and long-term
debt by 10 percent. Outcomes at the regional
level were divergent. Countries in the Middle
East and North Africa (MNA) region recorded
the fastest accumulation in external debt stocks,
on average 7 percent, propelled by the 15 percent
rise in Egypt, the region’s biggest borrower.
Conversely, in Europe and Central Asia external
debt stocks fell, on average 4.8 percent, from the
2017 level due in large part to the sharp
contraction in the Russia’s external debt stock.
1 SSA stands for Sub-Saharan Africa.
-100
-50
0
50
100
150
200
250
300
China EAPexcl.
China
ECA LAC MNA SAS SSA
Debt Equity
0 500 1000 1500 2000
China
EAP excl. China
ECA
LAC
MNA
SAS
SSA
2018 2017
3
East Asia and Pacific
Net financial flows totaled $587 billion in 2018, a 5 percent decline from the prior year with increased
equity inflows largely offsetting a contraction in net debt inflows. But outcomes were dictated by China
and, on average, for other countries in the region, net financial inflows fell on average 12 percent reflecting
a downturn in both debt and equity inflows.
Table 1: External Debt Stock and Net Financial Flows, East Asia and Pacific, 2009-2018 US$ (billion)
2009 2010 2011 2012 2013 2014 2015 2016 2017 2018
External debt stocks 822 1,183 1,546 1,728 2,091 2,435 2,000 2,117 2,491 2,794
Net financial flows, debt and equity 274 662 657 468 720 606 -104 274 621 587
Percent of GNI (%) 4 8 7 4 6 4 -1 2 4 4
Net Debt Inflows 83 358 367 174 382 297 -368 53 391 323
Long-term 15 51 100 130 90 138 63 70 135 138
Official creditors 5 2 3 3 2 4 2 3 3 5
Bilateral -1 -2 1 0 0 2 -3 -1 0 0
Multilateral 6 4 2 3 2 3 6 4 4 5
World Bank (IBRD and IDA) 2 3 1 1 2 2 3 2 2 2
IMF 0 0 0 0 0 0 0 0 0 0
Other multilateral 3 1 1 2 0 1 3 2 1 3
Private creditors 10 49 97 127 88 133 61 67 132 133
Bonds 13 9 37 76 41 61 25 38 113 99
Banks and other private -3 40 61 51 46 73 36 29 19 34
Short-term 68 307 266 44 292 159 -432 -17 256 185
Net equity flows 191 304 290 294 337 310 265 221 230 264
Net FDI inflows 151 265 283 259 309 259 261 197 195 215
Net portfolio equity inflows 40 40 7 35 29 51 4 24 35 49
Source: World Bank Debtor Reporting System, International Monetary Fund, and Bank for International Settlement.
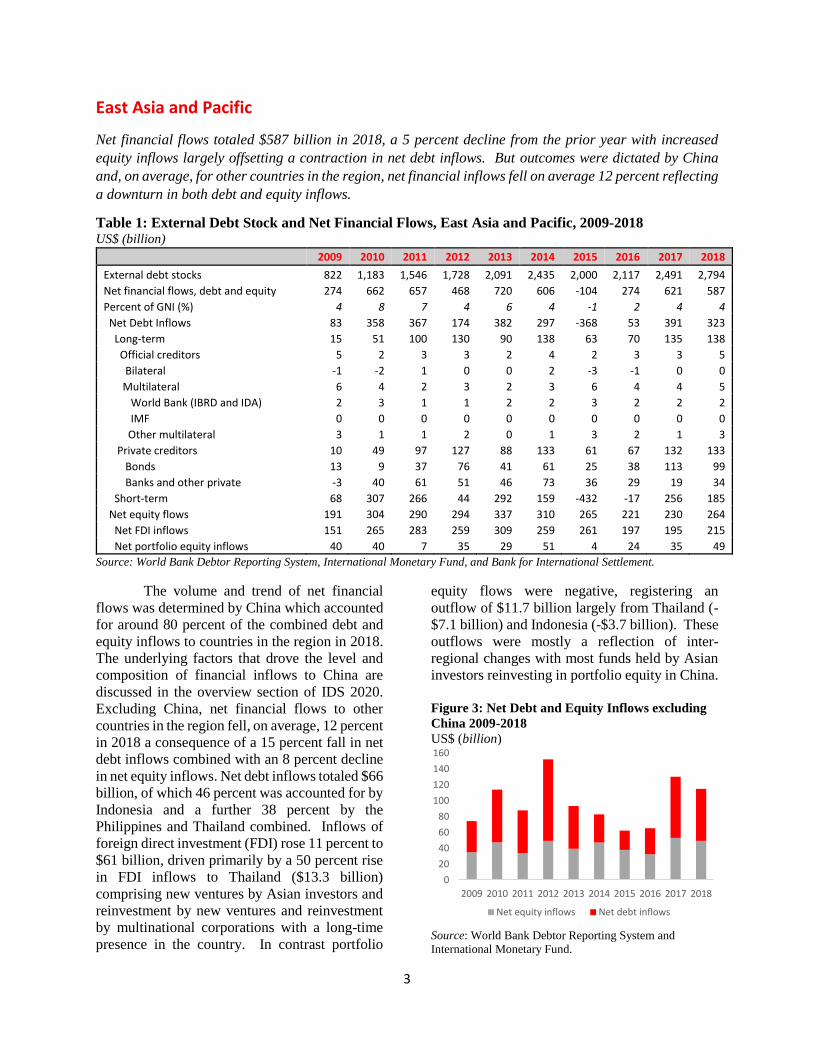
The volume and trend of net financial
flows was determined by China which accounted
for around 80 percent of the combined debt and
equity inflows to countries in the region in 2018.
The underlying factors that drove the level and
composition of financial inflows to China are
discussed in the overview section of IDS 2020.
Excluding China, net financial flows to other
countries in the region fell, on average, 12 percent
in 2018 a consequence of a 15 percent fall in net
debt inflows combined with an 8 percent decline
in net equity inflows. Net debt inflows totaled $66
billion, of which 46 percent was accounted for by
Indonesia and a further 38 percent by the
Philippines and Thailand combined. Inflows of
foreign direct investment (FDI) rose 11 percent to
$61 billion, driven primarily by a 50 percent rise
in FDI inflows to Thailand ($13.3 billion)
comprising new ventures by Asian investors and
reinvestment by new ventures and reinvestment
by multinational corporations with a long-time
presence in the country. In contrast portfolio
equity flows were negative, registering an
outflow of $11.7 billion largely from Thailand (-
$7.1 billion) and Indonesia (-$3.7 billion). These
outflows were mostly a reflection of inter-
regional changes with most funds held by Asian
investors reinvesting in portfolio equity in China.
Figure 3: Net Debt and Equity Inflows excluding
China 2009-2018
US$ (billion)
Source: World Bank Debtor Reporting System and
International Monetary Fund.
0
20
40
60
80
100
120
140
160
2009 2010 2011 2012 2013 2014 2015 2016 2017 2018
Net equity inflows Net debt inflows
4
Net debt inflows to the region fell 17
percent in 2018 with a marginal 2 percent rise in
long-term debt inflows offset by a 28 percent fall
in net short-term debt flows, an outcome driven
by a combination of a contraction in net short-
debt inflows to China to $188 billion, ($229
billion in 2017), and an outflow of -U.S. 3 billion
to other countries in the region, a marked
turnaround from the $27 billion inflow in 2017.
Excluding China, long-term debt inflows to the
region rose 38 percent to $69 billion, underpinned
by a doubling of net inflows from private
creditors and a 61 percent rise in inflows from
official creditors, mostly from multilateral
institutions to $6.6 billion. Despite this increase
official creditors’ share of long-term debt inflows
remained moderate, 10 percent.
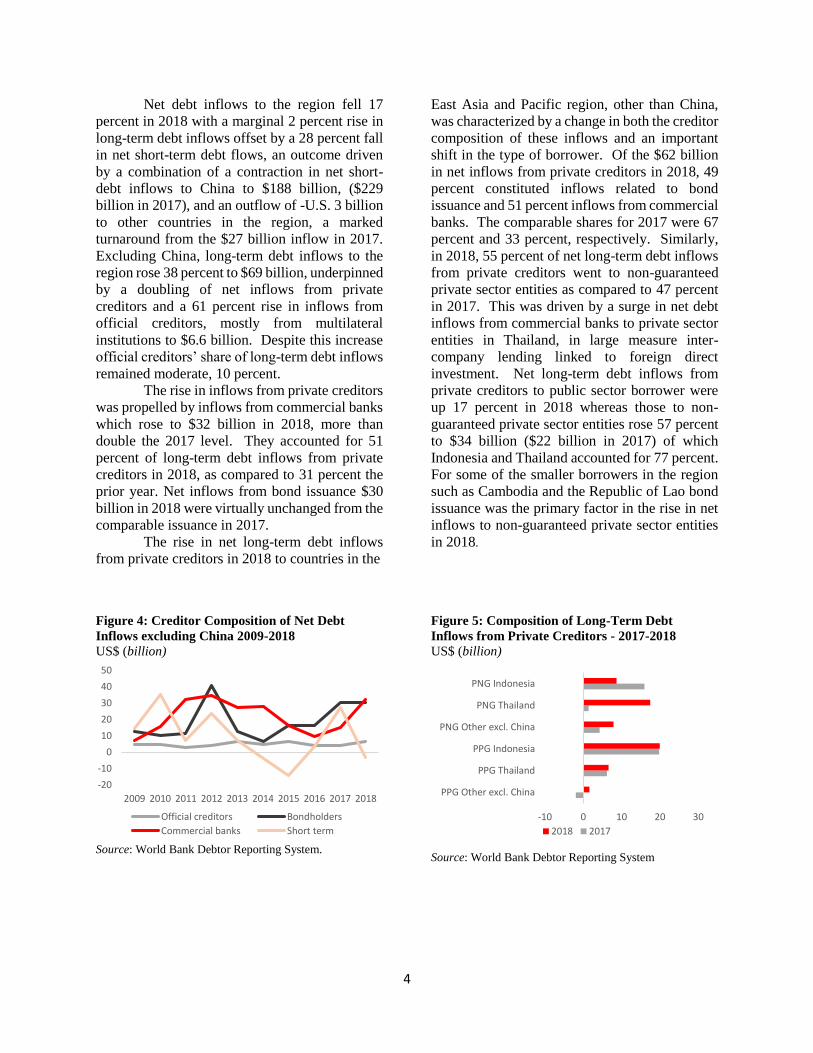
The rise in inflows from private creditors
was propelled by inflows from commercial banks
which rose to $32 billion in 2018, more than
double the 2017 level. They accounted for 51
percent of long-term debt inflows from private
creditors in 2018, as compared to 31 percent the
prior year. Net inflows from bond issuance $30
billion in 2018 were virtually unchanged from the
comparable issuance in 2017.
The rise in net long-term debt inflows
from private creditors in 2018 to countries in the
Figure 4: Creditor Composition of Net Debt
Inflows excluding China 2009-2018
US$ (billion)
Source: World Bank Debtor Reporting System.
East Asia and Pacific region, other than China,
was characterized by a change in both the creditor
composition of these inflows and an important
shift in the type of borrower. Of the $62 billion
in net inflows from private creditors in 2018, 49
percent constituted inflows related to bond
issuance and 51 percent inflows from commercial
banks. The comparable shares for 2017 were 67
percent and 33 percent, respectively. Similarly,
in 2018, 55 percent of net long-term debt inflows
from private creditors went to non-guaranteed
private sector entities as compared to 47 percent
in 2017. This was driven by a surge in net debt
inflows from commercial banks to private sector
entities in Thailand, in large measure inter-
company lending linked to foreign direct
investment. Net long-term debt inflows from
private creditors to public sector borrower were
up 17 percent in 2018 whereas those to non-
guaranteed private sector entities rose 57 percent
to $34 billion ($22 billion in 2017) of which
Indonesia and Thailand accounted for 77 percent.
For some of the smaller borrowers in the region
such as Cambodia and the Republic of Lao bond
issuance was the primary factor in the rise in net
inflows to non-guaranteed private sector entities
in 2018.
Figure 5: Composition of Long-Term Debt
Inflows from Private Creditors - 2017-2018
US$ (billion)
Source: World Bank Debtor Reporting System
-20
-10
0
10
20
30
40
50
2009 2010 2011 2012 2013 2014 2015 2016 2017 2018
Official creditors Bondholders
Commercial banks Short term
-10 0 10 20 30
PPG Other excl. China
PPG Thailand
PPG Indonesia
PNG Other excl. China
PNG Thailand
PNG Indonesia
2018 2017
5
Europe and Central Asia
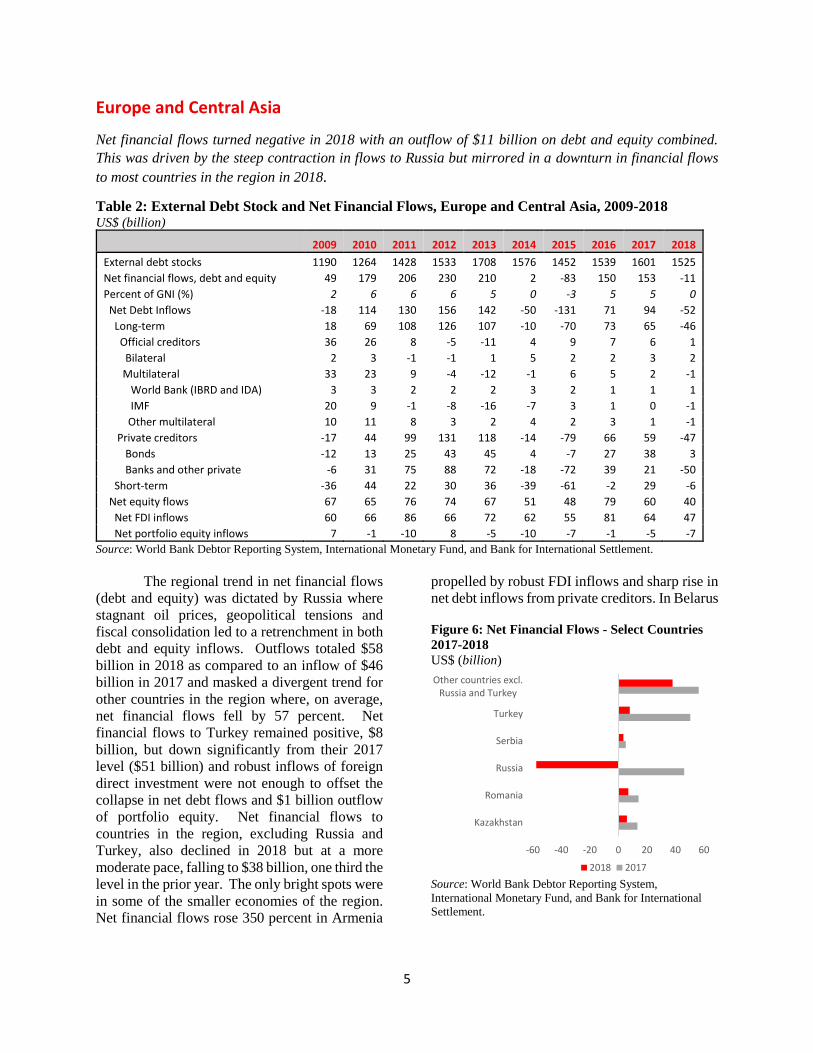
Net financial flows turned negative in 2018 with an outflow of $11 billion on debt and equity combined.
This was driven by the steep contraction in flows to Russia but mirrored in a downturn in financial flows
to most countries in the region in 2018.
Table 2: External Debt Stock and Net Financial Flows, Europe and Central Asia, 2009-2018 US$ (billion)
2009 2010 2011 2012 2013 2014 2015 2016 2017 2018
External debt stocks 1190 1264 1428 1533 1708 1576 1452 1539 1601 1525
Net financial flows, debt and equity 49 179 206 230 210 2 -83 150 153 -11
Percent of GNI (%) 2 6 6 6 5 0 -3 5 5 0
Net Debt Inflows -18 114 130 156 142 -50 -131 71 94 -52
Long-term 18 69 108 126 107 -10 -70 73 65 -46
Official creditors 36 26 8 -5 -11 4 9 7 6 1
Bilateral 2 3 -1 -1 1 5 2 2 3 2
Multilateral 33 23 9 -4 -12 -1 6 5 2 -1
World Bank (IBRD and IDA) 3 3 2 2 2 3 2 1 1 1
IMF 20 9 -1 -8 -16 -7 3 1 0 -1
Other multilateral 10 11 8 3 2 4 2 3 1 -1
Private creditors -17 44 99 131 118 -14 -79 66 59 -47
Bonds -12 13 25 43 45 4 -7 27 38 3
Banks and other private -6 31 75 88 72 -18 -72 39 21 -50
Short-term -36 44 22 30 36 -39 -61 -2 29 -6
Net equity flows 67 65 76 74 67 51 48 79 60 40
Net FDI inflows 60 66 86 66 72 62 55 81 64 47
Net portfolio equity inflows 7 -1 -10 8 -5 -10 -7 -1 -5 -7
Source: World Bank Debtor Reporting System, International Monetary Fund, and Bank for International Settlement.
The regional trend in net financial flows
(debt and equity) was dictated by Russia where
stagnant oil prices, geopolitical tensions and
fiscal consolidation led to a retrenchment in both
debt and equity inflows. Outflows totaled $58
billion in 2018 as compared to an inflow of $46
billion in 2017 and masked a divergent trend for
other countries in the region where, on average,
net financial flows fell by 57 percent. Net
financial flows to Turkey remained positive, $8
billion, but down significantly from their 2017
level ($51 billion) and robust inflows of foreign
direct investment were not enough to offset the
collapse in net debt flows and $1 billion outflow
of portfolio equity. Net financial flows to
countries in the region, excluding Russia and
Turkey, also declined in 2018 but at a more
moderate pace, falling to $38 billion, one third the
level in the prior year. The only bright spots were
in some of the smaller economies of the region.
Net financial flows rose 350 percent in Armenia
propelled by robust FDI inflows and sharp rise in
net debt inflows from private creditors. In Belarus
Figure 6: Net Financial Flows - Select Countries
2017-2018
US$ (billion)
Source: World Bank Debtor Reporting System,
International Monetary Fund, and Bank for International
Settlement.
-60 -40 -20 0 20 40 60
Kazakhstan
Romania
Russia
Serbia
Turkey
Other countries excl.Russia and Turkey
2018 2017

6
they increased by 46 percent on account of
increased debt and equity inflows and in Bulgaria
they more than doubled as a result of strong FDI
inflows.
Net debt flows to the region turned
negative in 2018 with countries recording a
combined outflow of $52 billion, a marked
contrast to the $94 billion in debt inflows
recorded in 2017. Long-term debt outcomes were
largely dictated by Russia and specifically by the
much lower disbursements of new financing and
much higher principal repayments by public
sector borrowers resulted in an outflow on long-
term debt of $61 billion, as compared to an inflow
of $22 billion in 2017. Net debt flows to other
countries in the region were positive in 2018, $12
billion, but significantly below the comparable
figure of $66 billion for 2017. The primary
reason for this decline was the pronounced, $23
billion drop in net inflows from private creditors
and reversal in the direction of short-term debt
flows to an outflow of $3 billion, from an inflow
of $23 billion in 2017. In contrast to Russia most
of the fall in net inflows was accounted for by a
downward trajectory in commercial bank inflows
to private sector non-guaranteed entities across
the region. The contraction in short-term debt
was largely attributable to Turkey: it turned
negative in 2018, an outflow of $4 billion
compared to an $18 billion inflow in 2018. Short-
term debt flows were also negative in other
countries in the region in 2018, including
Romania and Ukraine.
Figure 7: Net Debt Inflows by Creditor Type
excluding Russia 2009-2018
US$ (billions)
Source: World Bank Debtor Reporting System
FDI inflows to Russia fell by $17 billion in 2018
in response to geopolitical concerns, sluggish
GDP growth and disinvestments (i.e. sale of
foreign affiliates to Russian investors).
Excluding Russia inflows to other countries were
$37 billion in 2018, unchanged from the prior
year but at the individual country level the picture
was mixed. Weak oil prices and declining rates
of return weighed heavily on oil exporters such as
Azerbaijan and Kazakhstan; both countries saw
FDI inflow fall to half the 2017 level due to a
downturn in investments in the oil and gas sector.
Conversely, FDI inflows to the region’s more
diversified economies proved resilient. Serbia
recorded the most significant increase, 82 percent
to $3 billion, facilitated by the country’s strategic
location and skilled labor force and it was a
similar story for Bulgaria which recorded a 40
percent increase in FDI inflows in 2018. Turkey
was the region’s largest recipient of FDI in 2018.
Inflows rose percent 18 percent to $12 billion,
despite slower than usual economic growth and
uncertainty surrounding the Turkish lira. The
$6.3 billion Star Refinery built by the National
Oil Company of Azerbaijan and one the largest
foreign investments in Turkey came on stream in
late 2018. Other important inflows in 2018 was
the acquisition of UN Ro-Ro Isletmeleri,
providers of deep-sea freight transport, by DFDS
Denmark.
Figure 8: Foreign Direct Investment - Select
Countries 2017-2018
US$ (billion)
Source: International Monetary Fund
(60)
(40)
(20)
-
20
40
60
80
2009 2010 2011 2012 2013 2014 2015 2016 2017 2018
Official creditorsPrivate creditorsShort-term
0 10 20 30
Bulgaria
Ukraine
Serbia
Romania
Turkey
Azerbaijan
Kazakhstan
Russia
2018 2017
7
Latin America and Caribbean
Net financial flows rose 11 percent in 2018 to $272 billion, their highest level since 2014, despite a 24
percent fall in net equity inflows. It was offset by increased net debt inflows which rose 63 percent to $159
billion driven in large part by the rescue package for Argentina and surge in short-term debt inflows.
Table 3: External Debt Stock and Net Financial Flows, Latin America & Caribbean, 2009-2018 US$ (billion)
2009 2010 2011 2012 2013 2014 2015 2016 2017 2018
External debt stocks 898 1064 1221 1361 1503 1657 1669 1693 1774 1868
Net financial flows, debt and equity 163 333 288 300 303 303 208 168 246 272
Percent of GNI (%) 4 7 5 6 6 5 4 4 5 6
Net Debt Inflows 61 173 140 147 170 177 88 43 98 159
Long-term 64 117 141 128 141 152 79 72 86 114
Official creditors 16 22 5 12 9 11 6 5 7 34
Bilateral 3 4 3 5 5 6 -2 -2 4 -3
Multilateral 13 18 2 7 4 6 8 6 3 37
World Bank (IBRD and IDA) 6 8 -3 4 3 2 3 2 -1 2
IMF 0 1 0 0 0 -1 0 0 0 29
Other multilateral 7 8 5 3 2 4 6 4 4 7
Private creditors 47 95 136 116 132 140 73 67 79 80
Bonds 42 67 81 78 69 64 26 52 71 36
Banks and other private 5 28 56 38 64 76 47 15 8 43
Short-term -3 56 -1 19 29 26 8 -29 12 45
Net equity flows 102 160 148 153 133 125 120 125 148 113
Net FDI inflows 61 120 145 138 121 107 106 104 129 118
Net portfolio equity inflows 41 40 3 15 12 19 14 21 20 -5
Source: World Bank Debtor Reporting System, International Monetary Fund, and Bank for International Settlement.
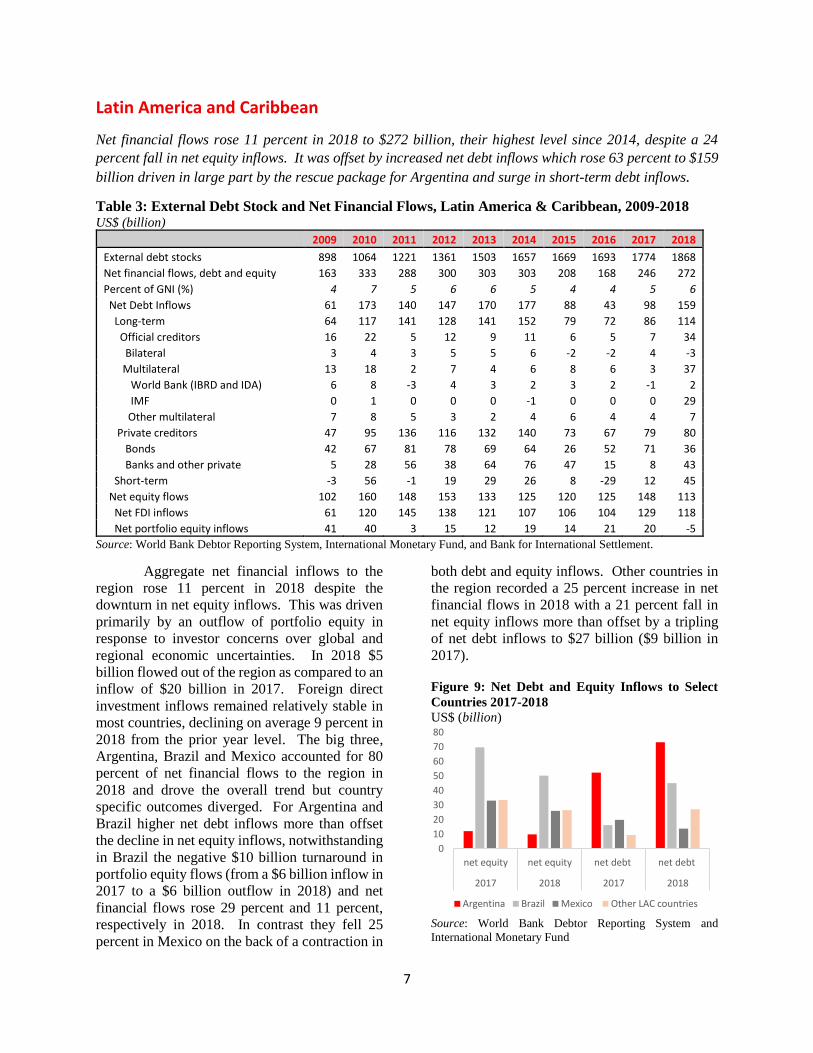
Aggregate net financial inflows to the
region rose 11 percent in 2018 despite the
downturn in net equity inflows. This was driven
primarily by an outflow of portfolio equity in
response to investor concerns over global and
regional economic uncertainties. In 2018 $5
billion flowed out of the region as compared to an
inflow of $20 billion in 2017. Foreign direct
investment inflows remained relatively stable in
most countries, declining on average 9 percent in
2018 from the prior year level. The big three,
Argentina, Brazil and Mexico accounted for 80
percent of net financial flows to the region in
2018 and drove the overall trend but country
specific outcomes diverged. For Argentina and
Brazil higher net debt inflows more than offset
the decline in net equity inflows, notwithstanding
in Brazil the negative $10 billion turnaround in
portfolio equity flows (from a $6 billion inflow in
2017 to a $6 billion outflow in 2018) and net
financial flows rose 29 percent and 11 percent,
respectively in 2018. In contrast they fell 25
percent in Mexico on the back of a contraction in
both debt and equity inflows. Other countries in
the region recorded a 25 percent increase in net
financial flows in 2018 with a 21 percent fall in
net equity inflows more than offset by a tripling
of net debt inflows to $27 billion ($9 billion in
2017).
Figure 9: Net Debt and Equity Inflows to Select
Countries 2017-2018
US$ (billion)
Source: World Bank Debtor Reporting System and
International Monetary Fund
0
10
20
30
40
50
60
70
80
net equity net equity net debt net debt
2017 2018 2017 2018
Argentina Brazil Mexico Other LAC countries
8
The 61 percent rise in net debt inflows in
2018 was accompanied by a change in
composition. Short-term debt inflow rose at a
much faster pace (275 percent) than long-term
debt (33 percent) reflecting a surge in flows to
Brazil and, to a lesser extent, Mexico. The
principal driver of the 33 percent increase in net
long-term debt inflows was the IMF $57 billion
bailout package for Argentina against which $29
billion was disbursed in 2018. It pushed
multilateral creditors share of net long-term debt
inflows to one third, from a negligible 3 percent
in 2017. Net inflows from private creditors ($80
billion) were static but characterized by a switch
in composition with the decline in net inflows
from bonds offset by a comparable increase in net
inflows from commercial banks. Underlying this
shift was the reduction in bond issuance, notably
by Brazil, where borrowers found opportunities
in the domestic market. The rise in inflows from
commercial banks was propelled by a surge in
those to private sector entities to $40 billion ($6
billion in 2017), often inter-company lending
associated with foreign direct investment.
Brazilian entities were the dominant factor,
accounting for 65 percent of total inflows but
Colombia and Peru also recorded a sizeable
increase in inflows in 2018, as compared to
outflows in 2017.
Figure 10: Composition of long-term net debt
inflows 2016-2018
US$ (billion)
Source: World Bank Debtor Reporting System
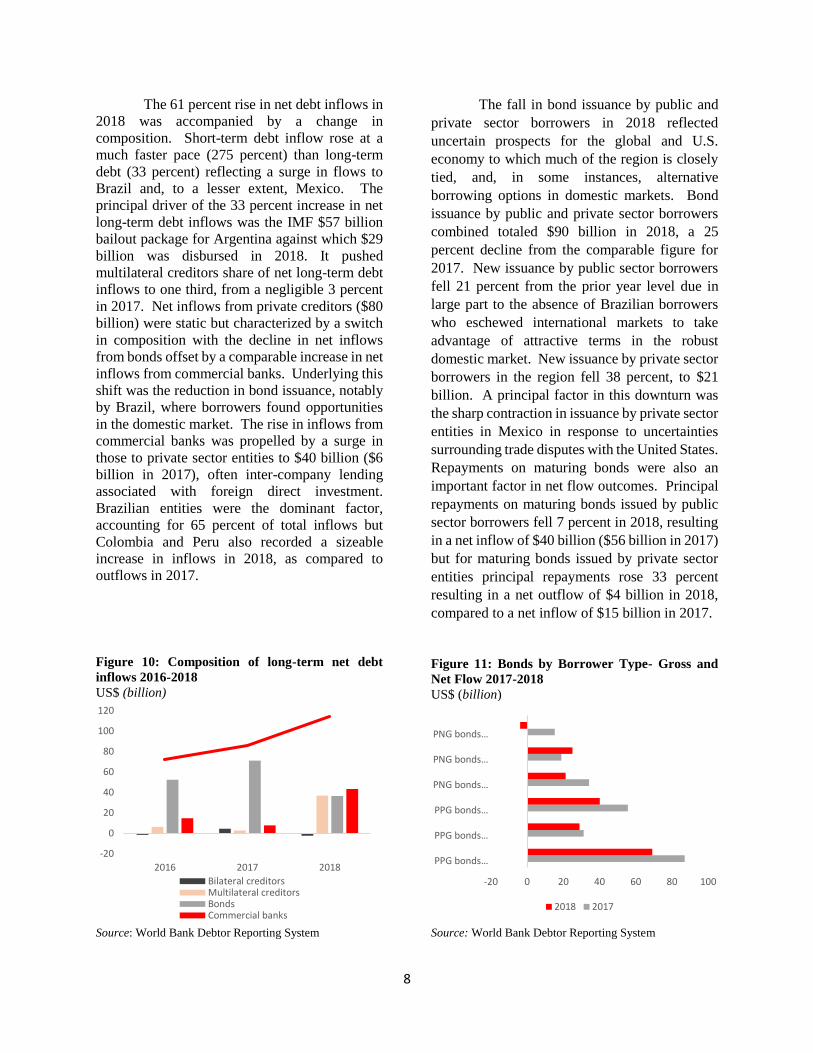
The fall in bond issuance by public and
private sector borrowers in 2018 reflected
uncertain prospects for the global and U.S.
economy to which much of the region is closely
tied, and, in some instances, alternative
borrowing options in domestic markets. Bond
issuance by public and private sector borrowers
combined totaled $90 billion in 2018, a 25
percent decline from the comparable figure for
2017. New issuance by public sector borrowers
fell 21 percent from the prior year level due in
large part to the absence of Brazilian borrowers
who eschewed international markets to take
advantage of attractive terms in the robust
domestic market. New issuance by private sector
borrowers in the region fell 38 percent, to $21
billion. A principal factor in this downturn was
the sharp contraction in issuance by private sector
entities in Mexico in response to uncertainties
surrounding trade disputes with the United States.
Repayments on maturing bonds were also an
important factor in net flow outcomes. Principal
repayments on maturing bonds issued by public
sector borrowers fell 7 percent in 2018, resulting
in a net inflow of $40 billion ($56 billion in 2017)
but for maturing bonds issued by private sector
entities principal repayments rose 33 percent
resulting in a net outflow of $4 billion in 2018,
compared to a net inflow of $15 billion in 2017.
Figure 11: Bonds by Borrower Type- Gross and
Net Flow 2017-2018
US$ (billion)
Source: World Bank Debtor Reporting System
-20
0
20
40
60
80
100
120
2016 2017 2018
Bilateral creditorsMultilateral creditorsBondsCommercial banks
-20 0 20 40 60 80 100
PPG bonds…
PPG bonds…
PPG bonds…
PNG bonds…
PNG bonds…
PNG bonds…
2018 2017
9
Middle East North Africa
Net financial flows US$43.8 billion in 2018 were little changed from the prior year but characterized by a
shift in composition of debt flows with a sharp decline in inflows from official creditors and outflow of
short-term debt offset by a 67 percent rise in long-term debt inflows from private creditors.
Table 4: External Debt Stock and Net Financial Flows, Middle East North Africa, 2009-2018 US$ (billion)
2009 2010 2011 2012 2013 2014 2015 2016 2017 2018
External debt stocks 182.9 192.2 191.9 200.7 223.5 225.5 239 267.6 299.5 320.7
Net financial flows, debt and equity 33.0 33.9 14.4 28.4 40.3 28.9 34.5 49.7 43.3 43.8
Percent of GNI (%) 3.3 2.9 1.1 2.0 3.1 2.2 2.9 4.0 3.7 ..
Net Debt Inflows 5.3 9.3 0.5 8.9 22.2 10.9 19.6 29.9 23.0 24.2
Long-term 2.1 4.4 1.2 12.3 20.3 6.6 18.4 19.2 21.8 27.3
Official creditors 2.5 1.3 1.0 4.7 10.3 2.6 8.3 15.9 9.0 5.7
Bilateral -0.9 -1.1 -1.5 1.8 6.8 -0.4 4.8 6.4 1.7 1.9
Multilateral 3.4 2.4 2.5 2.9 3.5 3.0 3.5 9.5 7.3 3.8
World Bank (IBRD and IDA) 0.9 0.8 0.9 0.7 1.1 0.8 1.8 2.3 2.5 2.5
IMF -0.1 .. .. 0.5 0.9 1.5 0.9 2.8 2.8 1.7
Other multilateral 2.6 1.6 1.6 1.7 1.5 0.7 0.8 4.4 2.0 -0.4
Private creditors -0.4 3.1 0.2 7.6 10.0 4.0 10.1 3.3 12.8 21.6
Bonds 0.1 3.2 -0.8 5.8 7.8 0.5 5.6 1.3 11.4 10.6
Banks and other private -0.5 -0.1 1.0 1.8 2.2 3.5 4.5 2.0 1.4 11.0
Short-term 3.2 4.9 -0.7 -3.4 1.9 4.3 1.2 10.7 1.2 -3.1
Net equity flows 27.7 24.6 13.9 19.5 18.1 18.0 14.9 19.8 20.3 19.6
Net FDI inflows 26.5 22.6 14.5 20.7 18.1 17.3 15.7 19.1 20.9 19.6
Net portfolio equity inflows 1.2 2.0 -0.6 -1.2 .. 0.7 -0.8 0.7 -0.6 ..
Source: World Bank Debtor Reporting System, International Monetary Fund, and Bank for International Settlement.
Net debt inflows to the region rose 5
percent in 2018 to $24.2 billion with a $3.1 billion
contraction in short-term debt inflows offset by a
25 percent increase in long-term debt inflows to
$27.3 billion (including the IMF), and
characterized by a shift in creditor composition.
Net inflows from official creditors fell 37 percent
in 2018, to $5.7 billion while those from private
creditors rose 67 percent to $21.6 billion, divided
broadly evenly between bond issuance and
financing from commercial banks.
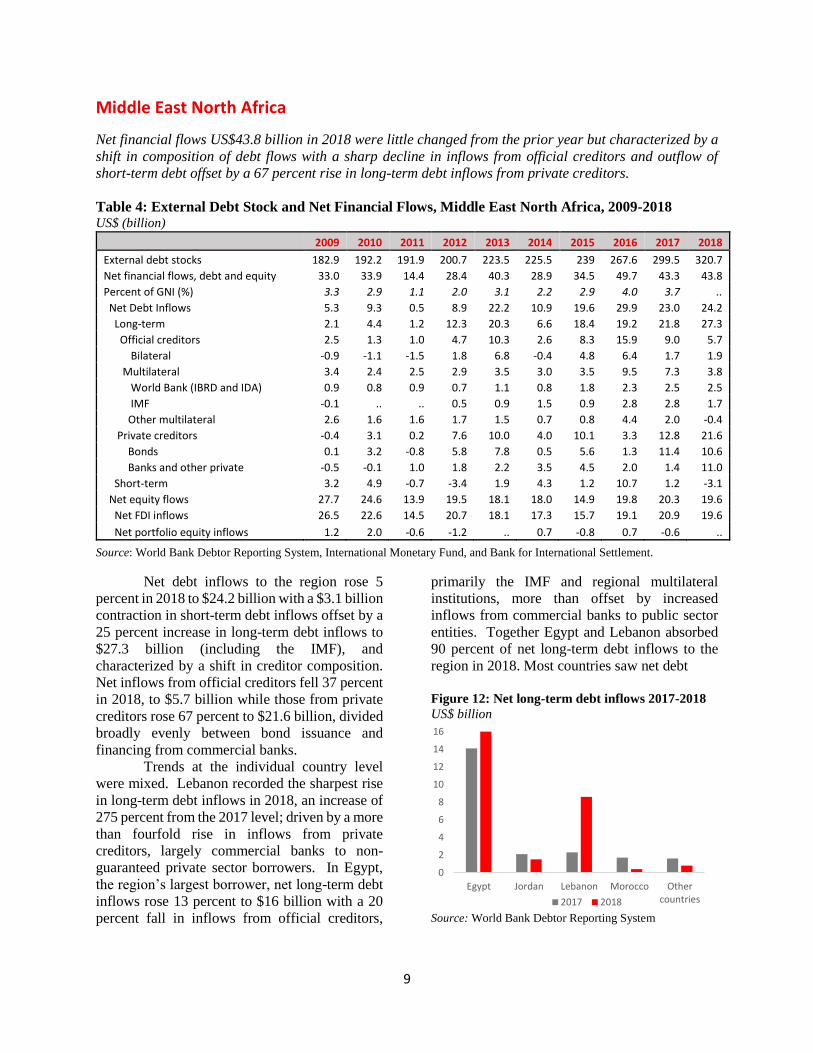
Trends at the individual country level
were mixed. Lebanon recorded the sharpest rise
in long-term debt inflows in 2018, an increase of
275 percent from the 2017 level; driven by a more
than fourfold rise in inflows from private
creditors, largely commercial banks to non-
guaranteed private sector borrowers. In Egypt,
the region’s largest borrower, net long-term debt
inflows rose 13 percent to $16 billion with a 20
percent fall in inflows from official creditors,
primarily the IMF and regional multilateral
institutions, more than offset by increased
inflows from commercial banks to public sector
entities. Together Egypt and Lebanon absorbed
90 percent of net long-term debt inflows to the
region in 2018. Most countries saw net debt
Figure 12: Net long-term debt inflows 2017-2018
US$ billion
Source: World Bank Debtor Reporting System
0
2
4
6
8
10
12
14
16
Egypt Jordan Lebanon Morocco Othercountries2017 2018
10
inflows decline. In Morocco they fell 76 percent
to $425 million, their lowest level in a decade
following a sharp contraction in flows from
official creditors, including a net outflow to
bilateral creditors. Jordan recorded a 29 percent
drop in net debt flows and in the remaining
countries in the region they fell, on average, to
half the prior year level.
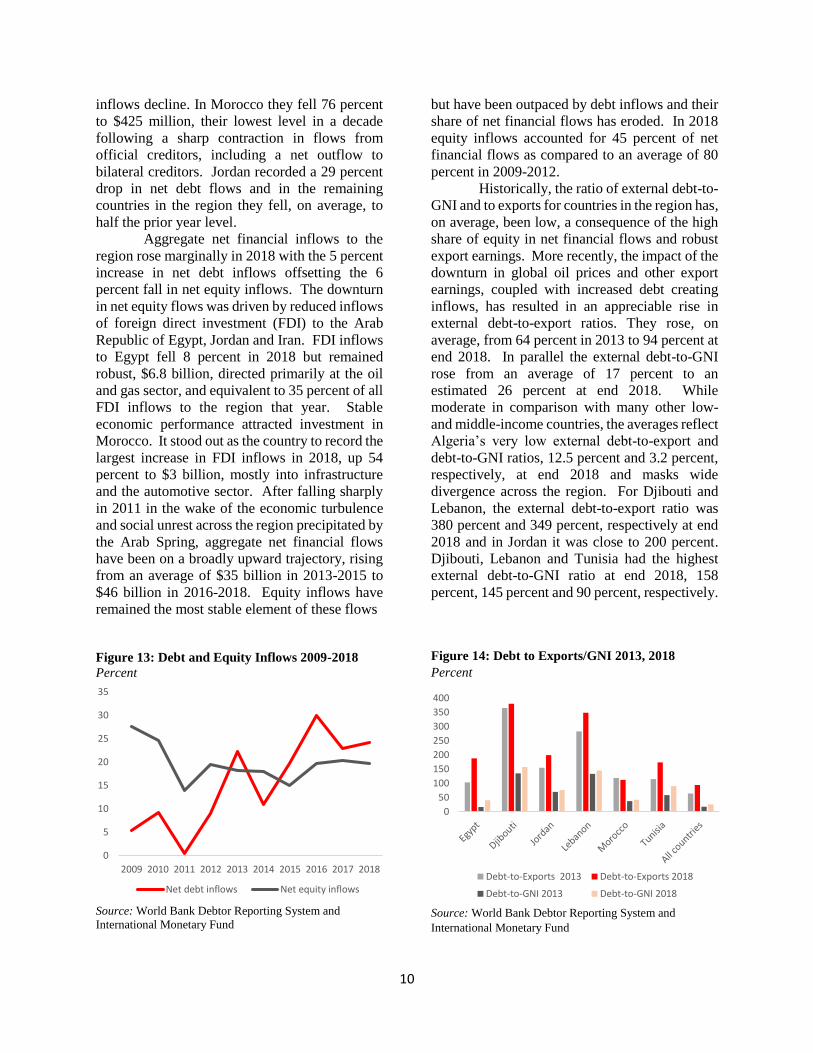
Aggregate net financial inflows to the
region rose marginally in 2018 with the 5 percent
increase in net debt inflows offsetting the 6
percent fall in net equity inflows. The downturn
in net equity flows was driven by reduced inflows
of foreign direct investment (FDI) to the Arab
Republic of Egypt, Jordan and Iran. FDI inflows
to Egypt fell 8 percent in 2018 but remained
robust, $6.8 billion, directed primarily at the oil
and gas sector, and equivalent to 35 percent of all
FDI inflows to the region that year. Stable
economic performance attracted investment in
Morocco. It stood out as the country to record the
largest increase in FDI inflows in 2018, up 54
percent to $3 billion, mostly into infrastructure
and the automotive sector. After falling sharply
in 2011 in the wake of the economic turbulence
and social unrest across the region precipitated by
the Arab Spring, aggregate net financial flows
have been on a broadly upward trajectory, rising
from an average of $35 billion in 2013-2015 to
$46 billion in 2016-2018. Equity inflows have
remained the most stable element of these flows
Figure 13: Debt and Equity Inflows 2009-2018
Percent
Source: World Bank Debtor Reporting System and
International Monetary Fund
but have been outpaced by debt inflows and their
share of net financial flows has eroded. In 2018
equity inflows accounted for 45 percent of net
financial flows as compared to an average of 80
percent in 2009-2012.
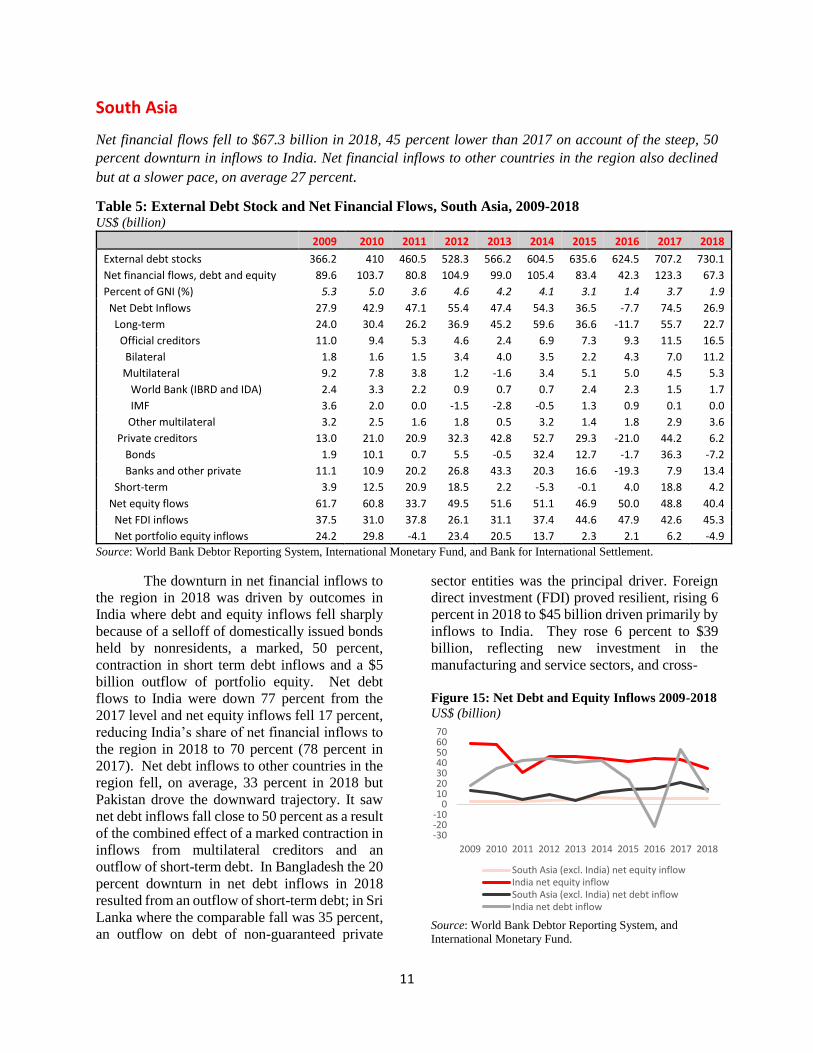
Historically, the ratio of external debt-to-
GNI and to exports for countries in the region has,
on average, been low, a consequence of the high
share of equity in net financial flows and robust
export earnings. More recently, the impact of the
downturn in global oil prices and other export
earnings, coupled with increased debt creating
inflows, has resulted in an appreciable rise in
external debt-to-export ratios. They rose, on
average, from 64 percent in 2013 to 94 percent at
end 2018. In parallel the external debt-to-GNI
rose from an average of 17 percent to an
estimated 26 percent at end 2018. While
moderate in comparison with many other low-
and middle-income countries, the averages reflect
Algeria’s very low external debt-to-export and
debt-to-GNI ratios, 12.5 percent and 3.2 percent,
respectively, at end 2018 and masks wide
divergence across the region. For Djibouti and
Lebanon, the external debt-to-export ratio was
380 percent and 349 percent, respectively at end
2018 and in Jordan it was close to 200 percent.
Djibouti, Lebanon and Tunisia had the highest
external debt-to-GNI ratio at end 2018, 158
percent, 145 percent and 90 percent, respectively.
Figure 14: Debt to Exports/GNI 2013, 2018
Percent
Source: World Bank Debtor Reporting System and
International Monetary Fund
0
5
10
15
20
25
30
35
2009 2010 2011 2012 2013 2014 2015 2016 2017 2018
Net debt inflows Net equity inflows
0
50
100
150
200
250
300
350
400
Debt-to-Exports 2013 Debt-to-Exports 2018
Debt-to-GNI 2013 Debt-to-GNI 2018
11
South Asia
Net financial flows fell to $67.3 billion in 2018, 45 percent lower than 2017 on account of the steep, 50
percent downturn in inflows to India. Net financial inflows to other countries in the region also declined
but at a slower pace, on average 27 percent.
Table 5: External Debt Stock and Net Financial Flows, South Asia, 2009-2018 US$ (billion)
2009 2010 2011 2012 2013 2014 2015 2016 2017 2018
External debt stocks 366.2 410 460.5 528.3 566.2 604.5 635.6 624.5 707.2 730.1
Net financial flows, debt and equity 89.6 103.7 80.8 104.9 99.0 105.4 83.4 42.3 123.3 67.3
Percent of GNI (%) 5.3 5.0 3.6 4.6 4.2 4.1 3.1 1.4 3.7 1.9
Net Debt Inflows 27.9 42.9 47.1 55.4 47.4 54.3 36.5 -7.7 74.5 26.9
Long-term 24.0 30.4 26.2 36.9 45.2 59.6 36.6 -11.7 55.7 22.7
Official creditors 11.0 9.4 5.3 4.6 2.4 6.9 7.3 9.3 11.5 16.5
Bilateral 1.8 1.6 1.5 3.4 4.0 3.5 2.2 4.3 7.0 11.2
Multilateral 9.2 7.8 3.8 1.2 -1.6 3.4 5.1 5.0 4.5 5.3
World Bank (IBRD and IDA) 2.4 3.3 2.2 0.9 0.7 0.7 2.4 2.3 1.5 1.7
IMF 3.6 2.0 0.0 -1.5 -2.8 -0.5 1.3 0.9 0.1 0.0
Other multilateral 3.2 2.5 1.6 1.8 0.5 3.2 1.4 1.8 2.9 3.6
Private creditors 13.0 21.0 20.9 32.3 42.8 52.7 29.3 -21.0 44.2 6.2
Bonds 1.9 10.1 0.7 5.5 -0.5 32.4 12.7 -1.7 36.3 -7.2
Banks and other private 11.1 10.9 20.2 26.8 43.3 20.3 16.6 -19.3 7.9 13.4
Short-term 3.9 12.5 20.9 18.5 2.2 -5.3 -0.1 4.0 18.8 4.2
Net equity flows 61.7 60.8 33.7 49.5 51.6 51.1 46.9 50.0 48.8 40.4
Net FDI inflows 37.5 31.0 37.8 26.1 31.1 37.4 44.6 47.9 42.6 45.3
Net portfolio equity inflows 24.2 29.8 -4.1 23.4 20.5 13.7 2.3 2.1 6.2 -4.9
Source: World Bank Debtor Reporting System, International Monetary Fund, and Bank for International Settlement.
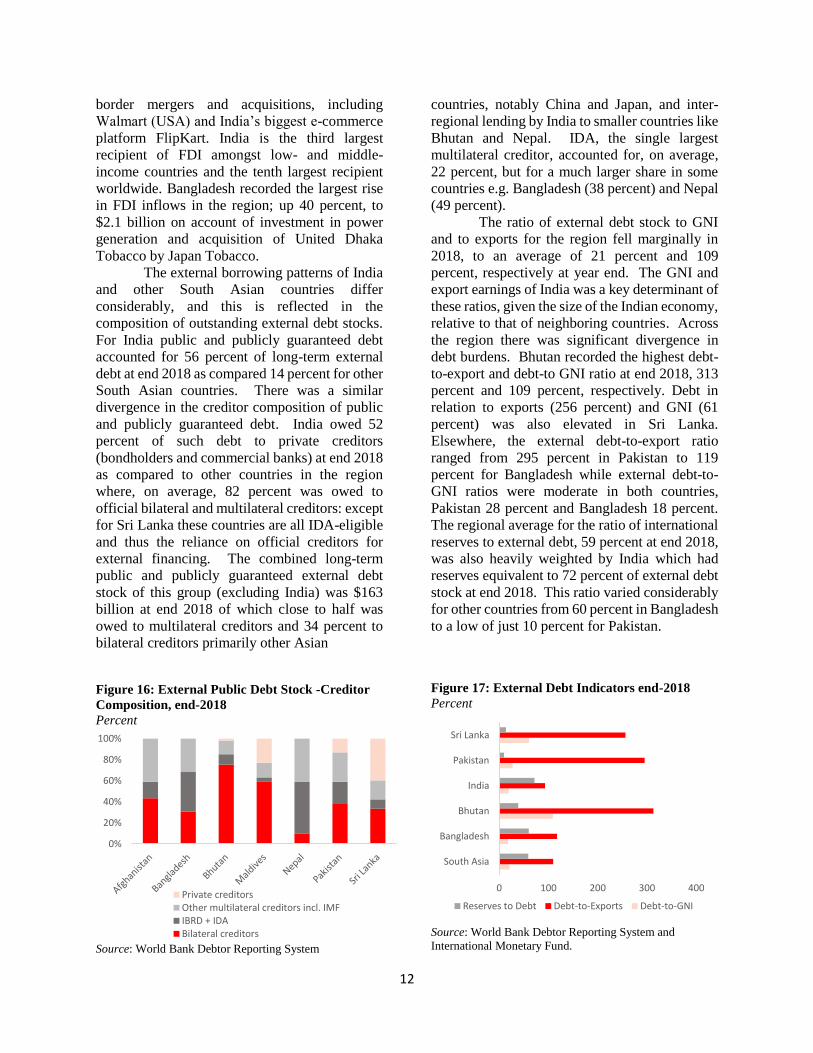
The downturn in net financial inflows to
the region in 2018 was driven by outcomes in
India where debt and equity inflows fell sharply
because of a selloff of domestically issued bonds
held by nonresidents, a marked, 50 percent,
contraction in short term debt inflows and a $5
billion outflow of portfolio equity. Net debt
flows to India were down 77 percent from the
2017 level and net equity inflows fell 17 percent,
reducing India’s share of net financial inflows to
the region in 2018 to 70 percent (78 percent in
2017). Net debt inflows to other countries in the
region fell, on average, 33 percent in 2018 but
Pakistan drove the downward trajectory. It saw
net debt inflows fall close to 50 percent as a result
of the combined effect of a marked contraction in
inflows from multilateral creditors and an
outflow of short-term debt. In Bangladesh the 20
percent downturn in net debt inflows in 2018
resulted from an outflow of short-term debt; in Sri
Lanka where the comparable fall was 35 percent,
an outflow on debt of non-guaranteed private
sector entities was the principal driver. Foreign
direct investment (FDI) proved resilient, rising 6
percent in 2018 to $45 billion driven primarily by
inflows to India. They rose 6 percent to $39
billion, reflecting new investment in the
manufacturing and service sectors, and cross-
Figure 15: Net Debt and Equity Inflows 2009-2018
US$ (billion)
Source: World Bank Debtor Reporting System, and
International Monetary Fund.
-30-20-10
010203040506070
2009 2010 2011 2012 2013 2014 2015 2016 2017 2018
South Asia (excl. India) net equity inflowIndia net equity inflowSouth Asia (excl. India) net debt inflowIndia net debt inflow
12
border mergers and acquisitions, including
Walmart (USA) and India’s biggest e-commerce
platform FlipKart. India is the third largest
recipient of FDI amongst low- and middle-
income countries and the tenth largest recipient
worldwide. Bangladesh recorded the largest rise
in FDI inflows in the region; up 40 percent, to
$2.1 billion on account of investment in power
generation and acquisition of United Dhaka
Tobacco by Japan Tobacco.
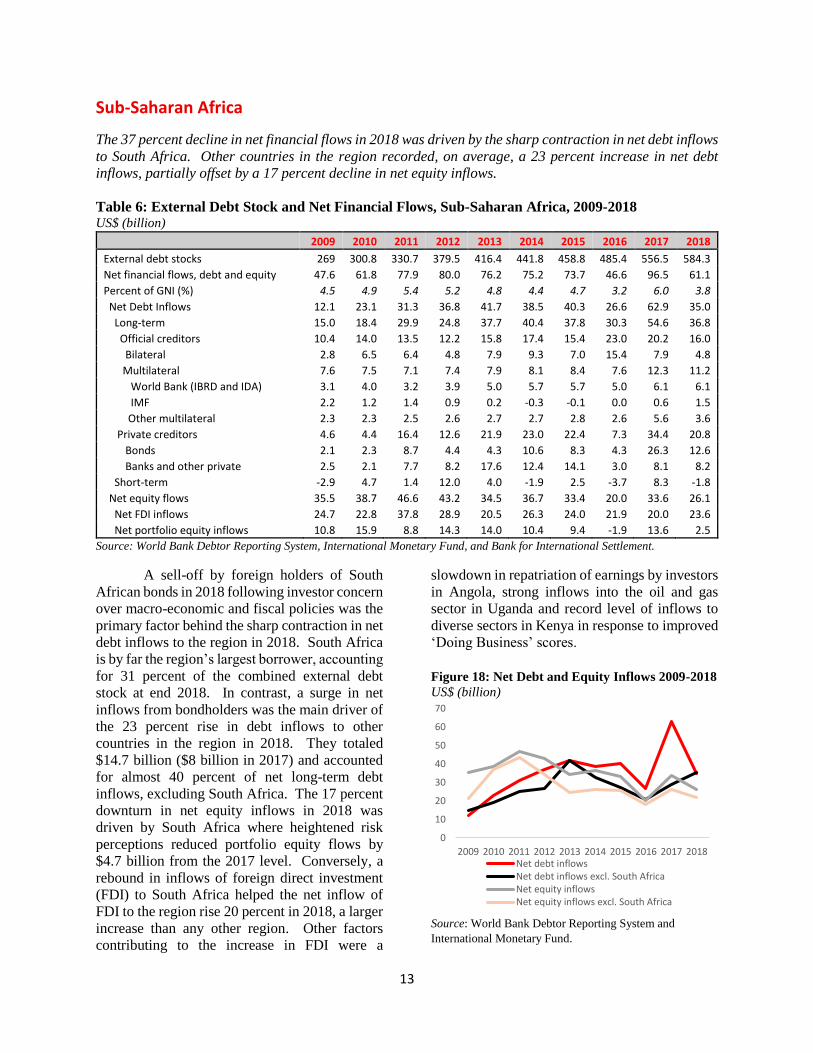
The external borrowing patterns of India
and other South Asian countries differ
considerably, and this is reflected in the
composition of outstanding external debt stocks.
For India public and publicly guaranteed debt
accounted for 56 percent of long-term external
debt at end 2018 as compared 14 percent for other
South Asian countries. There was a similar
divergence in the creditor composition of public
and publicly guaranteed debt. India owed 52
percent of such debt to private creditors
(bondholders and commercial banks) at end 2018
as compared to other countries in the region
where, on average, 82 percent was owed to
official bilateral and multilateral creditors: except
for Sri Lanka these countries are all IDA-eligible
and thus the reliance on official creditors for
external financing. The combined long-term
public and publicly guaranteed external debt
stock of this group (excluding India) was $163
billion at end 2018 of which close to half was
owed to multilateral creditors and 34 percent to
bilateral creditors primarily other Asian
Figure 16: External Public Debt Stock -Creditor
Composition, end-2018
Percent
Source: World Bank Debtor Reporting System
countries, notably China and Japan, and inter-
regional lending by India to smaller countries like
Bhutan and Nepal. IDA, the single largest
multilateral creditor, accounted for, on average,
22 percent, but for a much larger share in some
countries e.g. Bangladesh (38 percent) and Nepal
(49 percent).
The ratio of external debt stock to GNI
and to exports for the region fell marginally in
2018, to an average of 21 percent and 109
percent, respectively at year end. The GNI and
export earnings of India was a key determinant of
these ratios, given the size of the Indian economy,
relative to that of neighboring countries. Across
the region there was significant divergence in
debt burdens. Bhutan recorded the highest debt-
to-export and debt-to GNI ratio at end 2018, 313
percent and 109 percent, respectively. Debt in
relation to exports (256 percent) and GNI (61
percent) was also elevated in Sri Lanka.
Elsewhere, the external debt-to-export ratio
ranged from 295 percent in Pakistan to 119
percent for Bangladesh while external debt-to-
GNI ratios were moderate in both countries,
Pakistan 28 percent and Bangladesh 18 percent.
The regional average for the ratio of international
reserves to external debt, 59 percent at end 2018,
was also heavily weighted by India which had
reserves equivalent to 72 percent of external debt
stock at end 2018. This ratio varied considerably
for other countries from 60 percent in Bangladesh
to a low of just 10 percent for Pakistan.
Figure 17: External Debt Indicators end-2018
Percent
Source: World Bank Debtor Reporting System and
International Monetary Fund.
0%
20%
40%
60%
80%
100%
Private creditorsOther multilateral creditors incl. IMFIBRD + IDABilateral creditors
0 100 200 300 400
South Asia
Bangladesh
Bhutan
India
Pakistan
Sri Lanka
Reserves to Debt Debt-to-Exports Debt-to-GNI
13
Sub-Saharan Africa
The 37 percent decline in net financial flows in 2018 was driven by the sharp contraction in net debt inflows
to South Africa. Other countries in the region recorded, on average, a 23 percent increase in net debt
inflows, partially offset by a 17 percent decline in net equity inflows.
Table 6: External Debt Stock and Net Financial Flows, Sub-Saharan Africa, 2009-2018 US$ (billion)
2009 2010 2011 2012 2013 2014 2015 2016 2017 2018
External debt stocks 269 300.8 330.7 379.5 416.4 441.8 458.8 485.4 556.5 584.3
Net financial flows, debt and equity 47.6 61.8 77.9 80.0 76.2 75.2 73.7 46.6 96.5 61.1
Percent of GNI (%) 4.5 4.9 5.4 5.2 4.8 4.4 4.7 3.2 6.0 3.8
Net Debt Inflows 12.1 23.1 31.3 36.8 41.7 38.5 40.3 26.6 62.9 35.0
Long-term 15.0 18.4 29.9 24.8 37.7 40.4 37.8 30.3 54.6 36.8
Official creditors 10.4 14.0 13.5 12.2 15.8 17.4 15.4 23.0 20.2 16.0
Bilateral 2.8 6.5 6.4 4.8 7.9 9.3 7.0 15.4 7.9 4.8
Multilateral 7.6 7.5 7.1 7.4 7.9 8.1 8.4 7.6 12.3 11.2
World Bank (IBRD and IDA) 3.1 4.0 3.2 3.9 5.0 5.7 5.7 5.0 6.1 6.1
IMF 2.2 1.2 1.4 0.9 0.2 -0.3 -0.1 0.0 0.6 1.5
Other multilateral 2.3 2.3 2.5 2.6 2.7 2.7 2.8 2.6 5.6 3.6
Private creditors 4.6 4.4 16.4 12.6 21.9 23.0 22.4 7.3 34.4 20.8
Bonds 2.1 2.3 8.7 4.4 4.3 10.6 8.3 4.3 26.3 12.6
Banks and other private 2.5 2.1 7.7 8.2 17.6 12.4 14.1 3.0 8.1 8.2
Short-term -2.9 4.7 1.4 12.0 4.0 -1.9 2.5 -3.7 8.3 -1.8
Net equity flows 35.5 38.7 46.6 43.2 34.5 36.7 33.4 20.0 33.6 26.1
Net FDI inflows 24.7 22.8 37.8 28.9 20.5 26.3 24.0 21.9 20.0 23.6
Net portfolio equity inflows 10.8 15.9 8.8 14.3 14.0 10.4 9.4 -1.9 13.6 2.5
Source: World Bank Debtor Reporting System, International Monetary Fund, and Bank for International Settlement.
A sell-off by foreign holders of South
African bonds in 2018 following investor concern
over macro-economic and fiscal policies was the
primary factor behind the sharp contraction in net
debt inflows to the region in 2018. South Africa
is by far the region’s largest borrower, accounting
for 31 percent of the combined external debt
stock at end 2018. In contrast, a surge in net
inflows from bondholders was the main driver of
the 23 percent rise in debt inflows to other
countries in the region in 2018. They totaled
$14.7 billion ($8 billion in 2017) and accounted
for almost 40 percent of net long-term debt
inflows, excluding South Africa. The 17 percent
downturn in net equity inflows in 2018 was
driven by South Africa where heightened risk
perceptions reduced portfolio equity flows by
$4.7 billion from the 2017 level. Conversely, a
rebound in inflows of foreign direct investment
(FDI) to South Africa helped the net inflow of
FDI to the region rise 20 percent in 2018, a larger
increase than any other region. Other factors
contributing to the increase in FDI were a
slowdown in repatriation of earnings by investors
in Angola, strong inflows into the oil and gas
sector in Uganda and record level of inflows to
diverse sectors in Kenya in response to improved
‘Doing Business’ scores.
Figure 18: Net Debt and Equity Inflows 2009-2018
US$ (billion)
Source: World Bank Debtor Reporting System and
International Monetary Fund.
0
10
20
30
40
50
60
70
2009 2010 2011 2012 2013 2014 2015 2016 2017 2018Net debt inflowsNet debt inflows excl. South AfricaNet equity inflowsNet equity inflows excl. South Africa
14
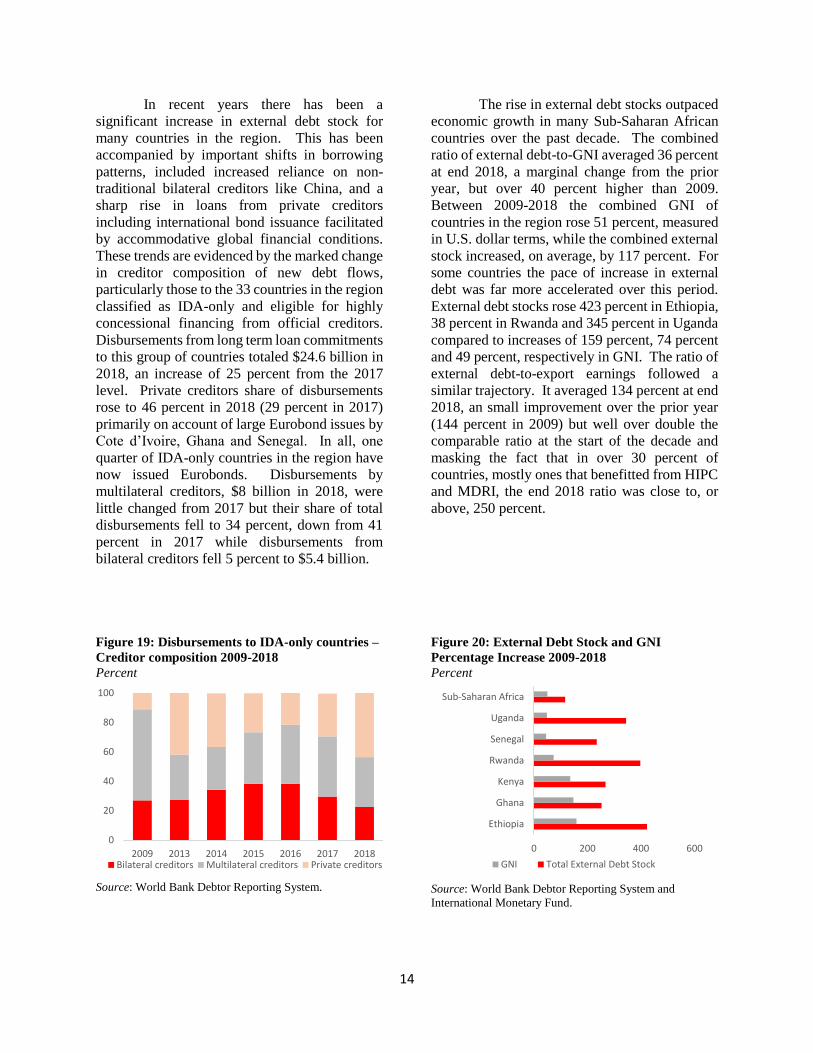
In recent years there has been a
significant increase in external debt stock for
many countries in the region. This has been
accompanied by important shifts in borrowing
patterns, included increased reliance on non-
traditional bilateral creditors like China, and a
sharp rise in loans from private creditors
including international bond issuance facilitated
by accommodative global financial conditions.
These trends are evidenced by the marked change
in creditor composition of new debt flows,
particularly those to the 33 countries in the region
classified as IDA-only and eligible for highly
concessional financing from official creditors.
Disbursements from long term loan commitments
to this group of countries totaled $24.6 billion in
2018, an increase of 25 percent from the 2017
level. Private creditors share of disbursements
rose to 46 percent in 2018 (29 percent in 2017)
primarily on account of large Eurobond issues by
Cote d’Ivoire, Ghana and Senegal. In all, one
quarter of IDA-only countries in the region have
now issued Eurobonds. Disbursements by
multilateral creditors, $8 billion in 2018, were
little changed from 2017 but their share of total
disbursements fell to 34 percent, down from 41
percent in 2017 while disbursements from
bilateral creditors fell 5 percent to $5.4 billion.
Figure 19: Disbursements to IDA-only countries –
Creditor composition 2009-2018
Percent
Source: World Bank Debtor Reporting System.
The rise in external debt stocks outpaced
economic growth in many Sub-Saharan African
countries over the past decade. The combined
ratio of external debt-to-GNI averaged 36 percent
at end 2018, a marginal change from the prior
year, but over 40 percent higher than 2009.
Between 2009-2018 the combined GNI of
countries in the region rose 51 percent, measured
in U.S. dollar terms, while the combined external
stock increased, on average, by 117 percent. For
some countries the pace of increase in external
debt was far more accelerated over this period.
External debt stocks rose 423 percent in Ethiopia,
38 percent in Rwanda and 345 percent in Uganda
compared to increases of 159 percent, 74 percent
and 49 percent, respectively in GNI. The ratio of
external debt-to-export earnings followed a
similar trajectory. It averaged 134 percent at end
2018, an small improvement over the prior year
(144 percent in 2009) but well over double the
comparable ratio at the start of the decade and
masking the fact that in over 30 percent of
countries, mostly ones that benefitted from HIPC
and MDRI, the end 2018 ratio was close to, or
above, 250 percent.
Figure 20: External Debt Stock and GNI
Percentage Increase 2009-2018
Percent
Source: World Bank Debtor Reporting System and
International Monetary Fund.
0
20
40
60
80
100
2009 2013 2014 2015 2016 2017 2018Bilateral creditors Multilateral creditors Private creditors
0 200 400 600
Ethiopia
Ghana
Kenya
Rwanda
Senegal
Uganda
Sub-Saharan Africa
GNI Total External Debt Stock