public disclosure authorized pakistan economic and social ... · pdf fileeconomic and social...
TRANSCRIPT

Report No. 5962-PAK
PakistanEconomic and Social Development Prospects(In Two Volumes) Volume II: The Social Sectors
February 18,1986
South Asia Region
FOR OFFICIAL USE ONLY
Document of the WUrld Bank
This report has a restricted distribution and may be used by recipientsonly in the performance of their official duties. Its contents may not otherwisebe disclosed without World Bank authorization.
Pub
lic D
iscl
osur
e A
utho
rized
Pub
lic D
iscl
osur
e A
utho
rized
Pub
lic D
iscl
osur
e A
utho
rized
Pub
lic D
iscl
osur
e A
utho
rized
Pub
lic D
iscl
osur
e A
utho
rized
Pub
lic D
iscl
osur
e A
utho
rized
Pub
lic D
iscl
osur
e A
utho
rized
Pub
lic D
iscl
osur
e A
utho
rized

CURRENCY EQUIVALENTS la(annual averages)
Rs per US$1.00 US$ ner Rs 1.00
FY79 9.90 Od"11FY80 9.90 0.101FY81 9.90 0.iOlFY82 10.55 0.095FY83 12.75 0.078FY84 13.50 0.074FY85 15.30 0.065
jt Since January 8, i982, the exchange rate for the rupee has been managedwith respect to a weighted basket of currencies.
GOVERNMENT OF PAKISTANFISCAL YEAR
July 1 to June 30
Note: Historical data in the report refer only to the present nationof Pakistan, i.e. the former West Pakistan, unless otherwisespecifically noted.

FOR OFCIAL USE ONLY
PAKISTAN
ECONOMIC AND SOCIAL DEVELOPMENT PROSPECTS
Table of Contents
Page No.
VOLUME I: RECENT ECONOMIC DEVELOPMENTS AND STRUCTURAL ADJUSTMENT
VOLUME II: THE SOCIAL SECTORS
Chapter VI: Population ............. . ......... ........ .. .. 1
A. Demographic Features and Structure of Population .. I
B. Population Projections ........................... 6
C. Consequences of Population Growth ......... o....... 8- Employment ................................... 8- The Provision of Social Services .............. 10- Urbanization ............ ................... so. 12- Environmental Degradation . ..................... 12
D. Slowing Population Growth .... o..................... 12- The Family Planning Program ................... 13- Political and Administrative Commitment ....... 14- Creating Demand for Family Planning Services ... 15- Provision of Services ......................... 16- Expanding Family Planning ........... .......... 16- Financing Family Planning ..................... 17
Chapter VII: The Education Sector ................................. 19
A. Present Situation ........... *.** *...**.......**s.o 19
B. Education Strategies . ............... ... ......... *. 22- Primary Education ..... .. ................. ..... 22- Secondary Education .......... ............... 26- Higher Education . ................. ... ......... 26- Non-formal Education and Mass Literacy ........ 28
C. Major Issues ............................................... 29- Female Education **e..... .......*.. s...* .... 29- Availability of Teachers ...................... 32- Social Inequities ...... . ....................... . 34- The Re-emerging Private Sector ................ 36
D. Targets for the Future ..... ...................... 41
This domument has a restriced dirbution and may be used by e_ients only in the performce oftheir offi duties Its contnts may not otherwe be disclsed without World Bank authoriatioL

-ii-
E. Financing Education Requirements ................. 42
F. Priorities for the Future ..... ................... 46
Chapter VIII: The Health System ...................... ............. 48
A. Present Situation ........... .. ................... 48- Health Status ................................. 48- Health Policies and Service Structure ......... 49
B. Major Issues ..................................... 54- Coverage and Quality of Rural Health Services .. 54- Manpower and Training .. ....................... 59- Planning and Management ....................... 62- The Role of the Private Sector ................ 62- Health Insurance ......... .................... . 65
C. Targets for the Future ........................... 66
D. Financing Health Care .. .. ............. 68
E. Prioricies for the Future ........................ 72
Chapter IX: Urban Developments ... ........... ..ooo ..... ..... ...... 74
A. Urbanization Trends and Patterns ................. 74
B. Urbanization and Economic Development ....... o..... 78
C. Policy Issues and Programs .. ..................... 79- Housing .......................... o.o........... 81- Water Supply, Sanitation and Solid
Waste Management . ... o..... ...... ... o........ 83
D. Policy Options .... ............................... 84- Reducing Technical Standards .. . ............ 84- Increasing Public Resource Mobilization .... ... 84- Improving Urban Management ............. o....... 87
E. Financing Urban Investments ..... ................. 88- Investment Requirements ....................... 88- Firnicing fo t.........hFur.. 00. ..........0........ 89
Fo Priorities for the Future o ......................... .....*....... . 90

Table of Contents (continued)
ANhE 1: Scholarships and Student Loans ........................... 91ANlll 2: Returns to Education in Pakistan .......... 0............... 97AlNEX 3: The Potential for Increased Cost Recovery
in Higher Education ..... ............................... 106ANNEX 4: Assumptions for Selected Tables in Chapters VII and VIII .. 117
List of Tables and Charts in TextPage No.
Chapter VI: Population
Table Vi.1 - Deriographic Indicators, 1951-1981 ................... 2Talie VI.2 - Selected Vital Statistics, 1962-1979 ................ 4Table VI.3 - Population Projections, 1985-2025 .................. 7Table VI.4 - Public Outlays for Health and Education Sectors
under Different Population Growth Scenaria,1988/89-2024/25 .... **. *.e .......... *. 11
Chapter VII: The Education Sector
Table VII.1 - Comparative Education Indicators, 1984 ............... 20Table VII.2 - Rates of Return by Level of Education, 1985 ......... 22Table VII.3 - Female Education Indicators, 1970/71-1982/83 ........ 30Table VII.4 - Fertility Rates Per Woman, 1977 ..... ................ 31Table VII.5 - Requirements for Primary and Secondary Teachers,
1984/85-1992/93 ................ .......... 9. ............ .*. 33Table VII.6 - Annual Public Expenditures on Education, 1984/85 .... 34Table VII.7 - Private Education Institutions and Enrollments,
1968/69-1992/93 ..... .................. ......... *.. 39Table VII.8 - Suggested Education Targets, 1984/85-199912000 ...... 43Table VII.9 - Estimated Average Annual Public Outlays,
1977/78-1999/2000 ............... *. ee................ 44
Figure 7.1 - The Distribution of Cumulative Public EducationalSubsidies in Pakistan and Other Developing Countries 37
Figure 7.2 - The Distribution of Cumulative Public EducationalSubsidies, Before and After Increased CostRecovery in Higher Education, 1984 ................. 38
Chapter VIII: The Health System
Table VIII.1 - Health Indicators, 1965-1983 ........................ 49Table VIII.2 - Public Health Infrastructure, 1977/78-1984/85 .*...... 51Table VIII.3 - Utilization of Medical Services, 1983/84 ............ 52

-iv-
Table VIII.4 - Expenditures on Health Services ..................... 53Table VIII.5 - Medical Facility by Average Distance for
Urban/Rural Residents, 1983/84 .................... 55Table VIII.6 - Average Annual Recurrent Expenditure Allocations
Per Facility (1984185) ............................ 57Table VIII.7 - Health Manpower, 1965 and 1980 ..00.................... 60Table VIII.8 - Trained Staff Needed to Meet Planned Requirements .... 61Table VIII.9 - Private Realth Facilities, 1980/81-1992/93 .......... 63Table VIII.10 - Estimated Public Health Infrastructure Requirements .. 68Table VIII.11 - Estimated Average Annual Public Outlays,
1977/78-1999/2000 ................................. 69
Chapter IX: Urban Developments
Table IX.1 - Distribution of Urban Population, 1972 and 1981 ..... 75Table Ix.2 - Size Distribution of Cities/Towns, 1951-1981 ........ 76Table IX.3 - Selected Urban Indicators, 1970 and 1982 ............ 80Table IX.4 - Urban Housing and Population Growth, 1960-1980 ...... 81TabLe IX.5 - Minimum Investment Requirements for Incremental
Urban Population, 1985/86-1999/2000 ............... 85

Chapter VI: Population
A. Demographic Features and Structure of Population
6.01 The population of Pakistan is estimated at about 95 million, amore than five-fold increase since the beginning of this century, makingPakistan the ninth most populous country in the world. Moreover, theaverage population growth rate has accelerated from 1.7Z p.a. in the firsthalf of the century to 3.1% between 1961 and 1972 and has remained at 2.91since then. High population growth is the result of reductions in thedeath rate unaccompanied by any significant decline in fertility. At thisrate, the size of the population would double approximately every 25years. Pakistan's population growth rate is high compared with the 2.1%rate for low income countries and 2.5% for lower middle income countries.Its growth rate is also the highest in South Asia and above that of other::_slim countries such as Indonesia (2M3U), Bangladesh (2.4%) and Egypt(2.5%). This high growth rate is clearly undesirable from an economic andsocial point of view, and is the main long-term constraint to theGovernment's objective of sustained and equitable economic growth.
6.02 Pakistan remains primarily a rural economy; only 28% of thepopulation resides in urban areas with the metropolitan areas of Karachi,Lahore, Faisalabad and Rawalpindi/Islamabad accounting for 422 of theurban population. The population is unevenly distributed throughout thecountry: 56Z are located in Punjab, 23% in Sind, 13% in NWFP and 5% inBaluchistan. Average population density (120 persons per square km)remains low in comparison to other South Asian countries, but much of theopen land is arid, and without large investments in irrigation, unsuitablefor agricultural production. International and internal migration hasbeen substantial. International migration to the Middle East acceleratedafter 1973 and presently there are an estimated 2.5 million Pakistaniworkers in Middle Eastern countries. However, due to lower economicgrowth in the Middle East, net migration has begun to decrease which willexacerbate labor absorption problems in Pakistan. According to the 1981Census, internal migration accounted for 3.3 million people during theinter-censal period 1972-81. Twice as many migrants moved within the sameprovince as those who moved between provinces, while approximately as manymigrants moved within rural areas as those who moved from rural to urbanareas. In addition to international out-migration and internal migration,some 3 million Afghan refugees are now settled in Pakistan, primarily inWFP and Baluchistan.
6.03 Rapid population growth has resulted in an increasingly young agestructure. The proportion of the population under 15 years has risen from40% in 1951 to 44% in 1981, while the relative size of the age groupbetween 15 and 64 has declined from 57% to 52% over the correspondingperiod (Table VI.1). These changes imply not only an increase in overalldependency, from 75% in 1951 to 92% in 1981, but also a gradual shift inthe structure of the dependency burden toward young age groups, and havemajor consequences for the provision of social infrastructure andservices. The expansion of younger age groups also generates its owngrowth momentum as it results in corresponding growth in the number ofwomen in reproductive age.

-2-
Table VI.1: DEMOGRAPHIC INDICATORSt, 1951-1981
1951 1961 1972 1981
PopulationSize (million) Ia 33.7 46.2 64.9 84.2Growth rate (p.a.) 1.8 /b 3.2 3.1 2.9
Age Structure (X distribution)0 - 14 39.7 39.1 41.9 44.015 - 64 57.2 57.1 54.1 52.065 and over 3.1 3.8 4.0 4.0
Dependency Ratio (Z) /c 74.8 75.1 84.8 92.3
Singulate Mean Age at Marriage (yrs.) /dMale 22.3 23.3 25.7 25.4Female 16.9 16.7 19.7 20.8
Labor Force Participation Rate (Z) /eMale 55.0 55.0 55.8 50.6Female 2.0 6.1 6.2 2.6Total 30.6 32.4 32.9 27.6
Urban ConcentrationUrban population (2) 17.8 22.5 25.2 28.2Share of 10 largest cities (Z) 9.7 11.9 14.4 15.7
/a Figures for 1951 and 1961 have been adjusted for under-enumeration./b Growth rate for the period 1941-1951.7T Ratio of population under 15 years and over 64 years to population
in the age group 15-64, expressed as a percentage./d Approximately equal to the average age at marriage of those marrying by
age 50./e Share of labor force in total population.
Source: Population Censuses, 1951, 1961, 1972, 1981; M. Afzal, ThePopulation of Pakistan, PIDE, (1974); S.S. Lieberman;"Demographic Perspectives on Pakistan's Development," Populationand Development Review, (1982); and World Bank, Pakistan:Population Planning and Social Services, Report No. 2018-PAK,(1978).

-3-
6.04 Pakistan's fertility level is among the highest in the world.Contrary to the experience of most developing countries, increasing mod-ernization has not reduced fertility levels in Pakistan. Despite rela-tively high economic growth, the development of more advanced structuresin the productive sectors and rapid urbanization, Pakistan's fertilitylevel has fallen only slightly in more than 20 years. The average womantoday gives birth to 6.3 children compared to 7 in 1962 and 6 in 1968(Table VI.2). Provincial differences in fertility are significant, withPunjab and NHFP having the highest fertility levels. Fertility of urbanwomen appears to be as high as fertility of rural women. The age patternof fertility rates is almost the same in all provinces, rising sharplybetween the ages of 15 and 25, peaking in the age group 25 to 29 and thendeclining. Female education, especially if the secondary level iscompleted, has a strong influence on fertility rates. The total fertilityrate of literate women is 3.6 compared to 7.1 for illiterate women.l/
6.05 Of the "proximate" causes of fertility changes-age at marriage,length of breast-feeding, interval between marriage and first birth, useof contraception--only changes in the average age at marriage have beenconducive to fertility reduction. Between 1951 and 1981, the singulatemean age at marriage increased from 22.3 years to 25.4 years for malesand from 16.9 years to 20.8 years for females. However, this increaseappears to have been offset by a shortening of the length of breastfeedingand possibly of the first birth interval.2/ Knowledge and use of con-traceptives remain unusually low. Comparison of the Pakistan FertilitySurvey (1975) and Pakistan Labor Migration Survey (1979) reveals a sharpdecline in contraceptive use from 10.5% of eligible women in 1975 to 4.9Xin 1979, probably due to the discontinuation of the Family PlanningProgram in 1977. Preliminary findings from a recent survey indicate thatthe use of contraceptives has increased again to llZ.3/ The impact ofcontraceptive use, however, may be somewhat limited as there is some
1/ A. Nohammad, "Fertility Differentials in Pakistan, 1977," QuarterlyResearch Review, Federal Bureau of Statistics, (1983).
2/ Findings from the Population, Labor Force, and Migration Survey of1979 show the mean length of breastfeeding to be about two monthsshorter than that reported by the Pakistan Fertility Survey in 1975,although the structure of differentials and among population subgroupsremained largely unchanged. See also Z. Sathar and M. Irfan,"Reproductive Behavior: Insights from the Population, Labor Force,and Migration Surveys," Pakistan Development Review, (1984).
3/ C. Soomro, and M. Ali, "Prevalence of Knowledge and Use ofContraception in Pakistan," PIDE, (1983); and Contraceptive PrevalenceSurvey, USAID Report, (1985 unpublished).

-4-
evidence that in many cases they are being used by women who have com-pleted their desired family size.l/
Table VI.2: SELECTED VITAL STATISTICS, 1962-1979 /a
1962-65 1968-71 1976-79
Crude Birth Rate Total 42.0 37.3 41.5(per 1000 population) Urban n.a. 33.3 38.4
Rural n.a. 39.3 42.7
Crude Death Rate Total 15.0 11.5 10.5(per 1000 population) Urban n.a. 8.7 8.2
Rural n.a. 12.5 11.4
Rate of Natural Increase Total 2.7 2.6 3.1(z) Urban n.a. 2.5 3.0
Rural n.a. 2.7 3.1
Total Fertility Rate 7.0 6.0 6.7Infant Mortality Rate 150 n.a. 119(per thousand)
/a Vital statistics are estimated and not directly comparable to the Censusdata presented in Table VI.1.
Source: M. Farooqui, et. al., Final Report of the Population GrowthEstimation Experiment, 1962-65, PIDE, (1971); and variousPopulation Growth Surveys.
6.06 Continued high levels of fertility are primarily the result ofsocio-cultural values which determine the position of women in thePakistan society. Demand for children in Pakistan is high, averaging 5children in urban and 5.5 children in rural areas, reflecting primarilythe desire to have several living sons. The Pakistan Fertility Survey(1975) data show that the desire for additional children among marriedwomen is higher for those with a low number of living sons than for those
1/ I. Alam, M. Irfan, and N. Farooqui, "Fertility Levels, Trends andDifferentials in Pakistan: Evidence from the Population, Labor Forceand Migration Survey," PIDE, (1983); Population Welfare Division,Family Welfare Centers: Evaluation Survey Report, Government ofPakistan (1985).

-5-
with several sons.1/ In Pakistani society daughters are primarily per-ceived as an economic burden, while sons are an economic asset and providean insurance against the incapacitation of the household or the loss ofland and other assets. Sons can contribute early in their lives to familyincome while females have very limited opportunities to participate ineconomically productive activities outside the household. Due to exten-sive use of child labor, particularly in rural areas, it is estimated thata primary school age boy can earn between Rs 250 p.a. and Rs 2,120 p.a.,depending on age, which increases to about Rs 5,000 p.a. at the secondaryschool age.2/ In contrast, female labor force participation rates are lowand have declined from 6.2Z in 1972 to 2.6% in 1981 (Table VI.1).
6.07 The low status of women perpetuates the high demand for children.Low status begins early in a girl's life with an inferior position withrespect to food, care and education.3/ Restricted contact with the worldtogether with submission to their husbands in marriage, perpetuates thisstatus throughout their life. As women continue to measure their value interms of bearing children and find their personal rewards in the nurturingfunction and social contact with other women and children, large familiescontinue to be their main source of self-worth. This vicious circle isdifficult to interrupt since women live secluded in their extendedfamilies and the majority of girls do not attend school--only 33% ofprimary school aged girls are enrolled in school and only 14% of all womenin Pakistan are literate.
6.08 High fertility rates are also the result of continued high infantmortality, which at 119 per 1,000 live births (Table VI.2) remains highcompared with rates of 93 in India and rates of 50 or lower in Sri Lanka,China, and most countries in Southeast Asia. It is particularly high inrural areas and among low income groups. As a result of high infantmortality, parents attempt to protect themselves against expected deaths
1/ C. Farooq and M. Irfan, "A Micro Empirical Analysis of FertilityBehavior in Pakistan", ILO Working Paper, (1985).
2/ E. Jimenez and J.P. Tan, Educational Development in Pakistan: TheRole of User Charges and Private Education, World Bank, draft, (1985).
3/ This is reflected in markedly higher female infant and child mor-tality rates relative to males, which is unusual by internationalstandards. See: Z. Sathar, Mortality and Health in Pakistan, (1984);and M. Anwar, and M. Naseen, Situation of Children in Rural Punjab,(1980).

-6-
by having more children than the desired family size.11 Crude death rateshave declined but remain high by international standards. The con-siderable scope for further mortality reductions underlines the potentialfor continued high population growth unless fertility can be rapidlycurtailed.
B. Population Projections
6.09 To illustrate the consequences of population growth, a set ofpopulation projections based on alternative assumptions regardingfertility, mortality and contraceptive prevalence are presented inTable VI.3. Data fiom the 1981 census are used as baseline data. Themedium case assumes a reduction of the total fertility rate (TFR) from 6.3in 1985 to 5.6 in 1995 and to 5.1 in 2005. This decline in fertilitywould be possible if decisive progress can be made under the FamilyPlanning Program and if significant improvements in female education andMother Child Health Care Programs can be achieved. The low case repre-sents a more optimistic path of fertility decline. A third scenarioillustrates the pessimistic case with only a small reduction in fertilityup to 1995, and somewhat higher reductions between 2005 and 2015. Asingle time-path of mortality decline corresponding to that used for the1984 World Development Report projections was applied in each scenario.Infant mortality is projected to fall from the present high 119 per 1,000population to 110 in 1990 and 100 in 1995, while life expectancy at birthwould rise from 50 years to 54 years by 1995.
6.10 In all scenaria, contraceptive prevalence rates would need toincrease significantly. To achieve the medium scenario, the contraceptiveprevalence rate would need to reach 14Z by 1995 and 21X by 2005. Toachieve rapid fertility decline, the contraceptive prevalence rate wouldneed to increase to 17Z by 1995 and 35% by 2005. These assumptions under-score the difficult challenge facing the Family Planning Program. Eventhe projections of the medium case are only achievable provided a strongpolitical will exists to improve and expand family planning activities inPakistan. Equally important will be additional complementary activitiesin the education and health sectors needed to increase demand for con-traceptives and bring about the fertility reducing effects associated withstrengthened health and education programs.
1/ In Pakistan there are indications that parents overcompensate forexpected child loss as fertility levels remain above the desiredfamily size even after taking into account average infant and childmortality.

-7-
Table VI.3: POPULATION PROJECTIONS 1985 - 2025
Variable/Scenario 1985 1995 2005 2015 2025
Total Fertility RateHigh 6.3 6.1 5.6 5.0 4.0Medium 6.3 5.6 5.1 4.3 3.4LoW 6.3 5.0 4.0 3.0 2.3
Life Expectancy at Birth (yrs.)High 50.0 53.9 57.8 61.7 65.4Medium 50.0 53.9 57.8 61.7 65.4Low 50.0 53.9 57.8 61.7 65.4
Contraceptive Prevalence Rate (Z) /aHigh 11 11 12 18 20Medium 11 14 21 26 32Low 11 17 35 42 49
Population Size (million)High 94.9 127.4 171.3 226.5 290.3Nedium 94.9 124.9 163.8 210.5 258.6Low 94.9 122.1 151.7 180.6 20ti.5
Population Growth (Z p.a.)High 3.0 3.0 2.8 2.5Nedium 2.8 2.8 2.5 2.1Low 2.6 2.2 1.8 1.3
Dependency Ratio (Z) /bHigh 89.2 89.4 87.1 78.6 71.7Nedium 89.0 85.6 80.2 72.5 62.3Low 89.2 81.5 67.9 56.1 46.6
School Age Population (million) /cHigh 25.6 34.0 46.8 58.3 72.0Medium 25.6 33.4 42.5 53.1 58.5Low 25.6 32.8 36.6 39.3 37.1
Working Age Population (million) /dHigh 50.2 67.3 91.5 126.8 169.1Nedium 50.2 67.3 90.9 122.0 159.3Low 50.2 67.2 90.3 115.7 139.4
/a Number of contraceptive users as a ratio of women aged 15-49.7i Population aged 14 and below and 65 and above as a ratio of population
aged 15-64./c Children aged 5-14.7T Population aged 15-64.
Source: Staff estimates.

-8-
6.11 The projections presented in Table VI.3 clearly demonstrate theimportance of a rapid fertility decline for the future size and structureof the population. With a slow fertility decline (high case) the popula-tion would triple by the year 2025, while with a rapid decline (low case)population size would more than double. Thus in only 40 years the dif-ference in population size between the high and low fertility declinescenaria would amount to 86 million, almost Pakistan's present populationsize. Also, with different fertility assumptions, markedly differentpopulation structures emerge; under the high growth scenario, by 2025 aworking age population of 169 million would have to support 121 milliondependents, while under the low growth scenario a working age populationof 139 million would have to support only 65 million dependents. Underall scenaria, however, population growth rates remain high until the nextcentury. Even under the medium growth scenario it would only be after2005 that population growth rates comparable to other South Asiancountries such as India (2.3%) or Bangladesh (2.4%) can be achieved.
C. Consequences of Population Growth
6.12 The projected rapid population growth will significantly influencethe Government's ability to sustain high economic growth over the long runand ensure adequate improvements in the welfare of its people. While itis difficult to determine the precise consequences of rapid populationgrowth, some implications for employment, the provision of socialservices, urbanization and the environment are briefly discussed below.Detailed implications for education, health and urban development areaddressed in Chapters VII to IX.
Employment
6.13 As a result of the present high population growth rates and the 10to 15 year lag between changes in fertility and the working agepopulation, growth in the labor force will continue to be high for thenext two decades under all scenaria. Assuming constant labor force par-ticipation rates, the size of the labor force would increase from itspresent level of 28.6 million to 35.5 million by the end of the SeventhPlan and to 44 million by the year 2000. About 7 million jobs will there-fore need to be created between now and the end of the Seventh Plan and8.5 million between 1993 and the year 2000. The new labor market entrantswill be largely untrained and illiterate. Only about 40Z of the age groupseeking employment during the Seventh Plan will have completed primaryeducation, only 15% secondary education and only 16% of labor marketentrants will be qualified as skilled or semi-skilled workers. The larreincrease in the labor force coupled with its lack of skills and the likelyslowdown in demand from the Middle East is expected to exert considerablepressure on the labor market and could lead to considerable unemploymentand rising income inequalities.

-9-
6.14 Mainly as a result of the large increase in overseas migration,especially during the 1970's, labor absorption has generally not beenregarded as a serious problem in Pakistan. Migration is estimated to haveabsorbed nearly one-third of the increase in the labor force during theFifth Plan and the Government expected it to absorb about 15Z during theSixth Plan. However, recent economic developments in Gulf countries andthe results of an ILO/ARTEP study suggest that Pakistan will increasinglyface labor absorption problems.l/ The ILO study projects net migrationduring the Sixth Plan to be between 240,000 and 310,000, or about one-halfof that assumed in the Sixth Plan. Declines in economic growth projectedfor oil-exporting Gulf countries will reduce demand for Pakistani laborduring the remainder of the decade, placing considerable strains on theeconomy's ability to both provide employment to new job seekers and accom-modate a larger number of returning migrants.
6.15 There is little reliable data on unemployment in Pakistan.Official estimates place the total number of people unemployed at 1.1million but there is also evidence of considerable underemployment. TheSixth Plan estimated that about 25% of the population work less than 35hours a week. Even this estimate probably understates the incidence ofunderemployment since a large number of the rural population work longhours with low productivity and inadequate incomes. Under this criterion,as many as 37% of the rural population would be considered underemployed.
6.16 Although government policies to encourage sustained economicgrowth will improve the economy's potential for absorbing a rapidlyexpanding labor force, prospects for creating the approximately 7 millionjobs that are likely to be required by the end of the Seventh Plan, appearlimited. Agriculture accounts for about one-half of Pakistan's laborforce but its share is declining-from 54Z in FY75 to 50% in FY85. Ruralunderemployment, increasing rural-urban migration and rising landlessnessall partly reflect limited labor absorptive capacity in agriculture.2/Although the potential for increasing labor demand in the industrialsector appears greater than in agriculture, industry accounts for lessthan 20% of the labor force and its contribution to employment generationwill be increasingly constrained by the ability of Pakistan's educationsystem to provide a sufficient number of adequately trained workers. Withlimited employment potential in agriculture and industry, most of theuntrained labor force will be forced to seek employment in the services
1/ ILO/ARTEP, Impact of Return Migration on Domestic Employment inPakistan, 1984.
2/ See A. Hussain, "Changes in the Agrarian Structure of Pakistan andthe Demand for Farm Labor," ILO/ARTEP, (1982); and M. Khan, "Classesand Agrarian Transition in Pakistan," Pakistan Development Review,(1983).

-10-
sector, where underemployment and disguised unemployment are alreadyprevalent. While government policies which avoid distorting relativefactor costs and encourage education and training can, over the mediumterm, assist labor absorption, reducing population growth should receivepriority over the long run.
The Provision of Social Services
6.17 In order to sustain growth and increase employment an increasein the capital stock will be required in the productive sectors. At thesame time, Pakistan's growing population will increase the demand forsocial services, especially education and health. The impact of rapidpopulation growth on public resources is best demonstrated in the educa-tion sector. Under the medium growth scenario, an additional 1.6 millionprimary and 1.8 million secondary school children would need to be edu-cated during the Seventh Plan. To provide facilities to these students,an additional Rs 17 billion (in 1985 prices) would be needed in capitalfunds, or more than the total amount allocated to education under theSixth Plan. Table VI.4 presents investment and resulting recurrent expen-diture requirements for the education and health sectors needed to accom-modate the growing population under alternative growth scenaria in addi-tion to providing the existing level of services to the presentpopulation. These projections clearly show the considerable savings thatwould accrue from lower population growth. During the Seventh Plan periodthe Government would require Rs 4.8 billion less in real terms if the lowgrowth scenario is achieved instead of the high scenario. The differenceincreases to Rs 19.4 billion over the next seven years and continues torise thereafter. Given Pakistan's poor domestic resource mobilizationperformance, there is a real danger that the requirements to accommodatethe additional population will make improvements in Pakistan's badlyneglected social infrastructure impossible and could, in fact, result in adeterioration in the quality of services provided.

-11-
Table VI.4: PUBLIC OUTLAYS FOR HEALTH AND EDUCATION SECTORSUNDER DIFFERENT POPULATION GROWTH SCENARIA, 1988/89-2024/25
(billion rupees at 1985 prices)
1988/89- 1993194- 2000/01- 2015/16-1992/93 199912000 2014/15 2024/25
Education /a
High GrowthCapital Expenditures 6.18 14.12 11.18 8.11Current Expenditures 49.29 82.22 246.53 221.10
Medium GrowthCapital Expenditures 6.18 11.71 9.7 2.7Current Expenditures 49.29 80.36 227.5 193.90
Low GrowthCapital Expenditures 6.18 9.02 2.38 1.54Current Expenditures 49.29 78.15 195.32 139.20
Health /b
High GrowthCapital Expenditures 18.58 27.02 61.54 50.24Current Expenditures 17.99 36.44 117.40 108.90
Medium GrowthCapital Expenditures 15.93 22.90 55.45 37.64Current Expenditures 17.43 33.52 110.21 98.39
Low GrowthCapital Expenditures 14.78 19.45 33.84 18.43Current Expenditures 17.00 33.81 99.13 79.87
TOTAL
High Growth 92.04 159.80 436.65 388.35Medium Growth 88.83 148.49 402.86 332.63Low Growth 87.25 140.43 330.67 239.04
/a Assuming that present enrollment rates are maintained (see Table VII.9)Th Assuming that the improvements suggested in Chapter VIII of this report
are implemented until the year 2000, and the level of healthservices are kept constant thereafter.
Source: Staff estimates.

-12-
Urbanization
6.18 By the turn of the century, the number of people living inPakistan's cities will double to about 60 million. This means thatPakistan's urban centers will have to accommodate more than 30 millionadditional inhabitants over a period of only 15 years. Clearly, anincrease of this magnitude will exert considerable pressure on Pakistan'salready weak urban infrastructure and will require substantial investmentsto prevent a rapid deterioration in urban living conditions. Moreover,contrary to the experience in other countries urbanization in Pakistanwill not reduce population growth over the medium term. Since urbanfertility rates have remained as high as rural ones but urban mortalityrates are lower, urban population growth is expected to remain above thenational average.
Environmental Degradation
6.19 Increased population growth and the resulting pressures on naturalresources are likely to accelerate the already serious process of environ-mental degradation in Pakistan. In rural areas degradation has manifesteditself in deforestation, rangeland degradation and desertification, soilerosion and landslides, waterlogging and salinity in irrigated areas. Theincreasing population in urban areas has led to serious air and waterpollution, particularly in Karachi. The degradation process will havesignificant economic and social consequences, which have already beenmanifested in disputes over grazing rights and access to forest resources.An accelerated degradation process is likely to affect the poorer popula-tion more severely. Rising fuelwood prices already make it increasinglydifficult for the poor to purchase sufficient quantities for heating andcooking. The degradation and desertification of overgrazed arid andsemi-arid ranges threaten the economic survival of tribal populations.Shifting sand dunes bury fields, irrigation systems, roads and villages.There is much that can be done to arrest this process. Measures neededinclude a comprehensive national forestry and national range managementpolicy, strengthened institutional and legal frameworks, and continuedefforts to include the refugee community in reforestation and watershedprotection activities. However, by far the most effective policy to limitenvironmental degradation will be to reduce population pressure onPakistan's limited natural resources.
D. Slowing Population Growth
6.20 While there is no single policy intervention which can by itselfcause the fertility decline assumed in the medium scenario, research hasshown that family planning programs and the use of contraceptives havebeen the single most important influence in countries which experienced a

-13-
rapid fertility decline.l/ However, it is also clear that family planningprograms can only be effective if operated in a receptive environment andwhere complementary activities supporting the family planning efforts andstrengthening the role of women in society are carried out. This has twoimportant implications for Pakistan's population control strategy. First,building a receptive environment will not only entail a strong commitmenta high government levels but it must also permeate to lower administra-tive levels and the community at large. Second, expanding opportunitiesfor women will require educating women. The impact on reduced fertilityof an educated female population which is integrated in economic life andhas access to activities and options outside the household has been welldocumented in many countries.2/ With an improvement in the social statusof women the desire for large families with several sons and the costsassociated with daughters decrease. In Pakistan, establishing a com-prehensive female education program and effective, Mother Child CareServices will be of overriding importance, since social constraints areexpected to continue to hamper the effectiveness of the Family PlanningProgram for the forseeable future. Chapters VII and VIII discuss requiredprograms for the health and education sectors. The remainder of thischapter focuses on the need to improve and strengthen the Covernment'sfamily planning program.
The Family Planning Program
6.21 Pakistan was one of the first developing countries to initiate afamily planning program. But its history has been fraught with problemsand controversy and its effectiveness has suffered from frequentreorganizations, changing approaches, interruptions in the program, andthe very difficult environment in which it operates. Family planningbegan in the 1950s with volunteer efforts and was extended in 1965 by aseparate government family planning program for rural areas. This programwas interrupted from 1969 to 1971, reorganized in 1973 and 1975 andaltogether suspended in 1977. Population programs were resumed in 1980under the Population Welfare Program, 1980-83 (PWP). Building on thelessons of the previous 20 years, the PWP avoids the earlier over-optimistic objectives of fertility decline and adopts a multisectoral
1/ A composite picture of 31 countries which experienced large fer-tility declines shows that of the total reduction of almost 5children: delay in marriage age contributed a reduction of 1.4children; reduced breast-feeding worked in the opposite direction,raising fertility by 1.5 children; and increased use of contraceptioncontributed the most, 4.5 children. World Development Report, WorldBank, (1984).
2/ M. Cain, Women's Status and Fertility in Developing Countries, WorldBank Staff Working Paper, No. 682.

-14-
approach, not confined to single purpose birth control activities. ThePNP has three major components: (i) the establishment of Family WelfareCenters (FWC) to provide family planning services jointly with mother-child health care, motivation/education and community developmentactivities; (ii) the provision of gynecological and obstetric services andcontraceptive surgery through reproductive health service centers estab-lished in government and private sector hospitals; and (iii) the implemen-tation of a major Information, Education and Communication (IEC) Program,which through mass media, personal and group communication is to promotesix main themes-breastfeeding, maternal and child care practices, nutri-tion of the growing child, responsibility of the father, late marriage,and the status of women.
6.22 The multisectoral, more cautious approach of the PWP appearsappropriate for Pakistani society but progress made under the program hasbeen extremely slow. While some improvements are noticeable over the lastfew months, the program as a whole lacks sufficient visible and activesupport from all levels of government and within the political structure,its services are of inconsistent quality due to management and staffingproblems, demand for family planning activities remains poor and access tofamily planning services remains limited. To achieve the contraceptiveprevalence rate of 14% in 1995 and 21% by 2005 required for the mediumgrowth scenario, a major strengthening of the program is needed.
6.23 Strengthening the Government's PWP will not be an easy task andwill require time and perseverance. There are no easy solutions or majorpolicy changes which can produce immediate results. However, two factorswill be critical in determining the long term success of the program: thedegree of political commitment to family planning and the administrativecapacity of the Government to coordinate the deployment, training, super-vision and availability of staff. At present, the PWP is hampered byadministrative weaknesses which, in part, appear to result from a lessthan full commitment to family planning. Administrative efforts will needto focus on four key areas: (i) creating demand for family planningservices; (ii) improving the quality of services provided; (iii) expandingthe outreach of family planning activities; and (iv) ensuring appropriatefunding levels.
Political and Administrative Commitment
6.24 In Pakistan, the overriding issue in population planning is theauthorities' comm.itment, which in turn is constrained by deepseated socialand cultural norms. Many of the obstacles to the expansion and improve-ment of family planning can be overcome with sufficient commitment, butfew of them will be overcome without it. While commitment has clearlystrengthened at the highest government levels, there continues to be vocalopposition and disinterest in many groups of society and some medium andlower levels of federal and provincial administrations. It is criticalthat the key role assigned to population planning in the Government's

-15-
deveLopment strategy be reinforced among the top leadership and opinion-making groups, as well as throughout the federal and provincialadministrative structures of government. Without such a commitment, evenimproved policies and financial allocations will have little impact onefforts to reduce population growth.
6.25 Developing the necessary level of commitment and internal consen-sus is also the most difficult challenge confronting the Government.Efforts are needed to explain the rationale and goals of the Government'sPWP through meetings, discussions and sustained publicity drives designedto assure the public that family planning is acceptable and beneficial.The Government should attempt to enlist the support of key opinionleaders, such as military and religious representatives, women's groups,members of the business and farming community, school teachers andjournalists. In view of the responsibility of provincial governments inthe implementation of population programs, the support of provincialleadership groups will be critical. In this respect two areas warrantspecial attention. First, in order to strengthen the consensus-buildingprocess, the Government should emphasize the long term consequences ofhigh population growth for provincial budgets and their ability to meetthe social needs of their constituencies. Second, the respective roles offederal and provincial authorities shouLd be clarified and a more activistfunction assigned to provincial and local staff in the implementation,monitoring and evaluation of population programs.
Creating Demand for Family Planning Services
6.26 Knowledge about contraceptives in Pakistan is unusually low. InFY80 only 26% of women knew about at least one efficient contraceptivemethod, with markedly higher knowledge in urban (43%) than in rural areas(21%). Knowledge among illiterate women was 23% compared to 45% amongwomen with primary education and 642 among women with secondary or highereducation. In FY80, use of contraceptives was reported at 4.9% which nextto Nepal was the lowest contraceptive prevalence rate in South Asia. Useand knowledge was particularly low among women below the age of 25 (1.3%)and highest among urban women above 35 (9.8%).l/ This knowledge andcontraception prevalence rates were below rates obtained in 1969.However, since family planning activities were reintroduced in 1980 thereare indications that knowledge and use have risen back to previouslevels.2/
1/ G. Soomro and S. Ali, Prevalence of Knowledge and Use of Contraceptionin Pakistan, PIDE, (1984).
2/ These are preliminary results obtained under the ContraceptivePrevalence Survey carried out by USAID in 1985.

-16-
6.27 Low knowledge and utilization rates point to the need tostrengthen IEC programs. This requires that nearly one-third of IECpositions which remain vacant at federal and provincial levels be filledexpeditiously. Personnel with specialized communication skills shouldalso be recruited from outside the Government for these positions. Manyof the staff now in place lack adequate skills in IEC strategy and need toreceive intensive training. The campaign in particular needs to bedirected toward 19 to 29 year old illiterate or semi-literate women, whogive birth to about 75Z of Pakistan's children. Priority needs to begiven to IEC programs in rural areas, where knowledge of efficient birthcontrol methods is especially low, utilizing in particular radio andpersonal contact. In urban areas relatively more importance should beattached to quality improvements to ensure that initial acceptors willcontinue and act as motivators for other women.
Provision of Services
6.28 rue Family Welfare Centers (FWCs) are the core of Pakistan'sfamily planning efforts. About 1,250 have been established, each staffedby five workers and expected to serve about 20,000 people. However,existing centers remain poorly utilized and provide little in familyplanning activities. Average daily attendance is only 11 and less than20- of patients seek family planning services. The number of patientsseeking para-or postnatal care is also very small. The major reasons forthis underutilization are: reluctance of women to be associated withFUCs, lack of knowledge about the services provided, and difficulties intraveling to FWCs. The already questionable image of FWCs is frequentlycompounded by poor quality and irregularity of services due to staffvacancies, staff absenteeism, high turnover rates and inadequate suppliesof contraceptives and drugs. The staff is often untrained and findsitself overextended among the many activities of FWCs. These problemshave led to insufficient emphasis on family planning services.
6.29 Staff vacancies are primarily due to difficulties in recruitingfemale workers, especially to rural areas. Recruiting female workers isconstrained by low salaries and the fact that women are reluctant to beseparated from their families and the low prestige associated with workingfor the family planning program. Better incentives, such as salarybonuses might be needed to overcome these obstacles. Equally importantare more and regular supervision and training to control absenteeism andto improve the quality of services, and the adequate provision ofappropriate drugs and contraceptives. The lack of leadership at thedistrict level and regular supervision appear to be the main reasons forthe poor quality of service.
Expanding Family Planning
6.30 To achieve the contraceptive prevalence rates assumed under themedium growth scenario a much wider outreach of family planning activities

-17-
is required. Since FWCs continue to face operational difficulties,upgradation and consolidation of their services rather than expansion isrecom_ended. Three additional channels need to be explored and developed:(i) the use of health facilities, particularly in rural areas, includingthe existing network of Basic Health Units (BHUs) and Rural Health Centers(RHCs); (ii) more intensive use and support of Non-GovernmentOrganizations (NGOs); and (iii) wider distribution of contraceptivesthrough the commercial system.
6.31 At present, the existing 4,900 rural health facilities are notused for family planning services. The Government has recently decided tointroduce family planning services in rural health facilities. This is awelcome decision but for it to be effective a general upgradation of theexisting rural health structure will be required, involving the trainingof staff, new supervisory arrangements, and improved logistic and supportsystems. Chapter VIII (paras. 8.17-8.18) addresses these points indetail. NGOs have often been pioneers in the population field and theirparticipation is usually cost-effective, especially in innovation anddemonstration activities, community organization and research. AlthoughNGOs have been playing active and important roles since the inception ofthe family planning program in Pakistan, historically they have receivedlittle attention from government planners. Recognizing their potentialrole, the Population Welfare Division established the NGO CoordinatingCouncil in January 1985. To increase the compatibility and complemen-tarity of NGO programs with those of the Government, a critical evaluationof the structure, achievements and limitations of NGO projects should beconducted by the Council. The findings would also be useful in settingthe long-term goals for the NGOs and in determining their future contribu-tion to the national population program. The distribution of contracep-tives through commercial channels needs to be strengthened.Contraceptives are already available in retail shops, but the prices aretoo high for people in lower income groups. In order to make contracep-tives available at low cost, the Government has recently approved theSocial Marketing Contraceptive Project which involves the commercialdistribution of contraceptives at subsidized prices.
Financing Family Planning
6.32 While financing has not been a serious impediment to progress infamily planning in Pakistan, financial allocations might become a con-straint with the significant expansion needed to reach the contraceptiveprevalence levels assumed under the medium growth scenario. Pakistan'spresent public expenditures per contraceptive user are estimated at Rs 425
-18-
p.a., a relatively high amount by international standards.l/ High usercosts are likely to result from the difficult socio-cultural environmentin which the family planning program operates, which requires high invest-ments to reach acceptors. Assuming constant user costs, a total alloca-tion of Rs 1,670 million (in FY85 prices) would be needed by FY95 to reachthe contraceptive prevalence level of 14Z required under the medium growthscenario.21 This compares to a total allocation of Rs 802 million in FY86,representing a substantial real annual increase of 8.51 between FY86 andFY95. There is, however, potential to decrease user costs. As the familyplanning program expands, economies of scale will become available, whileincreased reliance on a commercial distribution system and NCOs wouldreduce costs further.
1/ In 1980 Pakistan's expenditure per contraceptive user amounted toUS$33, while the average cost of countries for which data are avail-able amounts to US$21. But costs vary greatly, from US$5 in Peru toUS$69 in Nepal. See R. Bulatao, Expenditures on Population Programsin Developing Regions, World Bank Staff Working Paper, No. 679.
2/ Calculations are based on a total female population in the reproduc-tive age group (15-49) of 28.1 million in FY95, a 14X contraceptiveprevalence rate and an annual unit cost of Rs 425.

-19-
Chapter VII: The Education Sector
7.01 The weak educational base on which Pakistan's development has beenbuilt will constrain economic growth over the long run and prevent a moreequitable distribution of the benefits from high growth. While the educa-tion priorities and strategies which were articulated in the Sixth Planremain appropriate, it is clear that educational targets are excessivelyambitious and should be recast to be attained during the Seventh Plan.Even under this more realistic approach, the Government's task will beformidable. Emphasis will need to be placed on both improvements inquality and expansion of the education system at the primary and lowersecondary leveLs. Improving quality will need to focus on the provision ofteaching materials, teacher training, increased supervision, and moreflexible curricula. Expansion of education will not only requireincreased financial allocations but also a strong comitment to limit thegrowth and subsidization of higher education in order to redirect resour-ces to the primary and secondary levels.
A. Present Situation
7.02 The education sector has been severely neglected in Pakistan. Thecountry's literecy and school enrollment rates are among the lowest in theworld (Table VII.1). Only 24% of Pakistan's population knows how to readand write and only 49% of its primary and 16X of its secondary school agepopulation is enrolled in school. Rural-urban and male-female imbalancesare striking; literacy rates range from 6% for rural females to 52% forurban males and primary enrollment rates from 33% for rural females to 77%for urban males. Only 15% of the rural population compared to 44% of theurban population is literate and 68Z of the urban primary school-age groupis enrolled in school, compared to 40% in the rural areas. Moreimportantly, little progress has been made in this sector in the lastfifteen years as the education system has barely kept pace with therapidly expanding school-age population. The unusually low educationalattainments of Pakistan's rapidly growing population, particularly of thefemale population, will become a serious impediment to the country'slong-term development process.

-20-
Table VII.1: COMPARATIVE EDuCATION INDICATORS, 1984(percent)
Enrollment RatesPrimary Secondary Higher Literacy Rate
Pakistan (1985) 49 16 5 24India 79 30 9 36Bangladesh 60 15 4 26Sri Lanka 103 54 4 86Low Income Economies 85 30 4 n.a.Lover Middle IncomeEconomies 103 35 10 n.a.
Source: World Development Report 1985; Social Indicators Data Sheets, WorldBank, 1984
7.03 Pakistan's poor educational base is primarily the result of per-sistent and serious underfunding, in itself caused by low priorityaccorded to the education sector. Although some progress has been made inrecent years, Pakistan has never allocated more than 2X of GNP and 8Z ofpublic expenditures to the education sector, a small amount compared withthe 3-6% of GNP and 12-15% of public expenditures generally provided inother Asian countries. While development spending during first two Planyears (FY84-85) remained below projected allocations, it represents a realincrease of 28% over average spending during the Fifth Plan. The FY86budget allocated Rs 3.0 billion in development funds to the educationsector, which compares favorably with the Rs 3.5 billion allocated duringthe first two years of the Sixth Plan. The unsatisfactory situation ineducation is also the result of inappropriate subsectoral allocations.More than other countries Pakistan has allocated investment funds tohigher education at the expense of primary and secondary education.Successive Plan documents have proposed reversing this investment biasby reallocating resources to primary and secondary education, butimplementation has failed. In an attempt to break with the past, thepresent Government introduced in the FY86 budget a special developmentfund (Rs 772 million) for primary education thereby increasing its sharein the development budget for education to 58Z compared with an average of24% during the first two Plan years.
7.04 The priority given to investments in higher education is not inline with the findings of economic research which shows that social andprivate returns are highest to primary education, even if secondarybenefits derived from primary education, which are difficult to quantify,are excluded. Secondary benefits shown to be related to both primary andsecondary education include: improved industrial and agricultural

-21-
productivity, improved health, reduced fertility and changes in socialbehavior, conducive to the development process. In Pakistan, the positiveimpact of primary and secondary education on agricultural productivity,health and fertility is well established. For instance, it has been arguedthat the large differentials in agricultural yields between East(Pakistan) and West (India) Punjab are, in large measure, the result ofhigher levels of educational attainment in West Punjab.l/ Table VII.2shows rates of return by level of education for 1985. A detailed presen-tation of the assumptions underlying the calculations is presented inAnnex 2. Results obtained from Pakistan data are comparable to thereturns to education calculated in a recent cross-country survey, whichconcluded that returns to education are high and that within the educationsector, highest for primary education.2/
1/ D. Wheeler, Human Resource Development and Economic Growth inDeveloping Countries, World Bank Staff Working Papers No. 407, (1985);S. Ali, "Contribution of Education towards Labor Productivity: ACross-Country Study," Pakistan Economic and Social Review, (1985);For the Pakistan case the impact of education, particularly secondaryeducation, on agricultural productivity has been shown by: S. Butt:"Education and Farm Productivity in Pakistan," Pakistan Journal ofApplied Economics (1984); World Bank, Review of ComparativeAgricultural Performance in East and West Punjab," (Draft Report,1983).
2/ Results show that for 45 developing countries reviewed, socialreturns to primary education amount to 24%, 152 for secondary, and 13%for higher. Private returns to primary education amount to 31%, 19%for secondary, and 22% for higher. G. Psacharopoulos, "Returns toEducation: A Further Internationel Update and Implications", Journalof Human Resources, (1985).

-22-
Table VII.2: RATES OF RETURN BY LEVEL OF EDUCATION, 1985(percent)
Intermediate DegreePrimary Secondary Colleges Colleges University
Social Rate of Return 16.4 /a 6.3 11.3 10.3 7.8Private Rate of Return 21.1 6.7 13.4 11.6 11.4
/a The social rate of return increases to 39.1% if opportunity costsare not taken into account at the primary level.
Source: Staff estimates.
B. Education Strategies
7.05 The following section analyzes education strategies at differentlevels with a special focus on primary education. Other levels ofeducation--secondary, higher, non-formal, and literacy education-are alsodiscussed. The more specialized areas of te_..hnical and vocational educa-tion are excluded. Major issues which cut across education subsectors arediscussed in Section C.
Primary Education
7.06 A rapid expansion of the primary education system coupled with animprovement in the quality of instruction should receive priority.Primary enrollment rates have improved little over the last 15 years andeven deteriorated under the Fifth Plan: 43% if the primary school-agegroup was enrolled in FY72, 54% in FY78 and 492 in Fv85. Progressexpected under the revised Sixth Plan remains modest, with 53% of the agegroup attending primary school by FY88. The efficiency of the primarysystem measured in terms of drop-out and repeater rates is among thelowest in the world; only 50% of the students who enter, complete theprimary cycle.l/ Low enrollment, high drop-out and repeater rates arecaused by poor quality of instruction, long travel distances to reach theschools, high opportunity costs and an unusually low demand for educationin rural areas.
1/ The average primary school completion rate- is 60% for low-incomecountries and 75 for middle-income countries. East Asian Countrieshave an average completion rate of 66%.

-23-
7.07 Lack of Demand. Demand for basic education in urban areas is highand schools tend to be overcrowded. In contrast, demand in rural areasremains low with underutilized facilities and small class sizes. Even invillages with a functioning school it is often difficult to convinceparents to enroll their children in primary school. Opportunity anddirect costs for education are high in rural areas and benefits derivedfrom basic education are not as immediately apparent compared to urbansettings. Opportunity costs of education are estimated to amount to Rs250 to Rs 2,120 p.a. for primary school aged boys due to the extensiveuse of child labor in carpet ccttage industries, textile units andagricultural tasks.l/ Direct costs of primary education are also high, asfees for learning materials, uniforms and special school funds amount toRs 93 p.a./student. To stimulate demand for primary education, the provi-sion of free learning materials should be considered in selected lowincome rural districts. Additionally, the extensive use of Zakat funds tofinance learning materials for needy students should be continued.2/ Toreduce opportunity costs, a more flexible teaching schedule will need tobe introduced. At present, all rural and urban children are taught at auniform daily and yearly schedule. Such uniformity is not required andDistrict Education Officers (DEOs) should be authorized and encouraged toadjust teaching schedules in line with competing demands on children'stime, taking account of the seasonal requirements in agriculture andtextile units.
7.08 Access to Education. Inadequate physical access to education hasbeen identified as a major cause for low enrollments and high drop-outrates, particularly in Sind and Baluchistan, where the population issparsely distributed. The average student in Baluchistan has to walk 3miles to reach the closest primary school and 2 miles in rural Sind.3/For primary school children the Likelihood of attending school dropssubstantially even when the one way walk is only one mile to anothervillage as opposed to a school in their own village, then drops again if a
1/ For detailed calculations see J.P. Tan and E. Jimenez, EducationalDevelopment in Pakistan, The Role of User Charges and PrivateEducation, World Bank, (draft, 1985). For a more detailed analysis ofthe influence of income on enrollment and drop-out rates also see S.R.Khan: An Analysis of School-Level Enrollments, Drop-outs and Outputin Pakistan: Supply and Demand Side Consideration 1970/71-1982/83,PIDE, (Seminar Draft Report, 1985).
2/ A more detailed description of the Zakat fund system is providedin Annex 1.
3/ See Ministry of Education, National School Mapping Survey, 1984; andPlanning and Development Division Survey of Primary Education inSelected Districts, 1985.

-24-
two mile walk is involved. Distance to a primary school also precondi-tions secondary school attendance. The chances of receiving higher educa-tion are significantly greater if a primary school is close by.1/ Theseresults point to the need for schools at closer distance even in ruralareas where population density is low and where school sizes thereforewill remain small.
7.09 Expansion at low cost can be provided through the Mosque SchoolProgram as originally envisioned under the Sixth Plan. However, littleprogress has been made so far under the program which proposed to estab-lish 42,300 mosque schools during the Plan period. Only 4,653 mosqueschools were opened in FY84-85 and a further 8,400 mosque schools are tobe operating by FY88. First evaluations of the program point to encourag-ing results. Enrollment rates are higher and drop-out rates lower than incomparable regular primary schools. Attitudes of teachers and Imams ofschools participating under the scheme are positive and they support afull integration of the mosque schools into the regular system.2/ Thisintegration is lacking; contact between teachers of mosque schools andDEOs is minimal, and supervision and inspections completely absent.Significant organizational shortcomings continue to trouble the program.Salaries are paid irregularly and mosque schools have often been opened invillages where adequate primary schools existed. In addition, qualifica-tions of mosque school teachers are much lower than in regular schools,since only 7% of teachers hold a teaching certificate. To improve theintegration and quality of teaching in mosque schools, special mosqueschool supervisors should be appointed under each DEO. To assist thelargely untrained teachers, the supervisors should be aided by learningcoordinators responsible for five to ten mosque schools each, who would befully trained and experienced teachers and would provide in-service,on-the-job training to mosque school teachers.3/
7.10 Quality Improvements. The expansion of the primary educationsystem needs to be complemented by efforts to improve the quality ofexisting schools. Low quality of teaching is partly the result of under-
1/ R. Lucas, Selectivity in Use of Educational and Health Facilities inSind, (Draft Report, 1984). Similar results have been found in asurvey on primary education in rural districts in Pakistan. Thesurvey shows that only 15Z of the primary school age population livingfurther than three miles away from a school is enrolled.
2/ Government of Sind, Education Department, Evaluation Report of MosqueSchools in Sind, (1984); Ministry of Education, Evaluation of theSpecial Mosque Schools Program, (unpublished, 1985).
3/ The use of learning coordinators has been tested in the IDA-financedPrimary Education Project (Cr. 892-PAK) with very favorable results.

-25-
funding of recurrent expenditures. Pakistan spends Rs 373 p.a./student(US$24), which approzimates average primary student costs in other SouthAsian countries but is much below the average $59 p.a. of other low incomecountries. More importantly, about 92% of unit costs is spent on teachersalaries while only Rs 3 p.a. are spent on learning materials. A largerallocation, in the order of 10% of per student expenditures, needs to bemade for provision of learning materials as education research has pointedto their significant contribution to student achievement.l1
7.11 Other factors identified as significant for the reduction ofdrop-out and repeater rates are regular and intensive supervision ofteachers, control of teacher absenteeism and improved facilities. About30% of schools are without school buildings and physical conditions werefound to be inadequate in 70Z of schools surveyed in a recent schoolmapping exercise.2/ At present, the system of supervision is insufficientas each Assistant Education Officer has to supervise between 150 to 200primary and secondary schools in addition to performing a ho>; ofadministrative duties. The number of schools assigned for supervision toone officer is too large and supervisors tend to spend most of their timeon the secondary instead of the primary system. An alternative intensivesystem of supervision has been tested under an experimental projectincluding 4,000 primary schools and is now being implemented in 55 dis-tricts in Sind, Baluchistan and NWFP. Enrollment rates under theexperimental project have increased by 30% in the project schools anddrop-out rates reduced from 52% to 38Z.3/ To improve the quality ofinstruction it is recommended that the tested supervisory structures beexpanded gradually. In particular, the position of a special AssistantDistrict Education Officer for primary education should be created,relieved from administrative duties and made solely responsible for thesupervision of teaching in primary schools. More importantly, the conceptof learning coordinators, each supervising up to ten schools, should beintroduced gradually as a regular feature.
7.12 Adjustments in Curriculum. An overextended, rigid and demandingcurriculum for the primary cycle places a heavy burden on primary schoolteachers and children. Curricula are standardized throughout the country
1/ B. Fuller, Raising School Quality in Development Countries: WhatInvestments Boost Learning, (1985).
2/ See: National School Mapping Survey, 1984, op.cit. Physicalfacilities are particularly poor in Punjab, where about 50% of schoolsare shelterless.
3/ A special evaluation program on the affects of improvements ofspecific inputs on drop-out, repeater and enrollment rates has beencarried out under the IBRD Primary Education Project (Cr. 892-PAK).

-26-
not taking account of rural/urban and male/female differences and theneeds of students with different local languages. A drastic reduction andsimplification in the content of teaching and a more flexible curriculumadjusted to local needs is required. Recognizing that due to high oppor-tunity costs, drop-out rates will remain high even with improved qualityof primary education, a two stage primary cycle should be introduced. Itshould consist of a minimum core program teaching only the local language,numeracy, and elementary Urdu in Grades 1 to 3 and a social studies com-pone.nt added for Grades 4 and 5. The core curriculum taught in Grades 1to 3 should have teaching of literacy and numeracy as its only objectiveand be sufficiently rigorous to avoid relapsing into illiteracy, ensuringthat the students dropping out before Grade 5 have received some basicretainable education.l/ The Sixth Plan proposed the introduction of asimplified and integrated curriculum, but little progress has been made.Introduction of such a two stage simplified cycle should be a transitionalarrangement until universalization of primary education can be achieved,demand for primary education increased and drop out rates reduced.
Secondary Education
7.13 The constraints in secondary education are similar to those inprimary education: the need for increased access, a more relevantcurriculum, improved facilities and better teacher training andsupervision. The Sixth Plan strategy rightly focuses on science,mathematics, and technical education as a priority. However, such areorientation of the curriculum is hampered by insufficient and poorlytrained science and mathematics teachers, outdated curricula, under-equipped laboratories and inadequate teaching materials. Also, thestrengthening of secondary education for female students has so far notreceived sufficient attention. As many of the benefits derived fromfemale education (para. 7.23) become pronounced only after completion ofthe secondary cycle, expansion of female secondary schools needs to begiven priority.
Higher Education
7.14 Higher education in Pakistan covers a wide spectrum of differentinstitutions, including intermediate and degree colleges, professionalcolleges and universities. In comparison to the primary and secondaryleveLs, higher education has received relatively larger allocations duringpast Plan periods, ranging between 30% and 50% of total education develop-ment expenditures. Large financial allocations have been partly the
1/ The reduced simplified program for Grades 1 to 3 would also con-stitute the core program for mosque schools to be taught by theteachers while instruction in Arabic and Islamyat could be given bythe Imam.

-27-
result of a deliberate Government policy, but also a response to strongsocial pressures exercised by urban interest groups demanding more andbetter higher education facilities.l/ As a result, in all Plan periodsactual expenditures exceeded planned allocations. However, generousfinancial allocations have not been matched by comparable improvements inquality. At most institutions of higher education, quality of instructionis low, largely as a result of poor curriculum design, inadequatelytrained and supervised teachers, shortages of textbooks, teachingmaterials, laboratory and workshop equipment, and library resources, etc.But poor quality is also the result of the very fragmented and unstruc-tured system of higher education which is difficult to manage efficiently.This is particularly apparent in the area of college education, whichincludes intermediate, degree colleges and professional colleges. Itincludes Grades XI ai' XII, which in most other countries are part ofsecondary education. The Sixth Plan proposed to transfer Grades XI andXII to the secondary levels and to reconstitute colleges as exclusivelydegree level institutions but no progress has been made. Restructuring ofcollege education along the lines proposed by the Sixth bLan shouldreceive priority.
7.15 The last 15 years have been marked by a proliferation of univer-sities. While Pakistan had only one operating university at Independence,20 were operating in FY85. An additional 15 medical and professionalcolleges have also been established. The large quantitative expansion hasled to the establishment of small, unviable and expensive institutions.Average student/institution and student/teacher ratios are unusually low;they amount to only 2,600/1 and 10/i, respectively. Small institutionsand generous staffing has led to high unit costs; at Rs 12,800, annualcurrent expendiLure per student is significantly larger than in otherSouth Asian countries. In spite of this, the quality of university educa-tion is considered to be low and deteriorating.2/ This is partly theresult of relatively poor equipment and facilities provided in theuniversities; about 85Z of current expenditures are for salaries, leavingvery little for library material, research, and laboratory equipment. Butit is also the result of an inadequate incentive and supervision systemwhich would encourage better teaching and research.
1/ It is only under the Third Plan and the Non-Plan period that aspecial emphasis on higher education was made explicit. In all otherPlan periods priority was given to primary and secondary educationwhich was then abandoned during Plan implementation.
2/ For an assessment of the qua'litative aspects of university educationsee: S.R. Khan and R. Siddiqui, Chapter 6 in Higher Education andEmployment in Pakistan, UNESCO and Ministry of Education,(forthcoming, 1986).

-28-
7.16 The Sixth Plan projects a relatively low allocation of 12Z ofdevelopment funds to the university sector and advocates a consolidationand upgradation of the existing system. This strategy is appropriate andshould be firmly implemented and maintained throughout the Seventh Plan.There is ample scope for increasing enrollment levels through betterutilization of existing facilities, increased student intake, betterfinancial management, and if necessary selective expansion of existingcampuses. Qualitative upgrading should be pursued selectively, givingemphasis to the science faculties and the identified centers ofexcellence, and concentrating on improvements of teaching standardsthrough better supervision and evaluation.
Non-formal Education and Mass Literacy
7.17 Pakistan has attached low priority to its non-formal educationprogram but placed major emphasis on the deveLopment of a mass adultliteracy program in the Sixth Plan: 15 million persons were to be madefunctionally literate during the Plan period. However, progress has beennegligible due to major problems encountered in the organization of theliteracy campaign and lack of demand among adults for literacy training.The existing 9,000 literacy centers remain largely unutilized. Theanticipated scope of the literacy program has now been scaled down to amore realistic level; 2.2 million are to be made literate, complemented byadditional programs organized at the union council level expected to reachanother 2 million.
7.18 The present more modest program is appropriate in light of theneeds of the country's formal education sector and the difficultiesexperienced in reaching adults. Given the tremendous advances which haveto be made in the formal basic education system, it will be difficult toorganize a full-fledged literacy program without diverting financial andmanpower resources away from higher priority subsectors. While literacytraining should continue to be made available on the present scale,emphasis on a broad based mass-literacy program as originally envisionedin the Sixth Plan, should instead be postponed until the proposed SeventhPlan targets have been achieved and mcre experience has been gained withongoing pilot projects. A clear choice in favor of the school-age popula-tion is warranted to secure minimal educational attainments of futuregenerations. Prospects for rapid progress are likely to be greater in theformal primary and secondary system, where administrative structures arealready in place and demand for education among school-age children--albeit low--is still higher than among the adult population. While it canbe argued that in order to stimulate demand for basic education adults aswell as children need to become literate, this does not appear an effec-tive short-term strategy for Pakistan. Benefits to be derived from adulteducation are unlikely to materialize quickly, resulting in a delayeddemand response among school age children. More direct demand creationprograms, including in particular reliance on religious leaders and thedevelopment of Lhe Mosque School Program, appear more promising.

-29-
C. Major Issues
Female Education
7.19 The Sixth Plan document describes the situation of women inPakistan as ". . . simply shocking . . . a sad commentary on the legacy ofneglect-compelling a speciaL and separate emphasis for this sector."Female education indicators clearly reflect this situation: 94% of womenin rural areas are illiterate, 79X of rural girls do not enroll in primaryschools and 97X do not attend secondary school, and less than 1Z offemales enroll in higher education (Table VII.3). While some progresshas been made in urban areas the situation of rural women has notimproved. Low female enrollment rates are a reflection of prevalentsocial values in rural areas where a strong bias exists against anyactivity which takes females away from the home, particularly at the ageof puberty.l/ Low social demand for female education has in itselfresulted in a limited number of schools for girls. In FY83 only 30% ofall primary schools were for girls. Facilities available are generallyunderutilized and drop-out rates significantly higher than for malestudents. Average female student/institution ratios in rural areas are aslow as 40/1 at the primary and 50/1 at the secondary level while annualdrop-out rates are as high as 20% at the primary level. Access to primaryschools is the most important factor influencing enrollment andattendance. Only 2% of girls were enrolled in school if the school wasfurther than 3 miles away and drop out rates were 50% higher if the schoolwas not in the same village.2/ Due to low female enrollment rates and theconcentration of female students on the primary level where public sub-sidies are low because of the relatively low unit costs compared to highereducation, female education accounts for only 3OZ of total direct studentexpenditures in Pakistan.
1/ The Planning and Development Division Survey of Primary Schools,op.cit., shows that 52% of the surveyed population reported to behostile toward education of girls, while only 16% reported to behostile toward education of boys. The same survey shows that girlswho drop out of school generally do not engage in income earningactivities but remain at home.
2/ Planning and Development Division, Survey of Primary Education inSelected Districts, Volume I, (1985).

-30-
Table VII.3: FEMALE EDUCATION INDICATORS, 1970/71-1982/83(percent)
Primary Secondary HigherLiteracy Education Education EducationRate Enrollment Enrollment Enrollment
1970/71 12 26 6 0.21977/78 10 33 9 0.51982/83Total 14 33 11 /a 0.5Rural 6 21 3 7i n.a.Urban 34 68 39 7i n.a.
/a For Grades VI-VIII, corresponding enrollment rates for GradesIX-X are 8% (total), 1Z (rural) and 27% (urban).
Source: Fourth, Fifth and Sixth Plan documents.
7.20 There are serious economic consequences of neglecting femaleeducation. The impact of female education on reduced fertility, improvedchild health and reduced infant mortality has been firmly established ineconomic literature and confirmed for Pakistan: educated women marrylater, desire fewer children, have fewer births, lose less childrenthrough deaths at early ages and use contraception more than uneducatedwomen.lI In Pakistan the impact is particularly strong in rural areas andespecially when the secondary school cycle is completed. The averagefamily size of a literate woman is 3.5 children smaller than of illiteratewomen.
1/ Z. Sathar, "Does Female Education Affect Fertility Behavior InPakistan?" Pakistan Development Review, (1984); Khan and Sirageldin,"Education Income and Fertility in Pakistan," Economic Development andCultural Change, (1979); G. Soomro, N. Farooqui, H. Siyal, AMultivariate Analysis of Program and Non-Program Effects on Fertilityin Pakistan, PIDE, (1984).

-31-
Table VII.4: FERTILITY RATES PER WOMAN, 1977
Pakistan Urban Rural
Illiterate 7.07 7.09 7.08Literate 3.60 3.68 3.54Below Primary Education 4.39 5.34 n.a.Primary Education 3.78 3.73 n.a.Matriculation 3.07 3.06 n.a.
Source: A. Mohammad, "Fertility Differentials in Pakistan, 1977,"Quarterly Research Review, Federal Bureau of Statistics, (1983).
7.21 To increase female enrollment and reduce drop-out rates thisreport recommends the implementation of a special Female Basic EducationProgram. This should consist of a combined action program between provin-cial and federal governments and follow the example of other specialprograms in the education and heaLth sectors.l/ The program should purrsuea three-pronged approach: (i) expansion of the network of female primaryand secondary schools in rural areas to improve access; (ii) adjustmentsin the curriculum in rural girls schools, and (iii) special motivationalc3mpaigns and incentives in rural areas. As discussed in para 7.10improved access can be provided through an expansion of the mosque schoolsystem, which has proven particularly effective in encouraging enrollmentof girls and reducing female drop-out rates. The mosque school aLsoremains one of the few places where girLs and boys can be assembledtogether. In light of the significant economic impact of secondaryeducation, the female secondary school system has to be extended as apriority in rural areas. To make benefits of female education visible toparents, the present curriculum has to be adjusted to the needs and valuesof the rural society. In addition to the basic numeracy and literacy coreprograms suggested for Grades 1 to 3 (para. 7.13), skills have to beimparted to girls which make them more attractive marriage partners.(e.g. sewing, knitting, housekeeping, health/sanitation). Such skillsremain highly valued in rural society, while the relevance of numeracy,literacy and knowledge of science is not immediately apparent. Due to themuch higher demand for urban female education, no such differentiation inthe boys' and girls' curricula is recommended for urban areas. Inaddition, special motivational campaigns involving union councils, educa-tion councils and Imams need to be carried out in rural areas, possibly
1/ Special Program referred to are the Accelerated Health Program andthe Special Mosque School Program.

-32-
modeled on the successful accelerated health program campaign.l/ Thecampaign needs to be complemented by special female scholarship schemesand provisions of free learning materials.
Availability of Teachers
7.22 Supply of teachers is marked by large rural-urban imbalances.While there is excess supply of teachers for urban areas, it is difficultto fill postings in rural areas. Graduates often prefer up to three yearwaiting periods instead of accepting a rural position due to the severityof rural living conditions, reluctance to live away from the extendedfamily and salary bonuses which pay 30Z more to a beginning teacher inurban than in rural areas to cover higher living expenses in urbansettings. Shortages are particularly severe for female rural teachers.As a consequence, an estimated 45% of positions for female teachers arevacant or filled with teachers without any or inadequate qualifications.2/The practice of filling primary positions with non-qualified teachingassistants has recently been intensified and has led to good results aslong as teachers are carefully supervised and receive regular in-servicetraining. Such supervision is generally not available at district Levels,as the responsible education officer supervises between 150-250 schools.
7.23 Equally insufficient is the budget allocated to in-service train-ing, which accounts for only 2% of the education development budget.Special training programs should be provided to these non-qualifiedteachers through the Open University where a promising beginning has beenmade with a distant learning program. But the present program lackssufficient rigor and will need to be upgraded and made comparable to thetraining imparted in regular pre-service institutions. In particular, itlacks practical teaching instructions and teaching exercises. Moreover,to make positions in rural areas more attractive to young graduates, thepresent salary bonus system needs to be reversed and relatively higherpayments made to rural teachers. The bonus payments to urban teachers actas a disincentive to accept rural postings. Present teacher trainingcapacities and supply of university graduates suitable to work as teachers
are sufficient to cover attrition of existing teaching staff, but with thelarge expansion necessary under the Seventh Plan at the primary and secon-dary level, increased training facilities for teachers will be required.Table VII.5 points to the shortages which will emerge particularly forprimary teachers. Projections assume that 25% of femaLe primary positionswill continue to be filled with unqualified recruits to satisfy the needsof rural areas.
1/ Union council. are administrative units comprising 5 to 15villages/towns which also participate in the decision regarding schoollocation, provide the land and finance operation and maintenance costsof school buildings. Education councils are special committees set upunder the union council to foster community participation at thevillage or town level.
2/ The National School Mapping Survey, op.cit., shows that in 1984, 46%of primary and secondary positions in Baluchistan, 15% in Sind and 28%in NWFP were either vacant or filled with unqualified or inadequatelytrained teachers.

Table VII.5: REQUIREMENTS FOR PRIMARY AND SECONDARY TEACHERS, 1984/85-1992/93 /a
(thousand)
Annual Trg. Require- Expected ExpectedIn Post Capacity ments (Deficit)/ Requirements (Deficit)/1984/85 1984/85 1987/88 Surplus 1992/93 Surplus
Primary 206 10.9 238 (4) 357 (122)
Male 149 6.2 146 - 214 (73)Female 57 4.7 82 (4) 143 (49)
Secondary (lower) 84 4.2 95 (13) 135 (55)
Male 59 2.6 66 (8) 92 (35)Female 25 1.6 29 (5) 43 (20)
Secondary (higher) 58 5.5 64 3 87 (15)
Male 40 3.0 41 2 54 (7)Female 18 2.5 23 1 33 (8)
/a Assumptions are presented in Annex 4.
Source: Ministry of Education and staff estimates.

-34-
Social Inequities
7.24 More than in other developing countries education financing arran-gements in Pakistan create social inequities. This is caused by the factthat the total student group enrolled in the education system is rela-tively small, the public subsidy to higher education is relatively large,and more than in other countries, students from higher income householdsare more strongly represented at all levels of education. Table VII.6shows that nearly 30% of funds are spent on 600 thousand students enrolledin higher education constituting less than 1% of the total students, atall levels. The subsidy which a student in higher education receives isnearly seven times the average subsidy per primary student and nearly fivetimes that per secondary student. Within higher education, those enrolledin universities enjoy an even larger advantage. The average subsidy theyreceive is six times that of a college student, 19 times that of a secon-dary and 29 times that of a primary student.
Table VII.6: ANNUAL PUBLIC EXPENDITURES ON EDUCATION, 1984/85
Share of Total Per Student Fees as Z Per Student Subsidy /bLevel of Public Expenditure of Public As Z of perEducation Expenditure /a (Rupees) Expenditure Rupees capita GNP
Primary 45.6 373 0 373 8.2Secondary 24.6 564 0.3 562 12.4Higher 29.8 2,811 9.0 2,557 56.4
/a Public expenditure includes recurrent and annualized capital expenditure.7- Defined as public educational expenditure net of fees.
Source: Staff estimates.

-35-
7.25 A complete picture of the distribution of educational subsidiesneeds to take account of the fact that subsidies are accumulated as anindividual passe) through the education system. In Pakistan, the 32 ofthe school age population which completes higher education receives about30Z of total education subsidies, 17% of the age group comnpleting secon-dary education receives 44% and 29% completing only primary receives 30%.No resources are channeled to the majority of the school-aged population,i.e. the 51% of school-aged children not enrolled in school. This dis-tribution of funds is more inequitable than in most other developingcountries and more skewed towards higher education than in most Africancountries. The Lorenz curve in Figure 7.1 shows the distribution of fundsin comparison to other developing countries.
7.26 In order to bring about a more equal distribution of educationfunds, fees should be collected from those who most immediately benefitfrom public education spending--students enrolled in higher education.Fees collected at higher levels remain low in comparison to student costs.Only 9% of total costs was recovered through student fees in FY85, includ-ing tuition plus other charges sniih n admission and examination fees.The average student contributed Rs 253 p.a. of the Rs 2,811 unit cost.Since there is substantial excess demand for higher education, tuitioncosts and other public charges contribute only a small portion of totalprivate education costs and price elasticities for higher education areestimated to be low, there is substantial room for increased user chargeswithout impairing demand.l/ Calculations show that even with full costrecovery there would remain excess demand for admission (Annex 3). Evenunder very conservative assumptions, fees for higher education could beincreased to Rs 1,005 p.a. without impairing demand. This would representa cost recovery rate of about 37%. To prevent poor students from havingto terminate their studies, a more extensive scholarship system would needto be established. Estimates show that with an increased fee of Rs 1,005p.a, 29% of the present student body would drop out and be replaced bywealthier students. This could be prevented with the establishment of anannual scholarship fund amounting to Rs 131 million. Financed with partof the revenues collected from increased fees, the fund should provide
l/ It has been estimated that student fees contribute only about 10% oftotal private costs of higher education, while opportunity cost repre-sent 80Z of total costs. Expenses for transport, books, food andlodging account for the remainder. See A. Chafoor, Unit Cost ofHigher Education, AEPH, (1984).

-36-
scholarships up to the full value of the fee increases to potential drop-outs.l/ A description of Pakistan's current scholarship and loan systemis presented in Annex 1.
7.27 Improved equity in education could be achieved if increasedrevenue collected from higher education fees were reinvested in primaryand secondary education. With the 37Z cost recovery rate suggested above,1.2 million additional primary students or 0.8 million secondary studentscould be enrolled. This would represent an increase in the primary schoolenrollment rate from 49% to 58Z or, alternatively, an increase in thesecondary enrollment rate from 20% to 27% of ths FY85 cohorts. Figure 7.2shows the distributional impact if cost recovery were to be implementedand revenue fee redistributed to primary education.
The Re-emerging Private Sector
7.28 Before 1972, much of the country's secondary and higher level ofeducation was in private hands. In 1968, 22% of primary, 42% of secondaryand more than one-half of higher education students were enrolled inprivate schools. After 1972 the Government nationalized more than 3,300institutions, reducing the private sector to all but a few institutions.Only 4Z of all primary and secondary schools remained private, mostlyreligious and selected elite institutions. Shortly after the change ingovernment in 1977, private schools were again allowed to open and nation-alized schools were gradually denationalized. Since then, there has beenhigh growth of private schools on the primary and lower secondary levelsbut only a modest increase at higher secondary and higher Levels ofeducation. Openings of private schools have almost exclusively been inurban areas, where demand for education is high and public facilities areovercrowded. While the total percentage of primary and secondary studentsattending private institutions in FY84 is estimated to be only 9% and 4%,respectively, an estimated 35Z of urban pr... ry and 14% of urban secondarystudents attend private institutions. The fiscal impact of this expansionis already substantial. Had these students been accommodated in publicschools, an additional 10% of the FY84 education budget would have beenrequired. Table VII.7 depicts private sector developments before andafter nationalization and denationalization, and provides estimates andprojections of institution and enrollment rates.
1/ The Rs 131 million represents the maximum amount needed for thescholarship fund since part of the scholarship recipients are likelyto need only partial scholarship. Calculations are based on 1985enrollment rates and structures. Adjustments in the size of the fundwould need to be made as enrollments increase and composition of thestudent body changes.

-37-
Chart I J
Percent ofPublicEducationSubsidies
20
0 20 40 60 80 100 Percent of Population
The Distribution of Cumulative Public Educational Subsidies in Pakistanand Other Developing Countries.
Note: The data for Pakistan refer to 1984, while that for other developing countries,to circa 1980; also, in the latter, they have not been adjusted to reflect publicspending net of fees. This adjustment would probably not alter much the picturein this figure.

-38-
shows the distributional impact if cost recovery were to be implementedand revenue fee redistributed to primary education.
Chart II
Percent ofPublicEducationSubsidies
100
80 ' /. ~~Current Distribution
60 ____i._1_
l a . t j ; Distribution After. / @ ! 7sK ~~~~~Partial (37.4%) Cost
40_____ ___. _____ .__l//_\__ Recovery and Reallocation
, /i/ \ from Higher to Primary
20 - - _ _- Distribution Afteri . z / > ~~~~~~~Full Cost Recovery
/ . / / ~~~~~~~~~and ReallocationFrom Higher to Primary
~~~~~~~~~~~~~~~-:u_ c .ati on
0 20 40 60 80 100
percent of Population
The Distribution of Cumulative Public Educational Subsidies,Before and After Increased Cost Recovery in Higher Education,Pakistan 1984.

Table VII.7: PRIVATE EDUCATION INSTITUTIONS AND ENROLLIENTS, 1968/69-1992/93
1968/69 1983/84 1987/88 /a 1992/93 /aNo. of No. of Z of Ic No. of No. of % of fC No. of No. of S of fr No. of No. o S of /cInstitu- Students Total Inatitu- Students Total Institu- Students Total Institu- Student. Totaltions Students tions Students tions Students tions Students
Primary 3,744 842,600 22 3.SO1 482,920 9 4,980 747,000 10 6,800 1,255,000 10
Secondary 1,070 479,640 42 605 85,221 4 985 166,000 6 1,500 300,000 7
Intermediate 128 87,400 55 15 n.a. n.a. 20 4,000 0.7 80 26,000 3Colleges
Universities 77 22,020 51 1 b/ 1,200 1 3 n n.a. T.. n.s. n.a. n.a.
/a Projected; assumption for projections are presented in Appendix 6.
/b The only operating private university is the Agha Khan Medical School. Two other pr;vate universities are under preparation.
/c Private students as a percentage of total students at different levels of education.
Source: School Mapping Survey, 1983; Ministry of Education; Survey of Private Schools, 1982; and staff estimates.

-40-
7.29 While growth in the primary and lower secondary level has beenrapid and is expected to continue, investments in higher secondary andtertiary institutions needs to be encouraged. Slow developments at higherlevels of education are in sharp contrast to the period beforenationalization, when most of Pakistan's students in higher educationattended private institutions. The Government has not yet allowed privateinstitutions to grant their own degrees, but requires them to affiliatewith public universities.l/ This makes it unattractive for students topay the high fees charged by private institutions. Reluctance to investis also caused by the large amount of capital required at higher levels ofeducation and the need to operate the schools with a relatively largestudent body. The prevailing risk averseness is probably also a result ofthe nationalization experience and prevailing uncertainties surroundinggeneral developments in higher secondary education. Conflicting messagessent out by provincial governments concerning language requirements formatriculation examinations after Grade X, a frequently changing secondarycurriculum and corresponding changes in admission standards of univer-sities provide an unstable environment which discourages investment.
7.30 There is much which can be done by the Government to overcomeprevailing uncertainties. A clear education policy for the higher secon-dary level will need to be announced and the policy toward the privatesector needs to be made more explicit. It is recommended that provincialgovernments enter into a structured dialogue with representatives fromprivate schools to develop a mutual atmosphere of confidence. TheGo-vernment should continue its policy of registering private schools butmaintain its present approach of not overregulating the sector. Inparticular, it should refrain from price regulations or quality controlsin the private system as there remains considerable fear among privateschool owners over the introduction of such controls. Provincial govern-ments should make it clear that no regulations and interventions areanticipated. While private schools are of uneven quality, most of themare considered to be superior to publicly operated schools. Until qualityin the public system itself has improved no attempt should be made toregulate quality in the private sector.
7.31 Since private developments at the lower levels of education aredynamic, there is no need for special incentives in urban areas. For theopening of colleges and higher institutions, capital at market termsshould be provided through the regular banking system since private school
1/ Power to grant degrees can only be given through presidentialcharter, at present given to only thrLe specialized institutions, theAga Khan Medical University of Karachi, the University of ManagementSciences in Lahore, and the religious Hamdard University. The lattertwo are not yet operating.

-41-
owners find it difficult to secure adequate funds. To attract moreprivate schools to rural or semi-urban areas the present practice ofproviding special grants should be standardized and expanded for ruralprivate schools if a significant amount of scholarship funds are madeavailable for lower income students.
D. Targets for the Future
7.32 The first two years of the Sixth Plan have proven original plantargets to be overly ambitious. The Plan proposed to increase primaryschool enrollment rates from 49% to 75% by the end of the Plan period andsecondary enrollment rates from 14% to 19% for Grades IX-X. To achievethis objective, 41,000 primary schools/mosque schools and 5,100 secondaryschools were to be opened. These investments coupled with a mass literacycampaign were expected to achieve a literacy rate of 48X by FY88. Littleprogress has been made toward this end during the first two Plan years.Only 8,500 primary schools have been opened and 8,000 upgraded; 1,000secondary schools have been consolidated; and virtually no progress hasbeen made in the implementation of a mass literacy campaign. As of FY85,minimal progress has been achieved in improving literacy and enrollmentrates. Underachievement of targets is partly the result of insufficientfinancial allocations of development funds. The education sector receivedonly 23% of total Sixth Plan allocation in FY84-85. The share allocatedto primary education was much smaller than projected, receiving only 18%of funds instead of the projected 34%, while university and manpowerdevelopment received relatively more. The much reduced allocation to theprimary sector was particularly disappointing and contradicted the educa-tion priorities established in the Sixth Plan. The Priority Plan(FY86-88), formulated in response to the shortfalls of Plan allocationsduring the first two Plan years, intends to reestablish the priority forthe education sector as a whole and to primary education in particular.It projects an allocr-cion of Rs 10.4 billion to the education sector,which would raise the share of the sector to 8% under the Priority Plancompared to 6.5% during FY8W--85. Primary education is projected to receivethe major share (26%), followed by secondary (23%), university (11%),college (9%) and technical education (8%).
7.33 For Pakistan to make the necessary progress in human resourcedevelopment, original Sixth Plan targets should be re-established for theend of the Seventh Pla- i eriod (Table VII.8). Even then they appearambitious in light of prevailing population growth rates and continuingresource constraints. By international standards the suggested SeventhPlan targets are low - in FY93 they will still leave Pakistan belowaverage enrollment rates of low income economies. It should be a priorityobjective to achieve universal enrollment for both males and females bythe end of the century and to bring secondary enrollment rates in linewith comparable rates in lower middle income countries. Priority shouldbe given to rural female enrollment for both primary and secondary levelsto achieve reductions in fertility and improvements in health indicators

-42-
(para. 7.21). In light of the urgent need to expand the lower levels ofeducation, only a very modest increase in enrollments is eecommended forthe college and university level.
E. Financing Education Requirements
7.34 These enrollment targets will require substantially increasedfinancial outlays. Table VII.9 presents the estimated financing require-ments by level of education for the Seventh Plan period and to the end ofthe century. The projections show annual allocations required to maintainpresent enrollments at different levels of education in light of a rapidgrowth of school age population (depicted under the 'constant' column) andannual allocations to achieve the improved enrollment rates recomnended inTable VII.8. To achieve the improved enrollment targets, annual alloca-tions for recurrent and capital expenditures will have to increase by 6Zp.a. in real terms between FY85 and FY93. Rs 83.9 billion will berequired during the Seventh Plan period (in constant FY8S prices). Theprojections further show that Rs 55.5 billion will need to be allocated tomerely maintain the present level of enrollment if population growth underthe medium growth scenario is attained (see Chapter VI). The Rs 55.5billion needed to just accommodate the growing school age population isalmost 601 hi,Lher than the total education allocation proposed in theSizth Plan. The projections assume a continuous increase in privatesector activities; 10% of primary students and 7% of all secondary stu-dents are expected to attend private schools by FY93.
7.35 Particularly high increases will be required for the expansion ofprimary education, amounting to lOZ p.a. in real terms throughout theSeventh Plan to achieve the improved level. Even with these increases theshare of primary education in the total education budget would remain at amodest 36X under the Seventh Plan, compared to 33% as proposed in theSixth Plan. Relative shares to secondary/college and higher educationwould remain high at 48% and 17%, respectively. The projected financingrequirements would imply public education spending equivalent to 2.2% ofGDP by FY93, still significantly below the average share in other develop-ing countries. Including expenditures of the priv'.te sector, estimated toawount to Rs 1.4 billion by FY93, total education expenditures wouldamount to 2.3Z of GDP.

-43-
Table VII.8: SUGGESTED EDUCATION TARGETS, 1984/85 - 1999/2000(percent)
1984/85 1987/88 1992/93 /i 1999/2000
Primary School Participation Rate 48 53 75 100Urban 71 75 95 100Rural 40 50 70 100Mala 63 68 90 100Female 32 38 60 100Rural Female 20 30 50 100
Secondary Schools Participation RateClasses VI-VIII 22 26 33 50
Urban 50 50 60 70Rural 15 17 25 40Male 35 36 43 60Female 14 16 21 40
Classes IX-X 16 17 20 30Urban 39 43 45 50Rural 6 7 10 25Male 21 22 25 38Female 8 12 15 22
CollegesClasses XI - XII 13 13 15 18
Hale 17 17 19 24Female 8 9 11 12
Universities and Degree Colleges 1.6 1.6 2 3Male 2.6 2.6 3 5Female 0.5 0.5 1 2
/a These targets represenc Sixth Plan targets.
Source: Staff estimates.

-44-
Table VII.9: ESTIMATED AVERAGE ANNUAL PUBLIC OUTLAYS, 1977/78-1999/2000 /a(billion 1984/85 rupees)
1988/89- 1993/94-1992/93 1999/2000
1977/78- 1985/86- Constant Improved Constant Improved1984/85 1987/88 Level Level Level Level
Primary EducationCapital Costs 3.58 1.39 1.28 7.21 2.75 12.14Current Costs 15.51 9.94 17.57 23.11 28.54 50.86Average Annual Cost 2.39 3.78 3.77 6.06 4.47 9.00
Secondary Education (Lower)Capital Costs 2.08 3.54 1.80 7.19 3.19 19.54Current Costs 6.33 3.62 6.16 8.44 10.05 19.37Average Annual Costs 1.05 2.39 1.59 3.13 1.89 5.56
Secondary Education (Higher)Capital Costs 2.10 0.70 0.98 2.40 1.40 7.16Current Costs 4.22 3.55 6.42 7.54 10.54 16.82Average Annual Costs 0.79 1.42 1.48 1.99 1.71 3.43
College Education /bCapital Costs 1.06 0.41 1.67 4.06 3.37 8.24Current Costs 4.06 4.98 9.03 9.86 14.82 19.06Average Annual Costs 0.64 1.80 2.14 2.78 2.60 3.90
Higher EducationCapital Costs 2.18 0.45 0.45 2.50 1.00 7.00Current Costs 12.86 5.53 10.11 11.61 16.41 26.19Average Annual Costs 1.88 1.99 2.11 2.82 2.49 4.74
Total Costs 53.98 34.11 55.47 83.92 92.07 186.38Capital Costs 11.00 6.49 6.i8 23.36 11.71 54.08Current Costs 42.98 27.62 49.29 60.56 80.36 132.30Average Annual Costs 6.75 11.37 11.09 16.78 13.15 26.63
/a For detailed assumption underlying calculation see Appendix 6.Th College education refers only to Grades XI-XII.
Source: Staff estimates.

-45-
7.36 Education expenditures are primarily recurrent expenditures. InFY86 these are budgeted to account for 80% of total education expendituresand for 24.8% of total provincial recurrent expenditures. Projectionsshow that recurrent expenditures are expected to increase by 8.5% p.a. inreal terms from FY85 until FY93 due to the expansion of facilities andhigher unit costs. Given the limited tax base of provincial governmentsand low elasticities of provincial taxes it is unrealistic to assume thatrecurrent expenditures can be financed through provincial revenues alone.This report takes the view that increasing recurrent expenditure obliga-tions in the education sector need to be covered through two avenues: (i)increased user charges for higher levels of educations to be made avail-able to provinces for use at lower levels; and (ii) a continued sharingarrangement between federal and prcvincial governments.
7.37 It has already been argued that at least 37% of recurrent expendi-tures should be collected in fees from students attending higher educationfacilities to improve the distributional impact of expenditures (paras7.26-'.27). This level is also recommended to increase revenues forrecurrent expenditure financing. Increased fees should be graduallyimplemented during the Seventh Plan period. If the collection target isto be achieved by FY93, Rs 2.53 billion (in FY85 prices) would becollected, part of which would need to finance a special scholarship fundcovering increased higher education fees for needy students. In light ofpersisten.- demand problems at lower levels of education in rural areas andthe political difficulties foreseen in introducing fees in urban but notin rural areas, no fee increases are suggested for the primary and secon-dary levels. However, fee increases are recommended for vocational train-ing programs which at present are provided at minimal charge and whereeven modest stipends are made available in selected centers. Continuedfree provision of vocational training is not necessary as vocationaltraining programs are now firmly established, there is excess demand forpublic vocational training and private returns to vocational training arehigh. The 37% collection target suggested for higher education in generalshould also apply to vocational training and be implemented as soon aspossible. A further increase in the fee structure for vocational trainingshould be considered for implementation under the Seventh Plan.
7.38 Even with the 37% collection target for higher education, recur-rent expenditure obligations resulting from the expansion program arelikely to exceed the financing capacity of provincial budgets. Thefederal government realizes the constraints imposed on education develop-ment due to the limited provincial financing capacities and has announcedin its FY86 Budget that all education recurrent expenditures above theFY83 level would be covered through the federal government under the ADPand through funds collected under a special 5% import surcharge levied inFY86. The decision of the Federal Government to provide specifically forrecurrent expenditure obligations resulting from new investments is awelcome development. The present sharing arrangements between the Federal

-46-
and Provincial Governments still remain somewhat ambiguous and modalitiescovering the nature of allocations need to be further clarified, but thesystem in principle should be maintained until more permanent sharingarrangements can be implemented.
F. Priorities for the Future
7.39 Pakistan's good economic growth performance can only be sustainedover the long term if more emphasis is given and increased financialallocations are made to the education sector as a whole, and to primaryand lower secondary education in particular. The weak human resource baseon which Pakistan's economic development is being built endangers itslong-term growth prospects and negatively affects the distributionalbenefits to be derived from such growth. While the education prioritiesand policy programs outlined in the Sixth Plan are appropriate, its tar-gets will not be achieved within the Plan period. Nonetheless, eventhough these targets are low and would not bring Pakistan to the averageenrollment levels of other low income countries, for Pakistan they repre-sent a formidable task. The progress which needs to be made to improvePakistan's present educational system to reach even these levels is verysubstantial and requires more than one five-year Plan period. It istherefore recommended to readopt the original Sixth Plan targets for theSeventh Plan. They are ambitious even then and can only be achieved ifincreased public funds are made available to the education sector.
7.40 Given domestic resource constraints, this report recommends anannual real increase for capital and recurrent expenditures of 9.5% p.a.throughout the Seventh Plan. This would leave Pakistan's public educationspending at only 2.22 of GDP by FY93, a very small amount by internationalstandards. Achievement of even these modest targets will be possible onlyif a political commitment exists to limit the growth of higher educationand the Sixth Plan's own priorities for primary and secondary educationare pursued decisively. In addition, expansion of the primary system willneed to rely considerably on the Mosque School Program and encouragementof the emerging private sector. If these conditions and priorities arenot acceptable, considerably higher increases would be needed. If alarger growth at higher levels of education than suggested in this reportis considered necessary, financing through substantially increased tuitionfees would be required.
7.41 Improved levels of education will aLso depend on more efficientuse of existing facilities and resources. The quality of instruction islow at all levels of education in Pakistan, leading to high drop-out andrepeater rates, particularly in the primary system, and poor educationalachievements at all levels. More relevant and flexible curricula combinedwith better trained and supervised teachers, would reduce drop-out andrepeater rates, making increased enrollments possible. With better use ofexisting facilities, particularly at the university level, expansion couldbe provided more efficiently in selected fields. Expansion and improve-ment in efficiency constitute a twin objective to be pursued throughoutthe Seventh Plan.

-47-
7.42 Future policies and priorities in Pakistan's education systemshould focus on:
(i) expansion of the primary system coupled with quality improve-ments of the existing system. Expansion should primarily beattempted through the Mosque School Program. Qualityimprovements in the primary system require improved teachersupervision through Learning Coordinators and AssistantEducation Officers, improved In-Service Training, preferablysupported by courses in the Open University, a simplifiedtwo-stage curriculum and more learning materials. Qualityimprovements will require an increase in per student recur-rent expenditures from Rs 373 p.a. to Rs 440 p.a.;
(ii) female primary and secondary education, preferably through aSpecial Basic Female Education Program. Expansion in ruralareas should again be primarily through the Mosque SchoolProgram. The provision of new facilities will be needed atthe secondary level. A motivational campaign complemented byspecial incentives such as scholarships and free learningmaterials should be undertaken. Adjustments in the ruralprimary curriculum to make education for girls more accept-able to parents are required;
(iii) efforts to improve demand for basic education in rural areasthrough more flexible teaching schedules, which reduce oppor-tunity costs of education, provision of free learningmaterials in selected districts and more extensive use ofZakat funds;
(iv) a consolidation of the existing system of higher education,concentrating on improving internal efficiency with no fur-ther expansion of facilities. Expansion of the student bodycan be achieved through increased intake of students onexisting campuses;
(v) a restructuring of the college system with a transfer ofGrades XI and XII to the secondary level and the designationof colleges exclusively as degree colleges;
(vi) mantaining mass literacy and non-formal programs at presentlevels;
(vii) the collection of substantially increased tuition fees athigher levels of education, to cover some of the proposedincreases in education expenditures under the Seventh Plan.It is recommended that about 37Z of recurrent expenditures becollected; and
(viii) continuing support to the private sector.

-48-
Chapter VIII: The Health System
8.01 Although progress in the provision of health services has beenfaster than in education, Pakistan still lags behind most deveLopingcountries in terms of both health indicators and spending on health.Improvements in the coverage and quality of Pakistan's health services arenecessary if economic development is to benefit the poor and thus help toreduce poverty and welfare disparities. Priority should be placed nn thedevelopment of a comprehensive and effective basic health service systemup to the district hospital level while improving only selected urbanhospitals. An appropriatt balance needs to be established between therelative roles of the public and private sectors. In particular, thepublic sector should focus on primary health care and ensuring a moreefficient utilization of rural health facilities during the remainder ofthe Sixth Plan. Continuing measures to ensure full utilization of theruraL health structure combined with some expansion will be needed duringthe Seventh Plan.
A. Present Situation
Health Status
8.02 Available indicators point to health status improvements made inthe past 20 years, but progress in Pakistan is less than in other Asiancountries. Table VIII.1 presents figures on life expectancy, infantmortality and child death rates for Pakistan and selected countries in theregion. It shows that life expectancy in Pakistan, particularly for women,is still lower and infant mortality substantially higher than for most ofthe comparators.
8.03 Infectious diseases continue to dominare morbidity and mortalitypatterns. Infant mortality remains high at 119 per 1000 births. Childrenbelow the age of five years and women in their reproductive ages (15-45)are particularly vulnerable groups. The most common illnesses amongchildren are tetanus, measles, whooping cough and diphtheria.Gastro-intestinal infections, generally manifested through diarrhea lead-ing to dehydration, also account for about 20-25Z of reported morbidityand a significant percentage of deaths. Another predisposing factor ininfant and child mortality is the duration of the preceding birthinterval. Short preceding intervals have been found to be associated withsevere excess infant and toddler mortality, together with protein-caloriemalnutrition (a problem leading to growth retardation, affecting 15Z ofchildren under 5) and low birth weight. High fertility is therefore ahealth as well as a serious demographic probLem. Malaria, which wasbrought under control in the early 1960s, had reappeared by 1969 due torelatively ineffective spraying programs and development of mosquitosresistant to insecticides. Currently more than 50% of the population live

-49-
in areas where malaria vectors are prevalent-l/ Tuberculosis is still amajor health problem: its overall incidence Lias changed little since the1960s and in recent years has increased in some areas. Much of Pakistan'sdisease burden is preventable and much of the premature mortalityavoidable. Expensive curative services and high level technology can dolittle to change this situation. Considerably more important are effec-tive primary level health services that improve the environment andprevent diarrhea, distribute oral rehydration salts, provide vaccinations,carry out TB case finding and treatment, and make readily available mater-nal and child health care and family planning services.
Table VIII.1: HEALTH INDICATORS, 1965-1983
Life Expectancy Infant /a Child /bat Birth (years) Mortality Rate Death Rate
Country Male Female1965 1983 1965 1983 1965 1983 1965 1983
Pakistan 46 51 44 49 150 119 23 16Bangladesh 45 49 44 50 153 132 24 19India 46 56 44 54 151 93 23 11Sri Lanka 63 67 64 71 63 37 6 2
Low Income /cEconomies 44 50 45 52 147 115 27 18
Lower MiddleIncome Economies 47 55 50 59 127 87 22 11
/a Per 1,000 live births for aged 0-1.7T Per t,000 for aged 1-4.T7 Excluding China and India, which have markedly better indicators.
Source: World Bank Developusnt Report 1985.
Health Policies and Service Structure
8.04 Policies. Health services in Pakistan leveloped slowly andunevenly after Independence. During the 1960s and 1970s considerable
11 According to the 1983 Health Survey, malaria accounts for 42% ofdiseases treated. The incidence is particularly high in Punjab andSind and markedly higher in rural areas.

-50-
effirts were made to build physical infrastructure, but manpower andinst-Atutional management development did not keep pace, with consequentimbalances through underutilization of facilities and 'ligh vacancy levels.A new scheme of basic health services was initiated in the mid-1970s toimprove the coverage of the rural population and to provide a systematiclink between village communities and hospitals. A start was made on thenew scheme and a modest system of basic health units now exists throughoutthe country. While the system is still not extensive enough to adequatelycover rural areas, its major problems are poor management and insufficientfunding of existing facilities, leading to large underutilization andwaste of resources. The Fifth and Sixth Plans announced an array ofmeasures, including: a rapid expansion of auxiliary manpower, thedevelopment of specialist cadres of doctors, special emphasis on preven-tive programs, the introduction of user charges, rapid expansion of theprivate sector, the posting of doctors to rural hea th facilities, manage-ment training for health workers and an integration of the rural healthstructure with the more developed urban system. However, the Plans'objectives have been difficult to realize. While progress has been madein training auxiliary manpower, development of a pri.ate sector andimplementation of a preventive program, the basic rural health struct"reremains neglected and isolated from the urban centers and efforts continueto concentrate on the completion of urban hospitals and improvements ofmedical schools.
8.05 Health Facilities and Services. Throughout the rural areas of thecountry there are about 5,500 small health outlets such as dispensaries,Mother-Child Care (MCHs), Health Centers (MCH), end subcenters. Based onthis infrastructure, the Government is developing the basic health systemto provide a systematic link between village communities and higher levelhealth facilities. Specifically, the Government intends to establish oneBasic Health Unit (BHU) staffed by a doctor and 4-6 health auxiliaries per10,0l0 population to provide both preventative and curative healthservices. So far about 2,500 BHUs have been built. The health staff atBHUs are also responsible for training and supervising community healthworkers who should live and work in their own villages, provide basicpreventive services, and do screening and simple curative treatment. Foreach 4-10 BHUs there should be one Rural Health Center (RHC) serving apopulation up to 100,000 people and staffed by three doctors and eightauxiliaries. About 450 RHCs have now been built. In addition to provid-ing basic health services in the immediate area, RHCs are intended to actas referral centers from BHUs, provide planning, management and super-visory support for preventive and promotional programs in their respectiveareas, and to serve as focal points for information and supplies. Inaddition to the rural health services, Pakistan has a network of about 600specialized public teaching, district and tehsil hospitals with a total of53,800 hospital beds. They are almost exclusively located in urban areasand generally out of reach for the majority of the rural population.Overall the country has about 1.8 hospital beds per 1000 population, butthe ratio varies from 1.3 in Sind to 2.7 in NWFP (Table VIII.2).

-51-
Table VIII.2: PUBLIC HEALTH INFRASTRUCTURE, 1977/78-1984/85 /a(thousands)
Population/Host.Bed /b Population/BHU PopulationIRHC Population/Others /c977178 1984/85 1984/85 1977/78 1984/85 1984/85
Punjab 2.0 2.0 31.4 318.4 223.1 22.0Sind l.o, 1.3 324.3 293.2 264.2 17.0Baluchistan 1.9 1.8 31.0 303.0 157.1 11.5NWFP 2.1 2.7 33.1 291.0 225.9 20.7
Total 1.7 1.8 38.4 303.1 208.2 17.4
/a Assumptions are presented in Annex 4.7T Including public hospital beds only./c MCH centers, dispensaries, immunization centers, and other public
rural health outlets below BHU level.
Source: Planning and Development Division and Staff estimates.
8.06 In addition to these government services there is a large privatehealth sector, located primarily in urban areas. The private systemtreats about 50% of all patients (Table VIII.3) and is expanding rapidly.In 1975 about 3,600 doctors were working in private facilities; today asmany as 12,000 of them are estimated to work full or part-time in privatehospitals or clinics. Urban areas are getting rapidly saturated withprivate facilities. About 70X of the urban population has a privateclinic within a distance of one km. There are now an estimated 15,000private hospital beds and 1,000 private clinics in Pakistan. The satura-tion of urban centers with private clinics is gradually leading to abetter coverage of semi-urban and rural areas. Traditional medicinecontinues to play an important role. Patieacs of all income and socialgroups depend on i_. About 38% of the rural and 14Z of the urban popula-tion rely on traditional medicine in case of sickness (Table VIII.3).Medical (allopathic) treatment through unqualified practitioners withoutany or inadequate medical education is widespread. Possibly as many as30,000 "self-made" practitioners offer their service, at a low fee buthigh risks for the public. No attempts have so far bean made to regulatethis informal sector.

-52-
Table VIII.3: UTILIZATION OF MEDICAL SERVICES, 1983/84(percent)
Patients Using Government Private PrivateFacilities Facilities Hospitals Clinics Traditional Total
Total 18 21 29 32 100
Rural 19 19 24 38 100Urban 15 25 46 14 100
Source: Health Survey, Federal Bureau of Statistics, 1985.
8.07 Health Expenditures. The Government of Pakistan has in the pastgiven low priority to the allocation of funds to the health sector.However, financial allocations have gradually increased since the begin-ning of the Fifth Plan, growing at 42 p.a. in real terms since FY78. Thisincreased level of public funding is a welcome development and has broughtPakistan's public health allocation closer to those of other developingcountries. In FY84 Pakistan spent 2.92 of total government expenditureson public health, still representing only 0.7Z of GNP, a small share incomparison to other developing countries (Table VIII.4). While theprivate sector has filled some of the vacuum left by the public sector andis playing a major role in the curative system, particularly in urbanareas, the low funding provided to the public system has resulted in aninadequate and poorly functioning rural health structure and poor primaryhealth care system. More importantly, inappropriate allocations andinefficient use of resources within the health structure have seriouslyaffected the efficiency of the system.

-53-
Table VIII.4: EXPENDITURES ON HEALTH SERVICES
Public Only Public and PrivateAs Z of Total
Per Capita As Z Government Per Capita As ZCountry (US$) of GNP Expenditure (us$) of GNP
Pakistan /a 2.50 (1984) 0.7 2.9 14.33 (1984) 3.8India 2.00 (1978) 1.2 1.7 n.a. n.a.Indonesia 5.00 (1978) 1.0(1980) 2.5(1980) 13.42 (1981) 2.8Sri Lanka 5.00 (1979) 1.7 4.2 14.95 (1982) 5.1Thailand 3.00 (1979) 1.2 4.1 15.88 (1976) n.a.Sudan 3.00 (1978) 0.9 1.7 n.a. n.a.Bangladesh 1.00 (1981) 1.0 5.7 n.a. n.a.
/a Corresponding numbers for 1980 were per capita expenditures of US$2.0representing a share of 0.9% of GCP and 1.5% of total Governmentexpenditures, US$11.26 per capita was estimated to have been spent in1981 per capita on private and public services.
n.a. = not available
Source: D. de Ferranti, Paying for Health Services in Developing Countr2iesWorld Bank Staff Working Papers 721; and World Bank-IndonesiaFinancial Resources and Human Development in the Eighties, (May 1982).
8.08 Allocations of health funds have aggravated rural-urbanimbalances. Funds have beer primarily spent on capital intensive hospitalcomplexes in crban areas, resulting in a serious neglect of the ruralhealth structure. Since FY78 about twice as much was spent in capitalfunds on urban than on rural infrastructure. At present, about 70% of thehealth recurrent budget is allocated to hospitals, primarily located inurban areas and utilized by urban dwellers. These relatively high alloca-tions to urban facilities have not resulted in a system of good urbanhealth services, as quality of treatment even in urban facilities remainspoor. Considerable efficiency gains could be made with better managementand organization in urban facilities. Successive Plan documents haveemphasized the need to develop a comprehensive rural healthinfrastructure, but more than in other health programs, actual allocationshave been cut as a result of: cost overruns in capital intensive urbanprojects; low implementation capacity of rural programs; and urban pres-sure groups demanding better facilities. The first two years (FY84-85) ofthe Sixth Plan have folLowed this pattern. Rural health programs receivedonly 19% of funds released for the health sector while hospital beds andhealth manpower development, primarily for improvements of medicalschools, received 32% and 16%, respectively. Even with the slight

-54-
increases projected for the rural health program during the remaining Planyears, the urban bias of the system will remain strong.
8.09 There are serious consequences which Pakistan has to face byneglecting its basic health structure. The persistent high fertilityrates, high infant and child mortality, bear testimony to the fact thatPakistan has not given sufficient attention to the provision of healthservices. The positive relationship between better health services, lowerinfant/child mortality and reduced adult mortality have been well estab-lished in economic literature.l/ Equally important are the positiveeffects of increased health on improved productivity, better educationalattainments, levels of nutrition, and higher incomes.2/ In light of thedrastic consequences or rapid population growth highlighted in Chapter VI,health interventions, combined with family planning programs and invest-ments in education, are effective instruments for reducing fertility andpc ulation growth.
B. Major Issues
Coverage and Quality of Rural Health Services
8.10 Access to Rural Health Services. The coverage of healthfacilities in rural ..reas remains inadequate. For Pakistan as a whole,only one BHU is available for 38,400 people and one RHC for 208,200people. This is still considerably below the original objective of one BHUor RHC for each 5,000 to 10,000 people and one RHC for up to 100,000people. Access to rural health facilities is particularly poor in ruralSind and Baluchistan. in these provinces, with their sparsely populatedinterior and scattered settlements, the average patient has to travelabout 14 kms to reach the nearest BHU (Table VIII.5). In all of Sind only66 BHUs are available. While Sind has maintained a Large number ofinferior rural health outlets, such as dispensaries and subcenters, it hasfailed to build up a system of BHUs and RHCs. A recent study identifiedthe importance of proximit- for the treatment pattern chosen by the L-'aralpopulation.3/ The study shows that within rural Sind the chances ofreceiving modern health care are significantly greater for persons livingwithin a three mile radius of a health center than for those more remotely
11 For Pakistan see Z. Sathar, Mortality and Health in Pakistan, SelectedIssues and Areas of Concern, (1984).
2( R. Barlow, "Health and Economic Development: A Theoretical andEmpirical Review"; and H. Mosley, "Health, Nutrition, and Mortality,"in Research in Human Capital and Development, (1979).
3/ R. Lucas, Selectivity in Use of Educational and Health Facilities inSind, (Draft, 1984).

-55-
located. Almost half of the population living 10 or more miles from amodern health facility receive no western style medical treatment whensick; most of them turn to traditional healers instead.
Table VIII.5: MEDICAL FACILITY BY AVERAGE DISTANCEFOR URBAN/RURAL RESIDENTS, 1983/84
(kilometers)
Pakistan Punjab Sind NWFP BaluchistanUrban Rural Urban Rural Urban Rural Urban Rural Urban Rural
Hospital 4.3 21.6 4.0 20.2 4.6 25.5 2.0 15.7 9.6 38.3Dispensary 1.7 9.9 1.7 8.5 2.0 13.4 1.3 9.0 1.6 14.8Maternity andChild HealthCenter 2.5 18.1 1.9 15.7 3.8 24.11 1.1 13.8 2.6 37.2Rural HealthCenter - 11.3 - 8.7 - 17.4 - 10.3 - 22.3Basic HealthUnit - 8.3 - 6.0 - 13.5 - 8.9 - 14.7
Source: Health Survey, Federal Bureau of Statistics, 1985.
8.11 The Sixth Plan pLoposed to establish one BHU or RHC in each unioncouncil by the end of the Plan period. A 70% coverage has now beenachieved. This is an appropriate medium-term objective but in the longruan such coverage is not sufficient. The original distributional coverageof one BHU or RHC for each 10,000 people and one RHC for each 7 BHUsappears, instead, a more appropriate long-term objective. Such a dis-tributional pattern would require a very large expansion in facilitieswhich is unlikely to be implementable in the near future as it requiressubstantially increased capital and recurrent funds and significantimprovements in implementation capaLities and managerial structures. Ifsuch coverage could be attempted for the year 2000, a total of 10,000 BHUsand 1,500 RHCs would need to be built over the next 15 years requiring Rs20.5 billion in capital funds for the rural health infrastructure alonebetween FY86 and FY2000 (Tables VIII.10 and VIII.11). But such an expan-sion program would also require very concentrated administrative effortsand early preparations. In particular, a comprehensive mapping exercise,identifying existing and appropriate future locations, would be

-56-
required.1/ Moreover, this expansion program should clearly have secondarypriority after an improvement of the existing rural health infrastructurewhicb needs to be secured through better management and sufficient recur-rent funds.
8.12 Underutilization of Facilities. Even in areas served by healthfacilities utilization rates remain low. This is partly the result ofcontinued distrust of the rural population against western allopathicmedicine but also the result of the poor q wality of treatment in publicfacilities. BHUs and RHC9 are designed to treat up to 50 and 150 patientsdaily, but the actual average daily attendance of outpatients is only 25for a BHU and 85 for a RHC. The average bed occupancy rate is only 32%,operation facilities are rarely used and there is a complete absence ofreferral systems which would link BHUs and RHCs to more specialized urbantreatment centers.2/ The better established urban health structure istherefore far out of reach for the majority of the rural popula ion.Underutilization of facilities is caused by: (i) frequent absenteeism andvacancies of medical and paramedical staff; (ii) inadequate supply ofmedicine and equipment; and (iii) lack of female personnel for femalepatients who are generally unwilling to be treated by male doctors.Referrals to hospitals -ire made impossible as most RECs lack telephonesand ambulances. Inadequate staffing, equipment, absenteeism and lowquality treatment is largely caused by shortages of recurrent expenditurefunds and poor management and supervision. Lack of funds has particularlyaffected the supply of medicines and the maintenance of equipment. Thelow morale of doctors placed in rural areas, where living conditions aresevere and little equipment is available for diversified and intensivetreatment, is also a reason for the poor quality of health services.
8.13 To improve utilization of facilities recurrent expenditure alloca-tions will need to be increased. An appropriate level of annual fundingfor one BHU with 25 outpatients is estimated at Rs 175,000 while one RHCwith 85 patients requires Rs 513,000. At present, the average level offunding for one BHU is about Rs 125,000 annually and about Rs 360,000 forone RHC. The rural health infrastructure is presently underfunded by 30%and an additional Rs 186 million p.a. are needed in the four provinces to
1/ Such a mapping exercise could follow the model of the school mappingexercise recen. y completed by the Ministry of Education. See NationalSchool Mapping Survey, 1984.
2/ Since there are no detailed data available about attendance andtreatment at BHUs and RHCs, this report relies largely on a surveyconducted in 1981 as part of an Evaluation of the Rural Health Programin Pakistan, Planning and Development Division, 1984. Findings ofthis evaluation were confirmed and updated during the mission.

-57-
make the existing system fully operational.l/ Underfunding among dif-ferent provinces varies widely, amounting to 28% or Rs 117 million inPunjab, to 58% or Rs 31 million in Sind, to 26Z or Rs 30 million in NWFP,and to 19Z or Rs 8 million in Baluchistan. The relatively high levels offunding in Baluchistan have resulted in a very good attendince record; anaverage of 140 outpatients visit one RHC and 42 patients visit one BHUevery day. Allocations for recurrent expenditures will need to beincreased further as daily visits of patients rise above the planningassumptions. Special consideration should be given to the allocation offunds for medicine as availability of medicine has been shown to be ofparticular importance for good patient attendance.
Table VIII.6: AVERAGE ANNUAL RECURRENT EXPENDITURE ALLOCATIONSPER FACILITY, 1984/85
(thousand rupees)
Facility Punjab Sind NWFP Baluchistan
RHC 409 200 350 410
BHU 121 90 133 142
Source: Planning and Development Division and Provincial Budgets, 1984/85.
8.14 To reduce absenteeism and improve the quality of treatment it isfurther necessary to introduce a regular system of supervisian and staffevaluation. Absenteeism at present is pervasive and little control isexercised to reduce it. A group of supervisors who regularly visit BHUsand RHCs should be established under the provincial health directors orthe district health officers. To improve availability and maintenance ofmedical equipment, standardized equipment norms and instructions formaintenance need to be developed and enforced. To reach the large ruralfemale population at least one female medical or para-medical staff memberis needed at each BHU or RHC. Training courses for medical and paramedi-cal staff at district hospitals should become a regular feature for rural
l/ Calculations are based on 1,706 BHUs and 240 RHCs functioning inPunjab, 66 BHUs and 81 RCHs in Sind, 450 BHUs and 66 RHCs in NWFP, and157 BHUs and 31 RHCs in Baluchistan. Shortfalls are calculated bycomparing the estimated provincial requirements based on a unit costof RS 175,000 for one BHU and Rs 513,000 for one RHC with the actualallocations in each province based on unit costs depicted in TableVIII.6. Shortfalls for FATA, Azad Jammu and Kashmir, and NorthernAreas have not been calculated.

-58-
medical staff--to break the rural isolation, improve standards of medicaltreatment and build contacts between the urban and rural staff tofacilitate referral care.
8.15 Improvements in Primary HeaLth Care. Pakistan's public healthsystem is primarily curative. While rural health facilities are designedto provide comprehensive preventive and curative treatment, in practicepreventive care is not provided. Since 1982 preventive programs haveinstead been executed through specialized "v.ertical" programs, primarilyadministered by the Federal Government and in coordination with ProvincialGovernments. These include programs against malaria, tuberculosis andmore recently expanded immunization (EPI) schemes, production, distribu-tion of Oral Rehydration Salt (ORS) packages and training of traditionalbirth attendants (TBAs). The EPI, ORS and TBA training programs have maderemarkable progress and are proceeding ahead of Sixth Plan schedule.Integration of this specialized program into the regular rural healthstructure will now be necessary to ensure that provision of preventivecare becomes a regular feature of the health system. Integration isalready being attempted in Punjab, while for the other provinces it isscheduled for the end c-f the Sixth Plan. Considerable plarning andpreparation will be needed before integration can be achieved, as theoutreach efforts of immunization, ORS distribution and training programswill need to be maintained. This requires, itl particular, additionalstaff, vehicles at RHCs and selected BHUs, and special training programs.To safeguard the results achieved so far and to prepare the transition,integration should be commenced without delay on a pilot basis in selecteddistricts of Sind, NWFP and Baluchistan.
8.16 Apart from the integration of this particular program, there is ageneral need for a strengthened primary health care system. The presentstrong emphasis on- curative care leads to substantial welfare losses asdirect costs for treating a patient are disproportionally high compared tothe small amounts needed to prevent diseases. A general reorientationfrom curative to preventive care is needed. This requires, among otherthings, a stronger emphasis on community health training in medicalschools. The present curriculum includes training in primary health carebut little attention is given to it in actual teaching. Community healthcare should become a subject matter included in the core curriculum andexamination schedules. Specialized post-graduate programs need to beestablished at selected medical schools. Community Health Studies arebeginning to be provided on an experimental basis at the Agha Khan MedicalSchool, the Medical Colleges in Abbottabad and in Multan. These programscould be further expanded and tested and s-tbsequently used as models inother medical schools.
8.17 Introduction of Family Planning Services. Although it isGovernment policy for family planning services to be made available in allexisting health facilities (both governmental and non-governmental), nosignificant family planning services are offered in provincial health

-59-
facilities, except in hospitals where contraceptive surgery and temporaryfamily planning methods are offered through programs run by the PopulationWelfare Division. Many doctors in Pakistan have been reluctant toassociate themselves or the health facilities with family planning, whichthey perceive as creating a negative image that might jeopardize healthprograms. As a result, a separate network of family planning (recentlyrenamed family welfare) centers had to be established in the late 1960s.There are currently about 1250 Family Welfare Centers. The doctors'perception may be now changing, but it is still constraining the prospectsfor incorporating family planning services into the regular RHC and BHUclinic routines.
8.18 From a health viewpoint, the incorporation of family planning intoMCH services is highly desirable, particularly considering the demon-strated detrimental effects of closely spaced pregnancies for women interms of maternal morbidity and mortality, and for children in terms ofhigher infant mortality. The combination of family planning with MCHservices can also increase the opportunities for health workers to inten-sify their motivational efforts. In addition, a significant expansion offamily planning services is essential in order to address the seriousdemographic problem of rapid population growth facing the country. Thereis a growing consensus at both national and provincial levels that thehealth service delivery system represents a promising and currently under-utilized resource for family planning work which could be used in additionto the existing Family Welfare Centers. At the same time, it is alsoaccepted that MCH services are very weak. A recent survey in rural Punjabshoved that onLy lOZ of pregnant women have any contact with rural healthfacilities and only 3X of births are attended by a trained midwife. Thestudy also highlighted the absence of effective health education, demon-strated by inadequate weaning feeding practices and reductions in thelength of breastfeeding.l/ However, given the continued weaknesses in therural health system, efficient family pLanning services can only beprovided through the health system, if management and organization can besignificantly strengthened, a distributional system built up, and ifhealth staff are appropriately trained.
Manpower and Training
8.19 There are serious imbalances between manpower needs and supply inthe health sector in Pakistan, with doctors being in excess supply andshortages of medical technicians, nurses and paramedical staff.Table VIII.7 shows the unusual relationship between the number of doctorsand nurses in Pakistan. There are more than three times as many doctorsin Pakistan compared to nurses. This, combined with large outmigration ofauxiliary manpower, has led to a severe lack of qualified health support
1/ M. Anwar and M. Naseem, Situation of Children in Rural Punjab, (1980).

-60-
staff in public and private facilities, while unemployment of doctors hasincreased rapidly. Furthermore, the disease pattern and severe lack ofqualified health support staff in peripheral facilities make it clear thatit is nurses, paramedicals and auxiliaries, which Pakistan primarily needsto train, not doctors.
Table VIII.7 HEALTH MANPOWER, 1965 and 1980
Population per Physician Ponulation per Nurse1965 1980 1965 1980
Pakistn 3,160 3,480 16,960 13,140Burma 11,660 4,680 11,410 4,770India 4,860 3,690 6,500 5,460Indonesia 31,820 11,530 9,500 2,300Sri Lanka 5,750 7,170 3,210 1,340Thailand 7,230 7,100 5,020 2,400
Source: World Development Report 1985; Planning and Development Division.
8.20 The oversupply of medical graduates today is the result of therapid expansion of medical schools between 1974 and 1982 (when 13 newschools were opened) and highly subsidized medical education. Thesefactors have contributed to the high unemployment of medical graduates.It is estimated that about 12.5Z of doctors are either unemployed orworking in professions unrelated to their training. To limit furtherunemployment, the intake of medical students was reduced by 7% in FY85with all provinces participating except Sind, where 50% of medicalgraduates are produced and unemployment is particularly high. The reducedintake should have a beneficial effect on quality of training but reduc-tions are not sufficient to avoid further serious unemployment problems.Table VIII.8 shows the rapid build-up of doctors throughout the SeventhPlan period if the present annual output level of 4,000 medical graduatesis maintained. With these large increases of doctors, population perdoctor ratio would decrease from its present level of 3,000 to 2,500 inFY88 and 2,300 in FY93. These ratios are more in line with those of uppermiddle income economies and it is unlikely that Pakistan would be able toabsorb this rapid increase. The intake of medical students should befurther reduced.
8.21 In addition, increased tuition fees should be collected to reducedemand for medical education and to improve revenue collection. Despitevery high demand for medical education, tuition fees charged are minimal.It costs the Government about Rs 300,000 to train each doctor, but totaltuition fees amount to only Rs 3,600 during the five years of education.

-61-
This report recommends a collection target of about 40Z of expendituresfor the higher education system as a whole, to be implemented during theSeventh Plan period (para. 7.39). Such a collection target would alsoconstitute an appropriate intermediate objective for medical schools.However, as demand for admission to medical schools is particularly high,further increases in fees should be feasible. To secure admission ofstudents from poorer families, a loan scheme and extended scholarshipscheme for medical students would need to be established. Repayments ofloans could be reduced for doctors serving in curative puolic service andbe waived for public doctors serving for an extended time period in ruralareas.
8.22 The training of medical technicians, paramedical staff, tradi-tional birth attendants and nurses has received special emphasis under theSixth Plan. With the exception of training for paramedicals, Sixth Planmanpower targets are being achieved. Paramedical training is laggingbecause of insufficient training institutions. Completion of thesefacilities and adequate equipment should remain the prime objective forthe next years. Compared to overall needs, Sixth Plan training targetsfor paramcdical and auxiliary staff are modest and large deficits intrained medical support staff will persist beyond FY88. Developing anadequate supply of medical support staff should therefore featureprominently in the Seventh Plan health strategy. Table VIII.8 highlightssome of the projected deficits for auxiliary health manpower and thesurplus of doctors.
Table VIII.3: TRAINED STAFF NEEDED TO MEET PLANNED REQUIREMENTS /a(end fiscal year)
Total Expected Total ExpectedRequire- (Deficit) Require- (Deficit)
Available ment Surplus ment Surplus(1985) (1988) (1988) (1993) (1993)
Doctors 32,000 34,000 6,700 50,700 11,700Nurses 7,300 20,000 (11,500) 23,750 (13,800)Lady HealthVisitors 3,500 9,700 (5,300) 19,600 (14,000)
MedicalTechnicians 2,000 4,850 (900) 9,800 (4,000)
/a Assumptions are presented in Annex 4.
Source: Planning and Development Division

-E .2-
Planning and Management
8.23 Planning and implementation of health programs are strictlyseparated in Pakistan and planning frequently has little impact onprograms actually implemented. There is a need to integrate the implemen-tation agencies into the planning process and use the planning assumptionsin the decisions of the routine managerial processes. This requires thepreparation of basic plans at every point in the health system. Thus,every community health worker should have a "village health plan" whichidentifies the village's main health problems, defines a program to over-come them and identifies priorities. Similar plans should be prepared foreach BHU, RHC, hospital and training school, stating priorities and tar-gets for improvement, which are then built into provincial and nationalplans as part of the formal planning cycle.
8.24 To improve the implementation and supervision capacity of provin-cial health services, the functions of the District Health Officer (DHO)need to be altered. The DHO remains the most crucial element in theprovincial health management structure, yet it is its weakest link. Thedistrict is the key intermediate level in the health system for opera-tional management of services, coordination with other agencies, and forplanning and development of services in association with the provincialand federal organizations. However, at present DHOs are restricted intheir role, lack authority to hire or discipline district staff above lowsalary grades, do not have freedom to reallocate budgets or staff withinthe district, are restricted in their ability to travel, have limiteddiscretion and decision-making authority, and have little involvement inthe overall planning and design of services for the district as a whole.Their remuneration is low in relation to their responsibilities and incomparison with medical superintendents of district hospitals. The exist-ing responsibilities of DHOs cover a wide range of functions. They shouldbe simplified and built into a new type of job, more focussed on planning,development, management and the creative building of health services. Anew role model for the DHO needs to be established. These professionalsshould combine knowledge and ability in epidemiology, management, andcoordination and be capable of taking initiative and appropriatedecisions. The DHO should be able to coordinate services at the districtlevel, especially hospital and basic health services, and also introducehealth concerns in population, education, water and sanitation programsunderway in the district.
The Role of the Private Secrjr
8.25 The health system in Pakistan is primarily a private one; 83Z ofexpenditures are spent on private facilities and pharmaceuticals, while50Z of patients use private western medical treatment in case of

-63-
sickness.l/ Reliance on private health services is particularly strong inurban areas. Private facilities have developed rapidly and are projectedto continue to expand. By the end of the Seventh Plan it is projected that26% of all hospital beds will be private and 69% of all doctors will workfull-time in the private sector. The stimulus for development in theprivate system has primarily come from unemployed medical graduates whoare unable to find employment in public service and therefore open privatemedical practices. There ore a number of incentives introduced by theGovernment to stimulate growth of the private sector, iticluding customsduty and sales tax concessions on imports of medical equipment, income taxconcessions for practices set up outside municipal limits, provision ofsubsidized land for hospitals and a special subsidized credit Lineprovided through the Small Business Finance Corporation. The subsidizedcredit is a substantial incentive and does not seem necessary in light ofthe dynamic developments in the sector. The regular banking system shouldinstead be encouraged to provide sufficient credit at market interestrates.
Table VIII.9: PRIVATE HEALTH FACILITIES, 1980/81-1992/93 /a
1980/81 1984/85 1987/88 /b 1992/93 /b
Hospitals 150 260 330 460Hospital Beds 10,000 13,000 17,000 25,000Clinics n.a. 9,000 13,000 23,000Doctors 6,000 12,000 20,200 35,400
/a Assumptions are presented in Annex 4.T_ Projected.
Source: Ministry of Planning; Directorate of Health, Survey of PrivateHealth Facilities, (1983); and staff estimates.
8.26 With the large increases in private practices opened by younginexperienced graduates, a quality problem has developed. This is partlythe result of inadequate training of young doctors but also of poorlyequipped medical facilities and the severe lack of trained support staff.
1/ Data is derived from the 1985 Health Survey :'.hich shows that in FY84Rs 2.1 billion were spent on private hospitals, Rs 2.0 billion onprivate clinics, Rs 8.8 billion on pharmaceuticals. These expendituredata are substantially higher than the estimate made for FY82 andreflected in the World Bank, Pakistan Health Sector Report,No. 4736-PAK, (Washington, 1983).

-64-
It is rather common to find difficult operations being undertaken inminimally equipped clinics. Given the poor quality of medical schools,medical graduates are generally unprepared for unsupervised treatment ofpatients. Apart from a general upgrading and adjustments in teachingstandards and curricula, the Government should consider the introductionof a two-year practical period during which medical graduates have to workunder supervision of an experienced practitioner. This practical periodshould be followed by a standardized final written examination, whichwould then provide the basis for the final license of the medical doctorrequired before a practice can be opened.
8.27 A more direct role of government is required in monitoringdeveLopments of the sector and ensuring minimum quality standards. Thereexists at present no reliable data about the size and distribution ofprivate facilities. This makes any health planning in Pakistan a dif-ficult task. The questionable quality standards with which manyfacilities operate require closer supervision. While at this point it isnot recommended to regulate the private sector through legalinterventions, a much more activist role needs to be played by thePakistan Medical and Dental Council and Provincial Health Departments. Aset of minimum standards for different types of clinics and hospitalsshould be developed and distributed to patients and private doctors asguidelines. To allow for better monitoring, all private hospitals andclinics should be registered at provincial health departments. A bettersystem of recourse for patients who suffered from poor treatment should beestablished outside the lengthy and complicated legal system. One pos-sibility is to appoint a generally recognized and respected person asMedical Ombudsperson along with a small but well-trained and paid staff,jointly financed out of public revenues, the Pakistan Medical Associationand the Association of Ptivate Hospitals, Clinics and Nursing Homes. TheOffice of the Ombudsperson could have the mandate to: (i) investigateselected public grievances; and (ii) carry out random inspections withauthority to close facilities for limited periods if found inadequate.l/
8.28 Private practice is also customary for government doctors, whoperform these functions alongside their official duties. This has led toconsiderable misuse, such a.s the custom of persuading patients of govern-ment facilities to go to a private clinic after official hours. Patientsare thus made to pay for a private consultatiun on the understanding thatthey will then receive better and faster treatment. For the Government toimprove the management of its hospitals and the availability of qualitycare, it would need to address itself to the conflict created through
if The present appeals system established at the Pakistan MedicalAssociation is inadequate and de-facto inoperative. The professionalcode of the Association is hardly enforced and is far too general forthe purpose of regulating the private sector.

-65-
private practice by government employed doctars. As there is strongdemand for admission into the public service by medical graduates, privatepractice should not continue to be made permissible for new entrants. Fordoctors already in public service such changes in working conditions arelegally difficult and probably impossible to enforce. It is recommendedinstead, to raise substantially the non-practicing allowance from Rs 300to possibly Rs 1,500 per month.l/ As competition in urban areas amongprivate clinics is strong, such increased allowance could be an effectiveincentive.2/ The mosz important likely consequence of such a change wouldbe an improvement in the quality of public health provided, and anincrease in utilization of government health facilities.
Health Insurance
8.29 The introduction of a voluntary health insurance systeca should beconsidered in Pakistan. However, there are some issues that would need tobe carefully evaluated before adoption of such a scheme: (i) traditionalforms of third-party health insurance do not provide incentives forcomprehensive, including preventive, health care; (ii) the system isvulnerable to cost escalation due to the risk of over-treating (althoughthis may be lessened through co-payments and deductibles); and (iii) theseschemes are very expensive and affordable only by a small section ofsociety. For example, with premiums of Rs 5,000 per household and assum-ing that no more than 5% of household income could be afforded as apremium, only households with more than Rs 100,000 per year would beeligible; these households represent less than 4Z of the total inPakistan. Nevertheless, if commercial insurance firms were prepared tooperate sucn a scheme, some of the large semi-public organizations mightbe interested in joining on a group basis (either paying the premium infull or jointly with their employees), as in FY82 they spent an estimatedRs 800 million on providing health services themselves.
8.30 In contrast, the alternative model of a health maintenanceorganization appears more feasible and affordable for individuals. Undersuch a system a fee is paid in advance (for example, on a capitationbasis) by individuals to a group of doctors who in turn agree to provide aspecified range of health services. A major advantage of this model is
1/ Nun-practicing allowances are paid to hospital doctors willing notto work in a private practice in addition to their hospital duties.
2/ The maximum cost of an additional Rs 1,200 per month for the exist-ing government doctors would be Rs 194 million p.a. equivalent to 9%of the Government's recurrent expenditures on health in FY85. Thefiscal impact of this increased allowance is likely to be much smallersince not all public doctors will give up private practice to collectthe allowance.

-66-
that the doctors have an incentive to minimize visits. Assuming that asingle doctor could handle 2,000 patients p.a. and that his gross annualcosts including salary are Rs 100,000 then the annual per capita contribu-tion would only need to be Rs 50 (excluding cost of pharmaceuticals). Atpresent most doctors in private practice earn considerably more than theamount likely to be earned on this basis, and even government doctors whodo some private practice can earn similar amounts. However, the situationfacing doctors will change significantly in the next few years as medicalunemployment is expected to increase. Given the existing oversupply ofdoctors in urban areas it is likely that such schemes could becomepopular.
8.31 At present about 10% of the industrial work force is covered bythe social security scheme. In general, it appears to be a popularscheme, and there has been some discussion about whether it should beexpanded further. On the one hand, the employers' 7% contributionincreases the cost of labor, and it is the Government which effectivelyfinances approximately half of the total costs through tax rebates.Nonetheless, the system of financing through payroll taxes is administra-tively convenient, and it also places some responsibility on employers forthe health of their workers. In addition, their contributions (excludingtax rebates) represent a net addition to the resources for health in thecountry. Other advantages of the system are that it provides protectionto industrial workers facing occupational hazards. On the other hand,there are possible problems of excessive demand for services because thereare no user charges at the point of service delivery, and there is alsosome duplication of services with other suppliers. More analysis is,therefore, needed on future options for the social securi-ty scheme to takeadvantage of its attractive features while minimizing its adverse effects.
C. Targets for the Future
8.32 The original Sixth Plan targets consisted of: (i) the immuniza-tion of 24 million children and protection of 100Z of infants againstdiarrheal diseases through oral rehydration salts; (ii) training of 21,600doctors, 38,000 paramedics, 30,000 traditional birth attendants and 5,000nurses; (iii) building or upgradation of 4,725 BHUs and 355 RHCs; and(iv) completion of 11,800 hospital beds. Very good progress has been madein the first two years of the Sixth Plan to achieve targets for thepreventive program and manpower development (with the exception of train-ing of nurses and paramedical staff). Implementation of the expansion ofthe rural health facilities has been much less successful. Only 734 BHUsand 116 RHCs have been built or upgraded in FY84-85. This is largely theresult of inadequate financial allocations. The health sector as a wholereceived only 27Z of the total Sixth Plan allocation, reducing its sharein the ADP to 4.9% compared to the target share of 5.4%. Subsectoralallocations differed very significantly from Plan forecasts. More wasspent on hospital beds, health manpower, and the preventive program, whilemuch less was spent on rural health. The Priority Plan (FY86-88),

-67-
presented in response to the shortfalls of the first two Plan years, willonly partly correct these divergences from original Plan projections. Thefunds allocated to health remain modest amounting to Rs 6.1 billion and4.7% of total Priority Plan allocations. The Priority Plan will allocate26Z of funds to health manpower, 23% to rural health, 20Z to hospital bedsdevelopment, 16X to the preventive program, and 15% to miscellaneous. Theshare of funds provided to rural health will be increased over allocationsin the first two Plan years but will be far too modest to even approximatethe original Plan allocation of 44%. In contrast, funds for health man-power will be much higher than originally projected and even more than wasspent in the first two Plan years. The amounts allocated to hospital bedsdevelopment will be scaled down to the size anticipated under the originalPlan.
8.33 In order to ensure sustainable economic development with astrengthened and more productive human resource base, Pakistan should aimto achieve life expectancy indicators which presently prevail in lowerMiddle Income Countries between the end of the Seventh Plan and the year2000. With an upgraded and expanded basic health system and with furtherimprovements in living conditions it should be possible to reduce infantmortality to 105 per 1,000, reduce the child death rate to 12 per 1,000and increase life expectancy to 53 years by the end of the Seventh Planperiod. To achieve these life expectancv targets significant improvementswill need to be made in the functioning of the existing basic healthsystem. This is clearly the first priority, but it will also require asubstantial expansion of facilities to cover rural areas and to serve theneeds of the rapidly growing population. Table VITI.10 presentsinfrastructure requirements assuming that the Government would attempt toprovide one BHU or RHC for each 10,000 people and one RHC for 7 BHUs bythe year 2000, which is the distributional pattern originally proposed forrural heaLth facilities (paras. 8.05 and 8.11). As shown inTable VIII.10, a major expansion program of 2,900 BHUs and 380 RHCs wouldneed to be carried out during the Seventh Plan to reach only an inter-mediate objective of providing one BHU or RHC for each 16,000 people. Asprivate hospital beds are expected to expand rapidly, only a modestprogram of 7,100 public hospital beds appears necessary. About 25,000private hospital beds are estimated to be available in urban areas byFY93. Public hospital bed development should be primarily for generalward upgrading and expansion of district and tehsil hospitals.

-68-
Table VIII.10: ESTIMATED PUBLIC HEALTH INFRASTRUCTURE REQUIREMENTS, /a1984/85-1999/2000
End EndBenchmark Sixth Plan Seventh Plan1984/85 1987/88 1992/93 1999/2000
Basic Health Units 2,468 3,600 6,500 12,500Rural Health Centers 455 620 1,000 2,000Hospital Beds 53,803 62,900 70,000 75,000Doctors 27,800 40,700 50,700 62,200Nurses 7,230 9,200 23,250 42,900
/a Assumptions are presented in Annex 4.
Source: Staff estimates.
D. Financing Health Care
8.34 To make the necessary improvements in the existing system and toprovide for projected expansions, Rs 33.4 billion (in real terms) willneed to be allocated during the Seventh Plan, of which Rs 15.9 billion arerequired for development and Rs 17.4 billion for recurrent expenditures.(Table VIII.li).l/ This would require very substantial annual realincreases of 7.7X for total health expenditures between FY85 and FY93.Public health expenditures are projected to account for 0.9Z of GNP byFY93, still a low share compared to most other developing countries.Table VIII.11 also points to the required shifts in subsectoralallocations. While 29% of total health funds will need to be allocated tothe rural itealth structure in the remaining years of the Sixth Plan, thisshare increases to 37Z under the Seventh Plan and to 53% for the periodbeyond until the year 2000.
1/ Under the Fifth Plan, Rs 4.5 billion (nominal) was allocated fordevelopment and Rs 7.3 billion for recurrent expenditures. Thiscorresponds to a capital expenditure allocation of Rs 6.1 billion andto a recurrent expenditure allocation of Rs 10.3 billion in 1985prices. The revised Sixth Plan projects an allocation of Rs 9.2billion for development expenditures.

-69-
Table VIII.11: ESTIMATED AVERACE ANNUAL PUBLIC OUTLAYS, 1977/78-1999i'2000 /a(billion 1984/85 rupees)
1977/78- 1985/86- 1988/89- L993/94-1984/85 1987/88 1992/93 1999/2000
Basic Health UnitsCapital Costs 1.70 4.35 9.00Current Costs 1.58 4.55 11.77Average Annual Cost 1.09 1.78 2.97
Rural Health CentersCapital Costs 0.58 1.33 3.50Current Costs 0.82 2.14 5.44Average Annual Cost 0.47 0.69 1.28
Hospital BedsC-.pital Costs 2.69 5.68 4.00Current Costs 5.46 10.74 16.31Average Annual Cost 2.72 3.28 2.90
Doctors 1.90 3.00 4.20Average Annual Cost 0.63 0.60 0.60
Nurses 0.22 1.57 2.20Average Annual Cost 0.07 0.31 0.31
Preventive Programs 0.95Average Annual Cost 0.32
Total Costs 27.04 15.90 33.36 56.42Capital Costs 10.68 8.04 15.93 22.90Current Costs 16.36 7.86 17.43 33.52Average Annual Cost 3.38 5.30 6.67 8.06
/a Assumptions are presented in Annex 4.
Source: Staff estimates.
8.35 In view of the already inadequate financial resources for theoperation and maintenance of existing services, recurrent expenditureimplications needed for the projected new investments and to upgrade theexisting facilities are particularly important. Recurrent evpendituresare projected to grow by 8% p.a. in real terms between FY85 and FY93,compared to 6% real growth between FY78 and FY85. This rapid growth islikely to pose strains on provincial budgets. Serious funding problems

-70-
have been experienced in the past and rapid growth rates in recurrentexpenditures have contributed to ipcreasing deficits of provincialbudgets.l/ The implications of this are threefold. First, every possibleeffort must be made to ensure that health services are managed as effi-ciently as possible, and that resources are allocated optimally betweendifferent programs. Particular attention should be paid to the needs ofthe basic health ervices. Second, increased resource mobilizationerforts will need to be made. Possibilities at the provincial level arelimited due to the restricted tax base. Avenues for enlarging provincialrevenues are presently being explored but more decisive efforts will needto be made to improve provincial revenue collection through mechanismsalready available. In the health sector, this is primarily throughincreased user charges. Third, to the extent that trade-offs remainbetween allocating existing resources to different programs, priorityshould be given to ensuring that existing services are adequately funded.There would be little point in significantly expanding the size of thepublic health infrastructure if the new services were to be of low qualityand poorly utilized due to continuing recurrent budget constraints.
8.36 User fees presently raised are insignificant. They amounted toonly 4% of total recurrent health expenditures in FY85. Public healthservices are either free or are provided at nominal charges. Forinpatients there is a bed fee of Rs 4 per day in Sind and Rs 5 per day inPunjab, and a one-time admission fee of Rs 5 in NWFP; no charges forinpatients are levied in Baluchistan. Civil servants are generallyprovided free medical services; where charges are levied, these vary insome instances with the income of beneficiaries. Fees are charged forprivate patients in government facilities, but these are considerablybelow the cost of providing the service.2/
8.37 The Sixth Plan proposed very large increases in user charges,projected to account for Rs 1,250 million or 39% of total health currentexpenditures by the end of the Plan period. Clearly, this objective istoo ambitious and little progress has been made to achieve it. Apart from
1/ Provircial recurrent expenditure budgets have grown by 17.7Z p.a.in nominal terms between FY78 and FY85. The share of the healthrecurrent expenditures in provincial budgets is relatively small. Itaccounted for only 6.2% in FY85 budgets. However, growth in healthexpenditures was particularly large. They grew by 21% p.a. (innominal terms) since the beginning of the Fifth Plan (FY78).
2/ Private patients are patients placed in private rooms as opposed tohospital wards and who receive special medical treatment.

-71-
modest increases in the beginning of the Plan period no further adjust-ments have been implemented.l/ The Government is presently undertaking amajor study to define appropriate fee structures for public healthservices. Before this study is completed no major reforms in the systemof user charges should be undertaken. But results of the study should bereviewed quickly and implemented with priority. In the interim, someobvious anomrlies can be corrected in the fee structure of urbanhospitals. First, major increases are recommended for private inpatientsin public hospitals. Present fees charged do not recover full costs andas a result the public budget now subsidizes private patients. Sincethere is very strong demand from patients to be admitted to private wards,there is ample room for full cost recovery. As private patients generallybelong to the wealthier segments of society, and receive special qualityservice and medical treatment, full cost recovery is also justified onequity grounds. Second, increased fees should be charged for inpatientsin urban hospitals. Fees presently charged are below the subsistencecosts of the average urban citizen admitted to such hospitals. It isrecommended that hospitals at least recover the expenditures allocatedunder the hospital contingency funds, which include diet charges, laundryand utilities. Third, as discussed in para. 8.21, 40% of training costsfor training of medical doctors should be recovered through tuition fees.If a 40% fee recovery were maintained throughout the Seventh Plan, Rs 1.2billion could be collected.
8.38 Emerging recurrent expenditure constraints also could be bettercontroLled through a more integrated financial planning process, takingaccount of both capital and recurrent expenditure implications of theinvestment program. The present planning system is marked by a strictseparation between capital and recurrent expenditure planning, which alsomanifests itself in the institutional separation of the two planningentities: capital expenditures are planned by the federal and provincialplanning departments while recurrent expenditure implications areestimated in the finance departments of provincial governments-generallyafter the Annual Development Programs have been prepared. The presentfinancial planning process is too rigid and needs to be replaced by a moreiterative process, taking account of both capital and recurrent expendi-ture implications of an investment program. At least the federal planningdivision needs to build up the capacity to regularly estimate recurrentexpenditure implications of proposed investment programs. Recent expendi-ture coefficients should be derived from past expenditure patterns,optimal staffing, and equipment norms and should be monitored and adjustedon an ongoing basis. Provincial planning departments could then utilizethe nationally estimated coefficients and adjust them for provincialinvestment programs.
1/ The 4.iZ of expenditures collected through user charges alreadycompares favorably to the 2.5% collected in FY81.

-72-
E. Priorities for the Future
8.39 The Government should give primary emphasis to the development ofa comprehensive and effective basic health service system up to the dis-trict hospital level, while improving only selected hospitals in urbanareas for specialized treatment and providing a modest expansion ingeneral hospital wards. A reasonable balance of the curative system inurban areas should be achieved between the public and private sectors, asthe latter is expanding rapidly and has the potential for significantfurther growth. The public sector should continue to have a predominantrole in the rural areas where the private sector is less forthcoming.More importantly, the public sector should expand its role in the provi-sion of primary health care, making preventive programs a regular featureof the standard system. Since rural health facilities remain poorlymanaged, underfunded and inefficiently utilized, immediate emphasis duringthe remaining Sixth Plan years will need to be given to the consolidationand more efficient utilization of the rural system. While only a modestexpansion of the rural health structure is being carried out under theSixth Plan, a more expansion oriented program combined with measures tosecure full utilization of existing infrastructure, further improvementof management of services and expansion of the auxiliary manpower will beneeded under the Seventh Plan. This is necessary to accommodate therapidly growing population and to improve basic health services suffi-ciently to bring Pakistan's health indicators to the level of most lowermiddle income countries. To finance this expansion while at the same timeimproving existing services, annual allocations for capital and recurrentexpenditures to the health sector will need to increase by a very substan-tial 7.7Z in real terms between FY85 and FY93. Appropriate recurrentexpenditure allocations will be required to secure an efficient function-ing of the existing and expanding system.
8.40 Major recommendations discussed in this chapter are:
ti) improvements in the utilization and services of the ruralhealth infrastructure through increased recurrent expenditureallocations, improvements in supervision structures, bettermaintenance of equipment, staffing with adequate femalehealth workers or doctors, and regular training of staffposted in rural health facilities;
(ii) increased access to rural health services through an expan-sion of rural facilities;
(iii) early preparation for the integration of the specialaccelerated health program into the regular rural healthstructure to strengthen preventive programs;
(iv) preparation for a much extended and strengthened system offamily planning services in rural health facilities whilemaintaining the existing network of Family Welfare Centers;

-73-
(v) special emphasis given to the training of auxiliary manpowerwhile reducing the intake of medical students into medicalschools;
(vi) substantial increases in tuition fees for medical students tocurtail demand for admission and to increase revenuecollection. A fee structure recovering 40% of training expen-ditures is recommended, which is in line with the recommenda-tion presented in Chapter VII for the system of higher educa-tion as a whole. Loan and scholarship schemes need to beestablished for needy students;
(vii) strengthening of the district level health administrationthrough a redefinition of the role of the District HealthOfficer;
(viii) a more active monitoring role of Government in the develop-ments of the private sector to secure quality standards bydefining a set of minimum standards for different types ofhospitals and clinics;
(ix) to strengthen public medical service and reduce pressures onthe private sector, the private practicing permission for newentrants into Government medical service should bediscontinued. A substantial increase in the non-practicingallowance for public doctors already in service should alsobe considered;
(x) a substantial increase of user charges in public healthfacilities after the study on user charges now underimplementation has been completed. Intermittently an increasefor private inpatients fees to the level of full costrecovery is recommended. An itcrease in fees charged to allinpatients of urban hospitals to recover the amounts allo-cated under the hospital contingency fund should also beconsidered.

-74-
Chapter IX: Urban Developments
A. Urbanization Trends and Patterns
9.01 Pakistan's urban population has grown rapidly. In 1951 about 18%of the country's total population lived in urban areas; today 30% ofPakistan's population--28.5 million--are urban dwellers. During the sameperiod, the urban population grew by 4.7Z compared to 3.1% for the popula-tion as a whole. Pakistan's urben population is projected to continue togrow at this rate over the next 15 years and urban centers are expected toplay an increasingly important role in the country's development processas the industrial and services sectors, primarily located in urban areas,assume grater importance in the economy. It is projected that by the year2000, 58.8 million people, or 41% of the total population will live inurban areas. Providing shelter and infrastructure to these additionalurban households represents a formidable task. Pakistan has generallyavoided serious congestion and overcrowding in its cities. However, aserious deterioration of urban living conditions will only be prevented ifsignificantly more public and private resources can be mobilized toprovide for housing and urban infrastructure and if improvements are madein urban management and implementation. To meet the urban challenge thisreport recommends a significant reduction in building and infrastructurestandards, a more extensive system of housing finance, increased plotcharges and full recovery of costs in upgrading projects, adjustments inthe property valuation techniques and a system of construction financing.
9.02 High urban population growth in Pakistan is primarily the resultof a high natural growth of the urban population itself, but is alsocaused by increasing rural-urban migration, the extension of boundaries ofexisting urban areas and the redesignation of formerly rural to urbanareas. In a typical year in the early 1980s, the urban areas of Pakistangrew by about 1,175,000 persons, of which 750,000 were born in urbanareas, 350,000 were added through net rural-urban migration, and 75,000were added by annexation of existing areas. Rural-urban migrationaccounted for about 30% of gross migration movements during 1972-79 butthis share appears to be rising.l/ Each year roughly 725,000 personsmigrate from rural to urban areas, but urban-rural migration is also high,with about 375,000 migrating from urban to rural locations. More thanone-half of rural-urban migration in the late 1970s was within Punjab. Anadditional 20% was from Punjab to other provinces, primarily Sind.Studies show that the *ural-urban migrant is primarily male, young, rela-tively educated and driven by lack of employment opportunities in thevillages. In almost all cases, the migrant finds himself economically
1/ M. Iman, L. Demery, and G.M. Arif, "Migration Pattern in Pakistan:Preliminary Results from the PLN Survey 1979", PIDE, (1983).

-75-
better off in urban than in the rural setting.l/ The urban population isdistributed unevenly over the provinces (Table IX.l). The majority ofurban residents (55Z) live in Punjab. Sind, primarily due to theinfluence of Karachi, is the most urbanized province with 43% of itspopulation in urban areas.
Table IX.1: DISTRIBUTION OF URBAN POPULATION, 1972 and 1931(percent)
Urban Population Distribution ofLand Area as Z of Total Urban Population
1972 1981 1972 1981
Pakistan 100.0 100.0 100.0 25.4 28.3FATA 3.4 0.1 - 0.5 -N.W.F.P. 9.4 7.2 7.0 14.3 15.0Punjab 25.8 55.3 54.5 24.4 27.5Sind 17.7 34.5 34.7 40.4 43.3Baluchistan 43.6 2.4 2.9 16.5 15.6Islamabad 0.1 0.5 0.9 32.6 60.0
Source: Population Census data 1972 and 1981.
9.03 Pakistan's urbanization process and pace has often been describedas overly rapid.2/ However, urbanization has not led to an unusuallylarge concentration in a few urban areas as is the case in many developingcountries. Instead it has been a rather balanced process leading to manysmaller urban centers: in 1981, there were 373 urban places; two-thirds ofPakistan's cities had fewer than 25,000 inhabitants; about 42Z of theurban population lived in cities of fewer than 200,000 people; only 15% of
11 L.R. Qureshi, Urban Villagers: Brokers of Modernization or ofDevelopment-a Study of Immigrants in Karachi Metropolis, AIT,(Bangkok, 1981).
2/ See, for example, Government of Pakistan, National Human SettlementsPlicy Study, (1985). TheB assertion that Pakistan is 'over-urbanized has been based upon regression of Pakistan's total andurban population against per capita GNP in comparison to otherdeveloping countries. However, the definition of urban populationvaries from country to country, and in Pakistan is unusually wide.Any community with a population of more than 5,000 inhabitants isdefined as urban. Even smaller communities can be urban, if they*aintain most public utilities and are substantially non-agricultural.

-76-
Pakistan's population lived in cities of over 500,000 persons(Table IX.2). Growth of urban centers was also relatively even. Between1951 and 1981 ten of Pakistan's biggest 28 cities grew at a rate of lessthan 42 p.a., ten grew between 4Z and 5% and only eight had a growth rateabove 5%.
Table IX.2: SIZE DISTRIBUTION OF CITIES/TOWNS, 1951-1981
Number of Cities/TownsPopulation 1951 1961 1972 1981
One million or more 1 2 2 3500,000 - one million 1 - 4 5200,000 - 500,000 2 5 4 4100,000 - 200,000 5 5 10 1650,000 - 100,000 7 10 25 3425,000 - 50,000 23 30 42 655,000 - 25,000 124 173 215 246
Total 163 225 302 373
Source: Housing Census, 1980
9.04 The increase of the urban population through rural-urban migrationis the result of a gradual sectoral transformation in the Pakistaneconomy, reflected in a slow but continuous decline in the economic con-tribution of agriculture and an increase in the contribution of industryand services which are primarily located in urban areas. Agriculturecontinues to be the dominant sector, contributing 24.7% of GDP and absorb-ing 51% of the labor force in FY85, these shares, having declined from 38%and 57Z, in FY72, respectively. At the same time, industry and servicesexperienced rapid growth, with the service sector absorbing most of thelabor released from rural areas. Manufacturing value added grew by 7.7%p.a. during FY72-85, and by a sabstantially higher rate of 9.82 sinceFY78. The share of manufacturing in CDP grew from 15.6% in FY72 to 19.5%in FY85. While labor absorption in industry remained limited during thesame period and employment growth was only marginally greater than inagriculture, labor absorption in the construction industry was high. Thenumber of workers employed in construction increased by an annual averageof 5X since FY72; almost 5% of the economically active population wasemployed in construction in FY85 compared to 3.3% in FY72. But the mostsignificant transformation took place in the services sector, whichemploys 28Z of the economically active population compared to 23% in FY72.Studies show that the service sector remains the main employer for therural urban migrants. For example, 622 of the migrant household heads in

-77-
Peshawar work in the tertiary sector while only 32% x.ork in industry,construction and transportation.l/
9.05 This sectoral transformation is expected to accelerate further.There is evidence of increasing landlessness, rising un- and under-employment in rural areas.2/ With the switch to more modern farm methodsand capital intensive technology, necessary to achieve higher yields andcompetitiveness in agricultural export markets, rural labor will beincreasingly driven into urban areas in search of employment. Continuedhigh growth of 9% projected for industry and the growth in services whichis usually linked to industrial growth, will act as "pull" factors tourban centers. Pakistan's work force is projected to increase to 44million by FY2000, of which the farm sector is expected to absorb about43Z, leaving some 25 million people to be employed by the non-farm sector,located primarily in urban areas. At the same time, increases in agricul-tural productivity and expansion of employment in the industrial andservice sectors are expected to resuLt in rising per capita incomes. GNPis expected to grow at about 5% p.a. in real terms throughout the SeventhPlan period with a resulting per capita income growth of 2% p.a. The twoforces, accelerated urban growth and rising per capita incomes, willresult in expanding demand for manufactured goods and services. The shareof urban-based production in GDP is expected to rise from about 60% to 75%over the next twenty years.
9.06 Rural "push" factors will be further aggravated by a rapidlygrowing rural population. At the same time, the natural growth of urbanpopulation will continue to be high, primarily as a result of high urbanfertility and lower infant and child mortality in urban areas. Lowermortality and longer life expectancy are the result of higher per capitaincomes, better diets, health care. and access to safe water in urban thanin rural areas. Continued high demand for children in urban areas isunusual in international comparison and probably represents a delayedresponse of rural-urban migrants to the economic envirorment of urbanareas, and the limited effectiveness of the Family Planning Services.Urban fertility is projected to decline as the new urban dweller adjuststo the urban environment and the Family Plazining Program develops further.Under the medium growth scenario in Chapter VI, the urban population willamount to 41 million by FY93 and to 58.8 million by FY2000.
1/ PIDE Research Report No. 102, Factors Influencing Migration to UrbanAreas in Pakistan--a Case Study of Peshawar City, (1977).
2/ A Hussain, Changes in the Agrarian Structure of Pakistan and theDemand for Farm Labor, ILO/ARTEP, 1982; and N.H. Khan, "Classes andAgrarian Transition in Pakistan", Pakistan Development Reveiw, 1983.

-78-
B. Urbanization and Economic Development
9.07 The Government views the process of urbanization with alarm,especially the rapid growth of Karachi and Lahore. This attitude hasbeen reinforced by the results of the National Human Settlements PolicyStudy, a major study of the costs and benefits of urbanization.l/ Thestudy recommends an urbanization process primarily directed toward secon-dary cities. It provides a quantitative evaluation of the relative costsof urban development in small and large cities, based on the assumptionthat the per capita costs of generating and providing employment, shelterand infrastructure rise with city size. However, the policy conclusionsand assumptions underlying the calculations are controversial. The lowercost of employment generation in smaller cities is based on the fact thatthey primarily attract small scale industries, which provide jobs at lowercosts than the more capital intensive large scale industry. The studyignores the inter-industry flows necessary to sustain economic activitiesin smaller cities which depend in part on heavy manufacturing and morecomplex financial and coumercial services usually based in large cities.The study also fails to rigorously estimate costs of urban shelter andinfrastructure and fails to make cost estimates comparable for differentcity sizes. In addition, the average standards of both housing and publicservices are assumed to vary with city size. This report questions theassumptions underlying the calculations of the National Human SettlementsStudy and maintains that urban infrastructure can be provided at costsconsiderably lower even for the largest centers. An urbanization process,even if directed toward major cities, can be beneficial to Pakistan'seconomic development, provided urbanization is supported by appropriategovernment policies and investments.
9.08 There are both economic benefits and economic costs associatedwith urbanization. Economies of scale in production processes and thereductions in transaction costs attributable to well developed communica-tions and to the agglomeration of interdependent activities are the twoprincipal sources of urban advantage. In addition, established citiesoffer ready access to labor supplies, legal, financial and technicalservices, and established markets for products. Growth of industry andservices located in urban centers and resulting from urban concentrationspearheads economic developments through higher value added growth than inrural areas, through utilization of more economic technologies and througha modernization process generall.y associated with labor absorption in themore modern industrial and services sectors. In Pakistan, economicactivities located in urban areas already contribute about 60Z of GDP andannual growth in value added of urban production has been substantial overthe last years, amounting to 7.0Z since FY72.
1/ Government of Pakistan, National Human Settlements Policy Study,(19P4).

-79-
9.09 Growth in industry and services and in the number of urbanhouseholds will require substantial investments in infrastructure andsocial services, including water supply, residential land, drainage, wastedisposal, streets, roads, schools, and hospitals. But most of theseservices can be provided less expensively on a per capita basis in urbanthan in rural areas as they are characterized by very large economies ofscale. Moreover, the incremental expenditures needed to serve residentialcustomers, in addition to industry and commerce, are relatively modestbecause of these same scale economies. Yet, those who remain in ruralareas can generally be served by more rudimentary roads, drains and watersupplies because lower densities imply that congestion is not as sig-nificant a problem and that the assimilative powers of the environmentwill accommodate a greater part of the flow of wastes. The cost ofproviding housing services is typically somewhat greater in urban thanrural areas. The higher cost reflects primarily the higher standards ofservices required to deal with the consequences of crowding. In addition,land is more costly in cities because of the proximity to employment andconsumption opportunities, and because of the artificial limitations onthe supply of urban land imposed by regulations on land use and landconversion. The cost of housing a family in a small town in Pakistan isestimated to be about 85% of that for housing in a large city. The chal-lenge before the Government of Pakistan is not how to impede the processof urbanization but rather how to facilitate it through the most economicuse of resources by lowering unit costs, particularly in housing, andproviding investments and services needed to bring about the benefits ofurbanization.
C. Policy Issues and Programs
9.10 Provision of shelter, urban infrastructure, and urban serviceshas not kept pace with the rapid and unplan.aed urban population growthwhich Pakistan experienced. This has resulted in a deterioration of urbanliving conditions, increased environmental health hazards and growth ofslums and squatter settlements. The selected indicators presented inTable IX.3 show that access of urban population to safe water and excretadisposal is comparable or better than in other Asian low income countries,but the housing indicator also points to the poor housing conditions.Deterioration of urban living conditions has partly been caused by theGovernment's slow response to rapid urbanization. By imposing inap-propriately high infrastructure standards, failing to mobilize adequatemunicipal resources and not developing sufficient implementationcapacities, the Government has been unable to provide adequate and timelydeveloped plots.

-80-
Table IX.3: SELECTED URBAN INDICATORS, 1970 and 1982
Access to Average Urban PopulationAccess to Excreta /a Number of in PovertySafe Water /a Disposal Persons/Room Income Group (Z)
1970 1982 1970 1982 1970 1982 1982
Pakistan 77 77 12 42 3.3 3.5 /b 32 /cBangladesh 13 26 /b n.a. 21 /b n.a. n.s. 40 T7India 60 77 25 27 2.8 n.a. 40 7TSri Lanka 46 65 76 80 /b 2.7 n.a. n.a.Low IncomeAsia n.a. 77 n.a. 29 n.a. n.a. 44
/a As percent of total population.7b- 1980 data.T. 1979 data.
n.a. = not available.
Source: Social Data Sheets, World Bank, 1985.
9.11 Development and maintenance of the urban environment are over-whelmingly the responsibilities of the public sector in Pakistan. Inaddition to regulatory functions such as establishing technical standardsfor construction of roads, buildings and service infrastructure, andplanning land use and trunk infrastructure, local governments develop landfor sale to industry and households, and construct by contract most addi-tions to trunk infrastructure.l/ Community services, such as educationand health, and public utilities, such as solid wastes collection, watersupply, drainage, and sewerage are produced and distributed by localgovernments. The private sector is active in development of urban landan4i constru. tion of housing, but most of its efforts are not legallysanctioned. The private sector develops land for low income householdsbut this land usually does not meet government sLandards and is convertedto use without formal approval. Because of the acute scarcity of legallaed and housing, and the large size of the illegal housing stock, theprivate sector functions outside the system of government regulations.
1/ Trunk infrastructure refers to basic municipal infrastructure suchas roads, bulk water supply, sewerage, etc., which is not connected toindividual households.

-81-
Housing
9.12 Shelter. The most urgent problem in Pakistan's cities is thedeteriorating housing situation, caused primarily by a growing shortageand worsening of housing quality. Investments in housing have fallenconsiderably behind the growth in urban population. Between 1960 and 1980annual urban population growth averaged 4.5Z, while growth in housingaveraged only 3.7% (Table IX.4). This led to a densification of livingconditions: the average number of persons per room increased from 3.3 in1960 to 3.5 in 1980, and the average size of households from 5.5 to 7.0.About 1.4 million additional housing units would be required to provideeveryone with officially sanctioned shelter. Densification is most severein Karachi. Although the housing shortage has affected all groups ofsociety, the principal sufferers have been the lowest income groups whohave swelled the growth of "katchi abadis" (squatter settlements) incities throughout the country. It is estimated that 25% of Pakistan'stotal urban population and 33% of the population in Karachi, live in"katchi abadis". Moreover, much of the inner city houses in Karachi,Lehore and Peshawar, have deteriorated due to overcrowding and as a resultof inadequate maintenance investments.
Table IX.4: URBAN HOUSING AND POPULATION GROWTH, 1960-1980(million)
Urban Annual GrowthPopulation Housing Units Rates, 1960-1980 (Z)1960 1980 1960 1980 Population Housing
Pakistan 9.7 23.7 1.7 3.6 4.5 3.7Punjab 5.5 13.0 1.0 2.0 4.3 3.6Sind 3.2 8.2 0.6 1.2 4.8 3.9NWFP 0.8 1.7 0.1 0.2 3.9 3.1Baluchistan 0.2 0.7 0.05 0.09 5.4 2.8
Source: Housing Census of Pakistan, 1980; and I. Zaki, Housing Censusin Pakistan 1960-198], Pakistan Development Review, (1981).
9.13 Most housing finance in Pakistan is provided through informalarrangements, outside the system of credit allocation. While little isknown about the detailed functioning of this informal system, it isbelieved to be characterized by high interest rates and short maturities.The Government has attempted to provide longer term financing through thefederally owned House Building Finance Corporation (HBFC), but the totalvolume of lending through HBFC has remained small. In FY84, HBFC lendingamounted to only Rs 1.1 billion and represented less than 152 of the

-82-
year's housing investment. The low Lending volume is the result oflimited resources available to HBFC as it does not mobilize privatesavings. The operations of HBFC are fully dependent upon below-marketcontributions from the State Bank of Pakistan. HBFC lending primarilyreaches middle-and higher-income households. This is in part due toHBFC's terms and conditions. Most of HBFC's loans are for the construc-tion of finished housing. Loans for the purchase of plots, incrementalconstruction or repair--which would be more affordable to poorerhouseholds-are not made. The requirement that financed buildings meetofficial building standards, and that borrowers demonstrate legal titlealso restricts access by lower income households. The private sectorsupplies about 85% of the total financing for housing construction. Thesefunds are obtained primarily from foreign remittances, from the capital ofprivate developers and from individuals saving for construction of theirown homes. Frequently developers obtain downpayments from buyers whichare then used to finance improvements. Private developers also helpbuyers to form building cooperatives so that multi-household structuresmay be financed with loans from HBFC.
9.14 Plot Development. One of the major reasons for slow housingdevelopments is an inadequate supply of plots and provision ofinfrastructure. Plot development is primarily the responsibility of thepublic sector. Production reached only 67Z of Fifth Plan targets and only23% of Sixth Plan targets were implemented during FY84-85. Delays havebeen caused primarily by insufficient funds and, in areas where publicland is not available, by difficulties in land acquisition. Slowimplementation and resource constraints are aggravated by very high plotdevelopment standards imposed by the Government which have led to highdevelopment costs. Land e-quisition is a bottleneck in most urban centersexcept Karachi, where adequate public land is available; elsewhere landhas to be acquired from private owners. The problem of land acquisitionis most acute in Punjab, where disputes over the adequacy of compensationhave resulted in lengthy delays in plot development. Under the compensa-tion formula used in Punjab, land owners receive a small cash settlementfixed by law, plus the rights to 30% of the gross site area, returned inthe form of developed plots (typically about one-half of the plots) uponcompletion of the project. While this is an attractive method of financ-ing land acquisition, it has not worked well in practice. Use of a singleformula for determining compensation, which does not differentiate amongdifferent types of property, has produced inequities which in turn havediscouraged land owners from cooperating with the program. Resistance andlegal disputes over the transfer of land have followed. Considerationshould be given to devising a more appropriate basis for setting the levelof compensation provided to landowners and to accelerating payment.
9.15 In response to inadequate supply of plots by MunicipalGovernments, the private sector has played a large role in the developmentof unserviced plots. Unserviced plots are either provided through illegalsubdivision of public lanv' or privately owned land is legally subdivided

-83-
with title transferred to the purchasers, but without the street access,infrastructure, and other amenities required by planning regulations.These irregular developments are primarily obtained by low incomehouseholds. Public policy should not seek to eliminate this form ofdevelopment but rather to increase its capacity and efficiency through areduction in standards governing plot development and the provision ofsecure tenure to such minimally serviced plots. The Government couldenforce such reduced planning standards through its authority to withholdthe recognition of transfer of title in developments where minimum stand-ards have not been met.
Water Supply, Sanitation and Solid Waste Management
9.16 Government programs to increase water supply have generally beenmore successful than those for plot development. In 1980, 58Z of urbanhousing units used piped water, while 33% relied on hand pumps, 7% onwells, and 2% on surface water sources. But water supply in all majorcities is irregular with average supply ranging from four to eight hoursper day at varying pressures. Interruptions in supply produce negativepressure and lead to contamination of water. Network losses are high,varying from 30% of production in Karachi to 50Z in Lahore and Faisalabad.Most of Pakistan's large urban centers are publicly served with onlyindividual plots having septic tanks or soakpits. Installation of sewagetreatment plants has lagged behind network development, resulting insubstantial amounts of raw or partially treated sewage being dischargedinto drainage channels and rivers. Storm drainage systems in all majorurban areas are unable to prevent periodic flooding in the monsoon season.Garbage collection and ditposal have been neglected and remain inadequatein all major cities. Collection services are rudimentary in most smallertowns and sewers and drains tend to become clogged with uncollectedrefuse. In Karachi and Lahore only 30% to 40% of solid wastes areproperly collected and removed to the official dumping ground by municipalservices. The coverage and effectiveness of urban sanitation is par-ticularly inadequate. While this is partly the result of rapid urbanpopulation growth and increased water logging, major shortfalls in urbanservice delivery in the areas of flood protection and of human and solidwaste disposal have played a substantial role. Insufficient financialallocations, inadequate charges, and inappropriately high standards indesign are largely the cause of poor municipal services. Charges formunicipal services such as water supply, garbage collection and publictransport are low relative to costs, or in case of water, compared torates charged by private vendors. In many cities there are no charges forsewerage and drainage services.

-84-
D. Policy Options
Reducing Technical Standards
9.17 Unnecessarily high standards for land, housing and infrastructureis the major issue in the urban sector. Official standards are among thehighest in developing countries, leading to very high development costsand delays in implementation. High standards are an impediment to theadequate supply and distribution of infrastructure and housing. Highdevelopment costs make it difficult for the public sector to providesufficient developed plots, make it impossible for the private sector toserve low inc,ae households profitably within legally prescribed regula-tions and lead to the development of large urban settlements which do notcomply with the legally mandated standards. As the majority of urbanhouseholds cannot afford housing and plots which comply with thesestandards, the public sector has catered primarily to upper income groupswhile low income groups have sought housing through the informal sector.High standards also exclude low income groups from official housingfinance as only houses meeting local building codes can be financed underHBFC loans.
9.18 Standards could be substantially reduced without endangeringpublic health and safety. This is most obvious for plot developmentschemes: plot sizes were reduced in 1980 and now range from 60 sq. yardsto 600 sq. yards, but minimum plot sizes could be decreased by a further301 thereby cutting the cost of land development by 20% per household.Lower construction standards also could be implemented without compromis-ing structural integrity. Further reductions in standards can be guidedby the experience of World Bank supported projects in Karachi and Lahore,which implement reduced standards.l/ Under these projects, a family ofseven is allowed a housing structure 3m x 7m in size, constructed ofmasonry with an asbestos cement roof and a finished concrete floor. Thehouses have a kitchen area with running water, a shower and a latrine.Costs for the reduced standard house are about 25% of a house builtaccording to official standards. Utility costs could also be reduced,through the use of standpipes and low cost sanitation technologies inplace of individual house connections and water-borne sewerage.Reductions in utility standards could reduce the cost of servicing aresidential plot by 35%.
Increasing Public Resource Mobilization
9.19 Investment in urbanization--housing, and related on and off-siteinfrastructure--would total Rs 167.5 billion over the next 15 years, if
1I Lahore Urban Development Project (Cr. 1348-PAK) and the KarachiSpecial Development Project.

-85-
the reduced standards, recommended in this report, were adopted for alladditional urban popalation (Table IX.5). Although a large part of thisinvestment would be financed by private institutions and individuals, thedemands on the public sector to mobilize resources are neverthelesssubstantial. The present rate of domestic resource mobilization inPakistan is low. The dynamism of the urban economy offers opportunitiesto mobilize additional resources, in the form of both private and publicsector savings.
Table IX.5: MINIMUM INVESTMENT REQUIREMENTS FOR INCREMENTALURBAN POPULATION, 1985/86 - 1999/2000
(billion 1984/85 rupees)
1985/86- 1988/89- 1993/941987/88 1992/93 1999/2000
Housing 12.5 25.0 46.3InfrastructureOn-site 5.6 11.1 20.6Off-Site 6.9 13.9 25.6
Total 25.0 50.0 92.5
Average AnnualInvestments 4.2 5.0 6.6
Source: Staff estimates.
9.20 House Building Finance Corporation. HBFC is the only publicsource of housing finance in Pakistan. It is at present solely financedby the State Bank of Pakistan, and does not mobilize its own funds. Ittherefore can provide only very limited financial resources. HBFC'soperations have been Islamized. Rather than charging interest, HBFCobtains a share of the 'mvuted rent from the investment. Its share iscalculated as the ratio of the loan to the current construction cost ofthe structure. Thus, with inflation in the cost of construction, theshare of imputed rent due to HBFC falls over time. In principle, HBFCalso participates in capital gains from the sale of a mortgaged house butthis participation is regularly being avoided as borrowers repay the loan.before transferring title to the new owner. Hence, the returns to HBFC oninvestments in housing are very modest and in recent years have beenequivalent to an interest rate of 5-7Z. These low returns preclude mobi-lization of private funds by HBFC since they are only about half the ratepaid by national savings schemes. The formula for determining HBFC'sshare of the imputed rent should be revised to more adequately reflect itspartnership in the venture. The mechanisms for sharing in capital gains

-86-
should be reviewed for the same purpose. The creation of contractualsavings schemes should also be considered. Such programs eventuallyprovide a guarantee of future loans: at the outset, the saver and thelending institution agree on an amount to be funded through the scheme.When a fixed proportion of the agreed amount has been reached by thesaver, this amount is returned to him together with the balance of thecontract amount, which is treated as a loan.
9.21 Cost Recovery. Direct recovery of costs from beneficiaries isfeasible for a number of public sector activities. In area developmentprojects, plot charges should be set to recover the full costs of land andinfrastructure. At present, area development projects are priced on whatis intended to be a break even basis. The calculation of costs, however,often excludes land, which is either donated from the public domain orfunded on a grant basis. Moreover, plot prices are fixed prior to theinitiation of work, and thus do not allow for the additional costs due todelays, inflation or changes in physical specifications. As a result,receipts from the sale of plots usually are not sufficient to cover actualexpenditures. The strength of the market for serviced plots suggests thatplot charges could be increased sufficiently to cover fully the cost ofboth land and development.
9.22 Improved cost recovery is feasible also in schemes which provideinfrastructure to squatter settlements on public lands. At present,development agencies attempt to recover part of the cost of upgradingschemes through the sale of long term leases to occupants. However,recovery has been poor, partly because charges were set too low, andpartly because beneficiaries have failed to make payments. Levels ofcharges could be increased enough to cover full investment costs, withoutexceeding beneficiaries' ability to pay, if short term financing were madeavailable. Levels of collection could be improved through more systematiccommunity involvement, greater attention to the timing of implementationand better coordination of physical improvements and the levying ofcharges. No satisfactory mechanism exists now for recovering the costs ofupgrading established slums where occupants have legal tenure but lackservices. In Lahore's Walled City, increases in property taxes are beingused as an indirect means of recovering upgrading costs. Similar propertyrelated charges (betterment taxes) may be a feasible means of recoveringupgrading costs under othe.r circumstances. In addition, the costs oftrunk infrastructure may be recoverable through direct charges tobeneficiaries, particularly where the infrastructure provides services toidentifiable land development projects, and thus the costs can be includedin plot charges.
9.23 Local Taxes and Charges. The scope for mobilizing funds forinvestment through increased local taxes and charges is fairly broad.Local governments now generate about Rs 1.2 billion annually in investableresources from surpluses in their recurrent budgets. This high degree ofpublic sector savings (equal to about 40% of total local revenues) is made

-87-
possible by the widespread use of the octroi.l/ Due to simple assessmentprocedures and low rates, compliance with the octroi is good. Thusadministrative costs are lower, and economic distortions less severe thanthose normally associated with this form of taxation. Direct taxes andcharges, which support local governments in other developing countries,are not well exploited in Pakistan. An urban property tax is imposed byprovincial governments on behalf of local governments. Yields are low,largely because the assessments do not accurately reflect property values.In Sind and Punjab, the factors used to convert property characteristicsto estimates of value have not been revised in over a decade. Exemptionsand rate reductions are excessively generous, particularly for owner-occupied property. The administrative infrastructure for property taxa-tion is solid, however, and rapid increases in property tax revenues couldbe achieved with these relatively minLr technical and policy changes.Service charges are also underexploited as a source of investableresources. Charges for water, sanitation and other services are oftenbased on provincial property valuations. Yields are therefore constrainedby valuation practices. Also, rates are increased infrequently. Theadministration of local charges is generally poor, particularly withrespect to collections. Improvements in administration would have toaccompany technical and policy reforms in order to achieve substantialincreases in the yields of local charges. This would include reviewingtax roLls to ensure their completeness, more systematic recording ofpayments and arrears, and greater enforcement of penalties provided by thelaw.
Improving Urban Management
9.24 To accommodate the growing urban population, implementationcapacity of the public sector needs to be strengthened. The public sectorhas taken on the principal responsibility of providing urban infrastruc-ture and services in Pakistan, but its performance has been uneven. Whilephysical targets for water distribution have in the past almost beenachieved, implementation of area development projects and slum upgradingschemes has been consistently weak. Several institutional and proceduralbottlenecks are responsible for these delays. In addition to the inade-quacies in the system of land acquisition (para. 9.14), area developmentprojects have also been delayed by the absence of a workable system ofconstruction financing. Development agencies require construction financ-ing to bridge the period from land acquisition, through infrastructureconstruction, to tVe time when plots can be sold and costs recovered.Disagreements between provincial and local governments over their respec-tive responsibilities for construction financing have delayed someprojects for several years. In the Sixth Plan, the Government has alsoannounced the creation of a revolving fund, which would provide short termfinancing for specified area development projects. The idea is a good
1/ Octroi is a tax on goods imported into a local authority area.

-88-
one, and should be pursued. Specific operational issues, such as institu-tional location, lending terms, and borrower eligibility will need to beaddressed.
9.25 Failure to coordinate investment programs of various sectoralagencies has delayed development of serviced plots. Frequently plotscould not be sold because electric power supplies, trunk roads and trunkwater supply lines had not been completed. Depending on the institutionalarrangement in different urban areas, this may call for a stronger rolefor planning agencies at the local level and greater interministerialcoordination at the provincial level. Local governments, in particularneed to strengthen their ability to identify investment priorities and tomanage the current services efficiently. Capital budgets now extend foronly one year and typically consist of a miscellany of small projectsadvanced by individual councillors. Improvement in service delivery isimpeded by the absence of timely management information. Accountingsystems have been designed primarily to avoid the misuse of funds, ratherthan to monitor the costs of individual services. Cost accounting andreporting systems need to be developed and implemented.
9.26 Improvements in financial management also require better trainingand development of staff. At present, local governments have difficultyattracting qualified staff from the private sector. Little professionalor technical training is given to existing staff, and most must learntheir jobs from previous incumbents. Due to the lack of exposure tomodern methods of financial management, the system with all its inade-quacies becomes self perpetuating. At present, only one specializedtraining institute for local government staff exists, and since itsdegrees are not recognized by the civil service grading system, staff havelittle incentive to attend. Thus training in financial management forlocal government staff needs to be expanded and integrated into the civilservice system. In addition, in order to reduce the loss of trainedfinancial staff to non-financial positions throu.h rotation, a specializedstream of financial personnel should be developed in the local governmentcivil service, paralleling those in the provincial and federal services.Individuals from the private sector should also be employed on a fixed-term or consultation basis, to design new accounting procedures, overseetheir implementation, and provide on-the-job training.
E. Financing Urban Investments
Investment Requirements
9.27 The number of urban households is projected to double between FY85and FY2000, growing from 4.2 million to 8.4 million by the end of thecentury. Providing shelter to these additional urban households will be aformidable challenge for Pakistan. If houses were to be built accordingto official building regulation for all additional urban households,investment requirements for housing would amount to Rs 339 billion (in

-89-
FY85 prices). Annual investments in housing alone would then amount to95% of FY85 gross domestic savings. This is clearly not feasible. Butmost houses are not built according to these standards; the standards ofconstruction de-facto employed are about one-quarter as costly. As thesestandards are considered adequate (para. 9.18), the need for providingminimum shelter for Pakistan's additional urban population could also bemet by spending Rs 25 billion, or 5 billion annually, during the SeventhPlan and with Rs 46.3 billion for the period beyond until FY2000(Table IX.5).1/ These amounts appear feasible. The costs of providingminimum-standard housing to the incremental urban population in 1986 wouldamount to Rs 4.6 billion (in 1985 prices), compared to Rs 3.6 billionactually spent in FY85, most of which, however, was spent on high-incomehousing. Resources in addition to the estimates presented in Table IX.5will be required to provide housing for the urban population now living inovercrowded shelter and for slum upgradation. It should also be notedthat investment requirements depicted in Table IX.5 are based only onminimum housing standards. As a large share of investments will be forhigh income housing, total housing investments will actually be substan-tially higher. The second major component of urban investment will be theprovision of infrastructure. This includes on-site investments in waterdistribution, drainage, sanitation, streets, and off-site investments intrunk infrastructure. It is estimated that on-site infrastructure can beprovided at Rs 9,000 and off-site infrastructure at Rs 11,200 perhousehold ii the reduced standards recommended in this report are adopted.This implies an annual investment in urban infrastructure of Rs 5 billionthroughout the Seventh Plan, and of Rs 6.6 billion for the period beyondtill the year 2,000, at constant 1985 prices.
Financing
9.28 As housing investments in Pakistan are primarily private, they areprimarily constrained by the low domestic savings rate. In contrast, thescaLe of infrastructure investment is limited by the public sector'sability to mobilize resources. The Government will have to substantiallyincrease public resource mobilization efforts, if major increases inallocations from ADP funds are to be avoided. The Sixth Plan (as revisedthrough the Priority Plan) allocates a total of Rs 4.48 billion forinvestments in plot development, upgrading and -rban water and sanitation.Based on the minimum Ltandards for infrastructute, the total (revised)Sixth Plan allocation would be sufficient to accommodate only about one-half of the urban population growth expected during the Sixth Plan period.As discussed in paras. 9.21-9.23 there is substantial potential forincreased public resource mobilization, primarily through taxes and user
11 This assumes a structure of 3m x 7m size constructed of masonry withan asbestos cement roof and finished concrete floor, a kitchen areawith running water, a shower and a latrine. The unit cost of such anofficial standard house amounts to Rs 20,200 (FY85 prices).

-90-
charges. The cost of on-site infrastructure can be recovered through plotcharges, the costs of slum upgrading through the sale of leases, costs ofwater and sewerage investments through connection fees and recurrenttariffs.
F. Priorities for the Future
9.29 In order to meet the needs of the growing urban population,Pakistan must incresse the efficiency of its urban sector. This chapterhas identified a number of policy changes that would contribute to thisobjective. The major recommendations are:
(i) a reduction of standards for housing and infrastructure,including in particular a reduction of plot sizes, construc-tion standards and infrastructure standards in public sectorland development projects;
(ii) to increase official housing finance, the formula used tocalculate HBFC's profit-share needs to be revised to ensureits full participation in gains from inflation and capitalgains. This would permit HBFC to offer attractive terms topotential savers and thereby mobilize its own resources;
(iii) HBFC should also provile financing for incremental construc-tion and repair;
(iv) to improve public resource mobilization, plot prices inpublic sector land development should be increased to coverfull costs. Collection of charges for slum upgradingprojects needs to be improved;
Cv) property valuation techniques need to be revised to ensurethat they fully reflect market values. Rates need to beadjusted and adsministration needs to be improved to increasethe yield of property taxes and related charges;
(vi) to accelerate implementation of plot developments, a systemof construction financing should be created to bridge theperiod from the purchase of Land to its sale tohomebuilders;
(vii) the methods for calculating compensation for land acquisi-tion for development should be revised to reflect moreaccurately market values to avoid the now cus-omary delayscaused by non-cooperation or litigation of property owners;
(viii) the internal management of local agencies should bestrengthened by introducing modern manaaement systems, andby providing training and career development to staff.

-91-
ANNEX 1Page 1 of 6
Scholarships and Student Loans
A. Scholarships
1. Scholarships constitute a very small proportion of total publicspending on education. According to the FY85 budget some Rs 118.8 million(or 1.3Z of all educational expenditures), were spent on scholarships,most of them given by the federal government. Provinces generally spendless than 12 of their budgets on scholarships.
Table 1: GOVERNMENT SCHOLARSHIPS Iu PAKISTAN, 1984-85
Source by Amount As % of EducationGovernment (Rs million) Budget of EachLevel Government Level
Federal 73.5 3.8AJK .3 .001NWFP 9.6 .7Punjab 24.4 .7Sind 5.6 .3Baluchistan 5.4 1.2
Pakistan 118.8 1.3
Source: Central Bureau of Education, Islamabad, Budget AllocationTables, 1984-85.
2. The scholarships tend to be allocated primarily on the basis ofmerit, and only secondarily, on the basis of need. For example, for thePresident's One Thousand Scholarships, only applicants who have passedmatriculation examinations in first division were considered, except forsecond division finishers from Baluchistan and federally administeredtribal areas. Scholarships for studies overseas, such as those given bythe Ministry of Science and Technology for graduate studies, were allo-cated on the basis of scores on written tests. In addition to thesegovernment granted scholarships, the institutions themselves grant a verylimited number of scholarships. For example, the University of the Punjaballocated some Rs 500,000 ir FY84 for scholarships, of which 70% wasdistributed on the basis of merit and 30Z on the basis of need, with thedepartment head certifying who is needy. At other levels, the provincial

-92-
AMNEX 1Page 2 of 6
authorities allow some fee concessions for families who have more than onechild in school. In general, direct payments to students are limited,particularly at the lower levels. It should be examined, whether theamounts allocated to scholarships could be increased while reducing theeducational subsidies through grants to schools. Resources forscholarships, at least at higher levels of education, can be obtainedthrough increased user charges (see paras. 7.26).
B. Student Loans
3. The most important student loan scheme in Pakistan is a jointventure between the Government and the private banking system, throughthe Pakistan Banking Coun-il. Called the Qarz-e-Hasna Scheme forEducation, its objective i_. "to provide financial assistance to studentsof insufficient means and of outstanding calibre, who are unable to pursuetheir studies due to financial difficulties" (Pakistan Banking Council).The main vehicle is through interest free loans for students in highereducation. There are two parts to the Scheme, which was established in1981. Out of a total of Rs 7 million in 1984, Rs 5 million was awardedfor loans for studies within Pakistan. The student must be in a post-intermediate degree course in the fields of engineering, medicine or thesciences and must have achieved a minimum of First Division in the inter-mediate degree. (Post-graduate loans in business and economics are alsoallowed). Out of 2 million applicants, 12,000 loans were awarded in 1984.The maximum award was Rs 5,000 and they are reduced by Zakat receipts ofstudents. The amount awarded is determined by means tests, which areevaluated on the basis of income tax certificates and other documents.The other part of the Scheme (Rs 2 million) is for studies overseas. Fora maximum of Rs 125,000 per year, these loans are for post-graduatestudies only. Of 1,000 applicants for this part of the Scheme in 1984,200 were accepted.
4. The terms of the loans are generous. There is no interest and atwo-year grace period on the repayment of the principal after completionof studies. Thereafter, repayment is made in monthly installments for aperiod of no more than 10 years. Unsatisfactory academic performanceresults in immediate repayment of the loan. All recipients must serve inPakistan if a job is offered to him within the country. Otherwise, apenalty of up to twice the principal is assessed. The Scheme is financed50X by the Government and 50X by the participating private banks. Inaddition, all administrative work and collection are handled by theprivate banks. Thus far, there has been no experience with collectionbecause the scheme is new and even the earliest recipients are stillwithin the grace period. While these schemes are still small, they are aninteresting experiment. They rely on the private banking system, whichhas a much broader range of experience on the administration of loans.The great excess demand for these loans suggests that they are extremelypopular. Thus, it may be feasible to expand this scheme to recover alarger proportion of its costs.

-93-
ANNEX 1Page 3 of 6
C. Zakat Scholarships
5. The President of Pakistan promulgated the Zakat and Ushr Ordinanceon June 30, 1980. Its purpose was to institutionalize a system for col-lecting funds to assist "the needy, the indigent and the poor (that is,the "mustahequeevs"), with a view to securing their economic wellbeing(ann) to help them stand on their own feet and become useful members ofsocieLy" I'Central Zakat Administration, n.d.). Under the provision of theOrdinance, collected funds 1/ can be used for educational purposes, aslong as they are disbursed to benefit individuals directly, that is dis-bursed as scholarships. The system is still in its infancy. A substan-tial fund has nevertheless been collected since it came into being amount-ing to Rs 1,163 million in FY83, Rs 1,070 million in FY84 and Rs 1,227million in FY85. Periodically these funds have been disbursed to theProvincial Zakat Councils, which in turn allocates the funds to localZakat committees. The disbursement follows the guidelines shown in Figure1.
6. Strict adherence to these guidelines would imply that 42.5 percentof the Zakat funds are allocated for educational purposes throughscholarships. Reflecting the priorities set by the central Zakat council,the allocation is largest (25 percent of the total Zakat funds) for stu-dents of religion in "deena madarisas". The remaining amount for generalstudies is still substantial-about Rs 177 million if the 1983-84 Zakatcollection from financial assets are disbursed according to theguidelines. These Zakat scholarships are therefore comparable to thetotal amount allocated in FY85 as government scholarships in provincialbudgets. In FY83, there were about 32,600 recipients of Zakatscholarships, and it is envisaged that this number will increase to100,000 in 1983-84. A large number of these students are from primaryand middle level schools. Data on the distribution of the recipients bylevel of education are, however, available only for NWFP (Table 2).Slightly over half the recipients were students in primary and secondaryschools. however, they received only one-quarter of the total amount ofZakat scholarships, because the size of each scholarship was much smallerthan that at the other levels of study. The awards for university studiesare especially generous, and reflect the priorities established by theCentral Zakat Council: special emphasis has been placed on "mustaheq"students pursuing studies in medicine, engineering, accountancy, commerceand agriculture. (Table 3).
1/ Zakat funds are collectible from two sources: through levies onfinancial assets, operationalized since the promulgation of theOrdinance; and through a tax on agricultural produce which becameoperational in March 1983. The latter tax, known as Ushr, is a Zakaton agricultural produce.

Figure 1
Central Zakat Fund
Provincial Zakat Councils(I in each province, total number 4)
X ~~~~5Z
Local Zakat Students in other HealthCommittees Religious Students (Patients) Others(Total Number Studies
- 36,672)
Subsistance Rehabilitation Stipends toGrant to of Primary Students
"mustahequeens" "mustahequeens" Grades 4 and 5
i
Figure 6: Guidd ealcm for the Dlsburse et of Zakat Fonds In Pakistan

-95-
ANNEX 1Page 5 of 6
Table 2: ZAKAT SCHOLARSHIPS IN NWFP, 1985/86
No. of Scholarship Amount (Rupees)Type of Institution Recipients Total (million) Per Recipient
Schools /a 7,881 2.527 321Colleges 3,355 2.380 709Technical Institute 1,746 1.100 630Universities 1,973 3.618 1,095
Total 15,174 10.000 659
/a Primary and secondary schools.
Source: Personal communications from the Education Department,NWFP Covernment.
TabLe 3: STIPENDS FROM ZAKAT FUNDS FOR HIGHER EDUCATIONSTUDENTS IN PAKISTAN
(rupees)Monthly Stipend Lump sum Stipend Payable
Course of Study Non-Boarders Boarders at Beginning of Year
Medicine 250 300 2,000Engineering 250 300 1,500Agriculture 150 250 1,000Accountancy 150 250 1,000BusinessAdministration 150 250 1,000
Source: Central Zakat Administration
7. The number of scholarships is expected to increase "as theProvincial Zakat Administration get -better organized... and finalizeinstitutional arrangements for the grant of scholarships on a widerscale" (Central Zakat Administration). The anticipated expansionis especially important if increased cost recovery for education isimplemented. One advantage of the Zakat scholarship scheme is its focuson "mustaheq" students Who are identified by Local administratorsactually resident in the same area as the recipients. Moreover, theclear association of these scholarships with poverty discourages

-96-
ANNEX 1Page 6 of 6
application from those outside the target group. As the Zakat scholarshipis expanded, steps should be taken to strengthen its focus on ruralprimary education. This emphasis would ensure that the scholarshipscontinue to benefit children from the poorest income groups in Pakistan.In addition, the availability of such scholarships should be widelypublicized, especially in the rural areas, as a way to encourage parentsto enroll children who are not yet in school.

-97-
ANNEX 2Page 1 of 9
RETURNS TO EDUCATION IN PAKISTAN
1. There is a consensus among policymakers and their advisers thatinvestment in education generates significant social returns, particularly atthe lower levels. Thus, the Sixth Plan has called for an increase in theflow of national resources going to this sector of the economy. Given thescarcity of development resources in Pakistan, it is important to review theevidence regarding the magnitudes of the returns to different levels andtypes of education. Such an analysis would be useful in deciding the extentof investment that should go into education and in alLocating resourceswithin education.
A. The Existing Literature
2. There have been a number of studies of the rates of return to educa-tion in Pakistan, most of which have been conducted with data collected inthe 1970s. The results are mixed regarding the profitability of differentlevels of education relative to each other and to other sectors. Accordingto Table 1, three different studies on the same data base, a 1975 householdsurvey of Rawalpindi City, came up with very different conclusions regardingthe magnitude of the rate of return relative to the opportunity cost ofcapital, as well as the relative rates of return to different levels ofeducation. Hamdani (1977) concluded that the social rate of return toprimary education was 13% and exceeded that of higher levels of education.Private rates of return were even higher. Haque (1977) and Guisinger et. al.(1984) concluded that the private rates of return to primary education wereeven lower than the social rates calculated by Hamdani and were lower thanthose to higher levels of education. Khan and Irfan (1985) with a later(1979) nationwide survey of workers came up with similar results in Haque andGuisinger et. al. except that their rates of return to higher levels werealso low.

-98-
ANNEX 2Page 2 of 9
Table 1. Rates of Return to Education in Pakistan from Existing Studies
Source Hamdani Hague Guisinger et.al. Khan and IrfanLevel of Self- Self-Education Private Social Private Employee Employed All Employee Employed
Incompleteprimary 7 5 - - - 3.4 - -
Primary 20 13 2.6 4.3 1.2 3.5 4.0 6.7Secondary 11 9 5.2 12.5 8.4 11.6 5.6 7.7College 14 10 9.8 14.2 3.7 13.1 6.8 3.4University 27 8
Coverage Rawalpindi (Same as (Same as Hamdani) All PakistanYear of Data 1975 Hamdani) 1979Source PIDE Socio- " ILO-UNFPA
economic Labor Force andSurvey Migration Survey
Sample Size 1,295 " 11,288
"-": Not available
Sources: K.A. Hamdani. "Education and the Income Differential," Pakistan DevelopmentReview, 1977; N. ul Haque, "Education and the Income Differential," PakistanDevelopment Review, 1977; S. Guisinger, et. al., "Earnings, Rate of Returnto Education and the Earnings Distribution in Pakistan," Economics ofEducation Review, 1984; S.R. Khan and M. Irfan, Rates of Return toEducation and Determinants to Earnings in Pakistan," Pakistan DevelopmentReview, (Autumn/Winter 1985).
3. The most recent survey of worldwide rates of return concludes thatthe rates of return to education as a whole are high exceeding the bench-mark rate used to evaluate the opportunity cost of physical capital, andthat, within the education sector, the returns to primary education arehighest (see Table 2). The studies of Haque, Guisinger et. al. and Khanand Irfan have been used to conclude that the rates of return to educationin Pakistan are different from those in other parts of the world. Variousexplanations have been advanced for this phenomenon. For example,Guisinger, et.al., ascribe the low rates of return to a conscious govern-ment policy--wage controls-which drastically compressed the skill-wagestructure. If the compression in the skill-wage structure results in anundervaluation of the returns to skill-acquisition, the true socialbenefits to education is likely to exceed the estimated private benefits.Another ezplanation is that the relatively high rate of outmigration fromPakistan affected earnings differential (Irfan and Ahmed).

-99-
ANlNE) 2Page 3 of 9
4. Whatever the validity of these explanations the pattern in therates of return reported in the studies are nevertheless at variance withearlier studies within Pakistan, such as Hamdani, with studies in otherparts of the world (Psacharopoulos 1985) and with the prior intuition ofgovernment policymakers and their advisers. The question then is, arethere other reasons for the different results of the studies quoted inTable 1? In particular, if the results differ purely for methodologicalor data reasons, then policy conclusions would have to be tempered untilmore definitive results are obtained.
Table 2. The Returns to Investment Education by Country Type and Level (Z)
Number ofSociaL Private Countries
'Region Primary Secondary Higher Primary Secondary Higher Reporting
Africa 28 17 13 45 26 32 16Asia 27 15 13 31 15 18 10Latin America 26 18 16 32 23 23 10Europe &Middle East 13 10 8 17 13 13 9
DevelopingCountries 24 15 13 31 19 22 45
DevelopedCountries - 11 9 - 12 12 15
"-": Means data were not available because of the lack of a control group ofilliterates.
Source: Psacharopoulos, "Returns to Education: A Further International Updateand Implications," Journal of Human Resources, 1985.
5. Methodology. There are two basic methodologies for estimatingrates of return to schooling. In the direct approach, rates of return arecomputed directly from the education coefficient in estimated earningsfunctions. In the indirect approach, internal rates of return are calcu-lated from a comparison of the incremental costs and the incrementalearnings associated with various schooling levels. These earnings varyaccording to age-earnings profiles. Guisinger et.al. admit that the two"give somewhat different results with the direct approach yieLding consis-tently lower estimates of the rates of return to schooling than theindirect approach. This may explain why Hamdani, who used the indirectapproach, found somewhat higher rates of return than we have found" (p.266). The reason is that the direct approach treats the coefficient ofa "level of education" dummy variable in an earnings function as the rateof return to education. If there is no interaction between this dumny

-100-
ANNEX 2Page 4 of 9
variable and education, the approach implicitly assumes that the dif-ference between earnings at two levels of education is the same throughouta person's life cycle. The indirect approach used by Hamdani accepts thepossibility that differences in earnings may vary with age--i.e., theremay be complementarities between formal schooling and experience--sinceage-earnings profiles are calculated at each educational level. Thelatter approach is more attractive since it is more flexible. There areother reasons for favoring the indirect approach. The most important isthat it allows calculation of the social rate of return to education,whereas the direct approach does not, except under very restrictiveassumptions about the costs of education.
6. Data. Coverage is extremely important. The Rawalpindi Citysurvey is based only on workers in a city that has an over-representationof government workers. Wider national samples, such as those used by Khanand Irfan, would be more valid for generalizable results.
B. An Updated Estimate
7. Age-earnings profiles by level of education computed from tablesderived from the 1979 Household Income-Expenditure Survey (HIES) were usedto conduct a rate of return analysis. It should be noted that becausethese profiles are taken from aggregate-level data, they may not bestrictly comparable to those from individual-level sources. However, thegains in terms of coverage and in the use of a better methodology partlyoffset the drawbacks from the aggregate analysis.
8. Benefits. The age earnings data used in the analysis arereproduced in Table 3. These data are segmented by level of education:less than primary, high school, intermediate, degree, and postgraduate(university). Since some of the given educational intervals which haverelatively few observations, age-earnings equations were estimated inorder to smooth out the profiles. Earnings (Y) of the ith individual whohas retained the jth level of schooling were presumed to be related to age(X) and its square (X2):
2X =A +A X +AX (1)
ij o 1 ij 2 ij
At any given point in the working segment of an individual's life cycle then,the benefits of having acquired the jth level of schooling is thedifference between earnings at that level and those at the previouslevel:
B =Y -Y (2)ij ij ij-l
The results of the estimation of (1) are reproduced in Table 4. Thebenefits of each level of education over an individual's entire life cyclewould be the difference between the age earnings profile of any twolevels. This difference would, of course, be calculated only over the

-101-
ANNEX 2Page 5 of 9
age-range from the time that an individual begins his/her working life torctirement (assumed to be 65 years).
Table 3: AGE-EARNINGS PROFILES BY LEVEL OF EDUCATION PAKISTAN KALES, 1979
Less Than Post-Age Primary Primary Matirc Intermediate Degree Graduate
10-14 203 - 269 - - -
15-19 314 428 353 463 630 -20-24 406 436 469 589 712 87725-29 521 545 673 629 812 122630-34 572 700 703 939 1233 152835-39 638 774 803 999 1149 147440 + 732 1093 1089 1437 1189 2757
Source: Household Income and Expenditure Survey, 1979.
Table 4: AGE-EARNINGS REGRESSIONS
Level of Schooling Intercept Age Age2
Less than Primary -134.3477 31.2404 -.2804(1.5911) (.0244)
Primary 147.7675 12.7737 .1062(9.1288) (.1296)
Matric -69.2633 28.2948 -.1167(5.9061) (.0906)
Intermediate -4.3069 25.8117 .0387(15.8336) (.2248)
Degree 269.7713 14.3921 .3208(28.0786) (.3986)
Post-Graduate 622.9908 -3.5541 .8481(65.6273) (.8676)
Source: Computed from Table 3.
9. The implicit assumption is that earnings capture all of thebenefits to an individual of schooling. One possibility is that becauseof labor market failure, wages do not reflect productivity. Inparticular, it has been hypothesized that the returns to higher educationare underestimated by earnings because of policy-induced wage-compression

-102-
ANNEX 2Page 6 of 9
of skilled relative to semi-skilled workers. This is exacerbated by thefact that semi-skilled workers have access to the international labormarket while skilled workers do not. Such arguments have not beenrigorously tested with available data. Another possibility is that thereare non-monetary benefits to education. Aside from social benefits, thereare the gains to farm productivity. The samples used in the rate ofreturn analysis do not account for gains in the rural areas. Findingsfrom other studies are discussed later in this section.
10. Costs. The social costs of education are assumed to be the sumof the following: the unit subsidy (unit cost less unit fee revenue)incurred by the Government to provide education at a given level; theopportunity cost in terms of income foregone while in school incurred bythe student; and other privately-incurred direct costs of schooling, suchas transport, school supplies, etc. The unit cost figures were taken fromMinistry of Education and Universicy Grants Coomission data and aresummarized, for the 1983-84 period in Table 5. The opportunity cost ofthe jth schooling level were simply assumed to be the earnings, over thetime that a person has to be in school for that level, of schooling le-elj-1. At the primary level two alternative assumptions were made regailingopportunity cost to span the range of possibilities regarding rates ofreturn--(i) that there are opportunity costs over the entire primary agerange 6-10; and (ii) that there are no opportunity costs at all. Finally,no data on the privately-incurred direct costs of schooling were availablefrom the same data base, other studies were used to estimate thesemagnitudes. It was assumed that, below the post-graduate universitylevel, the private costs of schooling were 25Z of government-incurreddirect costs. At the university level, they were assumed at 10%. Theprivate costs of schooling include: the opportunity cost, privately-incurred direct costs and tuition. Fees per student are calculated as theaverage amount actually collected, rather than the amount charged. Thetwo are different because of various exemptions that are granted by bothprovincial and university authorities. Scholarships that are directlypaid to students are not included sine they are of a very small magnitude.

-103-
ANNEX 2Page 7 of 9
Table 5: COSTS OF EDUCATION IN PAKISTAN
Level of Education Primary Matric Intermed Degree Postgrad
Starting age of educ. level 5 13 15 17 20Ending age of level 10 15 17 20 23Years not in lab. force 5 2 2 3 3
1. Direct costs per student 373 564 1566 1566 12426borne by government (83 Rs):
2. Costs borne by students(83 Rs)a. Annual tuition 83/84: 0 2 113 113 1716b. Annual foregone income
Year of schooling:lst 254 4462 5626 7624 117342nd 736 4946 6048 8088 122053rd 1208 8554 126874th 16705th 2123
c. Other personal costs: 93 141 392 392 1243
Flows of Costs (83 Rs)
Social costs (1+2b+2c)Year of schooling:1st 720 5167 7584 9581 254022nd 1202 5651 8006 10046 258733rd 1674 10512 263564th 21365th 2589
Private costs (2a+2b+2c)Year of schooling:1st 347 4605 6131 8128 146922nd 829 5089 6553 8593 151633rd 1301 9059 156464th 17635th 2216
Sources: 1, 2a, Ministry of Education budget documents; 2b, Appendix 2;2c, 252 of 1 for all levels except postgraduate where it is 10%of 1.

-104-
ANNEX 2Page 8 of 9
11. Rates of Return: To compare these flows, the rates of return tovarious levels of education are presented in Table 6. The rate of returnis the rate of discount that would set the net present value to zero. Thegreater the degree to which benefits outweigh costs, the greater wouldthis rate have to be. The main conclusion is that the trends in, andindeed, the magnitudes of the rates of return are very similar to thosefound by Hamdani for Rawalpindi City. The social rates of return toeducation range from about 7Z (secondary) to about 16Z (primary) under theassumption that there are opportunity costs of schooling at the primarylevel. Moreover, both private and social returns decline with highereducational level, with the exception of the relationship between secon-dary and college levels, where it rises. The social rate of return toprimary education is double that of university-level education, which hasa rate of return of 7.8Z. The latter is less than the opportunity cost ofphysical investment.
Table 6: RATES OF RETURN BY LEVEL OF EDUCATION (Z)
Level of Education PRIMARY MATRIC INTERMED DEGREE POSTGRAD
Full Opportunity CostsSocial rate of return 16.4 6.3 11.3 10.3 7.8Private rate of return 21.1 6.7 13.4 11.6 11.4
No Opportunity Costsfor ages 6-10
Social rate of return 39.1 -- Same as above
12. These results are remarkably similar to those of Hamdani, despitethe differences in data coverage. This implies that methodology doesmatter in rate of return analysis. In particular, allowing for complemen-tarity between on-the-job experience and schooling changes the conclusionsregarding rates of return. The benefits to higher levels increase withage, whereas the benefits to primary schooling stay relatively constant.However, the latter are realized sooner and would be given a relativelygreater weight in a rate of return calculation based on earnings functionsthat allowed for complementarity. Thus, the literature has yet to achievea consensus on quantifying rates of return to education in Pakistan. Itis not possible to reject the notion that the returns in Pakistan exhibita similar trend to those in other countries: higher for primary relativeto university. Relative magnitudes appear to be lower than the averagefor other developing countries. However, at least for primary levels,there is evidence that they are higher than the returns to investing inphysical capital. The difference between the social and private rates ofreturn measure the degree of subsidization in any given level ofeducation. For grades above primary, the difference is greatest foruniversity education. This implies that it is possible to transfer costsfrom society in general to the student without adversely affecting thesocially desirable number of graduates in Pakistan.

-105-
AMIEX 2Page 9 of 9
C. Non-Monetary Benefits
13. Rate of return calculation focus on earnings differentials andcapture benefits onLy in the monetized sector of the economy. Takingother benefits into account would increase the computed rates of returnsubstantially. Aside from effects that are impossible to measure, such asthe impact on national unity, and socialization, researchers haveattempted some preliminary measures of non-monetary impact. In a study ofthe impact of education on farm productivity, Butt (1984) concludes thateducational attainment, particularly at the secondary level, has a sig-nificant effect on output. Education is also found to be positivelyrelated to yield per area. Another effect of education that has beenmeasured for Pakistan is its negative effect on fertility, particularly inthe rural sector. Thus, to the extent that family planning is a socialconcern in Pakistan, this effect would increase the social value ofeducation.

-106-
ANNEX 3Page 1 of 11
The Potential for Increased Cost Recovery in Higher Education
1. The Government bears almost the entire cost of public educationat all levels. In 1985, fees have been increased, but they remain lowrelative to the per student cost of public education. The analysis belowshows that there is room for increased cost recovery, particularly inhigher education, and that the increase could lead to significant improve-ment in the efficiency of resource allocation in the sector, and enhanceequity in the distribution of public spending on education.
2. In 1984 each student place in higher education cost Rs 2,811. I/On average, 9Z of the total public spending on higher education wasrecovered through fees (tuition plus other charges such as admission andexamination fees) paid by the students. Each student therefore con-tributed Rs 253 per year and the subsidy averaged Rs 2,558 per student peryear. Besides fees, students incur other expenses, mainly fox transport,books, and food and lodging. But the most important item is opportunitycost. Chafoor shows that it constitutes over 80% of the total privatecost of higher education. 2/ The share of fees was only about 102. Toestimate the potential effect of an increase in user charges for highereducation, data are needed on the extent of excess demand, as well as theelasticity of demand with respect to user charges. Unfortunately, bothtypes of data are not readily or easily available. There is, however,some partial evidence suggesting that there is substantial excess demandfor higher education in Pakistan, as there is in other developingcountries. Anecdotal evidence indicates that at some of the better publiccolleges and universities, there could be three times as many applicantsas there are places at the postgraduate level. For undergraduate studies,as many as 5 to 10 applicants compete for each available seat, and thisnumber could rise to 20 for medical and other professional studies. Thestrong demand is not limited to public universities where tuition isalmost free: The Agha Khan Medical College, a private institution whichcharges Rs 18,000 per year (about US$1,160 at 1985 exchange rates)attracts, on average, 30 applicants per available place.
1/ Using data for 1985 would have been preferable since they reflectthe new structure of fees. The analysis based on the 1984 data wouldnevertheless remain useful since it permits comparison between whatthe fee increase could have been, given the demand conditions in 1984,and that which was actualLy implemented in 1985.
2/ A Ghafoor, Unit Cost of Higher Education, AEPH, 1984.

-107-
ANNEX 3Page 2 of 11
3. Evidence is scanty, however, on the extent of excess demand forhigher education for the country as a whole. One recent study (Khan andHussain, 1984) indicates that in 1980-81, there were about 2.3 to 10applicants per available place for undergraduate studies; and for coursesat the Masters level, there were 1.4 to 3.4 applicants per place. It isunclear how these rates have been computed, but they fall in the vicinityof the average ratio for colleges in the Punjab--2.65 applicants perplace-which have been corrected for the incidence of multipleapplications. 1/ On the whole, it seems reasonable to assume as a conser-vative estimate 2/ for the base case simulations, that there are twoapplicants per place in Pakistani higher education. In 1984, the feeswere, on average, Rs 253 per student, and 0.56 million were enrolled.Since only half the demand for higher education is assumed to be satisfiedin the base case simulation, the corresponding expressed demand for highereducation would be 1.2 million. For the more pessimistic simulations, itis assumed that there are 1.5 applicants per available place; this cor-responds to an expressed demand of 0.84 million at the average fee levelof Rs 253 per year.
4. Information on the elasticity of demand for education is similarlyscarce. Jimenez's (1985) review uncovered only nine studies worldwide, ofwhich only one, for Taiwan in 1950-69, focussed on higher education.Given this data gap, some assumption about the elasticity of demand wouldbe needed to assess the potential impact of an increase in user charges inPakistan's higher education. In the base case it is assumed that thedemand for higher education drops 0.25Z for every 1% increase in fees.This is an extremely conservative assumption: since the share of fees intotal private costs is only 10%, it implies that the elasticity of demandwith respect to total private cost is -2.5. 31 In the less conservativesimulations, the elasticity with respect to fees is assumed to be -0.5.
5. A valid concern with the increase in fees is that it might beinequitable. Poor students in particular might be forced to terminatetheir studies. This outcome could, however, be avoided by providingscholarships to these students. The potential expansion of higher educa-tion would in this case be smaller, since the provision of scholarships
1/ S. R. Rhan and A. Hussain, Chapter 5 in Higher Education andEmployment Opportunities in Pakistan, UNESCO and Ministry ofEducation, (forthcoming, 1986).
2/ Conservative in the sense that the assumption probably leads tounderestimates of the potentially feasible increase in user charges.
3/ The relationship between the elasticity with respect to fees (ef)and with respect to total private cost (ec) is given by ef = x . ecwhere x is the share of fees in total private cost.

-108-
ANNEX 3Page 3 of 11
reduces the funds that can actually be used to increase the supply ofplaces. If fees were increased to Rs 1,005, 29.2% of the students woulddrop out under the base case assumptions and would be replaced by thosewho can afford the fees. 1/ To avoid this problem, the potential dropoutscould be fully shielded from the fee increase through scholarships equalin value to the fee increase. (This assumption is conservative since someof the dropouts might be able to continue their studies with smallerscholarships). The fee increase accompanied by a selective scholarshipscheme would permit higher education in Pakistan to expand by 0.7 millionplaces or 30.4%.
1/ This result probably overestimates the number of dropouts, since itassumes that those who are actually enrolled have the same elasticitywith respect to fees as those who would like to enroll, but areactually not enrolled due to the shortage of places.

-109-
ANNEX 3Page 4 of 11
m. : _ _ _ = _m VaI~
Asazptis Aloxut the il Ptei ineae (Z) In EfftveDan for Higher Ezcation Fee l b/ lM=ilmt in Highwr Fsation
s Demd ELasticity As % ofSiulatiom I aJ w.r.t. Fees es Costs c WLthmlt Sdelamrships e/ uth l i e
1. Base case 2.0 -0.25 1,005 35.8 41.1 3D.4
2. DurKi is 2.0 -0.50 694 24.7 21.4 12.5
elastic
3. Es, s 1.5 -0.25 651 23.2 17.9 14.3dmmi fKis-lI er
4. Demi is 1.5 -0.50 472 16.8 8.9 7.1
elasticaxd ess
maller
a/ Defined as the ratio between the r of applicants and the number admitted to higher education.
bf The level at rAdch there is neite exess dewd for nor exce supiLy of hIghr¢ educata pLaes
c/ The average cost per stxdet place m Rs2Pll in 1984. paceipts fro fee cotstituted 9 perxt of total.piublic spendirg m education, ich inpLies an average fee of Rs 253 per student in 1984.
d/ Asgus thaut all the extra rev s are wed to emd the suply of placs in higher educatiCx.
e/ The schiarships refer to those thst 'md be esIe to prevent dropout the popAatiax curredlyemmUed, due to the increase In fees.

-110-
ANNMX 3Page 5 of 11
6. The potential expansion in higher education remains significanteven when the base case assumptions, are made even more conservative. Theresults corresponding to the alternative assumptions appear in Table 1.When the elasticity of demand with respect to fees is doubled, fees can beraised to Rs 964 without causing the supply of placed to exceed demand.This level of fees implies a cost recovery rate of 24.7%, and would permithigher education in Pakistan to expand by 0.12 million places (21.4%), ifscholarships are not provided for potential dropouts; and by 0.07 millionplaces (12.5%), if selective scholarships are provided. The potentialexpansion is of the same order of magnitude when a smaller excess demand-reflected in a applicants-to-admitted-students ratio of 1.5 instead of2.0-is assumed in the calculations. For completeness, the resultscorresponding to the most pessimistic simulation-in which simultaneouslythe demand with respect to fees is more elastic, and excess demand issmaller-are also presented. Not surprisingly, the potential expansion ismch smaller. The result should, however, be taken as the minimum pos-sible increase in user charges for higher education.
7. So far the calculations assume that the extra revenues fromincreased fees are used to expand higher education. Alternatively, theextra funds could be used to expand primary or even secondary education.Since the social returns to investment at the lower levels exceed those inhigher education, this reallocation is likely to generate more efficiencyequity in the distribution of public spending on education. Inparticular, expansion at the lower levels will enhance the access to basiceducation for children who would otherwise be denied this opportunity. Inthe base case simulations, the fee elasticity of demand for higher educa-tion is assumed to be constant at -0.25; and the excess demand, tocorrespond to an applicants-to-admitted-students ratio of 2.0. Underthese assumptions, it can be shown that if the provision of places inhigher education were fixed at its 1984 level of 0.56 million, excessdemand would persist even if fees were raised to recover costs fully.With full cost recovery in higher education, the extra revenues wouldpermit primary school enrollments to be expanded by 59.9Z; oralternatively, secondary school enrollments to be expanded by 115%. 1/Thus the enrollment ratio in primary education could potentially be raisedfrom 49% to 785; or that in secondary education from 20X to 42%. Theresults corresponding to alternative assumptions about excess demand forhigher education, and the fee elasticity of demand appear in Table 2. Asbefore, even under the most stringent assumptions, it would be possible toincrease fees substantially without precipitating excess supply of places
It These calculations are based on the unit subsidy in 1984. Ascoverage extended, a higher subsidy may be needed to encourageenrollment; for example, in the rural areas, transportation costs andchildren's foregone production in farming may have to be compensatedfor. If so, the potential increase in places would be smaller.

-lll-
ANNEX 3Page 6 of 11
in higher education. For example, if simultaneously the ratio ofapplicants to admitted students were 1.5 instead of 2.0, and the feee:lsticity of demand were 0.5 instead of -0.25, fees can be raised toRs 564 (recovering 20.1% of unit costs) without causing supply to exceeddemand. Under these extremely unfavorable assumptions, the extra revenueswould permit a modest expansion at the lower levels of schooLing--by 7.3Zin primary education, or 13.5Z in secondary education. Again, theseoutcomes represent the lower bounds. It is probably feasible to aim at ahigher rate of cost recovery: the assumption required to raise fees to,say Rs 1,281 or Rs 1,050 (recovering respectively 45.6% and 45.6% of unitcosts) without resulting in excess supply, would still be very stringent.As indicated in Table 2, the extra funds could potentially increase theprimary enrollment ratio from 49Z to between 58 and 61%; or alternatively,increase the secondary enrollment ratio from 20% to between 27 and 29Z.

-112-
ANNEX 3Page 7 of 11
Ta 2: _ O In _3 et -
FqufiibriumAau3ti1s Alxout tihe Fe lwel In x fmi Potential &llt
Dand for lgIer Eratio HIgm Fdtmtmin in Fnrolants Ratio (2)
Ez,es D-* ElaSticity AS % Of Prfrwyc/ SecondarfrSimAtio W In v.r.t. Fe A*ees cBst Priary Sectnday (49Z) (2a:)
1. Be alSe 2.0 -0.25 2 8 1 1 b/ 100.0 59.9 115.0 78 42
2. DTxd Is 2.0 -0.50 1050 37.4 18.7 34.7 58 27tmuelastic
3. ?Qq 1.5 -0.25 1281 45.6 24.1 44.8 61 29
Is amiler
4. 13iw is 1.5 -0.50 564 20.1 7.3 13.5 53 23
er
a/ See footrtes of Table 10.
b ThE equilibrix fee is acbully uch Ighr. lmm, snce proflrng8 not an objective of pubibUced.catcm, the full cst recvery lewd of fee is asmmAu to be the equilibriun fee.
c/ Fiue In pudmis Is the czrxt nrezof t ratio.

-113-
ANNEX 3Page 8 of 11
8. The above policy--increasing fees in higher education and real-locating the extra revenues toward primary or secondary education--wouldalso have a positive impact on equity. This is because it redirectspublic resources towards those who are at present denied even the oppor-tunity for basic education. The gain in equity would persist even if theincrease in fees in higher education causes some students from poorfamilies to dropout. The tradeoff is between avoiding some dropout amongthose who already have at least secondary education, and widening educa-tional opportunity for those who do not yet have any schooling. Since thelatter are likely to be even poorer than the potential dropouts in highereducation, the equity loss in higher education is very likely outweighedby the gain in equity for the sector as a whole. To illustrate, considerthe outcome when fees are raised to recover costs fully, and the extrarevenues are used to expand primary education. Previously, those whoentered adulthood with no schooling or only primary schooling represented80% of the population, and accummulatd 3.IZ of the public subsidies foreducation. With the increase in user charges and reallocation towardsprimary education, their share would rise to 53.6%.
9. To slimnarize, the foregoing discussion shows that there is roomfor increasing user charges in Pakistani higher education. Although thelack of data prevents disaggregation of the analysis by fields of study,the results support a policy in which user charges are, on average,enhanced to recover a substantial portion of the cost of higher education:the conditions under which it is reasonable to aim, say for a 40X costrecovery rate, appear probable, and arguably even conservative. The extrarevenues from the increased fees could be reinvested in higher education,but the social benefits-in terms of efficiency and equity gains-would belarger if most, if not all, of the funds are reallocated toward primaryeducation.

ANNEX 3Page 9 of 11
ENROLLMNIT IN EDUCATIONAL INSTIlUTION BY KIND. LEVEL AND SEU
Primary Stage Middle Stage High Stage Secondary Arts & Science Professional UniversitiesTear (K-V) (VI-VIIl) (IX-X) Vocational College$ College&
(thousonds) (thousands) (thousands) (thousands) (thousands)
Total Female Total Fegale Total Female Total Feguse Total Female Total Female Total Female
1947-48 770 110 221 21 5k 7 4 2 14 1 4.4 0.327 0.664 0.0561948-49 830 120 225 24 i} 7 4 2 17 1 4.5 0.349 0.690 0.0641949-50 920 120 250 24 57 9 5 2 21 2 4.9 0.394 0.737 0.071
1954-55 1,550 240 332 45 109 15 11 3 43 6 8.1 0.833 2.0 0.0491959-60 1,890 370 442 63 149 23 13 3 76 12 12.4 1.9 4.1 0.778
1960-61 2,060 430 449 67 160 27 15 6 71 12 12.9 1.9 5.1 1.01961-62 2,270 480 461 7S 161 23 19 8 72 14 14.0 2.3 7.2 1.31962-63 2,490 530 491 82 209 38 20 8 94 18 14.9 2.5 9.5 1.71963-64 2,750 570 576 119 217 54 23 7 119 21 17.7 2.7 9.0 2.01964-65 3.050 700 624 128 222 46 .21 6 127 24 17.4 3.0 13.2 2.7
1965-66 3,160 750 689 149 244 49 21 5 139 28 19.1 2.9 13.4 3.0
1966-67 3,380 790 763 169 273 55 22 7 148 32 19.8 3.1 12.8 2.51967-68 3,750 990 793 164 275 50 24 8 153 34 25.0 3.5 15.9 3.0198-69 3,830 1,010 846 170 296 56 24 8 159 40 30.1 3.9 13.1 2.7 11969-70 3,910 1,030 899. 175 337 62 29 9 175 45 33.6 4.2 15.5 3.3
1970-71 3,960 1,040 933 178 336 67 35 10 199 50 37.2 4.6 17.1 3.71971-72 4,210 1,110 963 196 366 71 40 12 186 49 36.2 5.0 17.5 3.91972-73 4,450 1,270 1,041 232 390 81 59 16 186 47 37.6 6.5 18.7 4.21973-74 4,810 1,370 1,096 247 418 78 40 14 193 53 42.5 6.8 19.1 4.11974-75 4,971 1,430 1,196 279 504 100 42 14 208 58 44.7 8.1 21.4 4.5
1975-76 5,319 1,549 1,247 294 524 106 31 9 211 53 56.1 8.9 22.8 5.11976-77 5,611 1,590 1,298 309 548 116 39 8 223 66 56.9 9.5 37.7 9.01977-78 5,015 1,598 1,304 317 538 123 33 8 221 72 62.1 10.8 41.1 7.01978-79 5,131 1,629 1,300 327 513 124 34 9 233 75 67.3 12.0 38.6 6.01979-80 5,213 1,676 1,391 345 511 125 35 7 253 78 72.5 13.2 41.8 5.7
198O-81 5,474 1,782 1,412 359 549 130 40 7 270 87 77.7 14.4 42.7 7.1
1981-82 5,741 1,896 1,453 374 588 135 45 7 283 94 82.5 15.4 47.6 8.51982-83* 6,023 1,974 1,593 408 596 167 49 8 388 121 84.3 16.5 47.6 7.91983-84* 6,412 2,092 1,676 432 611 176 52 9 419 130 87.7 17.4 49.5 8.01984-85* 6,645 2,195 1,738 451 624 145 55 10 452 141 92.2 19.0 56.2 8.5
Gourc6i 1. Federal Bureau of Statistics2. Ministry of Education3. University Grants Commission
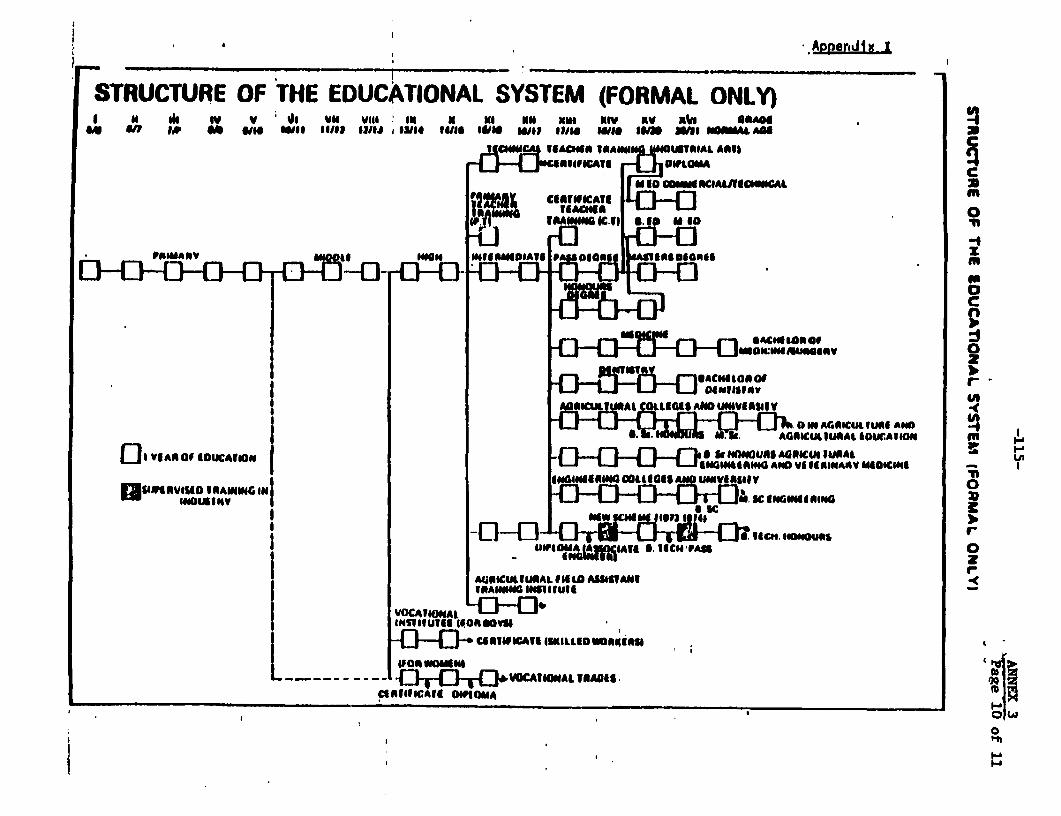
A',Pnendix I
STRUCTURE OF THE EDUCATIONAL SYSTEM (FORMAL ONLY)0 N id I w v 0o wVI vilIN U No No Nut NWY Kw NW 0401
W 14V 44 wie Owl$ solos uriti 13#14 1411111 UWIS Woo Stile 141 ISMNII WIIIA. s 'A
_UCM_o IAO IRUAI AWSOU
MO iCIA&II1ICHM"2
wRI~c~2& A1S =C.1 S. .0 M I0
[ {<{]'~~~~~~~~~~G ;w;|onil a ' saad x.I
fa
C
r _ t;|_ _ _ *^eio o ef ri =E <~~~~~~~~~~~~~
I I USAI YJIOISUSA$IouWIl4VEiI IA
DIN" MA&ISC44,lS *5U41 AAOICUIIUIAI AGUAIIO Ill
OfWIARO .IOUCAViON I kINC 1A
IOWIIIY ~ ~ ~ ~ ~ ~ ~ ~ ~ ~ ~ ~ ~ ~~~ ~~~AD dO ININASIW UOICIdeIg~ ~~~~~~~~~~~~~~~~~~Ail
i ut~~~~~~~~~~~o"w id ., .e,..
I -uz^ *)AII D. ioc -'PAS -I ~~~~~~~AdIICU&VUIAL#iglOo 0VAN
_01 4i~~~~~~~~~~~~~~~
|~ ~~~~~~~avwv ISKneuwss zfiol
VOCAINAL -00-e I"tAllO""S" , ; .
w0^"l z z b~~~~~~~~~~~~~~~~~~~~~~~~~~~~~~~~~~~~~~~-_______ _ _ _ __ {1^ 1"^0{l . w M~~~~~~~~~~~~~~~~~~~~~~~~~~~~~~~~~~~-

NUMBER OF EDUCATIONAL INSTITUTIONS BY KIND, LEVEL AND SEX
ANNEX 3Page 11 of 11
Secondary Vocational Arts and Science ProfessionalPrimary Schools Middle Schoola High Schools Institutions College$ Colleges Universities,
VYAR --- ~-~--------- -- ~-~--------~ --------- ~~-~ ~~-------------- ------------------ --------------- ~~~~~~~~~~~~~~Total Female Total Female Tgtal Fep§12 Total Femtle Total Fe ale Total Female_ Totel
1947-46 8,413 1,549 2,190 153 408 64 46 18 40 5 - - 21948-49 9,073 1,564 2,174 154 411 70 49 20 42 6 19 2 21949-50 9,411 1,586 2,134 172 469 69 59 25 46 9 19 2 2
1954-55 14,162 2,474 1,517 196 747 148 90 40 77 19 24 1 4
1959-60 17,901 3,260 1,974 281 1,069 203 100 35 126 32 40 5 4
1960-61 20,909 4,057 1,798 275 1,172 225 109 47 131 33 42 5 41961-62 24,930 5,350 2.011 364 1,300 255 103 40 146 37 39 5 61962-63 28,338 6,715 2,237 423 1,349 275 103 41 159 39 41 5 61963-64 30,950 7,416 2,379 462 1,459 308 117 38 190 51 43 5 61964-65 32,589 8,021 2,701 589 1,622 367 145 58 225 62 45 5 6
1965-66 32,930 8,272 2,785 626 1,658 376 113 39 228 63 48 5 61966-67 34,678 8,535 2,970 659 1,776 423 142 62 258 76 48 5 71967-68 36,453 9,324 3,018 719 1,627 458 165 72 251 76 50 5 7196869 38,870 10,250 3,290 790 1,910 490 180 80 270 80 58 5 71969-70 41,290 11,170 3,560 860 1,995 520 190 90 290 85 59 5 7
1970-71 43,710 12,097 3,822 928 2,063 529 209 97 514 87 73 6 71971-72 45,854 12,290 4,110 1,038 2,247 571 284 134 339 93 73 6 81972-73 49,580 14,437 4,406 1,163 2,498 621 391 152 334 89 76 7 81973-74 50,574 15,061 4,586 1,223 2,742 718 314. 150 354 95 81 8 81974-75 51,744 15,678 4,713 1,266 2,898 770 301 141 361 96 83 8 10
1975-76 52,800 15,829 4,783 1,307 3,047 806 282 116 404 107 98 8 121976-77 53,162 15,941 4,990 1,352 3,214 860 231 81 433 116 98 8 121977-78 53,964 16,246 5,100 1,359 3,239 880 242 82 430 116 95 8 IS1978-79 53,882 16,551 5,194 1,393 3,321 898 245 83 429 119 99 8 151979-80 57,220 17,771 5,233 1,407 3,361 924 248 84 430 18 99 8 15
1980-81 59,168 18,595 5,295 1,412 3,479 967 231 88 434 120 100 8 191981-82 61,117 19,420 5,362 1,423 3,597 1,010 247 92 450 130 02 8 201982-83* 69,058 20,507 5,979 1 ,595 4,037 1,122 263 96 500 154 102 8 201983-84* 72,053 21,202 6,053 1,609 4,180 1,167 266 98 514 161 102 8 201984-85* 75,532 22,050 6,229 1,656 4,274 1,474 270 101 520 163 107 11 20
Source: 1. Federal Bureau of Statistics.*Estimated 2. Ministry of Education

-117-
ANNEX 4Page 1 of 5
Assumptions for Selected Tables in Chapters VII and VIII
1. Table VII.5: Requirements for Primary and Secondary Teachers,1984/85 - 1992/93
a) Annual Training Capacity: includes 9,000 positions to be filledwith qualified candidates from universities and degree collegeswho did not attend special teacher training institutions.
b) Requirements: includes projected requirements in the publicand private sector. Calculations are based on student/teacherratios of 35:1 for the primary; 22:1 for the lower secondary;and 13:1 for the higher secondary level. Student enrollment andteacher requirement projections amount to the following(in thousand);
1987/88 1992/93
Primar
Male students 5,110 7,482Female students 2,855 4,988Male teachers 146 214Female teachers 82 143
Secondary (Lower)
Male students 1,441 2,033Female students 641 949Male teachers 66 92Female teachers 29 43
Secondary (Higher)
Hale students 539 708Female students 294 425Hale teachers 41 54Female teachers 23 33

-118-
ANNEX 4Page 2 of 5
c) Expected (deficit) Surplus: attrition is assumed to amount to5% p.a. for male and to 8X p.a. for female teachers. Projectionsshow the following teacher availabilities (in thousand):
1987/88 1992/93
Primary Teachers
Male 146 141Female (trained) 57 58Female (untrained) 21 36
Note: As demand for female teachers in rural areas is unlikelyto be met with trained teachers, it has been assumed that 25Zof total posts for female primary teachers will have to be filledwith untrained teachers.
Secondary (Lower) Teachers
Male 58 57Female 24 23
Secondary (Higher) Teachers
Male 43 47Female 22 25
2. Table VII.7: Private Education Institutions and Enrollments
a) Primary: projections are based on the assumption that growthin the primary sector will continue to be buoyant and annualgrowth in primary schools will amount to 10% until FY88. Growthwill then slow down to 6.5% as the urban market, where most ofthe private schools are located is getting gradually saturated.The size of schools is expected to gradually increase again, fromits present level of 142 students to 150 students in FY88 and 185students in FY93. This is still lower than the average schoolsize or 225 in FY69.
b) Secondary: growth in the secondary school system is expected toaccelerate in the next Plan period, when policy issues have beenclarified and the investment climate in the private school sectorimproves. Rapid growth projections also take account of the factof the strong role secondary private education had playedbefore nationalization. A 13Z p.a. growth in secondary schoolsis projected until FY88, and a less buoyant 8.7Z p.a. growththroughout the Seventh Plan. School sizes are expected toincrease again, from its present level of 140 to 168 in FY88

-119-
ANNEX 4Page 3 of 5
snd to 200 in FY93, compared to an average secondary school sizeof 448 before nationalization.
c) Intermediate: only a modest growth is projected for intermediatecolleges as a number of difficult issues regarding examinationsand admission criteria for local universities will need tobe clarified. Increasing growth can be expected under theSeventh Plan, but enrollment levels will still remainsubstantially below the pre-nationalization period and collegesizes will remain small.
3. Table VII.9: Estimated Average Annual Public Outlays
a) Primary: enrollment assumptions for FY88 are 8 million, for FY93are 12.5 million (improved level) and 8.3 million (constantlevel), for FY2000 are 20.1 million (improved level) and 10million (censtant level). Unit capital cost assumed are Rs1,600/student; unit current costs are Rs 440 p.a./student.
b) Secondary (lower): enrollment assumptions for FY88 are 2.1million, for FY93 are 3 million (improved level) and 2 million(constant level), for FY2000 are 5.4 million (improved level)and 2.4 million (constant level). Unit capital cost assumed areRs 8,000/student; unit current cost are Rs 650 p.a./student.
c) Secondary (higher): enrollment assumptions for FY88 are 0.8million, for FY93 are 1.1 million (improved level) and 0.9 mil-lion (constant level), for FY2000 are 2.0 million (improvedlevel) and 1.1 million (constant level). Unit capital costassumed are Rs 8,000/student; unit current cost are Rs 1,500p.a./student.
d) College (grades XI-XII): enrollment assumptions for FY88 are 0.6million, for FY93 are 0.8 million (improved level) and 0.7 mil-lion (constant level), for FY2000 are 1.2 million (improvedlevel) and 0.8 million (constant level). Unit capital costs areRs 23,003/student and unit current costs are Rs 2,800p.a./student.
e) Higher: enrollment assumptions for FY88 are 0.17 million, forFY93 are 0.24 (improved level) and 0.19 (constant level), forFY2000 are 0.43 (improved level) and 0.23 (constant level). Unitcapital cost assumptions are Rs 50,000/student and unit currentcosts Rs 11,000 p.a./student.
Unit costs are derived from Provincial Budget Statistics, 1984/85.They differ from the costs used in the analysis of paras. 7.26-7.29, as unit

-120-
ANNEX 4Page 4 of 5
costs used for projections include administrative and teacher training expen-ses allocated to each level of education. They are also adjusted upward forquality improvements needed.
4. Table VIII.2: Public Health Infrastructure, 1977/78-1984/85
In 1984/85, Punjab had 26,092 sanctioned public hospital beds, 1,706BHUs, 240 RHCs and 2,430 subcenters and a provincial population of 53.55million. Corresponding numbers for Sind are 16,882 sanctioned public hospi-tal beds, 66 BHUs, 81 RHCs and 1,260 subcenters. The Sind populationamounted to 21.4 million. Baluchistan had 2,634 sanctioned beds, 157 BHUs,31 RCHs, 424 other rural subcenters and a population of 4.87 million.Corresponding numbers for NWFP are 5,523 sanctioned beds, 450 BHUs, 66 RHCsand 721 other rural centers for a population of 14.91 million. Total sanc-tioned hospital beds amounted to 53,803 with 2,468 sanctioned BHUs, 455 RHCsand 5,453 other centers. Total population in FY85 was estimated at 94.73million.
5. Table VIII.8: Trained Staff Needed to Meet Planned Requirements
a) available: includes both employed staff and trained manpowerseeking employment;
b) expected deficit/surplus: projections are made under the assump-tion that no new training facilities be created or closed untiiFY93;
c) doctors: requirement figures reflect total amount needed ofdoctors at a constant doctor population ratio of 3,000/1 for 102million people in 1988 and 117 millien people in 1993. Theprojected surplus is based on ar. annual output of 4,000 medicalgraduates and 5Z attrition. The stock of medical doctors isprojected to amount to 40,700 in 1988 and to 50,700 in 1993;
d) nurses: requirements for nurses are based on a 1 to 4 nurse/bedratio for 80,200 hospital beds (17,300 private, 62,900 public)in FY88 and for 95,000 hospital beds (25,000 private, 70,000public) in FY93. Annual output of trained nurses is estimatedto amount to 1,200 throughout the Sixth and Seventh Plan periods.Annual attrition is estimated to amount to 10%.
e) lady health visitors: requirements are based on two lady healthvisitors per BHU and four per RHC. Annual training capacity isassumed at 450 and 5% annual attrition.
f) medical technicians: requirements are based on the assumptionof one medical technician per BHU and two technicians per RHC.Annual training capacities are projected at 600 throughout theSeventh Plan. Annual attrition is estimated at 5Z.

-121-
ANNEX 4Page 5 of 5
6. Table VIII.9: Private Health Facilities, 1980/81 - 1992/93
Projections are based on past growth trends and an assessment of thefuture absorptive capacity. Hospitals are estimated to have grown by 12Zbetween FY81 and FY85, this growth is projected to slow down to 7% betweenFY85 and FY93. The average size of hospitals is expected to increaseslightly, to 54 beds in FY88 and FY93, this is following a trend establishedin recent years. About 17,000 hospital beds are expected to be available inthe private sector in FY88 and 25,000 in FY93. Projections do not includedoctors who work only part-time in private practice in addition to theirduties in public service. In FY81 and FY85 private hospitals and clinicswere still largely staffed with doctors working primarily in the publicsector and performing private service on the side. With an increasing stockof doctors this situation is expected to change,. Projections for privatedoctors are based on the assumption that each hospital will be staffed bytwo doctors and each clinic by 1.5 doctors.
7. Table VIII.10: Estimated Public Health Infrastructure Requirements
Estimates are based on the medium population of Table VI.4 andassumes a population of 102 million in 1987/88; of 117 million in 1992/93;of 143 million in 1999/2000. End Sixth Plan targets represent revised SixthPlan (Priority Plan) targets. Requirements for Basic Health Units and RuralHealth Centers are calculated on the assumption to provide one BHU or RHCfor each 10,000 people by the year 2000. The balance BHU/RKC is about 7 to1. End Seventh Plan Requirements are an intermediate step, taking intoaccount implementation capacity. Public hospital bed requirements are calcu-lated on the assumption that 1 hospital bed (public or private) will beprovided for 1,300 people througnout until 2000. Private hospital beds areprojected to amount to 17,000 by FY88, to 25,000 by FY93, to 38,500 by FY2000. Numbers for doctors are based on the availability of doctors with4,000 medical graduates added each year and 5% attrition in the stock ofdoctors.
8. Table VIII.11: Estimated Average Annual Public Outlays
Estimation for financing requirements are based on infrastructurerequirements in Table VIII.10. Development costs of one BHU are Rs 1.5million; for one RHC 3.5 million; for one hospital bed Rs 0.8 million. Coststo train one doctor are estimated at Rs 0.3 million and at Rs 0.112 millionper nurse. Annual recurrent expenditures are estimated to amount to Rs175,000 for one BHU; Rs 513,000 for one RHC; and Rs 32,000 for one hospitalbed. The Rs 0.95 allocated for the Preventive Program represents the alloca-tion under the Priority Program.
