public disclosure authorized tech startup ecosystem in...
TRANSCRIPT

Tech StartupEcosystem in
FINDINGS AND RECOMMENDATIONS
West Bank and Gaza
This map was designed over a map produced by the Map Design Unit of the World Bank. The boundaries, colors, denominations and any other information shown on this map do not imply, on the part of The World Bank Group, any judgment on the legal status of any territory, or any endorsement or acceptance of such boundaries.
Pub
lic D
iscl
osur
e A
utho
rized
Pub
lic D
iscl
osur
e A
utho
rized
Pub
lic D
iscl
osur
e A
utho
rized
Pub
lic D
iscl
osur
e A
utho
rized

ContentAuthors and Acknowledgements 1
Executive Summary 2
Measuring and Analyzing the Tech Startup Ecosystem in the West Bank and Gaza 5
Measuring the Tech Startup Ecosystem 5
Analyzing the Tech Startup Ecosystem 6
The Tech Startup Ecosystem in the West Bank and Gaza 9Skills 12
Supporting Infrastructure for Entrepreneurship 14
Investment 17
Community 20
Startup Success Factors 23
Gap Analysis and Policy Recommendations 24Summary of Gap Analysis and Stage of Ecosystem 24
Policy Recommendations 25
Appendix: Survey Methodology and Analysis 28Methodology 28
Short-Term Success 32
Long-Term Success 32
Notes 33
References 34

LIST OF TABLESTable 1.1 Networking Assets 7
Table 1.2 Categories of Ecosystems 8
Table 3.1 Development Stage of Ecosystem 24
Table 3.2 Policy Recommendations 25
LIST OF FIGURESFigure 2.1: Startup Growth in the West Bank and Gaza 9
Figure 2.2: Time to Complete Procedural Tasks in Life Cycle of a Startup Across Regions 10
Figure 2.3: Percentage of Female Founders Across Analyzed Ecosystems 10
Figure 2.4: Gender Distribution of Founders in the West Bank and Gaza 11
Figure 2.5: Previous Function of Founders by Gender in the West Bank and Gaza 11
Figure 2.6: Previous Role Type of Founders by Gender in the West Bank and Gaza 11
Figure 2.7: Average Age of Founders Across Various Ecosystems 12
Figure 2.8: Age at Founding by Gender 12
Figure 2.9: Highest Degree Earned by Founders 12
Figure 2.10: Previous Educational Background by Gender 13
Figure 2.11: Educational Experience Founders 13
Figure 2.12: Previous Functions of Founders at Time of Founding 14
Figure 2.13: Previous Role Type of Founders 14
Figure 2.14: Accelerator Programs Attended by Startups in the West Bank and Gaza 16
Figure 2.15: Acceleration Multiplier for Funding Probability (Quantity) 17
Figure 2.16: Acceleration Multiplier of Investment (Quality) 17
Figure 2.17: Median Investment Amount by Year of Existence 18
Figure 2.18: Funding Breakdown by Gender of Founder(s) 19
Figure 2.19: Growth of Founders and Connections 20
Figure 2.20: Connections in the West Bank and Gaza Ecosystem 21
Figure 2.21: Visualization of Ecosystem Connectivity 22
Figure 2.22: Success Factors 23
List of BoxesBox 1.1: GERN Ecosystems Connections Mapping Project 6
Box 2.1: Accelerators and Incubators 15
Box 2.2: Selected Domestic Accelerators and Incubators in the West Bank and Gaza 15
Box 2.3: Venture Capital firms in the West Bank and Gaza 19
Box 3.1: What are Coding Bootcamps? 26


Startup A newly established business venture that is in its first stages of operation. This report focuses on tech startups, which are those that have a technological component. These startups are typically designed to scale up quickly.
Startup Ecosystem The combination of people, startups at various stages and other stakeholders and organizations supporting or connecting to these startups, interacting in multiple dimensions to create and scale new startup ventures.
Scale-up (Firm) A firm that has an average annualized growth in employees (or in turnover) of greater than 20 percent a year over a three-year period with at least 10 employees at the beginning of the period (ScaleUp Institute 2014).
Venture Capital (VC) An institutional investor that provides financing to startups and small early stage firms. Usually VCs look for high growth potential firms to exit the investment in the short term.
Angel Investor An investor who invest in ventures (primarily at an early stage) in their personal capacity (that is, investing their personal money) and may or may not have an active advisory or guidance role for the founders in the venture.
Mentor An experience person who can provide advice, knowledge, or connections to a startup founder. Mentors usually have strong business acumen and practical experience through former entrepreneurship experience or industry knowledge.
Business Acumen This term refers to the theoretical or practical knowledge of how to develop and manage a business, including commitment and speed in understanding and dealing with risks and opportunities in the business environment.
Exit (startup exit) Generally, refers to the point at which a founder or early stage investors sell their stake in the venture, either through a private acquisition or public offering. For the purposes of this report, it refers more broadly as the point at which a startup is sustainable or has received sufficient funding to grow in the medium term (for example, five years).
All dollar amounts are U.S. dollars unless otherwise indicated.
Terms Used

1Authors And Acknowledgements
Authors and Acknowledgements
The authors of this report were Victor Mulas, Kathy Qian, Jade Garza and Scott Henry. Matt Lerner, Kwame Robinson and Mireille Raad also contributed to this report with data analysis and visualizations. The survey was conducted by Agility Management and Financial Consulting. The report was edited by Colin Blackman (Camford Associates) and designed by Wenceslao Almazan. The peer reviewers were Carlo Maria Rossotto (Lead ICT Policy Specialist, TDD), Issa Aghabi (Investment Officer, Venture Capital, IFC) and Elena Gasol Ramos (Senior Private Sector Specialist, FCI). The Tech Startup Ecosystem in West Bank and Gaza report has been prepared as part of the World Bank Group Finance for Jobs Series of Projects (F4J SOP), an initiative designed to support innovative financing instruments to facilitate job creation through the deployment of private capital in the West Bank and Gaza. The F4J SOP is led by Abdalwahab Khatib, Stefanie Ridenour, and Peter Mousley, and it provides support through a range of interventions, including early-stage financing for startups, investment co-financing for medium sized private investments, and a skills focused Development Impact Bond.
To support the investment and job growth objectives of the Finance for Jobs Project as well as address some of the challenges linked to entrepreneurial capacity and early-stage financing, the World Bank has designed an instrument – the Entrepreneurship Ecosystem Matching Grant (EE-MG) – that will help develop the investment pipeline in the West Bank and Gaza. Drawing on lessons learned from other matching grant programs, the objective of the instrument is to bring more early-stage investments to ‘bankable’ status by working through existing Investment Funds (IFs) to provide the necessary support and capacity building to entrepreneurs. The design of the instrument draws on the current knowledge of the ecosystem as well as addresses some of the key challenges that limit the entrepreneurial ecosystem.
The EE-MG under Finance for Jobs is a pilot instrument that will require new approaches to experimentation and learning by doing. Baselining and data collection, analytical capabilities to interpret and capture lessons as well as feedback loops will be critical to ensuring success. Hence the role of the Tech Startup Ecosystem in West Bank and Gaza report in providing an analytical base to guide the implementation of the EE-MG and other startup ecosystem interventions.
Financial support for this report was provided by the Department for International Development (DFID). The findings, interpretations, and conclusions expressed here are those of the authors and do not necessarily reflect the views of DFID or the Board of Executive Directors of the World Bank or the governments they represent.
2 TECH START-UP ECOSYSTEM IN WEST BANK AND GAZA
Executive Summary
Technology is one of the main drivers of productivity and economic growth (Anders, Ng, and Robyn 2005). Developing countries have traditionally had difficulties in both developing technology and absorbing foreign technology. Seventy to eighty percent of the productivity gap between developed and developing countries is estimated to result from the lag in the adoption technologies by these countries (Comin and Mestieri 2014; Comin and Hobijn 2010).
Tech startups are an effective mechanism to both create local technology and absorb foreign technology. In recent years, there has been a surge of tech startups across the world. Fueled by global technology-led cost reductions and increased access to resources, tech entrepreneurs are increasingly emerging in both developed and developing countries. These tech-enabled startups represent an attractive investment for early stage investors, as they can be used to test, launch, and validate a business much faster and cheaper than in traditional ventures. However, to attract financing to ensure the growth of these businesses, there needs to be a better understanding of how these tech entrepreneurs form ecosystems, what are the internal dynamics of these ecosystems, how they work, what makes them grow and achieve sustainability, how they connect with the local economy to result in productivity and employment, and why some ecosystems are more effective than others at this.
This report is part of a broader research initiative (See Box 1.1) that aims to provide answers to these
questions. It provides new data and analysis of the tech startup ecosystem in the West Bank and Gaza. The analysis comprises: (i) an attempt to provide an accurate description and measurement of the economy’s tech startup ecosystem; and (ii) a comparison and gap analysis of four key components of the tech startup ecosystem (skills, finance, entrepreneurial supporting infrastructure, and community).
The objective of this report is to provide a better understanding of the status of the West Bank and Gaza startup ecosystem and provide policy recommendations for policy makers and other stakeholders who are interested in supporting the growth and sustainability of the ecosystem.
Analysis LimitationsMeasuring the tech startup ecosystem is difficult. Relevant databases of startups are not readily available, and the fast-paced and multidimensional dynamics of startup ecosystems – with new ventures constantly being created, failing, being closed, being bought, or transformed (changing names and/or purpose) – makes accurate measurement over time inherently difficult.
For this analysis, 423 entrepreneurs were surveyed in the West Bank and Gaza between December 2016 and February 2017 and relevant data was collected for 142 startups and 196 startup founders.1 The survey was based on the standard questionnaire from the Global Entrepreneurship Research Network (GERN) Ecosystem Connection project (see Box 1.1). The findings and conclusions of this analysis are based on this survey and so there are some limitations to this analysis. The

3executive summAry
dataset is not exhaustive and only represents a subset of the ecosystem’s startups. Moreover, it is subject to survivorship bias and does not include startups that were no longer in business when data was collected. Historical data about startups was collected through existing founders who were available at the time of the survey.
Despite these limitations, the subset of startups provides unique insights of the ecosystem. The data was collected by snowballing from public data contained in existing databases, networks from key stakeholders (for example, accelerators, events, and so on), as well as recommendations from founders. Although there are startups that were not captured in this survey, nevertheless it provides one of the richest samples of data collected to date on the most influential founders, startups, intermediaries, and other ecosystem stakeholders in the West Bank and Gaza.
FindingsThe tech startup ecosystem in the West Bank and Gaza is an early stage ecosystem that is maturing (see table below). The key strengths of the ecosystem are the presence of talented people, with highly educated founders (85 percent of them having a university degree and 27 percent with graduate degrees) and the connection with international networks of knowledge (primarily through international universities and accelerator programs). However, founders tend to be young and with little experience, with the bulk of founders having no previous managerial experience, resulting in limited business acumen of founders.
The supporting infrastructure (for example, accelerators, mentors) and the community is still maturing. Accelerator programs neither generate quantity nor quality of startups with many of them being supported by external funding programs, suggesting a need to improve the quality of these programs. Furthermore, while substantial amounts of grant financing are available, the accelerators have yet to establish an effective channel through which startups can absorb funding and deliver actual results. Mentors are available but they have no impact in startup success, suggesting limited quality. Since the entrepreneurial community is still in its early stages, like-minded individuals do not connect easily with one another to form clusters, suggesting a silo approach among ventures from different networks. This is exacerbated by the separation of clusters between Gaza and the West Bank. Therefore, capacity building efforts and the professionalization of accelerators represent priorities in strengthening the ecosystem.
Investment seems sufficient for the scale of the ecosystem, with a large pool of angel investors. On institutional investment, VC funds report not being able to meet their targets because of limitations of a quality pipeline. On the other hand, the international connectivity of the ecosystem allows those investment-ready startups in the West Bank and Gaza to also look for funding in the region and abroad.
The West Bank and Gaza ecosystem has one of the largest participation of female entrepreneurs of the ecosystems analyzed. However, these female entrepreneurs are young and inexperienced, suggesting that they would benefit from additional support to succeed.

4 TECH START-UP ECOSYSTEM IN WEST BANK AND GAZA
DEVELOPMENT STAGE OF THE WEST BANK AND GAZA STARTUP ECOSYSTEM
Ecosystem AreaStage
Nascent Advancing Mature
1. Community
2. Skills
3. Supporting Infrastructure
4. Investment
5. Constraints
OVERALL
Policy Recommendations
Based on this analysis, a set of high-level policy recommendations for policymakers are provided (see table below), which are further expanded in the report.
Ecosystem Area
High-Level Policy Recommendation Objective
Community
Strengthen coordination among multiple stakeholders to support the ecosystem’s growth.
Expand clusters’ connectivity, coordinate private and public action, and promote connections among all stakeholders.
Build the capacity of intermediaries and networking assets to increase community and clusters, particularly between Gaza and West Bank. Linkages could also be made with Jordan, proximate Arab communities, and the MENA region more broadly.
Expand clusters of intermediaries and establish stronger links with regional and international networks of talent.
Skills
Expand practical education in universities and through rapid skills training programs and accelerators connected with public education programs.
Address gaps in practical business acumen and technical training, train pipeline of talent for startup scale up, and encourage participation of lower income/educated population.
Support Infrastructure
Increase capacity building of mentors and foster the creation of angel networks. Aim towards professionalization of accelerators and facilitate entry of international talent (e.g. mentors, entrepreneurs or capacity builders) into the ecosystem.
Address shortage of quality mentors and strengthen support services.
Connect ecosystem with domestic traditional sectors and create tech verticals.
Expand support infrastructure to support tech verticals and connect startups with market needs.
Investment
Catalyze early stage financing and increase quality of pipeline investment.
Enable startups to scale up and increase capacity of investors to strengthen pipelines and get startups investment-ready.
Constraints
Address processes constraints (e.g. access to loans and funding).
Reduce constraints for startups’ incorporation and operations.
5meAsuring And AnAlyzing the tech stArtup ecosystem in the west BAnk And gAzA
Measuring and Analyzing the Tech Startup Ecosystem in the West Bank and GazaThis report provides an analysis of the tech startup ecosystem in the West Bank and Gaza. The analysis comprises: (i) an attempt to provide an accurate description and measurement of the economy’s tech startup ecosystem and (ii) a comparison and gap analysis of four key components of the tech startup ecosystem (skills, finance, entrepreneurial supporting infrastructure, and community).
For the purposes of this report, tech startups are defined as for-profit business ventures that a) have a financial model targeting high growth and b) employ an innovative and technology-enabled approach to the product or service that they provide to ensure scalability. These ventures may or may not be profitable at the current stage.
In order to capture the whole tech startup ecosystem, for this report the definition of startups was expanded beyond the phase in which these ventures are being newly emerged, encompassing also small and medium enterprises (SMEs) that were once startups and have reached the scaling phase. This definition allowed us to collect data to describe the evolution of the tech startup ecosystem over time as these startups grow and succeed.
Measuring the Tech Startup Ecosystem
Measuring the tech startup ecosystem is a difficult task. Relevant databases of startups are not readily available, and the fast-paced and multi-dimensional dynamics of startup ecosystems – with new ventures constantly being created, failing and being closed, and being bought or transformed (changing names and/or purpose) – makes accurate measurement over time inherently difficult.
Some databases include limited information on startups. These databases are global, local (mostly at the level of metropolitan areas’ ecosystems) and, in some cases, domestic (countrywide).
These databases are both open and proprietary. Access to proprietary databases, such as PitchBook, is limited and in some cases restricted (not being open to wider research). The most relevant open databases of startups are CrunchBase and AngelList. Neither of these databases, however, necessarily provides accurate or complete information. CrunchBase is a self-reported database which is not curated by an official entity, and as such it may include inaccurate information, such as closed or transformed ventures still being posted with the original data, founders omitted, and so on. AngelList generally contains more accurate information since startups listed there have received or are actively soliciting investment from angel investors or venture capital (VC) firms. Other global startups repositories, such as Startup Genome,2 build on these databases and additional self-reporting data from startups, and are therefore subject to similar limitations. Finally, while LinkedIn can provide more accurate data of startups through funders and employers, data access and use restrictions make its use for independent research purposes difficult.
Moreover, since these global databases include little information on startups in developing countries, they are of limited use in helping to build an overall picture of their tech startup ecosystems. For example, at the time of conducting this analysis, CrunchBase only held data on six startups, and AngelList only included data on 30 startups, in the West Bank and Gaza.
Regional and local startup databases can be richer in data and more accurate, since they are often the result of an active effort to track the activity and life cycle of startups. Examples of these databases are Digital NYC3 in New York or Tech Map4 in London. However, these databases are not present in many ecosystems, particularly in developing countries and, given their localized methodologies, their data is difficult to utilize for comparative analytics. Other datasets, such as that of the Global Accelerator Learning Initiative,5 only have enough power to report data at a regional level.
6 TECH START-UP ECOSYSTEM IN WEST BANK AND GAZA
While official government or NGO-managed databases in developing countries can provide richer and more accurate data from SMEs and larger companies, they also lack both data breadth and depth when it comes to startups. The Palestinian Central Bureau of Statistics (PCBS), for example, does not compile data related to startup creation, and its statistics related to ICT usage in business were last updated in 2009.6
To combat this poor data availability, a survey was designed and deployed by extending the standard questionnaire from the Global Entrepreneurship Research Network (GERN) Ecosystem Connection project (see Box 1.1). For a broader description and technical details of this survey, see the “Survey Questions” section in the Methodology portion of the Appendix. We surveyed 423 entrepreneurs in the West Bank and Gaza from November 2016 to February 2017 using an online interactive survey distributed through local partners by email, phone, and in person.7 From these interviews, data was collected for 241 relevant startups and 358 startup founders. This sample provides unique insights into the characteristics of founders, startups, investors, and supporting infrastructure in the West Bank and Gaza, as well as the relationships between them.8
BOX 1.1: GERN ECOSYSTEMS CONNECTIONS MAPPING PROJECT
The dataset is not exhaustive and only represents a subset of the ecosystem’s startups. Moreover, it is subject to survivorship bias and does not contain startups that have not survived to the date of data collection, and historical data about startups was collected through existing founders available to be sur-veyed at the time of surveying.9 However, this still represents a relevant subset since the startup data was collected by snow-balling from public data contained in existing databases, net-works from key stakeholders (for example, accelerators, events, and so on), and recommendations from founders. Given the lack of other datasets in the region and even though the survey was not able capture all relevant startups, the data provides one of the richest samples collected to date of the most influ-ential founders, startups, intermediaries, and other ecosystem stakeholders in the West Bank and Gaza.
Survey research was combined with information from interviews and focus groups with key stakeholders of the ecosystems, including three operational investment funds and four incubators/accelerators. This analysis was also corroborated with the most recent available data taken from the Global Entrepreneurship Monitor (GEM) in the West Bank and Gaza, which examined environmental framework conditions as assessed by national experts including academics, policy makers, and entrepreneurs. Although the latest GEM was conducted in 2012, its information sheds light on some of the trends highlighted in this new analysis (Palestine Economic Policy Research Institute 2013).
This report assumes that, because of the fast-moving nature of startup ecosystems, any attempt to accurately measure the tech startup ecosystem is inherently flawed – any measurement will be obsolete immediately after collection. The findings and recommendations provided in this report should be taken with this limitation in mind. Less emphasis should be placed on exact numbers, which are subject to change with the addition of more startups and which are sensitive to minor tweaks in methodology. Rather, the data collected enables analysis of general trends and the dynamics of the ecosystem that can inform specific policies. This analysis should not considered in isolation, and policy makers are encouraged to confirm these findings with other available resources (for example, perspectives from practitioners and anecdotal evidence). For more details on the limitations of the study’s approach, see the “Limitations” section in the Analysis portion of the Appendix.
Analyzing the Tech Startup EcosystemThe following analysis of the tech startup ecosystem in the West Bank and Gaza was based on the data collected through the survey methodology described in detail in the Appendix. When reading this analysis, the caveats summarized above should be taken into account.
This report analyzes four key elements of the tech startup ecosystem in the West Bank and Gaza: i) skills, ii) finance, iii) supporting infrastructure for entrepreneurship, and iv) community. The analysis first describes the status of each
The goal of the Ecosystem Connections Mapping Project31 is to map startup ecosystems across the world by collecting data on startup founders (for example, education, work experience, serial entrepreneurship, and so on) and their connections among themselves and other key stakeholders in their ecosystem (for example, mentors, investors, accelerators, universities, and so on) to better understand and support entrepreneurs in local startup ecosystems. This data aims to identify gaps in ecosystems and provide a basis for policy action to address these gaps and support growth and sustainability of startup ecosystems.
The project has mapped over nine startup ecosystems in cities across the world, including Bogota, Cairo, London, New York, and Singapore among others). The survey conducted for this report is also part of this project, adding the West Bank and Gaza to the ecosystems mapped. Data from these nine ecosystems was used as a comparator for the analysis of this report (see Methodology section in Appendix).
7meAsuring And AnAlyzing the tech stArtup ecosystem in the west BAnk And gAzA
of these elements based on the data collected, and then compares the results with those reported by both average and successful startup founders. When applicable, the report highlights findings with regard to female entrepreneurship.
For the purposes of this analysis, successful startups are considered to be those that have been funded and those that employ people. “Short-term success” is defined as obtaining funding once; “long-term success” is defined as hiring employees continually (as a proxy for growth).
Comparing average founders and startups with successful ones highlights which characteristics (in terms of education, experience, connections, and so on) are more predominant in successful startups in the West Bank and Gaza and whether they are consistent with those in other ecosystems or with global trends (when research is available). If comparable data was available from other ecosystems surveyed under the GERN Ecosystems Connections Project, local results were benchmarked against the other ecosystems to understand if there are gaps that could be addressed.
The four elements that this report analyzes represent the key ingredients needed for tech startup ecosystems to grow and be sustainable. Skills aims at understanding the educational and work experience that founders have and those that are more common for successful founders. Finance considers the
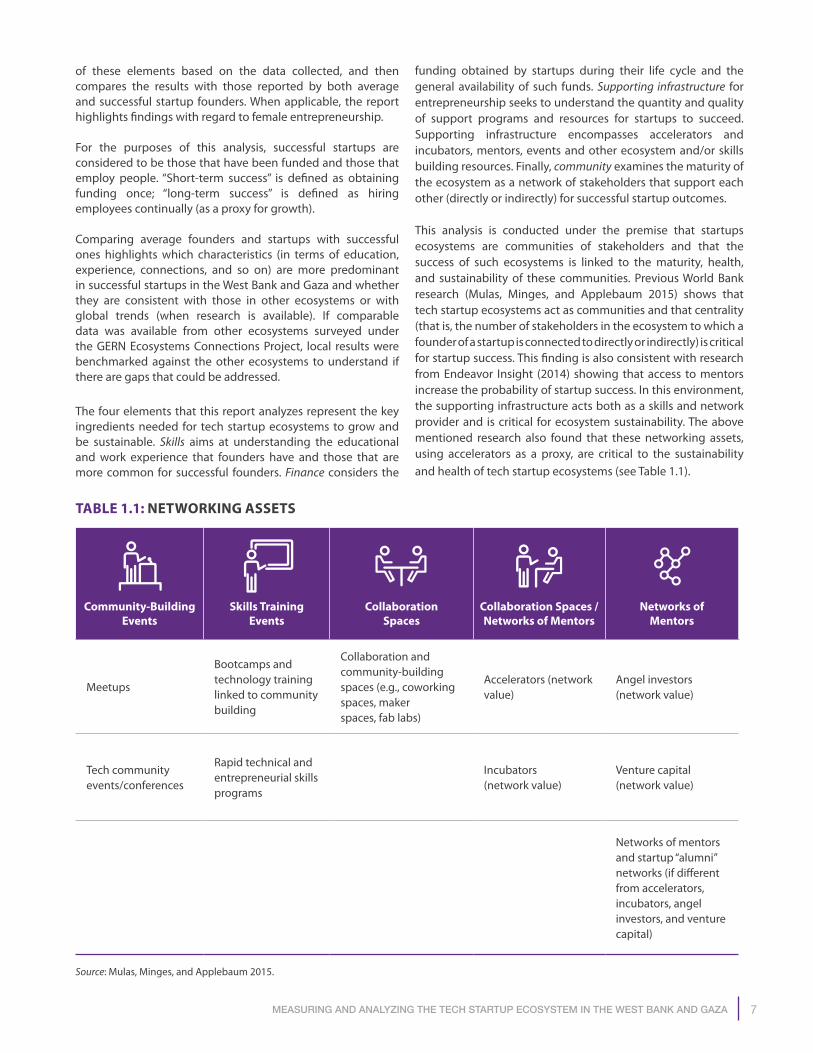
funding obtained by startups during their life cycle and the general availability of such funds. Supporting infrastructure for entrepreneurship seeks to understand the quantity and quality of support programs and resources for startups to succeed. Supporting infrastructure encompasses accelerators and incubators, mentors, events and other ecosystem and/or skills building resources. Finally, community examines the maturity of the ecosystem as a network of stakeholders that support each other (directly or indirectly) for successful startup outcomes.
This analysis is conducted under the premise that startups ecosystems are communities of stakeholders and that the success of such ecosystems is linked to the maturity, health, and sustainability of these communities. Previous World Bank research (Mulas, Minges, and Applebaum 2015) shows that tech startup ecosystems act as communities and that centrality (that is, the number of stakeholders in the ecosystem to which a founder of a startup is connected to directly or indirectly) is critical for startup success. This finding is also consistent with research from Endeavor Insight (2014) showing that access to mentors increase the probability of startup success. In this environment, the supporting infrastructure acts both as a skills and network provider and is critical for ecosystem sustainability. The above mentioned research also found that these networking assets, using accelerators as a proxy, are critical to the sustainability and health of tech startup ecosystems (see Table 1.1).
TABLE 1.1: NETWORKING ASSETS
Community-Building Events
Skills Training Events
Collaboration Spaces
Collaboration Spaces / Networks of Mentors
Networks of Mentors
Meetups
Bootcamps and technology training linked to community building
Collaboration and community-building spaces (e.g., coworking spaces, maker spaces, fab labs)
Accelerators (network value)
Angel investors (network value)
Tech community events/conferences
Rapid technical and entrepreneurial skills programs
Incubators (network value)
Venture capital (network value)
Networks of mentors and startup “alumni” networks (if different from accelerators, incubators, angel investors, and venture capital)
Source: Mulas, Minges, and Applebaum 2015.
8 TECH START-UP ECOSYSTEM IN WEST BANK AND GAZA
TABLE 1.2: CATEGORIES OF ECOSYSTEMS
Ecosystem AreaStage
Nascent Advancing Mature
Community
Limited number of startups, most in early stage
Low density of connections
Low number of clusters
Increased number of startups, most in early stage with increasing number of scale-ups
Several clusters
High density in clusters
Large number of startups in all stages
Highly dense, hyper connected clusters
Skills
Lack of business acumen and experience
Few serial entrepreneurs and limited generations of entrepreneurs
No substantial exits
Limited business acumen
Increasing number of serial entrepreneurs and more than three generations
Exits start to appear
Business acumen and practical experience
Several generations of startups
Successful exits
Supporting Infrastructure
Mentors are scarce and inexperienced
No international connections
Mentors are available and they have local practical experience
Increasing number of international connections
Plenty of mentors with sound practical experience
International hub attracting international talent
Investment
Gaps in finance pipeline
Few private sector funding opportunities
Finance pipeline with some gaps
Private early stage investment exists
No gaps in finance pipeline
Private early stage finance sustainable
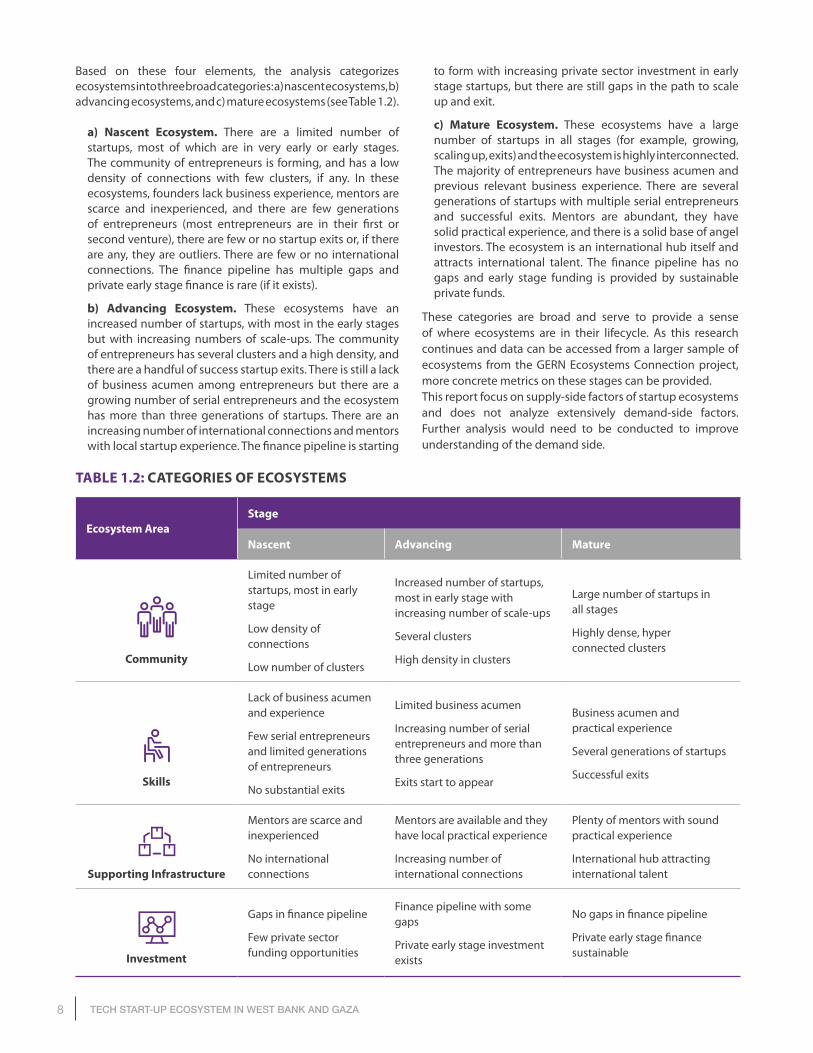
Based on these four elements, the analysis categorizes ecosystems into three broad categories: a) nascent ecosystems, b) advancing ecosystems, and c) mature ecosystems (see Table 1.2).
a) Nascent Ecosystem. There are a limited number of startups, most of which are in very early or early stages. The community of entrepreneurs is forming, and has a low density of connections with few clusters, if any. In these ecosystems, founders lack business experience, mentors are scarce and inexperienced, and there are few generations of entrepreneurs (most entrepreneurs are in their first or second venture), there are few or no startup exits or, if there are any, they are outliers. There are few or no international connections. The finance pipeline has multiple gaps and private early stage finance is rare (if it exists).
b) Advancing Ecosystem. These ecosystems have an increased number of startups, with most in the early stages but with increasing numbers of scale-ups. The community of entrepreneurs has several clusters and a high density, and there are a handful of success startup exits. There is still a lack of business acumen among entrepreneurs but there are a growing number of serial entrepreneurs and the ecosystem has more than three generations of startups. There are an increasing number of international connections and mentors with local startup experience. The finance pipeline is starting
to form with increasing private sector investment in early stage startups, but there are still gaps in the path to scale up and exit.
c) Mature Ecosystem. These ecosystems have a large number of startups in all stages (for example, growing, scaling up, exits) and the ecosystem is highly interconnected. The majority of entrepreneurs have business acumen and previous relevant business experience. There are several generations of startups with multiple serial entrepreneurs and successful exits. Mentors are abundant, they have solid practical experience, and there is a solid base of angel investors. The ecosystem is an international hub itself and attracts international talent. The finance pipeline has no gaps and early stage funding is provided by sustainable private funds.
These categories are broad and serve to provide a sense of where ecosystems are in their lifecycle. As this research continues and data can be accessed from a larger sample of ecosystems from the GERN Ecosystems Connection project, more concrete metrics on these stages can be provided.This report focus on supply-side factors of startup ecosystems and does not analyze extensively demand-side factors. Further analysis would need to be conducted to improve understanding of the demand side.
9the tech stArtup ecosystem in the west BAnk And gAzA
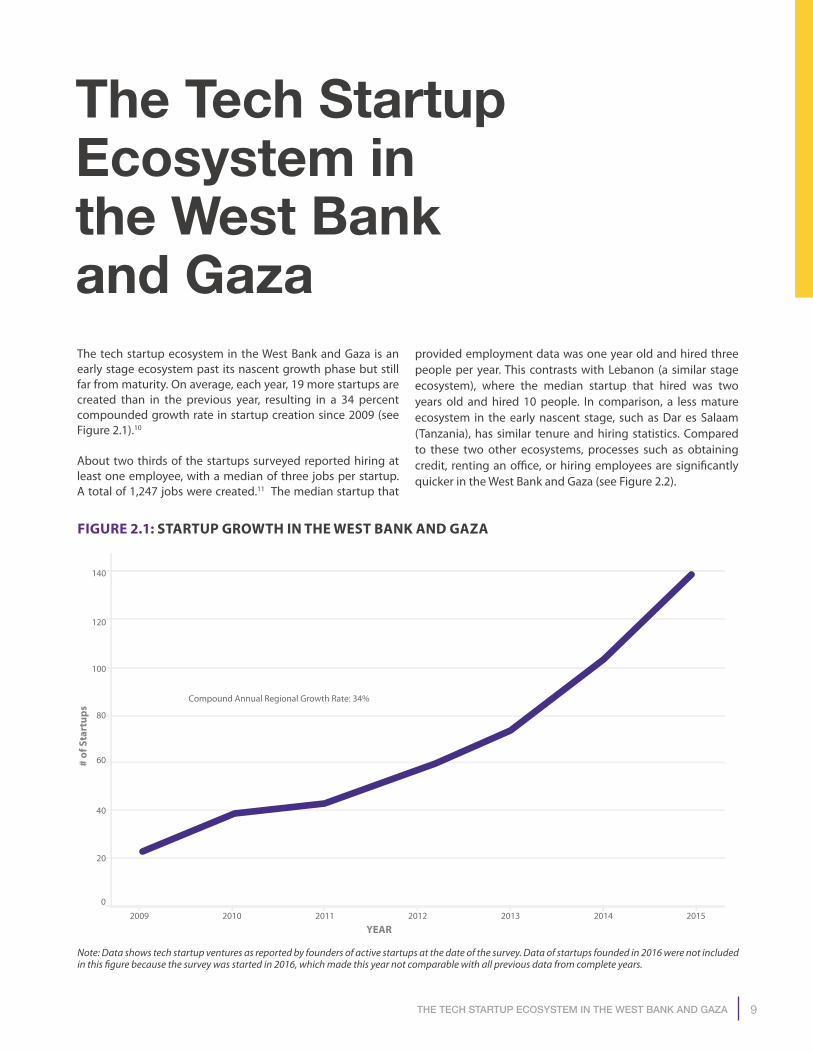
The Tech Startup Ecosystem in the West Bank and GazaThe tech startup ecosystem in the West Bank and Gaza is an early stage ecosystem past its nascent growth phase but still far from maturity. On average, each year, 19 more startups are created than in the previous year, resulting in a 34 percent compounded growth rate in startup creation since 2009 (see Figure 2.1).10
About two thirds of the startups surveyed reported hiring at least one employee, with a median of three jobs per startup. A total of 1,247 jobs were created.11 The median startup that
provided employment data was one year old and hired three people per year. This contrasts with Lebanon (a similar stage ecosystem), where the median startup that hired was two years old and hired 10 people. In comparison, a less mature ecosystem in the early nascent stage, such as Dar es Salaam (Tanzania), has similar tenure and hiring statistics. Compared to these two other ecosystems, processes such as obtaining credit, renting an office, or hiring employees are significantly quicker in the West Bank and Gaza (see Figure 2.2).
Note: Data shows tech startup ventures as reported by founders of active startups at the date of the survey. Data of startups founded in 2016 were not included in this figure because the survey was started in 2016, which made this year not comparable with all previous data from complete years.
FIGURE 2.1: STARTUP GROWTH IN THE WEST BANK AND GAZA
# of
Sta
rtup
s
2009 2010 2011 2012 2013 2014 2015
YEAR
0
20
40
60
80
100
120
140
Compound Annual Regional Growth Rate: 34%

10 TECH START-UP ECOSYSTEM IN WEST BANK AND GAZA
0 10 20 30 40 50 60 70 80 90 100 110 120 130MEDIAN DAYS
Set up BankAccount
Dar es Salaam
West Bank & Gaza
Beirut
BecomeIncorporated
Dar es Salaam
West Bank & Gaza
Beirut
Rent ano�ce
Dar es Salaam
West Bank & Gaza
Beirut
Hire anEmployee
Dar es Salaam
West Bank & Gaza
Beirut
ObtainCredit
Dar es Salaam
West Bank & Gaza
Beirut
ObtainFunding
Dar es Salaam
West Bank & Gaza
Beirut
4
3
5
22
30
28
30
15
30
30
15
30
90
15
30
125
120
33
COUNTRY
Dar es Salaam West Bank & Gaza BeirutCOUNTRY
FIGURE 2.2: TIME TO COMPLETE PROCEDURAL TASKS IN LIFE CYCLE OF A STARTUP ACROSS REGIONS
FIGURE 2.3: PERCENTAGE OF FEMALE FOUNDERS ACROSS ANALYZED ECOSYSTEMS
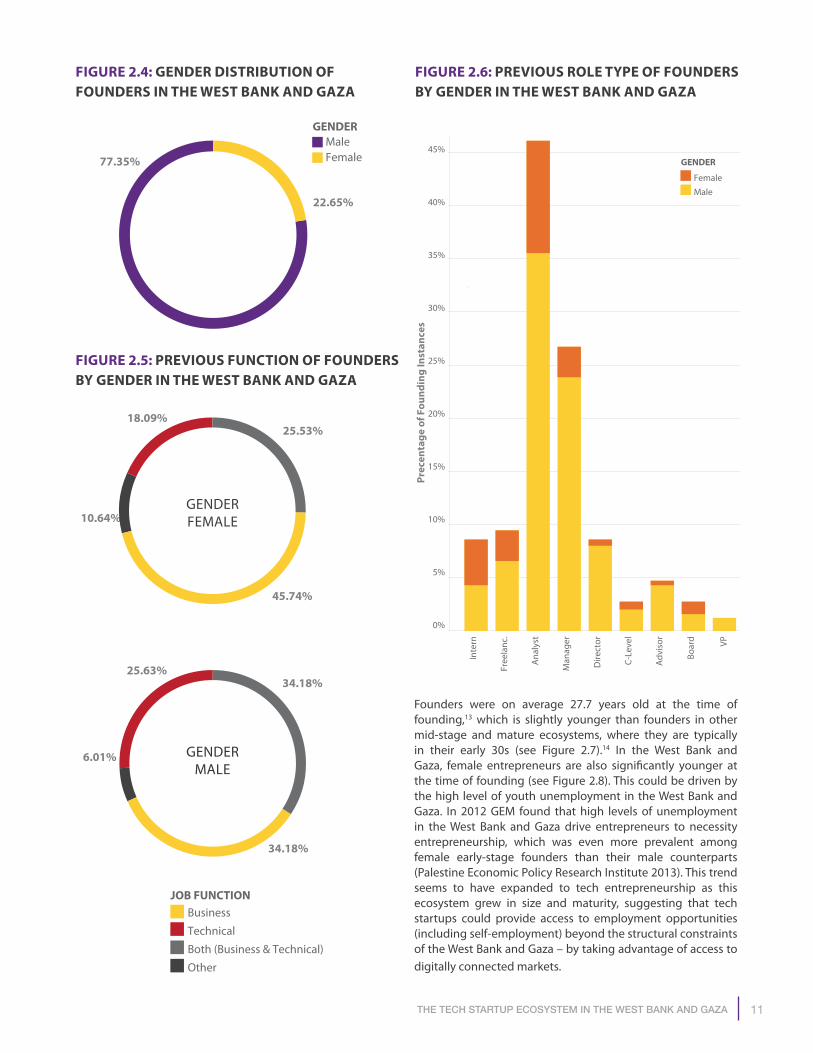
Startups have an average of 1.8 founders, and each founder has launched 1.2 startups. While founders are predominantly male (see Figure 2.4), with over 20% of female entrepreneurs, the West Bank and Gaza has one of the largest participations of female founders of all ecosystems surveyed (see Figure 2.3).12
Female founders have more prior experience in business, but they are less likely to have had managerial experience (see Figure 2.5 and Figure 2.6). This might be in part explained by the fact that skilled women, that is, those with postsecondary
education, including a two-year associate degree, are not strongly represented in the formal private sector compared to skilled men. In 2013, only 2.9 percent of women were full-time workers in medium-sized enterprises and six percent in small enterprises. In addition, owing to obstacles to entrepreneurship and significant social restrictions, only 1.7 percent of skilled women, as opposed to 5.7 percent of skilled men, indicated that they were employers, potentially reducing their opportunity for managerial experience (World Bank 2017a).
Note: Measurements refer to Dar es Salaam (Tanzania), Beirut (Lebanon) and West Bank & Gaza start-up ecosystems
Note: Differences in data survey may be driven by multiple factors, including time of data collection and maturity of the ecosystem
0%
5%
10%
15%
20%
25%
WEST BANK &GAZA
23%
BEIRUT
19%
DAR ESSALAAM
15%
MEDELLIN
14%
BOGOTA
13%
NEW YORK
12%
CAIRO
10%
SINGAPORE
10%
11the tech stArtup ecosystem in the west BAnk And gAzA
Technical
Other
Business
Both (Business & Technical)
JOB FUNCTION
FemaleMale
GENDER
22.65%
77.35%
25.53%
45.74%
10.64%
18.09%
34.18%
34.18%
6.01%
25.63%
FIGURE 2.2: TIME TO COMPLETE PROCEDURAL TASKS IN LIFE CYCLE OF A STARTUP ACROSS REGIONS
FIGURE 2.4: GENDER DISTRIBUTION OF FOUNDERS IN THE WEST BANK AND GAZA
FIGURE 2.5: PREVIOUS FUNCTION OF FOUNDERS BY GENDER IN THE WEST BANK AND GAZA
FIGURE 2.6: PREVIOUS ROLE TYPE OF FOUNDERS BY GENDER IN THE WEST BANK AND GAZA
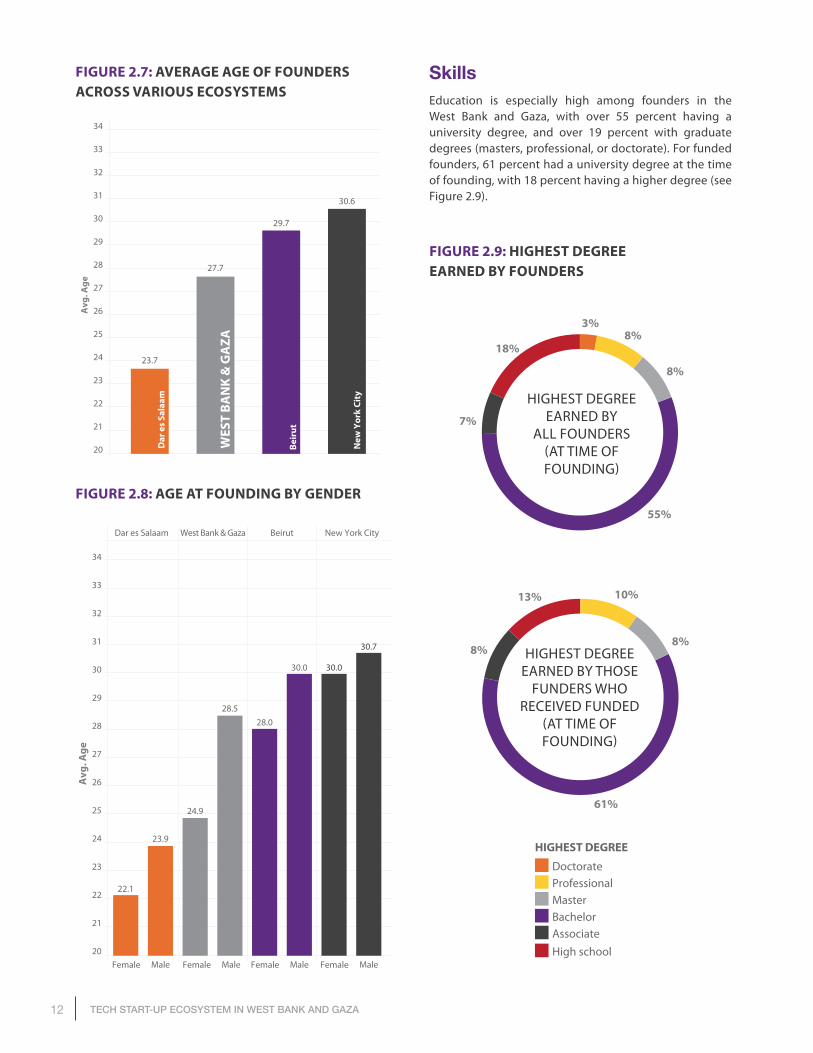
Founders were on average 27.7 years old at the time of founding,13 which is slightly younger than founders in other mid-stage and mature ecosystems, where they are typically in their early 30s (see Figure 2.7).14 In the West Bank and Gaza, female entrepreneurs are also significantly younger at the time of founding (see Figure 2.8). This could be driven by the high level of youth unemployment in the West Bank and Gaza. In 2012 GEM found that high levels of unemployment in the West Bank and Gaza drive entrepreneurs to necessity entrepreneurship, which was even more prevalent among female early-stage founders than their male counterparts (Palestine Economic Policy Research Institute 2013). This trend seems to have expanded to tech entrepreneurship as this ecosystem grew in size and maturity, suggesting that tech startups could provide access to employment opportunities (including self-employment) beyond the structural constraints of the West Bank and Gaza – by taking advantage of access to digitally connected markets.
Male
Female
GENDER
0%
Inte
rn
Free
lanc
.
Ana
lyst
Man
ager
Dire
ctor
C-Le
vel
Adv
isor
Boar
d VP
5%
10%
15%
20%
25%
30%
45%
40%
35%
Prec
enta
ge o
f Fou
ndin
g In
stan
ces
GENDERFEMALE
GENDERMALE
12 TECH START-UP ECOSYSTEM IN WEST BANK AND GAZA
AssociateHigh school
BachelorMasterProfessionalDoctorate
HIGHEST DEGREE
3%8%
8%
55%
7%
18%
10%
8%
61%
8%
13%
HIGHEST DEGREE EARNED BY
ALL FOUNDERS (AT TIME OF FOUNDING)
HIGHEST DEGREE EARNED BY THOSE
FUNDERS WHO RECEIVED FUNDED
(AT TIME OF FOUNDING)
20
21
22
23
24
25
26
27
28
29
30
31
32
33
34
Avg
. Age
West Bank & Gaza New York CityBeirutDar es Salaam
Dar
es
Sala
am
23.7
WES
T BA
NK
& G
AZA
27.7
Beir
ut
29.7
New
Yor
k Ci
ty
30.6
20
21
22
23
24
25
26
27
28
29
30
31
32
33
34
Avg
. Age
22.1
23.9
24.9
28.528.0
30.0 30.0
30.7
Female Male Female Male Female Male Female Male
FIGURE 2.7: AVERAGE AGE OF FOUNDERS ACROSS VARIOUS ECOSYSTEMS
FIGURE 2.8: AGE AT FOUNDING BY GENDER
SkillsEducation is especially high among founders in the West Bank and Gaza, with over 55 percent having a university degree, and over 19 percent with graduate degrees (masters, professional, or doctorate). For funded founders, 61 percent had a university degree at the time of founding, with 18 percent having a higher degree (see Figure 2.9).
FIGURE 2.9: HIGHEST DEGREE EARNED BY FOUNDERS
13the tech stArtup ecosystem in the west BAnk And gAzA
Both (Stem & Business)
MAJOR
Business
Other
Stem
8%
25%
19%
11%
21%
16%
52%
48%
AssociateHigh school
BachelorMasterProfessionalDoctorate
2%
6%
4%10%
9%7%
14%
56%
8%
32%
52%
HIGHEST DEGREE
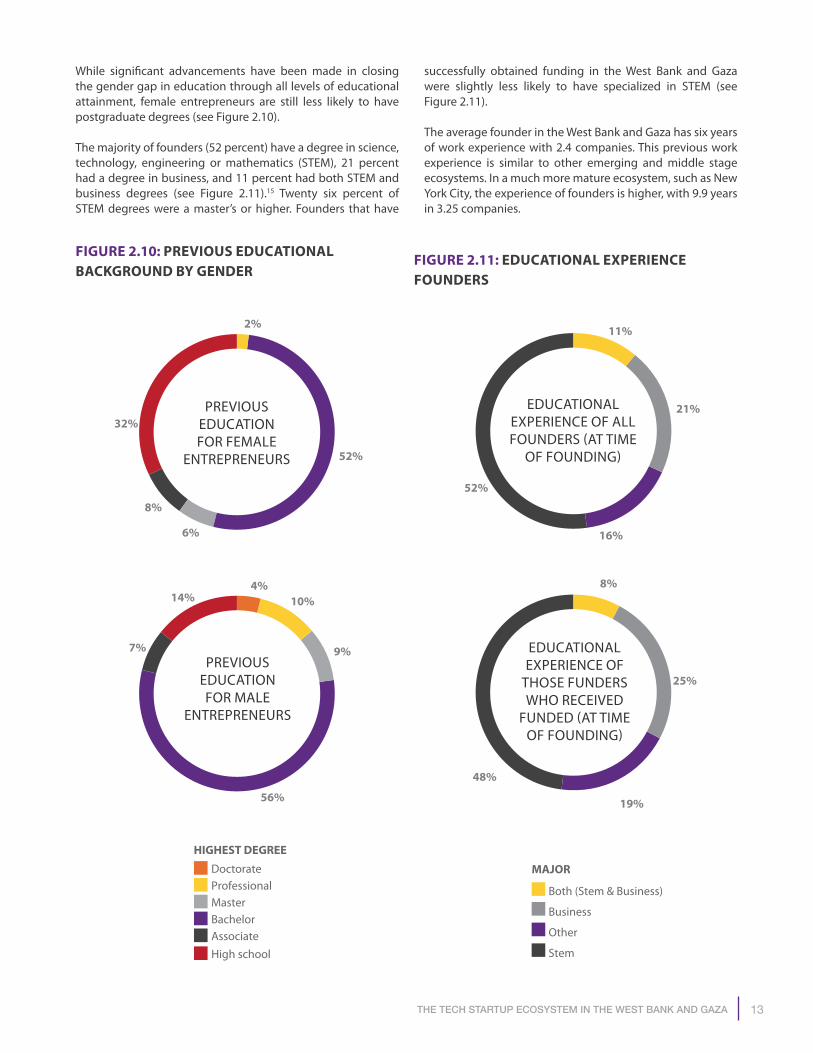
While significant advancements have been made in closing the gender gap in education through all levels of educational attainment, female entrepreneurs are still less likely to have postgraduate degrees (see Figure 2.10).
The majority of founders (52 percent) have a degree in science, technology, engineering or mathematics (STEM), 21 percent had a degree in business, and 11 percent had both STEM and business degrees (see Figure 2.11).15 Twenty six percent of STEM degrees were a master’s or higher. Founders that have
FIGURE 2.10: PREVIOUS EDUCATIONAL BACKGROUND BY GENDER
FIGURE 2.11: EDUCATIONAL EXPERIENCE FOUNDERS
PREVIOUS EDUCATION FOR FEMALE
ENTREPRENEURS
PREVIOUS EDUCATION FOR MALE
ENTREPRENEURS
successfully obtained funding in the West Bank and Gaza were slightly less likely to have specialized in STEM (see Figure 2.11).
The average founder in the West Bank and Gaza has six years of work experience with 2.4 companies. This previous work experience is similar to other emerging and middle stage ecosystems. In a much more mature ecosystem, such as New York City, the experience of founders is higher, with 9.9 years in 3.25 companies.
EDUCATIONAL EXPERIENCE OF ALL FOUNDERS (AT TIME
OF FOUNDING)
EDUCATIONAL EXPERIENCE OF
THOSE FUNDERS WHO RECEIVED
FUNDED (AT TIME OF FOUNDING)
14 TECH START-UP ECOSYSTEM IN WEST BANK AND GAZA
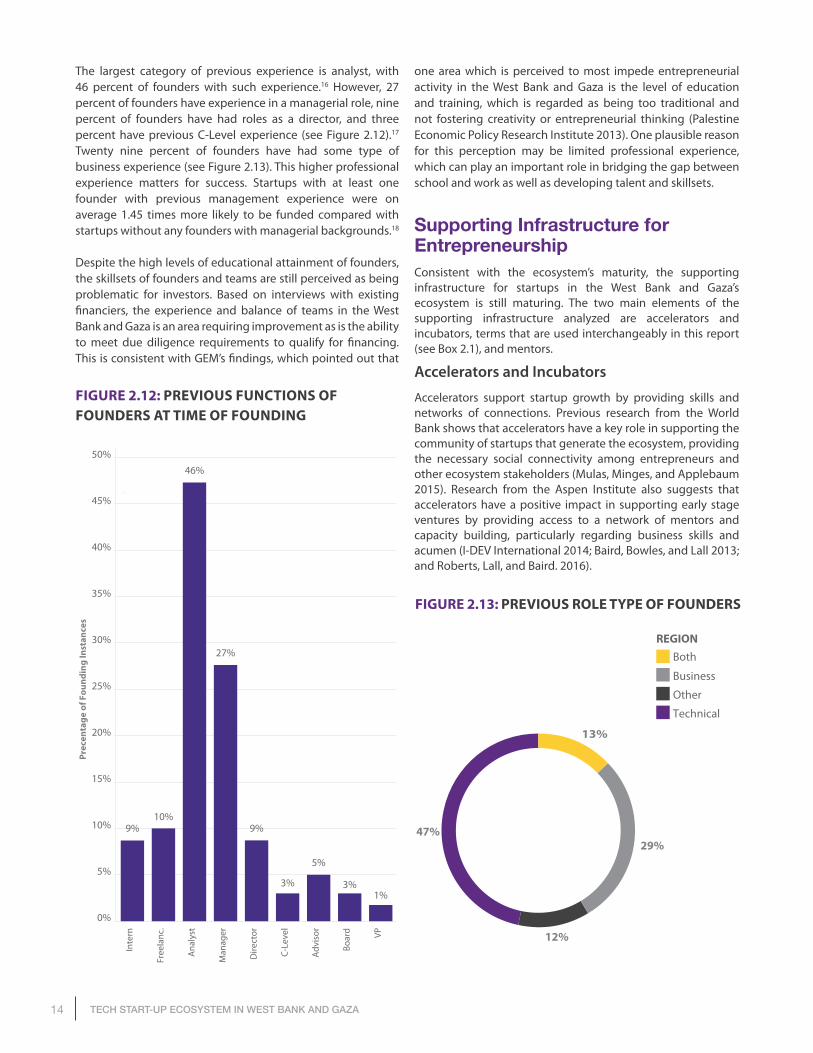
The largest category of previous experience is analyst, with 46 percent of founders with such experience.16 However, 27 percent of founders have experience in a managerial role, nine percent of founders have had roles as a director, and three percent have previous C-Level experience (see Figure 2.12).17 Twenty nine percent of founders have had some type of business experience (see Figure 2.13). This higher professional experience matters for success. Startups with at least one founder with previous management experience were on average 1.45 times more likely to be funded compared with startups without any founders with managerial backgrounds.18
Despite the high levels of educational attainment of founders, the skillsets of founders and teams are still perceived as being problematic for investors. Based on interviews with existing financiers, the experience and balance of teams in the West Bank and Gaza is an area requiring improvement as is the ability to meet due diligence requirements to qualify for financing. This is consistent with GEM’s findings, which pointed out that
one area which is perceived to most impede entrepreneurial activity in the West Bank and Gaza is the level of education and training, which is regarded as being too traditional and not fostering creativity or entrepreneurial thinking (Palestine Economic Policy Research Institute 2013). One plausible reason for this perception may be limited professional experience, which can play an important role in bridging the gap between school and work as well as developing talent and skillsets.
Supporting Infrastructure for Entrepreneurship Consistent with the ecosystem’s maturity, the supporting infrastructure for startups in the West Bank and Gaza’s ecosystem is still maturing. The two main elements of the supporting infrastructure analyzed are accelerators and incubators, terms that are used interchangeably in this report (see Box 2.1), and mentors.
Accelerators and Incubators
Accelerators support startup growth by providing skills and networks of connections. Previous research from the World Bank shows that accelerators have a key role in supporting the community of startups that generate the ecosystem, providing the necessary social connectivity among entrepreneurs and other ecosystem stakeholders (Mulas, Minges, and Applebaum 2015). Research from the Aspen Institute also suggests that accelerators have a positive impact in supporting early stage ventures by providing access to a network of mentors and capacity building, particularly regarding business skills and acumen (I-DEV International 2014; Baird, Bowles, and Lall 2013; and Roberts, Lall, and Baird. 2016).
FIGURE 2.12: PREVIOUS FUNCTIONS OF FOUNDERS AT TIME OF FOUNDING
FIGURE 2.13: PREVIOUS ROLE TYPE OF FOUNDERS
0%
Inte
rn
Free
lanc
.
Ana
lyst
Man
ager
Dire
ctor
C-Le
vel
Adv
isor
Boar
d VP
5%
10%
15%
20%
25%
30%
35%
40%
45%
50%
1%3%
5%
3%
9%
27%
46%
10%9%
Prec
enta
ge o
f Fou
ndin
g In
stan
ces
Technical
Both
Business
Other
13%
29%
12%
47%
8%
REGION
15the tech stArtup ecosystem in the west BAnk And gAzA
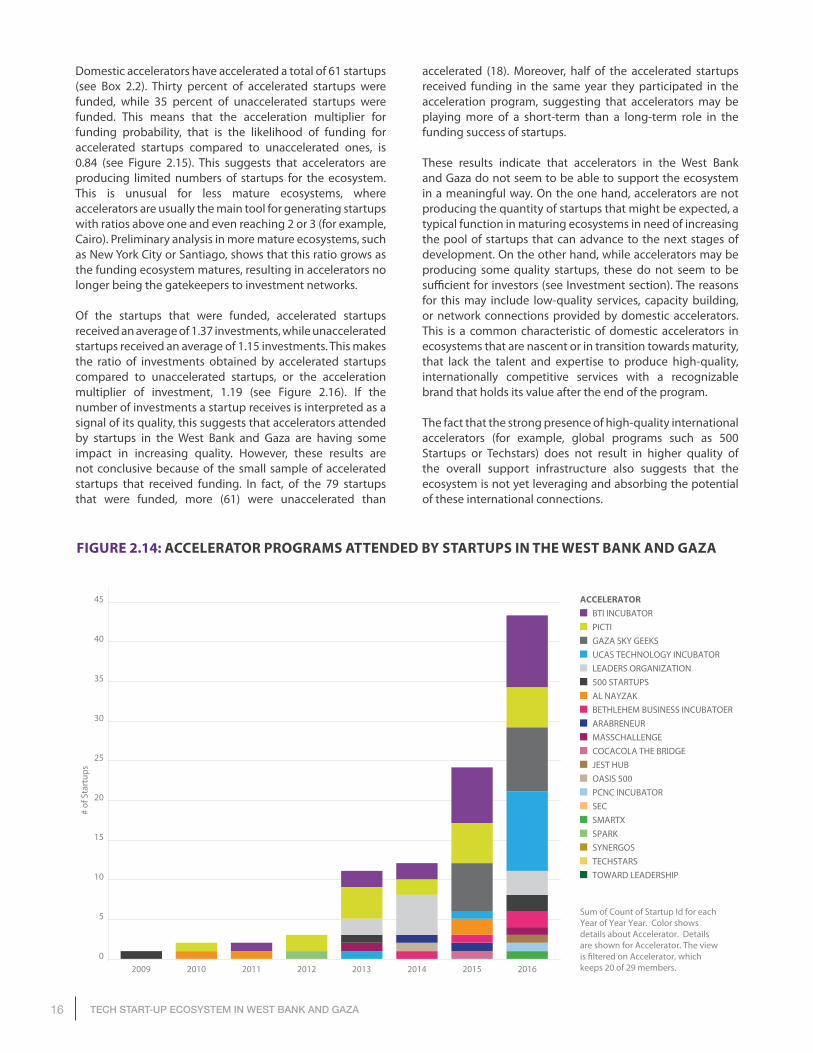
There are about 20 accelerator programs that accelerated domestic startups in the West Bank and Gaza. This is a large number of accelerator programs for the size and maturity of the ecosystem (see Box 2.2). There are two drivers for this. First, most of the domestic accelerators are supported by donor and public funding, which do not always follow market rules of demand and supply. Second, the ecosystem has a large involvement of international accelerators, including Startup 500, MassChallenge, Techstars, and Oasis 500 (see Figure 2.14). The involvement of these international accelerators denotes the connection of the West Bank and Gaza’s ecosystem to external resources in other ecosystems (see Community section).
BOX 2.1 ACCELERATORS AND INCUBATORS
Although the dataset and analysis does not differentiate between incubators and accelerators, there is a difference in their definition:
Accelerators support entrepreneurs and startups in early stages of development and they often comprise the following features: (i) a highly competitive and open application process for entrepreneurs, (ii) provision of small amounts of seed investment, (iii) focus on small teams rather than individual founders, (iv) intensive support for a limited period of time (usually 3-6 months), with active mentorship and networking, and (v) collaborative work among startups through cohort or classes of startups.
Incubators are spaces that support startups by providing office space and administrative support services. The most typical services are legal, recruitment, IT, accounting, public relations, and pooled buying programs. In addition, incubators may also provide coaching, mentorship, and help with access to funding on an ad hoc basis. Startups pay rent (which is usually below the market rate) for the office space and there is normally no time limit set for startups staying in the incubator (the average stay ranges widely from 18 months to five years). Some incubator providers may ask for a profit share in the future or require a minority stake in the startup as a prerequisite to access the incubator.
Source: Mulas, Minges, and Applebaum 2015.
BOX 2.2: SELECTED DOMESTIC ACCELERATORS AND INCUBATORS IN THE WEST BANK AND GAZA
Bader – ICT incubator providing seed capital that supports technology and ICT-related startups. Badar focuses on growth and expansion of companies through funding, business resources, and mentors.
Bethlehem Business Incubator (BBI) – offers training services and workshops, internships, mentorships and network opportunities to early-stage start-ups with a focus on women and youth who are interested in the non-ICT sector.
Business Startup Incubator Support (BSIS) Program – Part of the Leaders Network which was one of the first organizations focused on digital entrepreneurship in Ramallah. With funding from the European Union, BSIS focuses on startup incubators in Nablus, Ramallah, Bethlehem, Hebron, East Jerusalem, and Gaza and provides entrepreneurs with shared office space and resources, business advice, training, and coaching. Business Technology Incubator (BTI) – BTI aims to design, develop, implement and promote initiatives supporting young and marginalized Palestinian entrepreneurs with creative and unique ideas towards transforming their concepts into profitable Small and Medium Enterprises (SMEs).
Birzeit University Najjad Zeenni IT Center of Excellence – Runs a preincubation program and business plan competition event focused on IT startups. The center provides seed funding to qualified entrepreneurs as well as entrepreneur-investor matchmaking services. CEWAS – Launched the Middle East Start-up Program in Palestine in 2015. The program has incubated 10 innovative startups through training modules, individualized coaching, mentoring, and networking activities. CEWAS focuses on environmental issues including water, sanitation, and waste management and runs a yearly competition event. FastForward Accelerator – Part of the Leaders Network and one of the first startup accelerators in Palestine. FastForward was started in 2013 and provides seed funding (up to $20,000) along with office space and technology, access to mentors, training courses among other services over a period of four months. Gaza Sky Geeks – The first startup accelerator in Gaza providing coworking space, startup accelerator, and technology education for Gazan startups. Gaza Sky Geeks was launched in 2011 in partnership with Google and Mercy Corps. Ibdaa – Seed fund which provides university services, networking, mentoring, and capacity building. The fund holds competition events in which five to 10 startups are selected for seed funding from incubators. Ibdaa is mainly focused on the ICT sector and holds partnerships with Palestinian universities. Palestine’s Information and Communications Technology Incubator (PICTI) – Non-profit ICT incubator which was founded in 2004 as a technology-based physical incubator facility and grew to offer business services to Palestinian entrepreneurs. TYO – Based in Nablus and focuses on female empowerment and enterprises that are micro, small, or medium-sized, with the goal of scaling-up 15 women through incubation and/or investment.
16 TECH START-UP ECOSYSTEM IN WEST BANK AND GAZA
Domestic accelerators have accelerated a total of 61 startups (see Box 2.2). Thirty percent of accelerated startups were funded, while 35 percent of unaccelerated startups were funded. This means that the acceleration multiplier for funding probability, that is the likelihood of funding for accelerated startups compared to unaccelerated ones, is 0.84 (see Figure 2.15). This suggests that accelerators are producing limited numbers of startups for the ecosystem. This is unusual for less mature ecosystems, where accelerators are usually the main tool for generating startups with ratios above one and even reaching 2 or 3 (for example, Cairo). Preliminary analysis in more mature ecosystems, such as New York City or Santiago, shows that this ratio grows as the funding ecosystem matures, resulting in accelerators no longer being the gatekeepers to investment networks.
Of the startups that were funded, accelerated startups received an average of 1.37 investments, while unaccelerated startups received an average of 1.15 investments. This makes the ratio of investments obtained by accelerated startups compared to unaccelerated startups, or the acceleration multiplier of investment, 1.19 (see Figure 2.16). If the number of investments a startup receives is interpreted as a signal of its quality, this suggests that accelerators attended by startups in the West Bank and Gaza are having some impact in increasing quality. However, these results are not conclusive because of the small sample of accelerated startups that received funding. In fact, of the 79 startups that were funded, more (61) were unaccelerated than
FIGURE 2.14: ACCELERATOR PROGRAMS ATTENDED BY STARTUPS IN THE WEST BANK AND GAZA
accelerated (18). Moreover, half of the accelerated startups received funding in the same year they participated in the acceleration program, suggesting that accelerators may be playing more of a short-term than a long-term role in the funding success of startups.
These results indicate that accelerators in the West Bank and Gaza do not seem to be able to support the ecosystem in a meaningful way. On the one hand, accelerators are not producing the quantity of startups that might be expected, a typical function in maturing ecosystems in need of increasing the pool of startups that can advance to the next stages of development. On the other hand, while accelerators may be producing some quality startups, these do not seem to be sufficient for investors (see Investment section). The reasons for this may include low-quality services, capacity building, or network connections provided by domestic accelerators. This is a common characteristic of domestic accelerators in ecosystems that are nascent or in transition towards maturity, that lack the talent and expertise to produce high-quality, internationally competitive services with a recognizable brand that holds its value after the end of the program.
The fact that the strong presence of high-quality international accelerators (for example, global programs such as 500 Startups or Techstars) does not result in higher quality of the overall support infrastructure also suggests that the ecosystem is not yet leveraging and absorbing the potential of these international connections.
2009 2010 2011 2012 20130
5
10
15
20
25
30
35
40
45
# of
Sta
rtup
s
ACCELERATORBTI INCUBATORPICTIGAZA SKY GEEKSUCAS TECHNOLOGY INCUBATORLEADERS ORGANIZATION500 STARTUPSAL NAYZAKBETHLEHEM BUSINESS INCUBATOERARABRENEURMASSCHALLENGECOCACOLA THE BRIDGEJEST HUBOASIS 500PCNC INCUBATORSECSMARTXSPARKSYNERGOSTECHSTARSTOWARD LEADERSHIP
2014 2015 2016
Sum of Count of Startup Id for each Year of Year Year. Color shows details about Accelerator. Details are shown for Accelerator. The view is �ltered on Accelerator, which keeps 20 of 29 members.

17the tech stArtup ecosystem in the west BAnk And gAzA
0.00
0.50
1.00
1.50
2.00
3.50
3.00
3.50
3.06
2.162.02
1.211.07
0.93
0.49
Cair
o
New
Yor
k Ci
ty
Beir
ut
Sing
apor
e
Wes
t Ban
k &
Gaz
a
New
Yor
k Ci
ty
Sant
iago
Bogo
tá0.84
0.00
0.50
1.00
1.50
2.00
3.50
3.00
3.50
1.341.25
1.19 1.19 1.181.05
0.49
New
Yor
k Ci
ty
Sing
apor
e
Wes
t Ban
k &
Gaz
a
Sant
iago
Bogo
tá
Med
ellín
Cair
o
Beir
ut
0.94 0.94
FIGURE 2.15: ACCELERATION MULTIPLIER FOR FUNDING PROBABILITY (QUANTITY)
FIGURE 2.16: ACCELERATION MULTIPLIER OF INVESTMENT (QUALITY)
Mentors
Mentorship is a knowledge transfer mechanism for entrepreneurs to acquire business acumen, understand the unspoken rules of startup challenges, and access networks of talent, knowledge, and resources. Mentors need to be knowledgeable and experienced. A study for the U.K. government found that the most important characteristic of a mentor is proven business success in the area of work and network of contacts (BMG Research and Galli 2013). Mentorship relationships were found to often develop informally through a preexisting relationship. For example, acceleration and incubation programs typically assign startups formal mentors to assist them for a designated period of time. Research from Endeavor Insight shows that top performing startups have much higher support from mentors (Endeavor Insight 2014).
In the West Bank and Gaza, 38 percent (139) of founders received mentorship from a total of 348 mentors. Founders typically have a median of two mentors with the relationship lasting, on median, one year. One mentor guided 13 founders, which was twice as many as any other mentor. Four founders reported having 10 or more mentors. Of these mentors, only 26 are known founders within the dataset and only three are known investors.19
Mentors, however, do not seem to be very effective in supporting startups (see Long-Term Success Factors), not having a relevant impact on sustainability or access to funding from startups. This suggests a lack of quality of mentors in the West Bank and Gaza since mentors are generally one of the most relevant factors for success of startups in other more mature ecosystems (for example, New York, Santiago).
InvestmentThe value of investors extends beyond the money they provide. Early stage investors are often valued both for their networks and for their experience and subject area expertise, hence the phrase “smart money.” For the purposes of this report, all organizations that invest in high-growth startups venture capital firms and all people who invest in high-growth startups angel investors were considered.
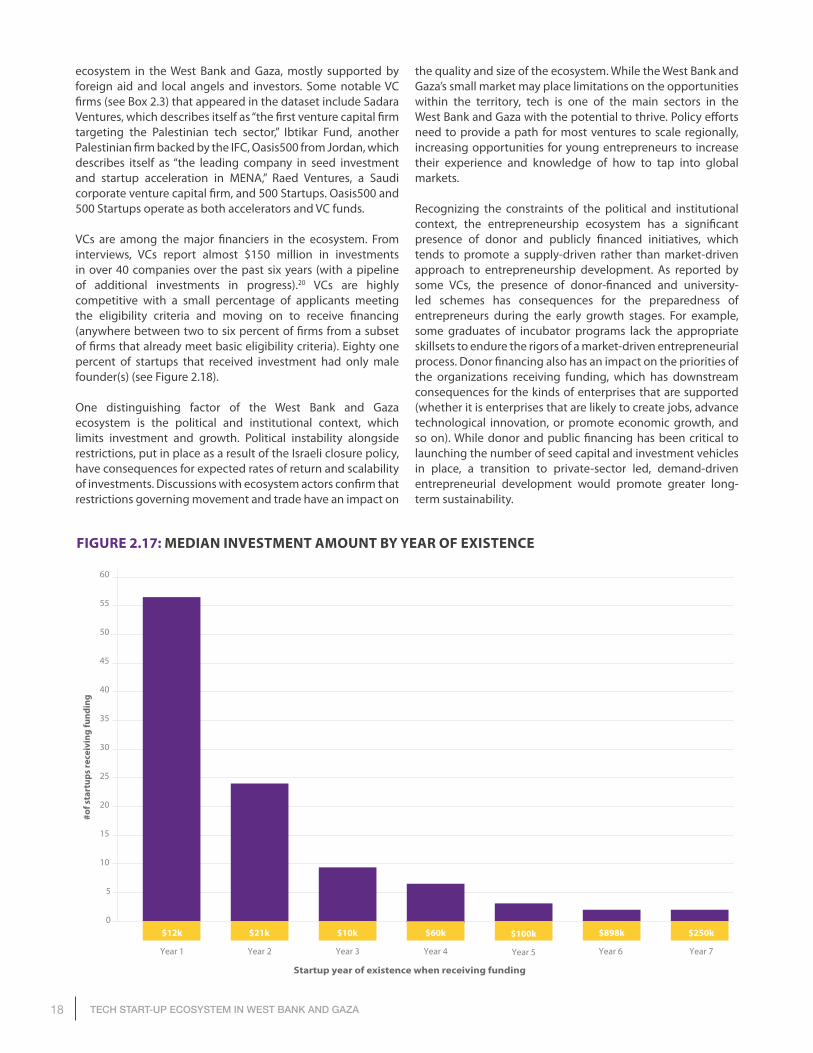
Fifty one investors in the West Bank and Gaza were recorded, of which about three quarters were angel investors and one quarter were venture capital firms. They made a total of 62 investments in 47 startups, and close to 60 percent of investments were identified as equity financing. The median number of startups invested per investor was one, but with several notable outliers. Two individuals invested in five and four startups respectively. Relatively small investment amounts are readily available while availability of larger amounts seem to be more limited (Figure 2.17). There is a nascent but active VC
18 TECH START-UP ECOSYSTEM IN WEST BANK AND GAZA
ecosystem in the West Bank and Gaza, mostly supported by foreign aid and local angels and investors. Some notable VC firms (see Box 2.3) that appeared in the dataset include Sadara Ventures, which describes itself as “the first venture capital firm targeting the Palestinian tech sector,” Ibtikar Fund, another Palestinian firm backed by the IFC, Oasis500 from Jordan, which describes itself as “the leading company in seed investment and startup acceleration in MENA,” Raed Ventures, a Saudi corporate venture capital firm, and 500 Startups. Oasis500 and 500 Startups operate as both accelerators and VC funds.
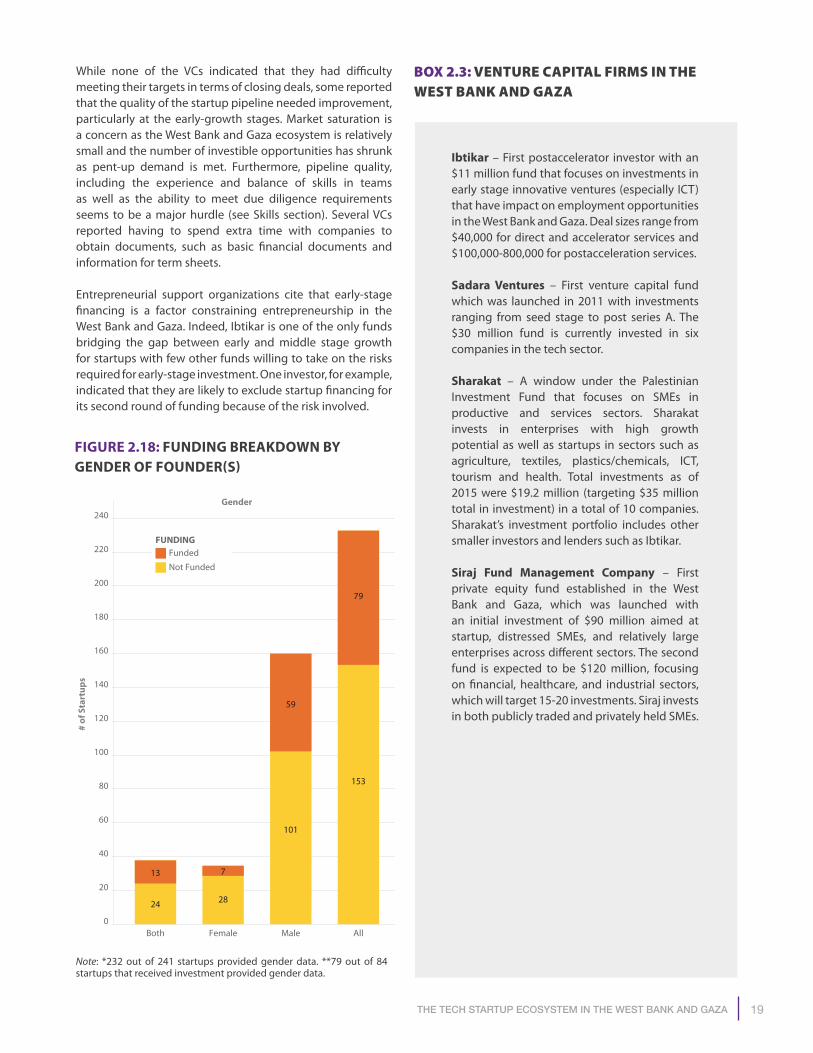
VCs are among the major financiers in the ecosystem. From interviews, VCs report almost $150 million in investments in over 40 companies over the past six years (with a pipeline of additional investments in progress).20 VCs are highly competitive with a small percentage of applicants meeting the eligibility criteria and moving on to receive financing (anywhere between two to six percent of firms from a subset of firms that already meet basic eligibility criteria). Eighty one percent of startups that received investment had only male founder(s) (see Figure 2.18).
One distinguishing factor of the West Bank and Gaza ecosystem is the political and institutional context, which limits investment and growth. Political instability alongside restrictions, put in place as a result of the Israeli closure policy, have consequences for expected rates of return and scalability of investments. Discussions with ecosystem actors confirm that restrictions governing movement and trade have an impact on
FIGURE 2.17: MEDIAN INVESTMENT AMOUNT BY YEAR OF EXISTENCE
the quality and size of the ecosystem. While the West Bank and Gaza’s small market may place limitations on the opportunities within the territory, tech is one of the main sectors in the West Bank and Gaza with the potential to thrive. Policy efforts need to provide a path for most ventures to scale regionally, increasing opportunities for young entrepreneurs to increase their experience and knowledge of how to tap into global markets.
Recognizing the constraints of the political and institutional context, the entrepreneurship ecosystem has a significant presence of donor and publicly financed initiatives, which tends to promote a supply-driven rather than market-driven approach to entrepreneurship development. As reported by some VCs, the presence of donor-financed and university-led schemes has consequences for the preparedness of entrepreneurs during the early growth stages. For example, some graduates of incubator programs lack the appropriate skillsets to endure the rigors of a market-driven entrepreneurial process. Donor financing also has an impact on the priorities of the organizations receiving funding, which has downstream consequences for the kinds of enterprises that are supported (whether it is enterprises that are likely to create jobs, advance technological innovation, or promote economic growth, and so on). While donor and public financing has been critical to launching the number of seed capital and investment vehicles in place, a transition to private-sector led, demand-driven entrepreneurial development would promote greater long-term sustainability.
0
5
10
15
20
25
30
35
40
45
50
55
60
#of s
tart
ups
rece
ivin
g fu
ndin
g
Startup year of existence when receiving funding
Year 7
$250k
Year 5
$100k
Year 1
$12k
Year 4
$60k
Year 3
$10k
Year 2
$21k
Year 6
$898k
19the tech stArtup ecosystem in the west BAnk And gAzA
While none of the VCs indicated that they had difficulty meeting their targets in terms of closing deals, some reported that the quality of the startup pipeline needed improvement, particularly at the early-growth stages. Market saturation is a concern as the West Bank and Gaza ecosystem is relatively small and the number of investible opportunities has shrunk as pent-up demand is met. Furthermore, pipeline quality, including the experience and balance of skills in teams as well as the ability to meet due diligence requirements seems to be a major hurdle (see Skills section). Several VCs reported having to spend extra time with companies to obtain documents, such as basic financial documents and information for term sheets.
Entrepreneurial support organizations cite that early-stage financing is a factor constraining entrepreneurship in the West Bank and Gaza. Indeed, Ibtikar is one of the only funds bridging the gap between early and middle stage growth for startups with few other funds willing to take on the risks required for early-stage investment. One investor, for example, indicated that they are likely to exclude startup financing for its second round of funding because of the risk involved.
0
20
40
60
80
100
120
140
160
180
200
220
240
Both Female Male All
# of
Sta
rtup
s
Gender
Not Funded
FundedFUNDING
13 7
24 28
59
101
79
153
FIGURE 2.18: FUNDING BREAKDOWN BY GENDER OF FOUNDER(S)
BOX 2.3: VENTURE CAPITAL FIRMS IN THE WEST BANK AND GAZA
Ibtikar – First postaccelerator investor with an $11 million fund that focuses on investments in early stage innovative ventures (especially ICT) that have impact on employment opportunities in the West Bank and Gaza. Deal sizes range from $40,000 for direct and accelerator services and $100,000-800,000 for postacceleration services. Sadara Ventures – First venture capital fund which was launched in 2011 with investments ranging from seed stage to post series A. The $30 million fund is currently invested in six companies in the tech sector. Sharakat – A window under the Palestinian Investment Fund that focuses on SMEs in productive and services sectors. Sharakat invests in enterprises with high growth potential as well as startups in sectors such as agriculture, textiles, plastics/chemicals, ICT, tourism and health. Total investments as of 2015 were $19.2 million (targeting $35 million total in investment) in a total of 10 companies. Sharakat’s investment portfolio includes other smaller investors and lenders such as Ibtikar. Siraj Fund Management Company – First private equity fund established in the West Bank and Gaza, which was launched with an initial investment of $90 million aimed at startup, distressed SMEs, and relatively large enterprises across different sectors. The second fund is expected to be $120 million, focusing on financial, healthcare, and industrial sectors, which will target 15-20 investments. Siraj invests in both publicly traded and privately held SMEs.
Note: *232 out of 241 startups provided gender data. **79 out of 84 startups that received investment provided gender data.
20 TECH START-UP ECOSYSTEM IN WEST BANK AND GAZA
CommunityStartup ecosystems operate as communities, where knowledge spillovers and access to resources flows through a network of embedded connections. The tighter and more connected an ecosystem, the more efficient is the flow of knowledge and access to resources. The less connected it is, the less effective the ecosystem is to spot talent and nurture potential ventures into successful startups.
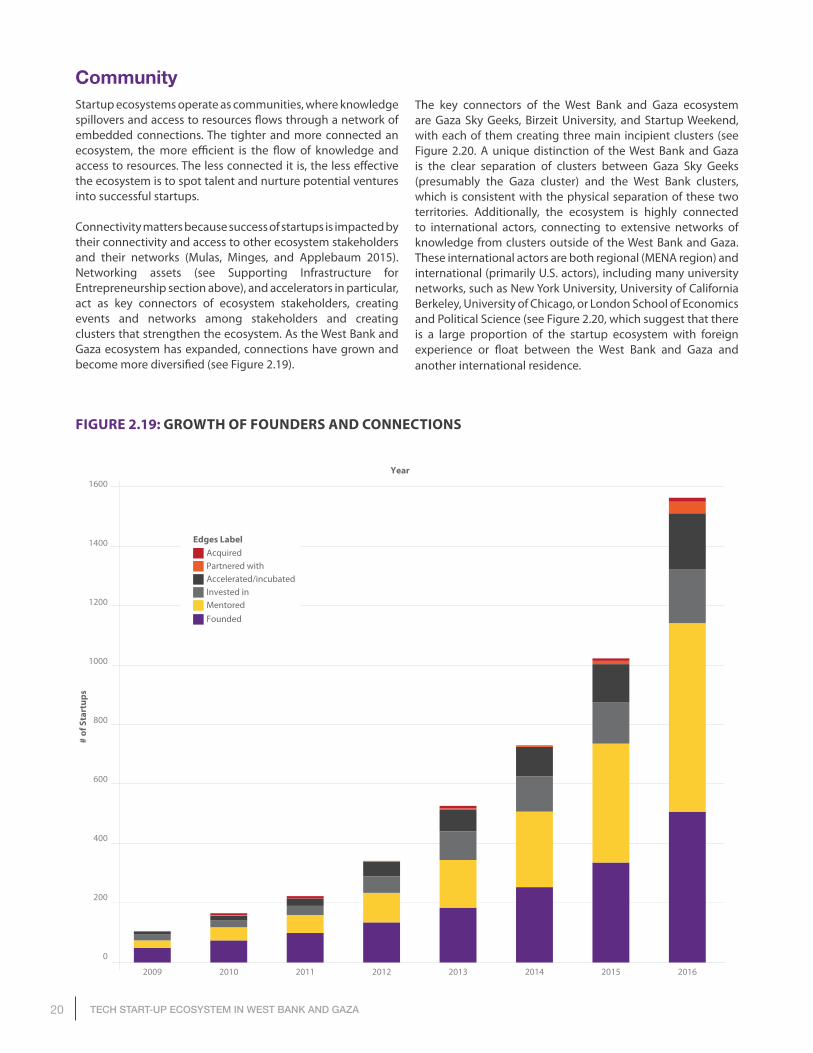
Connectivity matters because success of startups is impacted by their connectivity and access to other ecosystem stakeholders and their networks (Mulas, Minges, and Applebaum 2015). Networking assets (see Supporting Infrastructure for Entrepreneurship section above), and accelerators in particular, act as key connectors of ecosystem stakeholders, creating events and networks among stakeholders and creating clusters that strengthen the ecosystem. As the West Bank and Gaza ecosystem has expanded, connections have grown and become more diversified (see Figure 2.19).
FIGURE 2.19: GROWTH OF FOUNDERS AND CONNECTIONS
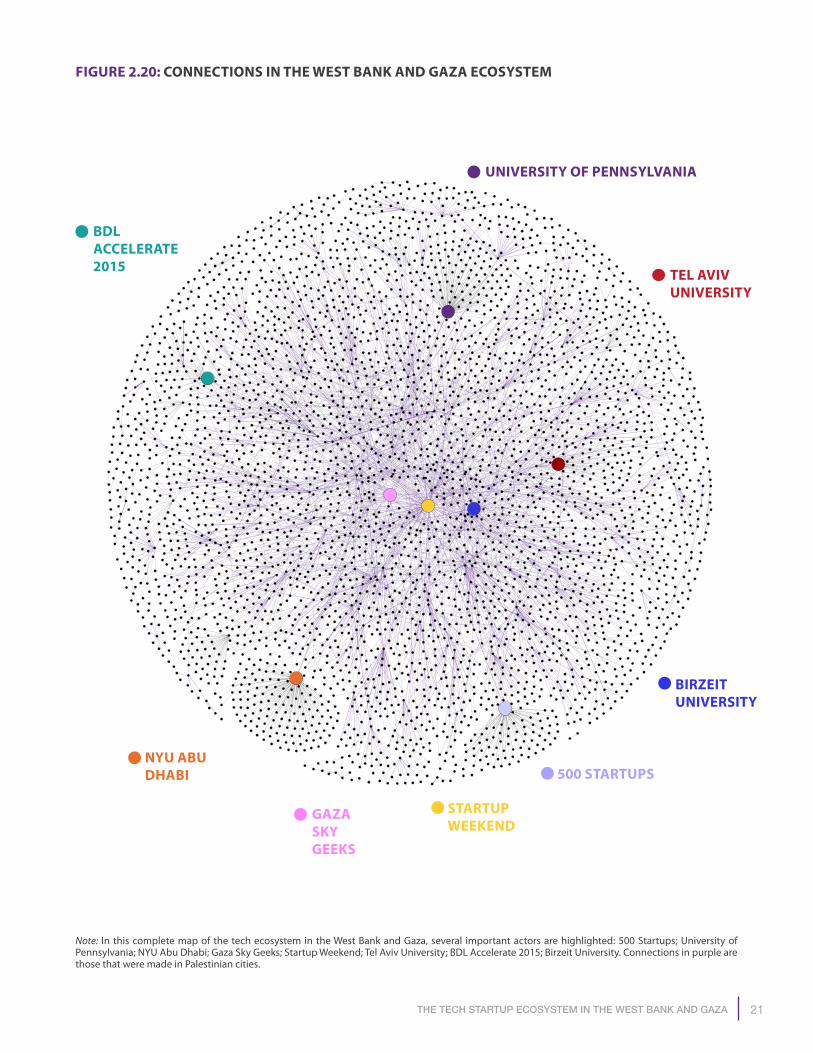
The key connectors of the West Bank and Gaza ecosystem are Gaza Sky Geeks, Birzeit University, and Startup Weekend, with each of them creating three main incipient clusters (see Figure 2.20. A unique distinction of the West Bank and Gaza is the clear separation of clusters between Gaza Sky Geeks (presumably the Gaza cluster) and the West Bank clusters, which is consistent with the physical separation of these two territories. Additionally, the ecosystem is highly connected to international actors, connecting to extensive networks of knowledge from clusters outside of the West Bank and Gaza. These international actors are both regional (MENA region) and international (primarily U.S. actors), including many university networks, such as New York University, University of California Berkeley, University of Chicago, or London School of Economics and Political Science (see Figure 2.20, which suggest that there is a large proportion of the startup ecosystem with foreign experience or float between the West Bank and Gaza and another international residence.
201120102009 2012 2013 2014 20162015
0
200
400
600
800
1000
1200
1400
1600
# of
Sta
rtup
s
Year
MentoredFounded
Invested inAccelerated/incubatedPartnered withAcquired
Edges Label
21the tech stArtup ecosystem in the west BAnk And gAzA
FIGURE 2.20: CONNECTIONS IN THE WEST BANK AND GAZA ECOSYSTEM
Note: In this complete map of the tech ecosystem in the West Bank and Gaza, several important actors are highlighted: 500 Startups; University of Pennsylvania; NYU Abu Dhabi; Gaza Sky Geeks; Startup Weekend; Tel Aviv University; BDL Accelerate 2015; Birzeit University. Connections in purple are those that were made in Palestinian cities.
NYU ABU DHABI
GAZA SKY GEEKS
BIRZEIT UNIVERSITY
BDL ACCELERATE 2015
500 STARTUPS
STARTUP WEEKEND
UNIVERSITY OF PENNSYLVANIA
TEL AVIV UNIVERSITY
22 TECH START-UP ECOSYSTEM IN WEST BANK AND GAZA
FIGURE 2.21: VISUALIZATION ECOSYSTEM CONNECTIVITY
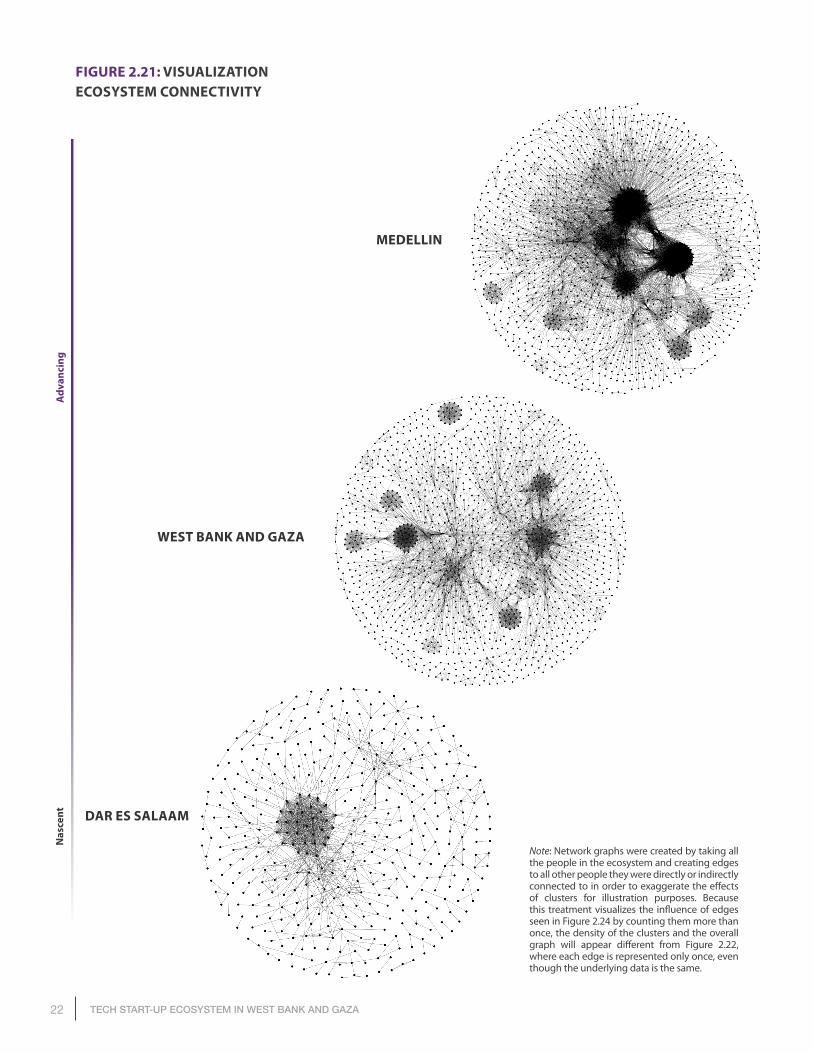
Note: Network graphs were created by taking all the people in the ecosystem and creating edges to all other people they were directly or indirectly connected to in order to exaggerate the effects of clusters for illustration purposes. Because this treatment visualizes the influence of edges seen in Figure 2.24 by counting them more than once, the density of the clusters and the overall graph will appear different from Figure 2.22, where each edge is represented only once, even though the underlying data is the same.
WEST BANK AND GAZA
MEDELLIN
Nas
cent DAR ES SALAAM
Adv
anci
ng
23the tech stArtup ecosystem in the west BAnk And gAzA
BE HIGHLY CONNECTEDTO OTHER STAKEHOLDERS
LONG-TERMSUCCESS
SHORT-TERMSUCCESS
Hiring employees over time
HAVING A FOREIGN FUNDER OR INVESTOR
HAVING A MORE FORMAL EDUCATION
RAISING FUNDING HIRING EMPLOYEES OVER TIME
The community in the West Bank and Gaza is consistent with a nascent ecosystem evolving to maturity, where there is more than one cluster evolving towards more connectivity. Higher density and more clusters allow entrepreneurs to connect to knowledge and resources through other actors in the ecosystem. The less dense the ecosystem is, the more difficult it is for a founder to find their way to mentors, investors, or other relevant knowledge or resources required for their venture. The additional separation of clusters in the West Bank and Gaza increases this difficulty. Clusters serve as multipliers of density, helping founders leapfrog orders of connection (for example, connections that in other cases are fifth or seventh order connections, that is, the founder is connected through five or seven connections to the target person, become a second or third order connection, where the founder is connected through two or three people to the target connection).
When comparing the density and clusters of the community with those of less and more advanced ecosystems (see Figure 2.24), the West Bank and Gaza features several clusters in formation but not yet developed. As a more nascent ecosystem, Dar es Salaam only features one cluster. In comparison, Medellin has already evolved into highly connected clusters driving connectivity in the ecosystem. The expansion and maturity of these clusters is important for the West Bank and Gaza ecosystem success. Connectivity is the most significant factor for obtaining funding for startups in the West Bank and Gaza (see Factors of Short-Term Success). The more this connectivity expands, the more access to funding, talent, and resources startups will have.
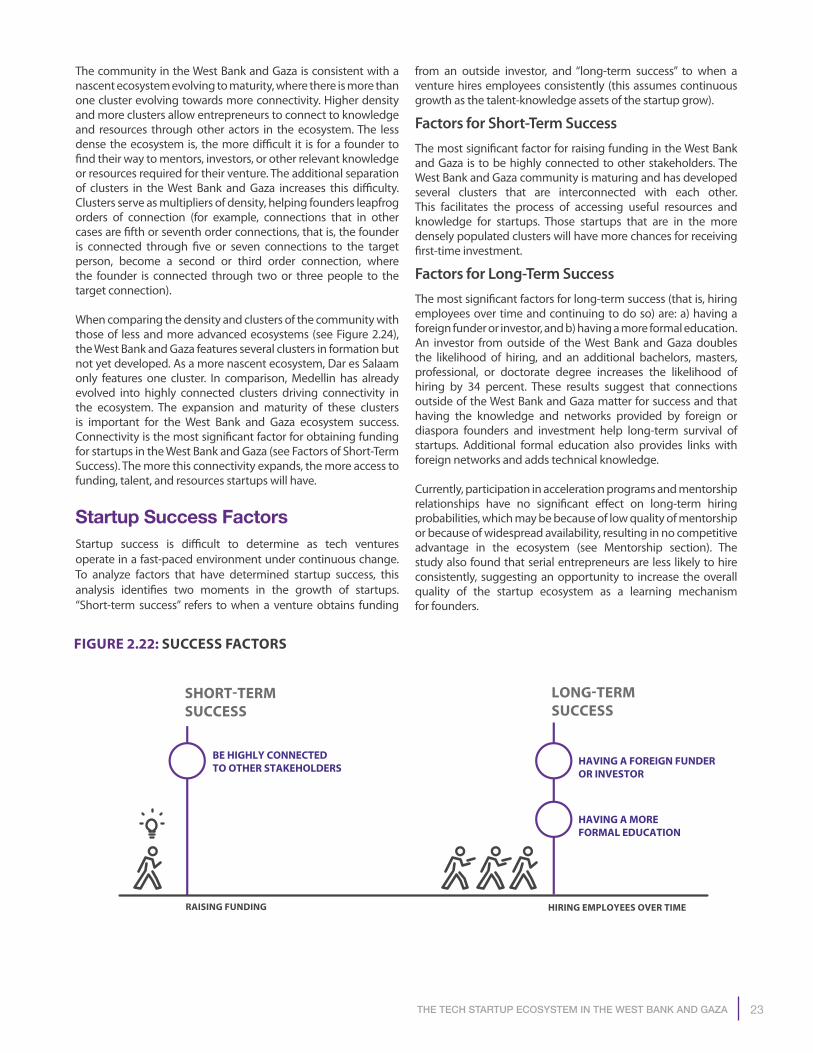
Startup Success FactorsStartup success is difficult to determine as tech ventures operate in a fast-paced environment under continuous change. To analyze factors that have determined startup success, this analysis identifies two moments in the growth of startups. “Short-term success” refers to when a venture obtains funding
from an outside investor, and “long-term success” to when a venture hires employees consistently (this assumes continuous growth as the talent-knowledge assets of the startup grow).
Factors for Short-Term Success The most significant factor for raising funding in the West Bank and Gaza is to be highly connected to other stakeholders. The West Bank and Gaza community is maturing and has developed several clusters that are interconnected with each other. This facilitates the process of accessing useful resources and knowledge for startups. Those startups that are in the more densely populated clusters will have more chances for receiving first-time investment.
Factors for Long-Term SuccessThe most significant factors for long-term success (that is, hiring employees over time and continuing to do so) are: a) having a foreign funder or investor, and b) having a more formal education. An investor from outside of the West Bank and Gaza doubles the likelihood of hiring, and an additional bachelors, masters, professional, or doctorate degree increases the likelihood of hiring by 34 percent. These results suggest that connections outside of the West Bank and Gaza matter for success and that having the knowledge and networks provided by foreign or diaspora founders and investment help long-term survival of startups. Additional formal education also provides links with foreign networks and adds technical knowledge.
Currently, participation in acceleration programs and mentorship relationships have no significant effect on long-term hiring probabilities, which may be because of low quality of mentorship or because of widespread availability, resulting in no competitive advantage in the ecosystem (see Mentorship section). The study also found that serial entrepreneurs are less likely to hire consistently, suggesting an opportunity to increase the overall quality of the startup ecosystem as a learning mechanism for founders.
FIGURE 2.22: SUCCESS FACTORS
24 TECH START-UP ECOSYSTEM IN WEST BANK AND GAZA
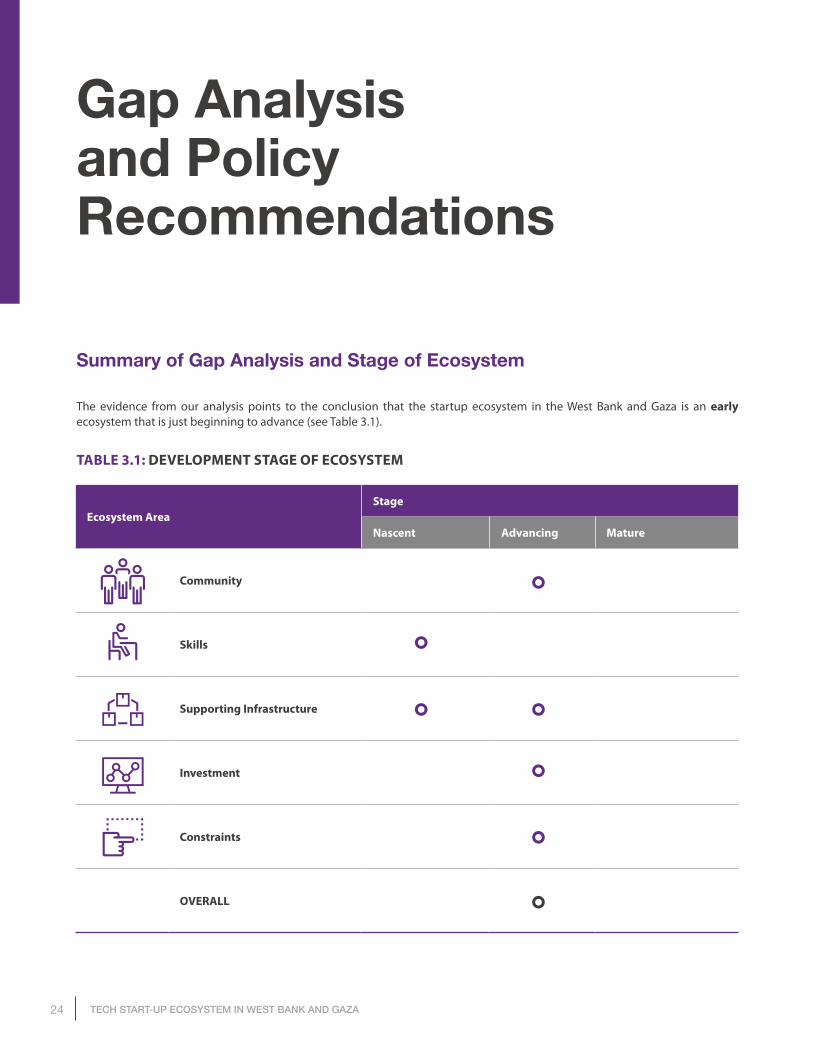
Ecosystem AreaStage
Nascent Advancing Mature
Community
Skills
Supporting Infrastructure
Investment
Constraints
OVERALL
Gap Analysis and Policy Recommendations
Summary of Gap Analysis and Stage of Ecosystem
The evidence from our analysis points to the conclusion that the startup ecosystem in the West Bank and Gaza is an early ecosystem that is just beginning to advance (see Table 3.1).
TABLE 3.1: DEVELOPMENT STAGE OF ECOSYSTEM
25gAp AnAlysis And policy recommendAtions
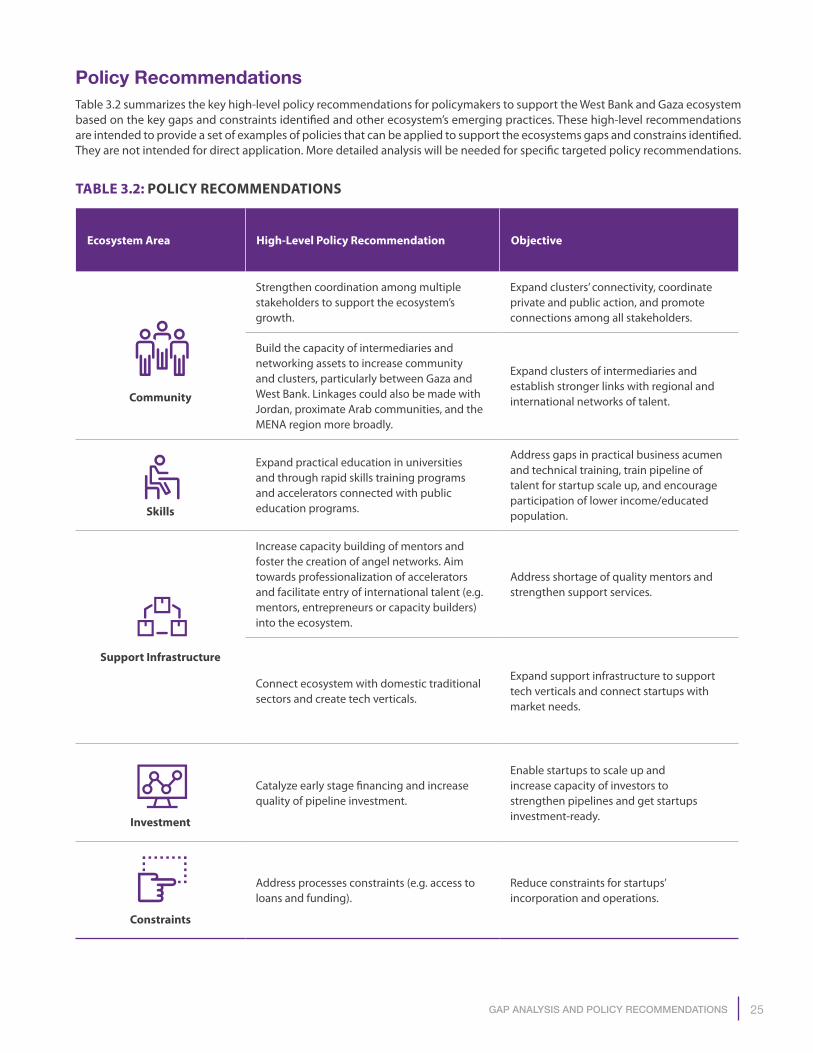
Policy RecommendationsTable 3.2 summarizes the key high-level policy recommendations for policymakers to support the West Bank and Gaza ecosystem based on the key gaps and constraints identified and other ecosystem’s emerging practices. These high-level recommendations are intended to provide a set of examples of policies that can be applied to support the ecosystems gaps and constrains identified. They are not intended for direct application. More detailed analysis will be needed for specific targeted policy recommendations.
TABLE 3.2: POLICY RECOMMENDATIONS
Ecosystem Area High-Level Policy Recommendation Objective
Community
Strengthen coordination among multiple stakeholders to support the ecosystem’s growth.
Expand clusters’ connectivity, coordinate private and public action, and promote connections among all stakeholders.
Build the capacity of intermediaries and networking assets to increase community and clusters, particularly between Gaza and West Bank. Linkages could also be made with Jordan, proximate Arab communities, and the MENA region more broadly.
Expand clusters of intermediaries and establish stronger links with regional and international networks of talent.
Skills
Expand practical education in universities and through rapid skills training programs and accelerators connected with public education programs.
Address gaps in practical business acumen and technical training, train pipeline of talent for startup scale up, and encourage participation of lower income/educated population.
Support Infrastructure
Increase capacity building of mentors and foster the creation of angel networks. Aim towards professionalization of accelerators and facilitate entry of international talent (e.g. mentors, entrepreneurs or capacity builders) into the ecosystem.
Address shortage of quality mentors and strengthen support services.
Connect ecosystem with domestic traditional sectors and create tech verticals.
Expand support infrastructure to support tech verticals and connect startups with market needs.
Investment
Catalyze early stage financing and increase quality of pipeline investment.
Enable startups to scale up and increase capacity of investors to strengthen pipelines and get startups investment-ready.
Constraints
Address processes constraints (e.g. access to loans and funding).
Reduce constraints for startups’ incorporation and operations.
26 TECH START-UP ECOSYSTEM IN WEST BANK AND GAZA
1. Community1.a. Strengthen coordination among multiple stakeholders to support the growth of the ecosystem. Ecosystem coordination increases the effectiveness of community-building events and connectivity among clusters. Successful ecosystems, such as Buenos Aires, Tel Aviv or Boston, havcreated different types of coordination mechanisms among stakeholders led by public policy actors (for example, municipal or government innovation agencies). This varies from stakeholder roundtables to continuous consultation processes and support programs for public-private partnerships (PPPs). 21 In Boston, for instance, District Hall was founded through a cross-sector partnership between the city and private actors to create a physical space and public resources to connect, support, and strengthen innovators while expanding the reach, visibility, and benefits of Greater Boston’s innovation economy.
1.b. Build the capacity of intermediaries and networking assets to increase community and clusters. Networking assets, and accelerators in particular, create clusters of connections, increasing the community and helping to expand it (Mulas, Minges, and Applebaum 2015). These intermediaries also serve to attract and train new talent to the ecosystem, expanding its community and the potential pipeline of indigenous startups. New York City created a network of incubators/accelerators with a clear focus on community building and skills training, resulting in expansion of tech startup clusters and diversification of the ecosystem across the city (Mulas and Gastelu-Iturri 2016). Promotion and support of ecosystem events also help by expanding the community. Riseup in Cairo or BDL in Lebanon are examples of the impact of ecosystem-wide events to expand and grow the community of entrepreneurs beyond their initial stages, attract international attention and a networks of partners, and connect with nontraditional partners (for example, traditional industries).
2. Skills2.a. Expand practical education in universities and through rapid skills training programs and accelerators as well as public education programs. Public policies can catalyze and support both practical educational programs to address the skills gaps in ecosystems. Coding bootcamps (see Box 3.1) are nascent in the West Bank and Gaza, but they have proven successful at rapidly assessing market gaps and demands in tech startup ecosystems. Moreover, these programs can serve to include the low-educated population into the ecosystem by providing a basic set of skills connected to the ecosystem demand. For instance, in New York City, the city’s initiative to support rapid skills training programs resulted in General Assembly, one of the largest providers of bootcamps worldwide, which serves to address skills gaps ranging from entrepreneurship and business skills to specific coding and technical skills through rapid skills training programs (Mulas and Gastelu-Iturri 2016). In Medellin, the city innovation agency catalyzed coding bootcamp programs in the city to provide technical skills for young people and support the growth of the tech ecosystem in the city (World Bank 2017b).
Public policy programs can also help community spaces, and accelerators can also be supported to enhance their capacity to provide higher quality mentorship and training to startup ventures with potential through their programs (in the case of accelerators) of related activities.
Additionally, public policies can catalyze the introduction of practical education programs for university students and address part of the gap in business acumen. Initiatives, such as Demola in Tampere,22 Finland, and Cornell-Technion Campus23 in New York were catalyzed to address this specific gap in their ecosystems. In both cases, a practical project-based education is added for students to learn-by-doing with businesses.
BOX 3.1: WHAT ARE CODING BOOTCAMPS?
Coding bootcamps are intensive short-term programs designed to train participants in programming skills to make them immediately employable in entry-level tech positions. In essence, they combine characteristics of traditional vocational training programs with the intensity of military bootcamps for new recruits, intermingling soft and tech skills learning in an intense manner, in what could be referred to as “skills accelerators.” Coding bootcamps follow a structured process with three main characteristic features: 1) intense rapid-skills training, 2) an experiential learning approach, and 3) curricula based on, and continuously adapting to, industry’s demand.
Although the bootcamp methodology has primarily focused on coding skills, it has been also adapted for business and entrepreneurial skills as well as other technical skills. Usually, bootcamp programs embed “life skills” in their curriculum, enabling their graduates to be competitive irrespective of the industry in which they choose to work, for example, the ability to master new knowledge quickly and efficiently, effectively work in a team, meet tight deadlines, and so on. Evidently, these “life skills” belong to the subset of future-proof soft skills (World Bank 2017b).
27gAp AnAlysis And policy recommendAtions
3. Support Infrastructure3.a. Increase the capacity of managers and mentors in accelerators and facilitate entry of international talent (as mentors, entrepreneurs or capacity builders) into the ecosystem. Support can also be provided to increase the capacity of managers and mentors (for example, through training and capacity-building programs) of accelerators and outside mentors. Neither accelerators nor mentors currently have a support effect in the ecosystem. Enhancing the management, operations, and practical training of these actors is key for the maturity of the ecosystem. Support for accelerators should be focus on quality. Currently, there is an abundance of funding to accelerators, but this has not resulted in successful outcomes.
Focusing on managerial support and attraction of mentors with startup and practical entrepreneurship and business experience will be key to increasing quality of this support infrastructure. In Kenya, the government, jointly with the World Bank, is designing a policy program to provide support to accelerators through self-improvement plans that focus on quality. In other ecosystems, support for accelerators has focused on attracting international high quality accelerators to the ecosystem (for example, Barcelona)24. This type of policy support may be more difficult to implement in the context of the West Bank and Gaza, but the connection to international accelerator programs should be supported. The ecosystem already has ties with leading accelerators in the United States, such as 500 Startups and Techstars.
A way to address this lack of experience and knowledge of mentors is to attract international talent with such practical acumen. There are several support programs that can achieve this goal, ranging from events that gather international talent and connect it to the ecosystem to more structural programs. Santiago, Chile, followed a more structured approach, creating a program (Startup Chile)25 to attract international talent to the ecosystem. The program is in essence an acceleration-funded program for high-skilled international talent to conduct their ventures’ initial stage in Chile. The program introduced specific activities to ensure knowledge spillovers between the international talent and domestic entrepreneurs. For instance, international entrepreneurs share coworking space with domestic entrepreneurs and they have to provide capacity building and workshops on entrepreneurship and technical skills for domestic entrepreneurs. This mechanism has been emulated by other ecosystems, including the K-Startup Grand Challenge in Korea.26
Even if this program cannot be applied fully under the constraints of the West Bank and Gaza ecosystem, the practical lessons of collocation and learning-by-doing between domestic and international entrepreneurs can be applied by attracting temporary programs and competitions for international or regional talent to work with domestic entrepreneurs and the built out links with high-quality mentor networks.
3.b. Connect ecosystem with domestic traditional sectors and create tech verticals. The West Bank and Gaza ecosystem could also expand beyond the tech sector, including traditional industries, such as agriculture or craft and related trades. This was, for instance, one of the key features of the New York ecosystem’s
success, which resulted in specialized startups with in-depth knowledge of industry niches and increased competitiveness of traditional sectors in the city, such as finance, media, advertising and fashion (Mulas and Gastelu-Iturri 2016). Policy actions can be applied to catalyze industry-startup innovation through open innovation and service codevelopment processes. For instance, Paris municipality has supported the corporate-startup service codevelopment process through initiatives such as Data City Paris.27 In New York, the city catalyzed through a PPP mechanism sector-specific accelerators for media and fashion, among others (Mulas and Gastelu-Iturri 2016).
4. Investment4.a. Catalyze early stage financing to enable startups to scale up and increase quality of pipeline investment. The West Bank and Gaza presents sufficient funding options for very early stage seed funding, with availability of small amounts (that is, $10,000-60,000) for startups in their first four years of operation). However, it presents less availability of funding for startups to grow and scale. Current efforts should be oriented towards enhancing the quality of pipeline investment. This is particularly important as VCs report that there are insufficient investment-ready startups for their existing funding. Further support to address financial access and capacity-related challenges by focusing on building the investment pipeline is needed. The World Bank is currently piloting an instrument (the Entrepreneurship Ecosystem Matching Grant) that deploys grants that finance business development support services and capacity building to entrepreneurs. It supports the development of a pipeline of investible projects in the West Bank and Gaza by enhancing the capacity of enterprises to absorb funding from the investment vehicles already in place.
5. Constraints5.a. Address process constraints. Policies related to conducting business are regarded as constraints insofar as they are perceived to lack central coordination and/or do not facilitate the growth of entrepreneurship. The overall rank for Doing Business in the West Bank and Gaza (140 out of 189 economies) confirms the need to improve time, cost and procedures for startup and entrepreneurial activity. Some entrepreneurs reported legal constraints that hindered startup creation. For example, one entrepreneur stated, “The problem is not with registering the startup or not. Palestinian law does not support most of the terms in terms sheets, so we had to create a new entity outside Palestine to fulfil and complete the process.” Improving intellectual property rights, tax incentives, and reducing the minimum capital required to open a company are some of the areas that have been identified where addressing process constraints could potentially play a role in facilitating proentrepreneurship policies.
These policy recommendations only address the short-term actions to support the West Bank and Gaza ecosystem. Policy makers should constantly monitor the ecosystem (which can be done through the coordination mechanism once in place) and iterate the policy approach as needed and address new gaps or growth hurdles as they arise. As the ecosystem grows and evolves into more maturity, new needs will emerge and other specific policies would be more applicable.
28 TECH START-UP ECOSYSTEM IN WEST BANK AND GAZA
Appendix: Survey Methodology and Analysis
Methodology
Survey Questions
For the survey of startup founders, the standard questionnaire developed under the Global Entrepreneurship Research Network (GERN) was used, with some additional questions to understand specific constraints that startups face. The GERN-developed standard questionnaire includes the following:
1. Educational history (including vocational, bootcamps, and certificate programs)
2. Employment history3. Founding history (serial entrepreneurship)4. Support programs (for example, acceleration, incubation,
and so on) history5. Connections with mentors and mentees6. Connections with investors (angel and institutional)
In addition to this questionnaire, the geographic location of startups and intermediaries were collected (for the geographic analysis) and included the following standard questions:
1. Incorporation: On average, how many days did it or would it take you to incorporate a new startup?
2. Funding: On average, how many days did it or would it take you to set up a bank account for your startup?
3. Credit: On average, how many days did it or would it take you to get a line of credit for your startup?
4. Funding: On average, how many days did it or would it take you to raise a round of equity funding?
5. Hiring: On average, how many days did it or would it take you to hire an employee, from job posting to employee start?
6. Office space: On average, how many days did it or would it take you to obtain office space for your startup?
7. Exit: On average, how many days did it or would it take you to exit your startup?
Outreach Strategy
Entrepreneurs filled in an online survey available at http://survey.techecosystems.org/. Agility Management & Financial Consulting were hired to partner with local organizations in order to disseminate the survey. These partners played a crucial role in not only identifying startups, but also connecting and introducing the survey and the study team to startups.
Partners included including Leaders Organization/Fast Forward, Bethlehem Business Incubator, Ibtikar Fund, Sadara Ventures, the Business Startup Incubator Support Program (BSIS), and Palestine Information and Communications Technology Incubator (PICTI).
Data was collected through (1) face to face sessions; (2) phone interviews; (3) networking events and workshops at accelerators and incubators; (4) and finally online communication (that is, Skype, Facebook, Email, and so on).
Data Pipeline
Survey data used in this report originated with the custom survey and was initially retrieved in raw JavaScript Object Notation (JSON) format. Data was converted to comma-separated values (CSV) and then combined with raw data from additional sources, then cleaned of outliers and testing data. Nodes without location data, and locations without geocodes, were passed to the Google Maps API in order to obtain standardized location data wherever possible. This new dataset was deduplicated using a process that marked similarities between names, email addresses, URLs, and dates. Entities that were determined to be likely duplicates were then merged, maintaining all existing data and privileging more recent data in the event of conflict. Duplicate edges resulting from this process were removed. Finally, college majors and company industries were categorized using a machine learning approach that used a set of manually categorized responses to predict category based on word similarity. From this cleaned and augmented dataset, panel and graph data were then generated for analysis.
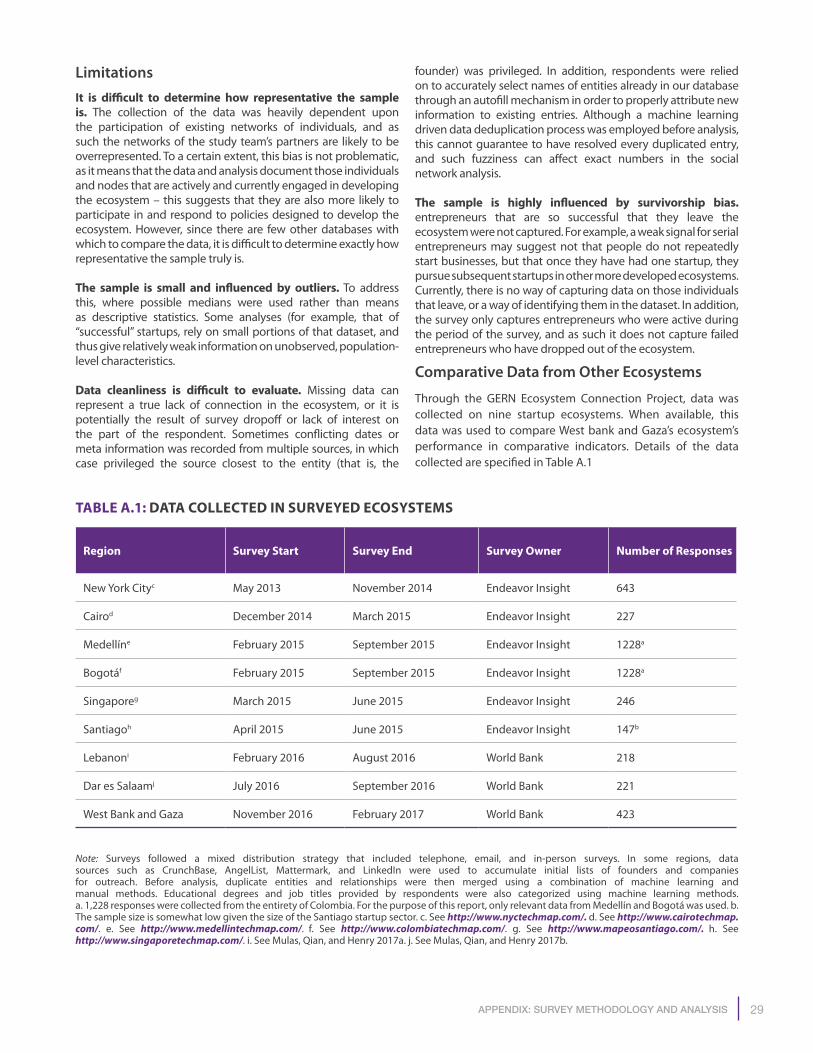
29Appendix: survey methodology And AnAlysis
LimitationsIt is difficult to determine how representative the sample is. The collection of the data was heavily dependent upon the participation of existing networks of individuals, and as such the networks of the study team’s partners are likely to be overrepresented. To a certain extent, this bias is not problematic, as it means that the data and analysis document those individuals and nodes that are actively and currently engaged in developing the ecosystem – this suggests that they are also more likely to participate in and respond to policies designed to develop the ecosystem. However, since there are few other databases with which to compare the data, it is difficult to determine exactly how representative the sample truly is.
The sample is small and influenced by outliers. To address this, where possible medians were used rather than means as descriptive statistics. Some analyses (for example, that of “successful” startups, rely on small portions of that dataset, and thus give relatively weak information on unobserved, population-level characteristics.
Data cleanliness is difficult to evaluate. Missing data can represent a true lack of connection in the ecosystem, or it is potentially the result of survey dropoff or lack of interest on the part of the respondent. Sometimes conflicting dates or meta information was recorded from multiple sources, in which case privileged the source closest to the entity (that is, the
founder) was privileged. In addition, respondents were relied on to accurately select names of entities already in our database through an autofill mechanism in order to properly attribute new information to existing entries. Although a machine learning driven data deduplication process was employed before analysis, this cannot guarantee to have resolved every duplicated entry, and such fuzziness can affect exact numbers in the social network analysis.
The sample is highly influenced by survivorship bias. entrepreneurs that are so successful that they leave the ecosystem were not captured. For example, a weak signal for serial entrepreneurs may suggest not that people do not repeatedly start businesses, but that once they have had one startup, they pursue subsequent startups in other more developed ecosystems. Currently, there is no way of capturing data on those individuals that leave, or a way of identifying them in the dataset. In addition, the survey only captures entrepreneurs who were active during the period of the survey, and as such it does not capture failed entrepreneurs who have dropped out of the ecosystem.
Comparative Data from Other Ecosystems
Through the GERN Ecosystem Connection Project, data was collected on nine startup ecosystems. When available, this data was used to compare West bank and Gaza’s ecosystem’s performance in comparative indicators. Details of the data collected are specified in Table A.1
Region Survey Start Survey End Survey Owner Number of Responses
New York Cityc May 2013 November 2014 Endeavor Insight 643
Cairod December 2014 March 2015 Endeavor Insight 227
Medellíne February 2015 September 2015 Endeavor Insight 1228a
Bogotáf February 2015 September 2015 Endeavor Insight 1228a
Singaporeg March 2015 June 2015 Endeavor Insight 246
Santiagoh April 2015 June 2015 Endeavor Insight 147b
Lebanoni February 2016 August 2016 World Bank 218
Dar es Salaamj July 2016 September 2016 World Bank 221
West Bank and Gaza November 2016 February 2017 World Bank 423
Note: Surveys followed a mixed distribution strategy that included telephone, email, and in-person surveys. In some regions, data sources such as CrunchBase, AngelList, Mattermark, and LinkedIn were used to accumulate initial lists of founders and companies for outreach. Before analysis, duplicate entities and relationships were then merged using a combination of machine learning and manual methods. Educational degrees and job titles provided by respondents were also categorized using machine learning methods. a. 1,228 responses were collected from the entirety of Colombia. For the purpose of this report, only relevant data from Medellín and Bogotá was used. b. The sample size is somewhat low given the size of the Santiago startup sector. c. See http://www.nyctechmap.com/. d. See http://www.cairotechmap.com/. e. See http://www.medellintechmap.com/. f. See http://www.colombiatechmap.com/. g. See http://www.mapeosantiago.com/. h. See http://www.singaporetechmap.com/. i. See Mulas, Qian, and Henry 2017a. j. See Mulas, Qian, and Henry 2017b.
TABLE A.1: DATA COLLECTED IN SURVEYED ECOSYSTEMS
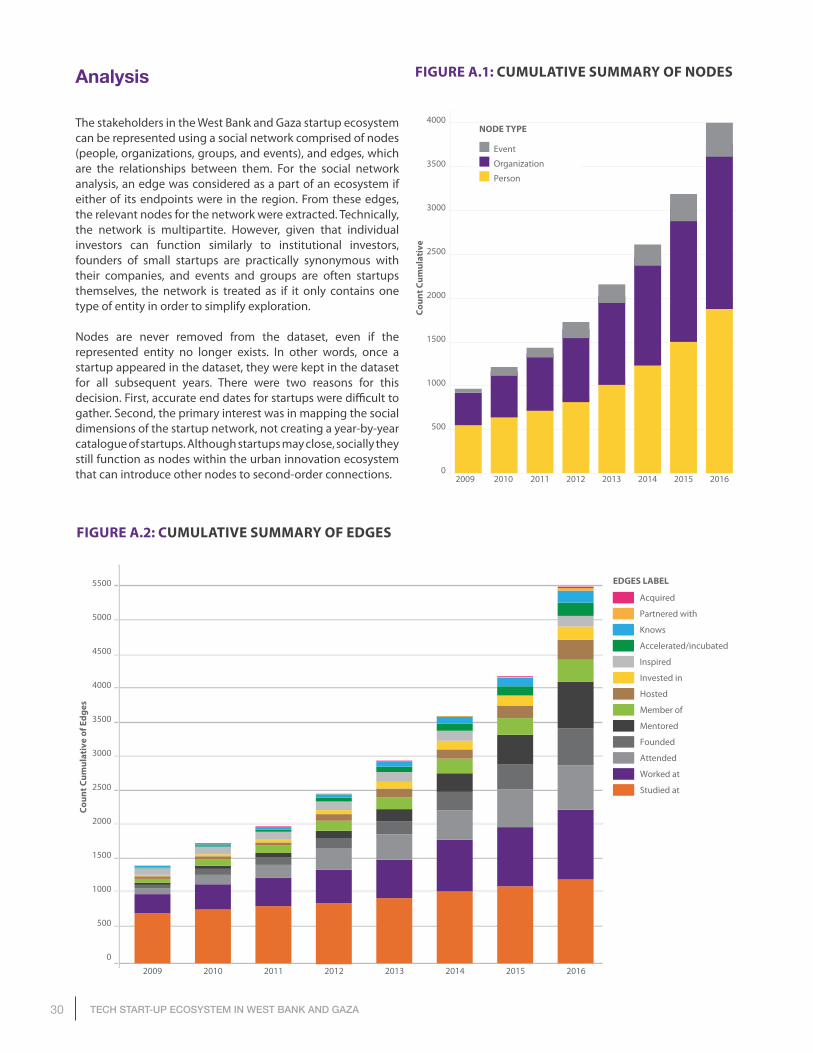
30 TECH START-UP ECOSYSTEM IN WEST BANK AND GAZA
Analysis
The stakeholders in the West Bank and Gaza startup ecosystem can be represented using a social network comprised of nodes (people, organizations, groups, and events), and edges, which are the relationships between them. For the social network analysis, an edge was considered as a part of an ecosystem if either of its endpoints were in the region. From these edges, the relevant nodes for the network were extracted. Technically, the network is multipartite. However, given that individual investors can function similarly to institutional investors, founders of small startups are practically synonymous with their companies, and events and groups are often startups themselves, the network is treated as if it only contains one type of entity in order to simplify exploration.
Nodes are never removed from the dataset, even if the represented entity no longer exists. In other words, once a startup appeared in the dataset, they were kept in the dataset for all subsequent years. There were two reasons for this decision. First, accurate end dates for startups were difficult to gather. Second, the primary interest was in mapping the social dimensions of the startup network, not creating a year-by-year catalogue of startups. Although startups may close, socially they still function as nodes within the urban innovation ecosystem that can introduce other nodes to second-order connections.
FIGURE A.1: CUMULATIVE SUMMARY OF NODES
FIGURE A.2: CUMULATIVE SUMMARY OF EDGES
2009 2010 2011 2012 2013 2014 2015 20160
500
1000
1500
2000
2500
3000
4000
3500
Coun
t Cum
ulat
ive
Person
Event
Organization
NODE TYPE
2009 2010 2011 2012 2013 2014 2015 2016
0
500
1000
1500
2000
2500
3000
3500
4000
4500
5000
5500
Coun
t Cum
ulat
ive
of E
dges
Inspired
Accelerated/incubated
Knows
Partnered with
Acquired
Founded
Attended
Worked at
Studied at
Mentored
Member of
Hosted
Invested in
EDGES LABEL
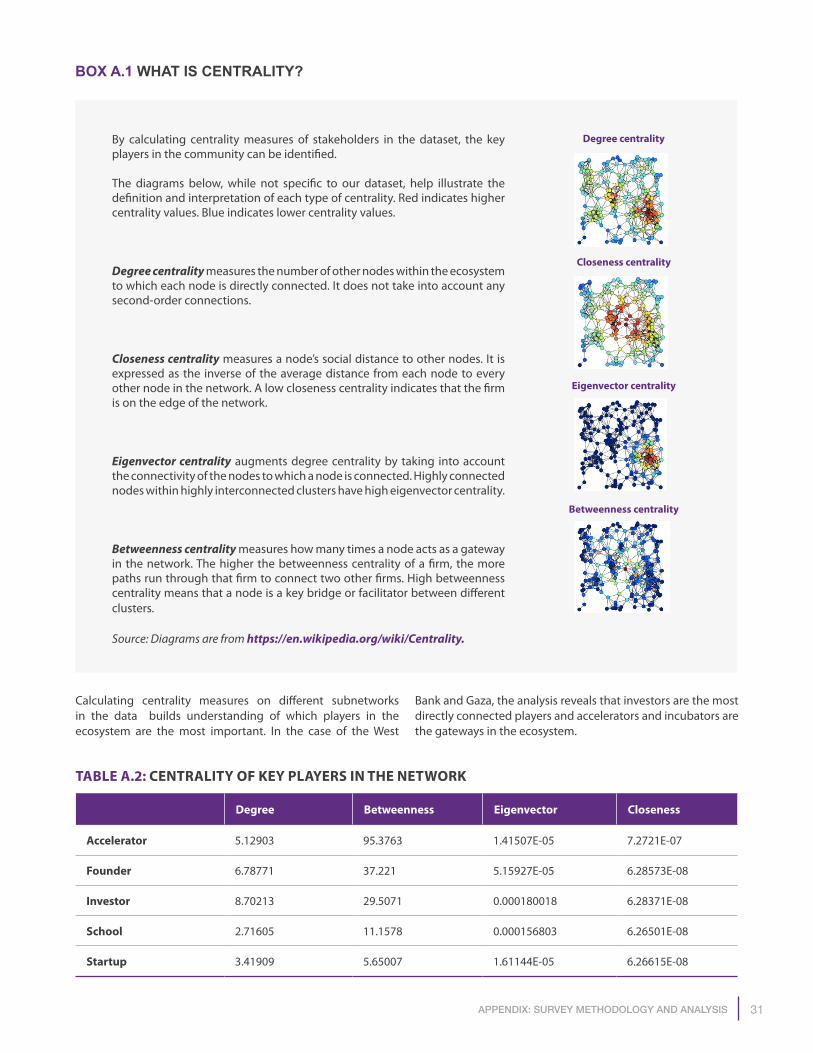
31Appendix: survey methodology And AnAlysis
Degree Betweenness Eigenvector Closeness
Accelerator 5.12903 95.3763 1.41507E-05 7.2721E-07
Founder 6.78771 37.221 5.15927E-05 6.28573E-08
Investor 8.70213 29.5071 0.000180018 6.28371E-08
School 2.71605 11.1578 0.000156803 6.26501E-08
Startup 3.41909 5.65007 1.61144E-05 6.26615E-08
BOX A.1 WHAT IS CENTRALITY?
Degree centrality
Closeness centrality
Betweenness centrality
Eigenvector centrality
By calculating centrality measures of stakeholders in the dataset, the key players in the community can be identified.
The diagrams below, while not specific to our dataset, help illustrate the definition and interpretation of each type of centrality. Red indicates higher centrality values. Blue indicates lower centrality values.
Degree centrality measures the number of other nodes within the ecosystem to which each node is directly connected. It does not take into account any second-order connections.
Closeness centrality measures a node’s social distance to other nodes. It is expressed as the inverse of the average distance from each node to every other node in the network. A low closeness centrality indicates that the firm is on the edge of the network.
Eigenvector centrality augments degree centrality by taking into account the connectivity of the nodes to which a node is connected. Highly connected nodes within highly interconnected clusters have high eigenvector centrality.
Betweenness centrality measures how many times a node acts as a gateway in the network. The higher the betweenness centrality of a firm, the more paths run through that firm to connect two other firms. High betweenness centrality means that a node is a key bridge or facilitator between different clusters.
Source: Diagrams are from https://en.wikipedia.org/wiki/Centrality.
Calculating centrality measures on different subnetworks in the data builds understanding of which players in the ecosystem are the most important. In the case of the West
Bank and Gaza, the analysis reveals that investors are the most directly connected players and accelerators and incubators are the gateways in the ecosystem.
TABLE A.2: CENTRALITY OF KEY PLAYERS IN THE NETWORK
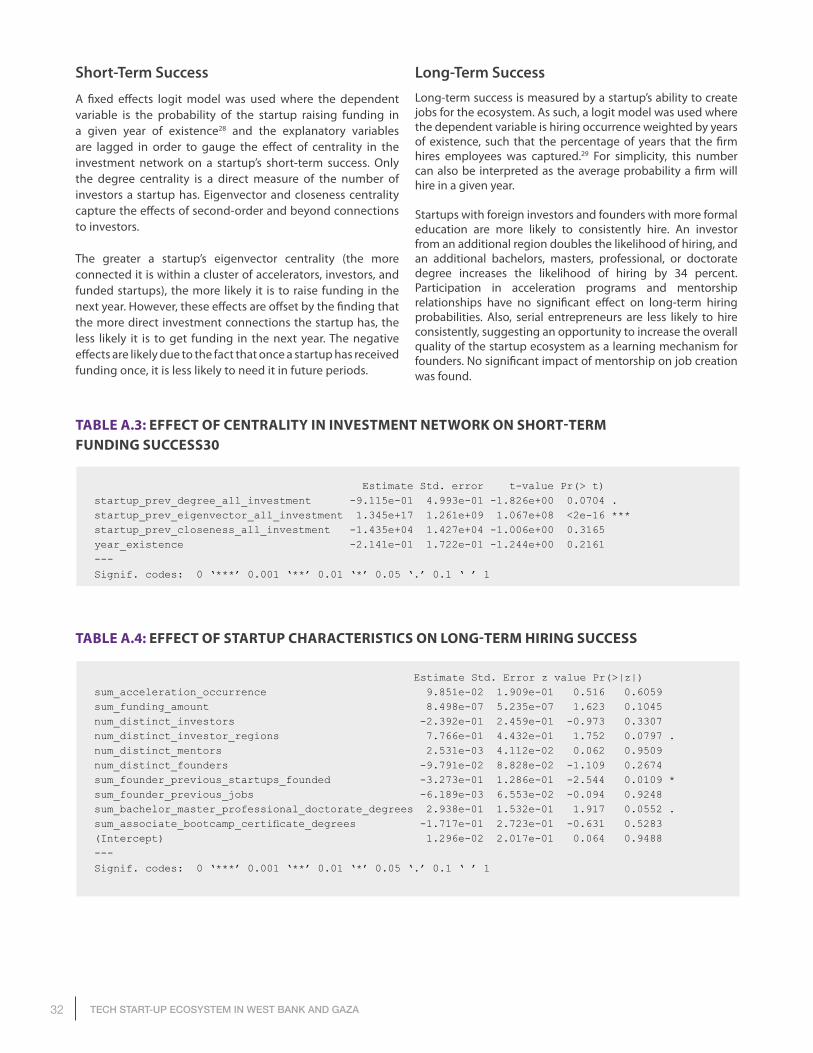
32 TECH START-UP ECOSYSTEM IN WEST BANK AND GAZA
Short-Term Success
A fixed effects logit model was used where the dependent variable is the probability of the startup raising funding in a given year of existence28 and the explanatory variables are lagged in order to gauge the effect of centrality in the investment network on a startup’s short-term success. Only the degree centrality is a direct measure of the number of investors a startup has. Eigenvector and closeness centrality capture the effects of second-order and beyond connections to investors.
The greater a startup’s eigenvector centrality (the more connected it is within a cluster of accelerators, investors, and funded startups), the more likely it is to raise funding in the next year. However, these effects are offset by the finding that the more direct investment connections the startup has, the less likely it is to get funding in the next year. The negative effects are likely due to the fact that once a startup has received funding once, it is less likely to need it in future periods.
Long-Term SuccessLong-term success is measured by a startup’s ability to create jobs for the ecosystem. As such, a logit model was used where the dependent variable is hiring occurrence weighted by years of existence, such that the percentage of years that the firm hires employees was captured.29 For simplicity, this number can also be interpreted as the average probability a firm will hire in a given year.
Startups with foreign investors and founders with more formal education are more likely to consistently hire. An investor from an additional region doubles the likelihood of hiring, and an additional bachelors, masters, professional, or doctorate degree increases the likelihood of hiring by 34 percent. Participation in acceleration programs and mentorship relationships have no significant effect on long-term hiring probabilities. Also, serial entrepreneurs are less likely to hire consistently, suggesting an opportunity to increase the overall quality of the startup ecosystem as a learning mechanism for founders. No significant impact of mentorship on job creation was found.
TABLE A.3: EFFECT OF CENTRALITY IN INVESTMENT NETWORK ON SHORT-TERM FUNDING SUCCESS30
Estimate Std. error t-value Pr(> t) startup_prev_degree_all_investment -9.115e-01 4.993e-01 -1.826e+00 0.0704 . startup_prev_eigenvector_all_investment 1.345e+17 1.261e+09 1.067e+08 <2e-16 ***startup_prev_closeness_all_investment -1.435e+04 1.427e+04 -1.006e+00 0.3165 year_existence -2.141e-01 1.722e-01 -1.244e+00 0.2161 ---
Signif. codes: 0 ‘***’ 0.001 ‘**’ 0.01 ‘*’ 0.05 ‘.’ 0.1 ‘ ’ 1
TABLE A.4: EFFECT OF STARTUP CHARACTERISTICS ON LONG-TERM HIRING SUCCESS
Estimate Std. Error z value Pr(>|z|) sum_acceleration_occurrence 9.851e-02 1.909e-01 0.516 0.6059 sum_funding_amount 8.498e-07 5.235e-07 1.623 0.1045 num_distinct_investors -2.392e-01 2.459e-01 -0.973 0.3307 num_distinct_investor_regions 7.766e-01 4.432e-01 1.752 0.0797 .num_distinct_mentors 2.531e-03 4.112e-02 0.062 0.9509 num_distinct_founders -9.791e-02 8.828e-02 -1.109 0.2674 sum_founder_previous_startups_founded -3.273e-01 1.286e-01 -2.544 0.0109 *sum_founder_previous_jobs -6.189e-03 6.553e-02 -0.094 0.9248 sum_bachelor_master_professional_doctorate_degrees 2.938e-01 1.532e-01 1.917 0.0552 .sum_associate_bootcamp_certificate_degrees -1.717e-01 2.723e-01 -0.631 0.5283 (Intercept) 1.296e-02 2.017e-01 0.064 0.9488 ---
Signif. codes: 0 ‘***’ 0.001 ‘**’ 0.01 ‘*’ 0.05 ‘.’ 0.1 ‘ ’ 1
33notes
Notes
1. As a reference for the sample size, the Investment Development Authority in Lebanon (IDAL) reported 800 companies in the IT sector, with 200 companies focused on software development, in Lebanon in 2005. See IDAL 2016.
2. https://startupgenome.com/.
3. http://www.digital.nyc/.
4. http://www.techmap.london/.
5. https://www.galidata.org/.
6. PCBS conducts an enterprise census, but it does not cover preincorporation activities and startups in the detail required for an analysis similar to the one presented in this report.
7. See “Outreach Strategy” in Appendix A for full list of partners.
8. See “Limitations” in Methodology section of Appendix A for more information on the limitations to the study approach.
9. See “Limitations” in Methodology section of Appendix A for more information on the limitations to the study approach.
10. The data collected for this analysis suffers from an inherent survivorship bias, the precise impact of which is difficult to quantify (see “Limitations” in Methodology section of Appendix A for more details).
11. Two outliers found in the survey, which are not tech startups, were excluded from this number: the Palestine Food Industries Union (2,000) and Nashaz TV Studio. These organizations are linked to only three founders and have extremely low centrality within the ecosystem.
12. Female founder participation in the West Bank and Gaza ecosystem is also above the 17 percent global average reported by CrunchBase (Teare 2017).
13. Of 415 instances of founding, only 62 percent (261) of those instances have the age of founders available.
14. http://nyctechmap.com/.
15. Of 415 instances of founding, only 53 percent (224) of those instances have the major of founders available.
16. Of 636 instances of work history at the time of founding, only 52 percent (336) have the job level of founders listed.
17. C-Level is an informal term used to collectively refer to a corporation’s most important senior executives.
18. In almost all regions, startups with at least one founder with previous management experience were more likely to be funded than startups without any founders with managerial backgrounds, and this multiplier ranged ~1.0-1.5.
19. Additional demographic or employment data about mentors was not requested.
20. Survey data does not represent aggregates of total investment in the ecosystem; analysis is focused on trends. Reported investment figures by VC describe their total investment on the ecosystem as reported in the interviews.
21. See, for example, Learning from Leading Startup Ecosystems, event organized by the Information Technology and Innovation Foundation, Washington DC, 2 May 2017. https://itif.org/events/2017/05/02/learning-worlds-leading-startup-ecosystems.
22. https://tampere.demola.net/.
23. https://tech.cornell.edu/jacobs-technion-cornell-institute/overview.
24. http://mobileworldcapital.com/numa-barcelona-primer-programa-europeo-dirigido-startups-fase-crecimiento/.
25. http://www.startupchile.org/.
26. http://www.k-startupgc.org/.
27. http://www.datacity.paris/.
28. The amount of funding raised was not taken into account, since this is heavily influenced by the type of business and prone to outliers.
29. The number of employees hired was not taken into account, since this is heavily influenced by the type of business and prone to outliers.
30. For this regression, startups were restricted to those founded after 2008 in order to avoid confounding influences from the global financial crisis.
31. http://gern.co/gern/ecosystem-connections-mapping.
34 TECH START-UP ECOSYSTEM IN WEST BANK AND GAZA
References
1. Baird, Ross, Lily Bowles, and Saurabh Lall. 2013. Bridging the “Pioneer Gap”: The Role of Accelerators in Launching High-Impact Enterprises. Aspen Network of Development Entrepreneurs and Village Capital. https://assets.aspeninstitute.org/ content/uploads/ les/content/docs/ande/Bridging%20 the%20Pioneer%20Gap%20The%20Role%20of%20 Accelerators%20in%20Launching%20High%20Impact%20 Enterprises%20.pdf.
2. Comin, Diego, and Martí Mestieri. 2014. “Technology Diffusion: Measurement, Causes and Consequences.” In Handbook of Economic Growth, Edition 1, Volume 2, Chapter 2, 565-622. https://ideas.repec.org/h/eee/grochp/2-565.html.
3. Comin, Diego, and Bart Hobijn. 2010. “An Exploration of Technology Diffusion.” American Economic Review 100 (December): 2031–2059. http://www.aeaweb.org/articles.php?doi=10.1257/aer.100.5.2031.
4. Endeavor Insight. 2014. The Power of Entrepreneur Networks: How New York City Became the Role Model for Other Urban Tech Hubs. New York: Endeavor Global. http://www.nyctechmap.com/nycTechReport.pdf.
5. IDAL. 2016. ICT Sector Statistics in Lebanon 2015. Beirut: Investment Development Authority of Lebanon http://www.investinlebanon.gov.lb/Content/uploads/SideBlock/160307124909480~ICT%20Statistics%202015.pdf.
6. I-DEV International. 2014. Measuring Value Created by Impact Incubators and Accelerators. I-DEV International, in conjunction with the Aspen Network of Development Entrepreneurs (ANDE) and Agora Partnerships. https://assets.aspeninstitute. org/content/uploads/ les/content/docs/resources/ ANDE%20I-DEV%20INCUBATOR%20REPORT%2011-21- 14%20FINAL%20FOR%20DISTRIBUTION.pdf.
7. Isaksson, Anders, Thiam Hee Ng, and Ghislain Robyn. 2005. Productivity in Developing Countries: Trends and Policies. Vienna: UNIDO. https://www.unido.org/sites/default/files/2009-04/Productivity_in_developing_countries_trends_and_policies_0.pdf.
8. Mulas, Victor, Michael Minges, and Hallie Applebaum. 2015. Boosting Tech Innovation Ecosystems in Cities: A Framework for Growth and Sustainability of Urban Tech Innovation Ecosystems. Washington, DC: World Bank. https://openknowledge.worldbank.org/handle/10986/23029.
9. Mulas, Victor, and Mikel Gastelu-Iturri. 2016. New York City: Transforming a City into a Tech Innovation Leader. World Bank, Washington, DC: World Bank. https://openknowledge.worldbank.org/handle/10986/25753.
10. Mulas, Victor, Kathy Qian, and Stanley Scott Henry. 2017a. Tech Start-up Ecosystem in Beirut: Findings and Recommendations. Washington, DC: World Bank Group. http://documents.worldbank.org/curated/en/702081504876957236/Tech-start-up-ecosystem-in-Beirut-findings-and-recommendations.
11. Mulas, Victor, Kathy Qian, and Stanley Scott Henry. 2017b. Tech Start-up Ecosystem in Dar es Salaam: Findings and Recommendations. Washington, DC: World Bank Group. http://documents.worldbank.org/curated/en/905101503998069531/Tech-start-up-ecosystem-in-Dar-es-Salaam-findings-and-recommendations.
12. Roberts, Peter W., Saurabh Lall, and Ross Baird. 2016. What’s Working in Startup Acceleration: Insights from Fifteen Village Capital Programs. Emory University, Aspen Network of Development Entrepreneurs, and Village Capital. https://www.lemelson.org/sites/default/files/Whats%20Working%20in%20Startup%20Acceleration.pdf.
13. Palestine Economic Policy Research Institute (MAS). 2013. Palestine Country Report 2012. Global Entrepreneurship Monitor. http://www.mas.ps/page.php?id=107c1y67521Y107c1.
14. ScaleUp Institute. 2014. The Scale-Up Report on UK Economic Growth. London: ScaleUp Institute. http://www.scaleupinstitute.org.uk/scale-up-report/.
15. Teare, Gené. 2017. “In 2017, Only 17% of Startups Have a Female Founder.” TechCrunch, 19 April. https://techcrunch.com/2017/04/19/in-2017-only-17-of-startups-have-a-female-founder/.
16. World Bank. 2017a. Palestinian Territories: Enhancing Job Opportunities for Skilled Women. Washington, DC: World Bank.
17. World Bank. 2017b. Coding Bootcamps: Building Future-Proof Skills through Rapid Skills Training. World Bank, Washington, DC: World Bank. https://openknowledge.worldbank.org/handle/10986/28218.

35references
This work is available under the Creative Commons Attribution Non-Commercial 3.0 IGO license (CC BY NC 3.0 IGO). Under the Creative Commons Attribution Non-Commercial license, you are free to copy, distribute, transmit, and adapt this work for non-commercial purposes, under the following conditions: Attribution—Please cite this work as follows: World Ban k. 2018. Tech Startup Ecosystem in West Bank and Gaza.; and Henry, Scott. 2017. Tech Start-up Ecosystem in West Bank and Gaza. Findings and Recommendations. License—Creative Commons Attribution Non-Commercial CC 3.0 IGO Translations—If you create a translation of this work, please add the following disclaimer along with the attribution: This translation was not created by The World Bank and should not be considered an official World Bank translation. The World Bank shall not be liable for any content or error in this translation. Adaptations—If you create an adaptation of this work, please add the following disclaimer along with the attribution: This is an adaptation of an original work by The World Bank. Responsibility for the views and opinions expressed in the adaptation rests solely with the author or authors of the adaptation and are not endorsed by The World Bank. Third-party content—The World Bank does not necessarily own each component of the content contained within the work. The World Bank therefore does not warrant that the use of any third-party-owned individual component or part contained in the work will not infringe on the rights of those third parties. The risk of claims resulting from such infringement rests solely with you. If you wish to re-use a component of the work, it is your responsibility to determine whether permission is needed for that re-use and to obtain permission from the copyright owner. Examples of components can include, but are not limited to, tables, figures, or images. All queries on rights and licenses should be addressed to the Publishing and Knowledge Division, The World Bank, 1818 H Street NW, Washington, DC 20433, USA; fax: 202-522-2625; e-mail: pubrights@ worldbank.org