public disclosure, risk, and performance at bank holding companies
TRANSCRIPT

This paper presents preliminary findings and is being distributed to economists and other interested readers solely to stimulate discussion and elicit comments. The views expressed in this paper are those of the author and do not necessarily reflect the position of the Federal Reserve Bank of New York or the Federal Reserve System. Any errors or omissions are the responsibility of the author.
Federal Reserve Bank of New York Staff Reports
Public Disclosure and Risk-Adjusted Performance at Bank Holding Companies
Beverly Hirtle
Staff Report No. 293
July 2007 Revised February 2015

Public Disclosure and Risk-Adjusted Performance at Bank Holding Companies Beverly Hirtle Federal Reserve Bank of New York Staff Reports, no. 293 July 2007; revised February 2015 JEL classification: G21, G32, G28
Abstract This paper examines the relationship between the amount of information disclosed by bank holding companies (BHCs) and their subsequent risk-adjusted performance. Using data from the annual reports of BHCs with large trading operations, we construct an index of publicly disclosed information about the BHCs’ forward-looking estimates of market risk exposure in their trading and market-making activities. The paper then examines the relationship between this index and subsequent risk-adjusted returns in the BHCs’ trading activities and for the firm overall. The key finding is that more disclosure is associated with higher risk-adjusted returns. This result is strongest for BHCs where trading represents a large share of overall firm activity. More disclosure does not appear to be associated with higher risk-adjusted performance during the financial crisis, however, suggesting that the findings are a “business as usual” phenomenon. These findings suggest that greater disclosure is associated with more efficient risk-taking and thus improved risk-return tradeoffs, a channel for market discipline that has not been emphasized previously in the literature.
Key words: disclosure, value at risk, market discipline, banking _________________
Hirtle: Federal Reserve Bank of New York (e-mail: [email protected]). This paper was previously distributed under the title “Public Disclosure, Risk, and Performance at Bank Holding Companies.” The author thanks Sarita Subramanian, Matthew Botsch, Ging Cee Ng, Peter Hull, Vitaly Bord, Eric McKay, and Bryan Yang for excellent research assistance in constructing the data set used in this paper, and Bob DeYoung, Mark Flannery, Don Morgan, Christophe Pérignon, Philip Strahan, and Til Schuermann for helpful comments and suggestions. Any remaining errors are solely those of the author. The views expressed in this paper are those of the author and do not necessarily reflect the position of the Federal Reserve Bank of New York or the Federal Reserve System.
I. Introduction Market discipline has occupied an increasingly prominent place in discussions of the
banking industry in recent years. Market discipline is the idea that the actions of shareholders,
creditors, and counterparties of banking companies can influence the investment, operational, and
risk-taking decisions of bank managers (Flannery 2001, Bliss and Flannery 2002). Bank
supervisors have embraced market discipline as a complement to supervisory and regulatory tools
for monitoring risk at individual banks and for limiting systemic risk in the banking system. For
instance, the Basel Committee on Banking Supervision says “the provision of meaningful
information about common risk metrics to market participants is a fundamental tenet of a sound
banking system. It reduces information asymmetry and helps promote comparability of banks’
risk profiles…” (Basel Committee on Banking Supervision 2015).1
For market discipline to be effective, market participants must have sufficient
information to assess the current condition and future prospects of banking companies. This
realization has prompted a range of proposals for enhanced public disclosure by banks. Many of
these proposals have focused on disclosure of forward-looking risk information, such as value-at-
risk (VaR) for trading portfolios or model-based estimates of credit risk exposure. In the words
of a major international supervisory group, disclosure of VaR and other forward-looking risk
measures is a means of providing “a more meaningful picture of the extent and nature of the
financial risks a firm incurs, and of the efficacy of the firm’s risk management practices”
(Multidisciplinary Working Group on Enhanced Disclosure 2001).
But to what extent does such information result in meaningful market discipline? Is risk-
taking or performance affected by the amount of information banks provide about their risk
exposures and risk management systems? This paper examines these questions by looking at how
the amount of information disclosed by a sample of large U.S. bank holding companies (BHCs)
1 The Basel II/III regulatory capital regime incorporates market discipline as the “third pillar” along with minimum capital standards and supervisory oversight (Basel Committee on Banking Supervision 2004).
1

affects their future risk-adjusted performance. We focus in particular on disclosures made in the
banks’ annual reports about market risk in their trading activities. Following previous work on
disclosure (Baumann and Nier 2004, Nier and Baumann 2006, Pérignon and Smith 2010, Zer
2014), we construct a market risk disclosure index and ask how differences in this index affect
future performance. Using data from the banking companies’ regulatory reports, we examine the
returns from trading activities and, using equity market data, we also examine returns for the firm
as a whole.
The main findings of this analysis are that disclosing more information is associated with
higher risk-adjusted trading returns and higher risk-adjusted market returns for the bank overall.
This result is strongest for BHCs where trading represents a large share of overall firm activity.
The results are economically meaningful as well as statistically significant, with a one standard
deviation increase in the disclosure index leading to a 0.35 to 0.60 standard deviation increase in
risk-adjusted returns. The positive relationship between disclosure and risk-adjusted performance
is much less evident during the financial crisis period, however, suggesting that the findings
reflect business-as-usual behavior. Finally, while higher values of the disclosure index are
associated with better future performance, being a leader or innovator in disclosure practices
seems to be associated with lower risk-adjusted market returns. This finding suggests there may
be a learning process in the market, such that disclosure “first movers” who provide new types of
information face a market penalty.
Overall, the results suggest that increased disclosure may be associated with more
efficient trading and an enhanced overall risk-return tradeoff. These findings seem consistent
with market discipline affecting not just on the amount of risk a BHC takes, but how efficiently it
takes that risk. This interpretation highlights the importance of examining returns, as well as risk,
when assessing the effectiveness of market discipline.
An important question in interpreting these results is whether greater disclosure leads to
enhanced market discipline and thus better performance, or whether some other channel is at
2
work. Specifically, banks with better risk management systems may be able to trade more
efficiently and, more generally, be able to generate a better risk-return tradeoff. The same risk
management systems that produce better risk-adjusted performance may also generate the
information needed to make more detailed risk disclosures, which may be used by the bank as a
public signal of their superior risk management abilities. This may not be the traditional view of
market discipline, but it is consistent with the idea that the role of public information is to provide
incentives for managers to optimize overall performance. This interpretation highlights that there
are many potential channels for the exercise of market discipline on firms.
The remainder of this paper is organized as follows. Section II reviews previous work on
the impact of disclosure in the banking industry, and discusses how this paper fits into that
literature. Section III describes the empirical approach and data used in this analysis, with
particular emphasis on the market risk disclosure index. Section IV presents the results, while the
final section contains summary and conclusions.
II. Disclosure and Bank Performance
A number of previous papers have examined the impact of disclosure in the banking
industry. The key idea is that disclosure of information about banks’ current condition and future
prospects will facilitate market discipline of risk-taking behavior. As argued in Flannery (2001)
and Bliss and Flannery (2002), market discipline has two distinct components: investors and
creditors’ ability to monitor and assess changes in bank condition, and their ability to influence
management behavior. Both are affected by the amount and quality of information disclosed. In
theory, greater disclosure provides more information on which investors and creditors can make
their assessments of firm condition, which in turn makes a significant market reaction to an
adverse change in condition – and subsequent management response – more likely and
immediate.
Market discipline may influence banks’ behavior not only in response to a market
reaction, but also in anticipation of one. That is, market discipline may also work by affecting
3

management behavior ex ante so as to prevent a negative outcome and consequent market
reaction. In this sense, greater disclosure can serve as a kind of commitment device by providing
sufficient information to the market about a bank’s condition and future prospects that it is
constrained from altering its risk profile in a way that disadvantages either investors or creditors
(Cumming and Hirtle 2001). Banks’ ability to shift assets and risk positions quickly has been
cited as one of the key sources of opaqueness in the banking industry (Meyers and Rajan 1998).
In fact, several studies have found evidence of greater opaqueness at banks with higher shares of
liquid assets, including especially trading positions (Morgan 2002, Iannotta 2006, Hirtle 2006).2
In a related vein, Bushman and Williams (2012) find that loan loss provisioning practices
intended to smooth earnings inhibit risk-taking discipline by making banks more opaque to
outsiders.
Underlying much of this discussion is the idea that greater disclosure and enhanced
market discipline will lead to reductions in bank risk. Enhanced market discipline would mean
the costs of increased risk would be more fully borne by the bank and presumably play a larger
role in its risk-taking decisions. More risk-sensitive market prices could also provide signals to
regulators that might induce or influence supervisory action (Flannery 2001). Offsetting these
factors, however, more information reduces the likelihood that the bank would face an excessive
(undeserved) risk premium or that market prices will over-react to news about the firm due to
uncertainty about its true condition and prospects. This could lower its funding costs and increase
the range of viable (positive net present value) investments, some of which could be riskier than
its current portfolio. The net impact of these influences is an empirical question.
Most of the previous empirical work on market discipline has focused on how disclosure
affects bank risk-taking. For instance, several papers examine market price reaction to changes in
bank condition or to differences across banks in risk profiles. Some of these papers have found
2 In contrast, Flannery et al. (2004) finds no evidence that bank assets are more opaque than the assets of non-financial firms.
4
that bond spreads increase with bank risk exposure, especially since the early-1990s reforms
associated with the Federal Deposit Insurance Corporation Improvement Act. Morgan and Stiroh
(2001) find that banks with riskier assets (e.g., trading assets) pay higher credit spreads on newly
issued bonds. Similarly, Covitz et al. (2004a, 2004b) and Jagtiani et al. (2004) find evidence that
subordinated debt spreads increase with banking company risk. In related work, Goyal (2005)
finds that riskier banks are more likely to have restrictive debt covenants in their publicly issued
debt. However, more recent work (Balasubramnian and Cyree 2011, Acharya et al. 2014, Santos
2014) suggests that the bonds of the largest banking companies are less sensitive to risk than
bonds issued by smaller BHCs, presumably because these firms are regarded by market
participants as “too big to fail.” These papers call into the question the efficacy of market
discipline, at least for the very largest and most complex bank holding companies.
In a somewhat different vein, several papers have examined the impact of disclosure on
risk-taking using equity trading characteristics – such as bid-asked spreads or price volatility – as
proxies for risk.3 Many of these studies focus on non-financial firms (for example, Bushee and
Noe 2000, Luez and Verrecchia 2000, Linsmeier et al. 2002), but some examine the link between
disclosure and market volatility in the banking industry. Baumann and Nier (2004) and Nier and
Baumann (2006) construct a disclosure index based on the number of balance sheet and income
statement items reported by a cross-country sample of banks. They find that stock price volatility
decreases and capital buffers increase as the amount of information disclosed increases,
consistent with the idea that greater disclosure enhances market discipline. Zer (2014) constructs
a disclosure index using balance sheet information from BHC 10-K filings and shows that BHCs
with higher values of the index have lower option-implied default probabilities and stock price
volatility.
3 Using a very different approach, Kwan (2004) examines the impact of market discipline on bank risk-taking by comparing the risk profiles of publicly traded and non-publicly traded bank holding companies. He finds that publicly traded banks take more risk than non-publicly traded institutions, which he interprets as being contrary to market discipline.
5
Fewer papers have examined the relationship between disclosure and performance – that
is, whether banking companies that disclose more information have better subsequent operating
or stock market performance. Several papers have examined this relationship for non-financial
firms. Eugster and Wagner (2011) construct an index of voluntary disclosure by Swiss
companies and demonstrate that firms with higher voluntary disclosure have higher abnormal
stock returns, though this effect is evident predominantly for more opaque companies. Barth et
al. (2013) find that firms with more transparent earnings have a lower cost of capital. In the
banking industry, Ellul and Yerramelli (2013) find that banks with stronger risk management
have higher operating profits (return on assets) and stock return performance. While this paper
focuses on risk management rather than disclosure per se, it measures risk management strength
based on an index constructed from 10-K filings, similar to the approach used in this and other
papers focusing on disclosure. The paper is also relevant because risk management and
disclosure are linked in that enhanced risk management systems generate the kind of forward-
looking risk information disclosed by some BHCs.
The analysis in this paper is complementary to previous work on disclosure in that it
examines the impact of enhanced disclosure on both operating and stock market performance for
large U.S. bank holding companies. In particular, the analysis examines whether enhanced
disclosure is associated with higher subsequent risk-adjusted performance. The analysis thus
assesses whether disclosure affects the efficiency of risk-taking, rather than whether enhanced
disclosure is associated with higher or lower risk per se. As noted above, the theoretical
relationship between disclosure and risk-taking is not straightforward and there is likely
considerable endogeneity between disclosure and subsequent risk.4 While the extent of both risk-
taking and disclosure are decisions made by each banking company, risk-adjusted performance is
an outcome that is less directly under each firm’s control. Examining performance provides an
4 Ellus and Yerrimilli (2013) and Zer (2014) use instrumental variable techniques to address this endogeneity.
6
additional window into the ways that market discipline may play out at banking companies, since
investors and creditors presumably care not only about the level of risk, but also about how
efficiently a bank translates its risk exposures into profits and returns.
Like much of the prior work, the analysis in this paper is based on a disclosure index
constructed from information reported by these banks in their annual reports and 10-K filings
with the SEC. However, rather than constructing a disclosure index based primarily on balance
sheet and income statement variables – which tend to be backward-looking – the disclosures we
track are forward-looking risk estimates made by the banking companies.5 The index focuses
specifically on disclosures concerning the market risk in banks’ trading and market-making
activities.
We focus on market risk in trading activities because trading is a well-defined banking
business activity with distinct regulatory and financial statement reporting. Bank holding
company annual reports have specific sections for reporting about market risk, and regulatory
reports contain trading return information that can be linked directly to these activities. Thus, we
can examine the impact of disclosure on overall firm performance, and on the specific activities
that are the focus of the disclosures. Previous work has also found that trading activities are
associated with greater opaqueness and risk, so this is an area of banking for which disclosure
might be particularly influential.
III. Data and Empirical Approach
This section describes the data and empirical approach used to assess the impact of
disclosure on BHC risk and performance. Since we are interested in the impact of disclosures
relating to market risk in trading activities, we begin by constructing a sample of U.S.-owned
BHCs that appear to be active traders. We limit the sample to those BHCs with significant
trading activities, since these are the firms that are most likely to make some kind of market-risk-
related disclosures in their annual reports. BHCs that are relatively active traders are also more
5 As discussed below, the index is similar to the one constructed in Pérignon and Smith (2010).
7
likely to be engaged in purposeful risk management of their trading positions, rather than using
the trading account simply to book a limited number of mark-to-market positions.
We use information from the Federal Reserve’s Y-9C reports of balance sheet and
income statement data for bank holding companies to identify BHCs with significant trading
account assets.6 Overall, relatively few BHCs report holding any assets in the trading account: at
year-end 2013, only 164 (of more than 1000) large BHCs reported holding any trading account
assets, and only 18 of these held trading assets exceeding $1 billion. Our sample consists of all
U.S.-owned BHCs with year-end trading account assets exceeding $1 billion (in 2013 dollars) at
some point between 1994 and 2012.7 We include a BHC in the sample starting with the first year
in which its constant-dollar trading assets exceed $500 million. The resulting sample consists of
293 observations from 36 BHCs over the years 1994 to 2012.8
The estimates consist of a series of regressions of risk-adjusted performance measures in
year t+1 on BHC characteristics and disclosure during year t:
1ti,εΓti,Χti,Disclosure1β1ti,Y +++=+
where Yi,t+1 is the risk-adjusted performance measure (discussed below), Disclosurei,t is the index
of market risk disclosure, and Xi,t is a vector of BHC control variables. Both the disclosure index
and the control variables are lagged one year to avoid endogeneity with the performance
measures. Thus, disclosure data and control variables from 1994 to 2012 are paired with
performance data from 1995 to 2013.
6 The Y-9C reports are available at http://www.chicagofed.org/economic_research_and_data/bhc_data.cfm. 7 We dropped foreign-owned BHCs because the U.S. activities of these institutions represent only a part of the banks’ overall activities and because many of them do not make 10-K filings with the SEC, which we need to construct the market risk disclosure index. In addition, two U.S. BHCs whose activities are primarily non-banking in nature – Metlife and Charles Schwab – are dropped from the sample. 8The sample is an unbalanced panel, due mainly to the impact of mergers. During the sample period, several of the BHCs were acquired in a merger, generally by other BHCs in the sample. In addition, BHCs in the sample sometimes acquired large BHCs that were not part of the sample. In estimates, we treat the pre- and post-merger acquiring BHC as separate entities. Observations involving a merger year are dropped. Finally, some BHCs enter the sample mid-way through the sample period, as their trading assets crossed the $500 million threshold, or as they converted to bank holding companies during the financial crisis.
8
The control variables include measures of institution size (the log of assets), risk profile
(the ratio of risk-weighted assets to total assets and the ratio of common equity to total assets),
revenue composition (non-interest income as a share of operating income), and revenue
concentration (Herfindahl-Hirschman Indices based on sources of revenue9). The regressions
also include the ratio of trading assets to total assets as a measure of the extent of the institution’s
trading activities. All BHC data are from the Y-9C reports. The regressions also include BHC
fixed effects and year dummies. Table 1 reports the basic statistics of the regression data set.
The key variables in the estimates are the measures of risk-adjusted performance and the
market risk disclosure index. The risk-adjusted performance measures are based on two distinct
sets of information. The first is derived from accounting data on BHCs’ trading activities.
Specifically, BHC regulatory reports contain information on quarterly trading revenues, the gains
and losses on the firms’ trading activities, including commission, fee, and spread income. We
collect trading performance data from Q1 1995 to Q4 2013. Using these data, we calculate
quarterly trading return as trading revenue in a quarter as a percent of beginning-of-quarter
trading assets. Trading Volatility is then calculated as the standard deviation of quarterly trading
return within a year, and Trading Return is calculated as the annual average of quarterly trading
return. Finally, Risk-adjusted Trading Return equals Trading Return divided by Trading
Volatility (essentially, the trading revenue “Sharpe ratio”). Since this measure reflects risk and
return on the BHCs’ trading activities, it is tied directly to the disclosure information covered in
the market risk disclosure index.
The second set of measures is derived from firm-wide equity prices. Specifically, we use
stock return data from the University of Chicago’s Center for Research in Security Prices (CRSP)
for the BHCs in our sample. For each year between 1995 and 2013, we cumulate daily returns
from CRSP to form weekly returns, and then calculate annual average weekly returns, expressed
9 The revenue concentration index is based on the shares of net interest income, fiduciary income, deposit service charges, trading revenue, and other non-interest income in overall operating income. Stiroh (2006) shows that revenue concentration is a significant determinant of BHC equity price volatility.
9
at an annual rate. We also calculate the standard deviation of weekly returns within each year,
and generate Risk-Adjusted Market Returns as the ratio of average returns to the standard
deviation of returns. As a second measure of risk-adjusted market performance, the data set also
includes the “alpha” (intercept term) from the three-factor Fama-French model, where the model
is estimated annually for each BHC using weekly return data and risk factors.
Basic statistics for all the risk and performance measures are reported in Table 1.
The market risk disclosure index is the other key variable in the analysis. As discussed
above, this index captures the amount of information banks disclose about their forward-looking
estimates of market risk exposure in their 10-K (annual report) filings with the Securities and
Exchange Commission (SEC). 10 The index covers 18 specific types of information that BHCs
could provide in their 10-K filings, primarily related to their value-at-risk (VaR) estimates.
Value-at-risk is a very commonly used measure of market risk exposure from trading
activities. VaR is an estimate of a particular percentile of the trading return distribution, assuming
that trading positions are fixed for a specified holding period. VaR estimates made by banks in
the sample are typically based on a one-day holding period, with distribution percentiles generally
at the 95th and above.11 VaR estimates form the base of banks’ regulatory capital requirements
for market risk (Hendricks and Hirtle 1997) and have been the focus of disclosure
recommendations made by financial industry supervisors (Multidisciplinary Working Group on
Enhanced Disclosure 2001, Basel Committee on Banking Supervision 2015).
The 18 items covered in the market risk disclosure index include information about a
BHC’s VaR estimates for its entire trading portfolio (“overall VaR”), VaR by risk type (e.g., risk
from interest rate or equity price movements), the historical relationship between VaR estimates
and subsequent trading returns (“backtesting”), the distribution of actual trading outcomes
10 We used the SEC’s EDGAR database to find the 10-K filings. The EDGAR database is available at: http://www.sec.gov/edgar.shtml. 11 See Jorion (2006) for an extensive discussion of VaR modeling, and Moody’s Investors Services (2006) for a description of typical VaR parameter choices at banks and securities firms.
10
(“returns distribution”), and stress testing. The specific items included in the index are listed in
Table 2. These items were selected based on a review of a sample of BHC disclosures to
determine which items were disclosed with enough frequency to be meaningfully included in the
index, and also by benchmarking the individual items and the five broader categories against
those listed in a rating agency evaluation of banks’ disclosure practices (Moody’s Investors
Service 2006).
The market risk disclosure index measures the amount of information that BHCs disclose
about their market risk exposures, not the content of that information. It is a count of the number
of data items disclosed, not an indicator of the amount or nature of market risk exposure
undertaken by the BHC. In that sense, it is similar to the disclosure indices constructed by Nier
and Baumann (2006) and Zer (2014), though based on different types of data. It is also quite
similar to a VaR disclosure index developed independently by Pérignon and Smith (2010). The
Pérignon and Smith (2010) index covers much of the same information as the index in this paper,
though they use their index primarily to make cross-country comparisons of disclosure practices
rather than to examine the link between the index and future risk and performance.12
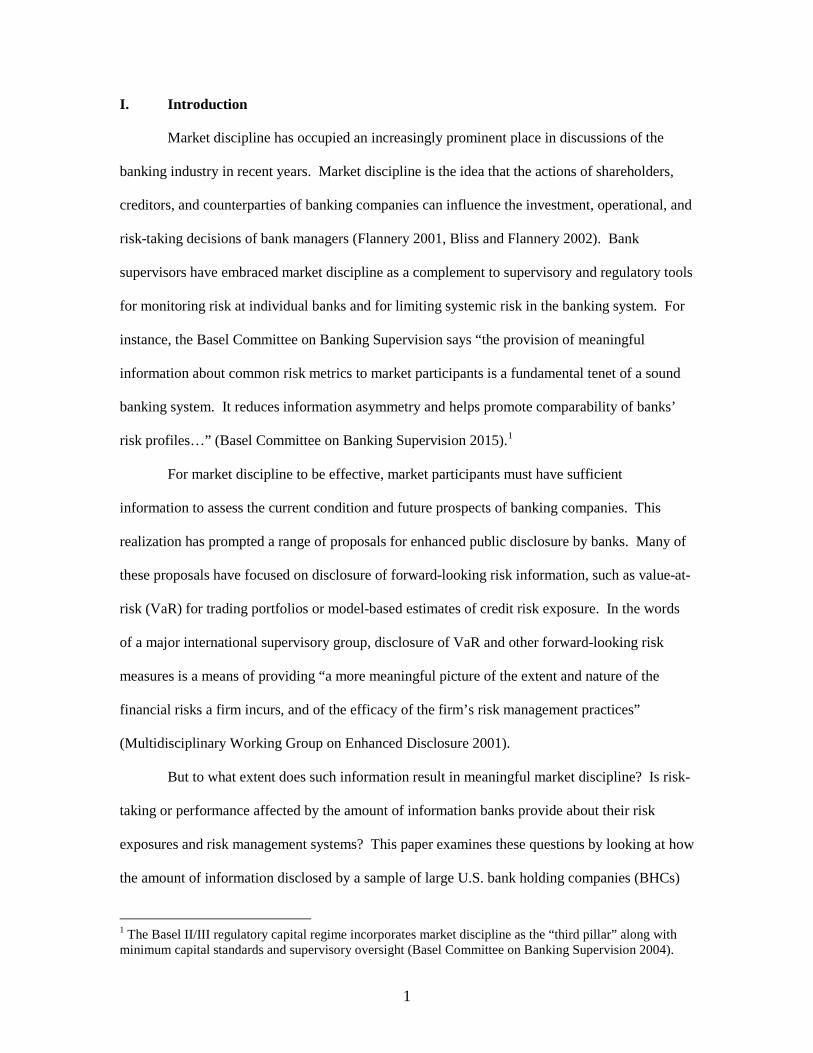
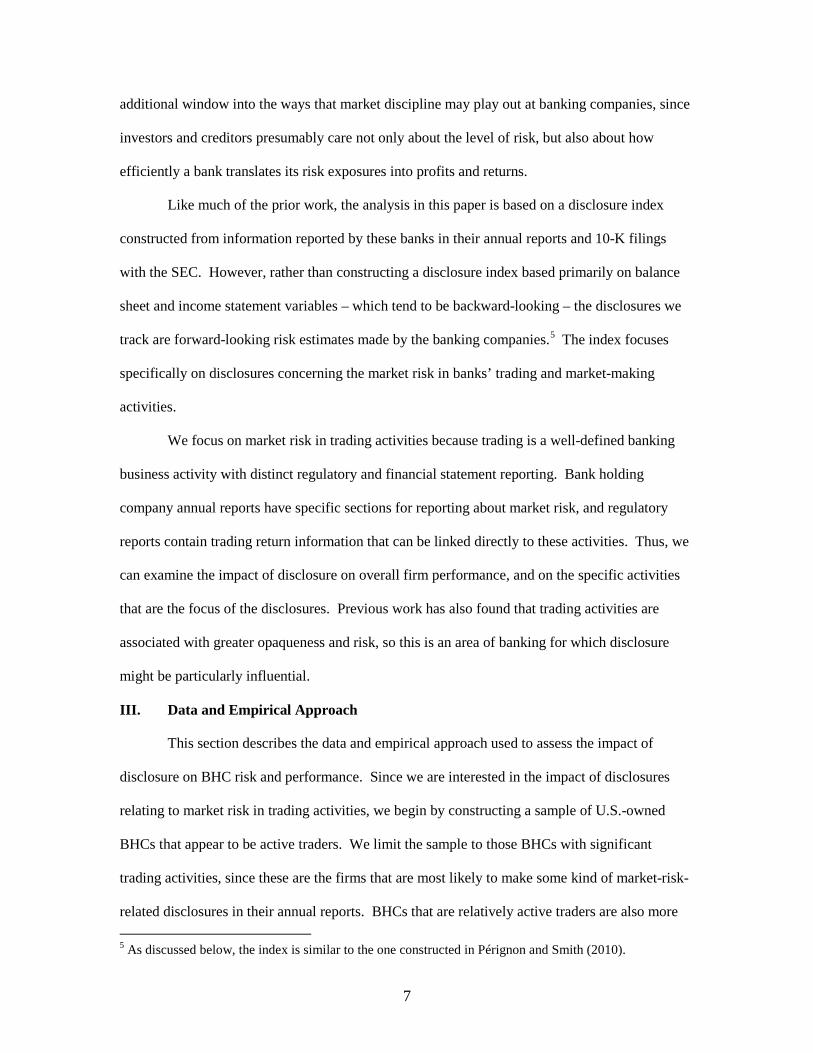
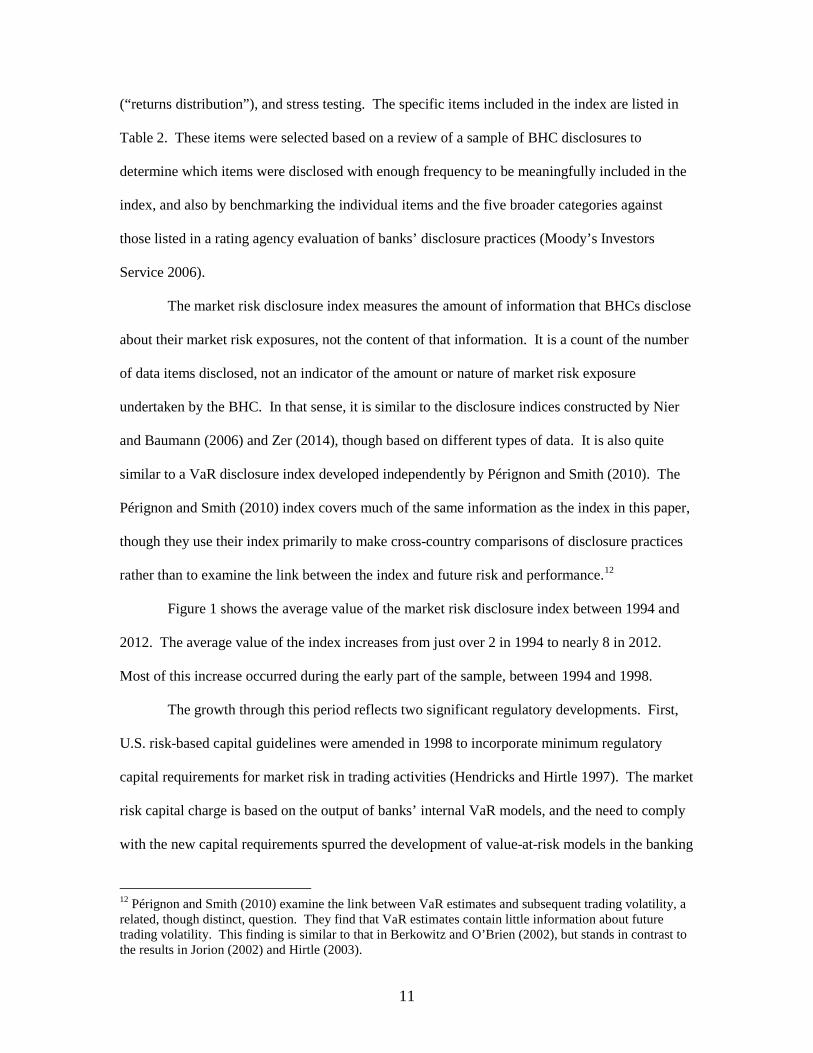
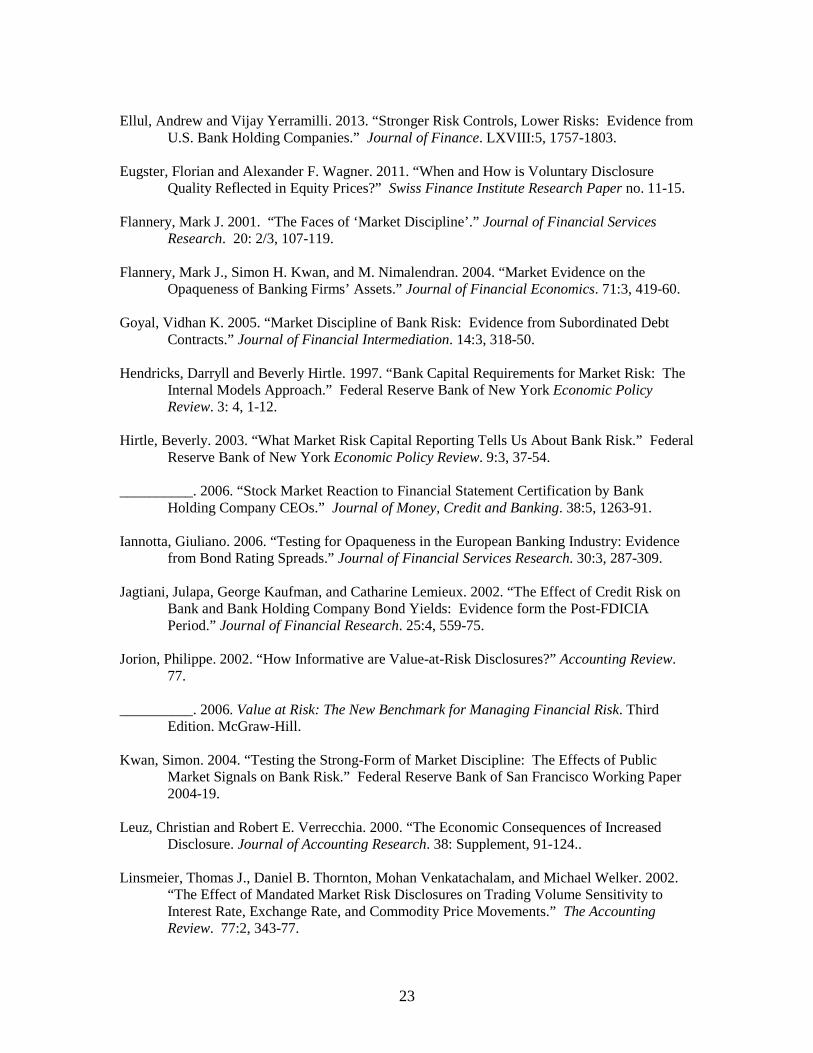
Figure 1 shows the average value of the market risk disclosure index between 1994 and
2012. The average value of the index increases from just over 2 in 1994 to nearly 8 in 2012.
Most of this increase occurred during the early part of the sample, between 1994 and 1998.
The growth through this period reflects two significant regulatory developments. First,
U.S. risk-based capital guidelines were amended in 1998 to incorporate minimum regulatory
capital requirements for market risk in trading activities (Hendricks and Hirtle 1997). The market
risk capital charge is based on the output of banks’ internal VaR models, and the need to comply
with the new capital requirements spurred the development of value-at-risk models in the banking
12 Pérignon and Smith (2010) examine the link between VaR estimates and subsequent trading volatility, a related, though distinct, question. They find that VaR estimates contain little information about future trading volatility. This finding is similar to that in Berkowitz and O’Brien (2002), but stands in contrast to the results in Jorion (2002) and Hirtle (2003).
11

industry. On a separate track, SEC Financial Reporting Release (FRR) 48 required all public
firms with material market risk exposure to make enhanced quantitative and qualitative
disclosures about their exposures, starting in 1997 (U.S. Securities and Exchange Commission
1997). FRR 48 included three options for forward-looking, quantitative market risk disclosures,
one of which was value-at-risk.13 Together, these two regulatory developments spurred
disclosure of VaR estimates and related information.
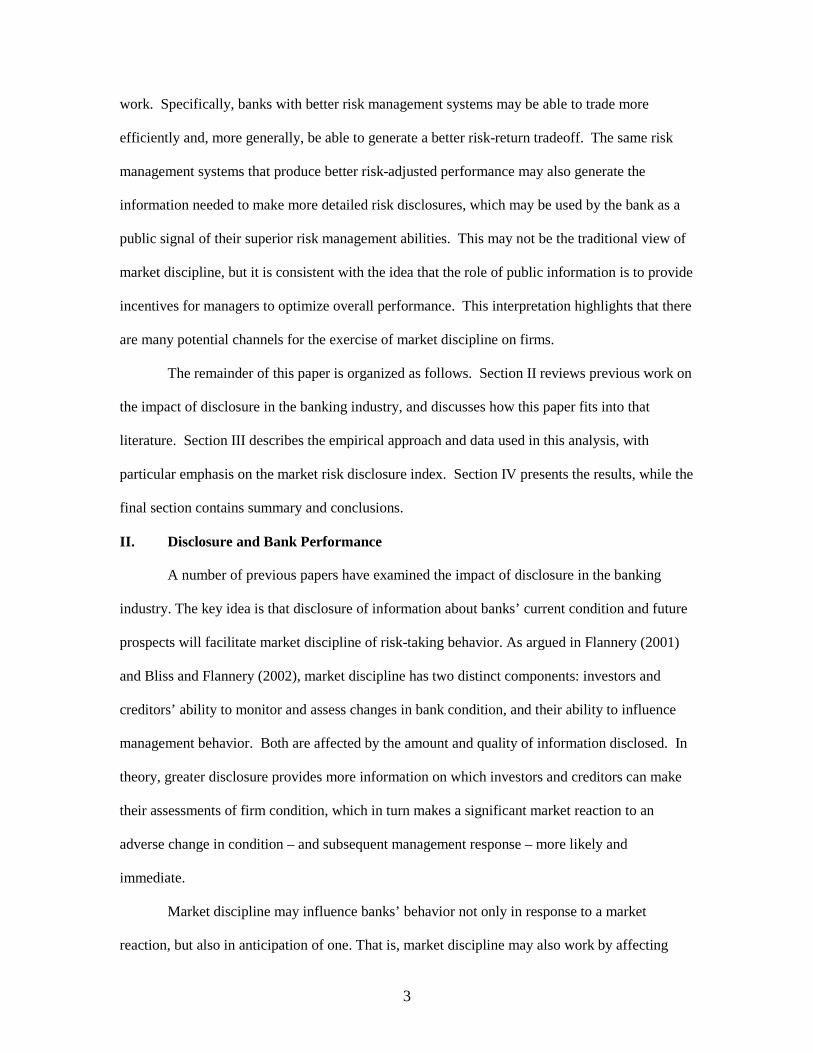
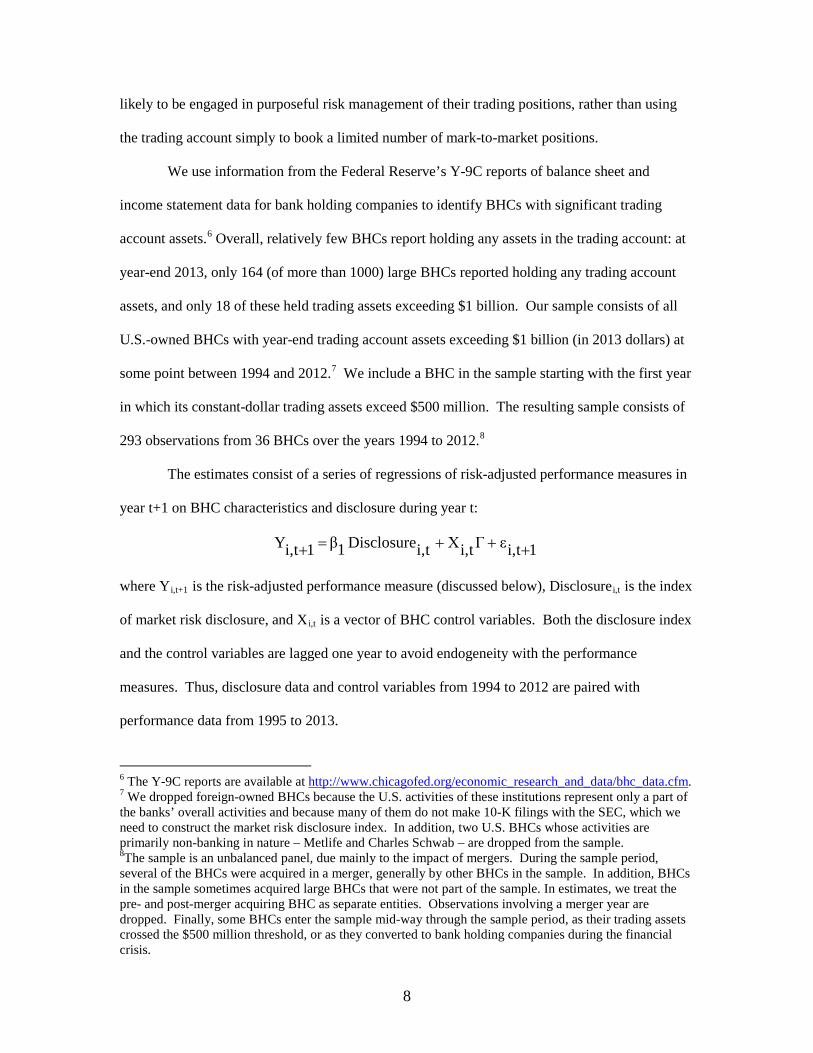
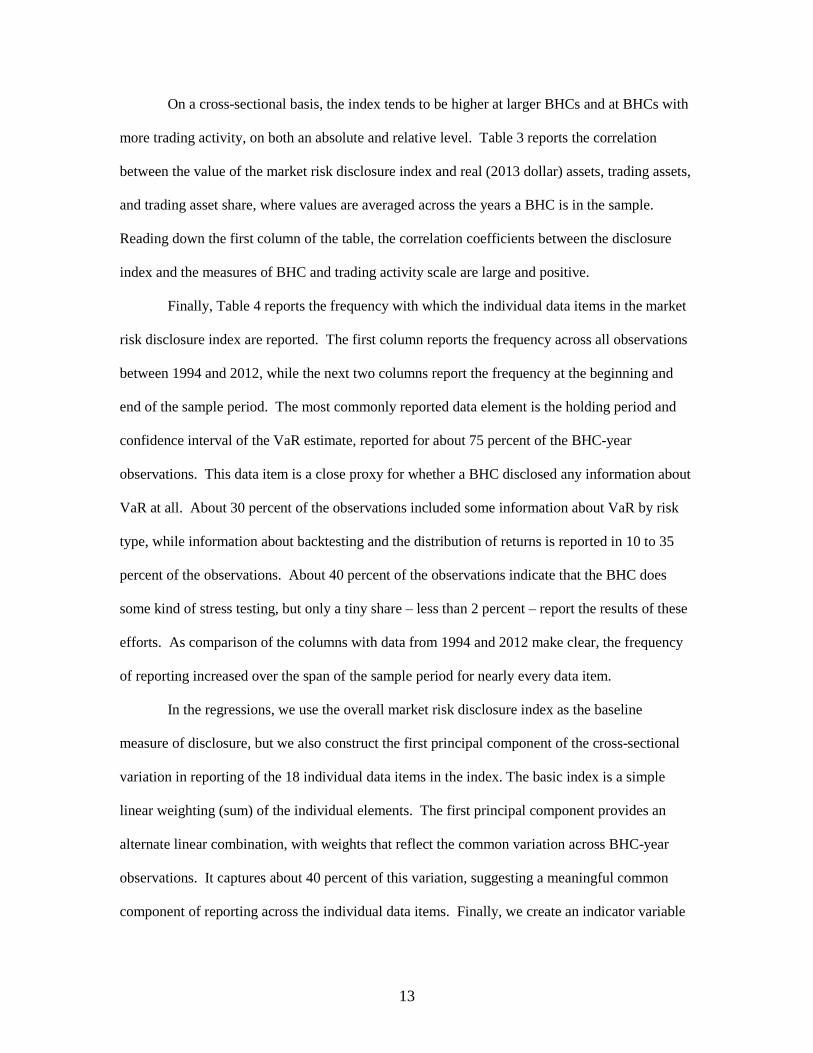
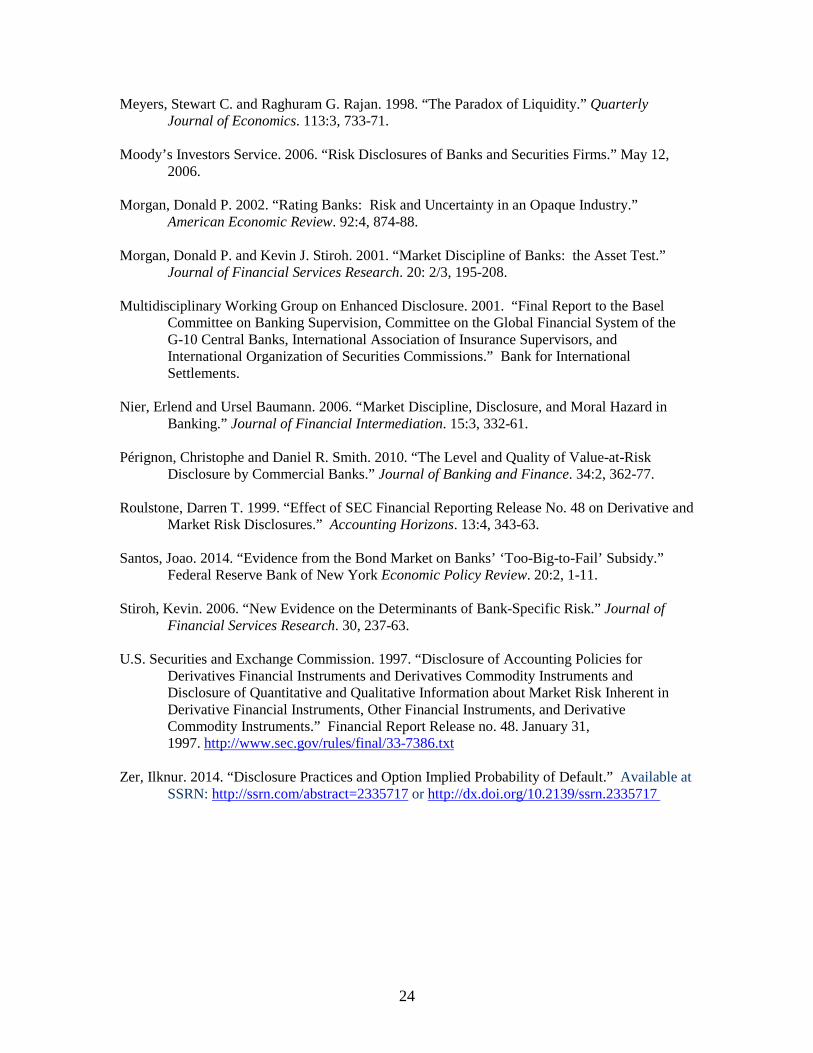
Figure 1 shows the average value of the market risk disclosure index, but the average
masks considerable diversity across BHCs in the sample. Figure 2 illustrates the range of
disclosure index values by year. Specifically, the chart shows the minimum and maximum values
of the index by year, the 25th and 75th percentiles, along with the averages reported in Figure 1.
The maximum value of the index grows from 7 in 1994 to 15 in the mid-2000s, before falling
back to 14 near the end of the sample period. At least one BHC in each year reported no market
risk information (index value of zero). As the average value of the disclosure index increases, the
dispersion within the sample BHCs grows. The inter-quartile (25th to 75th percentile) range more
than doubles over the sample period, due mainly to growing differentiation in the top half of the
distribution after 1998. Over this period, the distance between “top reporting” BHCs and those
nearer to the average widened considerably.
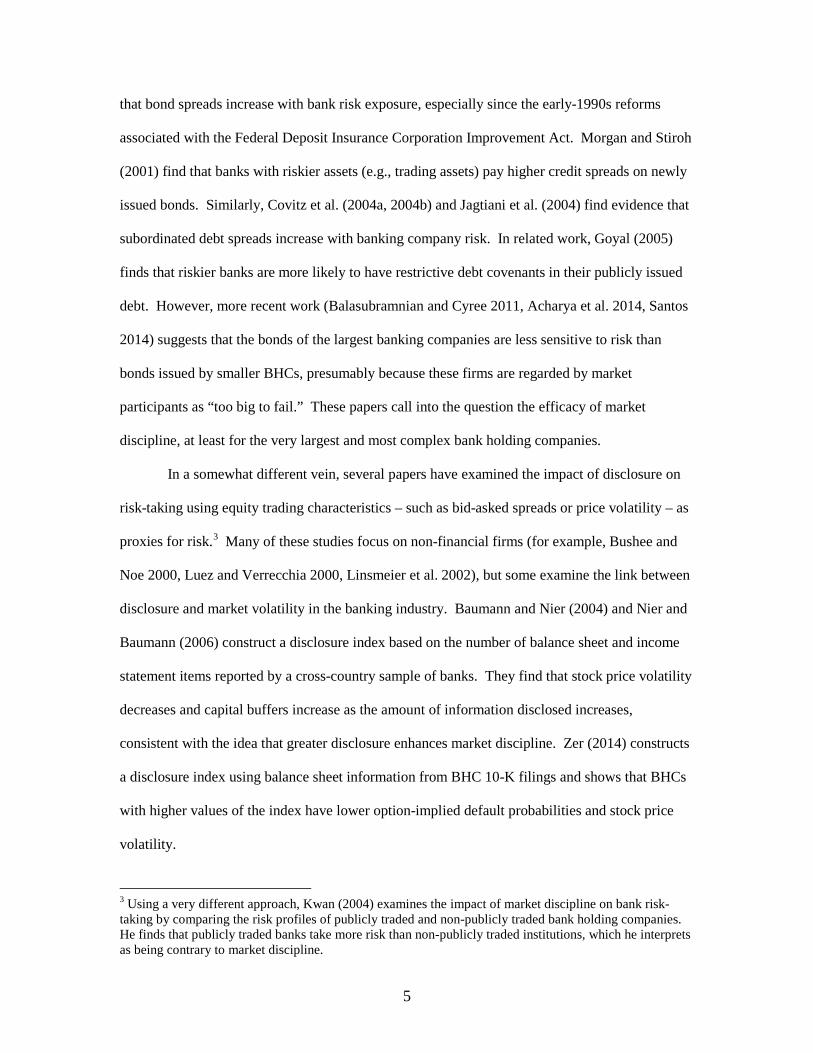
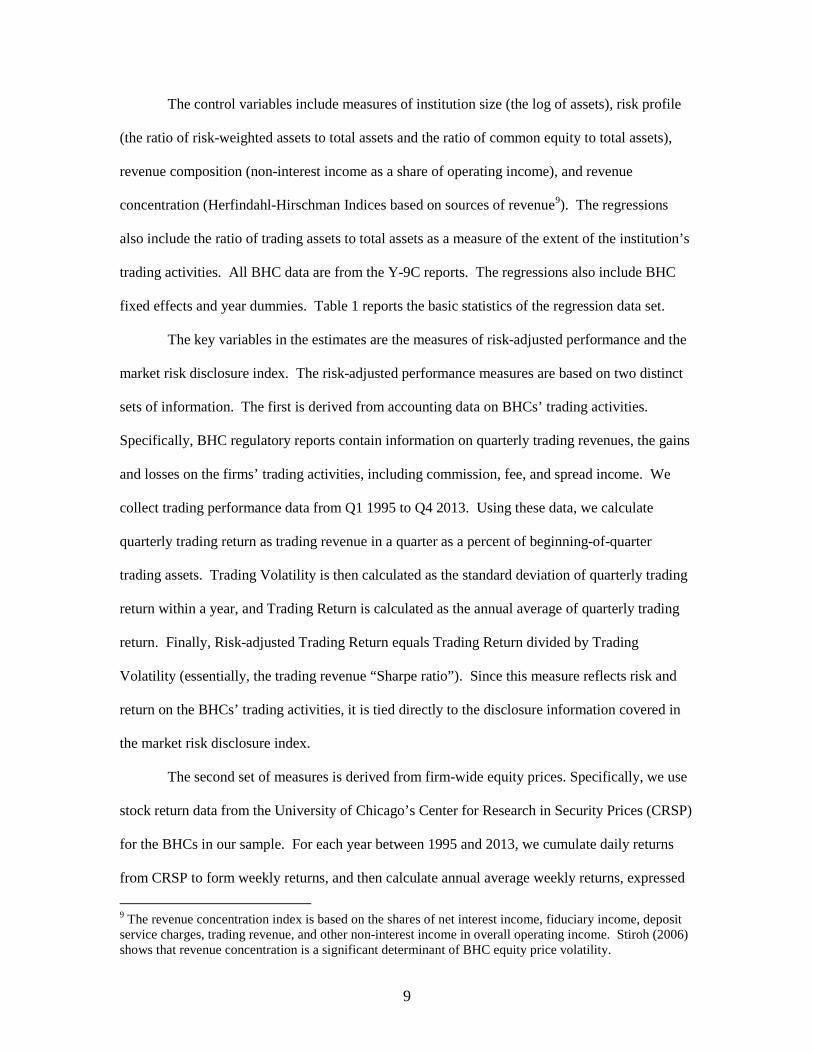
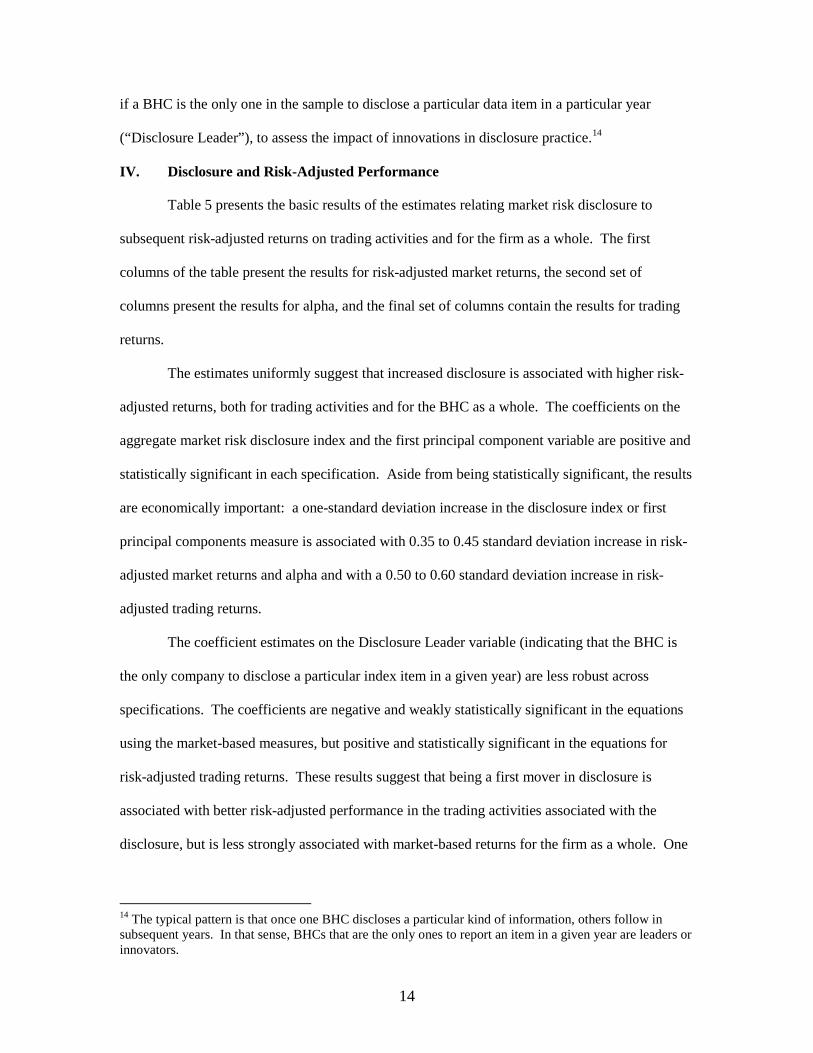
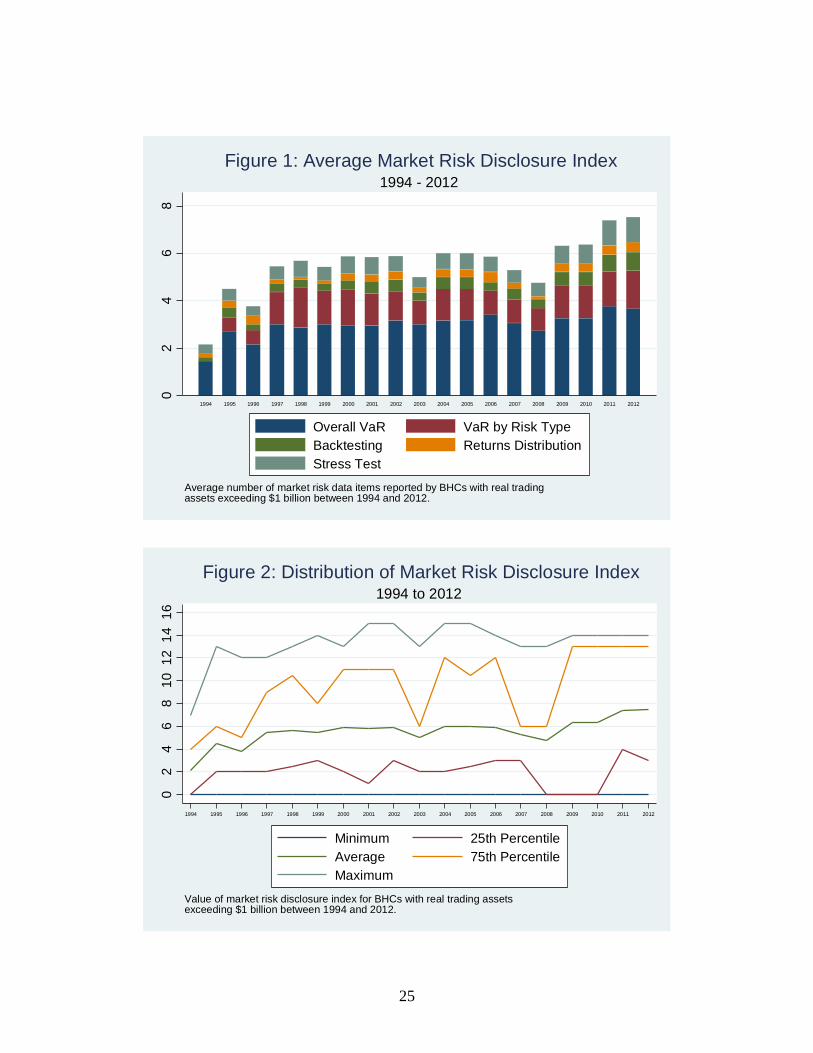
Figure 3 shows the market risk disclosure index at the individual BHC level. The BHCs
shown in the figure are those that are in the sample for at least four years, traced backward from
the BHCs’ corporate identity at the end of the sample period without adjusting for mergers. Not
surprisingly given the average results, the index tends to increase over the sample period at the
individual BHC level. The typical pattern is for the index to rise in steps over time, though there
are certainly cases in which the index declines.
13 The Pérignon and Smith (2006) index also grows through 1998, and they cite the influence of FRR 48 in this finding for the U.S. banks in their sample. See Roulstone (1999) for an assessment of the impact of FRR 48 on non-financial firms.
12
On a cross-sectional basis, the index tends to be higher at larger BHCs and at BHCs with
more trading activity, on both an absolute and relative level. Table 3 reports the correlation
between the value of the market risk disclosure index and real (2013 dollar) assets, trading assets,
and trading asset share, where values are averaged across the years a BHC is in the sample.
Reading down the first column of the table, the correlation coefficients between the disclosure
index and the measures of BHC and trading activity scale are large and positive.
Finally, Table 4 reports the frequency with which the individual data items in the market
risk disclosure index are reported. The first column reports the frequency across all observations
between 1994 and 2012, while the next two columns report the frequency at the beginning and
end of the sample period. The most commonly reported data element is the holding period and
confidence interval of the VaR estimate, reported for about 75 percent of the BHC-year
observations. This data item is a close proxy for whether a BHC disclosed any information about
VaR at all. About 30 percent of the observations included some information about VaR by risk
type, while information about backtesting and the distribution of returns is reported in 10 to 35
percent of the observations. About 40 percent of the observations indicate that the BHC does
some kind of stress testing, but only a tiny share – less than 2 percent – report the results of these
efforts. As comparison of the columns with data from 1994 and 2012 make clear, the frequency
of reporting increased over the span of the sample period for nearly every data item.
In the regressions, we use the overall market risk disclosure index as the baseline
measure of disclosure, but we also construct the first principal component of the cross-sectional
variation in reporting of the 18 individual data items in the index. The basic index is a simple
linear weighting (sum) of the individual elements. The first principal component provides an
alternate linear combination, with weights that reflect the common variation across BHC-year
observations. It captures about 40 percent of this variation, suggesting a meaningful common
component of reporting across the individual data items. Finally, we create an indicator variable
13
if a BHC is the only one in the sample to disclose a particular data item in a particular year
(“Disclosure Leader”), to assess the impact of innovations in disclosure practice.14
IV. Disclosure and Risk-Adjusted Performance
Table 5 presents the basic results of the estimates relating market risk disclosure to
subsequent risk-adjusted returns on trading activities and for the firm as a whole. The first
columns of the table present the results for risk-adjusted market returns, the second set of
columns present the results for alpha, and the final set of columns contain the results for trading
returns.
The estimates uniformly suggest that increased disclosure is associated with higher risk-
adjusted returns, both for trading activities and for the BHC as a whole. The coefficients on the
aggregate market risk disclosure index and the first principal component variable are positive and
statistically significant in each specification. Aside from being statistically significant, the results
are economically important: a one-standard deviation increase in the disclosure index or first
principal components measure is associated with 0.35 to 0.45 standard deviation increase in risk-
adjusted market returns and alpha and with a 0.50 to 0.60 standard deviation increase in risk-
adjusted trading returns.
The coefficient estimates on the Disclosure Leader variable (indicating that the BHC is
the only company to disclose a particular index item in a given year) are less robust across
specifications. The coefficients are negative and weakly statistically significant in the equations
using the market-based measures, but positive and statistically significant in the equations for
risk-adjusted trading returns. These results suggest that being a first mover in disclosure is
associated with better risk-adjusted performance in the trading activities associated with the
disclosure, but is less strongly associated with market-based returns for the firm as a whole. One
14 The typical pattern is that once one BHC discloses a particular kind of information, others follow in subsequent years. In that sense, BHCs that are the only ones to report an item in a given year are leaders or innovators.
14
potential explanation for these seemingly inconsistent results is that there are learning costs for
investors in understanding and putting in context new types of information.
The sample period for the performance data – 1995 to 2013 – includes the 2007 to 2009
financial crisis. Since this was a period of extraordinary volatility in financial markets and for the
banking sector, one question is how including this period in the sample affects the results. To
explore the impact of the unusual market conditions during the financial crisis, we re-estimated
the equations omitting observations from the peak crisis years, 2007 to 2009. These results are
reported in Table 6.
On the whole, omitting the financial crisis period does not significantly alter the results
concerning the relationship between disclosure and subsequent risk-adjusted performance. The
coefficients on the disclosure variables continue to be positive and statistically significant, with
little change in magnitude. The primary difference is that Disclosure Leader variable no longer
enters the equations with a statistically significant coefficient, though the signs and approximate
size of the coefficients are similar to those in the basic results. Thus, the exceptional market and
banking sector volatility during the financial crisis does not appear to be driving the overall
results.
A related question is whether BHCs that disclosed more risk information experienced
higher risk-adjusted returns during the financial crisis. The ideal way to answer this question
would be to do fully separate estimates for the crisis period, but this is not possible due to limited
annual observations. To provide some insight, however, we re-estimate the equations allowing
the coefficients on the disclosure index variables to differ between the non-crisis and crisis
periods (again defined as 2007 to 2009). Note that the Disclosure Leader variable is not
estimated separately for the two time periods because there is insufficient variation during the
crisis period to separately identify the impact. These results are reported in Table 7.
The results differ between across the three measures of risk-adjusted performance. For
risk-adjusted market returns, the coefficients on the disclosure index and fist principal
15

components variables are positive and statistically significant in both the crisis and non-crisis
periods. The hypothesis that the coefficients are the same cannot be rejected (see the last row of
the table). In contrast, for alpha and for risk-adjusted trading returns, the coefficients are positive
and statistically significant only during the non-crisis period. These findings suggest that BHCs
that disclosed more trading risk information did not have better (or worse) risk-adjusted trading
performance during the financial crisis, while the evidence about overall firm performance is
mixed.
Overall, the results in Tables 5 to 7 suggest that increased market risk disclosure is
associated with higher risk-adjusted returns. If this link is through market discipline on trading
activities, then we might expect that this effect would be stronger for BHCs that are more heavily
engaged in trading. To explore this question, Table 8 presents results where the coefficients on
the disclosure variables are allowed to differ between BHCs that are “intense traders” and the rest
of the sample. “Intense traders” are defined as the 10 BHCs in the sample with trading assets
greater than or equal to $20 billion and representing at least 10 percent of total assets. Note that
by construction, all BHCs in the sample have large trading accounts in absolute dollar terms, so
this partition identifies not only BHCs with especially large trading portfolios but also BHCs for
which trading is a particularly large share of firm-wide activity.15
As the results in Table 8 illustrate, there is a statistically significant relationship between
disclosure and risk-adjusted returns for both intense trader and for other large traders, but this
relationship is more material for intense trading firms. In every case, the coefficient estimate for
the intense traders is larger than that for the other large traders, though these differences are not
always significant (see the last row of the table). The coefficient estimate suggest that a one-
standard deviation increase in the disclosure index measures is associated with a 0.40 to 0.65
standard deviation increase in risk-adjusted returns for intense traders, but just a 0.20 to 0.45
15 “Intense traders” have trading assets that range between 11 and 42 percent of total assets (median 18 percent), as compared to a range of 0.1 to 12.0 percent (median 1.6 percent) for the other large traders in the sample.
16
standard deviation increase for other large trading BHCs. Further, the impact of being a
disclosure leader is evident only for the intense traders – these BHCs have higher risk-adjusted
trading returns, whereas there is no significant impact of being a disclosure leader among the
other larger traders. Thus, the impact of disclosure on risk-adjusted returns is much stronger for
those firms with a concentration in trading activity.
Robustness
One potential criticism of these findings is that the disclosure variables may be capturing
unobserved characteristics of the BHCs’ trading portfolios. For instance, information on VaR by
risk type is clearly more relevant for BHCs with trading positions spanning multiple risk factors
(e.g., interest rates, exchange rates, equity prices, commodities) than for those with simple
portfolios. Multi-risk-factor portfolios that span riskier or less widely held risk exposures, such
as commodities, could have different risk-return characteristics than portfolios composed of
positions exposed primarily to interest rates, which are held in nearly all trading portfolios.
Alternatively, BHCs that report more information about stress testing may do so because they
hold portfolios with “tail risk” that would not necessarily be realized in annual risk-adjusted
returns (that is, risk-adjusted returns could be overstated because “tail risk” is not captured), but
for which stress testing is an important risk management tool. It could be, therefore, that the
disclosure variables are capturing differences in underlying risk and return across BHCs rather
than the impact of differential disclosure practices.
We performed a series of robustness checks to assess this concern. To begin, the
specification includes BHC fixed effects, so any time-invariant differences in risk-adjusted
returns across BHCs that are systematically associated with differences in disclosure should be
absorbed by those controls. As a further check, we repeated the regressions including additional
variables to control for the composition of BHCs’ trading activity. In particular, BHC regulatory
reports contain information on trading revenues derived from different types of risk factors, such
as interest rates, exchange rates, equity prices, and commodity prices. Nearly all the BHCs in the
17

sample (91 percent) report trading revenue from interest rate and foreign exchange positions, but
fewer report revenue from equity or commodity based positions (64 percent and 48 percent,
respectively). We re-estimated the regression including dummy variables to capture the impact of
these less common trading risk factors. Regulatory reports also include information on the
different types of securities held in the trading account, and we estimated a second alternative
specification with variables capturing the composition of trading positions based on these data.16
Since this information is available only beginning in 1995, we drop observations from 1994 from
these estimates.
As a final test, we used a measure of the trading portfolio risk, the BHC’s market risk
capital requirement (scaled by trading account assets). As discussed above, minimum regulatory
capital requirements for market risk are based on a BHC’s internal VaR estimates. In that sense,
they are related to the information disclosed in public financial statements about market risk
exposure. Unfortunately, market risk capital data are available only beginning in 1998, when the
market risk capital requirements were first imposed, and even then, some BHCs in our sample
were not subject to the requirements in every sample year.17 Overall, the sample size is reduced
by about a third when the market risk capital requirement is included as a control variable.
Results of the estimates including these three sets of additional control variables are
reported in Tables 9A, 9B and 9C, respectively. Including the additional control variables does
not change the basic results. There continues to be a positive relationship between disclosure and
risk-adjusted returns, though as before, this relationship is stronger for the market-based measures
than for accounting-based trading returns. The coefficients on the additional control variables are
16 Specifically, the specification included variables reflecting the share of trading account assets composed of U.S. treasury and agency securities, state and local government securities, mortgage-backed securities, other debt securities, trading positions held in foreign offices, revaluation gains on derivatives positions, and other trading account assets. 17 Only banks and bank holding companies with trading account assets exceeding $1 billion or 10 percent of total assets are subject to the market risk capital requirement. In addition, supervisors have the option to exempt a bank or BHC that would otherwise be subject to the requirements if its trading risk is shown to be minimal, or to require a bank or BHC to be subject to the requirements if it has significant trading risk even if it is below the numerical thresholds (Hendricks and Hirtle 1997).
18
jointly statistically significant in most of the specifications, especially for the market-based return
measures. The most consistent result is that higher market risk exposure, as measured by the ratio
of market risk capital to trading assets, is associated with lower risk-adjusted returns (see Table
9C). The variables controlling for trading risk factors (commodity- and equity-based revenue)
tend to have the least explanatory power, though the results suggest that equity-based revenue is
associated with higher risk-adjusted market returns (but lower risk-adjusted trading returns).
Risk-Adjusted Performance and Market Discipline
The finding that increased disclosure is associated with higher future risk-adjusted
performance suggests that BHCs that disclose more information face a better risk-return tradeoff.
This finding is consistent with a broad interpretation of market discipline. Much discussion of
market discipline has focused on the idea that market participants are concerned primarily about
risk, so that enhanced disclosure serves mainly to discipline bank managers in terms of risk-
taking. However, investors, creditors, and other stakeholders might reasonably be assumed to be
concerned with efficient risk-taking and the relationship between risk and return. In this broader
interpretation, enhanced disclosure facilitates market discipline not merely by affecting risk, but
by making risk taking and trading activities more efficient and productive.
A related point is that the link between greater disclosure and better performance may not
necessarily be due to the impact of market discipline as traditionally defined. Specifically, the
same risk management systems that produce better risk-adjusted performance may also generate
the information needed to make more detailed risk disclosures, which may be used by the bank as
a public signal of their superior risk management abilities. In this view, enhanced disclosure is a
by-product of better performance, rather than a cause. That said, even in this story, enhanced
disclosure provides market participants with important information about the bank that could
influence investor actions, which seems consistent with a broad view of market discipline.
One final interesting finding concerns bank holding companies that are “first movers” in
disclosure, in the sense of being the first to disclose a particular type of information. These firms
19
appear to have lower future risk-adjusted market returns, but higher risk-adjusted trading returns.
This finding suggests that there may be learning costs for investors in assessing and putting into
context new types of information about risk. To the extent this is the case, policymakers
advocating new and innovative disclosures should also consider the role that the public sector
could play in educating investors and market analysts about these new disclosures. This could
reduce any negative market reaction to unfamiliar information and thus better align the incentives
of firms and policymakers about enhanced disclosure.
V. Summary and Conclusions
Disclosure plays an important role in market discipline since market participants need to
have meaningful information on which to base their judgments of risk and performance.
Disclosure is particularly important in the banking industry, since banks are generally viewed as
being opaque to outsiders. As a result, banking supervisors and other public sector officials have
encouraged enhanced disclosure by banking companies, particularly of forward-looking estimates
of risk. This paper tries to assess whether these kinds of disclosures provide useful information to
market participants that can help foster market discipline.
In particular, the paper examines disclosures related to market risk in trading and market-
making activities. The key variable is an index of market risk disclosure that captures the amount
of market risk information banking companies disclose in their annual reports. The index is
constructed for a sample of BHCs with significant trading activities over the years 1994 to 2012.
The estimates examine how this index affects future risk-adjusted return on trading activities and
for the BHC overall, as proxied by the firm’s equity price behavior.
The main findings are that increases in disclosure are associated with higher risk-adjusted
returns, both for trading activities and for the firm overall. These results are economically
meaningful as well as statistically significant. The findings are robust to alternative specifications
that include additional controls for the composition of the BHCs’ trading portfolios and the
sources of trading revenue, and are stronger for BHCs where trading represents a larger share of
20

firm-wide activity. The results are not driven by the recent financial crisis and, in fact, the
relationship between disclosure and risk-adjusted performance appears to be significantly weaker
during this period. Overall, the results suggest that as disclosure increases, BHCs experience an
improved risk-return tradeoff.
21
References
Acharya, Viral V., Deniz Anginer and A. Joseph Warburton. 2014. “The End of Market Discipline? Investor Expectations of Implicit Government Guarantees.” Available at SSRN: http://ssrn.com/abstract=1961656 or http://dx.doi.org/10.2139/ssrn.1961656
Balasubramnian, Bhanu and Ken B. Cyree. 2011. “Market Discipline of Banks: Why are Yield
Spreads on Bank-issued Subordinated Notes and Debentures Not Sensitive to Bank Risks?” Journal of Banking and Finance. 35:1, 21-35.
Barth, Mary E., Yaniv Konchitchki, and Wayne R. Landsman. 2013. “Cost of Capital and
Earnings Transparency.” Journal of Accounting and Economics. 55, 206-24. Basel Committee on Banking Supervision. 2004. “International Convergence of Capital
Measurement and Capital Standards: A Revised Framework.” Bank for International Settlements.
__________. 2015. “Standards: Revised Pillar 3 Disclosure Requirements.” Bank for
International Settlements. January 2015. http://www.bis.org/bcbs/publ/d309.pdf Baumann, Ursel and Erlend Nier. 2004. “Disclosure, Volatility, and Transparency: An Empirical
Investigation into the Value of Bank Disclosure.” Federal Reserve Bank of New York Economic Policy Review. September 2004, 31-45.
Berkowitz, Jeremy and James O’Brien. 2002. “How Accurate are Value-at-Risk Models at
Commercial Banks?” Journal of Finance. 57: 3, 1093-1111. Bliss, Robert R. and Mark J. Flannery. 2002. “Market Discipline in the Governance of U.S. Bank
Holding Companies: Monitoring vs. Influencing.” European Finance Review. 6, 361-395.
Bushee, Brian J. and Christopher P. Noe. 2000. “Corporate Disclosure Practices, Institutional
Investors, and Stock Return Volatility.” Journal of Accounting Research. 38: Supplement, 171-202.
Bushman, Robert M. and Christopher D. Williams. 2012. “Accounting Discretion, Loan Loss
Provisioning, and Discipline of Banks’ Risk-taking.” Journal of Accounting and Economics. 54, 1-18.
Covitz, Daniel M., Diana Hancock, and Myron L. Kwast. 2004a. “A Reconsideration of the Risk
Sensitivity of U.S. Banking Organization Subordinated Debt Spreads: A Sample Selection Approach.” Federal Reserve Bank of New York Economic Policy Review. September 2004, 73-92.
__________. 2004b. “Market Discipline in Banking Reconsidered: The Roles of Funding
Manager Decisions and Deposit Insurance Reform.” Board of Governors of the Federal Reserve System Finance and Economics Discussion Series. 2004-53.
Cumming, Christine M. and Beverly J. Hirtle. 2001. “The Challenges of Risk Management in
Diversified Financial Companies.” Federal Reserve Bank of New York Economic Policy Review. March 2001, 1-17.
22
Ellul, Andrew and Vijay Yerramilli. 2013. “Stronger Risk Controls, Lower Risks: Evidence from
U.S. Bank Holding Companies.” Journal of Finance. LXVIII:5, 1757-1803. Eugster, Florian and Alexander F. Wagner. 2011. “When and How is Voluntary Disclosure
Quality Reflected in Equity Prices?” Swiss Finance Institute Research Paper no. 11-15. Flannery, Mark J. 2001. “The Faces of ‘Market Discipline’.” Journal of Financial Services
Research. 20: 2/3, 107-119. Flannery, Mark J., Simon H. Kwan, and M. Nimalendran. 2004. “Market Evidence on the
Opaqueness of Banking Firms’ Assets.” Journal of Financial Economics. 71:3, 419-60. Goyal, Vidhan K. 2005. “Market Discipline of Bank Risk: Evidence from Subordinated Debt
Contracts.” Journal of Financial Intermediation. 14:3, 318-50. Hendricks, Darryll and Beverly Hirtle. 1997. “Bank Capital Requirements for Market Risk: The
Internal Models Approach.” Federal Reserve Bank of New York Economic Policy Review. 3: 4, 1-12.
Hirtle, Beverly. 2003. “What Market Risk Capital Reporting Tells Us About Bank Risk.” Federal
Reserve Bank of New York Economic Policy Review. 9:3, 37-54. __________. 2006. “Stock Market Reaction to Financial Statement Certification by Bank
Holding Company CEOs.” Journal of Money, Credit and Banking. 38:5, 1263-91. Iannotta, Giuliano. 2006. “Testing for Opaqueness in the European Banking Industry: Evidence
from Bond Rating Spreads.” Journal of Financial Services Research. 30:3, 287-309. Jagtiani, Julapa, George Kaufman, and Catharine Lemieux. 2002. “The Effect of Credit Risk on
Bank and Bank Holding Company Bond Yields: Evidence form the Post-FDICIA Period.” Journal of Financial Research. 25:4, 559-75.
Jorion, Philippe. 2002. “How Informative are Value-at-Risk Disclosures?” Accounting Review.
77. __________. 2006. Value at Risk: The New Benchmark for Managing Financial Risk. Third
Edition. McGraw-Hill. Kwan, Simon. 2004. “Testing the Strong-Form of Market Discipline: The Effects of Public
Market Signals on Bank Risk.” Federal Reserve Bank of San Francisco Working Paper 2004-19.
Leuz, Christian and Robert E. Verrecchia. 2000. “The Economic Consequences of Increased
Disclosure. Journal of Accounting Research. 38: Supplement, 91-124.. Linsmeier, Thomas J., Daniel B. Thornton, Mohan Venkatachalam, and Michael Welker. 2002.
“The Effect of Mandated Market Risk Disclosures on Trading Volume Sensitivity to Interest Rate, Exchange Rate, and Commodity Price Movements.” The Accounting Review. 77:2, 343-77.
23
Meyers, Stewart C. and Raghuram G. Rajan. 1998. “The Paradox of Liquidity.” Quarterly Journal of Economics. 113:3, 733-71.
Moody’s Investors Service. 2006. “Risk Disclosures of Banks and Securities Firms.” May 12,
2006. Morgan, Donald P. 2002. “Rating Banks: Risk and Uncertainty in an Opaque Industry.”
American Economic Review. 92:4, 874-88. Morgan, Donald P. and Kevin J. Stiroh. 2001. “Market Discipline of Banks: the Asset Test.”
Journal of Financial Services Research. 20: 2/3, 195-208. Multidisciplinary Working Group on Enhanced Disclosure. 2001. “Final Report to the Basel
Committee on Banking Supervision, Committee on the Global Financial System of the G-10 Central Banks, International Association of Insurance Supervisors, and International Organization of Securities Commissions.” Bank for International Settlements.
Nier, Erlend and Ursel Baumann. 2006. “Market Discipline, Disclosure, and Moral Hazard in
Banking.” Journal of Financial Intermediation. 15:3, 332-61. Pérignon, Christophe and Daniel R. Smith. 2010. “The Level and Quality of Value-at-Risk
Disclosure by Commercial Banks.” Journal of Banking and Finance. 34:2, 362-77. Roulstone, Darren T. 1999. “Effect of SEC Financial Reporting Release No. 48 on Derivative and
Market Risk Disclosures.” Accounting Horizons. 13:4, 343-63. Santos, Joao. 2014. “Evidence from the Bond Market on Banks’ ‘Too-Big-to-Fail’ Subsidy.”
Federal Reserve Bank of New York Economic Policy Review. 20:2, 1-11. Stiroh, Kevin. 2006. “New Evidence on the Determinants of Bank-Specific Risk.” Journal of
Financial Services Research. 30, 237-63. U.S. Securities and Exchange Commission. 1997. “Disclosure of Accounting Policies for
Derivatives Financial Instruments and Derivatives Commodity Instruments and Disclosure of Quantitative and Qualitative Information about Market Risk Inherent in Derivative Financial Instruments, Other Financial Instruments, and Derivative Commodity Instruments.” Financial Report Release no. 48. January 31, 1997. http://www.sec.gov/rules/final/33-7386.txt
Zer, Ilknur. 2014. “Disclosure Practices and Option Implied Probability of Default.” Available at
SSRN: http://ssrn.com/abstract=2335717 or http://dx.doi.org/10.2139/ssrn.2335717
24
02
46
8
1994 1995 1996 1997 1998 1999 2000 2001 2002 2003 2004 2005 2006 2007 2008 2009 2010 2011 2012
Average number of market risk data items reported by BHCs with real tradingassets exceeding $1 billion between 1994 and 2012.
1994 - 2012Figure 1: Average Market Risk Disclosure Index
Overall VaR VaR by Risk TypeBacktesting Returns DistributionStress Test
02
46
810
1214
16
1994 1995 1996 1997 1998 1999 2000 2001 2002 2003 2004 2005 2006 2007 2008 2009 2010 2011 2012
Minimum 25th PercentileAverage 75th PercentileMaximum
Value of market risk disclosure index for BHCs with real trading assetsexceeding $1 billion between 1994 and 2012.
1994 to 2012Figure 2: Distribution of Market Risk Disclosure Index
25
05
1015
05
1015
05
1015
05
1015
05
1015
1994 1997 2000 2003 2006 2009 2012 1994 1997 2000 2003 2006 2009 2012 1994 1997 2000 2003 2006 2009 2012 1994 1997 2000 2003 2006 2009 2012 1994 1997 2000 2003 2006 2009 2012
1994 1997 2000 2003 2006 2009 2012 1994 1997 2000 2003 2006 2009 2012 1994 1997 2000 2003 2006 2009 2012 1994 1997 2000 2003 2006 2009 2012 1994 1997 2000 2003 2006 2009 2012
1994 1997 2000 2003 2006 2009 2012 1994 1997 2000 2003 2006 2009 2012 1994 1997 2000 2003 2006 2009 2012 1994 1997 2000 2003 2006 2009 2012 1994 1997 2000 2003 2006 2009 2012
1994 1997 2000 2003 2006 2009 2012 1994 1997 2000 2003 2006 2009 2012 1994 1997 2000 2003 2006 2009 2012 1994 1997 2000 2003 2006 2009 2012 1994 1997 2000 2003 2006 2009 2012
1994 1997 2000 2003 2006 2009 2012 1994 1997 2000 2003 2006 2009 2012 1994 1997 2000 2003 2006 2009 2012 1994 1997 2000 2003 2006 2009 2012 1994 1997 2000 2003 2006 2009 2012
BANK OF AMERICA BANK OF NEW YORK BANK OF NY MELLON BANK ONE BANKERS TRUST
BB&T CITIGROUP COUNTRYWIDE FIFTH THIRD FIRST HORIZON
FLEETBOSTON GOLDMAN SACHS J.P. MORGAN J.P.MORGAN CHASE KEYCORP
MELLON FINANCIAL MORGAN STANLEY NORTHERN TRUST PNC REGIONS FINANCIAL
STATE STREET SUNTRUST U.S. BANCORP WACHOVIA WELLS FARGO
BHCs with trading assets greater than $1 billion for at least four years between 1994 and 2012.The data reflect the BHCs' corporate identities in 2012 or the last year they are in the sample,with no adjustments for mergers.
Figure 3: Disclosure Index for Large BHCs
26
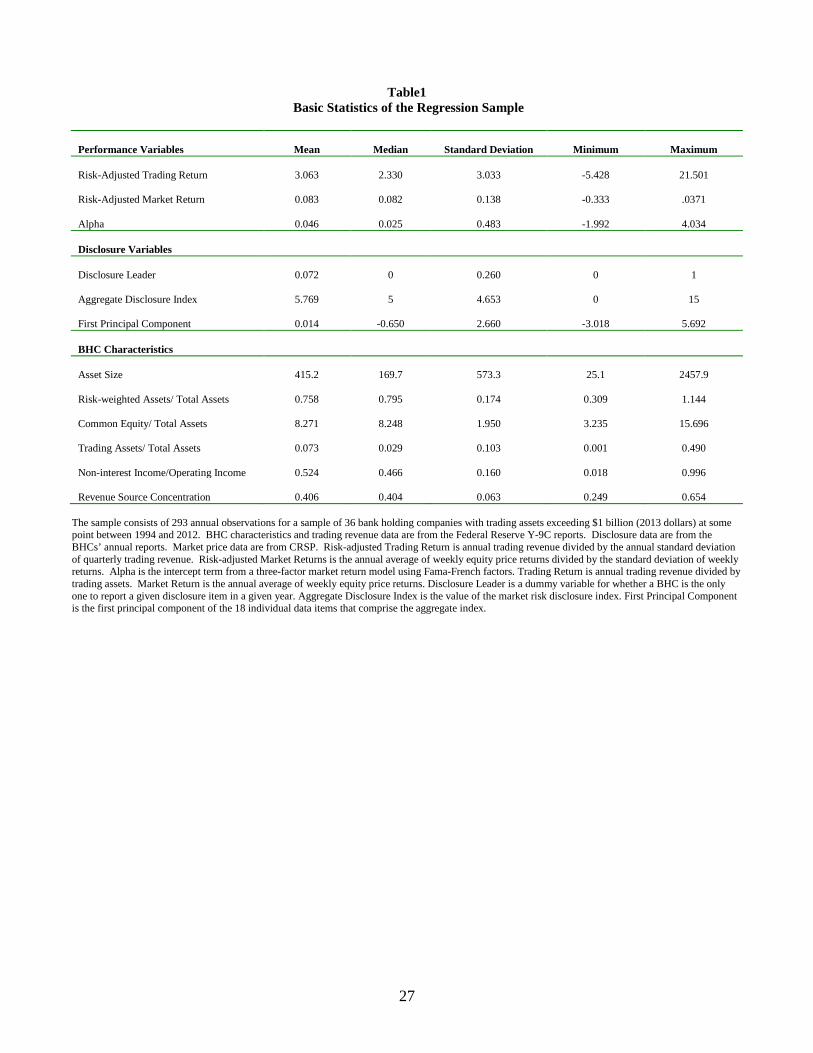
Table1 Basic Statistics of the Regression Sample
Performance Variables
Mean
Median
Standard Deviation
Minimum
Maximum
Risk-Adjusted Trading Return
3.063
2.330
3.033
-5.428
21.501
Risk-Adjusted Market Return
0.083
0.082
0.138
-0.333
.0371
Alpha
0.046
0.025
0.483
-1.992
4.034
Disclosure Variables
Disclosure Leader
0.072
0
0.260
0
1
Aggregate Disclosure Index
5.769
5
4.653
0
15
First Principal Component
0.014
-0.650
2.660
-3.018
5.692
BHC Characteristics
Asset Size
415.2
169.7
573.3
25.1
2457.9
Risk-weighted Assets/ Total Assets
0.758
0.795
0.174
0.309
1.144
Common Equity/ Total Assets
8.271
8.248
1.950
3.235
15.696
Trading Assets/ Total Assets
0.073
0.029
0.103
0.001
0.490
Non-interest Income/Operating Income
0.524
0.466
0.160
0.018
0.996
Revenue Source Concentration
0.406
0.404
0.063
0.249
0.654
The sample consists of 293 annual observations for a sample of 36 bank holding companies with trading assets exceeding $1 billion (2013 dollars) at some point between 1994 and 2012. BHC characteristics and trading revenue data are from the Federal Reserve Y-9C reports. Disclosure data are from the BHCs’ annual reports. Market price data are from CRSP. Risk-adjusted Trading Return is annual trading revenue divided by the annual standard deviation of quarterly trading revenue. Risk-adjusted Market Returns is the annual average of weekly equity price returns divided by the standard deviation of weekly returns. Alpha is the intercept term from a three-factor market return model using Fama-French factors. Trading Return is annual trading revenue divided by trading assets. Market Return is the annual average of weekly equity price returns. Disclosure Leader is a dummy variable for whether a BHC is the only one to report a given disclosure item in a given year. Aggregate Disclosure Index is the value of the market risk disclosure index. First Principal Component is the first principal component of the 18 individual data items that comprise the aggregate index.
27

Table 2
The Market Risk Disclosure Index
Category Data Items I. Overall Value-at-Risk (VaR) 1. Holding period and confidence interval.
2. Annual average VaR
3. Year-end VaR
4. Minimum VaR over the year
5. Maximum VaR over the year
6. VaR Limit (dollar amount)
7. Histogram of daily VaR
II. VaR by Risk Type 8. Annual average VaR by risk type
9. Year-end VaR by risk type
10. Minimum VaR by risk type
11. Maximum VaR by risk type
III. Backtesting 12. Chart of daily trading P&L versus daily VaR
13. Number of days losses exceeded VaR
IV. Returns Distribution 14. Histogram of daily trading P&L
15. Largest daily loss
V. Stress Testing 16. Mention that stress tests are done
17. Describe the stress tests qualitatively
18. Report stress test results
28

Table 3
Correlation Between Market Risk Disclosure Index and BHC Asset Size and Trading Activity
(P-values in parentheses)
Market Risk
Disclosure Index
Average Real
Assets
Average Real
Trading Assets
Average Trading Assets/
Total Assets
Market Risk Disclosure Index
1.000
Average Real
Assets
0.627
(0.000)
1.000
Average Real
Trading Assets
0.653
(0.000)
0.881
(0.000)
1.000
Average
Trading Assets/ Total Assets
0.605
(0.000)
0.464
(0.000)
0.705
(0.000)
1.000
Figures in the table are based on average values for 36 bank holding companies that have trading assets exceeding $1 billion at some point between 1994 and 2012. Total assets and trading assets are in 2013 dollars and are averaged across the years a BHC is in the sample.
29
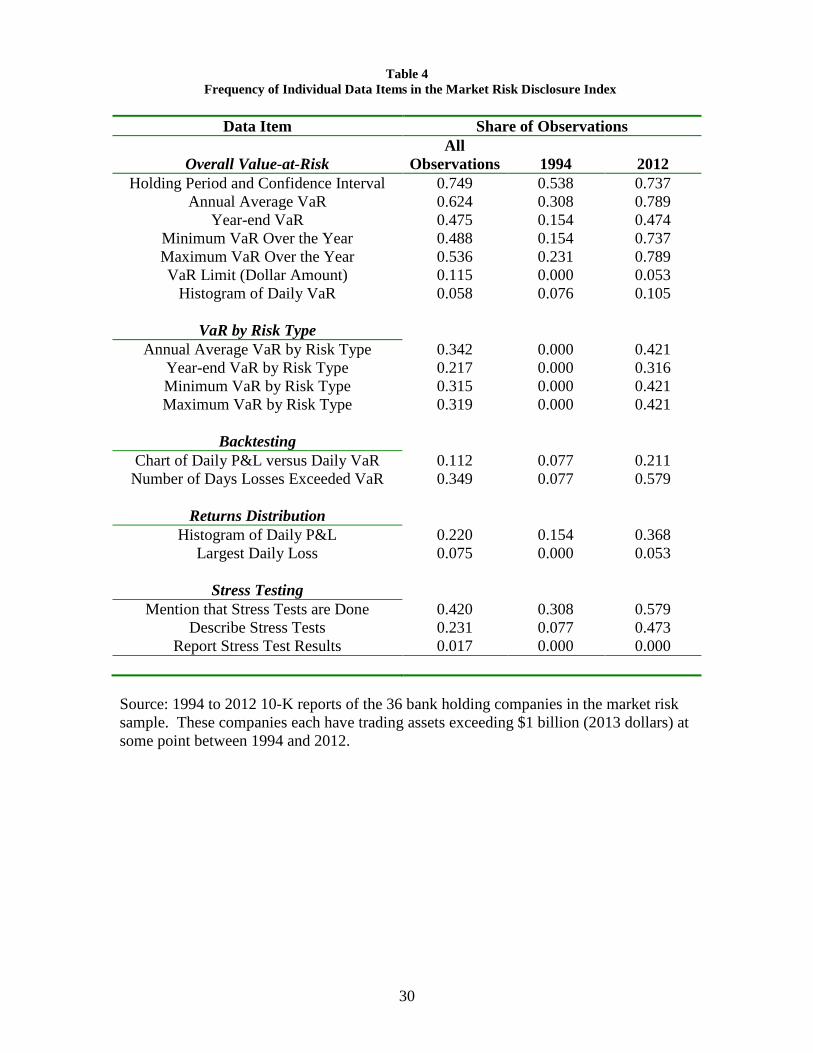
Table 4
Frequency of Individual Data Items in the Market Risk Disclosure Index
Data Item Share of Observations
Overall Value-at-Risk All
Observations
1994
2012 Holding Period and Confidence Interval 0.749 0.538 0.737
Annual Average VaR 0.624 0.308 0.789 Year-end VaR 0.475 0.154 0.474
Minimum VaR Over the Year 0.488 0.154 0.737 Maximum VaR Over the Year 0.536 0.231 0.789 VaR Limit (Dollar Amount) 0.115 0.000 0.053
Histogram of Daily VaR 0.058 0.076 0.105
VaR by Risk Type
Annual Average VaR by Risk Type 0.342 0.000 0.421 Year-end VaR by Risk Type 0.217 0.000 0.316 Minimum VaR by Risk Type 0.315 0.000 0.421 Maximum VaR by Risk Type 0.319 0.000 0.421
Backtesting
Chart of Daily P&L versus Daily VaR 0.112 0.077 0.211 Number of Days Losses Exceeded VaR 0.349 0.077 0.579
Returns Distribution
Histogram of Daily P&L 0.220 0.154 0.368 Largest Daily Loss 0.075 0.000 0.053
Stress Testing
Mention that Stress Tests are Done 0.420 0.308 0.579 Describe Stress Tests 0.231 0.077 0.473
Report Stress Test Results 0.017 0.000 0.000
Source: 1994 to 2012 10-K reports of the 36 bank holding companies in the market risk sample. These companies each have trading assets exceeding $1 billion (2013 dollars) at some point between 1994 and 2012.
30
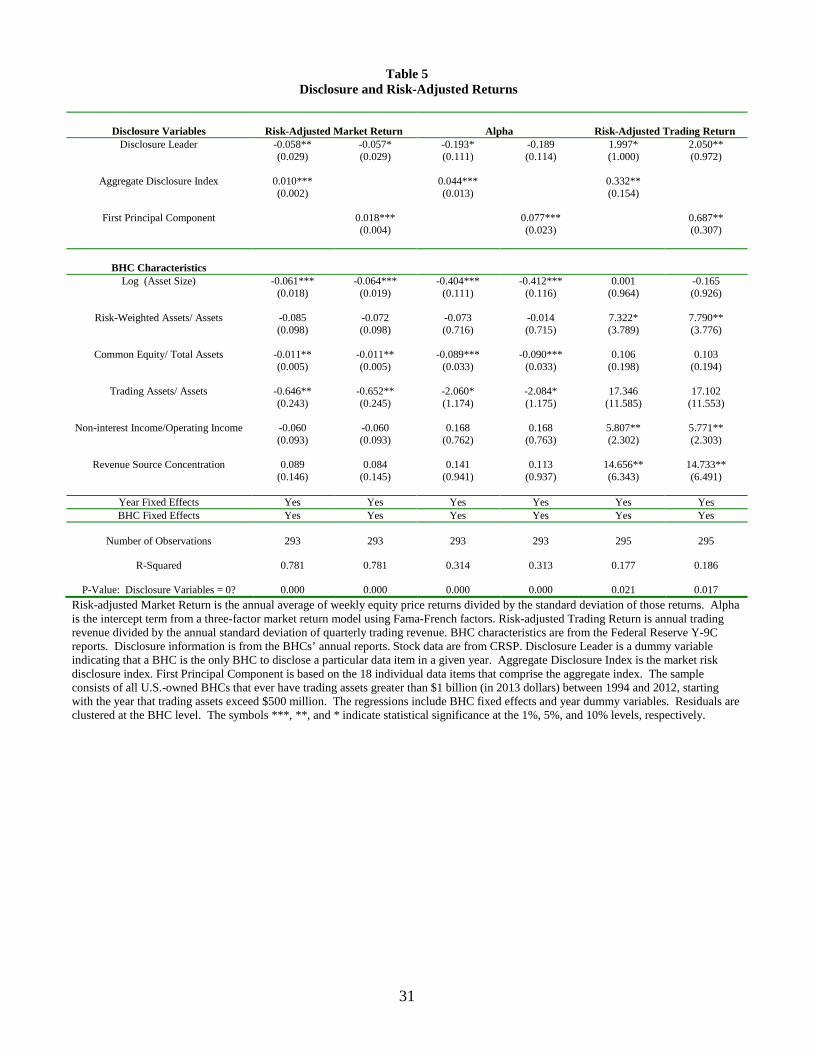
Table 5
Disclosure and Risk-Adjusted Returns
Disclosure Variables
Risk-Adjusted Market Return
Alpha
Risk-Adjusted Trading Return
Disclosure Leader -0.058** -0.057* -0.193* -0.189 1.997* 2.050** (0.029)
(0.029) (0.111) (0.114) (1.000) (0.972)
Aggregate Disclosure Index 0.010*** 0.044*** 0.332** (0.002)
(0.013)
(0.154)
First Principal Component 0.018*** 0.077*** 0.687** (0.004) (0.023)
(0.307)
BHC Characteristics
Log (Asset Size) -0.061*** -0.064*** -0.404*** -0.412*** 0.001 -0.165 (0.018) (0.019) (0.111)
(0.116) (0.964) (0.926)
Risk-Weighted Assets/ Assets -0.085 -0.072 -0.073 -0.014 7.322* 7.790** (0.098) (0.098) (0.716)
(0.715) (3.789) (3.776)
Common Equity/ Total Assets -0.011** -0.011** -0.089*** -0.090*** 0.106 0.103 (0.005) (0.005) (0.033)
(0.033) (0.198) (0.194)
Trading Assets/ Assets -0.646** -0.652** -2.060* -2.084* 17.346 17.102 (0.243) (0.245) (1.174)
(1.175) (11.585) (11.553)
Non-interest Income/Operating Income -0.060 -0.060 0.168 0.168 5.807** 5.771** (0.093) (0.093) (0.762)
(0.763) (2.302) (2.303)
Revenue Source Concentration 0.089 0.084 0.141 0.113 14.656** 14.733** (0.146) (0.145) (0.941)
(0.937) (6.343) (6.491)
Year Fixed Effects Yes Yes Yes Yes Yes Yes BHC Fixed Effects Yes Yes Yes Yes Yes Yes
Number of Observations
293
293
293
293
295
295
R-Squared
0.781
0.781
0.314
0.313
0.177
0.186
P-Value: Disclosure Variables = 0?
0.000
0.000
0.000
0.000
0.021
0.017
Risk-adjusted Market Return is the annual average of weekly equity price returns divided by the standard deviation of those returns. Alpha is the intercept term from a three-factor market return model using Fama-French factors. Risk-adjusted Trading Return is annual trading revenue divided by the annual standard deviation of quarterly trading revenue. BHC characteristics are from the Federal Reserve Y-9C reports. Disclosure information is from the BHCs’ annual reports. Stock data are from CRSP. Disclosure Leader is a dummy variable indicating that a BHC is the only BHC to disclose a particular data item in a given year. Aggregate Disclosure Index is the market risk disclosure index. First Principal Component is based on the 18 individual data items that comprise the aggregate index. The sample consists of all U.S.-owned BHCs that ever have trading assets greater than $1 billion (in 2013 dollars) between 1994 and 2012, starting with the year that trading assets exceed $500 million. The regressions include BHC fixed effects and year dummy variables. Residuals are clustered at the BHC level. The symbols ***, **, and * indicate statistical significance at the 1%, 5%, and 10% levels, respectively.
31
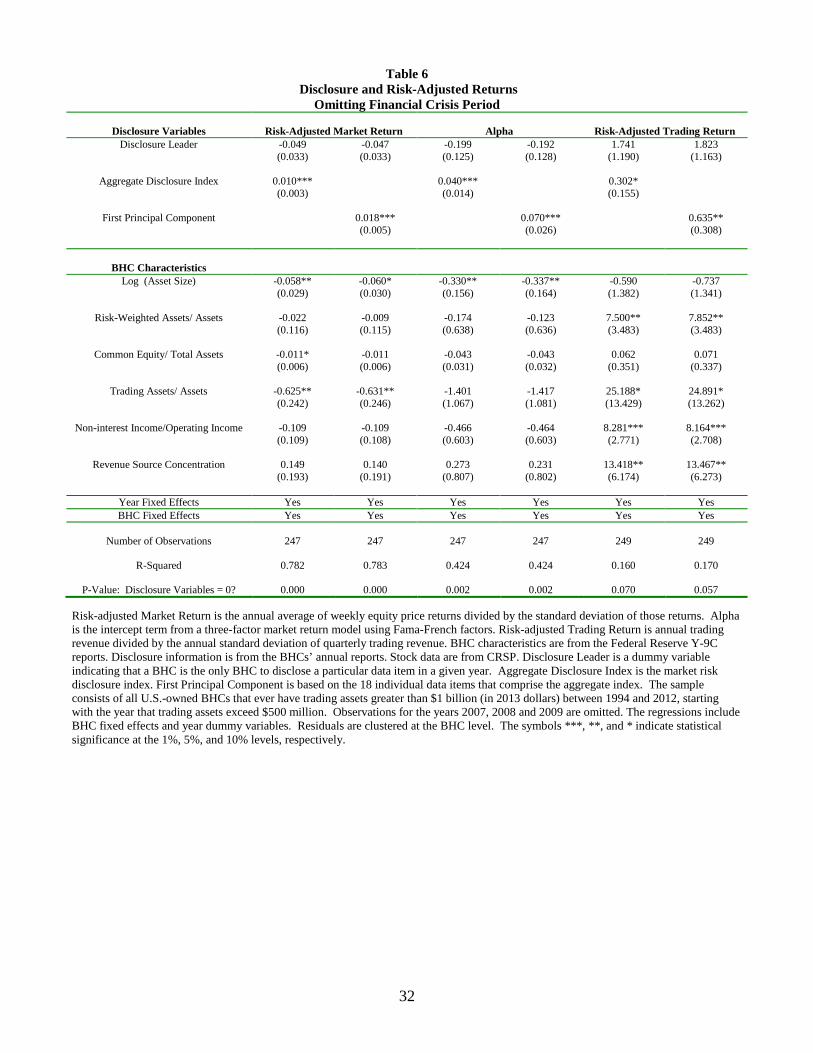
Table 6
Disclosure and Risk-Adjusted Returns Omitting Financial Crisis Period
Disclosure Variables
Risk-Adjusted Market Return
Alpha
Risk-Adjusted Trading Return
Disclosure Leader -0.049 -0.047 -0.199 -0.192 1.741 1.823 (0.033)
(0.033) (0.125) (0.128) (1.190) (1.163)
Aggregate Disclosure Index 0.010*** 0.040*** 0.302* (0.003)
(0.014) (0.155)
First Principal Component 0.018*** 0.070*** 0.635** (0.005)
(0.026) (0.308)
BHC Characteristics
Log (Asset Size) -0.058** -0.060* -0.330** -0.337** -0.590 -0.737 (0.029)
(0.030) (0.156) (0.164) (1.382) (1.341)
Risk-Weighted Assets/ Assets -0.022 -0.009 -0.174 -0.123 7.500** 7.852** (0.116)
(0.115) (0.638) (0.636) (3.483) (3.483)
Common Equity/ Total Assets -0.011* -0.011 -0.043 -0.043 0.062 0.071 (0.006)
(0.006) (0.031) (0.032) (0.351) (0.337)
Trading Assets/ Assets -0.625** -0.631** -1.401 -1.417 25.188* 24.891* (0.242)
(0.246) (1.067) (1.081) (13.429) (13.262)
Non-interest Income/Operating Income -0.109 -0.109 -0.466 -0.464 8.281*** 8.164*** (0.109)
(0.108) (0.603) (0.603) (2.771) (2.708)
Revenue Source Concentration 0.149 0.140 0.273 0.231 13.418** 13.467** (0.193)
(0.191) (0.807) (0.802) (6.174) (6.273)
Year Fixed Effects Yes Yes Yes Yes Yes Yes BHC Fixed Effects Yes Yes Yes Yes Yes Yes
Number of Observations
247
247
247
247
249
249
R-Squared
0.782
0.783
0.424
0.424
0.160
0.170
P-Value: Disclosure Variables = 0?
0.000
0.000
0.002
0.002
0.070
0.057
Risk-adjusted Market Return is the annual average of weekly equity price returns divided by the standard deviation of those returns. Alpha is the intercept term from a three-factor market return model using Fama-French factors. Risk-adjusted Trading Return is annual trading revenue divided by the annual standard deviation of quarterly trading revenue. BHC characteristics are from the Federal Reserve Y-9C reports. Disclosure information is from the BHCs’ annual reports. Stock data are from CRSP. Disclosure Leader is a dummy variable indicating that a BHC is the only BHC to disclose a particular data item in a given year. Aggregate Disclosure Index is the market risk disclosure index. First Principal Component is based on the 18 individual data items that comprise the aggregate index. The sample consists of all U.S.-owned BHCs that ever have trading assets greater than $1 billion (in 2013 dollars) between 1994 and 2012, starting with the year that trading assets exceed $500 million. Observations for the years 2007, 2008 and 2009 are omitted. The regressions include BHC fixed effects and year dummy variables. Residuals are clustered at the BHC level. The symbols ***, **, and * indicate statistical significance at the 1%, 5%, and 10% levels, respectively.
32
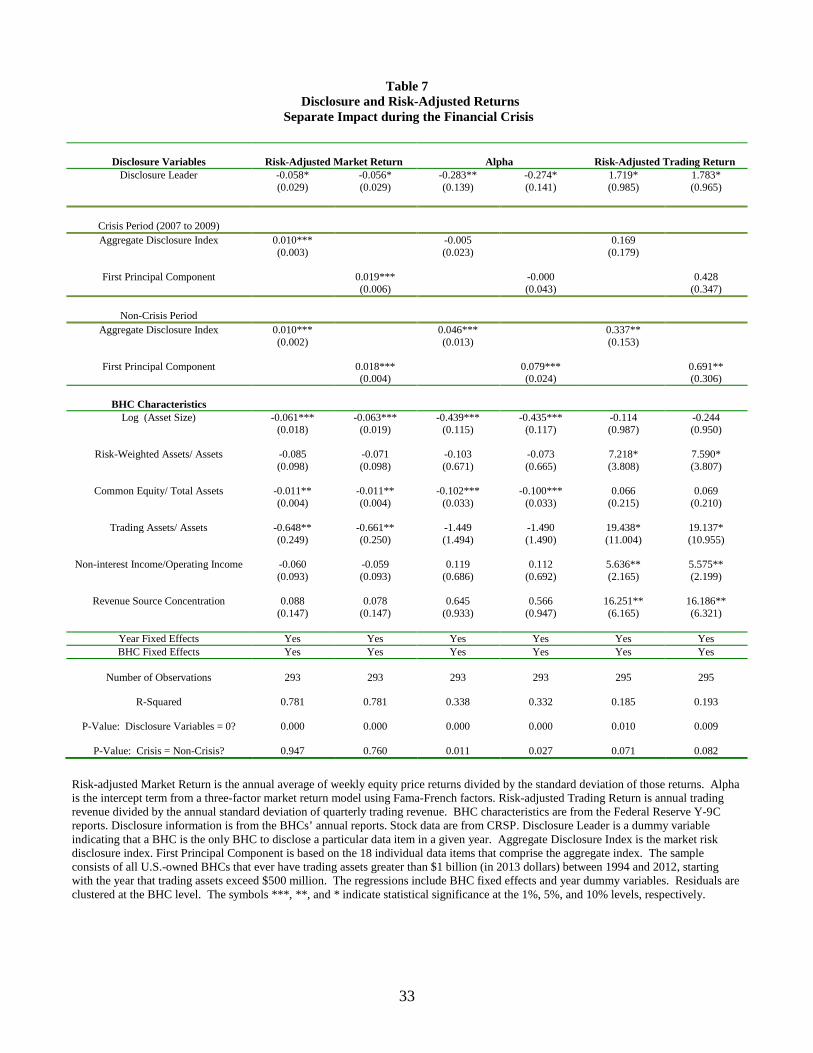
Table 7 Disclosure and Risk-Adjusted Returns
Separate Impact during the Financial Crisis
Disclosure Variables
Risk-Adjusted Market Return
Alpha
Risk-Adjusted Trading Return
Disclosure Leader -0.058* -0.056* -0.283** -0.274* 1.719* 1.783* (0.029)
(0.029) (0.139) (0.141) (0.985) (0.965)
Crisis Period (2007 to 2009)
Aggregate Disclosure Index 0.010*** -0.005 0.169 (0.003)
(0.023) (0.179)
First Principal Component 0.019*** -0.000 0.428 (0.006) (0.043) (0.347)
Non-Crisis Period
Aggregate Disclosure Index 0.010*** 0.046*** 0.337** (0.002)
(0.013) (0.153)
First Principal Component 0.018*** 0.079*** 0.691** (0.004) (0.024) (0.306)
BHC Characteristics
Log (Asset Size) -0.061*** -0.063*** -0.439*** -0.435*** -0.114 -0.244 (0.018)
(0.019) (0.115) (0.117) (0.987) (0.950)
Risk-Weighted Assets/ Assets -0.085 -0.071 -0.103 -0.073 7.218* 7.590* (0.098)
(0.098) (0.671) (0.665) (3.808) (3.807)
Common Equity/ Total Assets -0.011** -0.011** -0.102*** -0.100*** 0.066 0.069 (0.004)
(0.004) (0.033) (0.033) (0.215) (0.210)
Trading Assets/ Assets -0.648** -0.661** -1.449 -1.490 19.438* 19.137* (0.249)
(0.250) (1.494) (1.490) (11.004) (10.955)
Non-interest Income/Operating Income -0.060 -0.059 0.119 0.112 5.636** 5.575** (0.093)
(0.093) (0.686) (0.692) (2.165) (2.199)
Revenue Source Concentration 0.088 0.078 0.645 0.566 16.251** 16.186** (0.147)
(0.147) (0.933) (0.947) (6.165) (6.321)
Year Fixed Effects Yes Yes Yes Yes Yes Yes BHC Fixed Effects Yes Yes Yes Yes Yes Yes
Number of Observations
293
293
293
293
295
295
R-Squared
0.781
0.781
0.338
0.332
0.185
0.193
P-Value: Disclosure Variables = 0?
0.000
0.000
0.000
0.000
0.010
0.009
P-Value: Crisis = Non-Crisis?
0.947
0.760
0.011
0.027
0.071
0.082
Risk-adjusted Market Return is the annual average of weekly equity price returns divided by the standard deviation of those returns. Alpha is the intercept term from a three-factor market return model using Fama-French factors. Risk-adjusted Trading Return is annual trading revenue divided by the annual standard deviation of quarterly trading revenue. BHC characteristics are from the Federal Reserve Y-9C reports. Disclosure information is from the BHCs’ annual reports. Stock data are from CRSP. Disclosure Leader is a dummy variable indicating that a BHC is the only BHC to disclose a particular data item in a given year. Aggregate Disclosure Index is the market risk disclosure index. First Principal Component is based on the 18 individual data items that comprise the aggregate index. The sample consists of all U.S.-owned BHCs that ever have trading assets greater than $1 billion (in 2013 dollars) between 1994 and 2012, starting with the year that trading assets exceed $500 million. The regressions include BHC fixed effects and year dummy variables. Residuals are clustered at the BHC level. The symbols ***, **, and * indicate statistical significance at the 1%, 5%, and 10% levels, respectively.
33
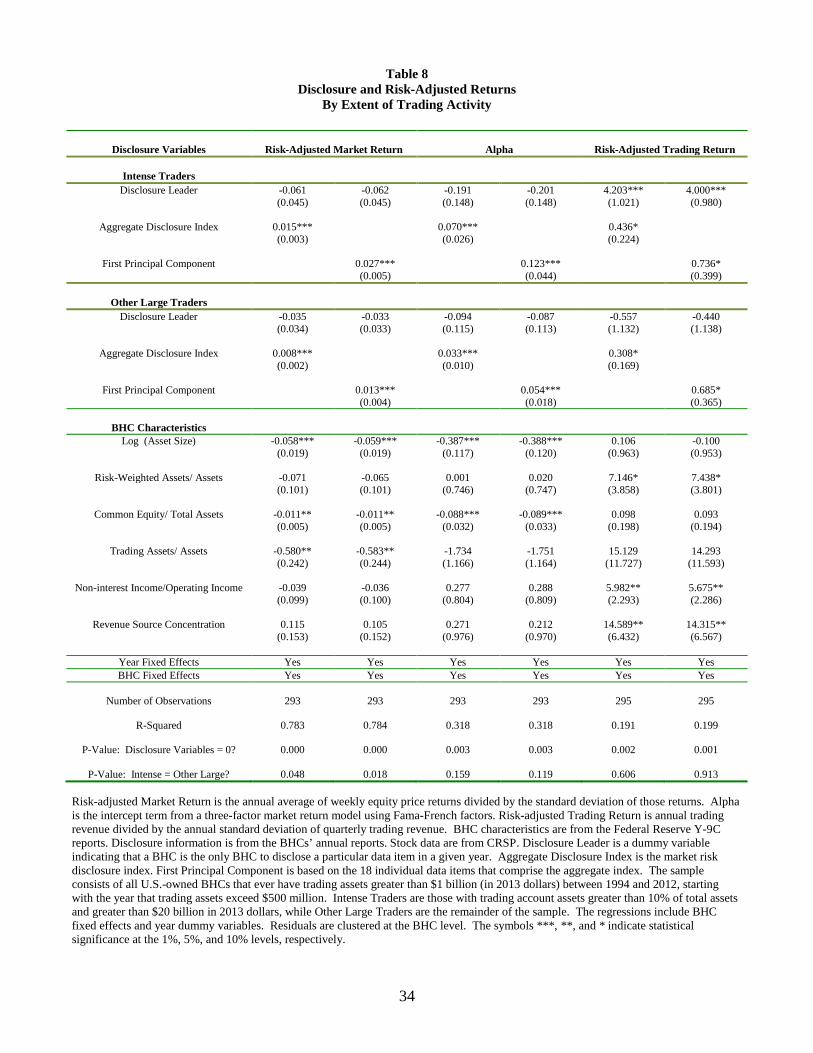
Table 8
Disclosure and Risk-Adjusted Returns By Extent of Trading Activity
Disclosure Variables
Risk-Adjusted Market Return
Alpha
Risk-Adjusted Trading Return
Intense Traders
Disclosure Leader -0.061 -0.062 -0.191 -0.201 4.203*** 4.000*** (0.045)
(0.045) (0.148) (0.148) (1.021) (0.980)
Aggregate Disclosure Index 0.015*** 0.070*** 0.436* (0.003)
(0.026) (0.224)
First Principal Component 0.027*** 0.123*** 0.736* (0.005) (0.044) (0.399)
Other Large Traders
Disclosure Leader -0.035 -0.033 -0.094 -0.087 -0.557 -0.440 (0.034)
(0.033) (0.115) (0.113) (1.132) (1.138)
Aggregate Disclosure Index 0.008*** 0.033*** 0.308* (0.002)
(0.010) (0.169)
First Principal Component 0.013*** 0.054*** 0.685* (0.004) (0.018) (0.365)
BHC Characteristics
Log (Asset Size) -0.058*** -0.059*** -0.387*** -0.388*** 0.106 -0.100 (0.019)
(0.019) (0.117) (0.120) (0.963) (0.953)
Risk-Weighted Assets/ Assets -0.071 -0.065 0.001 0.020 7.146* 7.438* (0.101)
(0.101) (0.746) (0.747) (3.858) (3.801)
Common Equity/ Total Assets -0.011** -0.011** -0.088*** -0.089*** 0.098 0.093 (0.005)
(0.005) (0.032) (0.033) (0.198) (0.194)
Trading Assets/ Assets -0.580** -0.583** -1.734 -1.751 15.129 14.293 (0.242)
(0.244) (1.166) (1.164) (11.727) (11.593)
Non-interest Income/Operating Income -0.039 -0.036 0.277 0.288 5.982** 5.675** (0.099)
(0.100) (0.804) (0.809) (2.293) (2.286)
Revenue Source Concentration 0.115 0.105 0.271 0.212 14.589** 14.315** (0.153)
(0.152) (0.976) (0.970) (6.432) (6.567)
Year Fixed Effects Yes Yes Yes Yes Yes Yes BHC Fixed Effects Yes Yes Yes Yes Yes Yes
Number of Observations
293
293
293
293
295
295
R-Squared
0.783
0.784
0.318
0.318
0.191
0.199
P-Value: Disclosure Variables = 0?
0.000
0.000
0.003
0.003
0.002
0.001
P-Value: Intense = Other Large?
0.048
0.018
0.159
0.119
0.606
0.913
Risk-adjusted Market Return is the annual average of weekly equity price returns divided by the standard deviation of those returns. Alpha is the intercept term from a three-factor market return model using Fama-French factors. Risk-adjusted Trading Return is annual trading revenue divided by the annual standard deviation of quarterly trading revenue. BHC characteristics are from the Federal Reserve Y-9C reports. Disclosure information is from the BHCs’ annual reports. Stock data are from CRSP. Disclosure Leader is a dummy variable indicating that a BHC is the only BHC to disclose a particular data item in a given year. Aggregate Disclosure Index is the market risk disclosure index. First Principal Component is based on the 18 individual data items that comprise the aggregate index. The sample consists of all U.S.-owned BHCs that ever have trading assets greater than $1 billion (in 2013 dollars) between 1994 and 2012, starting with the year that trading assets exceed $500 million. Intense Traders are those with trading account assets greater than 10% of total assets and greater than $20 billion in 2013 dollars, while Other Large Traders are the remainder of the sample. The regressions include BHC fixed effects and year dummy variables. Residuals are clustered at the BHC level. The symbols ***, **, and * indicate statistical significance at the 1%, 5%, and 10% levels, respectively.
34
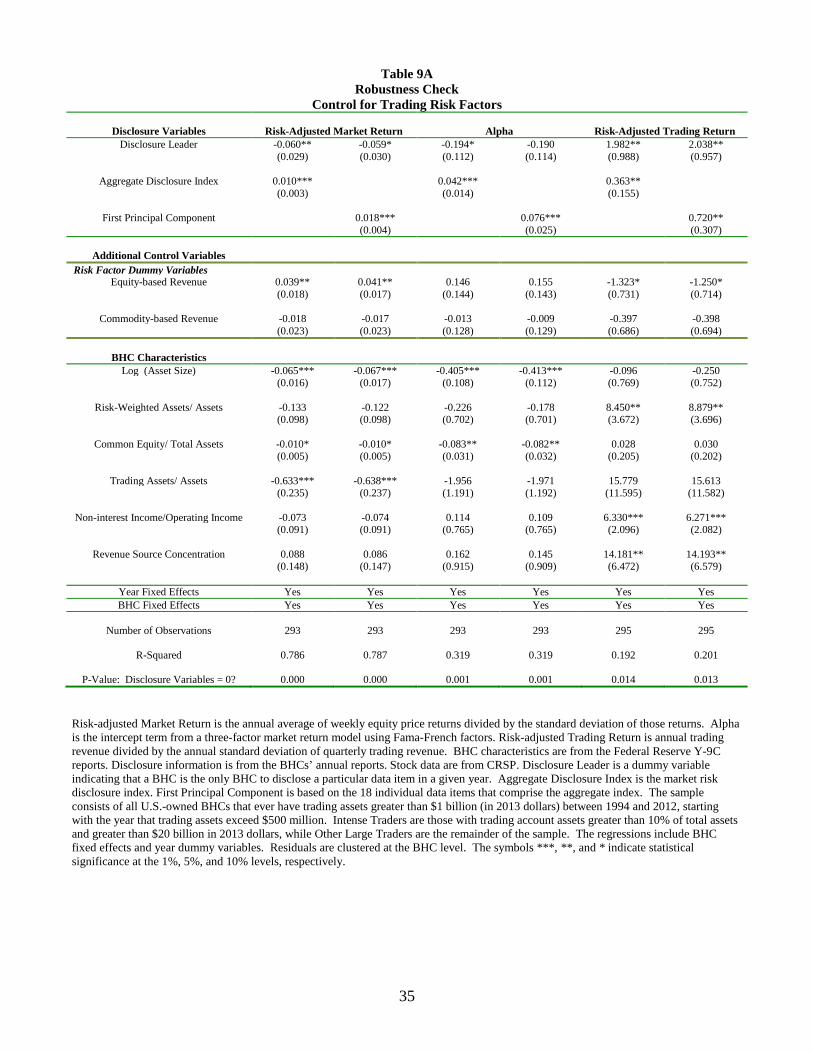
Table 9A
Robustness Check Control for Trading Risk Factors
Disclosure Variables
Risk-Adjusted Market Return
Alpha
Risk-Adjusted Trading Return
Disclosure Leader -0.060** -0.059* -0.194* -0.190 1.982** 2.038** (0.029)
(0.030) (0.112) (0.114) (0.988) (0.957)
Aggregate Disclosure Index 0.010*** 0.042*** 0.363** (0.003)
(0.014) (0.155)
First Principal Component 0.018*** 0.076*** 0.720** (0.004) (0.025) (0.307)
Additional Control Variables
Risk Factor Dummy Variables Equity-based Revenue 0.039** 0.041** 0.146 0.155 -1.323* -1.250*
(0.018)
(0.017) (0.144) (0.143) (0.731) (0.714)
Commodity-based Revenue -0.018 -0.017 -0.013 -0.009 -0.397 -0.398 (0.023) (0.023) (0.128) (0.129) (0.686) (0.694)
BHC Characteristics
Log (Asset Size) -0.065*** -0.067*** -0.405*** -0.413*** -0.096 -0.250 (0.016)
(0.017) (0.108) (0.112) (0.769) (0.752)
Risk-Weighted Assets/ Assets -0.133 -0.122 -0.226 -0.178 8.450** 8.879** (0.098)
(0.098) (0.702) (0.701) (3.672) (3.696)
Common Equity/ Total Assets -0.010* -0.010* -0.083** -0.082** 0.028 0.030 (0.005)
(0.005) (0.031) (0.032) (0.205) (0.202)
Trading Assets/ Assets -0.633*** -0.638*** -1.956 -1.971 15.779 15.613 (0.235)
(0.237) (1.191) (1.192) (11.595) (11.582)
Non-interest Income/Operating Income -0.073 -0.074 0.114 0.109 6.330*** 6.271*** (0.091)
(0.091) (0.765) (0.765) (2.096) (2.082)
Revenue Source Concentration 0.088 0.086 0.162 0.145 14.181** 14.193** (0.148)
(0.147) (0.915) (0.909) (6.472) (6.579)
Year Fixed Effects Yes Yes Yes Yes Yes Yes BHC Fixed Effects Yes Yes Yes Yes Yes Yes
Number of Observations
293
293
293
293
295
295
R-Squared
0.786
0.787
0.319
0.319
0.192
0.201
P-Value: Disclosure Variables = 0?
0.000
0.000
0.001
0.001
0.014
0.013
Risk-adjusted Market Return is the annual average of weekly equity price returns divided by the standard deviation of those returns. Alpha is the intercept term from a three-factor market return model using Fama-French factors. Risk-adjusted Trading Return is annual trading revenue divided by the annual standard deviation of quarterly trading revenue. BHC characteristics are from the Federal Reserve Y-9C reports. Disclosure information is from the BHCs’ annual reports. Stock data are from CRSP. Disclosure Leader is a dummy variable indicating that a BHC is the only BHC to disclose a particular data item in a given year. Aggregate Disclosure Index is the market risk disclosure index. First Principal Component is based on the 18 individual data items that comprise the aggregate index. The sample consists of all U.S.-owned BHCs that ever have trading assets greater than $1 billion (in 2013 dollars) between 1994 and 2012, starting with the year that trading assets exceed $500 million. Intense Traders are those with trading account assets greater than 10% of total assets and greater than $20 billion in 2013 dollars, while Other Large Traders are the remainder of the sample. The regressions include BHC fixed effects and year dummy variables. Residuals are clustered at the BHC level. The symbols ***, **, and * indicate statistical significance at the 1%, 5%, and 10% levels, respectively.
35
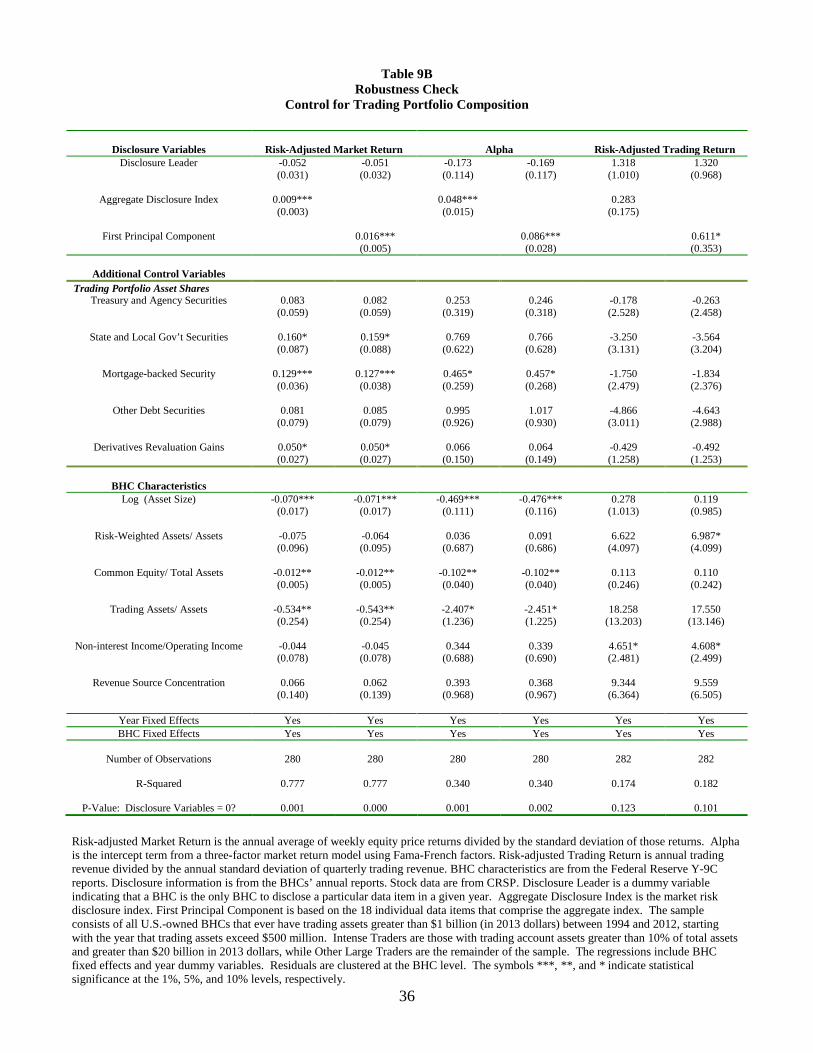
Table 9B
Robustness Check Control for Trading Portfolio Composition
Disclosure Variables
Risk-Adjusted Market Return
Alpha
Risk-Adjusted Trading Return Disclosure Leader -0.052 -0.051 -0.173 -0.169 1.318 1.320
(0.031)
(0.032) (0.114) (0.117) (1.010) (0.968)
Aggregate Disclosure Index 0.009*** 0.048*** 0.283 (0.003)
(0.015) (0.175)
First Principal Component 0.016*** 0.086*** 0.611* (0.005) (0.028) (0.353)
Additional Control Variables
Trading Portfolio Asset Shares Treasury and Agency Securities 0.083 0.082 0.253 0.246 -0.178 -0.263
(0.059)
(0.059) (0.319) (0.318) (2.528) (2.458)
State and Local Gov’t Securities 0.160* 0.159* 0.769 0.766 -3.250 -3.564 (0.087)
(0.088) (0.622) (0.628) (3.131) (3.204)
Mortgage-backed Security 0.129*** 0.127*** 0.465* 0.457* -1.750 -1.834 (0.036)
(0.038) (0.259) (0.268) (2.479) (2.376)
Other Debt Securities 0.081 0.085 0.995 1.017 -4.866 -4.643 (0.079)
(0.079) (0.926) (0.930) (3.011) (2.988)
Derivatives Revaluation Gains 0.050* 0.050* 0.066 0.064 -0.429 -0.492 (0.027) (0.027) (0.150) (0.149) (1.258) (1.253)
BHC Characteristics
Log (Asset Size) -0.070*** -0.071*** -0.469*** -0.476*** 0.278 0.119 (0.017)
(0.017) (0.111) (0.116) (1.013) (0.985)
Risk-Weighted Assets/ Assets -0.075 -0.064 0.036 0.091 6.622 6.987* (0.096)
(0.095) (0.687) (0.686) (4.097) (4.099)
Common Equity/ Total Assets -0.012** -0.012** -0.102** -0.102** 0.113 0.110 (0.005)
(0.005) (0.040) (0.040) (0.246) (0.242)
Trading Assets/ Assets -0.534** -0.543** -2.407* -2.451* 18.258 17.550 (0.254)
(0.254) (1.236) (1.225) (13.203) (13.146)
Non-interest Income/Operating Income -0.044 -0.045 0.344 0.339 4.651* 4.608* (0.078)
(0.078) (0.688) (0.690) (2.481) (2.499)
Revenue Source Concentration 0.066 0.062 0.393 0.368 9.344 9.559 (0.140)
(0.139) (0.968) (0.967) (6.364) (6.505)
Year Fixed Effects Yes Yes Yes Yes Yes Yes BHC Fixed Effects Yes Yes Yes Yes Yes Yes
Number of Observations
280
280
280
280
282
282
R-Squared
0.777
0.777
0.340
0.340
0.174
0.182
P-Value: Disclosure Variables = 0?
0.001
0.000
0.001
0.002
0.123
0.101
Risk-adjusted Market Return is the annual average of weekly equity price returns divided by the standard deviation of those returns. Alpha is the intercept term from a three-factor market return model using Fama-French factors. Risk-adjusted Trading Return is annual trading revenue divided by the annual standard deviation of quarterly trading revenue. BHC characteristics are from the Federal Reserve Y-9C reports. Disclosure information is from the BHCs’ annual reports. Stock data are from CRSP. Disclosure Leader is a dummy variable indicating that a BHC is the only BHC to disclose a particular data item in a given year. Aggregate Disclosure Index is the market risk disclosure index. First Principal Component is based on the 18 individual data items that comprise the aggregate index. The sample consists of all U.S.-owned BHCs that ever have trading assets greater than $1 billion (in 2013 dollars) between 1994 and 2012, starting with the year that trading assets exceed $500 million. Intense Traders are those with trading account assets greater than 10% of total assets and greater than $20 billion in 2013 dollars, while Other Large Traders are the remainder of the sample. The regressions include BHC fixed effects and year dummy variables. Residuals are clustered at the BHC level. The symbols ***, **, and * indicate statistical significance at the 1%, 5%, and 10% levels, respectively.
36

Table 9C
Robustness Check Control for Market Risk Exposure
Disclosure Variables
Risk-Adjusted Market Return
Alpha
Risk-Adjusted Trading Return Disclosure Leader -0.109*** -0.104*** -0.390*** -0.350*** 0.602 0.675
(0.024)
(0.026) (0.132) (0.125) (1.584) (1.473)
Aggregate Disclosure Index 0.010** 0.072*** 0.297 (0.004)
(0.020) (0.197)
First Principal Component 0.018** 0.122*** 0.578 (0.007) (0.035) (0.393)
Additional Control Variables
Market Risk Exposure Market Risk Capital/Trading Assets -0.085** -0.080** -0.468** -0.434** -2.554 -2.435
(0.035)
(0.035) (0.195) (0.197) (1.647) (1.569)
BHC Characteristics
Log (Asset Size) -0.082*** -0.082*** -0.629*** -0.623*** -0.206 -0.262 (0.029)
(0.030) (0.164) (0.169) (1.082) (1.061)
Risk-Weighted Assets/ Assets 0.015 0.025 0.849 0.916 8.971** 9.337** (0.099)
(0.101) (0.709) (0.720) (3.912) (3.883)
Common Equity/ Total Assets -0.009* -0.009* -0.104*** -0.103*** 0.112 0.110 (0.005)
(0.005) (0.034) (0.035) (0.263) (0.259)
Trading Assets/ Assets -0.799** -0.795** -3.038* -3.004* 11.608 11.449 (0.336)
(0.337) (1.712) (1.715) (17.558) (17.517)
Non-interest Income/Operating Income -0.108 -0.106 0.084 0.096 4.455** 4.523** (0.101)
(0.101) (0.791) (0.795) (1.847) (1.888)
Revenue Source Concentration 0.020 0.010 0.871 0.793 18.829** 18.905** (0.186)
(0.186) (1.213) (1.217) (7.155) (7.264)
Year Fixed Effects Yes Yes Yes Yes Yes Yes BHC Fixed Effects Yes Yes Yes Yes Yes Yes
Number of Observations
198
198
198
198
199
199
R-Squared
0.799
0.799
0.332
0.329
0.216
0.220
P-Value: Disclosure Variables = 0?
0.000
0.000
0.000
0.000
0.175
0.168
Risk-adjusted Market Return is the annual average of weekly equity price returns divided by the standard deviation of those returns. Alpha is the intercept term from a three-factor market return model using Fama-French factors. Risk-adjusted Trading Return is annual trading revenue divided by the annual standard deviation of quarterly trading revenue. BHC characteristics are from the Federal Reserve Y-9C reports. Disclosure information is from the BHCs’ annual reports. Stock data are from CRSP. Disclosure Leader is a dummy variable indicating that a BHC is the only BHC to disclose a particular data item in a given year. Aggregate Disclosure Index is the market risk disclosure index. First Principal Component is based on the 18 individual data items that comprise the aggregate index. The sample consists of all U.S.-owned BHCs that ever have trading assets greater than $1 billion (in 2013 dollars) between 1994 and 2012, starting with the year that trading assets exceed $500 million. Intense Traders are those with trading account assets greater than 10% of total assets and greater than $20 billion in 2013 dollars, while Other Large Traders are the remainder of the sample. The regressions include BHC fixed effects and year dummy variables. Residuals are clustered at the BHC level. The symbols ***, **, and * indicate statistical significance at the 1%, 5%, and 10% levels, respectively.
37