public educational forum on performance assessments
TRANSCRIPT
PUBLIC EDUCATIONAL FORUM ON
PERFORMANCE ASSESSMENTS
Aiken Technical College Amphitheater Aiken, SC
May 18, 2010
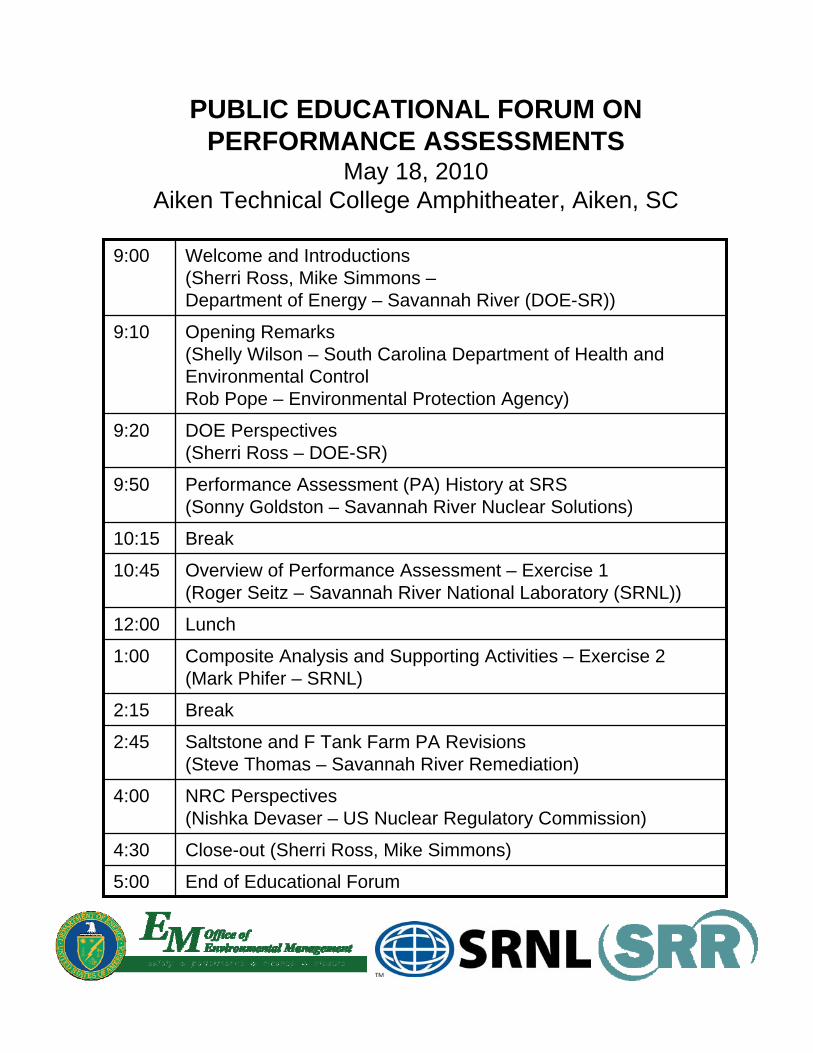
Welcome and Introductions (Sherri Ross, Mike Simmons –Department of Energy – Savannah River (DOE-SR))
9:00
Opening Remarks (Shelly Wilson – South Carolina Department of Health and Environmental ControlRob Pope – Environmental Protection Agency)
9:10
NRC Perspectives (Nishka Devaser – US Nuclear Regulatory Commission)
4:00
Close-out (Sherri Ross, Mike Simmons)4:30
End of Educational Forum5:00
Saltstone and F Tank Farm PA Revisions(Steve Thomas – Savannah River Remediation)
2:45
Break2:15
Composite Analysis and Supporting Activities – Exercise 2(Mark Phifer – SRNL)
1:00
Lunch12:00
Overview of Performance Assessment – Exercise 1 (Roger Seitz – Savannah River National Laboratory (SRNL))
10:45
Break10:15
Performance Assessment (PA) History at SRS (Sonny Goldston – Savannah River Nuclear Solutions)
9:50
DOE Perspectives(Sherri Ross – DOE-SR)
9:20
PUBLIC EDUCATIONAL FORUM ONPERFORMANCE ASSESSMENTS
May 18, 2010 Aiken Technical College Amphitheater, Aiken, SC
1
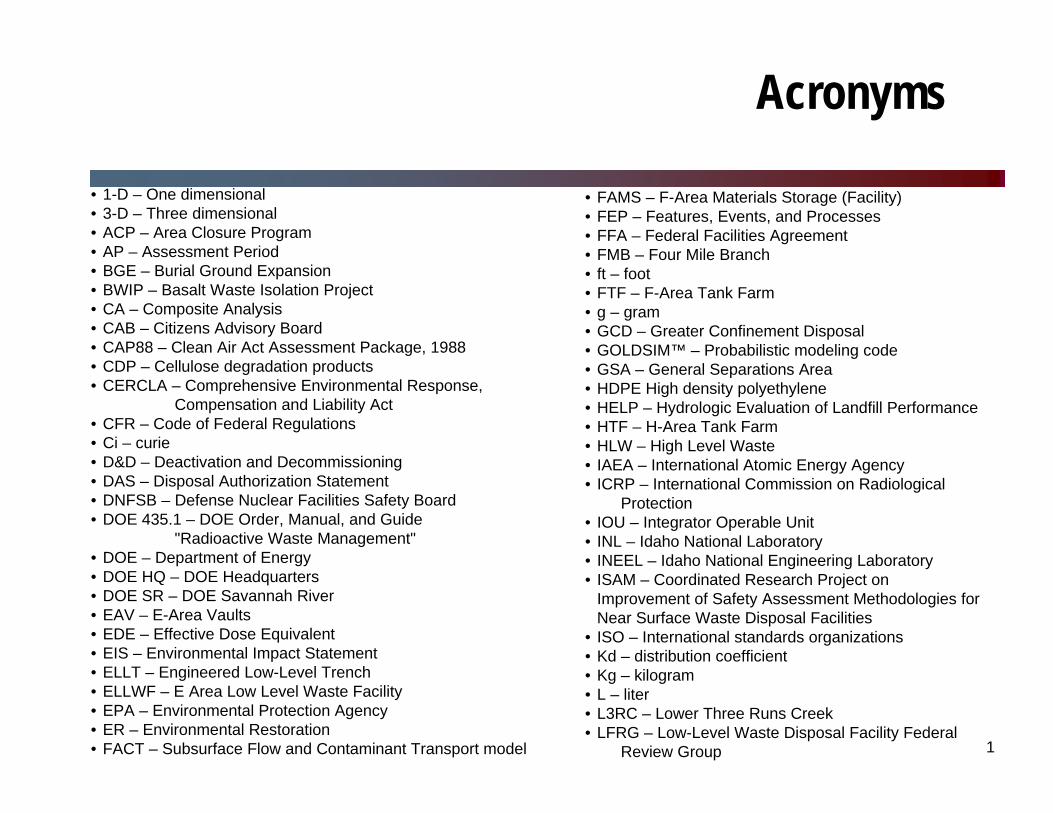
• 1-D – One dimensional• 3-D – Three dimensional• ACP – Area Closure Program• AP – Assessment Period• BGE – Burial Ground Expansion• BWIP – Basalt Waste Isolation Project• CA – Composite Analysis• CAB – Citizens Advisory Board• CAP88 – Clean Air Act Assessment Package, 1988• CDP – Cellulose degradation products• CERCLA – Comprehensive Environmental Response,
Compensation and Liability Act• CFR – Code of Federal Regulations• Ci – curie• D&D – Deactivation and Decommissioning• DAS – Disposal Authorization Statement• DNFSB – Defense Nuclear Facilities Safety Board• DOE 435.1 – DOE Order, Manual, and Guide
"Radioactive Waste Management"• DOE – Department of Energy• DOE HQ – DOE Headquarters• DOE SR – DOE Savannah River• EAV – E-Area Vaults• EDE – Effective Dose Equivalent• EIS – Environmental Impact Statement• ELLT – Engineered Low-Level Trench• ELLWF – E Area Low Level Waste Facility• EPA – Environmental Protection Agency• ER – Environmental Restoration• FACT – Subsurface Flow and Contaminant Transport model
Acronyms
• FAMS – F-Area Materials Storage (Facility)• FEP – Features, Events, and Processes• FFA – Federal Facilities Agreement• FMB – Four Mile Branch• ft – foot• FTF – F-Area Tank Farm• g – gram• GCD – Greater Confinement Disposal• GOLDSIM™ – Probabilistic modeling code• GSA – General Separations Area• HDPE High density polyethylene• HELP – Hydrologic Evaluation of Landfill Performance• HTF – H-Area Tank Farm• HLW – High Level Waste• IAEA – International Atomic Energy Agency• ICRP – International Commission on Radiological
Protection• IOU – Integrator Operable Unit• INL – Idaho National Laboratory• INEEL – Idaho National Engineering Laboratory• ISAM – Coordinated Research Project on
Improvement of Safety Assessment Methodologies for Near Surface Waste Disposal Facilities
• ISO – International standards organizations• Kd – distribution coefficient• Kg – kilogram• L – liter• L3RC – Lower Three Runs Creek• LFRG – Low-Level Waste Disposal Facility Federal
Review Group
2
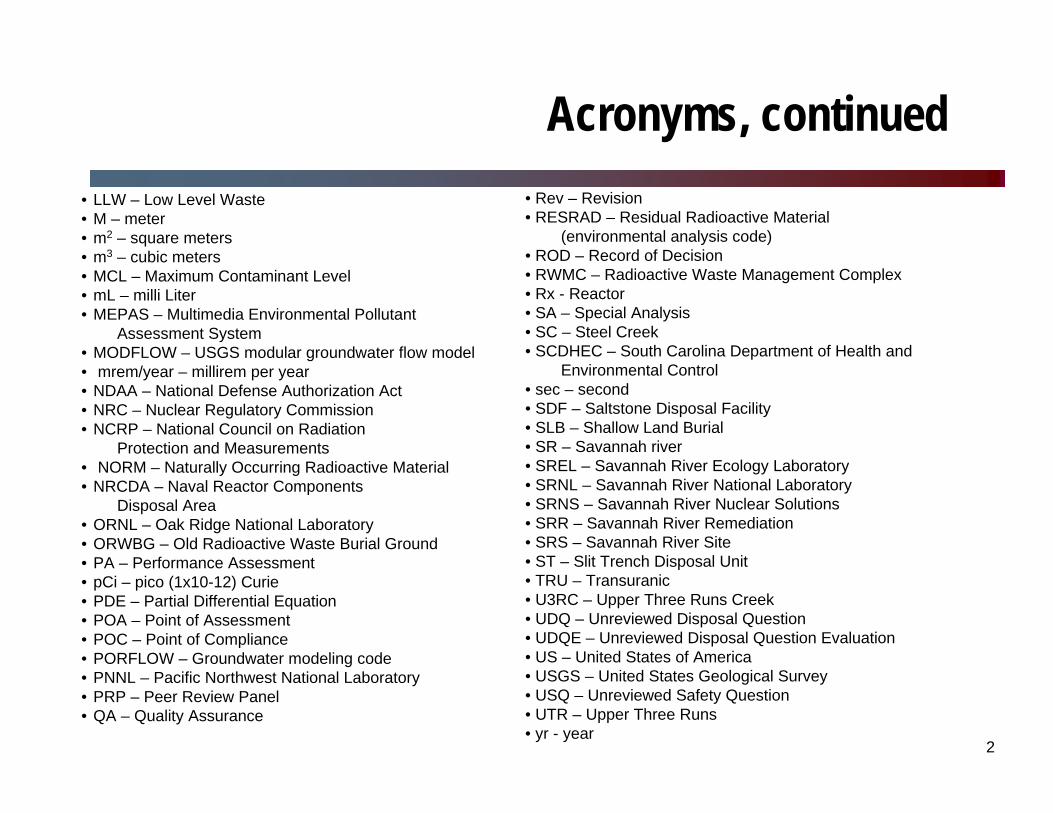
Acronyms, continued• LLW – Low Level Waste• M – meter• m2 – square meters• m3 – cubic meters• MCL – Maximum Contaminant Level• mL – milli Liter• MEPAS – Multimedia Environmental Pollutant
Assessment System• MODFLOW – USGS modular groundwater flow model• mrem/year – millirem per year• NDAA – National Defense Authorization Act• NRC – Nuclear Regulatory Commission• NCRP – National Council on Radiation
Protection and Measurements• NORM – Naturally Occurring Radioactive Material• NRCDA – Naval Reactor Components
Disposal Area• ORNL – Oak Ridge National Laboratory• ORWBG – Old Radioactive Waste Burial Ground• PA – Performance Assessment• pCi – pico (1x10-12) Curie• PDE – Partial Differential Equation• POA – Point of Assessment• POC – Point of Compliance• PORFLOW – Groundwater modeling code• PNNL – Pacific Northwest National Laboratory• PRP – Peer Review Panel• QA – Quality Assurance
• Rev – Revision• RESRAD – Residual Radioactive Material
(environmental analysis code)• ROD – Record of Decision• RWMC – Radioactive Waste Management Complex• Rx - Reactor• SA – Special Analysis• SC – Steel Creek• SCDHEC – South Carolina Department of Health and
Environmental Control• sec – second• SDF – Saltstone Disposal Facility• SLB – Shallow Land Burial• SR – Savannah river• SREL – Savannah River Ecology Laboratory• SRNL – Savannah River National Laboratory• SRNS – Savannah River Nuclear Solutions• SRR – Savannah River Remediation• SRS – Savannah River Site• ST – Slit Trench Disposal Unit• TRU – Transuranic• U3RC – Upper Three Runs Creek• UDQ – Unreviewed Disposal Question• UDQE – Unreviewed Disposal Question Evaluation• US – United States of America• USGS – United States Geological Survey• USQ – Unreviewed Safety Question• UTR – Upper Three Runs• yr - year
1
Overview ofDOE’s Regulatory Compliance Process for
Approval of Performance Assessments
Sherri R. RossLow-Level Waste Disposal Facility Federal Review Group
DOE-SR Alternate Representative
2
Acronyms
CA – Composite Analysis
DAS – Sisposal Authorization Statement
DNFSB – Defense Nuclear Facility Safety Board
DOE – Department of Energy
EM – Environmental Management
LFRG – Low Level Waste Facility Federal Review Group
LLW – Low Level Waste
PA – Performance Assessment
2
3
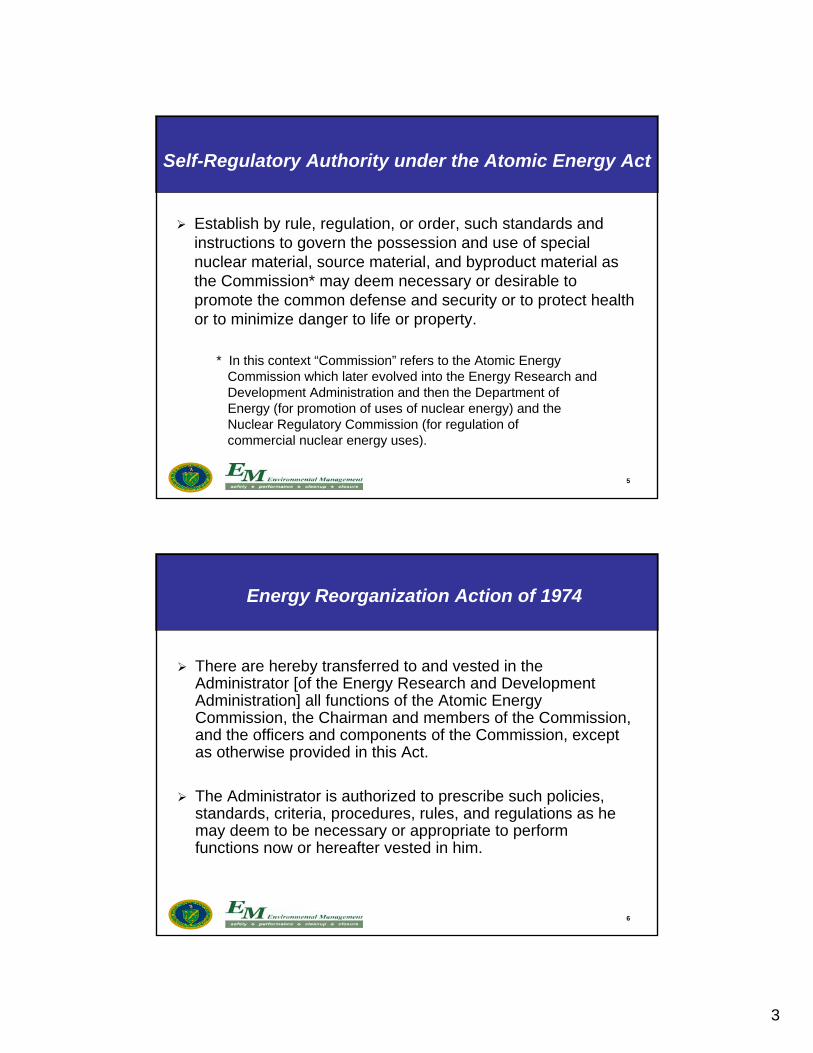
Explain DOE’s authority for management of radioactive waste
Explain DOE’s regulations for management of radioactive waste Focus on performance assessment requirements
Review and approval process of performance assessments
Explain ongoing efforts to update DOE’s regulations for management of radioactive waste
Purpose
4
Tank 50
DWPF
Saltstone
E/N-Area
PDCF/MOX/WSB
KAMS / KIS
L-Basin
Federal Repository
WIPP
MOX Product
Area Closure ProjectsSoil and Groundwater
D&D
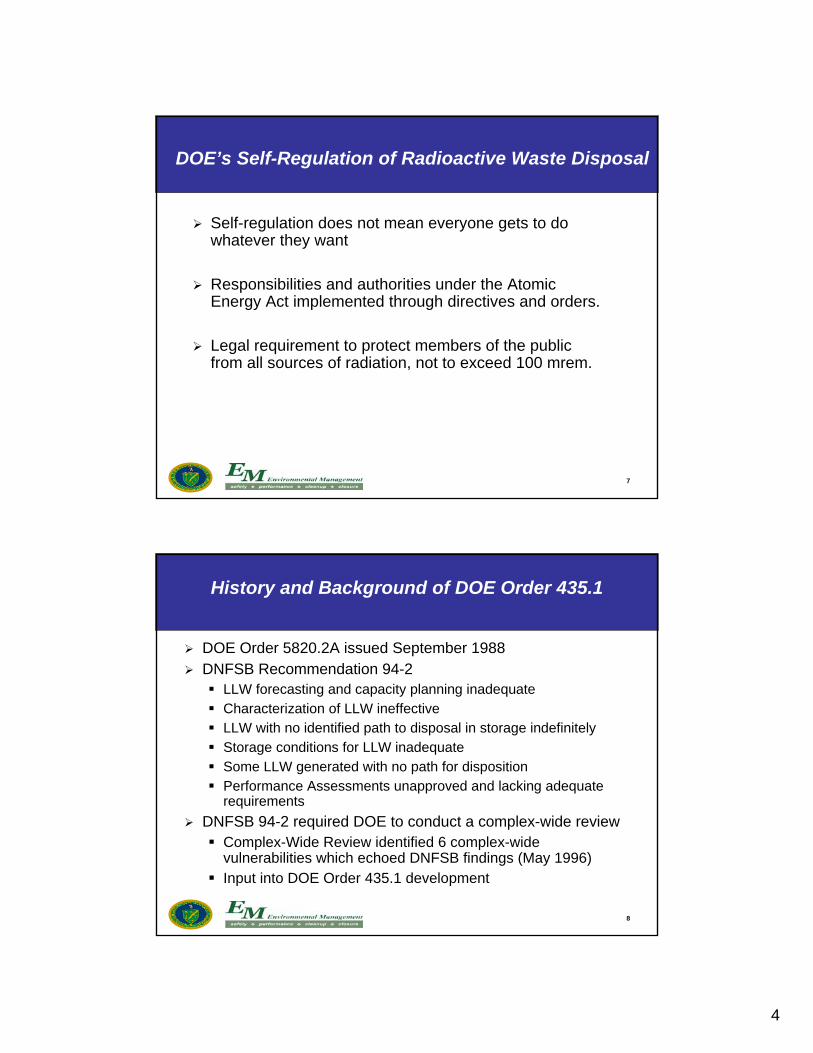
Savannah River SiteWaste and Material Flow Path
Excess Pu Consolidation
Excess Unirradiated
HEU Consolidation
Domestic Research Reactor Spent Fuel
Foreign Spent Fuel
Spent Nuclear Fuel
Unirradiated Uranium Materials (UUM)
“Non-Moxable” Pu
“MOXable
” Pu
TRU
Waste
TRU Waste
TRU Waste
LLW
Liquid Waste Failed
Equipment
LLW
(DDA)
HLW
DP
Irradiated Lithium Targets
LLW
Tritium Reservoirs
In-Situ
Off-Site Disposal e.g., Clive, Utah
LLW, MW & HW
C & D Landfill
Rubble
LLW Storage/Disposal
MW Storage
TRU Waste Storage
Off-Site Treatment & Disposal Facilities
HW/MW
Low-Enriched Uranium Solution
Public Landfills e.g., Three-Rivers
H Canyon
HB-Line
LLW
H-Completion Failed
Equipment
(LLW)
SRNL
Work for Others
Recycle Waste
HLWSludge
Salt WasteLLW
SWPF (future)
ARP/MCULLW
HLW
This depiction of SRS activities shows only the general scope of the major facilities and missions.
It does not represent all processes or all materials flow.
HW
/MW
ETP
LLW
F-Tank Farm (HLW)
H-Tank Farm (HLW)
Process
Support
Disposition Remediation
Non-Al SNFTo INLAl SNFFrom INL
Pu Waste (Added to sludge batch)
Pu PrepProject
Analytical Labs
Pits
GWSB
GlassWaste
InCanisters
GWSB
17
20
12
34
5
67
818
19
2526
2728
33
3444
4546
47
910
1112
13
1415
1621
22
2324
2930
31
3235
3637
38
3940
4142
43
4849
51
2F
3H
2H
2A
2B
II
II
I
II
I
I
II
I
III
II
II
IIII
IVIV
IVIV
IVIV
IV
IV
IIIIII
III
III
IIIIII
III
III
III
IIIIII
IIIIII
IIIIII
IIIIII
IIIIII
III
IIIIII
IIIIII
III
ACRONYMSAl - aluminumARP – Actinide Removal ProcessC&D - Construction and Demolition D&D - Decommissioning and DemolitionDDA - Deliquidification, Dissolution, and Adjustment DP – Defense ProgramsDWPF - Defense Waste Processing FacilityETP – Effluent Treatment ProjectGWSB – Glass Waste Storage Building
KAMS - K-Area Material Storage Facility Project KIS – K-Area Interim SurveillanceLLW - Low Level WasteHEU – Highly Enriched UraniumHLW – High Level WasteHW – Hazardous WasteINL – Idaho National LaboratoryMCU - Modular Caustic Side Solvent Extraction Unit MOX – Mixed Oxide MW – Mixed WastePDCF – Pit Disassembly and Conversion FacilityPu – PlutoniumSNF – Spent Nuclear FuelSRNL –Savannah River National LaboratorySWPF – Salt Waste Processing FacilityTRU – TransuranicWIPP - Waste Isolation Pilot PlantWSB - Waste Solidification Building
Process Materials Input
Product Leaving SiteWaste Leaving Site
Waste Disposed of On Site
Legend
On-Site Flow of Materials and Waste
Active Tank Closure
Tank 48 Organic Removal Project
3
5
Establish by rule, regulation, or order, such standards and instructions to govern the possession and use of special nuclear material, source material, and byproduct material as the Commission* may deem necessary or desirable to promote the common defense and security or to protect health or to minimize danger to life or property.
* In this context “Commission” refers to the Atomic Energy Commission which later evolved into the Energy Research and Development Administration and then the Department of Energy (for promotion of uses of nuclear energy) and the Nuclear Regulatory Commission (for regulation of commercial nuclear energy uses).
Self-Regulatory Authority under the Atomic Energy ActSelf-Regulatory Authority under the Atomic Energy Act
6
There are hereby transferred to and vested in the Administrator [of the Energy Research and Development Administration] all functions of the Atomic Energy Commission, the Chairman and members of the Commission, and the officers and components of the Commission, except as otherwise provided in this Act.
The Administrator is authorized to prescribe such policies, standards, criteria, procedures, rules, and regulations as he may deem to be necessary or appropriate to perform functions now or hereafter vested in him.
Energy Reorganization Action of 1974
4
7
Self-regulation does not mean everyone gets to do whatever they want
Responsibilities and authorities under the Atomic Energy Act implemented through directives and orders.
Legal requirement to protect members of the public from all sources of radiation, not to exceed 100 mrem.
DOE’s Self-Regulation of Radioactive Waste Disposal
8
History and Background of DOE Order 435.1
DOE Order 5820.2A issued September 1988 DNFSB Recommendation 94-2 LLW forecasting and capacity planning inadequate Characterization of LLW ineffective LLW with no identified path to disposal in storage indefinitely Storage conditions for LLW inadequate Some LLW generated with no path for disposition Performance Assessments unapproved and lacking adequate
requirements
DNFSB 94-2 required DOE to conduct a complex-wide review Complex-Wide Review identified 6 complex-wide
vulnerabilities which echoed DNFSB findings (May 1996) Input into DOE Order 435.1 development
5
9
How DOE Order 435.1 was created
Began Order writing process September 1996
Four teams of Headquarters and Field staff
High Level Waste
Transuranic Waste
Low Level Waste/Mixed Low Level Waste
General Requirements
Structured process of workshops and steps
July 9, 1999 issued Order, Manual, Guidance, Technical Basis, and training program
10
Effective implementation date July 2000
Establishes DOE HQ/Site responsibilities
Low-Level Waste Disposal Facility Federal Review Group (LFRG)
Establishes Performance Objective and Requirements governing disposal actions:
25 mrem all pathways dose
10 mrem air pathway
20 pCi/m2/second radon flux
Intruder Scenario
DOE Order 435.1, Radioactive Waste Management
6
11
LFRG Manual LFRG Program Management Plan Format and Content Guide for Performance
Assessments and Composite Analyses Closure Guide Maintenance Guide Monitoring Guidance
LFRG Framework and Processes
12
Martin J. Letourneau, Chair, EM Office of Compliance Dave Adler, Oak Ridge Operations Office Frank DiSanza, Nevada Site Office Doug Hildebrand, Richland Operations Office Bob Lober, Office of River Protection Barry Parks, Office of Science Mike Simmons (Primary), Savannah River Operations Office Sherri Ross (Alternate), Savannah River Operations Office Andy Wallo, Office of Health, Safety and Security Mary Willcox, Idaho Operations Office Alice Williams, National Nuclear Security Administration
LFRG Composition
7
13
Approved Disposal Authorization Statement (DAS)
Approved Performance Assessment (PA) Approved Composite Analysis (CA) Preliminary Closure Plan Monitoring Plan PA/CA Maintenance Plan Annual Summaries Radioactive Waste Management Basis
Authorization Requirements
14
Track and report preparation of compliance documentation
Develop and conduct formal review processes Review compliance documentation submitted by sites in
support of disposal authorization statements Provide LFRG recommendations to EM senior managers Prepare disposal authorization statements for disposal
facilities Conduct other reviews and assessments as directed by
EM senior management (e.g., waste determinations and transuranic waste disposal performance assessments)
LFRG Roles and Responsibilities
8
15
Site and Facility Characteristics -- 7 criteria Radioactive Sources and Release Mechanisms -- 6 criteria Performance Objectives and Measures -- 8 criteria Point of Assessment -- 6 criteria Conceptual Model -- 5 criteria Mathematical Models -- 13 criteria Assumptions -- 2 criteria Exposure Pathways and Dose Analysis -- 14 criteria Sensitivity and Uncertainty -- 7 criteria ALARA and Options Analysis -- 3 criteria Results Integration -- 11 criteria Quality Assurance -- 2 criteria
LFRG Review Topics and Review Criteria for PAs & CAs
16
Site Representative submits PA/CA LFRG determines suitability for review LFRG appoints review team leader and team members Review team prepares review plan and LFRG approves Team performs review and prepares draft report Site provides factual accuracy review Team edits and submits report to the LFRG LFRG approves PA, develops Compliance Evaluation and
Disposal Authorization Statement (DAS) and provides recommendation to the Deputy Assistant Secretary
Deputy Assistant Secretary approves DAS
LFRG Review Process (Overall)
9
17
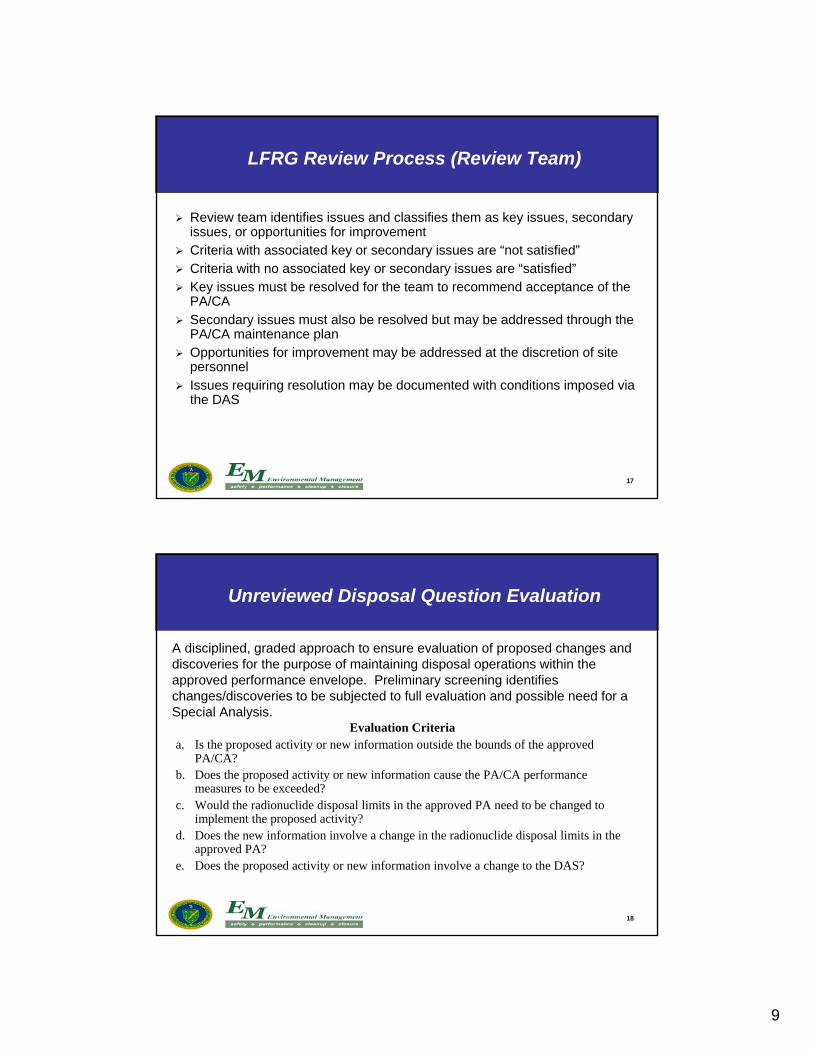
Review team identifies issues and classifies them as key issues, secondary issues, or opportunities for improvement
Criteria with associated key or secondary issues are “not satisfied” Criteria with no associated key or secondary issues are “satisfied” Key issues must be resolved for the team to recommend acceptance of the
PA/CA Secondary issues must also be resolved but may be addressed through the
PA/CA maintenance plan Opportunities for improvement may be addressed at the discretion of site
personnel Issues requiring resolution may be documented with conditions imposed via
the DAS
LFRG Review Process (Review Team)
18
A disciplined, graded approach to ensure evaluation of proposed changes and discoveries for the purpose of maintaining disposal operations within the approved performance envelope. Preliminary screening identifieschanges/discoveries to be subjected to full evaluation and possible need for a Special Analysis.
Unreviewed Disposal Question Evaluation
Evaluation Criteriaa. Is the proposed activity or new information outside the bounds of the approved
PA/CA?b. Does the proposed activity or new information cause the PA/CA performance
measures to be exceeded?c. Would the radionuclide disposal limits in the approved PA need to be changed to
implement the proposed activity?d. Does the new information involve a change in the radionuclide disposal limits in the
approved PA?e. Does the proposed activity or new information involve a change to the DAS?
10
19
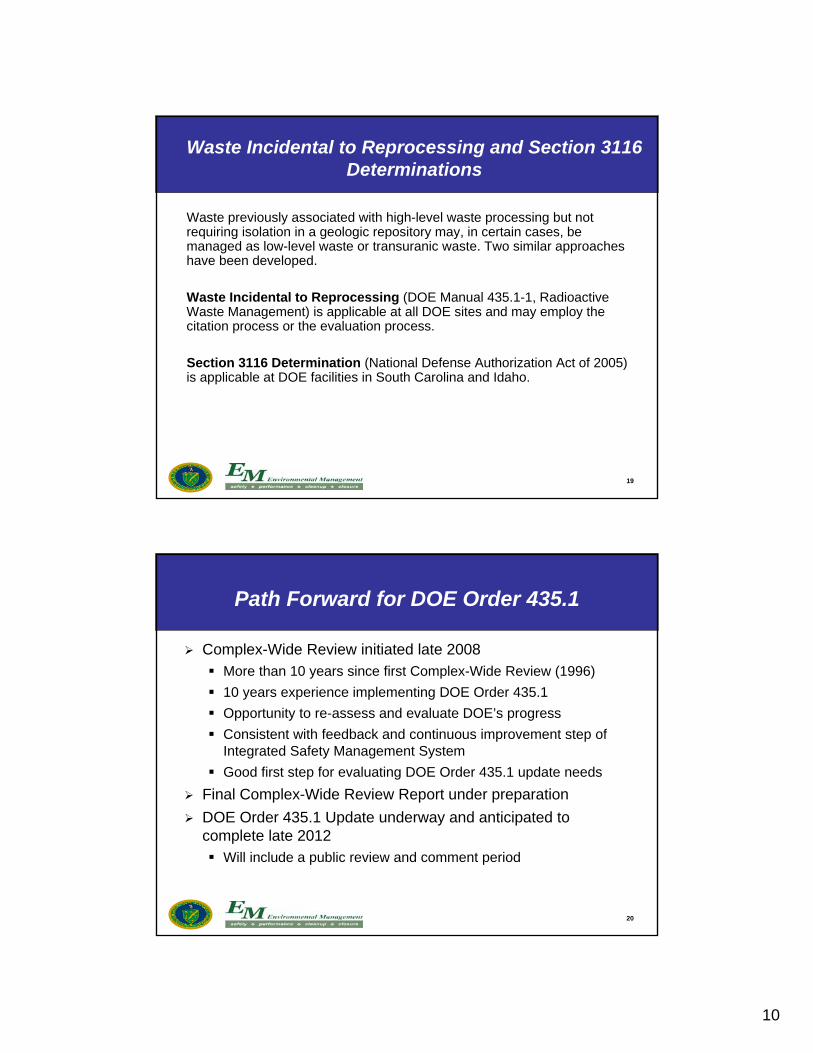
Waste previously associated with high-level waste processing but not requiring isolation in a geologic repository may, in certain cases, be managed as low-level waste or transuranic waste. Two similar approaches have been developed.
Waste Incidental to Reprocessing (DOE Manual 435.1-1, Radioactive Waste Management) is applicable at all DOE sites and may employ the citation process or the evaluation process.
Section 3116 Determination (National Defense Authorization Act of 2005) is applicable at DOE facilities in South Carolina and Idaho.
Waste Incidental to Reprocessing and Section 3116 Determinations
20
Path Forward for DOE Order 435.1
Complex-Wide Review initiated late 2008 More than 10 years since first Complex-Wide Review (1996)
10 years experience implementing DOE Order 435.1
Opportunity to re-assess and evaluate DOE’s progress
Consistent with feedback and continuous improvement step of Integrated Safety Management System
Good first step for evaluating DOE Order 435.1 update needs
Final Complex-Wide Review Report under preparation
DOE Order 435.1 Update underway and anticipated to complete late 2012 Will include a public review and comment period
1PA Educational Forum 5/18/2010
D O C U M E N T A T I O N & I N F O R M A T I O N S E R V I C E S 1
History of Performance AssessmentDevelopment at SRS
Savannah River SiteMay 18, 2010
Sonny Goldston and Elmer Wilhite
Performance Assessment Educational Forum
SRNL-STI-2010-00288
2PA Educational Forum 5/18/2010
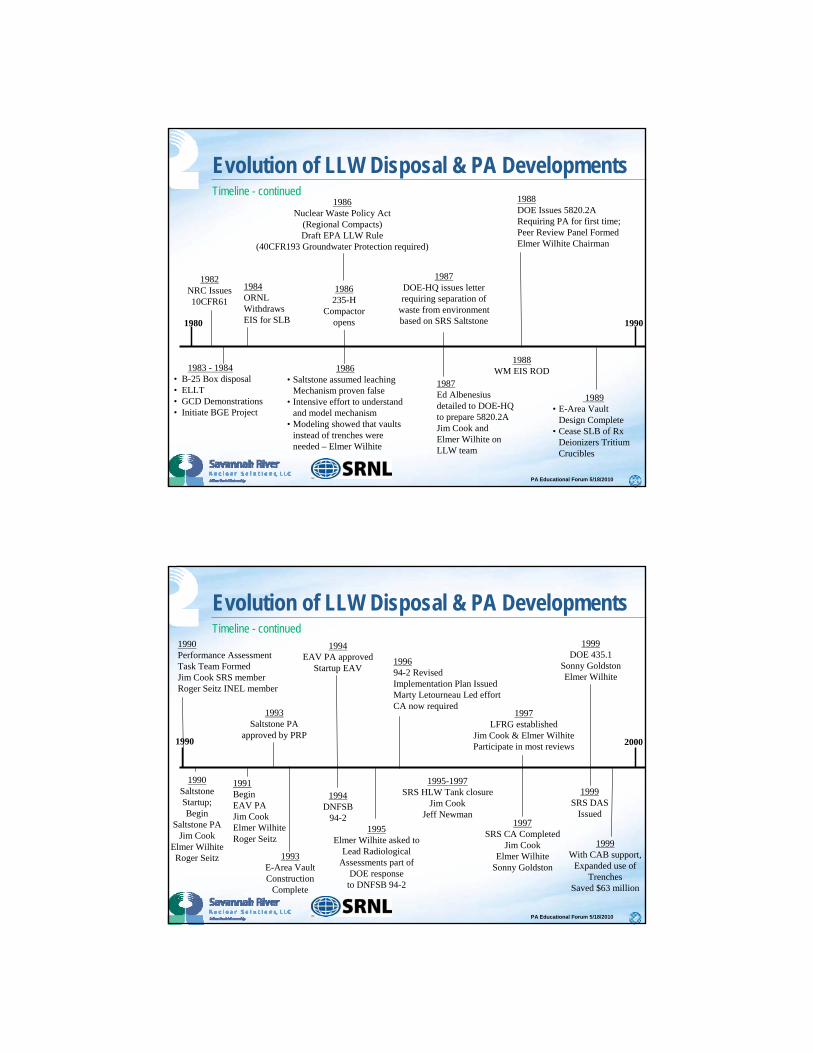
1965 – 1980sIntensive Study of Shallow-Land Burial
• Subsurface Monitoring• Lysimeters• Exhumation of waste – Perry Holcomb• Vegetative uptake• Cover stabilization• Pre-SRS use of Burial Ground• Pathways Analysis – Elmer Wilhite
Evolution of LLW Disposal & PA DevelopmentsTimeline
195376-AcreBurial GroundOpens
1956Burial GroundPerimeterWells Installed
1960
1960 - 1970Five CommercialDisposal Facilities
Open1970
1971Barnwell
Burial GroundOpens
1970119-Acre
Burial GroundOpens
1980
1975 - 1978Burial Ground Closures, West
Valley, SheffieldMaxey Flats
1973 – 1980sDevelopment and
use of DOSTOMANPA Code
Elmer Wilhite
197276-Acre
Burial Groundcloses
National
Developments
SRSDevelopments
3PA Educational Forum 5/18/2010
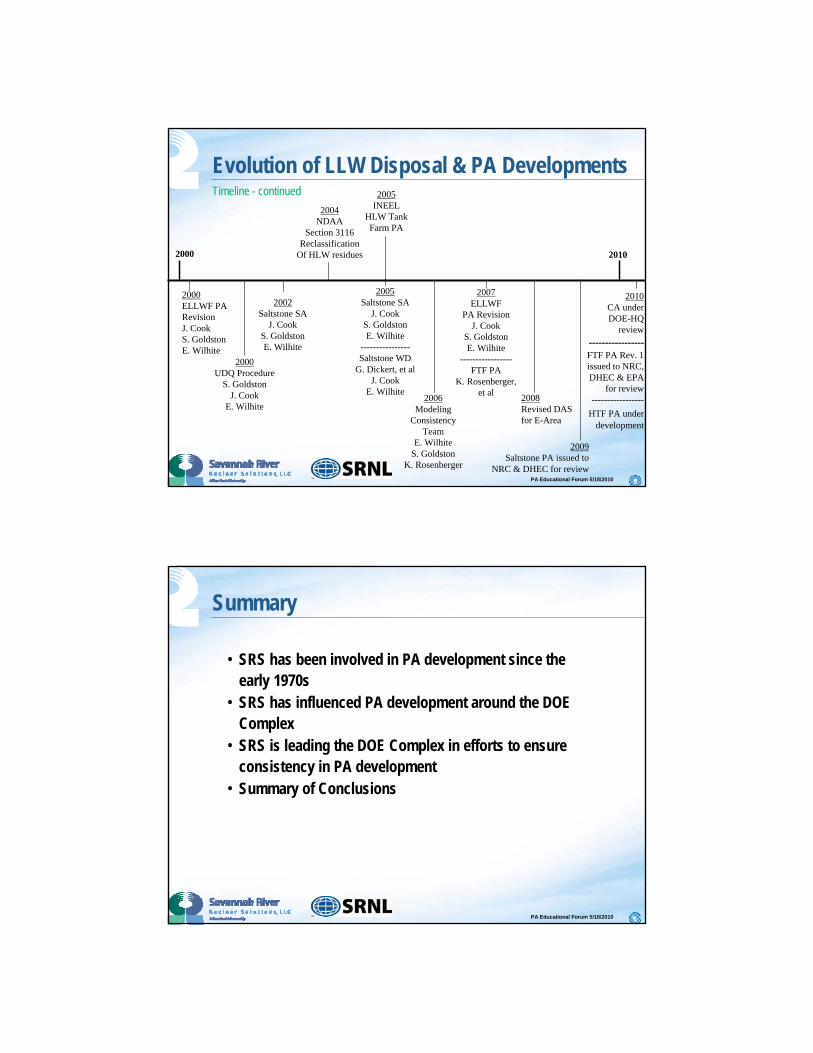
Evolution of LLW Disposal & PA DevelopmentsTimeline - continued
1983 - 1984• B-25 Box disposal• ELLT• GCD Demonstrations• Initiate BGE Project
1980
1986235-H
Compactoropens
1986Nuclear Waste Policy Act
(Regional Compacts)Draft EPA LLW Rule
(40CFR193 Groundwater Protection required)
1990
1982NRC Issues10CFR61
1984ORNLWithdrawsEIS for SLB
1987Ed Albenesius detailed to DOE-HQto prepare 5820.2AJim Cook and Elmer Wilhite on LLW team
1987DOE-HQ issues letterrequiring separation of
waste from environmentbased on SRS Saltstone
1988DOE Issues 5820.2ARequiring PA for first time;Peer Review Panel FormedElmer Wilhite Chairman
1988WM EIS ROD
1989• E-Area Vault
Design Complete• Cease SLB of Rx
Deionizers TritiumCrucibles
1986• Saltstone assumed leaching
Mechanism proven false• Intensive effort to understand
and model mechanism• Modeling showed that vaults
instead of trenches wereneeded – Elmer Wilhite
4PA Educational Forum 5/18/2010
Evolution of LLW Disposal & PA DevelopmentsTimeline - continued
1990
1991BeginEAV PAJim CookElmer WilhiteRoger Seitz
1993E-Area VaultConstruction
Complete
1994EAV PA approved
Startup EAV
1990Performance AssessmentTask Team FormedJim Cook SRS memberRoger Seitz INEL member
1990SaltstoneStartup;Begin
Saltstone PAJim Cook
Elmer WilhiteRoger Seitz
1993Saltstone PA
approved by PRP
1994DNFSB
94-21995
Elmer Wilhite asked toLead Radiological
Assessments part ofDOE response
to DNFSB 94-2
2000
1997SRS CA Completed
Jim CookElmer Wilhite
Sonny Goldston
1999DOE 435.1
Sonny GoldstonElmer Wilhite
199694-2 RevisedImplementation Plan IssuedMarty Letourneau Led effortCA now required
1999SRS DAS
Issued
1997LFRG established
Jim Cook & Elmer WilhiteParticipate in most reviews
1999With CAB support,
Expanded use ofTrenches
Saved $63 million
1995-1997SRS HLW Tank closure
Jim CookJeff Newman
5PA Educational Forum 5/18/2010
Evolution of LLW Disposal & PA DevelopmentsTimeline - continued
2000 2010
2000ELLWF PARevisionJ. CookS. GoldstonE. Wilhite
2002Saltstone SA
J. CookS. GoldstonE. Wilhite
2005Saltstone SA
J. CookS. GoldstonE. Wilhite
----------------Saltstone WD
G. Dickert, et alJ. Cook
E. Wilhite
2004NDAA
Section 3116Reclassification
Of HLW residues
2005INEEL
HLW TankFarm PA
2000UDQ Procedure
S. GoldstonJ. Cook
E. Wilhite
2007ELLWF
PA RevisionJ. Cook
S. GoldstonE. Wilhite
-----------------FTF PA
K. Rosenberger,et al
2006Modeling
ConsistencyTeam
E. WilhiteS. Goldston
K. Rosenberger
2008Revised DASfor E-Area
2009Saltstone PA issued to
NRC & DHEC for review
2010CA underDOE-HQ
review
-----------------FTF PA Rev. 1issued to NRC,DHEC & EPA
for review-----------------
HTF PA underdevelopment
6PA Educational Forum 5/18/2010
Summary
• SRS has been involved in PA development since the early 1970s
• SRS has influenced PA development around the DOE Complex
• SRS is leading the DOE Complex in efforts to ensure consistency in PA development
• Summary of Conclusions
Performance Assessment (PA)Overview
Roger Seitz
18 May 2010
PA Educational Forum SRNL-MS-2010-00089
2PA Educational Forum May 18, 2010
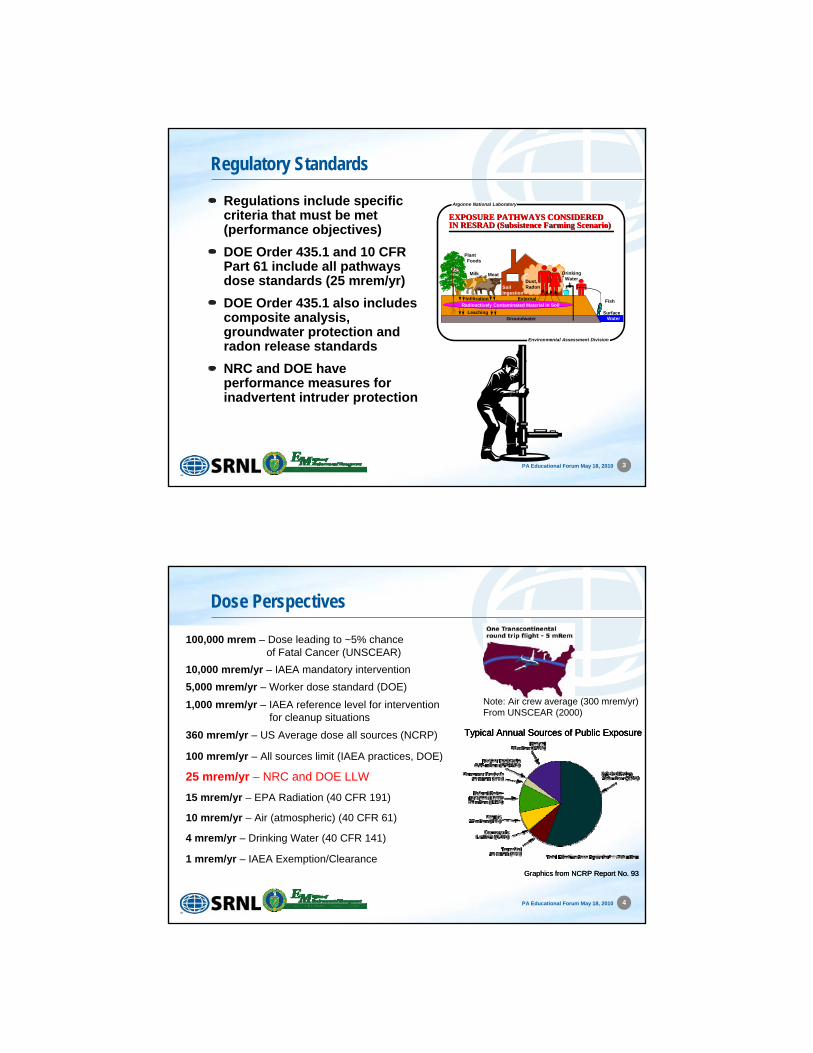
Radiation Concepts
Curie (Ci) or Becquerel (Bq) – amount of radioactivity
1 Ci is equivalent to 37 billion Bq
1 Bq = 1 disintegration per second
Half-Life – time required for the amount of radioactivity to decay to ½ starting value
Cs-137 has a ~30 yr half-life, if we start with 2 Ci, there will be 1 Ci remaining after 30 yr
Effective Dose (millirem (mrem) or milliSievert(mSv)) is a measure of impact of radioactivity
100 mrem is equivalent to 1 mSv
3PA Educational Forum May 18, 2010
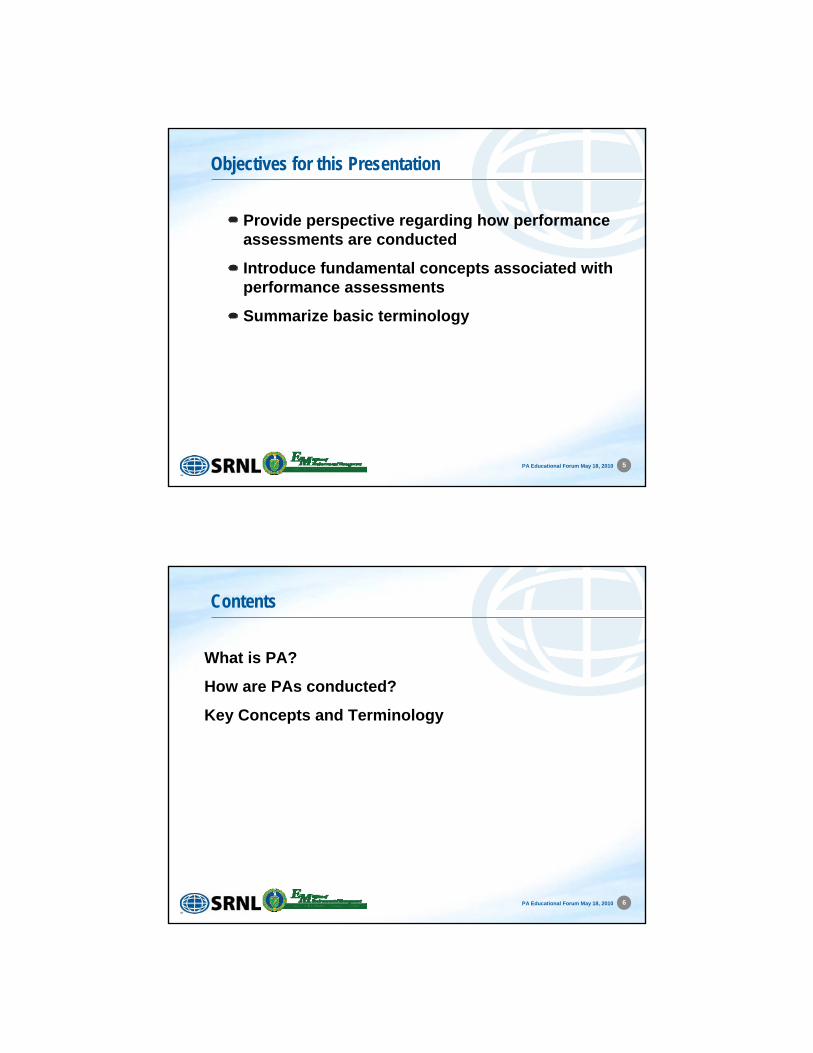
Regulatory Standards
Regulations include specific criteria that must be met (performance objectives)
DOE Order 435.1 and 10 CFR Part 61 include all pathways dose standards (25 mrem/yr)
DOE Order 435.1 also includes composite analysis, groundwater protection and radon release standards
NRC and DOE have performance measures for inadvertent intruder protection
Environmental Assessment Division
Argonne National Laboratory
EXPOSURE PATHWAYS CONSIDEREDEXPOSURE PATHWAYS CONSIDEREDIN RESRAD (Subsistence Farming Scenario)IN RESRAD (Subsistence Farming Scenario)
Dust,Radon
DrinkingWater
Fish
Plant Foods
MeatMilk
Radioactively Contaminated Material in Soil
SoilIngestion
Infiltration
Leaching
External
Surface WaterGroundwater
4PA Educational Forum May 18, 2010
Dose Perspectives
1 mrem/yr
15 mrem/yr
100 mrem/yr
25 mrem/yr – NRC and DOE LLW
1,000 mrem/yr
360 mrem/yr
4 mrem/yr
5,000 mrem/yr
100,000 mrem
10,000 mrem/yr
10 mrem/yr
1,000 mrem/yr – IAEA reference level for interventionfor cleanup situations
5,000 mrem/yr – Worker dose standard (DOE)
10,000 mrem/yr – IAEA mandatory intervention
100,000 mrem – Dose leading to ~5% chance of Fatal Cancer (UNSCEAR)
Graphics from NCRP Report No. 93
Typical Annual Sources of Public Exposure
Graphics from NCRP Report No. 93
Typical Annual Sources of Public ExposureTypical Annual Sources of Public Exposure
100 mrem/yr – All sources limit (IAEA practices, DOE)
360 mrem/yr – US Average dose all sources (NCRP)
Note: Air crew average (300 mrem/yr)From UNSCEAR (2000)
1 mrem/yr – IAEA Exemption/Clearance
15 mrem/yr – EPA Radiation (40 CFR 191)
4 mrem/yr – Drinking Water (40 CFR 141)
10 mrem/yr – Air (atmospheric) (40 CFR 61)
5PA Educational Forum May 18, 2010
Objectives for this Presentation
Provide perspective regarding how performance assessments are conducted
Introduce fundamental concepts associated with performance assessments
Summarize basic terminology
6PA Educational Forum May 18, 2010
Contents
What is PA?
How are PAs conducted?
Key Concepts and Terminology
7PA Educational Forum May 18, 2010
What is PA?
8PA Educational Forum May 18, 2010
Performance Assessment Applications
Development of Waste Acceptance Criteria for disposal facilities – waste forms, radionuclide content, etc.
Estimate health effects associated with leaving different amounts of waste in tanks or different levels of contamination in facilities
Evaluation of health effects associated with different options for remediation or D&D
PA provides capability to be able to distinguish benefits of specific features
9PA Educational Forum May 18, 2010
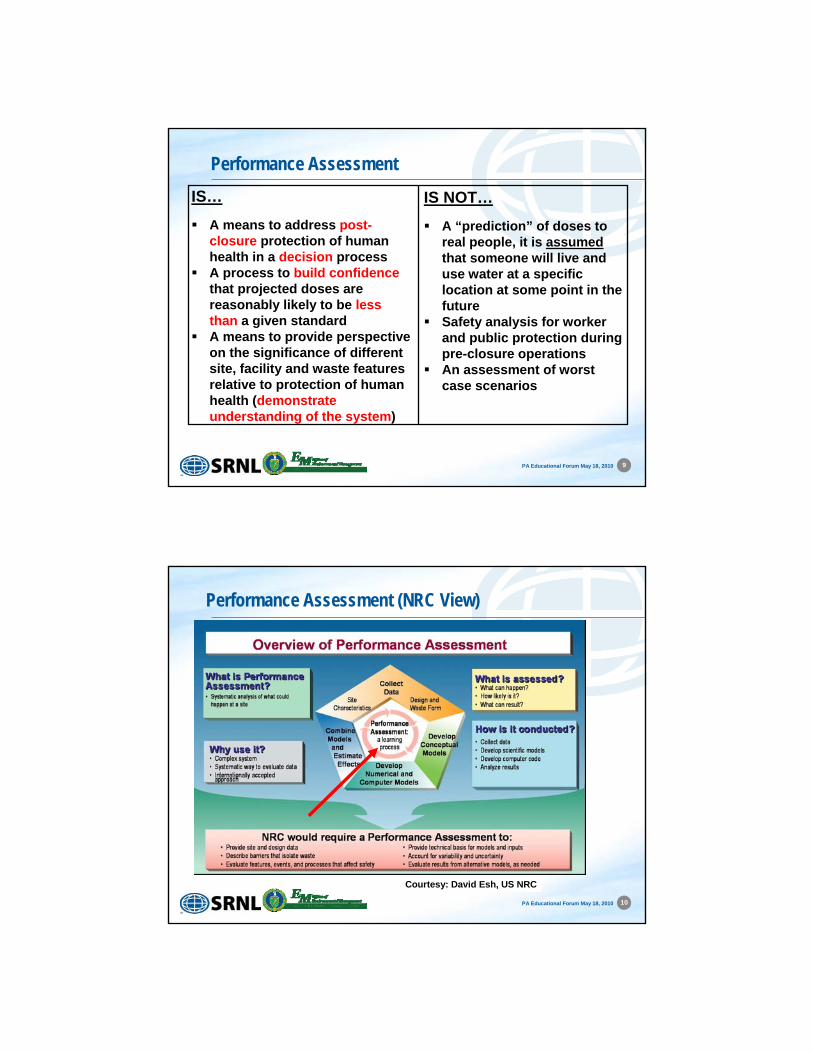
Performance AssessmentIS…
A means to address post-closure protection of human health in a decision process
A process to build confidencethat projected doses are reasonably likely to be less than a given standard
A means to provide perspective on the significance of different site, facility and waste features relative to protection of human health (demonstrate understanding of the system)
IS NOT…
A “prediction” of doses to real people, it is assumedthat someone will live and use water at a specific location at some point in the future
Safety analysis for worker and public protection during pre-closure operations
An assessment of worst case scenarios
10PA Educational Forum May 18, 2010
Performance Assessment (NRC View)
Courtesy: David Esh, US NRC
11PA Educational Forum May 18, 2010
Uncertainty
Courtesy: Bruce Crowe, Nevada Test Site
Structural Uncertainty
Structural Uncertainty
Statistical Uncertainty
12PA Educational Forum May 18, 2010
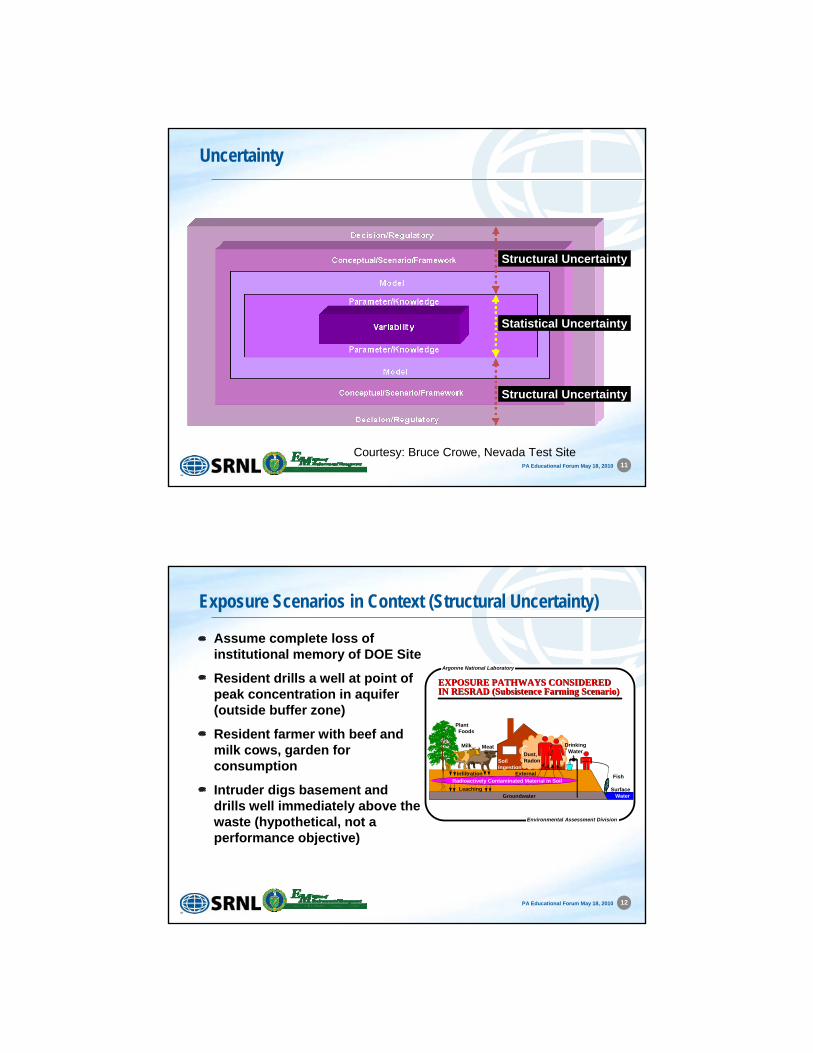
Exposure Scenarios in Context (Structural Uncertainty)
Assume complete loss of institutional memory of DOE Site
Resident drills a well at point of peak concentration in aquifer (outside buffer zone)
Resident farmer with beef and milk cows, garden for consumption
Intruder digs basement and drills well immediately above the waste (hypothetical, not a performance objective)
Environmental Assessment Division
Argonne National Laboratory
EXPOSURE PATHWAYS CONSIDEREDEXPOSURE PATHWAYS CONSIDEREDIN RESRAD (Subsistence Farming Scenario)IN RESRAD (Subsistence Farming Scenario)
Dust,Radon
DrinkingWater
Fish
Plant Foods
MeatMilk
Radioactively Contaminated Material in Soil
SoilIngestion
Infiltration
Leaching
External
Surface WaterGroundwater
13PA Educational Forum May 18, 2010
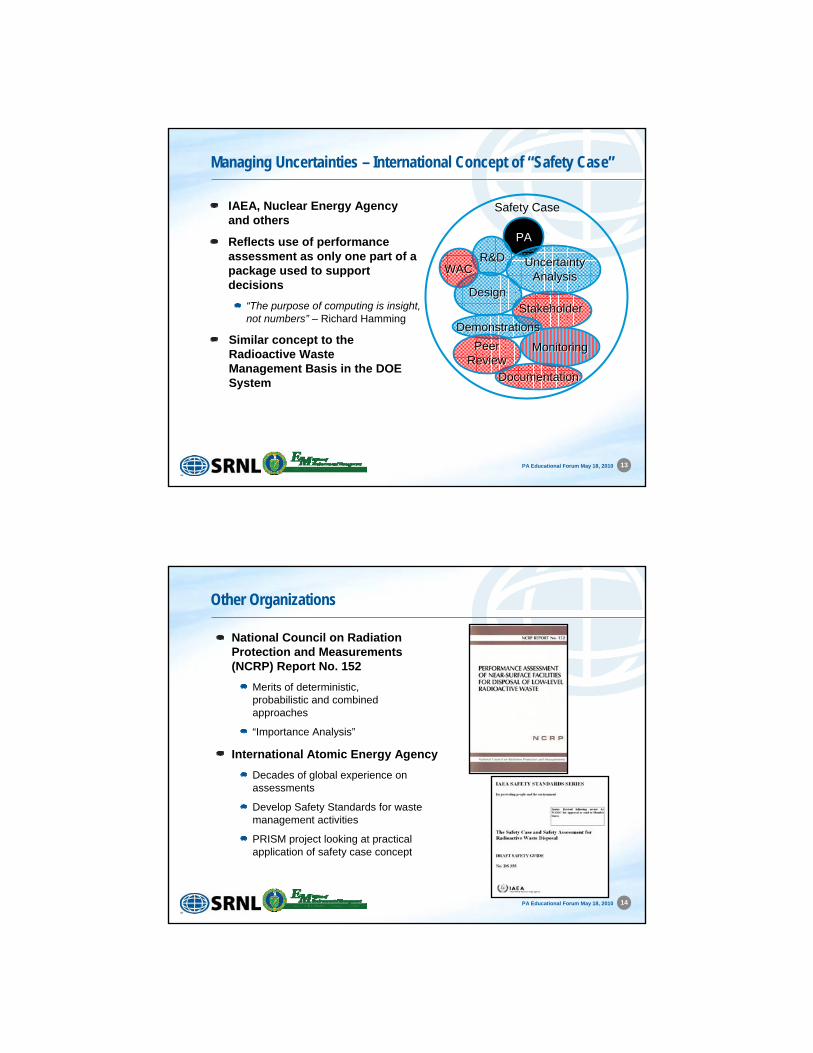
Managing Uncertainties – International Concept of “Safety Case”
IAEA, Nuclear Energy Agency and others
Reflects use of performance assessment as only one part of a package used to support decisions
“The purpose of computing is insight, not numbers” – Richard Hamming
PA
UncertaintyAnalysis
UncertaintyAnalysis
Similar concept to the Radioactive Waste Management Basis in the DOE System
Safety Case
DesignDesign
StakeholderStakeholder
DemonstrationsDemonstrations
R&DR&D
MonitoringMonitoring
DocumentationDocumentation
WACWAC
PeerReviewPeer
Review
14PA Educational Forum May 18, 2010
Other Organizations
National Council on Radiation Protection and Measurements (NCRP) Report No. 152
Merits of deterministic, probabilistic and combined approaches
“Importance Analysis”
International Atomic Energy Agency
Decades of global experience on assessments
Develop Safety Standards for waste management activities
PRISM project looking at practical application of safety case concept
15PA Educational Forum May 18, 2010
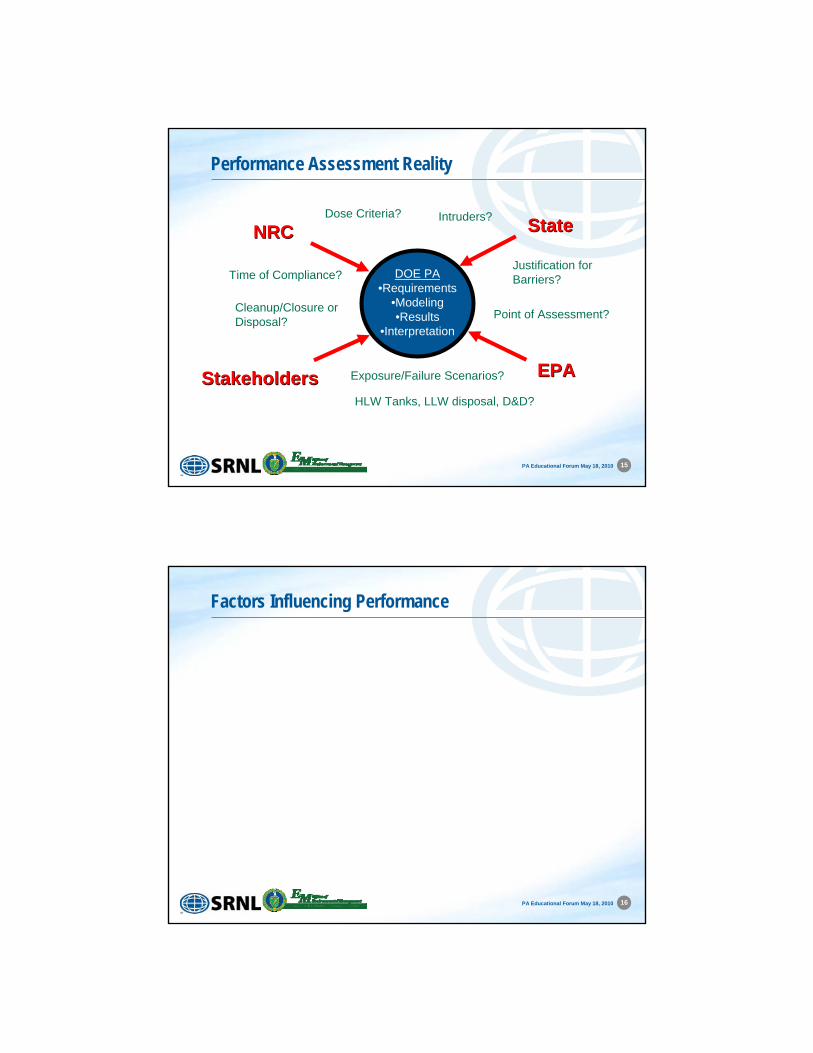
Performance Assessment Reality
DOE PA•Requirements
•Modeling•Results
•Interpretation
Dose Criteria? Intruders?
Exposure/Failure Scenarios?
Time of Compliance?
Point of Assessment?Cleanup/Closure orDisposal?
Justification forBarriers?
HLW Tanks, LLW disposal, D&D?
NRCNRC
StakeholdersStakeholders EPAEPA
StateState
16PA Educational Forum May 18, 2010
Factors Influencing Performance
17PA Educational Forum May 18, 2010
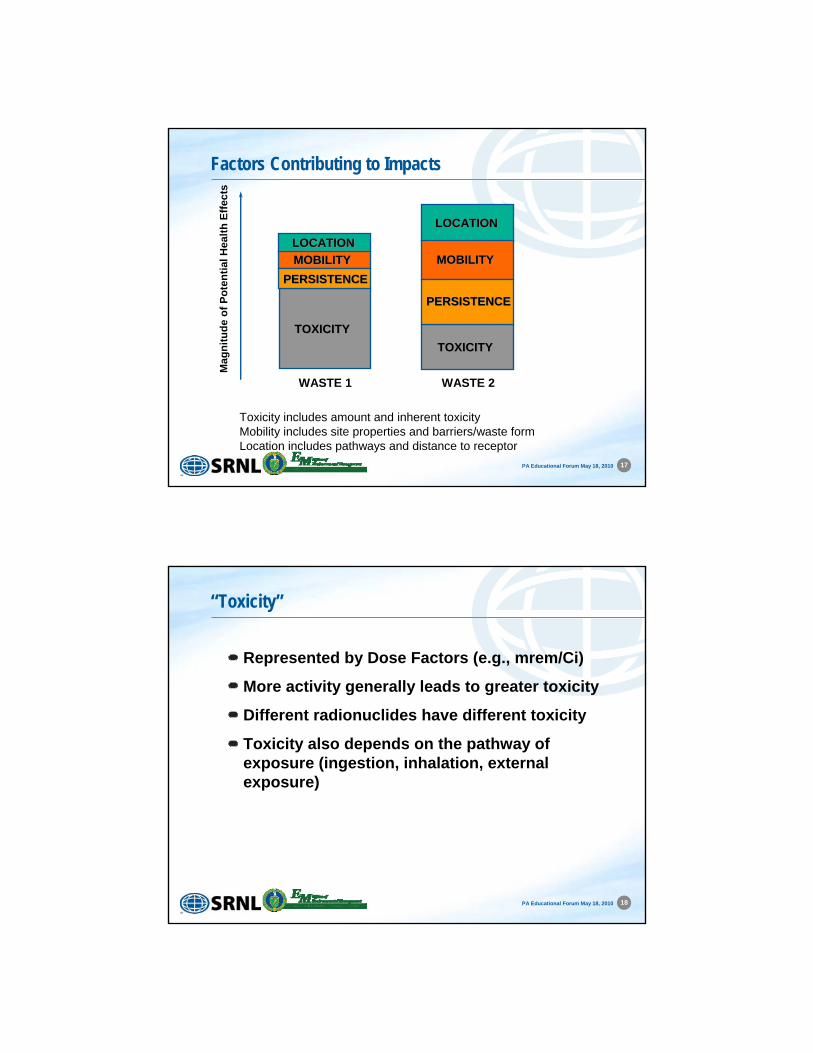
Factors Contributing to Impacts
Mag
nit
ud
e o
f P
ote
nti
al H
ealt
h E
ffec
ts
WASTE 2
TOXICITYTOXICITY
TOXICITYTOXICITY
WASTE 1
LOCATIONLOCATION
LOCATIONLOCATION
MOBILITYMOBILITY MOBILITYMOBILITY
PERSISTENCEPERSISTENCE
PERSISTENCEPERSISTENCE
Toxicity includes amount and inherent toxicityMobility includes site properties and barriers/waste formLocation includes pathways and distance to receptor
18PA Educational Forum May 18, 2010
“Toxicity”
Represented by Dose Factors (e.g., mrem/Ci)
More activity generally leads to greater toxicity
Different radionuclides have different toxicity
Toxicity also depends on the pathway of exposure (ingestion, inhalation, external exposure)
19PA Educational Forum May 18, 2010
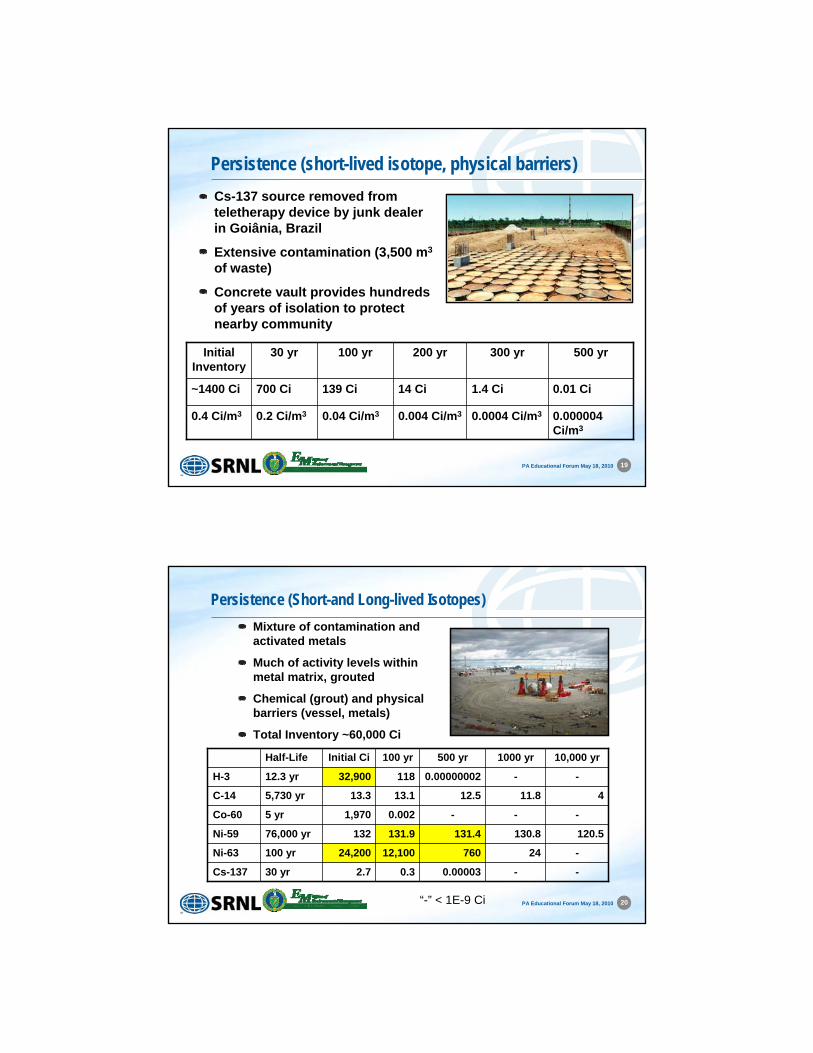
Persistence (short-lived isotope, physical barriers)Cs-137 source removed from teletherapy device by junk dealer in Goiânia, Brazil
Extensive contamination (3,500 m3
of waste)
Concrete vault provides hundreds of years of isolation to protect nearby community
0.01 Ci1.4 Ci14 Ci139 Ci700 Ci~1400 Ci
0.000004 Ci/m3
0.0004 Ci/m30.004 Ci/m30.04 Ci/m30.2 Ci/m30.4 Ci/m3
500 yr300 yr200 yr100 yr30 yrInitial Inventory
20PA Educational Forum May 18, 2010
Persistence (Short-and Long-lived Isotopes)Mixture of contamination and activated metals
Much of activity levels within metal matrix, grouted
Chemical (grout) and physical barriers (vessel, metals)
Total Inventory ~60,000 Ci
30 yr
100 yr
76,000 yr
5 yr
5,730 yr
12.3 yr
Half-Life
-2476012,10024,200Ni-63
-
130.8
-
11.8
-
1000 yr
-0.000030.32.7Cs-137
120.5131.4131.9132Ni-59
--0.0021,970Co-60
412.513.113.3C-14
-0.0000000211832,900H-3
10,000 yr500 yr100 yrInitial Ci
“-” < 1E-9 Ci
21PA Educational Forum May 18, 2010
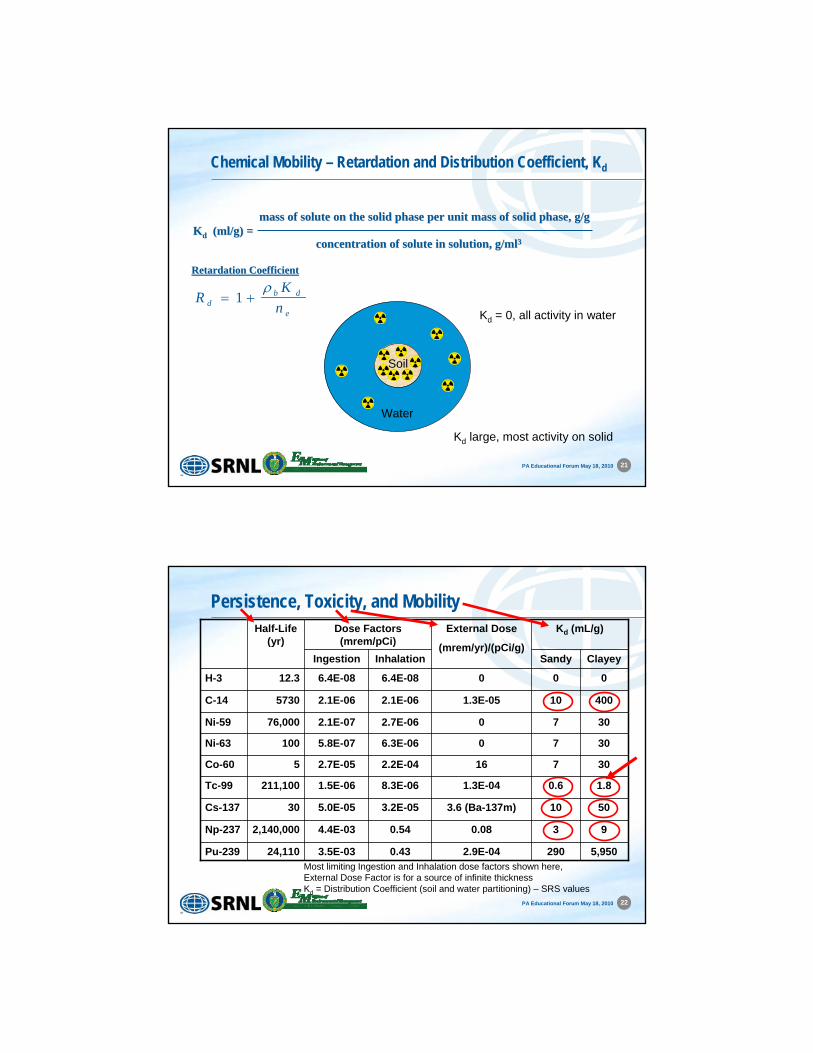
Chemical Mobility – Retardation and Distribution Coefficient, Kd
mass of solute on the solid phase per unit mass of solid phase, mass of solute on the solid phase per unit mass of solid phase, g/gg/g
concentration of solute in solution, g/mlconcentration of solute in solution, g/ml33KKdd (ml/g) =(ml/g) =
Water
Soil
Kd = 0, all activity in water
Kd large, most activity on solid
RK
ndb d
e
1
Retardation CoefficientRetardation Coefficient
22PA Educational Forum May 18, 2010
Persistence, Toxicity, and Mobility
2.9E-04
0.08
3.6 (Ba-137m)
1.3E-04
16
0
0
1.3E-05
0
External Dose
(mrem/yr)/(pCi/g)
50103.2E-055.0E-0530Cs-137
3076.3E-065.8E-07100Ni-63
3072.7E-062.1E-0776,000Ni-59
Kd (mL/g)Dose Factors (mrem/pCi)
1.80.68.3E-061.5E-06211,100Tc-99
5,9502900.433.5E-0324,110Pu-239
930.544.4E-032,140,000Np-237
3072.2E-042.7E-055Co-60
400102.1E-062.1E-065730C-14
006.4E-086.4E-0812.3H-3
ClayeySandyInhalationIngestion
Half-Life (yr)
Most limiting Ingestion and Inhalation dose factors shown here, External Dose Factor is for a source of infinite thicknessKd = Distribution Coefficient (soil and water partitioning) – SRS values
23PA Educational Forum May 18, 2010
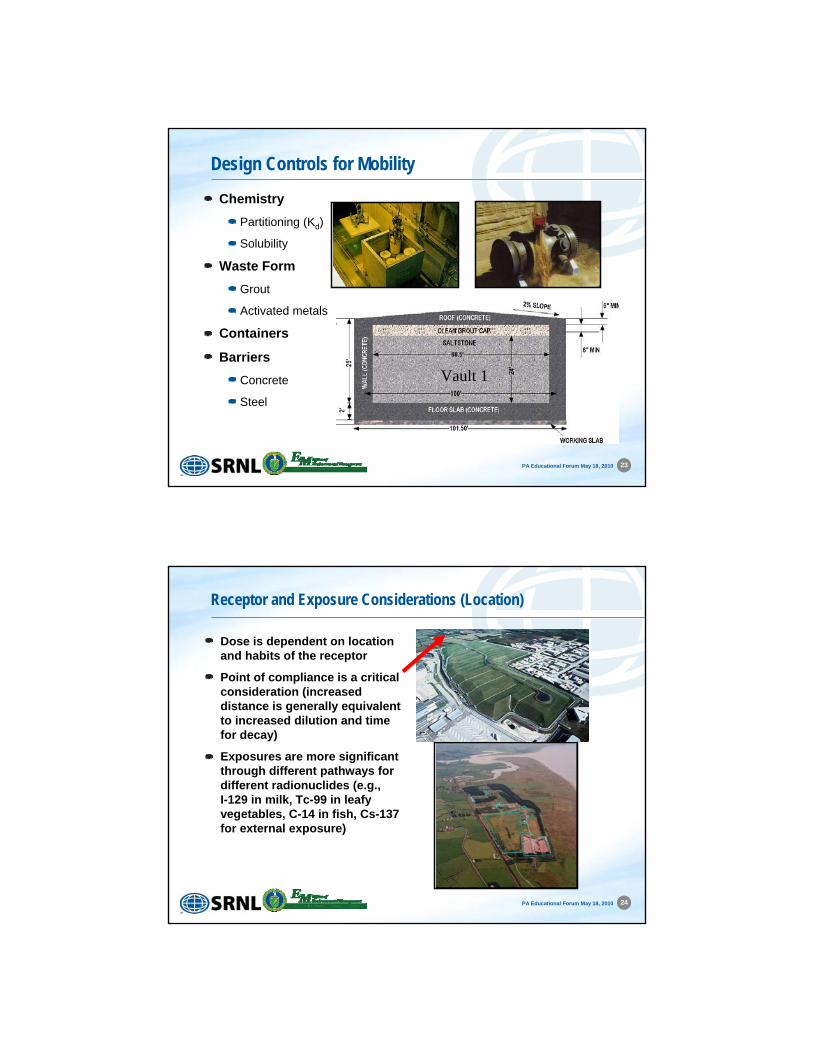
Design Controls for Mobility
Chemistry
Partitioning (Kd)
Solubility
Waste Form
Grout
Activated metals
Containers
Barriers
Concrete
Steel
Vault 1
24PA Educational Forum May 18, 2010
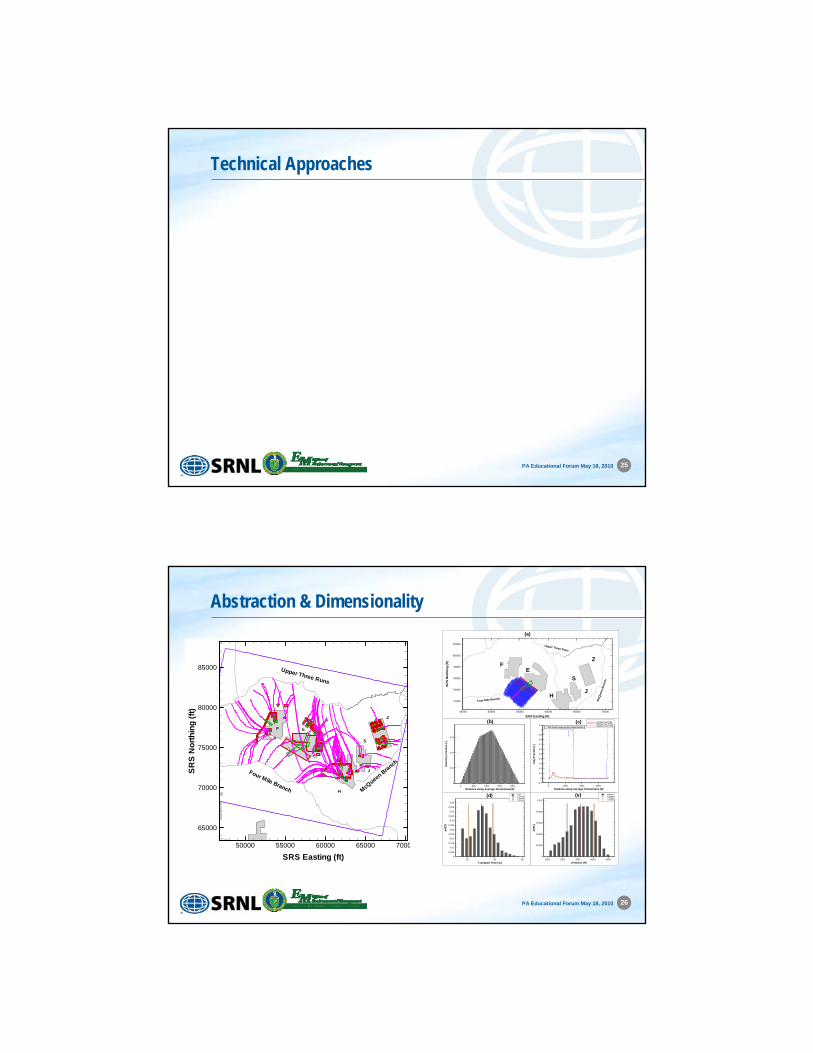
Receptor and Exposure Considerations (Location)
Dose is dependent on location and habits of the receptor
Point of compliance is a critical consideration (increased distance is generally equivalent to increased dilution and time for decay)
Exposures are more significant through different pathways for different radionuclides (e.g., I-129 in milk, Tc-99 in leafy vegetables, C-14 in fish, Cs-137 for external exposure)
25PA Educational Forum May 18, 2010
Technical Approaches
26PA Educational Forum May 18, 2010
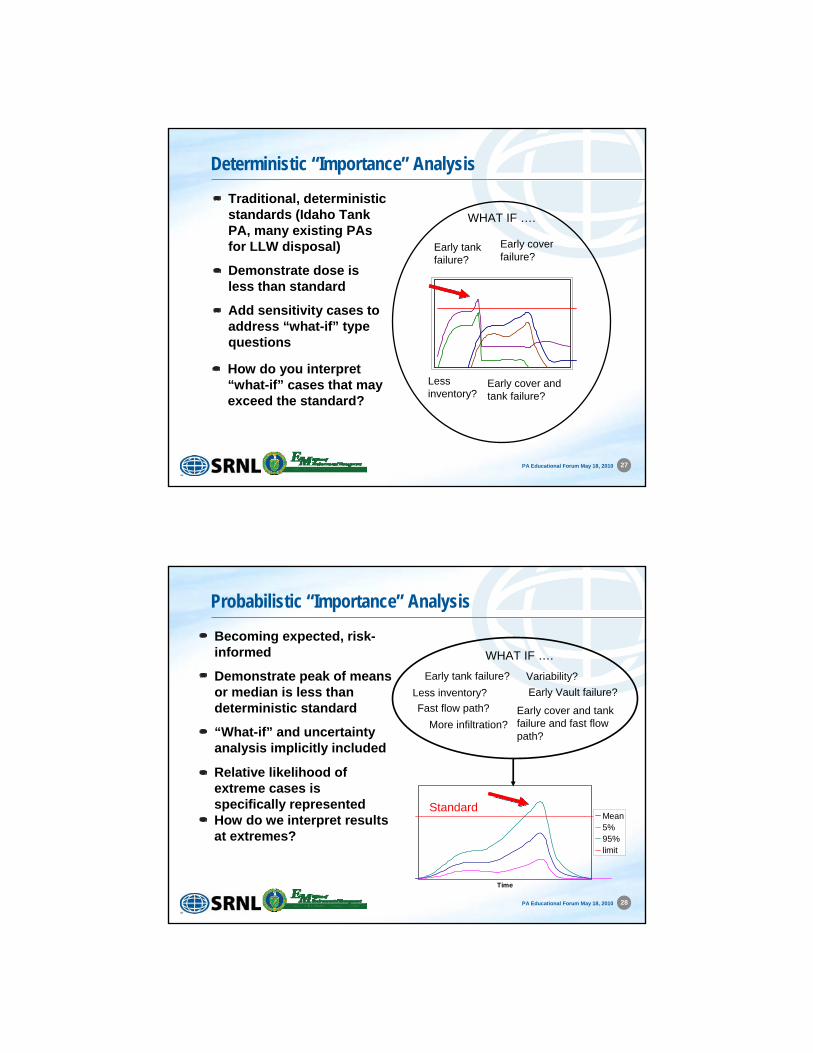
Abstraction & Dimensionality
Four Mile Branch
F
C
Z
E
H
J
McQ
ueen Branch
Upper Three Runs
S
SRS Easting (ft)
SR
SN
ort
hin
g(f
t)
50000 55000 60000 65000 7000
65000
70000
75000
80000
85000
Distance along Average Streamtrace(ft)
Inve
nto
ryF
ract
ion
(-)
0 500 1000 1500 20000
0.01
0.02
0.03
(b)
Distance along Average Streamtrace (ft)
Cla
yF
ract
ion
(-)
0 1000 2000 3000-0.1
0
0.1
0.2
0.3
0.4
0.5
0.6
0.7
0.8
0.9
1
1.1
Average Clay ProfileMinimum Clay ProfileMaximum Clay Profile
(c)0.00% Overall Stream Avg Clay Volume Fraction0.07% Overall Stream Avg Clay Volume Fraction3.00% Overall Stream Avg Clay Volume Fraction7.00% Overall Stream Avg Clay Volume Fraction
Transport Time (yr)
pd
f(T
)
20 40 600
0.005
0.01
0.015
0.02
0.025
0.03
0.035
0.04
0.045
0.05
0.055
0.06
TimeT averageT 15%tileT 85%tile
(d)
Distance (ft)
pd
f(L
)
2500 3000 3500 4000 45000
0.0002
0.0004
0.0006
0.0008
0.001
DistanceL averageL 15%tileL 85%tile
(e)
FZ
E
HJ
S
Four Mile Branch
McQ
uee
nB
ran
ch
Upper Three Runs
SRS Easting (ft)
SR
SN
ort
hin
g(f
t)
45000 50000 55000 60000 65000 70000
72000
74000
76000
78000
80000
82000
(a)
27PA Educational Forum May 18, 2010
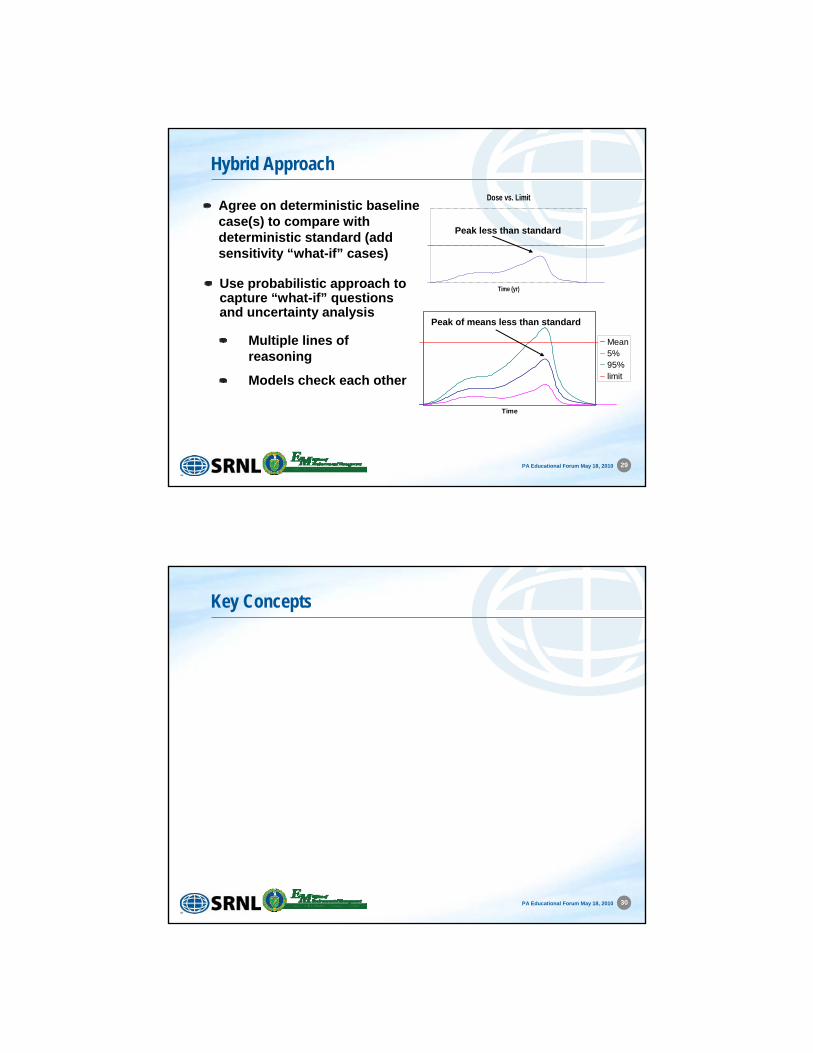
WHAT IF ….
Early cover and tank failure?
Early tank failure?
Less inventory?
Early cover failure?
Deterministic “Importance” AnalysisTraditional, deterministic standards (Idaho Tank PA, many existing PAsfor LLW disposal)
Demonstrate dose is less than standard
Add sensitivity cases to address “what-if” type questions
How do you interpret “what-if” cases that may exceed the standard?
28PA Educational Forum May 18, 2010
Probabilistic “Importance” Analysis
Becoming expected, risk-informed
Demonstrate peak of means or median is less than deterministic standard
“What-if” and uncertainty analysis implicitly included
WHAT IF ….
Early cover and tank failure and fast flow path?
Early tank failure?
Less inventory?
Fast flow path?
Early Vault failure?
More infiltration?
Variability?
Time
Mean5%95%limit
Standard
Relative likelihood of extreme cases is specifically representedHow do we interpret results at extremes?
29PA Educational Forum May 18, 2010
Hybrid Approach
Agree on deterministic baseline case(s) to compare with deterministic standard (add sensitivity “what-if” cases)
Dose vs. Limit
Time (yr)
Peak less than standard
Time
Mean5%95%limit
Peak of means less than standard
Use probabilistic approach to capture “what-if” questions and uncertainty analysis
Multiple lines of reasoning
Models check each other
30PA Educational Forum May 18, 2010
Key Concepts
31PA Educational Forum May 18, 2010
Multi-Disciplinary Team Approach
Numerical modeling
Hydrology
Structural stability
Geotechnical engineering
Cement formulations
Concrete durability
Biology
Health physics
Waste form and inventory
Facility knowledgeGeochemistry
Hydrogeology
Probabilistic assessment
Cover design
Source term modeling
Geology
Statistics
Project management
Process knowledge
Corrosion
Analytical modeling
Regulatory
Stakeholder relationsPA
32PA Educational Forum May 18, 2010
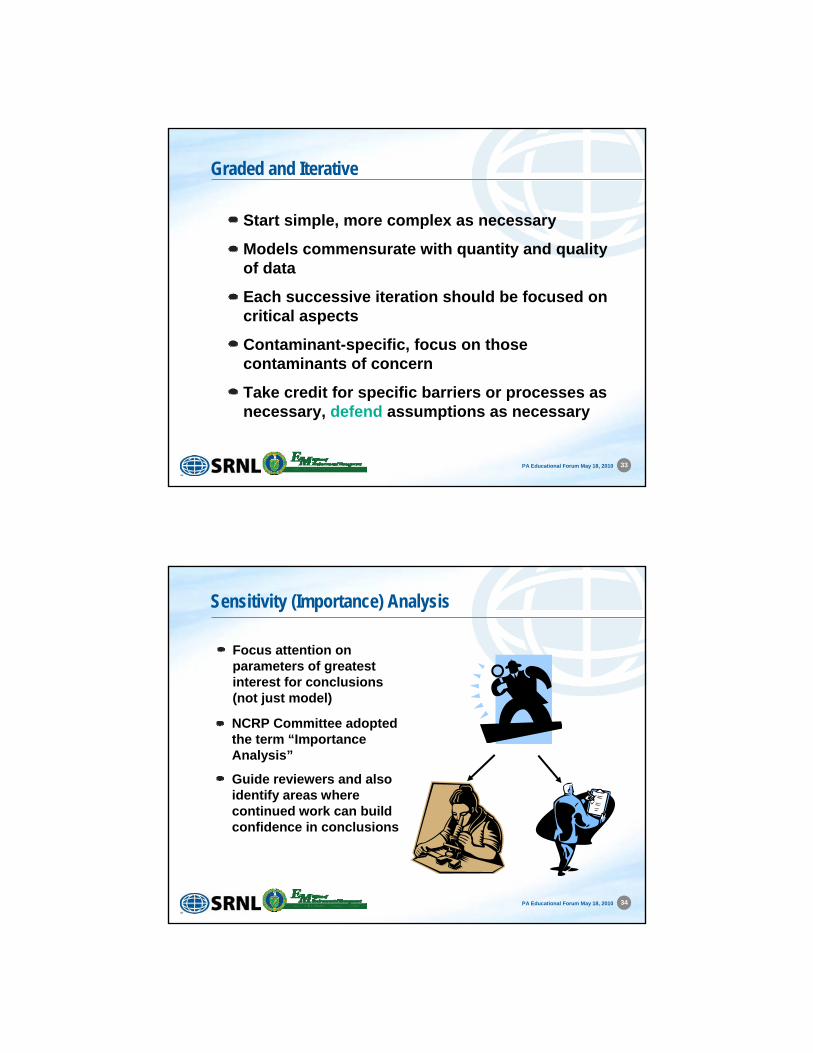
Source TermDrives the PA Process
Facility Description
Dimensions
Barriers (concrete, metal)
Initial condition and degradation of barriers
Contaminant Inventory
Chemical/physical formMaterial Composition
container lifetime?container lifetime?
solubility?solubility?
enhanced mobility?enhanced mobility?
gaseous release?gaseous release?
activated metal?activated metal?
concrete?concrete?
resins?resins?
SRS P Reactor Area
33PA Educational Forum May 18, 2010
Graded and Iterative
Start simple, more complex as necessary
Models commensurate with quantity and quality of data
Each successive iteration should be focused on critical aspects
Contaminant-specific, focus on those contaminants of concern
Take credit for specific barriers or processes as necessary, defend assumptions as necessary
34PA Educational Forum May 18, 2010
Sensitivity (Importance) Analysis
Focus attention on parameters of greatest interest for conclusions (not just model)
NCRP Committee adopted the term “Importance Analysis”
Guide reviewers and also identify areas where continued work can build confidence in conclusions
35PA Educational Forum May 18, 2010
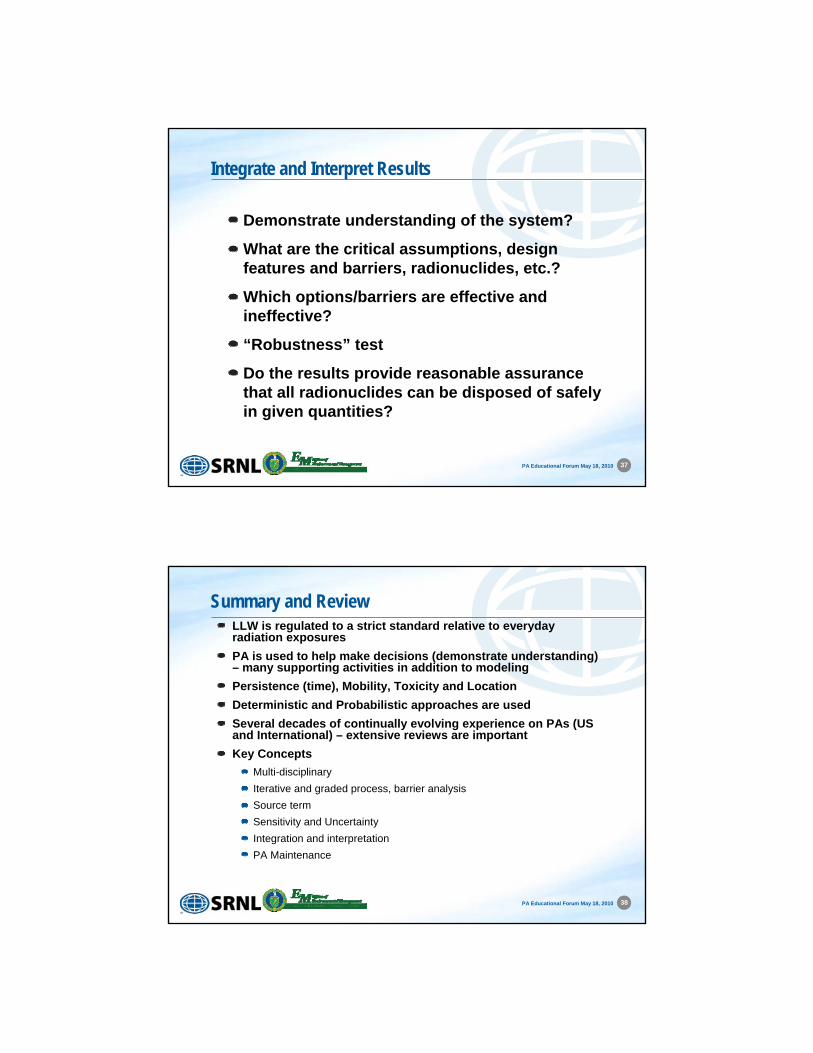
Graded Implementation (Barrier Analysis)
More detailed site representation(physical/chemical)?
Account for barriers(physical/chemical)?
Account for container (physical/chemical)?
Account for waste form (physical/chemical)?
Improved cover representation?
Enhanced screening?
36PA Educational Forum May 18, 2010
PA MaintenanceDOE approach to longer-term iterative process
Importance analyses and results of reviews used to prioritize work
Special analyses
Laboratory/field studies, model development or model refinement to reduce conservatism, address key assumptions
C-14 column experiment at Idaho
SRNL waste-form specific Kd studies for I-129
37PA Educational Forum May 18, 2010
Integrate and Interpret Results
Demonstrate understanding of the system?
What are the critical assumptions, design features and barriers, radionuclides, etc.?
Which options/barriers are effective and ineffective?
“Robustness” test
Do the results provide reasonable assurance that all radionuclides can be disposed of safely in given quantities?
38PA Educational Forum May 18, 2010
Summary and ReviewLLW is regulated to a strict standard relative to everyday radiation exposures
PA is used to help make decisions (demonstrate understanding) – many supporting activities in addition to modeling
Persistence (time), Mobility, Toxicity and Location
Deterministic and Probabilistic approaches are used
Several decades of continually evolving experience on PAs (US and International) – extensive reviews are important
Key Concepts
Multi-disciplinary
Iterative and graded process, barrier analysis
Source term
Sensitivity and Uncertainty
Integration and interpretation
PA Maintenance
39PA Educational Forum May 18, 2010
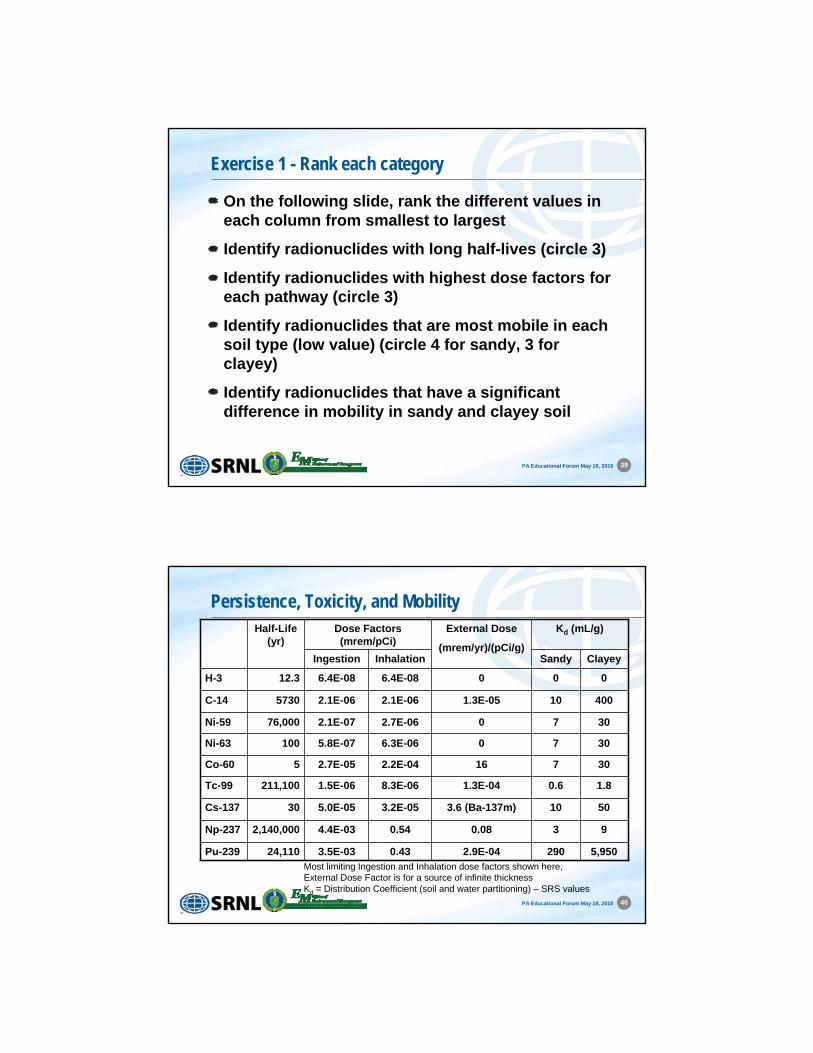
Exercise 1 - Rank each category
On the following slide, rank the different values in each column from smallest to largest
Identify radionuclides with long half-lives (circle 3)
Identify radionuclides with highest dose factors for each pathway (circle 3)
Identify radionuclides that are most mobile in each soil type (low value) (circle 4 for sandy, 3 for clayey)
Identify radionuclides that have a significant difference in mobility in sandy and clayey soil
40PA Educational Forum May 18, 2010
Persistence, Toxicity, and Mobility
2.9E-04
0.08
3.6 (Ba-137m)
1.3E-04
16
0
0
1.3E-05
0
External Dose
(mrem/yr)/(pCi/g)
50103.2E-055.0E-0530Cs-137
3076.3E-065.8E-07100Ni-63
3072.7E-062.1E-0776,000Ni-59
Kd (mL/g)Dose Factors (mrem/pCi)
1.80.68.3E-061.5E-06211,100Tc-99
5,9502900.433.5E-0324,110Pu-239
930.544.4E-032,140,000Np-237
3072.2E-042.7E-055Co-60
400102.1E-062.1E-065730C-14
006.4E-086.4E-0812.3H-3
ClayeySandyInhalationIngestion
Half-Life (yr)
Most limiting Ingestion and Inhalation dose factors shown here, External Dose Factor is for a source of infinite thicknessKd = Distribution Coefficient (soil and water partitioning) – SRS values
41PA Educational Forum May 18, 2010
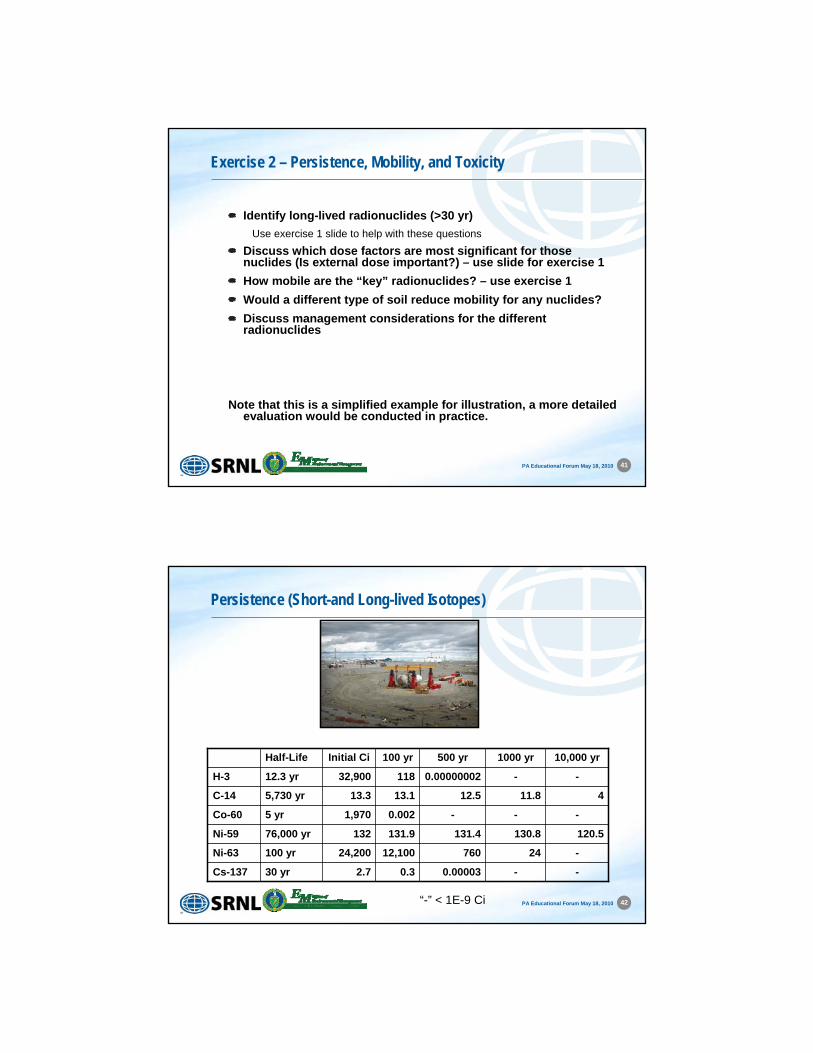
Exercise 2 – Persistence, Mobility, and Toxicity
Identify long-lived radionuclides (>30 yr)
Use exercise 1 slide to help with these questions
Discuss which dose factors are most significant for those nuclides (Is external dose important?) – use slide for exercise 1
How mobile are the “key” radionuclides? – use exercise 1
Would a different type of soil reduce mobility for any nuclides?
Discuss management considerations for the different radionuclides
Note that this is a simplified example for illustration, a more detailed evaluation would be conducted in practice.
42PA Educational Forum May 18, 2010
Persistence (Short-and Long-lived Isotopes)
30 yr
100 yr
76,000 yr
5 yr
5,730 yr
12.3 yr
Half-Life
-2476012,10024,200Ni-63
-
130.8
-
11.8
-
1000 yr
-0.000030.32.7Cs-137
120.5131.4131.9132Ni-59
--0.0021,970Co-60
412.513.113.3C-14
-0.0000000211832,900H-3
10,000 yr500 yr100 yrInitial Ci
“-” < 1E-9 Ci
SRS DOE 435.1 Composite Analysis
Mark Phifer
Senior Fellow EngineerMay 18, 2010
SRNL-STI-2010-00281
Performance Assessment Educational Forum
Four Mile Branch
F
C
Z
E
H
S
McQ
ueen
Branch
Upper Three Runs
SRS Easting (ft)
SR
SN
ort
hin
g(f
t)
50000 55000 60000 65000 7000
65000
70000
75000
80000
85000
POA Doses Over 1,000 Years
0.001
0.01
0.1
1.
10.
1950 2050 2150 2250 2350 2450 2550 2650 2750 2850 2950 3050 3150
Calendar Year
mre
m/y
rUTR
FMB
LTR
Steel
301 Bridge
2025 3025
0.17
2Environmental Restoration Technology SectionPA Educational Forum 5/18/2010
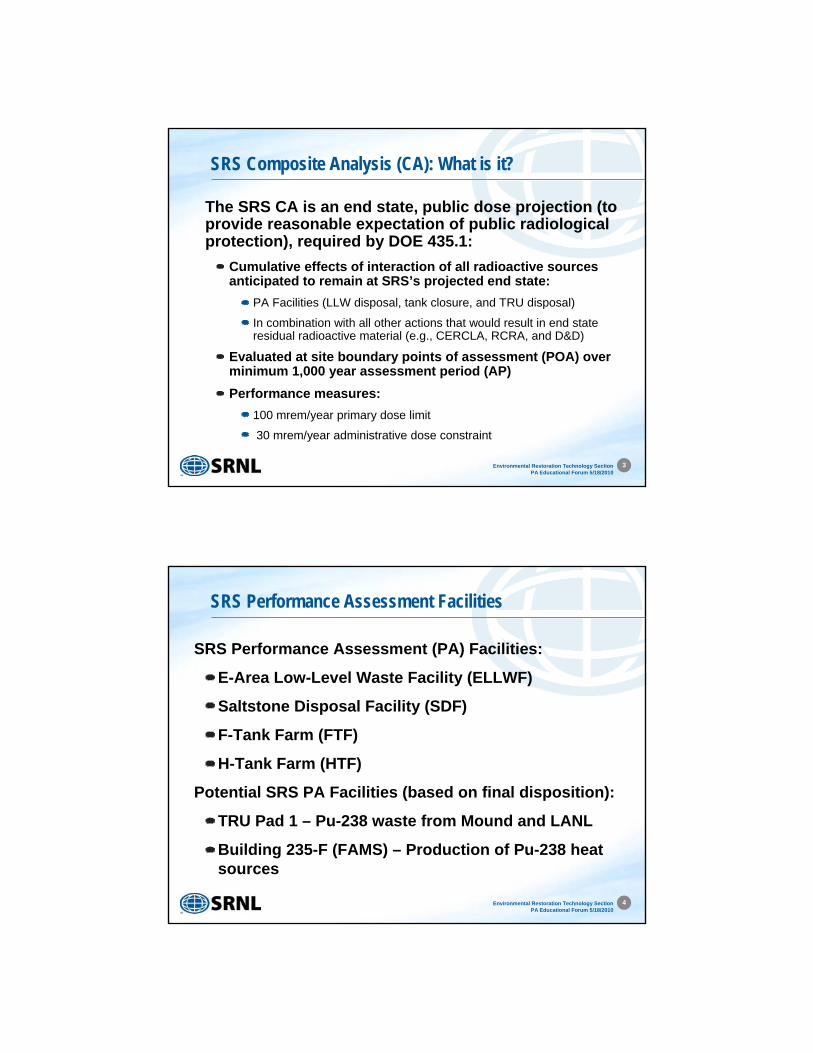
Why are Both a PA and a CA Needed?Performance Assessment:
An analysis of a single radioactive waste disposal facility
Conducted to demonstrate there is a reasonable expectation that performance objectives established for the long-term protection of the public and the environment will not be exceeded following closure of the facility.
Composite Analysis
An analysis that accounts for all sources of radioactive material that may contribute to the long-term dose projected to a hypothetical member of the public from an active or planned low-level waste disposal facility.
The analysis is a planning tool intended to provide a reasonable expectation that current low-level waste disposal activities will not result in the need for future corrective or remedial actions to ensure protection of the public and the environment.
3Environmental Restoration Technology SectionPA Educational Forum 5/18/2010
SRS Composite Analysis (CA): What is it?
The SRS CA is an end state, public dose projection (to provide reasonable expectation of public radiological protection), required by DOE 435.1:
Cumulative effects of interaction of all radioactive sources anticipated to remain at SRS’s projected end state:
PA Facilities (LLW disposal, tank closure, and TRU disposal)
In combination with all other actions that would result in end state residual radioactive material (e.g., CERCLA, RCRA, and D&D)
Evaluated at site boundary points of assessment (POA) over minimum 1,000 year assessment period (AP)
Performance measures:
100 mrem/year primary dose limit
30 mrem/year administrative dose constraint
4Environmental Restoration Technology SectionPA Educational Forum 5/18/2010
SRS Performance Assessment Facilities
SRS Performance Assessment (PA) Facilities:
E-Area Low-Level Waste Facility (ELLWF)
Saltstone Disposal Facility (SDF)
F-Tank Farm (FTF)
H-Tank Farm (HTF)
Potential SRS PA Facilities (based on final disposition):
TRU Pad 1 – Pu-238 waste from Mound and LANL
Building 235-F (FAMS) – Production of Pu-238 heat sources
5Environmental Restoration Technology SectionPA Educational Forum 5/18/2010
SRS CA Quick Facts152 source units modeled
~ 1,300 pages long
26 month effort
24 member CA Core Team to provide oversight (DOE-SR, SRNL, SRR, RI&BM, SWM, ACP (ER and D&D))
37 preparers (SRNL, SRR, ACP, SREL)
24 supporting CA reports
Over 450 references
3 separate reviews (CA Core Team, DOE-SR, and DOE-HQ LFRG)
Environmental Restoration Technology SectionBriefing for LFRG Review Team 3/22/10
6Environmental Restoration Technology SectionPA Educational Forum 5/18/2010
CA Summary
Disciplined, well documented implementation
Significant oversight and review
Deterministic (base case and sensitivity) and probabilistic (uncertainty) analyses
Maximum deterministic SRS end state dose to public is 3 mrem/year (i.e., 10% of the 30 mrem/year dose constraint)
Sensitivity and uncertainty analyses provide great confidence that dose constraint will not be exceeded
Provides a risk-based management tool
7Environmental Restoration Technology SectionPA Educational Forum 5/18/2010
CA Implementation
CA Planning and Implementation Documents:
Program Plan (defined tasks)
Execution Plan (defined method of implementation)
Quality Assurance Plan (defined QA controls)
Composite Analysis Criteria and Comments Matrices (defined applicable criteria)
CA Steering Team (7 members):
CA policy and strategic issues
Review and approval
Interface with DOE-SR and the DOE LFRG
8Environmental Restoration Technology SectionPA Educational Forum 5/18/2010
CA Implementation (continued)
CA Core Team (24 members):
Recommendations on CA policy and strategic issues
Technical oversight, direction, and review
Radionuclide source custodial organization representation (Representatives for solid waste, environmental restoration, deactivation and decommissioning, liquid waste, and DOE-SR)
CA Task Teams (37 preparers):
Implement and document (i.e. task report) each CA task
Report to the CA Core Team
9Environmental Restoration Technology SectionPA Educational Forum 5/18/2010
CA Quality Assurance Controls
Organization
Document Control
Software Quality Assurance
Radionuclide Source Locations and Inventory QA
Technical Design Check Process
CA Archive
10Environmental Restoration Technology SectionPA Educational Forum 5/18/2010
SRS Quick Facts
310 square miles
5% of area developed
16 operating areas
95% of area undeveloped
Five major watersheds draining into the Savannah River
Public exposure location: Stream mouths and Savannah River
Upper Three Runs
Fourmile Branch
Mouth of Fourmile Branch
Pen Branch
Savannah River Swamp
Savannah River
Pen Branch enters swamp
D-AreaT-Area
Georgia
Savannah River Site
South Carolina
Savannah River
Swamp
Savannah River
Georgia
Savannah River Site
South Carolina
Upper Three Runs
Fourmile Branch
Pen Branch
L-Lake
Steel Creek
PAR Pond
Lower Three Runs
11Environmental Restoration Technology SectionPA Educational Forum 5/18/2010
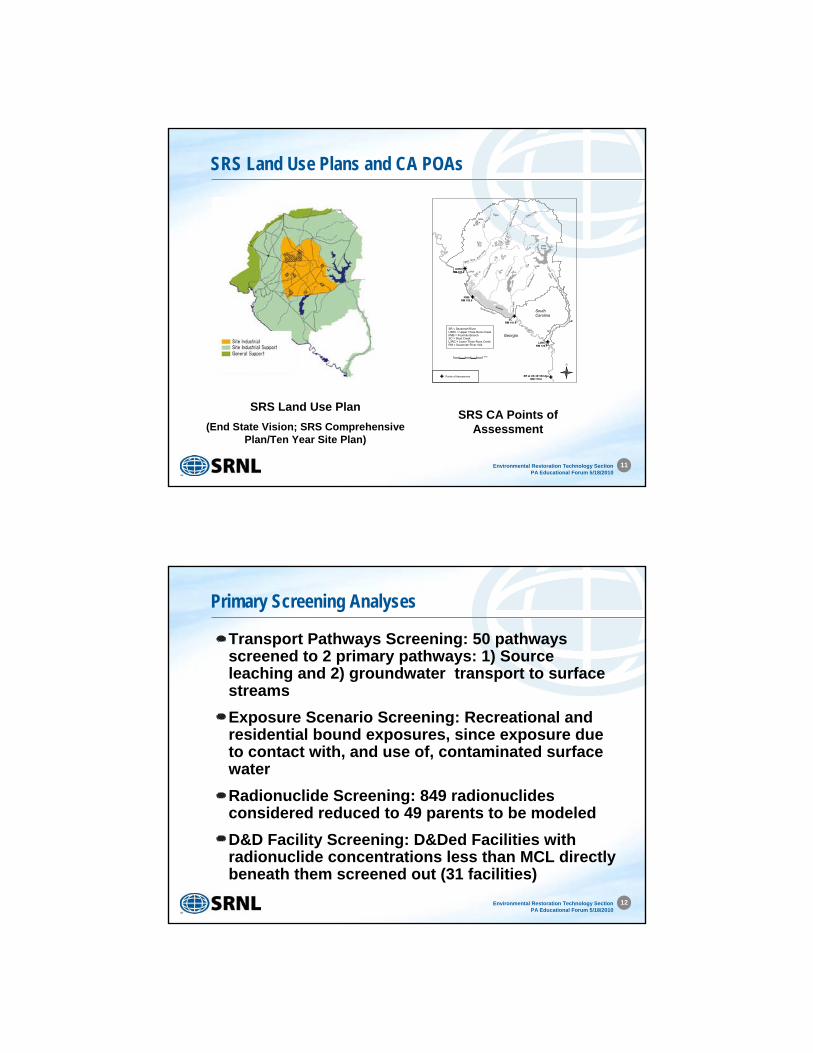
SRS Land Use Plans and CA POAs
� � � � � � ���
� � ����� ���������� �
�
�
�
�
�������
������� ���
��������������
���� ��
�����
� ����
�����������
�����
�����
����
� ������
�� ���������������
�����
�������������
����������
��
�������
������
����
����
��� ��
����
�������
��
��
���
�
�
� ���
!
�
�"# $ %
&
�
���������
�������� ��
���������������������������
����������
������������
����
����������
�
�����
�
���'���(����)���(*+��!�'�+,,*�#)*��-���!*�����'�� -*����*��.)�!�'����!*����!�'�� /*�#)*��-���!*����'���(����)���(*���
SRS Land Use Plan
(End State Vision; SRS Comprehensive Plan/Ten Year Site Plan)
SRS CA Points of Assessment
12Environmental Restoration Technology SectionPA Educational Forum 5/18/2010
Primary Screening Analyses
Transport Pathways Screening: 50 pathways screened to 2 primary pathways: 1) Source leaching and 2) groundwater transport to surface streams
Exposure Scenario Screening: Recreational and residential bound exposures, since exposure due to contact with, and use of, contaminated surface water
Radionuclide Screening: 849 radionuclides considered reduced to 49 parents to be modeled
D&D Facility Screening: D&Ded Facilities with radionuclide concentrations less than MCL directly beneath them screened out (31 facilities)
13Environmental Restoration Technology SectionPA Educational Forum 5/18/2010
Inventory Development
Extensive custodial organization (solid waste, environmental restoration, deactivation and decommissioning, liquid waste, and DOE-SR representatives) involvement to:
Identify facilities and waste sites with projected end state radionuclide inventories
Quantify end state inventories
14Environmental Restoration Technology SectionPA Educational Forum 5/18/2010
Inventory Development (continued)
Inventory Estimate Hierarchy:
Existing documented inventories
Developed from existing sampling and analysis data
Developed from inventories of similar facilities/waste sites
Developed from SAR operational inventories
15Environmental Restoration Technology SectionPA Educational Forum 5/18/2010
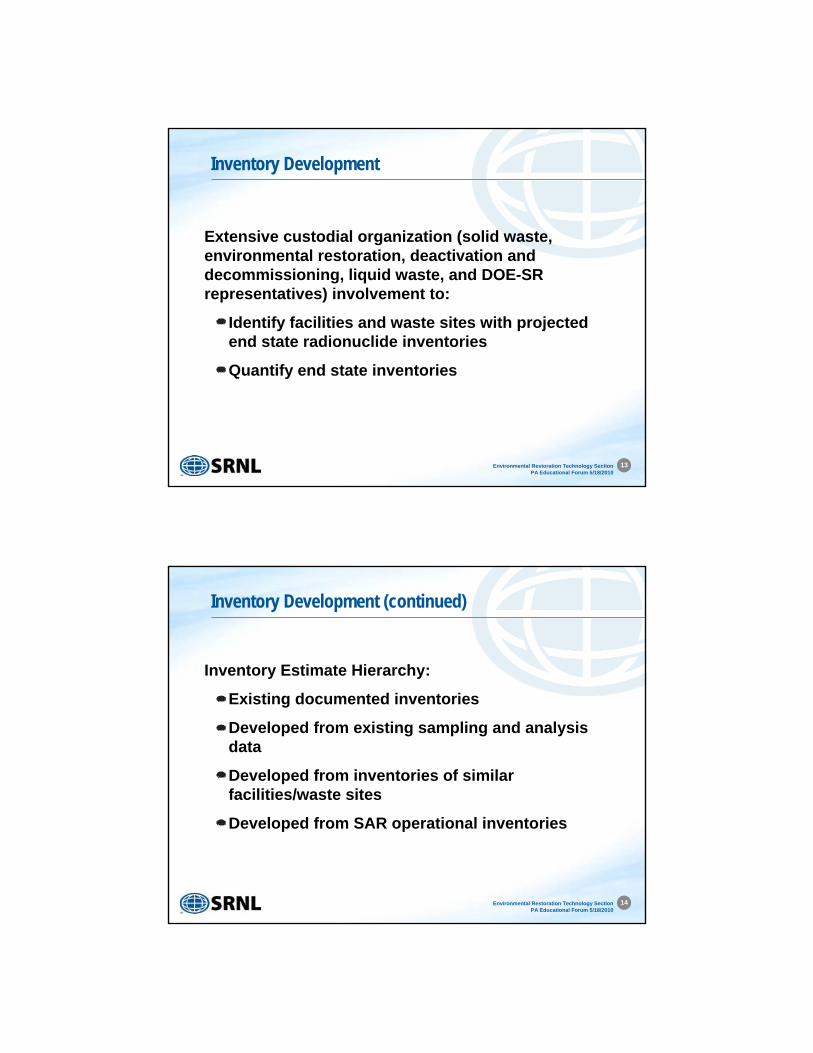
CA Conceptual Model
Near SurfaceSource
VadoseZone
Aquifer
GroundwaterPlume Source
Stream
Mouth POA
SavannahRiver POA
StreambedSource
1) Source Release Radionuclide Flux
RecreationalDose
ResidentialDose
3) Source Release Radionulide Flux
5) Source Release Radionuclide Flux
2) Radionuclide Flux
4) Radionuclide Flux
6) StreamMouth
Concentrationat POA
8) RiverConcentration
at POA
7) Radionuclide Flux
Transport RegionsSources
Points of Assessment
Dose Scenarios
and Location
16Environmental Restoration Technology SectionPA Educational Forum 5/18/2010
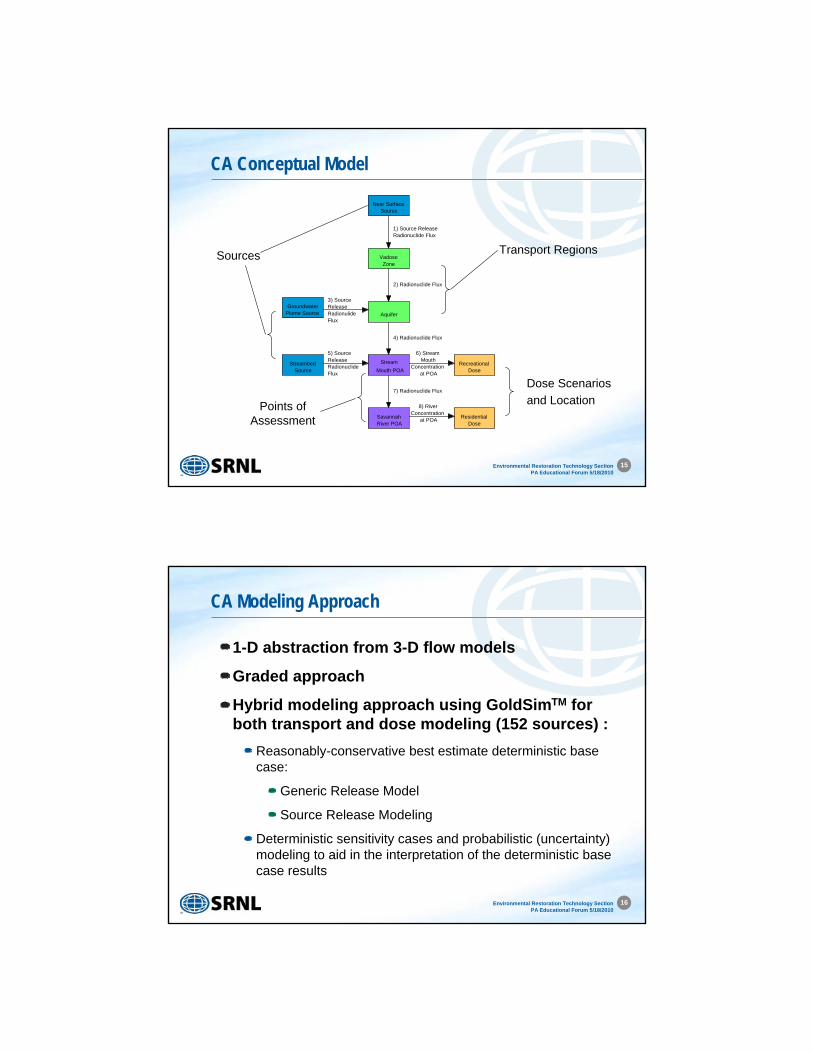
CA Modeling Approach
1-D abstraction from 3-D flow models
Graded approach
Hybrid modeling approach using GoldSimTM for both transport and dose modeling (152 sources) :
Reasonably-conservative best estimate deterministic base case:
Generic Release Model
Source Release Modeling
Deterministic sensitivity cases and probabilistic (uncertainty) modeling to aid in the interpretation of the deterministic base case results
17Environmental Restoration Technology SectionPA Educational Forum 5/18/2010
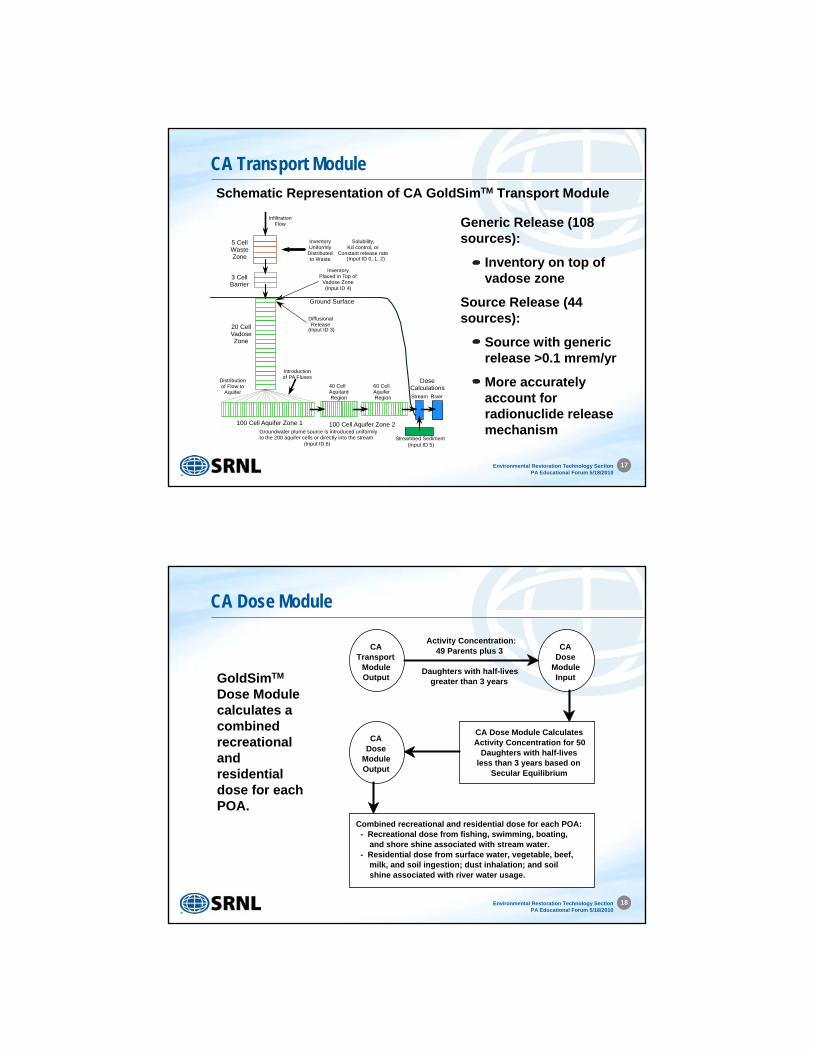
CA Transport Module
InfiltrationFlow
5 CellWasteZone
3 CellBarrier
20 CellVadoseZone
Ground Surface
InventoryUniformlyDistributedto Waste
InventoryPlaced in Top of
Vadose Zone
100 Cell Aquifer Zone 1
40 CellAquitardRegion
100 Cell Aquifer Zone 2
60 CellAquiferRegion
Distributionof Flow to
AquiferStream River
DoseCalculations
Introductionof PA Fluxes
Streambed Sediment(Input ID 5)
(Input ID 4)
(Input ID 3)
DiffusionalRelease
(Input ID 0, 1, 2)
Solubility,Kd control, or
Constant release rate
Groundwater plume source is introduced uniformlyto the 200 aquifer cells or directly into the stream
(Input ID 6)
Schematic Representation of CA GoldSimTM Transport Module
Generic Release (108 sources):
Inventory on top of vadose zone
Source Release (44 sources):
Source with generic release >0.1 mrem/yr
More accurately account for radionuclide release mechanism
18Environmental Restoration Technology SectionPA Educational Forum 5/18/2010
CA Dose Module
GoldSimTM
Dose Module calculates a combined recreational and residential dose for each POA.
CATransport
ModuleOutput
CADose
ModuleInput
Activity Concentration:49 Parents plus 3
Daughters with half-livesgreater than 3 years
CA Dose Module CalculatesActivity Concentration for 50
Daughters with half-livesless than 3 years based on
Secular Equilibrium
CADose
ModuleOutput
Combined recreational and residential dose for each POA: - Recreational dose from fishing, swimming, boating, and shore shine associated with stream water. - Residential dose from surface water, vegetable, beef, milk, and soil ingestion; dust inhalation; and soil shine associated with river water usage.
19Environmental Restoration Technology SectionPA Educational Forum 5/18/2010
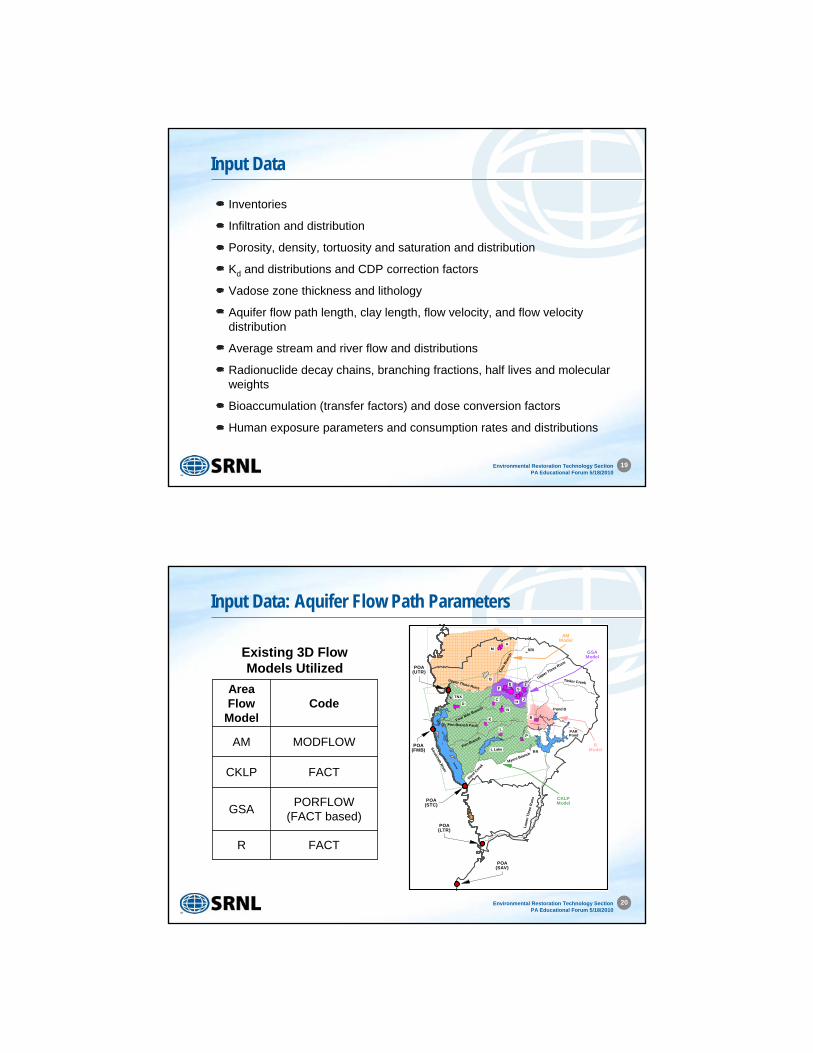
Input Data
Inventories
Infiltration and distribution
Porosity, density, tortuosity and saturation and distribution
Kd and distributions and CDP correction factors
Vadose zone thickness and lithology
Aquifer flow path length, clay length, flow velocity, and flow velocity distribution
Average stream and river flow and distributions
Radionuclide decay chains, branching fractions, half lives and molecular weights
Bioaccumulation (transfer factors) and dose conversion factors
Human exposure parameters and consumption rates and distributions
20Environmental Restoration Technology SectionPA Educational Forum 5/18/2010
Input Data: Aquifer Flow Path Parameters
Sw
amp
Tinker Creek
Four MileBranch
Lo
we
rT
hre
eR
un
s
Steel
Creek
Savannah
River
N
TNX
D
SRI
RR
K
P
R
L
F
B
AM
C
ZE
H
S
Pen Branch Fault
Pond B
Myers BranchL Lake
PARPond
Upper Three Runs
Tim
sB
ranc
h
Upper Three Runs
Pen Branch
POA(UTR)
POA(SAV)
POA(STC)
RModel
AMModel
GSAModel
CKLPModel
POA(FMB)
POA(LTR)
J
FACTR
PORFLOW(FACT based)
GSA
FACTCKLP
MODFLOWAM
CodeArea Flow
Model
Existing 3D Flow Models Utilized
21Environmental Restoration Technology SectionPA Educational Forum 5/18/2010
Input Data: Aquifer Flow Path Parameters
Four Mile Branch
F
C
Z
E
H
J
McQ
ueen Branch
Upper Three Runs
S
SRS Easting (ft)
SR
SN
ort
hin
g(f
t)
50000 55000 60000 65000 7000
65000
70000
75000
80000
85000
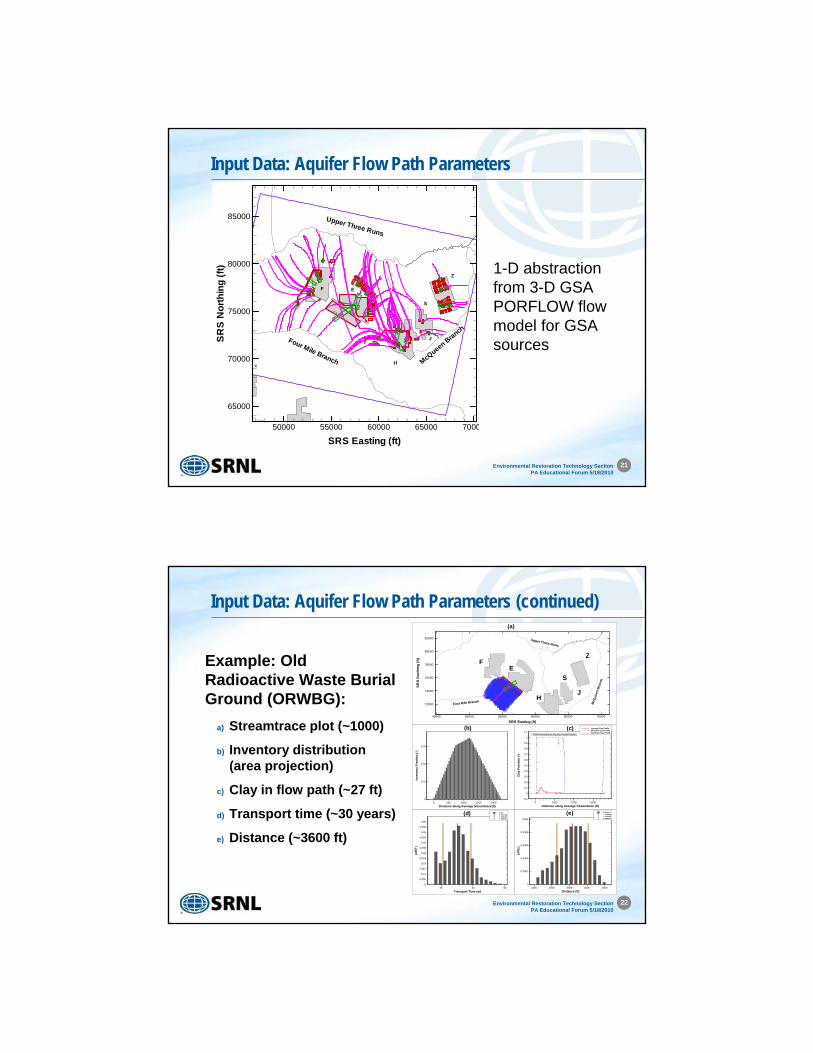
1-D abstraction from 3-D GSA PORFLOW flow model for GSA sources
22Environmental Restoration Technology SectionPA Educational Forum 5/18/2010
Input Data: Aquifer Flow Path Parameters (continued)
Distance along Average Streamtrace(ft)
Inve
nto
ryF
ract
ion
(-)
0 500 1000 1500 20000
0.01
0.02
0.03
(b)
Distance along Average Streamtrace (ft)
Cla
yF
ract
ion
(-)
0 1000 2000 3000-0.1
0
0.1
0.2
0.3
0.4
0.5
0.6
0.7
0.8
0.9
1
1.1
Average Clay ProfileMinimum Clay ProfileMaximum Clay Profile
(c)0.00% Overall Stream Avg Clay Volume Fraction0.07% Overall Stream Avg Clay Volume Fraction3.00% Overall Stream Avg Clay Volume Fraction7.00% Overall Stream Avg Clay Volume Fraction
Transport Time (yr)
pd
f(T
)
20 40 600
0.005
0.01
0.015
0.02
0.025
0.03
0.035
0.04
0.045
0.05
0.055
0.06
TimeT averageT 15%tileT 85%tile
(d)
Distance (ft)
pd
f(L
)
2500 3000 3500 4000 45000
0.0002
0.0004
0.0006
0.0008
0.001
DistanceL averageL 15%tileL 85%tile
(e)
FZ
E
HJ
S
Four Mile Branch
McQ
ueen
Bra
nch
Upper Three Runs
SRS Easting (ft)
SR
SN
ort
hin
g(f
t)
45000 50000 55000 60000 65000 70000
72000
74000
76000
78000
80000
82000
(a)
Example: Old Radioactive Waste Burial Ground (ORWBG):
a) Streamtrace plot (~1000)
b) Inventory distribution (area projection)
c) Clay in flow path (~27 ft)
d) Transport time (~30 years)
e) Distance (~3600 ft)
23Environmental Restoration Technology SectionPA Educational Forum 5/18/2010
Deterministic Base Case Results
0.17
1.06
2.16
0.42
2.97
0.17
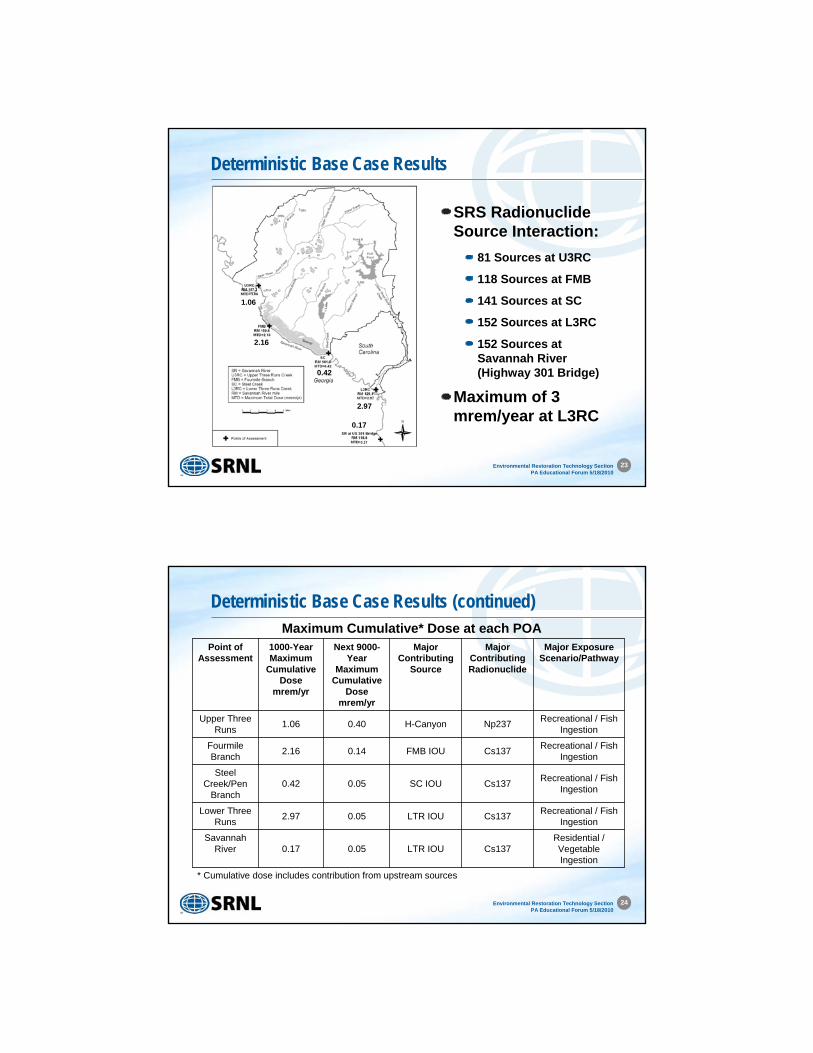
SRS Radionuclide Source Interaction:
81 Sources at U3RC
118 Sources at FMB
141 Sources at SC
152 Sources at L3RC
152 Sources at Savannah River (Highway 301 Bridge)
Maximum of 3 mrem/year at L3RC
24Environmental Restoration Technology SectionPA Educational Forum 5/18/2010
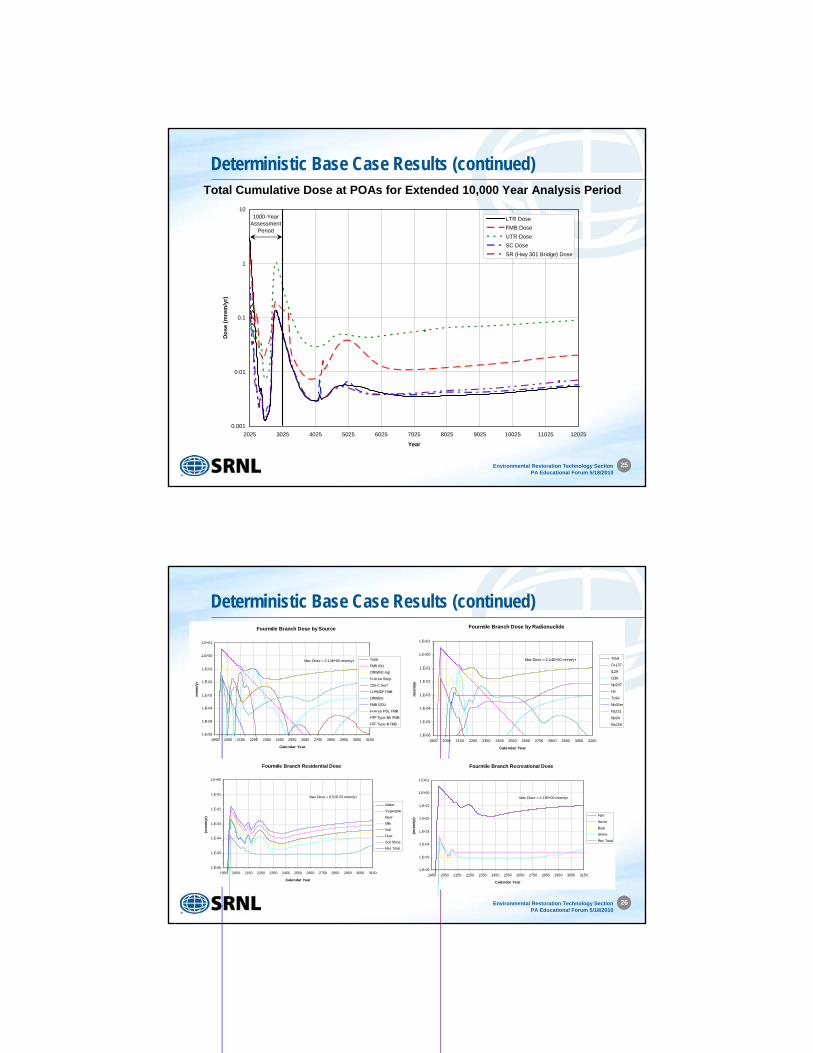
Deterministic Base Case Results (continued)Maximum Cumulative* Dose at each POA
Residential / Vegetable Ingestion
Cs137LTR IOU0.050.17Savannah
River
Recreational / Fish Ingestion
Cs137LTR IOU0.052.97Lower Three
Runs
Recreational / Fish Ingestion
Cs137SC IOU0.050.42Steel
Creek/Pen Branch
Recreational / Fish Ingestion
Cs137FMB IOU0.142.16Fourmile Branch
Recreational / Fish Ingestion
Np237H-Canyon0.401.06Upper Three
Runs
Major Exposure Scenario/Pathway
MajorContributingRadionuclide
Major Contributing
Source
Next 9000-Year
Maximum Cumulative
Dose mrem/yr
1000-Year Maximum
Cumulative Dose
mrem/yr
Point of Assessment
* Cumulative dose includes contribution from upstream sources
25Environmental Restoration Technology SectionPA Educational Forum 5/18/2010
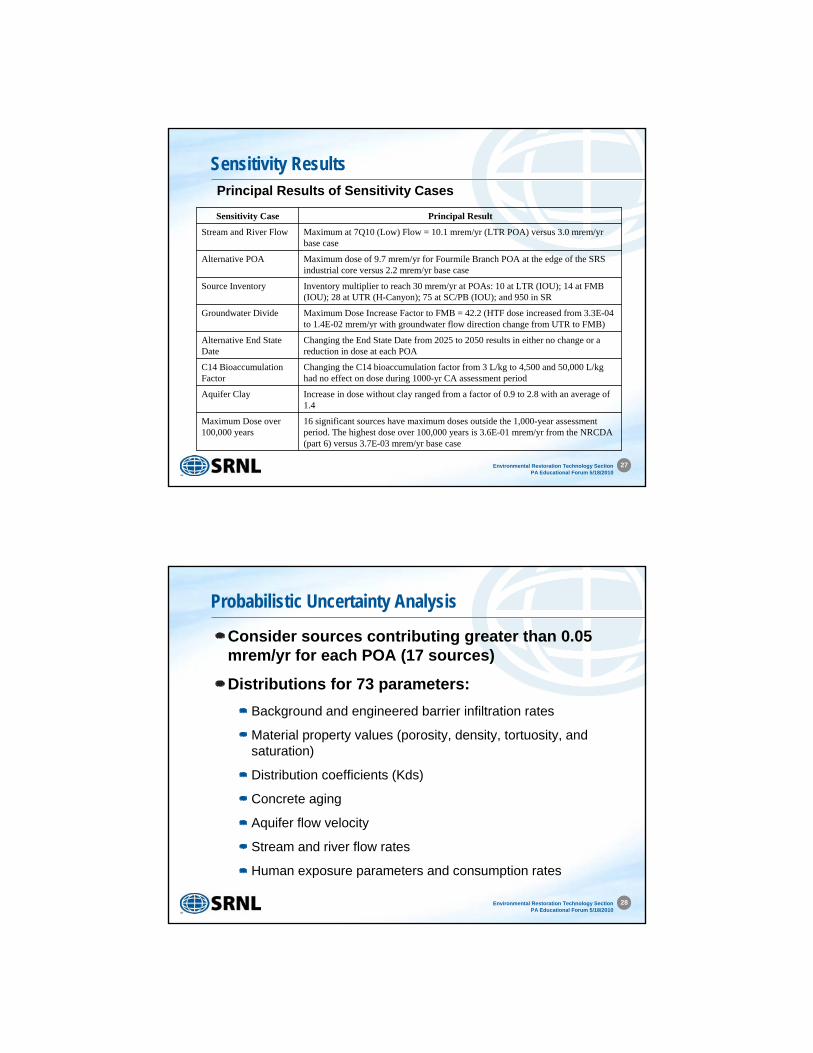
Deterministic Base Case Results (continued)Total Cumulative Dose at POAs for Extended 10,000 Year Analysis Period
0.001
0.01
0.1
1
10
2025 3025 4025 5025 6025 7025 8025 9025 10025 11025 12025
Year
Do
se (
mre
m/y
r)LTR Dose
FMB Dose
UTR Dose
SC Dose
SR (Hwy 301 Bridge) Dose
1000-YearAssessment
Period
26Environmental Restoration Technology SectionPA Educational Forum 5/18/2010
Deterministic Base Case Results (continued)Fourmile Branch Dose by Source
1.E-06
1.E-05
1.E-04
1.E-03
1.E-02
1.E-01
1.E+00
1.E+01
1950 2050 2150 2250 2350 2450 2550 2650 2750 2850 2950 3050 3150
Calendar Year
mre
m/y
r
Total
FMB IOU
ORWBG AgI
H-Area Seep
105-C Surf
LLRWDF FMB
ORWBG
FMB GOU
H-Area IPSL FMB
HTF Type IIIA FMB
HTF Type III FMB
Max Dose = 2.14E+00 mrem/yr
Fourmile Branch Dose by Radionuclide
1.E-06
1.E-05
1.E-04
1.E-03
1.E-02
1.E-01
1.E+00
1.E+01
1950 2050 2150 2250 2350 2450 2550 2650 2750 2850 2950 3050 3150
Calendar Year
mre
m/y
r
Total
Cs137
I129
Cl36
Np237
H3
Tc99
Nb93m
Pa231
Nb94
Ra226
Max Dose = 2.14E+00 mrem/yr
Fourmile Branch Residential Dose
1.E-06
1.E-05
1.E-04
1.E-03
1.E-02
1.E-01
1.E+00
1950 2050 2150 2250 2350 2450 2550 2650 2750 2850 2950 3050 3150
Calendar Year
(mre
m/y
r)
Water
Vegetable
Beef
Milk
Soil
Dust
Soil Shine
Res Total
Max Dose = 9.51E-03 mrem/yr
Fourmile Branch Recreational Dose
1.E-06
1.E-05
1.E-04
1.E-03
1.E-02
1.E-01
1.E+00
1.E+01
1950 2050 2150 2250 2350 2450 2550 2650 2750 2850 2950 3050 3150
Calendar Year
(mre
m/y
r)
Fish
Sw im
Boat
Shore
Rec Total
Max Dose = 2.13E+00 mrem/yr
27Environmental Restoration Technology SectionPA Educational Forum 5/18/2010
Sensitivity ResultsPrincipal Results of Sensitivity Cases
16 significant sources have maximum doses outside the 1,000-year assessment period. The highest dose over 100,000 years is 3.6E-01 mrem/yr from the NRCDA (part 6) versus 3.7E-03 mrem/yr base case
Maximum Dose over 100,000 years
Increase in dose without clay ranged from a factor of 0.9 to 2.8 with an average of 1.4
Aquifer Clay
Changing the C14 bioaccumulation factor from 3 L/kg to 4,500 and 50,000 L/kg had no effect on dose during 1000-yr CA assessment period
C14 Bioaccumulation Factor
Changing the End State Date from 2025 to 2050 results in either no change or a reduction in dose at each POA
Alternative End State Date
Maximum Dose Increase Factor to FMB = 42.2 (HTF dose increased from 3.3E-04 to 1.4E-02 mrem/yr with groundwater flow direction change from UTR to FMB)
Groundwater Divide
Inventory multiplier to reach 30 mrem/yr at POAs: 10 at LTR (IOU); 14 at FMB (IOU); 28 at UTR (H-Canyon); 75 at SC/PB (IOU); and 950 in SR
Source Inventory
Maximum dose of 9.7 mrem/yr for Fourmile Branch POA at the edge of the SRS industrial core versus 2.2 mrem/yr base case
Alternative POA
Maximum at 7Q10 (Low) Flow = 10.1 mrem/yr (LTR POA) versus 3.0 mrem/yr base case
Stream and River Flow
Principal ResultSensitivity Case
28Environmental Restoration Technology SectionPA Educational Forum 5/18/2010
Probabilistic Uncertainty Analysis
Consider sources contributing greater than 0.05 mrem/yr for each POA (17 sources)
Distributions for 73 parameters:
Background and engineered barrier infiltration rates
Material property values (porosity, density, tortuosity, and saturation)
Distribution coefficients (Kds)
Concrete aging
Aquifer flow velocity
Stream and river flow rates
Human exposure parameters and consumption rates
29Environmental Restoration Technology SectionPA Educational Forum 5/18/2010
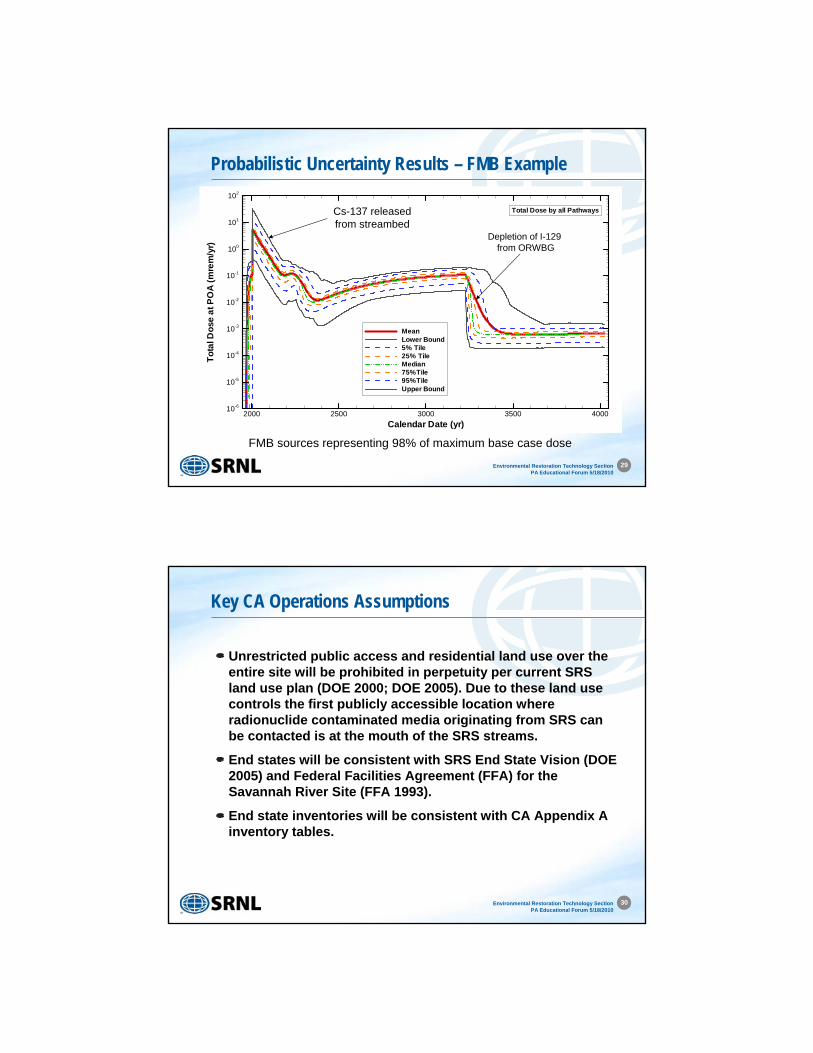
Probabilistic Uncertainty Results – FMB Example
Calendar Date (yr)
To
talD
ose
at
PO
A(m
rem
/yr)
2000 2500 3000 3500 400010-6
10-5
10-4
10-3
10-2
10-1
100
101
102
MeanLower Bound5% Tile25% TileMedian75%Tile95%TileUpper Bound
Total Dose by all PathwaysCs-137 releasedfrom streambed
Depletion of I-129from ORWBG
FMB sources representing 98% of maximum base case dose
30Environmental Restoration Technology SectionPA Educational Forum 5/18/2010
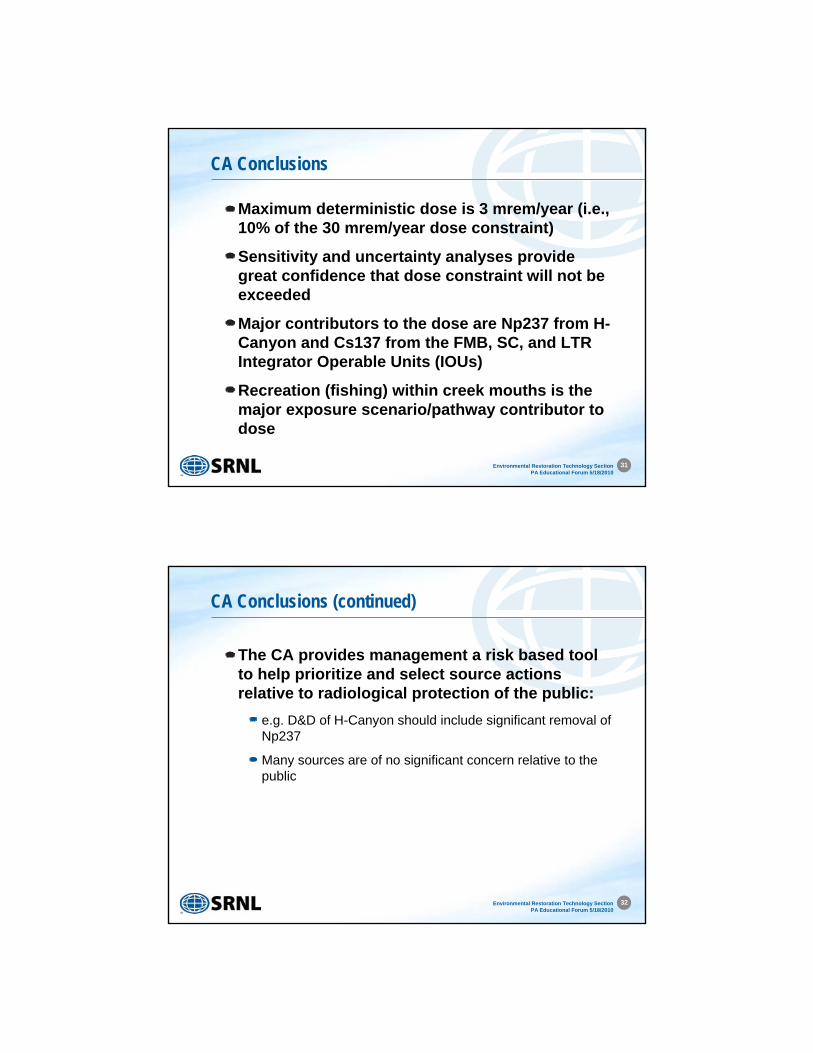
Key CA Operations Assumptions
Unrestricted public access and residential land use over the entire site will be prohibited in perpetuity per current SRS land use plan (DOE 2000; DOE 2005). Due to these land use controls the first publicly accessible location where radionuclide contaminated media originating from SRS can be contacted is at the mouth of the SRS streams.
End states will be consistent with SRS End State Vision (DOE 2005) and Federal Facilities Agreement (FFA) for the Savannah River Site (FFA 1993).
End state inventories will be consistent with CA Appendix A inventory tables.
31Environmental Restoration Technology SectionPA Educational Forum 5/18/2010
CA Conclusions
Maximum deterministic dose is 3 mrem/year (i.e., 10% of the 30 mrem/year dose constraint)
Sensitivity and uncertainty analyses provide great confidence that dose constraint will not be exceeded
Major contributors to the dose are Np237 from H-Canyon and Cs137 from the FMB, SC, and LTR Integrator Operable Units (IOUs)
Recreation (fishing) within creek mouths is the major exposure scenario/pathway contributor to dose
32Environmental Restoration Technology SectionPA Educational Forum 5/18/2010
CA Conclusions (continued)
The CA provides management a risk based tool to help prioritize and select source actions relative to radiological protection of the public:
e.g. D&D of H-Canyon should include significant removal of Np237
Many sources are of no significant concern relative to the public
33Environmental Restoration Technology SectionPA Educational Forum 5/18/2010
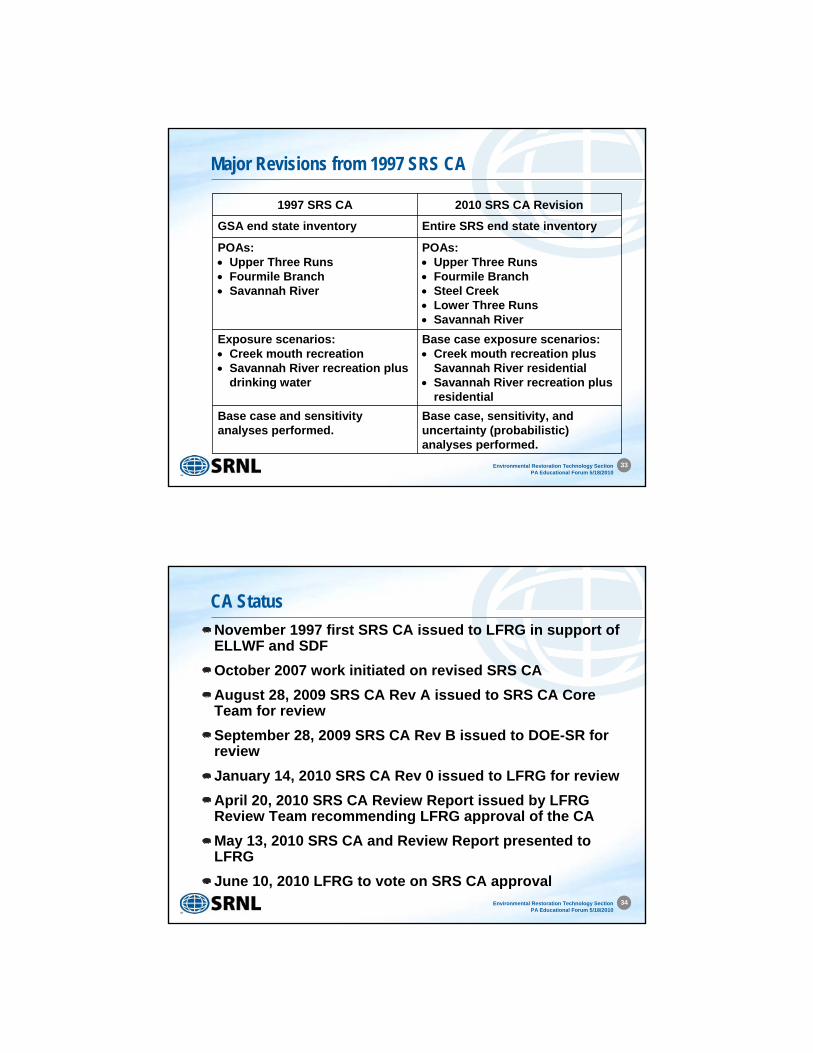
Major Revisions from 1997 SRS CA
Base case, sensitivity, and uncertainty (probabilistic) analyses performed.
Base case and sensitivity analyses performed.
Base case exposure scenarios: Creek mouth recreation plus
Savannah River residential Savannah River recreation plus
residential
Exposure scenarios: Creek mouth recreation Savannah River recreation plus
drinking water
POAs: Upper Three Runs Fourmile Branch Steel Creek Lower Three Runs Savannah River
POAs: Upper Three Runs Fourmile Branch Savannah River
Entire SRS end state inventoryGSA end state inventory
2010 SRS CA Revision1997 SRS CA
34Environmental Restoration Technology SectionPA Educational Forum 5/18/2010
CA StatusNovember 1997 first SRS CA issued to LFRG in support of ELLWF and SDF
October 2007 work initiated on revised SRS CA
August 28, 2009 SRS CA Rev A issued to SRS CA Core Team for review
September 28, 2009 SRS CA Rev B issued to DOE-SR for review
January 14, 2010 SRS CA Rev 0 issued to LFRG for review
April 20, 2010 SRS CA Review Report issued by LFRG Review Team recommending LFRG approval of the CA
May 13, 2010 SRS CA and Review Report presented to LFRG
June 10, 2010 LFRG to vote on SRS CA approval
SRNL Supporting Activities
Mark Phifer
Senior Fellow EngineerMay 18, 2010
SRNL-STI-2010-00287
Performance Assessment Educational Forum
Four Mile Branch
F
C
Z
E
H
S
McQ
ueen
Branch
Upper Three Runs
SRS Easting (ft)
SR
SN
ort
hin
g(f
t)
50000 55000 60000 65000 7000
65000
70000
75000
80000
85000
POA Doses Over 1,000 Years
0.001
0.01
0.1
1.
10.
1950 2050 2150 2250 2350 2450 2550 2650 2750 2850 2950 3050 3150
Calendar Year
mre
m/y
rUTR
FMB
LTR
Steel
301 Bridge
2025 3025
0.17
2Environmental Restoration Technology SectionPA Educational Forum 5/18/2010
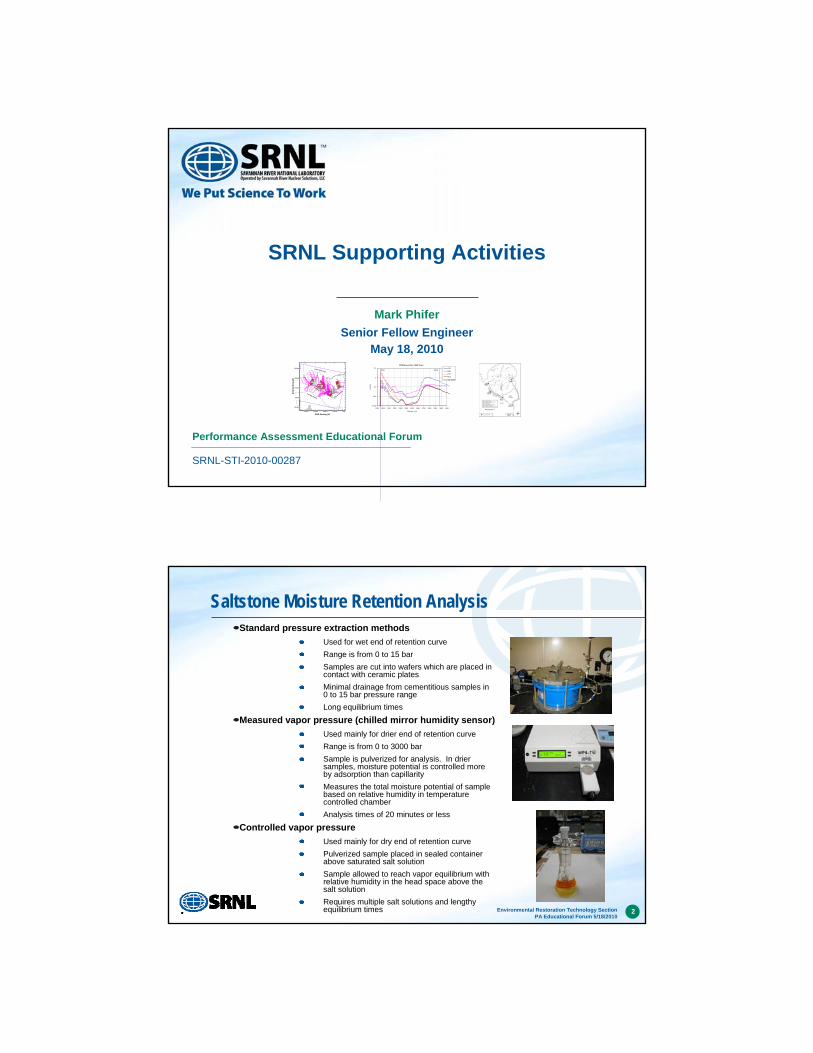
Saltstone Moisture Retention AnalysisStandard pressure extraction methods
Used for wet end of retention curve
Range is from 0 to 15 bar
Samples are cut into wafers which are placed in contact with ceramic plates
Minimal drainage from cementitious samples in 0 to 15 bar pressure range
Long equilibrium times
Measured vapor pressure (chilled mirror humidity sensor)
Used mainly for drier end of retention curve
Range is from 0 to 3000 bar
Sample is pulverized for analysis. In drier samples, moisture potential is controlled more by adsorption than capillarity
Measures the total moisture potential of sample based on relative humidity in temperature controlled chamber
Analysis times of 20 minutes or less
Controlled vapor pressure
Used mainly for dry end of retention curve
Pulverized sample placed in sealed container above saturated salt solution
Sample allowed to reach vapor equilibrium with relative humidity in the head space above the salt solution
Requires multiple salt solutions and lengthy equilibrium times
3Environmental Restoration Technology SectionPA Educational Forum 5/18/2010
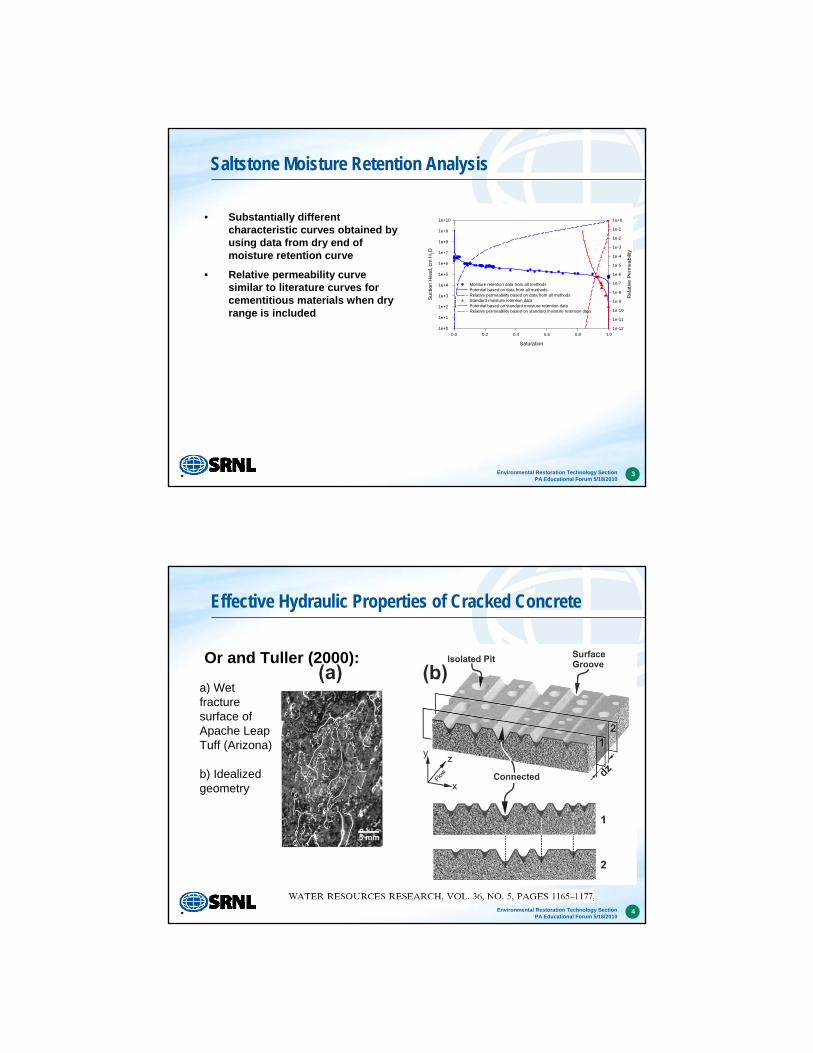
Saltstone Moisture Retention Analysis
• Substantially different characteristic curves obtained by using data from dry end of moisture retention curve
• Relative permeability curve similar to literature curves for cementitious materials when dry range is included
Saturation
0.0 0.2 0.4 0.6 0.8 1.0
Suc
tion
Hea
d, c
m H
2O
1e+0
1e+1
1e+2
1e+3
1e+4
1e+5
1e+6
1e+7
1e+8
1e+9
1e+10
Rel
ativ
e P
erm
eabi
lity
1e-12
1e-11
1e-10
1e-9
1e-8
1e-7
1e-6
1e-5
1e-4
1e-3
1e-2
1e-1
1e+0
Mositure retention data from all methodsPotential based on data from all methodsRelative permeability based on data from all methodsStandard moisture retention dataPotential based on standard moisture retention dataRelative permeability based on standard moisture retention data
4Environmental Restoration Technology SectionPA Educational Forum 5/18/2010
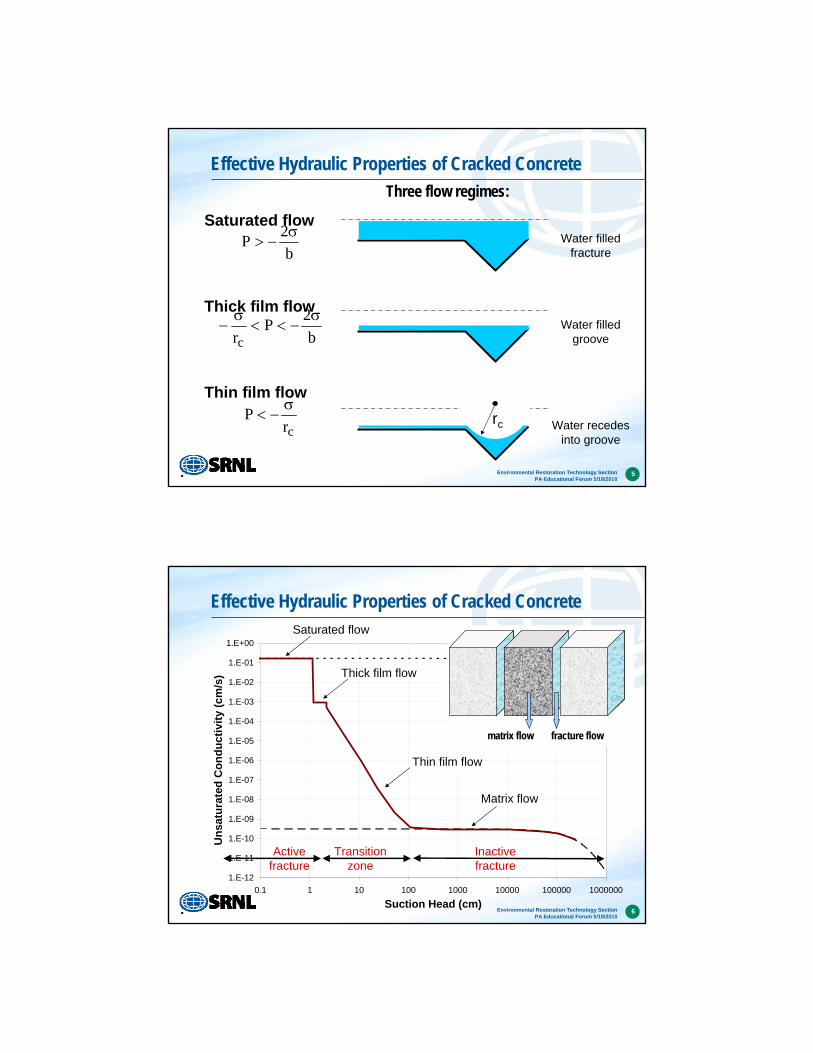
Effective Hydraulic Properties of Cracked Concrete
Or and Tuller (2000):
a) Wet fracture surface of Apache Leap Tuff (Arizona)
b) Idealized geometry
5Environmental Restoration Technology SectionPA Educational Forum 5/18/2010
Effective Hydraulic Properties of Cracked Concrete
Saturated flow
Thick film flow
Thin film flow
b
2P
b
2P
rc
crP
Water filled fracture
Water filled groove
Water recedes into groove
rc
Three flow regimes:
6Environmental Restoration Technology SectionPA Educational Forum 5/18/2010
Effective Hydraulic Properties of Cracked Concrete
1.E-12
1.E-11
1.E-10
1.E-09
1.E-08
1.E-07
1.E-06
1.E-05
1.E-04
1.E-03
1.E-02
1.E-01
1.E+00
0.1 1 10 100 1000 10000 100000 1000000
Suction Head (cm)
Un
satu
rate
d C
on
du
ctiv
ity
(cm
/s)
Intact concreteKsat correction onlyCracked concrete
Saturated flow
Thick film flow
Thin film flow
Active fracture
Inactive fracture
Transition zone
Matrix flow
matrix flow fracture flow
1
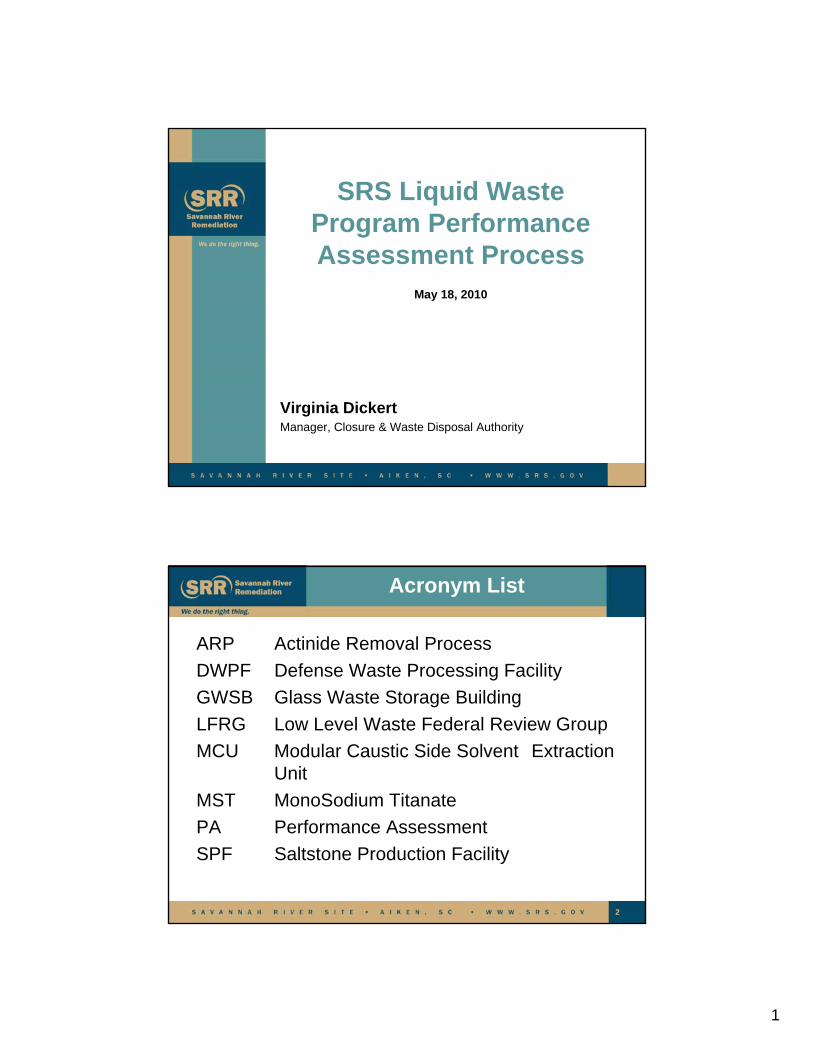
SRS Liquid Waste Program Performance Assessment Process
May 18, 2010
Virginia DickertManager, Closure & Waste Disposal Authority
2
Acronym List
ARP Actinide Removal Process
DWPF Defense Waste Processing Facility
GWSB Glass Waste Storage Building
LFRG Low Level Waste Federal Review Group
MCU Modular Caustic Side Solvent Extraction Unit
MST MonoSodium Titanate
PA Performance Assessment
SPF Saltstone Production Facility
2
3
Background
• Savannah River Remediation (SRR) assumed responsibility for the Liquid Waste Contract on July 1, 2009
• SRR’s mission is to operationally close all 22 of the old-style tanks within eight years
• The associated regulatory closure requirements are a key focus of this mission
• Liquid Waste Performance Assessments are a key tool supporting risk-informed decision making
4
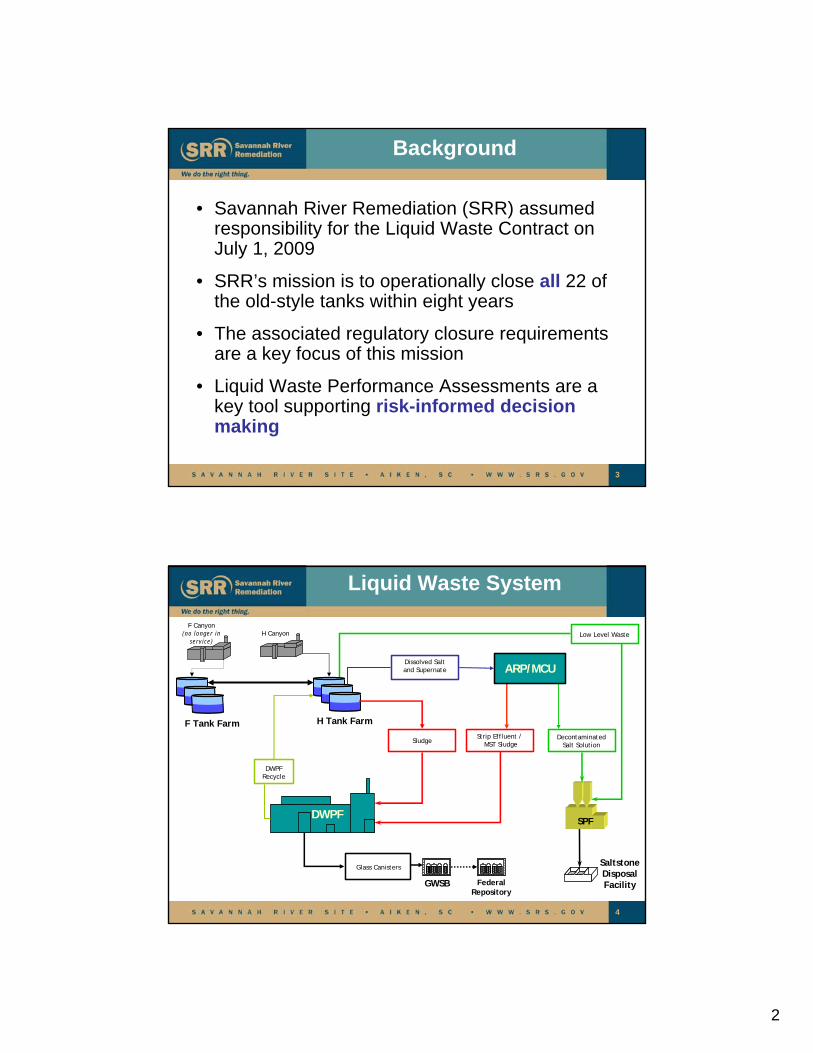
Sludge
Saltstone Disposal FacilityGWSB Federal
Repository
H Canyon
DWPF
F Canyon(no longer in
service)
Strip Effluent / MST Sludge
Dissolved Salt and Supernate
DWPF Recycle
Glass Canisters
F Tank Farm H Tank Farm
Low Level Waste
SPF
Decontaminated Salt Solution
ARP/MCU
Liquid Waste System
3
5
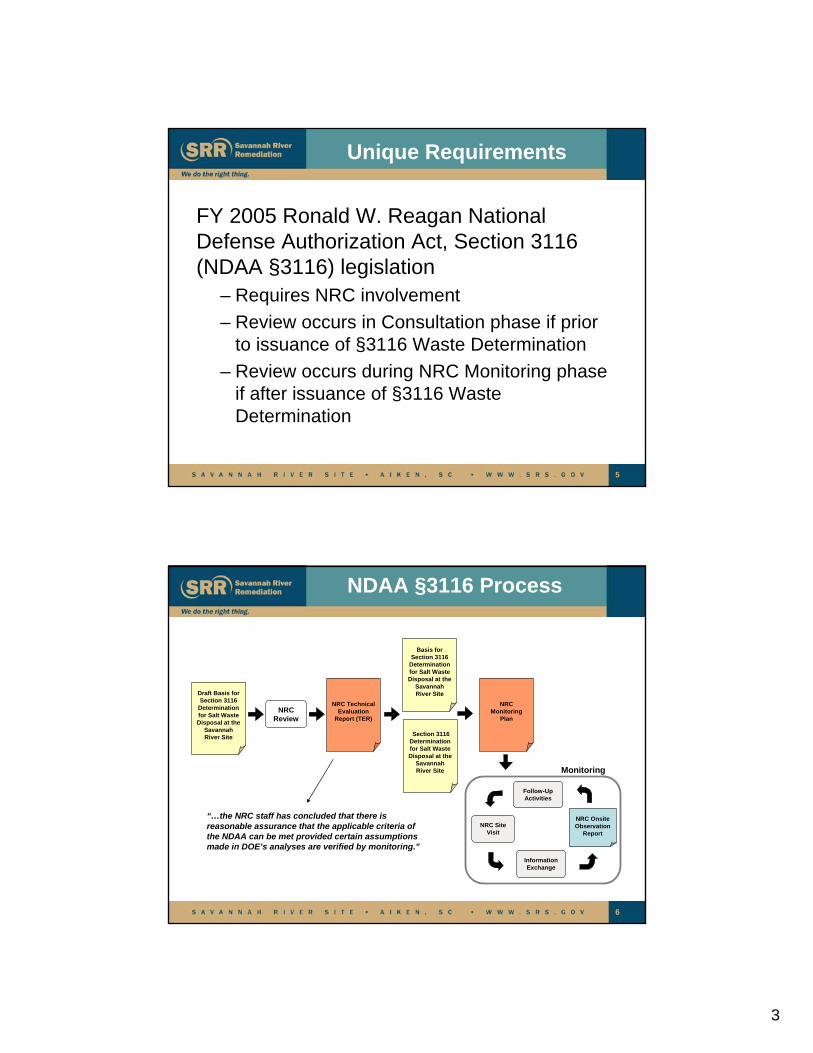
Unique Requirements
FY 2005 Ronald W. Reagan National Defense Authorization Act, Section 3116 (NDAA §3116) legislation
– Requires NRC involvement
– Review occurs in Consultation phase if prior to issuance of §3116 Waste Determination
– Review occurs during NRC Monitoring phase if after issuance of §3116 Waste Determination
6
NDAA §3116 Process
Draft Basis for Section 3116
Determination for Salt Waste Disposal at the
Savannah River Site
NRC Review
NRC Technical Evaluation
Report (TER)
Section 3116 Determination for Salt Waste Disposal at the
Savannah River Site
Basis for Section 3116
Determination for Salt Waste Disposal at the
Savannah River Site
NRC Monitoring
Plan
NRC Site Visit
NRC Onsite Observation
Report
“…the NRC staff has concluded that there is reasonable assurance that the applicable criteria of the NDAA can be met provided certain assumptions made in DOE’s analyses are verified by monitoring.”
Information Exchange
Follow-Up Activities
Monitoring
4
7
PA Preparation & Approval
• Special Group within SRR dedicated to preparation of complex closure and waste disposal documentation including PAs
• Scoping meeting process used to gain early input from DOE, SCDHEC, EPA, NRC and other stakeholders
• PAs are reviewed and approved by DOE-HQ through the LFRG process
8
• PAs are also provided to following groups for review and comment:– South Carolina Department of Health and
Environmental Control
– U.S. Environmental Protection Agency
– SRS Citizens Advisory Board
• Also posted for public access
PA Review
5
9
• SRR is currently in various stages of production for three PAs:– F-Tank Farm PA– Saltstone Disposal Facility PA– H-Tank Farm PA
• Prior to implementation, each of these PAswill have been provided to outside agencies for review and comment prior to final DOE approval and contractor implementation
Summary

1
Tom RobinsonSavannah River Remediation
Manager, Closure and Disposal AssessmentMay 18, 2010
SRR-CWDA-2010-00056
Liquid WastePerformance Assessments
Overview
2
200
300
300
200
300
300
300
200
300
300
300
200
300
300
300
300
300
300
200
300
300
200
200
300
300
F-Area E-Area H-Area
Z-Area
S-Area
Upper Three Runs
Fourmile Branch
McQueen Branch
Crouch Branch
0 2,000 4,000 Feet
0 600 1,200 Meters
N
F-Area Tank Farm (FTF)
LEGENDPerennial Stream
USGS Surface Contours (20ft)Facility Boundary
FTF
General Separations Area
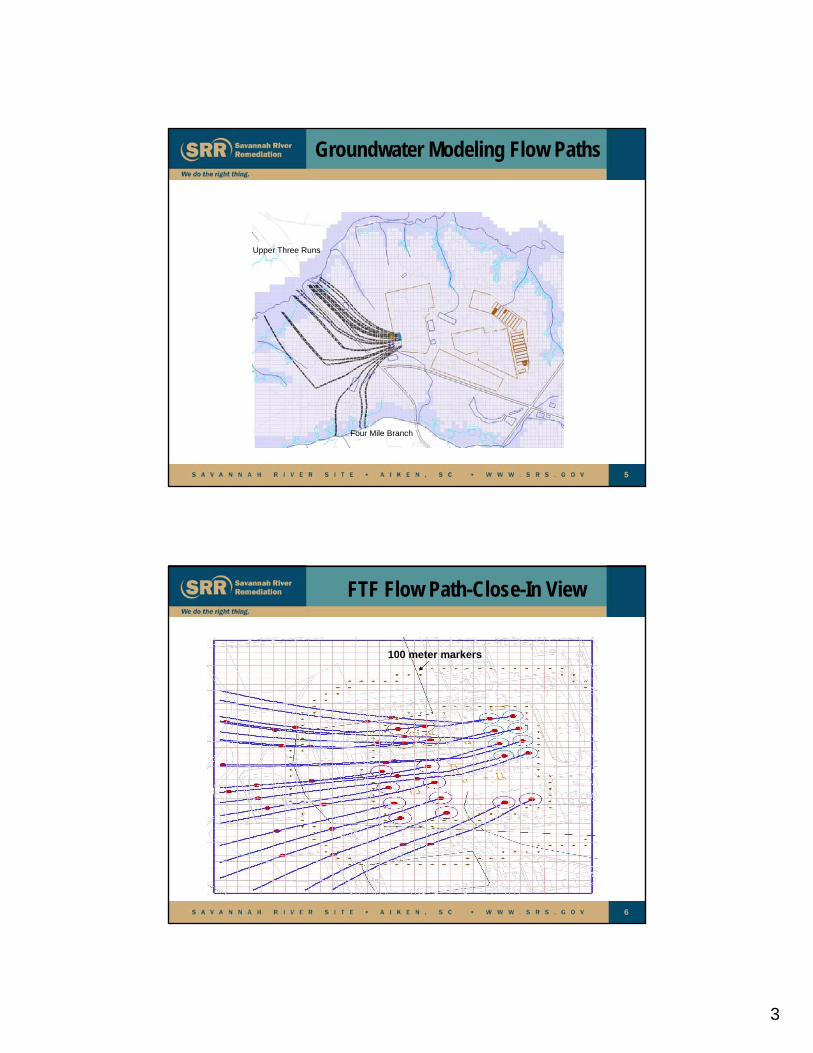
2
3
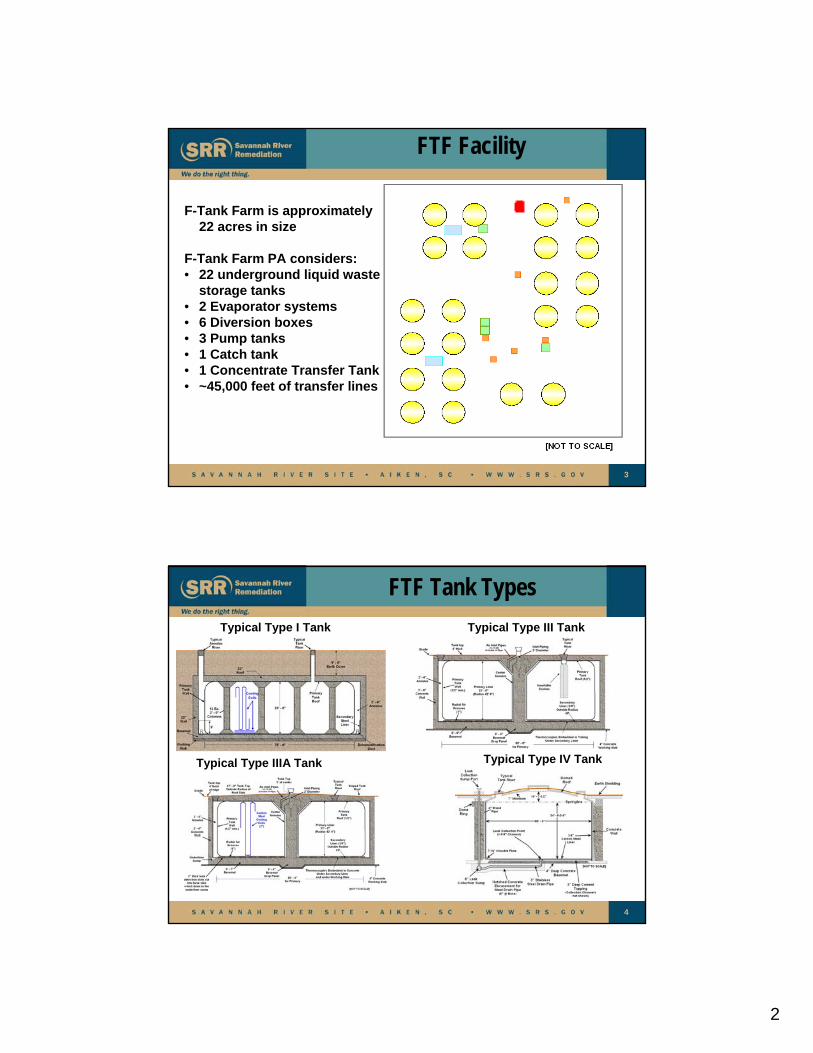
F-Tank Farm is approximately 22 acres in size
F-Tank Farm PA considers:• 22 underground liquid waste
storage tanks• 2 Evaporator systems• 6 Diversion boxes• 3 Pump tanks• 1 Catch tank• 1 Concentrate Transfer Tank• ~45,000 feet of transfer lines
FTF Facility
4
Typical Type I Tank Typical Type III Tank
Typical Type IIIA Tank Typical Type IV Tank
FTF Tank Types
3
5
Upper Three Runs
Four Mile Branch
Upper Three Runs
Four Mile Branch
Groundwater Modeling Flow Paths
6
FTF Flow Path-Close-In View
100 meter markers
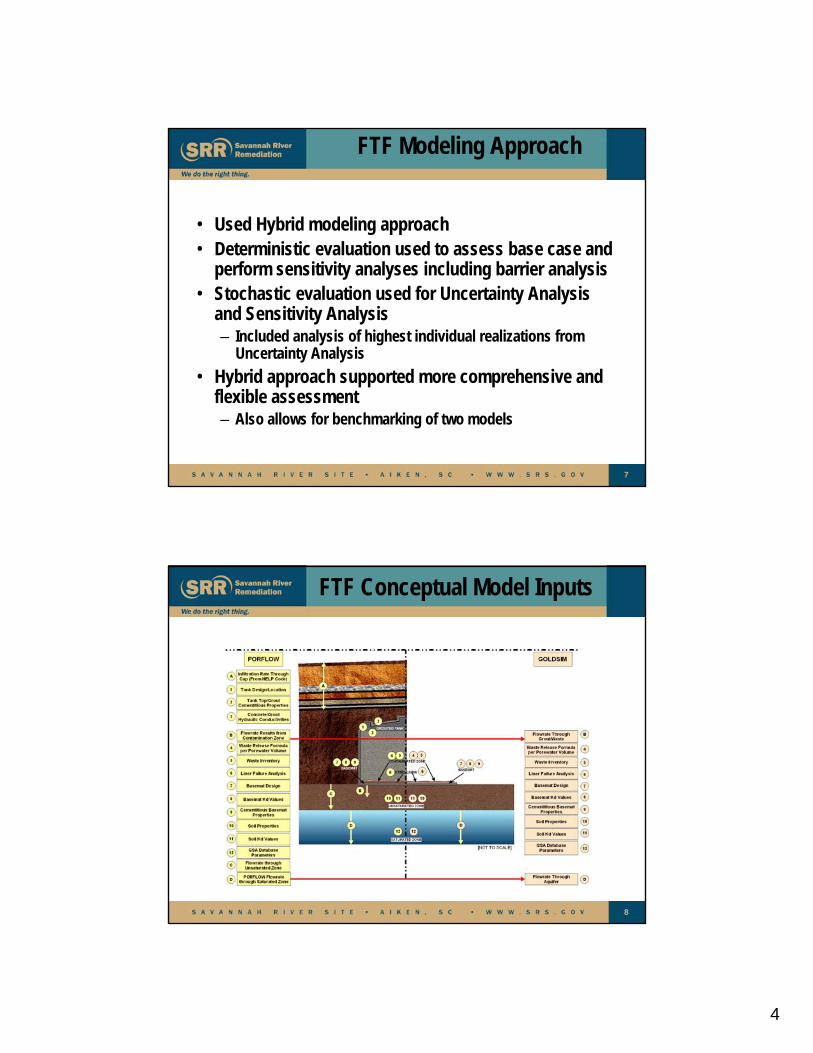
4
7
FTF Modeling Approach
• Used Hybrid modeling approach• Deterministic evaluation used to assess base case and
perform sensitivity analyses including barrier analysis • Stochastic evaluation used for Uncertainty Analysis
and Sensitivity Analysis – Included analysis of highest individual realizations from
Uncertainty Analysis • Hybrid approach supported more comprehensive and
flexible assessment – Also allows for benchmarking of two models
8
FTF Conceptual Model Inputs
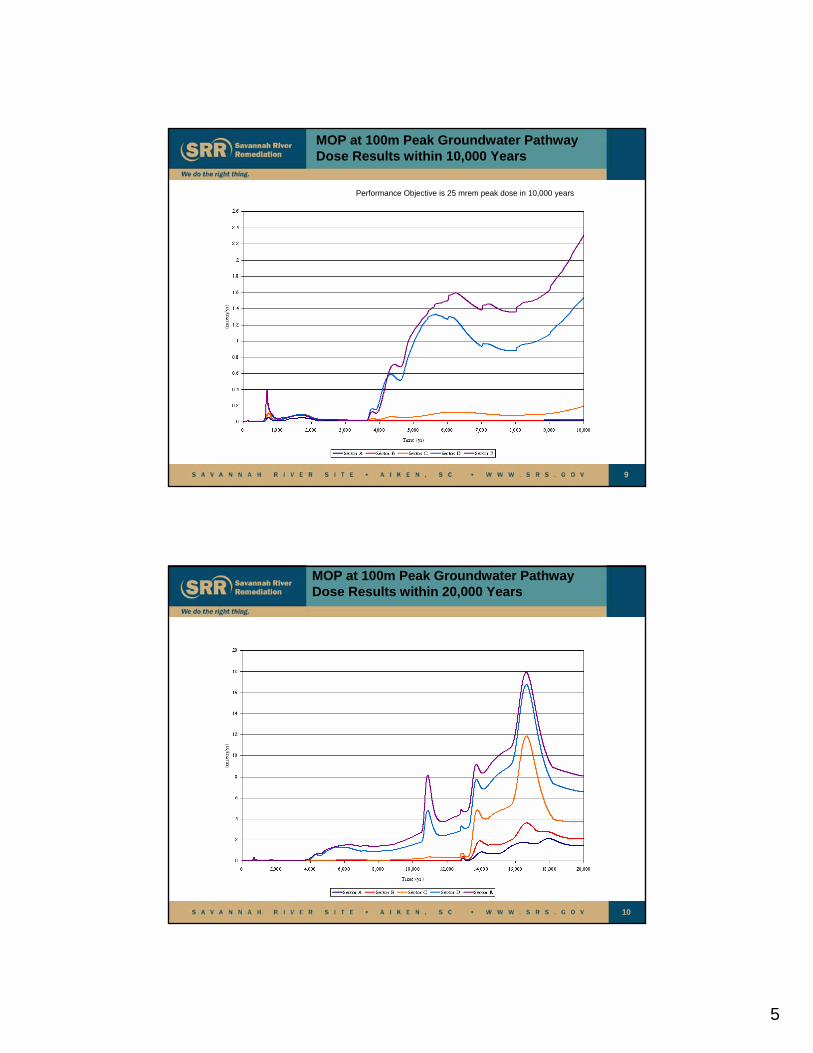
5
9
MOP at 100m Peak Groundwater Pathway Dose Results within 10,000 Years
Performance Objective is 25 mrem peak dose in 10,000 years
10
MOP at 100m Peak Groundwater Pathway Dose Results within 20,000 Years
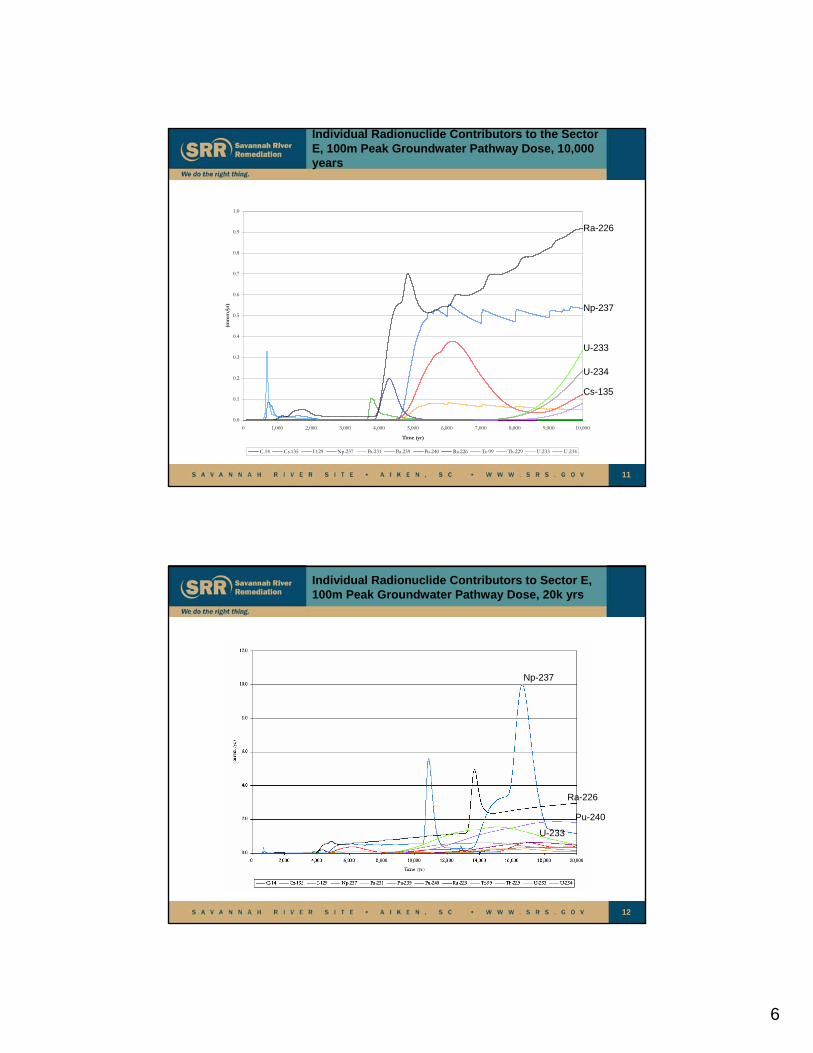
6
11
0.0
0.1
0.2
0.3
0.4
0.5
0.6
0.7
0.8
0.9
1.0
0 1,000 2,000 3,000 4,000 5,000 6,000 7,000 8,000 9,000 10,000
Time (yr)
(mre
m/y
r)
C-14 Cs-135 I-129 Np-237 Pa-231 Pu-239 Pu-240 Ra-226 Tc-99 Th-229 U-233 U-234
Individual Radionuclide Contributors to the Sector E, 100m Peak Groundwater Pathway Dose, 10,000 years
Ra-226
Np-237
U-233
U-234
Cs-135
12
Individual Radionuclide Contributors to Sector E, 100m Peak Groundwater Pathway Dose, 20k yrs
Ra-226
Np-237
U-233
Pu-240
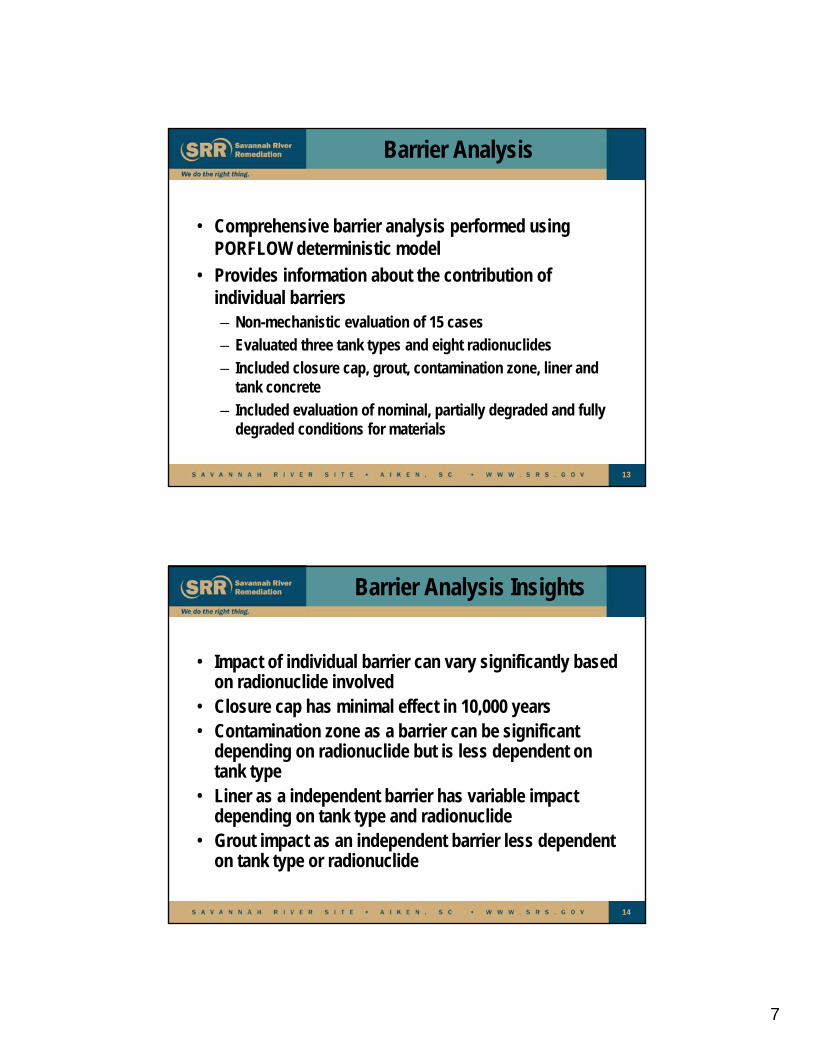
7
13
Barrier Analysis
• Comprehensive barrier analysis performed using PORFLOW deterministic model
• Provides information about the contribution of individual barriers– Non-mechanistic evaluation of 15 cases – Evaluated three tank types and eight radionuclides – Included closure cap, grout, contamination zone, liner and
tank concrete – Included evaluation of nominal, partially degraded and fully
degraded conditions for materials
14
Barrier Analysis Insights
• Impact of individual barrier can vary significantly based on radionuclide involved
• Closure cap has minimal effect in 10,000 years• Contamination zone as a barrier can be significant
depending on radionuclide but is less dependent on tank type
• Liner as a independent barrier has variable impact depending on tank type and radionuclide
• Grout impact as an independent barrier less dependent on tank type or radionuclide
8
15
FTF PA Summary
• Significant benefit from hybrid approach and performance of different analyses to provide understanding of importance of individual system features
• FTF PA Rev. 1 is currently undergoing external review • Analysis shows planned FTF closure activities result in
peak doses/concentrations well below regulatory requirements
16
H Tank Farm PA Status
• H Tank Farm PA is under development
• HTF PA scoping meeting was held 4/20-21
• HTF PA Rev. 0 will be issued for review and comments 3/31/2011
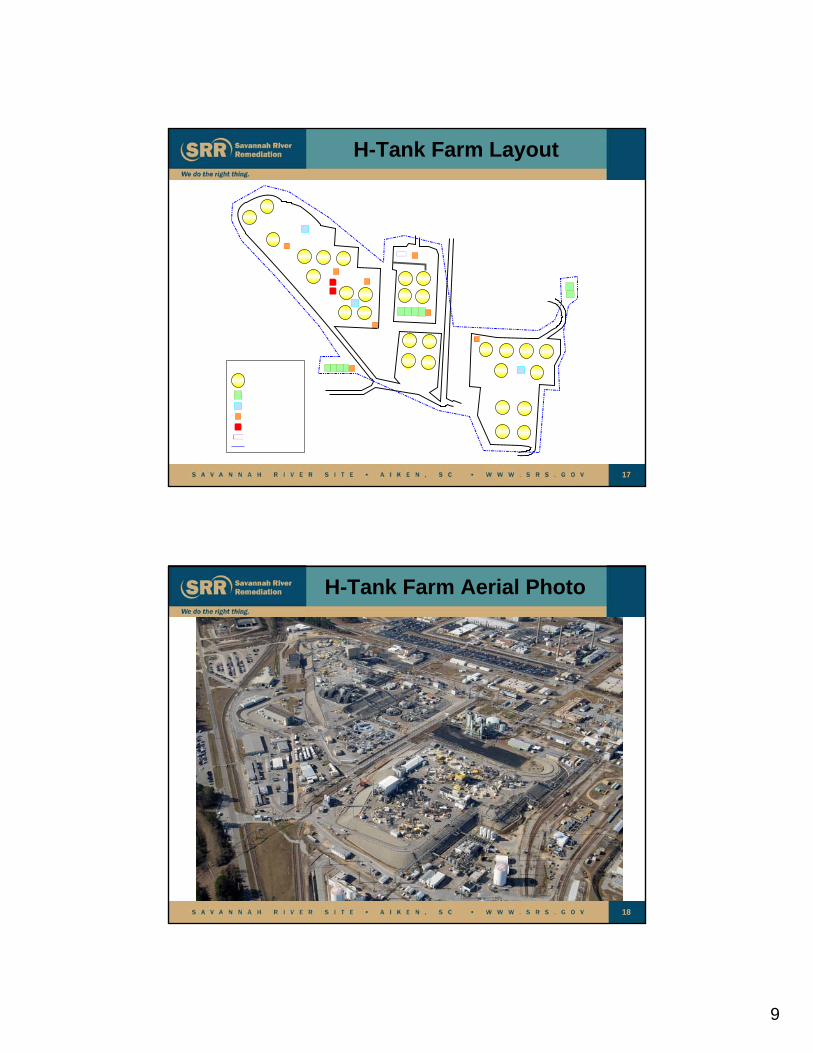
9
17
H-Tank Farm Layout
18
H-Tank Farm Aerial Photo
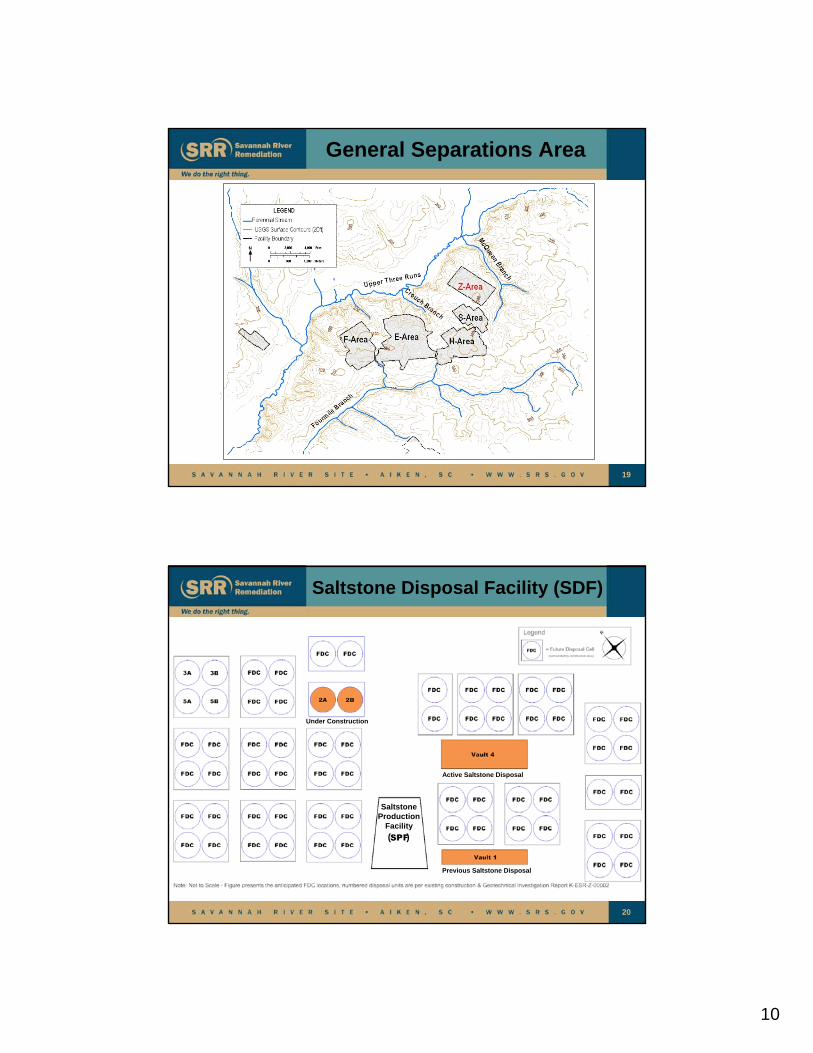
10
19
General Separations Area
20
Saltstone Disposal Facility (SDF)
Under Construction
Active Saltstone Disposal
Previous Saltstone Disposal
Saltstone Production
Facility
( )
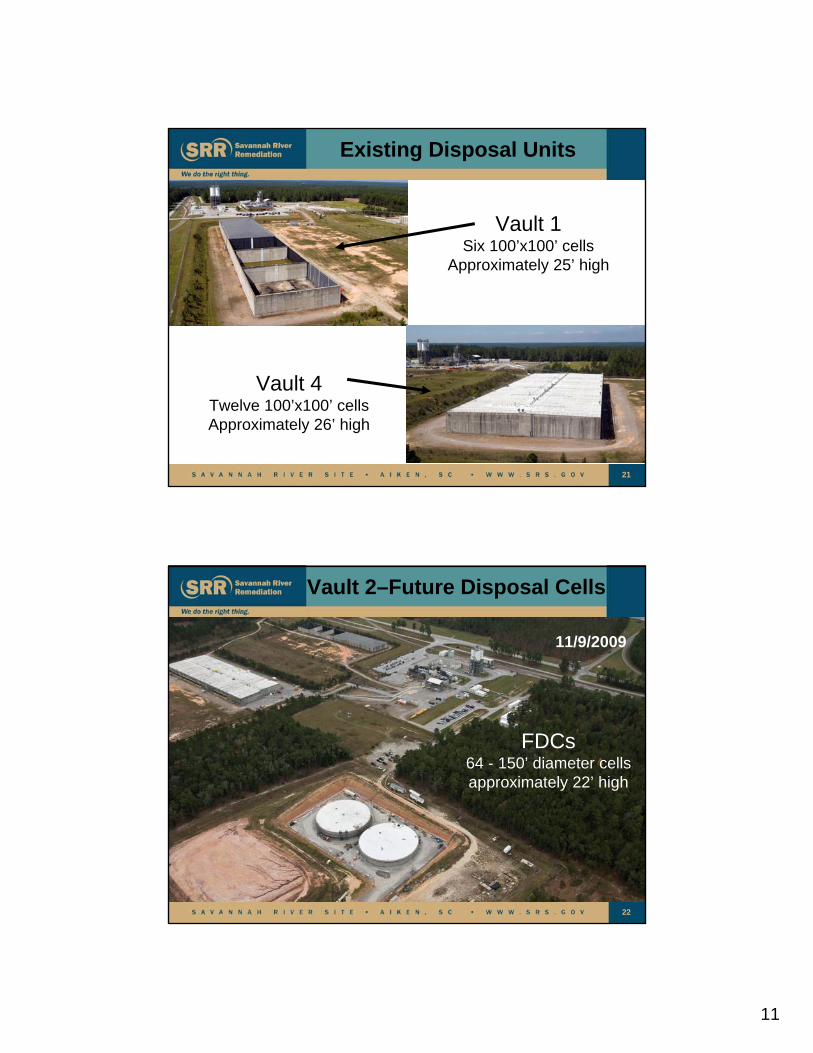
11
21
Existing Disposal Units
Vault 1Six 100’x100’ cells
Approximately 25’ high
Vault 4Twelve 100’x100’ cellsApproximately 26’ high
22
Vault 2–Future Disposal Cells
11/9/2009
FDCs64 - 150’ diameter cellsapproximately 22’ high
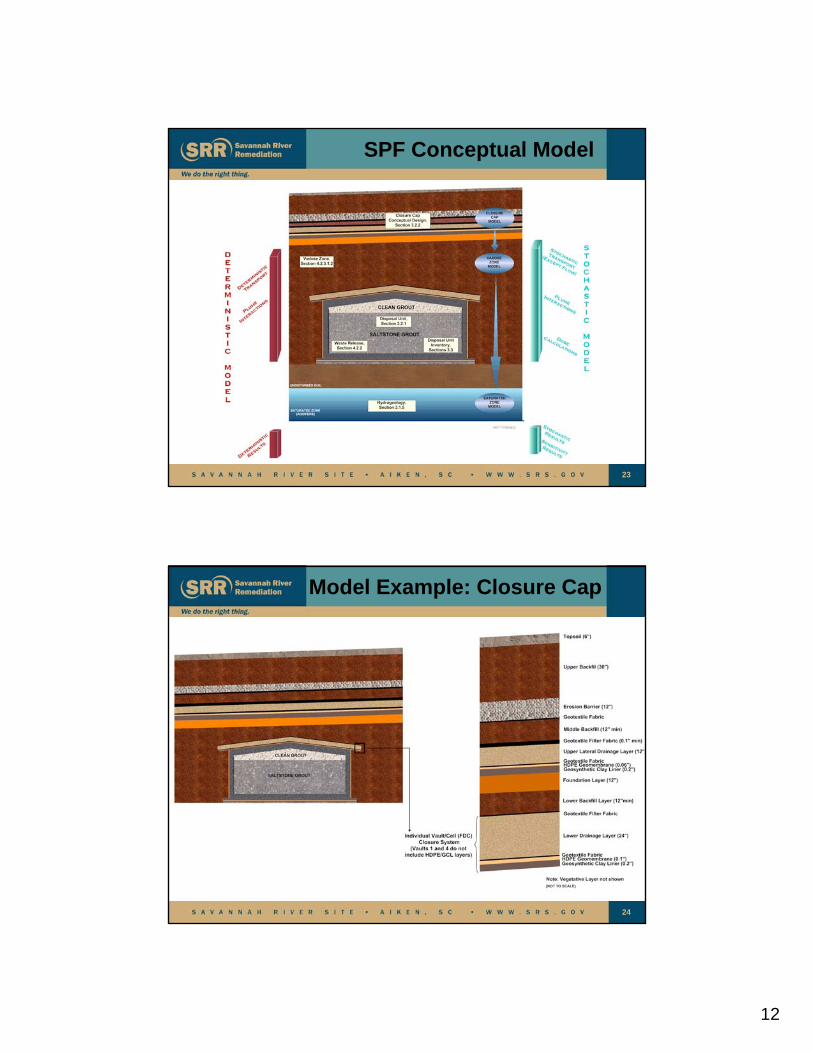
12
23
SPF Conceptual Model
24
Model Example: Closure Cap
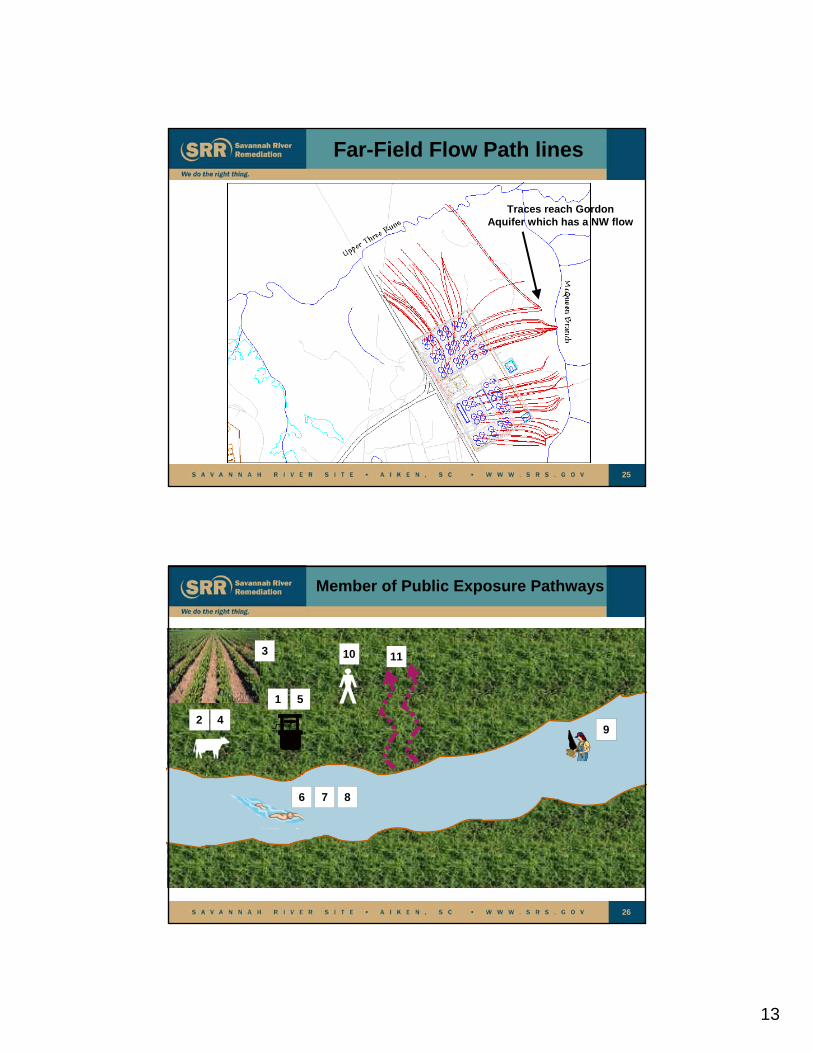
13
25
Far-Field Flow Path lines
Traces reach Gordon Aquifer which has a NW flow
26
Member of Public Exposure Pathways
2 4
5
6 7 8
1110
1
3
9
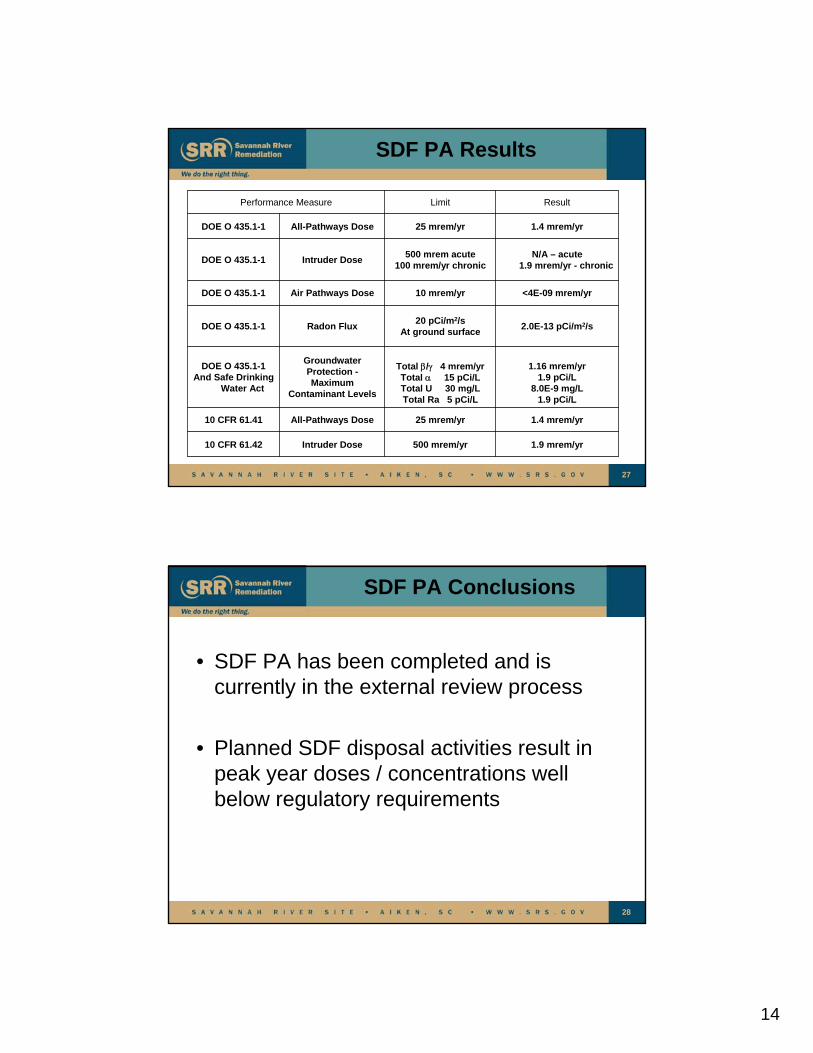
14
27
SDF PA Results
1.9 mrem/yr500 mrem/yrIntruder Dose10 CFR 61.42
1.4 mrem/yr25 mrem/yrAll-Pathways Dose10 CFR 61.41
1.16 mrem/yr1.9 pCi/L
8.0E-9 mg/L1.9 pCi/L
Total / 4 mrem/yrTotal 15 pCi/LTotal U 30 mg/LTotal Ra 5 pCi/L
Groundwater Protection -Maximum
Contaminant Levels
DOE O 435.1-1And Safe Drinking
Water Act
2.0E-13 pCi/m2/s20 pCi/m2/s
At ground surfaceRadon FluxDOE O 435.1-1
<4E-09 mrem/yr10 mrem/yrAir Pathways DoseDOE O 435.1-1
N/A – acute1.9 mrem/yr - chronic
500 mrem acute100 mrem/yr chronic
Intruder DoseDOE O 435.1-1
1.4 mrem/yr25 mrem/yrAll-Pathways DoseDOE O 435.1-1
ResultLimitPerformance Measure
28
SDF PA Conclusions
• SDF PA has been completed and is currently in the external review process
• Planned SDF disposal activities result in peak year doses / concentrations well below regulatory requirements
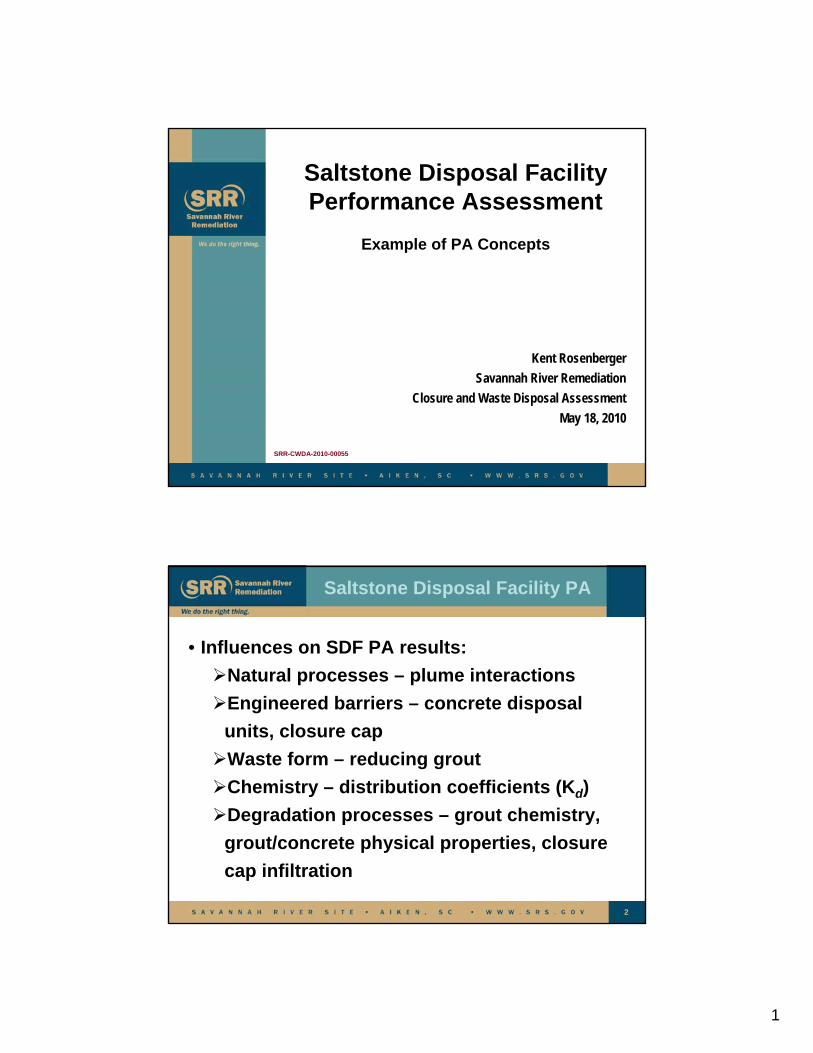
1
Kent RosenbergerSavannah River Remediation
Closure and Waste Disposal AssessmentMay 18, 2010
SRR-CWDA-2010-00055
Saltstone Disposal FacilityPerformance Assessment
Example of PA Concepts
2
• Influences on SDF PA results:
Natural processes – plume interactions
Engineered barriers – concrete disposal
units, closure cap
Waste form – reducing grout
Chemistry – distribution coefficients (Kd)
Degradation processes – grout chemistry,
grout/concrete physical properties, closure
cap infiltration
Saltstone Disposal Facility PA
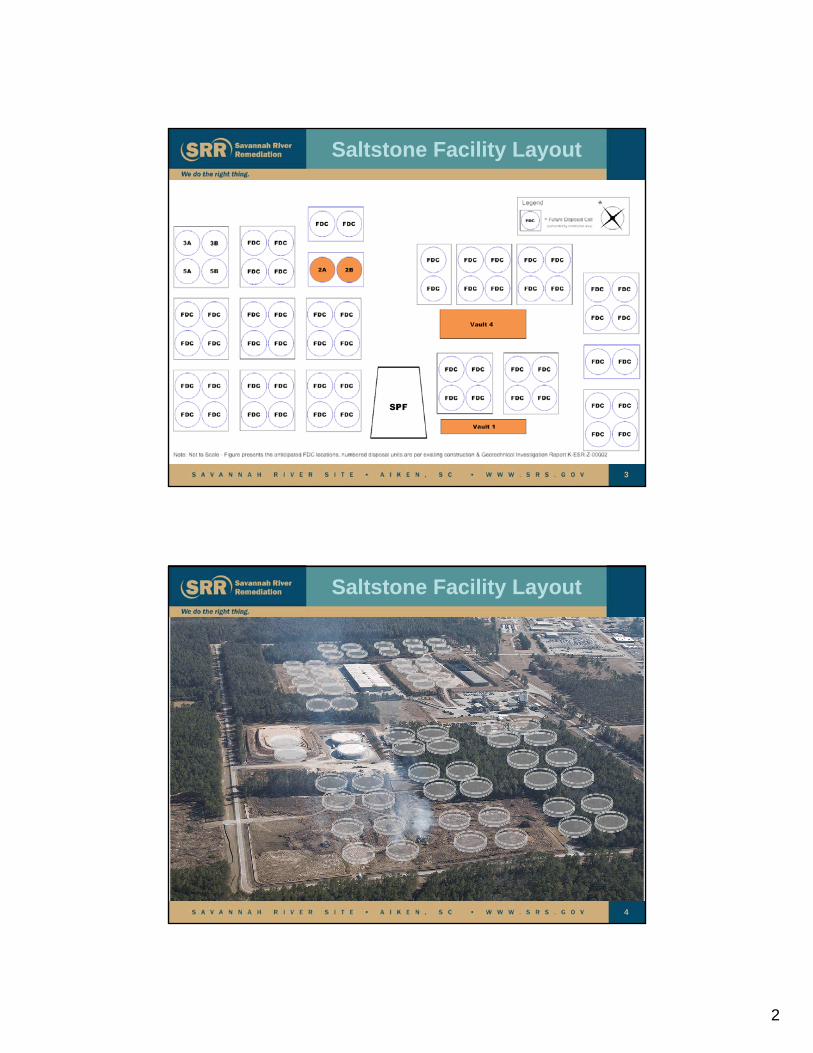
2
3
Saltstone Facility Layout
4
Saltstone Facility Layout
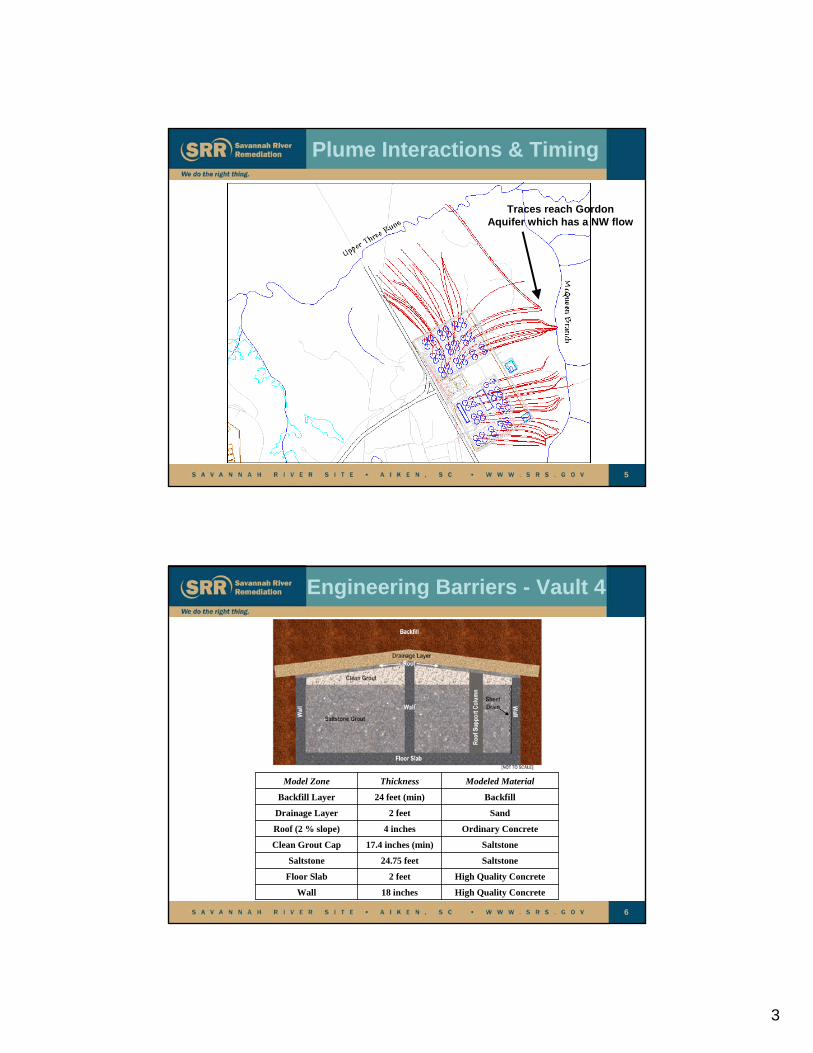
3
5
Plume Interactions & Timing
Traces reach Gordon Aquifer which has a NW flow
6
Engineering Barriers - Vault 4
High Quality Concrete18 inchesWall
High Quality Concrete2 feetFloor Slab
Saltstone24.75 feetSaltstone
Saltstone17.4 inches (min)Clean Grout Cap
Ordinary Concrete4 inchesRoof (2 % slope)
Sand2 feetDrainage Layer
Backfill24 feet (min)Backfill Layer
Modeled MaterialThicknessModel Zone
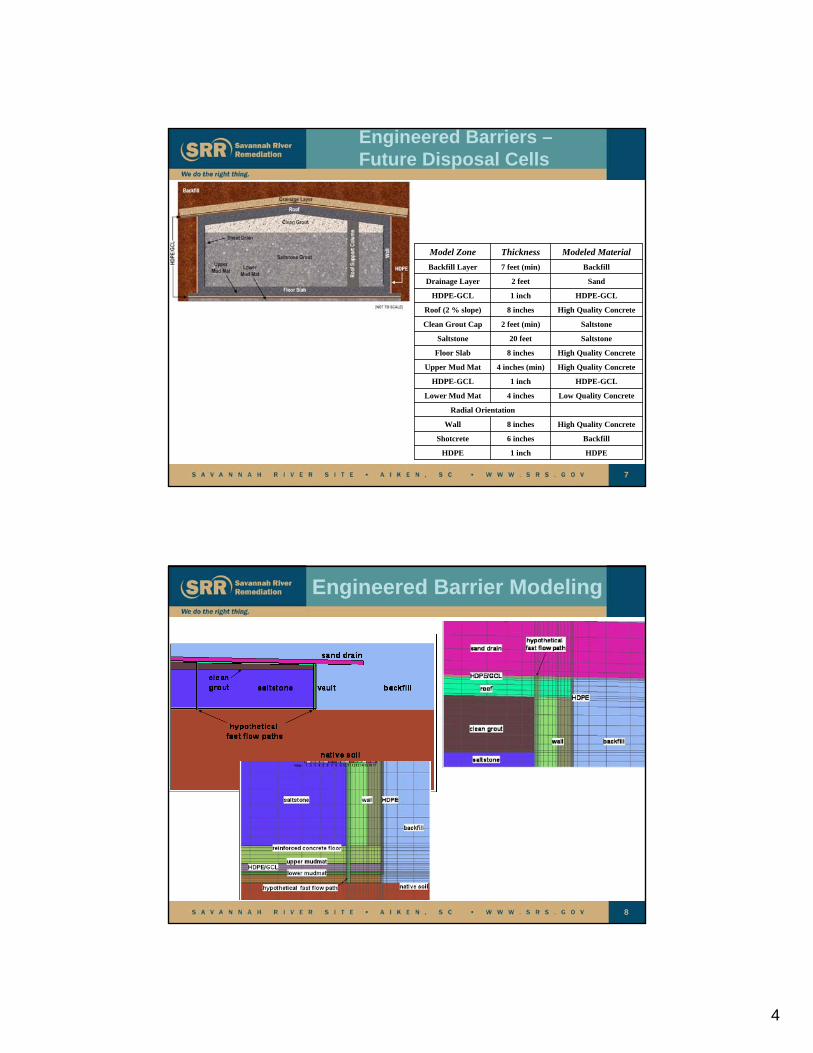
4
7
Engineered Barriers –Future Disposal Cells
HDPE1 inchHDPE
Backfill6 inchesShotcrete
High Quality Concrete8 inchesWall
Radial Orientation
Low Quality Concrete4 inchesLower Mud Mat
HDPE-GCL1 inchHDPE-GCL
High Quality Concrete4 inches (min)Upper Mud Mat
High Quality Concrete8 inchesFloor Slab
Saltstone20 feetSaltstone
Saltstone2 feet (min)Clean Grout Cap
High Quality Concrete8 inchesRoof (2 % slope)
HDPE-GCL1 inchHDPE-GCL
Sand2 feetDrainage Layer
Backfill7 feet (min)Backfill Layer
Modeled MaterialThicknessModel Zone
8
Engineered Barrier Modeling
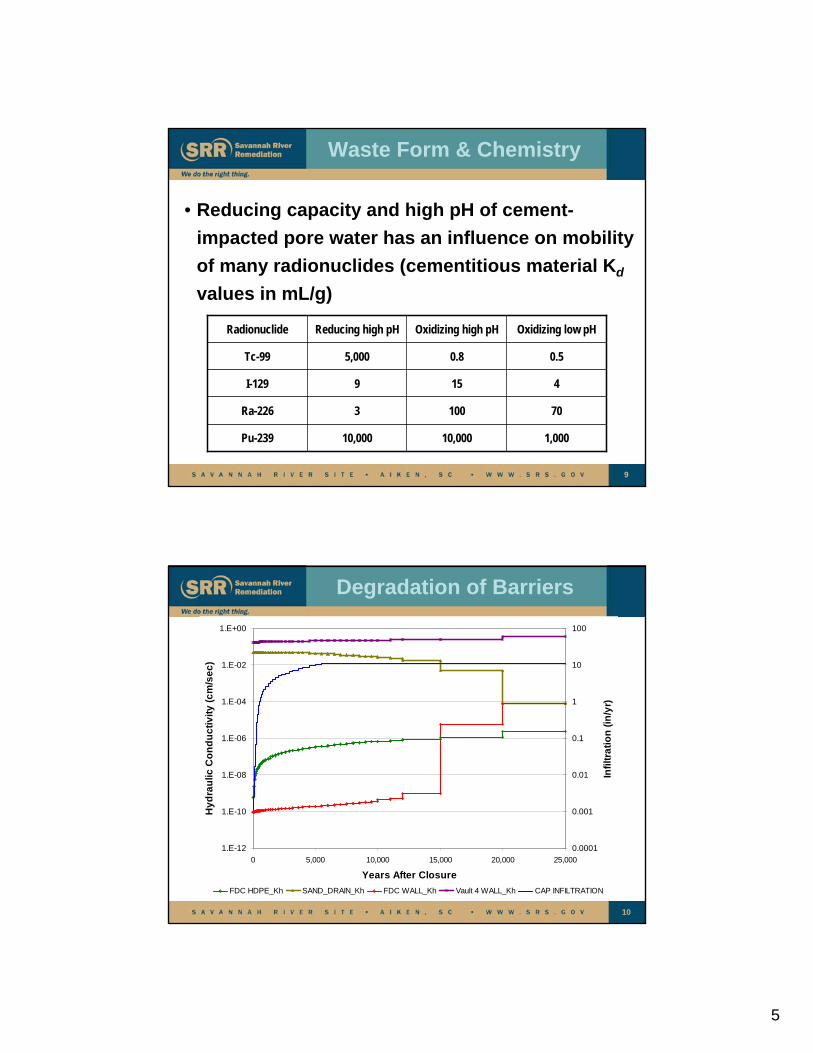
5
9
Waste Form & Chemistry
• Reducing capacity and high pH of cement-
impacted pore water has an influence on mobility
of many radionuclides (cementitious material Kd
values in mL/g)
1,00010,00010,000Pu-239
701003Ra-226
4159I-129
0.50.85,000Tc-99
Oxidizing low pHOxidizing high pHReducing high pHRadionuclide
10
Degradation of Barriers
1.E-12
1.E-10
1.E-08
1.E-06
1.E-04
1.E-02
1.E+00
0 5,000 10,000 15,000 20,000 25,000
Years After Closure
Hy
dra
ulic
Co
nd
uc
tiv
ity
(c
m/s
ec
)
0.0001
0.001
0.01
0.1
1
10
100
Infi
ltra
tio
n (
in/y
r)
FDC HDPE_Kh SAND_DRAIN_Kh FDC WALL_Kh Vault 4 WALL_Kh CAP INFILTRATION
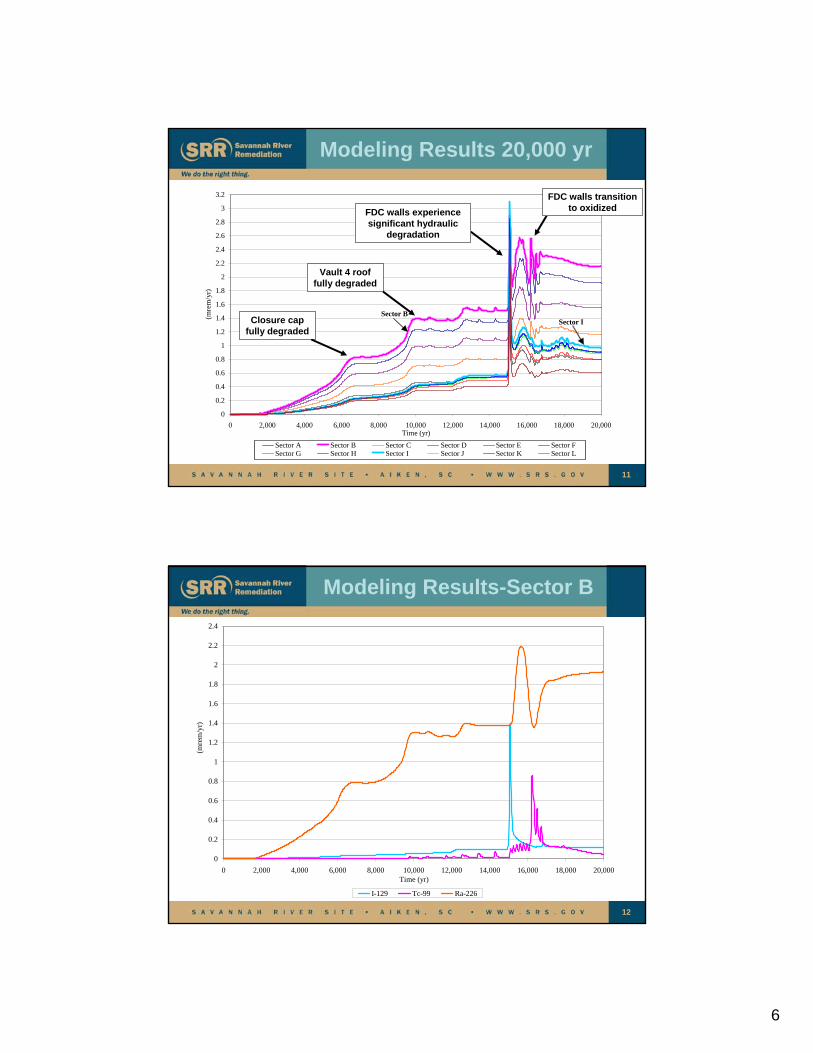
6
11
0
0.2
0.4
0.6
0.8
1
1.2
1.4
1.6
1.8
2
2.2
2.4
2.6
2.8
3
3.2
0 2,000 4,000 6,000 8,000 10,000 12,000 14,000 16,000 18,000 20,000Time (yr)
(mre
m/y
r)
Sector A Sector B Sector C Sector D Sector E Sector FSector G Sector H Sector I Sector J Sector K Sector L
Sector BSector I
Modeling Results 20,000 yr
Closure cap fully degraded
Vault 4 roof fully degraded
FDC walls experience significant hydraulic
degradation
FDC walls transition to oxidized
12
Modeling Results-Sector B
0
0.2
0.4
0.6
0.8
1
1.2
1.4
1.6
1.8
2
2.2
2.4
0 2,000 4,000 6,000 8,000 10,000 12,000 14,000 16,000 18,000 20,000Time (yr)
(mre
m/y
r)
I-129 Tc-99 Ra-226
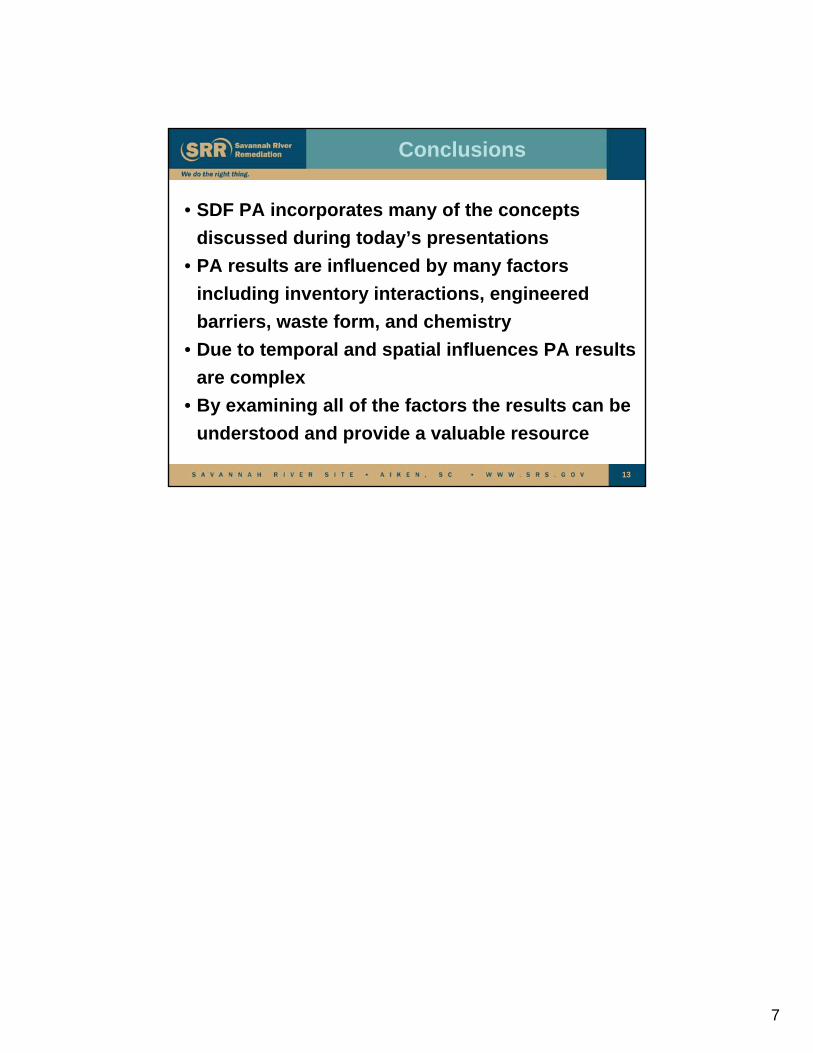
7
13
Conclusions
• SDF PA incorporates many of the concepts
discussed during today’s presentations
• PA results are influenced by many factors
including inventory interactions, engineered
barriers, waste form, and chemistry
• Due to temporal and spatial influences PA results
are complex
• By examining all of the factors the results can be
understood and provide a valuable resource
NRC Perspective on Performance Assessment
1
Nishka DevaserProject Manager
Environmental Protection & Performance Assessment DirectorateU.S. Nuclear Regulatory Commission
Contact: (301) 415-5196, [email protected]
May 18, 2010
Presented to: Savannah River Site Citizens’ Advisory Board
Performance Assessment
• IS…– A tool for understanding how a site’s natural and
engineered features retain radioactive materials.
• IS NOT…– A subjective process to produce a result supporting
a pre-determined decision (e.g., “the site is safe”)
– A substitute for a lack of key data
2
A PA should be used:
• To estimate radionuclide release and transport, and potential radiation dose to an average member of a critical group;
• To evaluate the effects of uncertainty and variability; and
• To provide information to decision makers.
3
Objectives for NRC PA Reviews
• The primary objectives of NRC’s PA review are to:– Identify risk-significant matters;
– Explore parameter and model uncertainty;
– Perform a risk-informed review of DOE’s PA model.
• NRC will base decisions on DOE’s PA model
4
NDAA Criteria
1. Does not require permanent isolation in a deep geologic repository
2. Highly radioactive radionuclides are removed to the maximum extent practical
3. Meets 10 CFR Part 61, Subpart C performance objectives– NRC’s review of a DOE PA is generally focused on
this last criterion
5
10 CFR Part 61, Subpart CPerformance Objectives
• 61.40 General requirements
• 61.41 Protection of the general population from releases of radioactivity
• 61.42 Protection of individuals from inadvertent intrusion
• 61.43 Protection of individuals during operations
• 61.44 Stability of the disposal site after closure
6
10 CFR 61.41Protection of the general population from releases of radioactivity
• Some areas of NRC review include:– How radioactive material might be released in the
future
– How future populations may be exposed to radioactive material
– Understanding how site features and environmental processes influence future human doses
7
10 CFR 61.42Protection of individuals from inadvertent intrusion
• NRC staff review:– The behavior of hypothetical intruders, timing and
dose pathways assumed.
– The operations, procedures, materials, barriers, and structures designed to provide protection.
8
10 CFR 61.44Stability of the disposal site after closure
• Stability of waste and the site is important to ensure disruptive processes like erosion, flooding, and seismicity, are considered in siting, design, use, operation, and closure of the disposal facility.
9
PA Review ProceduresNUREG-1854 – NRC Staff Guidance
• Scenario Selection and Receptor Groups
• Computational Models and Computer Codes
• Uncertainty/Sensitivity Analysis for Overall PA
• Evaluation of Model Results
• ALARA Analysis
• Inadvertent Intrusion
10
NRC Review ProceduresExamples
• Under “Specific Technical Review Procedures,” are review procedures for Climate and Infiltration
• Within the Climate review area, NRC staff would, for example, confirm that precipitation estimates are based on long-term precipitation data for the disposal facility
11
NRC Review ProceduresExamples
• Under “Computational Models and Computer Codes,” is a review area on Modeling Approach: Probabilistic or Deterministic.
• Within this area, NRC examines DOE’s choice of either a deterministic or probabilistic approach to compliance with the performance objectives
12
NRC PA reviewResults
• Through the PA review, NRC staff develops an understanding of factors that are important to NRC staff’s finding of reasonable assurance that the 10 CFR Part 61 performance objectives are being (or will be) met.
• These risk-significant factors, called “key monitoring areas,” are identified in NRC’s Technical Evaluation Report.
13
NRC Monitoring
• Once DOE issues a final waste determination, NRC will:
• Prepare a monitoring plan in coordination with the covered State; and
• Monitor DOE disposal actions, focusing on key monitoring areas that NRC identified during the PA review.
• NRC will also review routine updates of DOE’s PAs as they become available.
14
Regulatory Perspectiveon Performance Assessment
Questions?
15