public expenditure and financial accountability assessment...
TRANSCRIPT

Public Expenditure and Financial Accountability Assessment for the City of Tshwane
2015
Final Report

2
Public Expenditure and Financial Accountability Assessment for the City of
Tshwane Metropolitan Municipality, Republic of South Africa, 2015
Final Report
The quality assurance process followed in the production of this report satisfies all the
requirements of the PEFA Secretariat and hence receives the ‘PEFA CHECK’.
PEFA Secretariat
November 3, 2015
1
CONTENTS
ACRONYMS AND ABBREVIATIONS ............................................................................................ 2
SUMMARY ASSESSMENT ............................................................................................................. 3
1. INTRODUCTION .......................................................................................................................... 8
2. BACKGROUND INFORMATION ON CITY OF TSHWANE ..................................................... 11
2.1 ECONOMIC CONTEXT .............................................................................................................. 11 2.2 DEVELOPMENT AND REFORMS ................................................................................................ 12
a) The social and economic situation ................................................................................ 12 b) Fiscal policy and fiscal development ............................................................................. 12 c) Allocation of resources .................................................................................................. 13
2.3 DESCRIPTION OF THE LEGAL AND INSTITUTIONAL FRAMEWORK FOR PFM................................... 16 a) Existing legislation and regulations ................................................................................ 16 b) Institutional framework ................................................................................................... 19 c) Key features of the PFM system .................................................................................... 19 d) Structure of CoT ............................................................................................................. 20
3. ASSESSMENT OF PFM SYSTEMS, PROCESSES AND INSTITUTIONS .............................. 22
3.1 BUDGET CREDIBILITY .............................................................................................................. 23 3.2 COMPREHENSIVENESS AND TRANSPARENCY ............................................................................ 28 3.3 POLICY-BASED BUDGETING ..................................................................................................... 34 3.4 PREDICTABILITY AND CONTROL IN BUDGET EXECUTION ............................................................. 40 3.5 ACCOUNTING, RECORDING AND REPORTING ............................................................................. 53 3.6 EXTERNAL SCRUTINY AND AUDIT ............................................................................................. 56
4. GOVERNMENT REFORM PROCESS ...................................................................................... 61
ANNEXES ...................................................................................................................................... 64
A Documents consulted B People interviewed C Functions assigned to Municipalities by the Constitution D Calculations for HLG-1, PI-1 & 2 E Summary of ratings
2
Acronyms and Abbreviations
AG Auditor-General
AGSA Auditor-General of South Africa
AO Accounting Officer
ASB Accounting Standards Board
BBEEA Broad based Black Economic Empowerment Act
CFO Chief Financial Officer
COA Chart of Accounts
CoT City of Tshwane Metropolitan Municipal Council
COFOG Classifications of Functions of Government
DFS Department of Financial Services (CoT Treasury)
DORA (B) Division of Revenue Act (Bill)
FMIP Financial Management Improvement Programme
FY Fiscal Year
GDP Gross Domestic Product
GFS Government Financial Statistics
GNI Gross National Income
GRAP Generally Recognised Accounting Practice (as issued by the SA ASB)
IA Internal Audit
IDP Integrated Development Plan
IIA Institute of Internal Auditors
INTOSAI International Organisation of Supreme Audit Institutions
MFMA Municipal Finance Management Act
MMC Member of Mayoral Committee
MPAC Municipal Public Accounts Committee
MTREB Medium Term Revenue and Expenditure Budget
NT National Treasury
PAA Public Audit Act
PE Public Enterprise
PEFA Public Expenditure and Financial Accountability
PFM Public Financial Management
PPP Public Private Partnership
PPPFA Preferential Procurement Policy Framework Act
R Rand, South African currency
SACN South African Cities Network
SCM Supply Chain Management
SCOA Standard Chart of Accounts
SDBIP Service Delivery and Budget Implementation Plan
SECO (Swiss) State Secretariat for Economic Affairs
The South African municipal financial year begins on 1 July,
and 1 ZAR = 0.08 USD (July 2015)
3
Summary Assessment
This integrated summary assessment examines the performance of the public financial management
systems operating in the City of Tshwane Metropolitan Municipality (CoT) under the six key
dimensions defined in the PEFA framework, and examines the implications of weaknesses for the
three budgetary outcomes (aggregate fiscal discipline; strategic allocation of resources and efficient
service delivery).
Credibility of the budget
Budget credibility is good, as there are very small expenditure variances both at the aggregate and
individual vote levels. Original expenditure budgets and actual expenditure outcomes (PI-1) were
between -1.4% and 1.8%, in the three years under review – 2011/2012, 2012/2013, 2013/2014, and
final budget outturns did not vary significantly from the original estimates at the individual vote level
(PI-2), suggesting that expenditure budgets are realistic and that budget discipline is good, reflecting
a strong link between budget formulation and execution. On the revenue side, there are variances
between the total revenue originally budgeted and outturn (PI-3), in part explained by the global
economic environment.
The expenditure spikes often seen towards the final months of the fiscal year are evident, particularly
in respect of capital expenditure. The stock of expenditure arrears, while reducing over the period
remains in excess of 10% of expenditure. In some situations budget credibility is undermined by
extra-budgetary activities; however this is not the case in CoT as there is very little expenditure that is
unreported.
Comprehensiveness and transparency
The budget documentation is comprehensive, although the classification system in place does not
accord with GFS/COFOG standards: however, data is compiled and reported to the National
Treasury. There is a (national) process to reform the municipal chart of accounts, and CoT is one of
the pilots in this exercise, due to be completed by 1 July 2017.
The Department of Financial Services oversees fiscal risk arising from the three municipal entities
operated by CoT, and their financial performance is reported monthly to both Council and the National
Treasury.
The fiscal information available to citizens covers the entire budget cycle i.e. budget formulation and
planning, budget execution, and external scrutiny and audit. Public access to key fiscal information
in CoT is transparent, generally comprehensive, user-friendly and timely.
Policy-based budgeting
A clear annual budget calendar exists and is followed: it allows departments to meaningfully complete
their detailed estimates of revenue and expenditure. There is also sufficient time for departments to
adjust bids – over and above the base line – after approval by the Mayoral Committee.
The Department of Financial Services issues comprehensive and clear budget guidelines for an
integrated recurrent and capital budget process. The Medium Term Revenue and Expenditure

4
Budget allocations serve as firm budget guidelines, but may be subject to what are usually relatively
minor adjustments through a bid process over and above these guidelines. The Mayoral Committee
approves allocations in time to allow departments a further period (around four weeks) to incorporate
final amendments.
In the years reviewed by this assessment, the budget was approved by the CoT Council before the
start of the fiscal year, as required by the MFMA. Forecasts of fiscal aggregates are prepared for
three years, including the budget year. The forecasts are directly linked to subsequent budget
ceilings and include functional/sector classifications. Some sector strategies are prepared but these
do not fully reflect both investment costs and subsequent recurrent expenditure.
Predictability and control in budget execution
The transparency of taxpayer (ratepayer) obligations and liabilities is reasonable, and the collection of
tax payments effective, as CoT has a comprehensive register of properties upon which assessment
rates are levied. However, measures to control ratepayer registration are less effective – for example
when a property is sold, and are not systematically followed up.
The budget execution process provides each department with a spending horizon of twelve months
for expenditure commitment. Cash flows are prepared and updated monthly on a rolling basis. The
preparation of procurement plans is a pre-requisite to cash flow preparation and budget releases.
Departments are also required to prepare annual performance plans to guide their activities.
Controls in personnel and payroll administration are weak (despite the direct links between the post
database, the personnel database and the payroll database) in that the manual reconciliation process
is a cause for concern, although there is a physical head count signed off by the head of each unit
prior to payment of salaries. There are audit trails for any changes to personnel and payroll records,
although the time for any changes to take effect and for records to be updated is unduly long.
There are on-going reforms to Supply Chain Management (procurement). The Preferential
Procurement Policy Framework Act provides the legal framework, supported by the Treasury
Regulations, and fairness, equitable, transparent, competitive and cost-effective procurement
practices are prescribed. Justification for the use of procurement methods other than open
competition is the responsibility of the Accounting Officer.
Internal controls over non-salary expenditure are generally effective, although there are various
instances recorded in both Internal Audit and Auditor-General reports of failures to adhere to the
requirements – despite the fact that these may be adequately documented – with a consequent
impact on the quality of financial data. The Chief Audit Executive prepares comprehensive three-year
audit plans (that cover a wide range of issues: compliance testing, IT-based systems audit, payroll
and procurement audits) for approval by the Audit Committee and the Accounting Officer: overall,
more than half of staff time is spent on ensuring that systems are functional. Quarterly reports are
distributed to the Audit Committee, the Accounting Officer, the CFO and the Auditor-General:
however, it should be noted that the Auditor-General does not rely on work of internal audit.
Accounting, recording and reporting
Reconciliation of all CoT bank accounts takes place each day. Suspense accounts are cleared
regularly and cash advances to staff for official duties are acquitted routinely and in a timely manner.
The Chart of Accounts (while not complying with GFS) does provide adequate financial information on
5
resources received by front line service delivery units. In-year budget execution reports (‘Section 71’)
are produced and published in a timely manner, as are the annual financial statements: these are
submitted to the Auditor-General for audit within the prescribed timescales: however, the Auditor-
General’s audit reports note some decline in the quality of financial information over the fiscal years
reviewed.
External scrutiny and audit
The Council has more than three months to review all budget related documents submitted by the
executive, and does so in accordance with the rules (standing orders) governing Council procedure.
These procedures apply equally during the main budget process from March to June, as well as the
adjustment budget in December/January; the rules are well respected by both the executive and the
Council.
The Auditor-General has complete administrative and financial independence, and audits – which are
conducted in accordance with INTOSAI standards – cover financial, systems and performance audits.
Audited reports are submitted on time to the Council for scrutiny, although management response to
audit reports is not yet timely and systematic.
Assessment of the impact of PFM weaknesses
1 Aggregate fiscal discipline
Overall, fiscal discipline is good, with relatively minor concerns around outturn variances. However,
despite the regulatory requirement that the Council does not approve a deficit budget, there appears
to be a trend of negative balances. The significant level of (customer) arrears is managed prudently
in that appropriate provisions have been made, and projections of realizable revenue are reasonably
accurate. The Council has adequate opportunity to scrutinize budget proposals, which are presented
in considerable detail, although this detail may make it difficult to identify the key points for strategic
review in terms of aggregate financial discipline.
Budget execution is well supported by PFM systems, in particular the SAP electronic environment: in-
year reporting on budget execution is timely and data integrity and completeness are both
reasonable.
2 Strategic allocation of resources
In theory, the strategic allocation of resources in CoT is guided by the ‘Twelve Outcomes’ defined by
the National Planning Commission: however, the shifts observed in spending patterns over the last
three years do not appear to fully reflect these priorities. On the other hand, over this period, in-year
re-allocations have been relatively minor (except for the common problem of spending on capital
projects, which has been uneven), suggesting that the budget is actually executed in line with stated
policies.
3 Efficient service delivery
CoT's overall budget planning, accounting and reporting systems work reasonably well, and in
particular good quality management information on how resources have been used for service
delivery is available in a timely manner: this should reduce the possibilities of leakages – provided
the information is actually used by line managers.

6
Overall, internal control systems are sound, but weaknesses remain, as evidenced in audit reports.
The ratings for procurement and the payroll system are poor: improvements in these areas could
contribute to more efficient service delivery. A further impetus to improvement would be for the
Council to respond more rapidly to the issues raised in the reports of the Auditor-General.

7
Table 1: City of Tshwane: Summary of PEFA assessment scores, 2015
Performance Indicator Scoring Method
Dimension Ratings Overall Rating i. ii. iii. iv.
Credibility of the budget
HLG-1 Predictability of transfer from Higher Level of Government
M1 A B A B+
PI-1 Aggregate expenditure out-turn compared to original approved budget
M1 A A
PI-2 Composition of expenditure out-turn compared to original approved budget
M1 B A B+
PI-3 Aggregate revenue out-turn compared to original approved budget
M1 B B
PI-4 Stock and monitoring of expenditure payment arrears M1 D D D
Comprehensiveness and Transparency
PI-5 Classification of the budget M1 D D
PI-6 Comprehensiveness of information included in budget documentation
M1 A A
PI-7 Extent of unreported government operations M1 B NA B
PI-8 Transparency of inter-governmental fiscal relations M2 NA NA NA NA
PI-9 Oversight of aggregate fiscal risk from other public sector entities
M1 B NA B
PI-10 Public access to key fiscal information M1 A A
Policy-Based Budgeting
PI-11 Orderliness and participation in the annual budget process
M2 A A A A
PI-12 Multi-year perspective in fiscal planning, expenditure policy and budgeting
M2 A A C C B
Predictability and Control in Budget Execution
PI-13 Transparency of taxpayer obligations and liabilities M2 A C C B
PI-14 Effectiveness of measures for taxpayer registration and tax assessment
M2 C C D D+
PI-15 Effectiveness in collection of tax payments M1 NR A C NR
PI-16 Predictability in the availability of funds for commitment of expenditures
M1 A C B C+
PI-17 Recording and management of cash balances, debt and guarantees
M2 A A B A
PI-18 Effectiveness of payroll controls M1 D D C A D+
PI-19 Competition, value for money and controls in procurement
M2 B D C D D+
PI-20 Effectiveness of internal controls for non-salary expenditure
M1 C B C C+
PI-21 Effectiveness of internal audit M1 B A C C+
Accounting, recording and reporting
PI-22 Timeliness and regularity of accounts reconciliation M2 A A A
PI-23 Availability of information on resources received by service delivery units
M1 A A
PI-24 Quality and timeliness of in-year budget reports M1 C A C C+
PI-25 Quality and timeliness of annual financial statements M1 A A A A
External Scrutiny and Audit
PI-26 Scope, nature and follow-up of external audit M1 A A C C+
PI-27 Legislative scrutiny of the annual budget law M1 A A A A A
PI-28 Legislative scrutiny of external audit reports M1 A C B C+
8
1. Introduction
Objective of the PFM-PR
This assessment of the City of Tshwane Metropolitan Municipality (CoT) using the PEFA Performance
Measurement Framework is one element of a project to provide an understanding of the operation of
the PFM systems operating in three metropolitan municipalities (CoT, City of Johannesburg and
Ekurhuleni). The project has been designed to allow a better understanding of strengths and
weaknesses of PFM systems at the local level, and to help identify areas where the PFM framework
could be strengthened. It will also improve the understanding of government officials at both, central
and local level of the need for a well-functioning PFM system at the local level.
The global objectives of the project as stated in the Terms of Reference are to:
“compile a comprehensive ‘Public Financial Management – Performance Report’ according to the
2011 PEFA methodology and the 2013 Supplementary Guidelines for the application of the PEFA
Framework to Sub-National Governments, so as to provide an analysis of the overall performance
of the PFM systems in three metropolitan municipalities;
compile a systemisation report identifying structural PFM weaknesses at subnational level and
their implications at national level;
evaluate to what extent the institutional mechanisms set up by the partner country (national,
provincial and local) contribute to planning and the implementation of the reforms of the public
financial management”.
The specific objective of this report is to compile an objective assessment providing an overall
evaluation of the performance of the public financial management of the City of Tshwane Metropolitan
Municipality using the PEFA Framework: the subject of this report.
Background
The Swiss State Secretariat for Economic Affairs (SECO), in partnership with the South African Cities
Network (SACN), proposes to implement a program to support the strengthening of PFM capacities at
subnational level in South Africa. Cumulatively, South Africa’s nine largest cities account for 60% of
national economic production and over 40% of the total population. Thus the manner in which urban
areas are managed is of major importance to the national economy. The PEFA assessments will
serve as an entry point by identifying the main PFM problems in three metropolitan municipalities. In
a second phase, PFM reform plans will be elaborated and implemented, guided by the PEFA results.
The findings from the individual municipal PEFA assessments will furthermore allow the identification
of structural PFM problems at subnational level and their implications at the national level. A
systematization report highlighting these findings will provide advice to the national and local

9
governments on areas for action to improve PFM at subnational level for consideration in a revised
medium-term action plan.
SACN was responsible for the overall coordination of the assessment, and assisted the assessment
team in communicating and coordinating with the municipal governments. This included the
establishment of an Oversight Team (OT) (or Project Steering Committee) to oversee the assessment
and enable the exchange of experiences. SACN will comment on the draft and final PEFA reports.
The OT was established to govern the whole assessment process, and was also responsible for
gathering and sharing relevant reports and other PFM related data with the Assessment Team (AT) in
preparation for the field mission. The OT comprised officials from the three municipalities, the
National Treasury, and was jointly chaired by a representative of the lead agency (SECO) and SACN.
Terms of reference for the assessments were prepared by SECO in conjunction with the SACN, and
were circulated to the three Metropolitan Municipalities, following a presentation made to officials about
the PEFA methodology in July 2014. Each Municipality secured a Council resolution agreeing to
participate in the exercise. An exit workshop to present the draft reports to a wider group of
stakeholders involved in this assessment was held in September. Copies were also sent to the PEFA
Secretariat for quality review.
Methodology and approach
The assessment was carried out between February and April 2015 by a team of consultants engaged
by SECO1. The PEFA Framework, revised in January 2011, was utilized, together with the
“Guidelines for the application of the Framework to Sub-National Governments” issued by the PEFA
Secretariat at the end of 2012. The Framework involves the use of a series of indicators which are
based on “generally accepted good practices” to assess the strength of the PFM system in operation.
An effective PFM system should achieve:
aggregate fiscal discipline: i.e. effective control of the budget totals and management of fiscal
risks;
strategic allocation of resources: i.e. planning and executing the budget in line with stated
priorities to achieve declared objectives; and
efficient service delivery: i.e. managing the use of budgeted resources to achieve value for
money.
The assessment process required the:
review of legal and regulatory documentation, budget documentation and financial and audit
reports (see ANNEX A for documents consulted);
assessment of PFM practice procedures and systems in Municipal governments (see ANNEX B
for officials consulted);
quantitative analysis of official financial and budgetary data; and,
the application of professional judgment.
1 The AT comprised Philip Sinnett, Jorge Shepherd and Gerhard Stoop, under contract to ACE International
Consultants.
10
An important consideration in the assessment is an appreciation of the quality, comprehensiveness
and accuracy of data that is used to determine the budget credibility indicators. The reliability of the
PEFA indicators can only be as good as the accuracy of the financial data upon which they were
assessed.
A one-day capacity building workshop was organised by the Assessment Team on 4 February for
officials (also listed in ANNEX B) from the selected municipalities before the field mission/data
collection phase. The main purpose of the workshop was to enable the officials to fully understand
the methodology, indicators and requirements of the PEFA assessment, as well as the method of
determining ratings and performance. It included exercises for participants to help them understand
the application of the PEFA methodology (using training material provided by the PEFA Secretariat).
The workshop also allowed the assessment team to obtain information and knowledge regarding the
functioning of financial management arrangements in the municipalities, and to clarify the
requirements in terms of stakeholders to be interviewed and information to be obtained. The AT used
the workshop to come to an understanding with the municipalities on how they have to prepare for the
field missions; in particular to understand the data required before the field missions – a template with
these details was prepared and circulated.
A final dissemination workshop was organised by SACN on 3rd
September 2015 in Johannesburg,
attended by more than 40 participants.
Quality Assurance
A robust quality assurance has been put in place through the PEFA Secretariat ‘PEFA CHECK’
mechanism. The criteria for the PEFA Secretariat to award the PEFA CHECK endorsement are as
follows:
1. A quality review of the Concept Note is obtained from the PEFA Secretariat and at least three
other PFM institutions/experts before the assessment work starts, and, if necessary, the Concept
Note is revised and forwarded to the reviewers.
2. The draft assessment report is submitted to all reviewers for their comments, following which the
draft report is revised and forwarded to the reviewers with a table showing the assessment team’s
responses to all comments.
3. The management and quality assurance arrangements are described in the report, including the
names and positions of the Oversight Team, the Assessment Manager, the Assessment Team,
and reviewers (invited and actual), and dates of the draft and final Concept Notes, and of the
reviewed draft report.
In addition to the PEFA Secretariat, the EU, SECO, SACN, and the Municipality reviewed the draft
report.
11
2. Background information on City of Tshwane
2.1 Economic Context
South Africa has a unitary, but decentralised system of government, comprising national, provincial
and local spheres of government. The Constitution provides that the three spheres are “distinctive,
interdependent and interrelated”.2
There are nine3 provinces in South Africa, divided into 278 of municipalities that make up the local
sphere of government. Municipalities fall into one of three categories: Metropolitan; District; or Local
Councils. In the Province of Gauteng, there are three Metropolitan Municipalities: Ekurhuleni,
Johannesburg and Tshwane, which is the subject of this assessment.
The City of Tshwane Metropolitan Municipality (CoT) was established on 5 December 2000 through
the integration of various municipalities and councils that had previously served greater Pretoria and
the surrounding areas (Pretoria, Centurion, Akasia, Soshanguve, Mabopane, Atteridgeville, Ga-
Rankuwa, Winterveld, Hammanskraal, Tembisa, Pienaarsrivier, Crocodile River and Mamelodi). It is
one of South Africa’s eight metropolitan municipalities, and is situated in the north of Gauteng
Province. CoT includes the administrative capital of South Africa, Pretoria, covers an area of 6,368
square kilometres (approximately one third of the Province), and has a population of 2.5-million. CoT
has a mayoral executive system combined with a ward participatory system. It has 105 wards and
210 councillors, and is divided into seven regions.
Government plays an important role in CoT's economy, but there are many other sectors that
contribute to the local economy. Among those is the Research and Development Sector, which
comprises an estimated 90% of all research and development in South Africa and includes
companies such as Armscor, the Medical Research Council, the Council for Scientific and Industrial
Research, the Human Sciences Research Council and educational institutions such as the University
of South Africa and Tshwane University of Technology. CoT is also recognised in the fields of
manufacturing, technology, electronics and defence design and construction. The presence of
motoring giants Nissan, BMW, Ford and Tata in the nearby industrial areas has led to Tshwane
becoming known as the motor capital of South Africa. CoT’s main economic sectors include services
(64%), commerce (13%), industry (21%) and others (2%).
The CoT’s economic and development goals are aligned to a five-year Growth and Development
Strategy, which has five objectives:
To provide access to quality basic services and infrastructure throughout the city;
Accelerate shared and higher local economic growth and development;
Fight poverty and ensure clean, healthy, safe, secure and sustainable communities;
Foster participatory democracy and apply the Batho Pele principles through a caring, accessible
and accountable service; and
Ensure good governance and financial viability, building institutional capacity and optimising
transformation in order to execute the Municipality's constitutional mandate.
2 See Constitution of the Republic of South Africa (1996), Chapter 3. 3 The provinces are: Eastern Cape, Free State, Gauteng, KwaZulu Natal, Limpopo, Mpumalanga, Northern Cape, North West and Western Cape.

12
2.2 Development and Reforms
a) The social and economic situation
The total population of the CoT was 2.9 million, according to the 2011 Census data. Tshwane’s
population has historically been comprised of slightly more women than men, with large
concentrations of residents between the ages of 20 and 29. Between 1996 and 2011, the population
has grown by 1,151,158 people (65.02%). The Municipality makes the second largest contribution to
provincial GDP at 27%, with the tertiary sector’s government, social & personal services and finance
and business services in the forefront.4
Many national government departments, foreign embassies and tertiary educational institutions are
housed in CoT. The municipality is also known as a manufacturer and assembler of passenger
vehicles that are mainly produced in the Rosslyn and Pretoria East areas. According to the
Automotive Industry Development Centre, the municipality produces 40% of South Africa’s
automotive output. CoT exports more than it imports and also has a growing tourism sector that
contributes to job creation and investment. This section provides an overview of the socio-economic
outlook of the CoT’s demographic profile, access to services and development indicators.
The unemployment rate increased from 28.7% in 1996 to 37% in 2001 in the CoT, it then decreased
to 26.3% in 2011. Economic growth, as recorded in the 2011 census, was almost 70% higher than
the national average.5
Unemployment in the region is below the national and provincial average, but remains high at 24.2%,
although this figure is an improvement on the 2001 unemployment rate of 31.6%. Similarly, the youth
unemployment rate was reduced from 40.5% in 2001 to 32.6% in 2011. Nevertheless, this indicates
that a large percentage of residents are unemployed.
For those that are employed, the average household income is R182,822 per annum.6 The
dependency ratio is 39% meaning that each person working has on average to support four others.
Despite high economic growth, the poverty rate is 27.9% and the majority of poor people live in
previously disadvantaged areas. This can be attributed to the lack of social and economic
opportunities in these areas. 18% of all residents live in an informal dwelling, which equates to an
estimated 104,000 households, and the number continues to grow as migration into the city in search
of employment continues.
b) Fiscal policy and fiscal development
Over the medium term, CoT’s fiscal position has deteriorated, due to a rapid growth in operating
spending thus resulting in the overall balance changing from a surplus in FY 2011/12 to rising deficits
in FY 2012/13 and FY 2013/14 (Table 2.1). In general, spending has surpassed revenue mobilization
efforts and government grants and subsidies combined – spending has grown in nominal terms by
29% between FY 2011/12 and FY 2013/14, whereas total revenue grew by 19% (own revenues grew
by 14% and government grants and subsidies grew by 40%).
4 Parliament of the Republic of South Africa, 2013, “City of Tshwane General and Regional Overview”,
5 City of Tshwane (2013), Draft 2013/14 IDP Review 28 March 2013, p. 12.
6 Statistics South Africa (2011), Census 2011 Municipal Report Gauteng, p. 25.

13
The economic development agenda will continue to be triggered by the realization of a capital
investment programme in support of the electricity and other strategic services sectors. The CoT is
committed to implement several key infrastructure projects in order to boost economic activity with a
view to becoming less reliant on government grants and subventions. The CoT thus faces the task of
spending more efficiently and restraining the growth of consumptive expenditure whilst gradually
exercising stricter controls to reduce shortages in revenue.
Table 2.1: Summary of Fiscal Operations, FY 2011/12 to FY 2013/2014 (millions of Rands)
2011/12 2012/13 2013/14 % change
Total revenue and grants Own revenue
7
Of which: Property tax Electricity sales Water sales
Transfers recognised-operational Government grants and subsidies
22,012 16,129
3,391 7,724 1,955 2,336 3,547
24,319 16,851
3,999 8,131 2,285 2,724 4,744
26,244 18,406
4,432 8,314 2,431 2,861 4,976
19.2% 14.1%
30.7% 10.5% 24.3% 22.5% 40.3%
Total expenditure Operating expenditure
Of which: Wages and salaries Bulk purchases Other materials Contracted services Financial costs
8
Debt impairment Other operating costs
Capital expenditure
21,234 18,118
4,815 6,172
529 2,921
633 904 856
3,116
24,672 20,122
5,305 6,695
442 3,335
740 952
1,154 4,551
27,354 23,440
6,086 7,029
312 3,695
814 1,400 2,385 3,914
28.8% 29.4%
26.4% 13.9%
-41.0% 26.5% 28.6% 54.9%
178.7% 25.6%
Overall Group balance (Including grants and special programs)
778 (353) (1,111)
Overall Group balance (Excluding grants and special programs)
(2,770) (5,097) (6,087)
Sources: Consolidated AFS – Audited for FY 2011/12 and FY 2012/13; and unaudited for FY
2013/14.
c) Allocation of resources
Table 2.2 shows how the economic composition of expenditure changed rapidly in the medium term.
The share of bulk purchases, contracted services and other materials combined fell to 28% of the
total in FY 2013/14, from 32% in FY 2011/12. Conversely, other operating expenses grew markedly
at the expense of new investments in plant and equipment – debt impairment and other operating
expenses combined rose to 14% of total in FY 2013/14, from 8% in FY 2011/12. Employee-related
costs and capital expenditure remained unchanged in 23% and 14%, respectively: subsidies rose to
7 Own revenue and transfers recognized combined equal the “Revenue by Source” utilized for this analysis in
every financial year, which exclude “Capital transfers and contributions”. The analysis observed a discrepancy in the operating revenue due to the basis used by the Group Chief Financial Officer in the Annual Financial Statements to explain the overall operating results, namely, the “Revenue by Vote” (which equals additional revenues in about 12% not identified by the PEFA assessors). 8 Data include debt repayment and interest obligations.

14
17.9%, from 13.3%. Transfers and subventions to municipal entities rose tenfold, to 1% in FY
2013/14, from 0.1% in FY 2011/12.
Table 2.2: Allocation of budgetary resources, by economic category, FY 2011/12 to FY
2013/2014
(In % of total)
Category/type 2011/12 2012/13 2013/14
Total expenditure Operating expenditure
Of which: Wages and salaries Bulk purchases Other materials Contracted services Financial costs Debt impairment Other operating costs
Capital expenditure
100.0 85.3
22.7 29.1 2.5
13.8 3.0 4.3 4.0
14.7
100.0 81.6
21.5 27.1 1.8
13.5 3.0 3.9 4.7
18.4
100.0 85.7
22.2 25.7 1.1
13.5 3.0 5.1 8.7
14.3
Source: On the basis of Table 2.1.
Analysis of the functional composition of CoT expenditure (Table 2.3) shows that the budget is
concentrated mainly on Trading Services (51%), Governance and Administration (18%), and
Community and Public Safety (17%). Spending within Economic and Environmental Services,
including road transportation, amounts to the equivalent of 13% of the total. Major shifts in
expenditure took place within the largest spending sectors; noticeably, Governance and
Administration gained four additional points in the budget over the last three financial years, at the
expense of electricity and housing services. Shifts in spending priorities were also observed within
the utilities departments – total spending on electricity fell to 34% in FY 2013/14, from 37% in FY
2011/12, an amount which was used to increase the level of operating and capital expenditure within
the waste management and sanitation sector by three percentage points of the budget. Furthermore,
the share of road transportation in the budget rose modestly from 10% to only 11% over the period
under review.
Table 2.3: Allocation of budgetary resources, by function, FY 2011/12 to FY 2013/14
(In % of total)
Function/Sub-function 2011/12 2012/13 2013/14
Governance and Administration Of which: Corporate services
14.3
11.8
15.4
12.2
18.2
12.4
Community and Public Safety Of which: Public safety Housing Sports and recreation
18.6
6.0 5.3 3.6
18.7
6.1 4.7 4.4
17.1
6.8 3.5 3.3
Economic and Environmental Services Of which: Road transportation
11.2
9.6
13.3
11.6
13.3
10.8
Trading Services Of which: Electricity
55.0
37.0
51.8
34.3
50.6
34.2

15
Function/Sub-function 2011/12 2012/13 2013/14
Water Sanitation
9.3 8.7
8.8 8.6
5.1 11.4
Other 1.0 0.9 0.7
Total 100.0 100.0 100.0
Sources: Consolidated AFS – Audited for FY 2011/12 and FY 2012/13; and unaudited for FY
2013/14.
In aggregate, the division of the budget between operating and capital expenditure remained
unchanged over the last three financial years (Table 2.4), although the distribution across sectors has
shifted. Analysis of the economic and functional composition of CoT’s budget shows that increases in
the budget are largely attributed to employee-related costs and operating expenses rather than bulk
purchases and contracted services, particularly within the electricity sector – evidence shows that the
share of electricity-related operating expenses (in % of the total electricity) rose to 96% in FY
2013/14, from 93% in FY 2011/12, resulting in limited fiscal space for investment in new plant and
equipment. A salient feature in the capital budget is the increase in road transportation – this sector
receiving the highest priority in the capital budget over the last three years. Conversely, the sector
receiving the least in the capital equipment budget is public safety, representing only 1% of the total
capital budget – far surpassed by investments in corporate services and sports and recreation (Tables
2.4 and 2.5).
Table 2.4: Allocation of budgetary resources, vertically by function and economic category,
FY 2011/12 to FY 2013/14 (In % of total)
Function/Sub-function
2011/12 2012/13 2013/14
Op. Cap. Total Op. Cap. Total Op. Cap. Total
Governance and Administration Of which: Corporate services
15.3
12.7
8.3
6.6
14.3
11.8
16.9
13.9
8.8
4.3
15.4
12.2
19.6
13.7
10.0
5.0
18.2
12.4
Community and Public Safety Of which: Public safety Housing Sports and recreation
17.4
6.8 2.7 3.9
25.8
1.7 20.0 1.4
18.6
6.0 5.3 3.6
17.6
7.2 2.9 3.6
23.4
1.5 12.4 7.5
18.7
6.1 4.7 4.4
16.9
7.7 2.2 3.0
18.4
1.3 11.5 4.8
17.1
6.8 3.5 3.3
Economic and Environmental Services Of which: Road transportation
9.3
7.4
22.2
22.0
11.2
9.6
9.1
7.2
31.6
31.1
13.3
11.6
9.2
6.3
37.3
37.2
13.3
10.8
Trading Services Of which: Electricity Water Sanitation
57.1
40.1 9.9 7.1
42.6
18.6 5.7
18.3
55.0
37.0 9.3 8.7
55.4
38.6 9.8 7.1
35.4
15.5 4.5
15.4
51.8
34.3 8.8 8.6
53.5
38.4 2.6
12.5
33.9
9.7 19.5 4.7
50.6
34.2 5.1
11.4
Other 1.0 1.0 1.0 0.9 0.8 0.9 0.8 0.4 0.7
Total 100.0 100.0 100.0 100.0 100.0 100.0 100.0 100.0 100.0
Sources: Consolidated AFS – Audited for FY 2011/12 and FY 2012/13; and unaudited for FY
2013/14.

16
Table 2.5: Allocation of budgetary resources, horizontally by function and economic category, FY 2011/12 to FY 2013/14 (In % of total)
Function/Sub-function
2011/12 2012/13 2013/14
Op. Cap. Total Op. Cap. Total Op. Cap. Total
Governance and Administration Of which: Corporate services
91.4
91.7
8.6
8.3
100.0
100.0
89.5
93.4
10.5
6.6
100.0
100.0
92.0
94.2
8.0
5.8
100.0
100.0
Community and Public Safety Of which: Public safety Housing Sports and recreation
79.7
95.9 44.3 94.1
20.3
4.1 55.7 5.9
100.0
100.0 100.0 100.0
76.9
95.6 50.8 68.1
23.1
4.4 49.2 31.9
100.0
100.0 100.0 100.0
84.3
97.1 52.5 78.8
15.7
2.9 47.5 21.3
100.0
100.0 100.0 100.0
Economic and environmental services Of which: Road transportation
70.8
66.3
29.2
33.7
100.0
100.0
56.1
50.7
43.9
49.3
100.0
100.0
59.1
49.7
40.9
50.3
100.0
100.0
Trading services Of which: Electricity Water Sanitation
88.6
92.6 90.9 69.2
11.4
7.4 9.1
30.8
100.0
100.0 100.0 100.0
87.4
91.7 90.6 67.0
12.6
8.3 9.4
33.0
100.0
100.0 100.0 100.0
90.2
95.8 43.7 93.9
9.8
4.2 56.3 6.1
100.0
100.0 100.0 100.0
Other 84.5 15.5 100.0 83.6 16.4 100.0 92.6 7.4 100.0
Total 85.3 14.7 100.0 81.5 18.5 100.0 85.4 14.6 100.0
Sources: Consolidated AFS – Audited for FY 2011/12 and FY 2012/13; and unaudited for FY
2013/14.
Overall, based on the budgetary outcomes above, the allocation of budgetary resources does not
appear to respond to the medium-term policy objectives and spending priorities set out in CoT’s
Integrated Development Plan.
2.3 Description of the legal and institutional framework for PFM
a) Existing legislation and regulations
The municipal system forming the local sphere of government in South Africa has been restructured
since the end of apartheid and the first free general election in 1994. Since then, legislation changing
the provisions for determining boundaries, functions and powers, and other municipal governance
issues has been passed, and this comprehensive reform of local government has drastically reduced
the total number of local authorities from 843 to 278 (and consequently, the number of elected
members).
The Constitution 1996
The Constitution inter alia defines the roles and responsibilities of each role player in the management
of public finances; National government, Provincial governments and Municipal authorities. It
provides that the local sphere of government is comprised of municipalities, and that they have the
right to manage the matters defined as being within their competence for their communities (subject to
national and provincial legislation). The Constitution requires the three spheres to engage in
cooperative governance, but also provides – with strict limitations – for provincial intervention in the
functions of municipalities. Core PFM issues are set out in Chapter 13 (Finance), Section 229
(Municipal Fiscal Powers and Functions)9, while the foundations for fiscal policies and processes such
9 For further reference, go to http://www.acts.co.za/constitution-of-the-republic-of-south-africa-act-1996/
17
as taxation, the consolidated fund, contingencies, remunerations, public debt, accounts and financial
reporting, and external audit at the local level are also addressed.
Public Finance Management Act 1999
The PFMA (and its amendment) govern public financial management in South Africa, and outline the
duties of national, provincial and municipal government in relation to the level of service provision
required by each sphere of government. Financial reporting is a crucial part of effective PFM, and the
Act makes provision for different types of reporting at specific intervals by national, provincial and
municipal governments.
Municipal Finance Management Act (MFMA) 2003
The MFMA in many respects applies the provisions contained in the PFMA to the local sphere of
government. The Act establishes a basis for improved financial management – essential to improve
service delivery and sustain municipal services into the future – based on these underlying principles:
promoting sound financial governance by clarifying roles,
a more strategic approach to budgeting and financial management,
modernization of financial management,
promoting co-operative government, and
promoting sustainability.
Chapter 2 of the MFMA segregates the general supervisory functions over local government financial
management between the National and Provincial Treasuries. It also lays out the structure and
defines the management and oversight processes for the Municipal Budget. Chapter 3 sets out the
processes governing cash management and custody of revenues, as well as other aspects of
investment and asset management. Chapter 4 specifies provisions for the appropriation of funds and
grants for operating and capital expenditure, and establishes the process to prepare and publish the
annual and multi-annual budget, including consultation and approval within the executive and Council,
consultation on tabled budgets with civil society, and other matters including the municipal adjustment
budget, shifting of funds between multi-year appropriations, unauthorized, irregular or fruitless and
wasteful expenditure, among others. Chapter 6 covers debt management, including the conditions
applying to short- and long-term debt, disclosure, municipal guarantees, and national and provincial
guarantees. Chapters 8 and 9 define the various functions in financial management, including budget
preparation and implementation, as well as the roles and responsibilities of the accounting officer, and
the municipal budget and treasury offices. Chapter 10 deals with similar issues for municipal entities.
Further Chapters in the MFMA deal with Supply Chain Management, General Reporting
Requirements, and Financial Misconduct. The internal audit function is established in Chapter 14,
Sections 165 and 166. The duties and responsibilities related to internal audit fall under Accounting
Officers, according to Section 62 (General financial management functions within line departments)
and Section 95 (Municipal entities).
Division of Revenue Act (DORA) and Intergovernmental Fiscal Relations Act
Each year, Parliament is requested to enact a DORA in order to divide revenue from the national
fiscus between the three spheres of government (including the provision of national allocations for
each municipality for the next three years). The Intergovernmental Fiscal Relations Act provides the
level of stakeholder consultation required prior to passing the DORA, via a National Budget forum
chaired by the Minister of Finance, with representation from Provincial and Local Government,
provincial members of the executive councils (MECs) for finance and the South African Local
Government Association (SALGA).

18
Procurement Law and Regulations
The Preferential Procurement Policy Framework Act 2001 is the main procurement legislation. In
addition, the Treasury Regulations and the Revised Preferential Procurement Regulations of June
2011 provide the legal and regulatory regime for government procurement, as well as the Broad
Based Black Economic Empowerment Act (BBBEEA 2003), Supply Chain Management Regulations
and Circulars. The PPPFA empowers the Accounting Officer to be the sole authority for authorizing
procurement.
Public Audit Act 25 of 2004
The Public Audit Act 2004 establishes the office of the Auditor General and provides for the
independence of the Auditor General and his/her staff and empowers him/her or his authorised
representative to perform financial, systems, IT and performance audit of all government
departments, agencies and public entities and report the findings to the National Assembly.
Other relevant financial legislation includes:
The Municipal Systems (Amendment) Act (No. 44 of 2003), provides for the assignment of
functions or powers to municipalities, the submission of annual performance reports by
municipalities, for the establishment of municipal entities, and other connected matters;
The Municipal Property Rates Act (No. 6 of 2004) contains provisions dealing with the adoption
and contents of a rates policy, rate and tariff increases;
The Electricity Regulation (Amendment) Act (No. 4 of 2006) contains provisions relating to
electricity regulations, including aspects relating to licensing, and the sale and supply of electricity
within municipalities and tariffs; and
The Water Services (Amendment) Act (No. 30 of 2004) contains provisions relating to norms or
standards, and the development of plans and tariff mechanisms.
The Local Government Municipal Structures (Amendment) Act (No. 1 of 2003) establishes the
administrative and functional structure of municipalities and the sharing of financial and other
responsibilities amongst key municipal officials and units. It also provides that metropolitan
municipalities (category A municipalities), which have exclusive executive and legislative authority
in their area, can only be established in metropolitan areas. At the moment there are eight
metropolitan municipalities.10
The Act provides that areas that are not eligible for metropolitan
municipality status must have district municipalities (category C municipalities) and local
municipalities (category B municipalities) within their area11
. Therefore non-metropolitan areas
consist of district municipalities, which contain several local municipalities within their area. At the
moment there are 44 district and 226 local municipalities in South Africa.
The Municipal and Budget Reporting Regulations (MBRR) (2009) provide for sound and
sustainable management of the budgeting and reporting practices of municipalities and municipal
entities by establishing uniform norms and standards and other requirements for ensuring proper
accountability and transparency of municipal operations and shared lines of responsibility of those
institutions, as required by the MFMA legislation.
According to National Treasury reports, the impact of these legal and regulatory reforms has been
improvements in budgeting practices and accounting and reporting systems. Budgets are no longer
incremental, the budgeting and planning processes appear to be linked through the Integrated
10 The eight metros are: Buffalo City (East London), City of Cape Town, Ekurhuleni Metropolitan Municipality (East Rand), City of eThekwini (Durban), City of Johannesburg, Mangaung Municipality (Bloemfontein), Nelson Mandela Metropolitan Municipality (Port Elizabeth), City of Tshwane (Pretoria). 11 Local Government Municipal Structures Act (2003), Section 3.

19
Development Plan (IDP), budgets are no longer presented with considerable detail – thus allowing for
better understanding and control – revenue and capital estimates are more realistic in aggregate, and
financial reporting has resulted in more accurate and timely representation of the local public finances
thus allowing for more effective external audit.
b) Institutional framework
Executive
The Executive is headed by the President (elected on a 5-year term) and comprises 38
National departments, 9 constitutional bodies, 9 provinces and 278 local authorities. Each
province is headed by an elected Premier, and each municipality by an elected Mayor. The
Municipal Mayor, assisted by the Mayoral Committee, is the executive branch of CoT, and has
an overarching strategic and political responsibility. Each member of the Mayoral Committee
chairs a portfolio committee, consisting of councillors from all the various political parties
elected into the Metropolitan Council.
Legislature The Council is the legislative arm of CoT, and comprises 210 elected councillors. It is
empowered to approve municipal by-laws, the CoT Budget and the Integrated Development
Plan. It also has executive powers to deal with matters that have not been delegated to the
Executive Mayor. A Chairperson (the Council Speaker) is elected by and from the councillors.
Judiciary
The Constitution establishes the judiciary and guarantees its independence. It comprises a
Constitutional Court, a Supreme Court of Appeals, High Courts and Magistrate Courts.
Auditor-General
The office of the Auditor-General is the Supreme Audit Institution of the Republic, established
by Article 188 of the Constitution. The Public Audit Act provides specific powers and duties that
the Auditor-General (who is appointed by the President, subject to Parliamentary approval)
must perform, including auditing all state organs and public entities, at least annually. This
includes the primary responsibility for auditing the annual financial statements of municipalities
and their entities, and submitting an audit report to the accounting officer of the municipality or
entity within three months of receipt of those statements (MFMA, Section 121).
Audit Committees
The MFMA and Treasury Regulations establish and detail the responsibilities of audit
committees. The legal and regulatory framework, require that the committee must consist of at
least three members, including an independent private citizen as chairperson. It is responsible
for overseeing the activities of Accounting Officers and ensuring the full implementation of all
(internal or external) audit recommendations.
The National Treasury
The National Treasury is the pivot of PFM in South Africa. It provides leadership in all matters
relating to public finance management, as enshrined in the PFMA and MFMA.
c) Key features of the PFM system
South Africa has two financial years; April 1 to March 31 for national and provincial governments, and
July 1 to June 30 for municipalities. Policy development is the responsibility of national government.

20
Service delivery is the responsibility of provincial government and municipalities. The national
government provides oversight for provinces, while each province supervises the activities of its
municipalities, which are subdivided in accordance with the Constitution into three categories:
Metropolitan, District and Local councils. There are currently 278 municipalities that make up the
local sphere of government in South Africa.
The Constitution assigns a number of functional areas to Municipal governments, and these are set
out in Annex C: municipalities can also be assigned other matters by national or provincial legislation,
by agreement with the municipal council. Within their areas of jurisdiction, and subject to national and
provincial legislation, municipalities exercise full legislative and executive power: they are also
guaranteed the necessary financial resources and capacity building support necessary to fulfil their
functions and powers.
In aggregate, the local sphere of government is largely self-financing, although there are differences
in the ability of the richer and poorer municipalities to generate their own revenues. The Constitution
provides that municipalities are entitled to resources commensurate with their responsibilities, but in
many service sectors this is not realized in practice, as poverty is pervasive, especially in the rural
areas.
In the course of local government restructuring, municipalities were given not just constitutional
protection, but also fiscal capability, which meant that they became responsible for raising the vast
majority of their own revenues: sources are taxes (property rates) and service charges, the most
significant of which are for electricity and water. This is still a challenge as capacities of different local
authorities vary considerably, and many municipalities struggle to raise sufficient revenue: amounts
raised locally vary, according to a survey conducted by CLGF in 2008, between 67% per cent in the
smaller authorities and 97% in the metropolitan authorities.12
In addition, municipalities receive allocations from the national fiscus, and payments are made directly
to the municipalities (not via provinces). One of the most important developments in
intergovernmental fiscal transfers to the municipalities in recent years has been the adoption of the
Municipal Infrastructure Grant (MIG), a conditional allocation, intended to provide capital finance for
basic municipal infrastructure for poor households, micro enterprises and social institutions funded
from municipal budgets.
The Constitution and other legislation provides that when municipalities are assigned new functions
and powers, the necessary financial resources and capacity building measures have to be provided to
enable them to exercise those functions and powers.
d) Structure of CoT
To perform the functions assigned to a Metropolitan Municipality, the CoT is structured into twenty-
four departments and three municipal entities. The departments appear as budget heads (votes):
1. Office of the City Manager
2. Office of the Executive Mayor
3. Office of the Chief Audit Executive
4. Office of the Speaker
12 For further reference see the Commonwealth Local Government Forum (CLGF) in South Africa or go to http://www .clgf.org.uk/userfiles/CLGF/File/2008_Country_Files/SOUTH_AFRICA.pdf .

21
5. Office of the Chief Whip
6. Office of Legal Services
7. Office of City Planning
8. Office of Macro Economic Planning
9. Office of City Strategies and Performance Management
10. Office of Corporate and Shared Services
11. Office of Information, Communications and Technology Management
12. Office of Communications, Marketing and Events
13. Office of Emergency Services
14. Office of Regional Service Delivery
15. Office of Research and Innovation
16. Department of Financial Services
17. Department of Environmental Management
18. Department of Health and Social Development
19. Department of Housing and Human Settlement
20. Department of Metro Police Services
21. Department of Electricity
22. Department of Water and Sanitation
23. Department of Roads and Transportation
24. Department of Sport and Recreation
Department of Financial Services
The Department of Financial Services (DFS) is responsible for managing the corporate financial
affairs of CoT. It provides strategic financial management services to municipal departments,
divisions and units; draws up the annual municipal budget, and reports regularly on the Municipality’s
financial position.
The DFS is led by the Chief Financial Officer and comprises the Treasury, Assets and Liabilities
Division, the Budget Office, the Revenue Management Unit, and Supply Chain Management, Division
each headed by an Executive Director.
Municipal Entities
The three municipal entities included in the CoT Consolidated Budget are the Housing Company
Tshwane, the Sandspruit Works Association, and the Tshwane Economic Development Agency. The
FY 2014/15 budget adopted by CoT amounted to R25,818 million, of which the Municipality
represented 97% and the municipal entities represented 3.2% (Table 2.6).
Table 2.6: Operations by CoT Municipal Entities, FY 2014/15
(In millions of Rands)
Name Rs. Million
1. Housing Company Tshwane 39
2. Sandspruit Works Association 491
3. Tshwane Economic Development Agency (TEDA) 291
Total 821
Total Expenditures 25,818
% of total budget 3.2%
Source: Budget Adopted for FY 2014/15.
22
3. Assessment of PFM systems, processes and institutions
HLG-1: Predictability of transfers from Higher Level of Government
As in many countries, transfers from another level of government (e.g. from the national fiscus) are an
important source of funds for municipalities in South Africa. Any shortfalls in the amounts expected
and received, or delays in the timing of receipts are likely to have severe consequences for service
delivery: hence this indicator addresses an important feature of the sub-national financial system.
(i) Annual deviation of actual total HLG transfers from the original total estimated amount provided
by HLG to the SN entity for inclusion in the latter’s budget
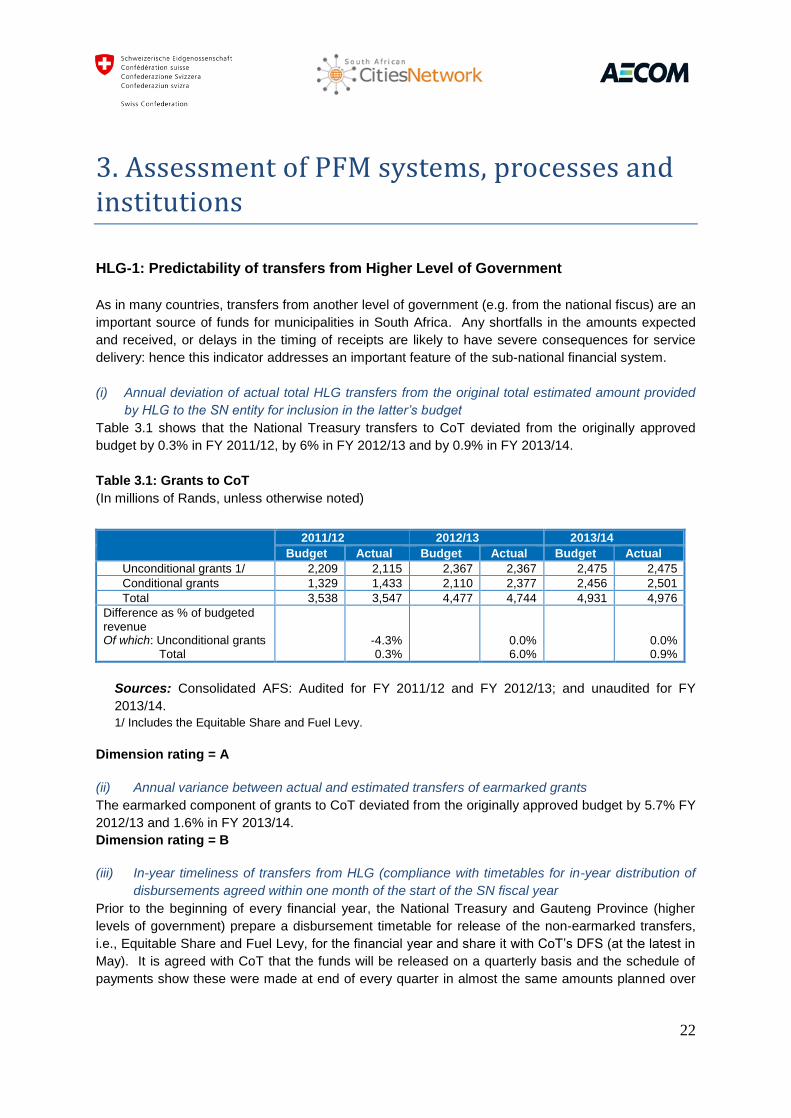
Table 3.1 shows that the National Treasury transfers to CoT deviated from the originally approved
budget by 0.3% in FY 2011/12, by 6% in FY 2012/13 and by 0.9% in FY 2013/14.
Table 3.1: Grants to CoT
(In millions of Rands, unless otherwise noted)
2011/12 2012/13 2013/14
Budget Actual Budget Actual Budget Actual
Unconditional grants 1/ 2,209 2,115 2,367 2,367 2,475 2,475
Conditional grants 1,329 1,433 2,110 2,377 2,456 2,501
Total 3,538 3,547 4,477 4,744 4,931 4,976
Difference as % of budgeted revenue Of which: Unconditional grants
Total -4.3% 0.3%
0.0% 6.0%
0.0% 0.9%
Sources: Consolidated AFS: Audited for FY 2011/12 and FY 2012/13; and unaudited for FY
2013/14.
1/ Includes the Equitable Share and Fuel Levy.
Dimension rating = A
(ii) Annual variance between actual and estimated transfers of earmarked grants
The earmarked component of grants to CoT deviated from the originally approved budget by 5.7% FY
2012/13 and 1.6% in FY 2013/14.
Dimension rating = B
(iii) In-year timeliness of transfers from HLG (compliance with timetables for in-year distribution of
disbursements agreed within one month of the start of the SN fiscal year
Prior to the beginning of every financial year, the National Treasury and Gauteng Province (higher
levels of government) prepare a disbursement timetable for release of the non-earmarked transfers,
i.e., Equitable Share and Fuel Levy, for the financial year and share it with CoT’s DFS (at the latest in
May). It is agreed with CoT that the funds will be released on a quarterly basis and the schedule of
payments show these were made at end of every quarter in almost the same amounts planned over
23
the past three years. In all, delays in a large portion of actual disbursements have not exceeded 25%
in more than one of the last three financial years.
Dimension rating = A
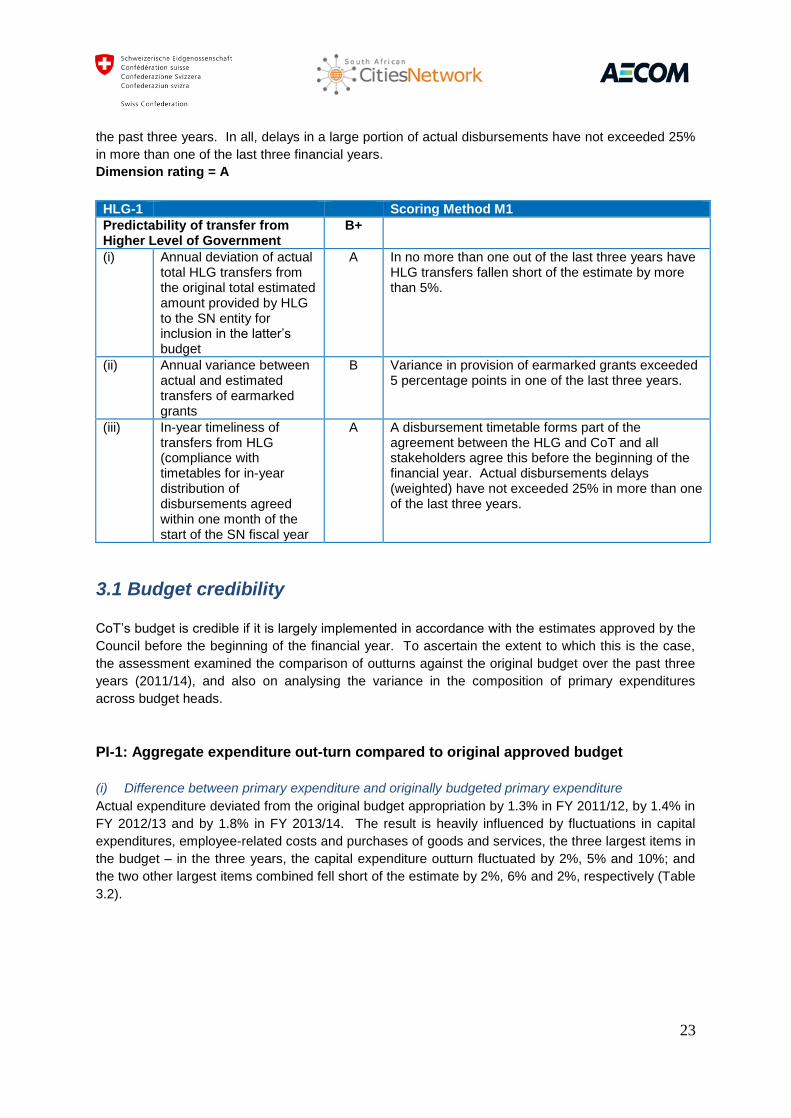
HLG-1 Scoring Method M1
Predictability of transfer from Higher Level of Government
B+
(i) Annual deviation of actual total HLG transfers from the original total estimated amount provided by HLG to the SN entity for inclusion in the latter’s budget
A In no more than one out of the last three years have HLG transfers fallen short of the estimate by more than 5%.
(ii) Annual variance between actual and estimated transfers of earmarked grants
B Variance in provision of earmarked grants exceeded 5 percentage points in one of the last three years.
(iii) In-year timeliness of transfers from HLG (compliance with timetables for in-year distribution of disbursements agreed within one month of the start of the SN fiscal year
A A disbursement timetable forms part of the agreement between the HLG and CoT and all stakeholders agree this before the beginning of the financial year. Actual disbursements delays (weighted) have not exceeded 25% in more than one of the last three years.
3.1 Budget credibility
CoT’s budget is credible if it is largely implemented in accordance with the estimates approved by the
Council before the beginning of the financial year. To ascertain the extent to which this is the case,
the assessment examined the comparison of outturns against the original budget over the past three
years (2011/14), and also on analysing the variance in the composition of primary expenditures
across budget heads.
PI-1: Aggregate expenditure out-turn compared to original approved budget
(i) Difference between primary expenditure and originally budgeted primary expenditure
Actual expenditure deviated from the original budget appropriation by 1.3% in FY 2011/12, by 1.4% in
FY 2012/13 and by 1.8% in FY 2013/14. The result is heavily influenced by fluctuations in capital
expenditures, employee-related costs and purchases of goods and services, the three largest items in
the budget – in the three years, the capital expenditure outturn fluctuated by 2%, 5% and 10%; and
the two other largest items combined fell short of the estimate by 2%, 6% and 2%, respectively (Table
3.2).

24
Table 3.2: Comparison of original budget and actual expenditure
(In millions of Rands, unless otherwise noted)13
2011/12 2012/13 2013/14
Budget Actual Budget Actual Budget Actual
Recurrent expenditure Of which: Employee-related costs
14
Purchases of goods and services15
17,142
4,905 9,433
17,485
4,815 9,622
19,908
5,613 11,125
19,381
5,305 10,473
21,137
6,133 11,259
22,025
6,086 11,035
Capital expenditure 3,185 3,116 4,353 4,551 4,345 3,914
Total primary expenditure 20,327 20,601 24,261 23,932 25,483 25,938
Difference as % of budgeted primary expenditure 1.3% -1.4% 1.8%
Sources: Consolidated AFS: Audited for FY 2011/12 and FY 2012/13; and unaudited for FY
2013/14.
PI-1 Scoring Method M1
Aggregate expenditure out-turn compared to original approved budget
A In none of the three financial years has the actual expenditure deviated from budgeted expenditure by an amount equivalent to more than 5% of budgeted expenditure.
PI-2: Composition of expenditure out-turn compared to original approved budget
(i) Extent of the variance in expenditure composition of primary expenditure during the last three
years, excluding contingency items
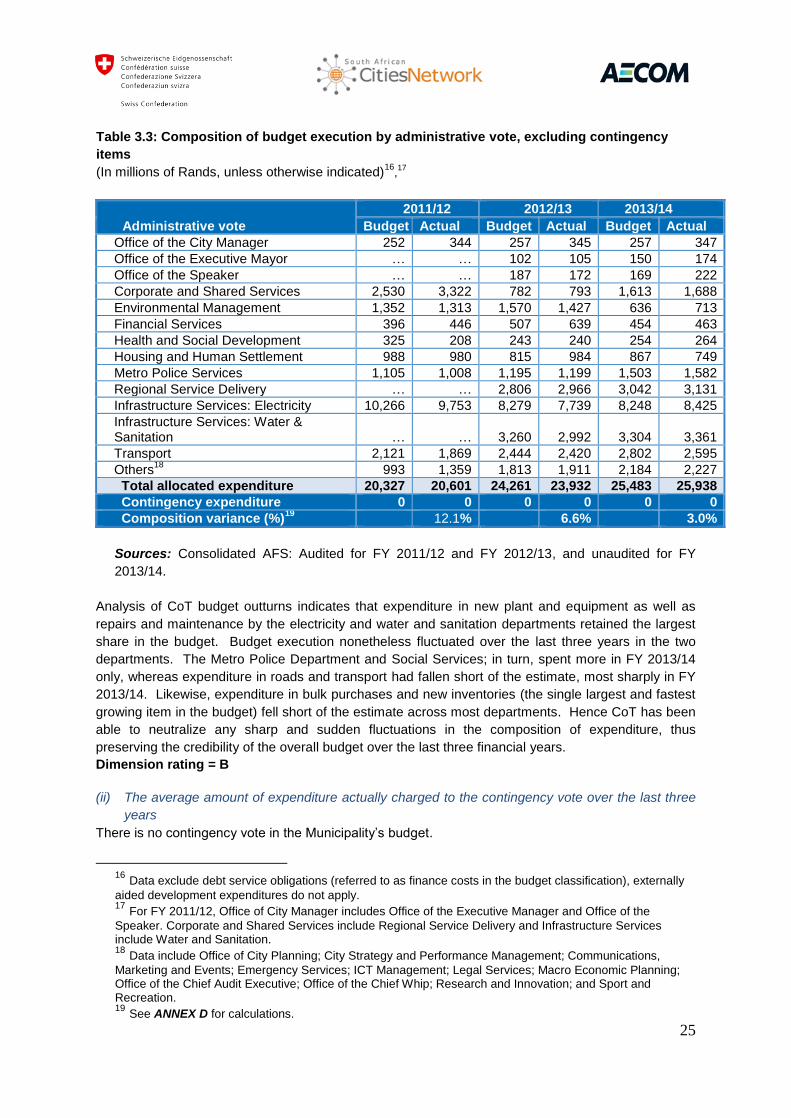
Variance in the composition of expenditure, excluding contingency items, exceeded 12.1% in
2011/12, 6.6% in 2012/13 and 3.0% in 2013/14 (Table 3.3).
13
Data exclude debt service obligations (referred to as finance costs in the budget classification), externally aided development expenditures do not apply. 14 Data include (a) salaries and wages, (b) pension fund contribution, (c) travel, motor car subsistence and
other allowances, (d) medical aid contributions, and (e) overtime payments, among others. In 2013/14, these represented 66% of total employee-related costs, 12%, 9%, 6%, and 5%, respectively. 15 Data include bulk purchases, repairs and maintenance, and other materials and contracted services.
25
Table 3.3: Composition of budget execution by administrative vote, excluding contingency
items
(In millions of Rands, unless otherwise indicated)16
,17
Administrative vote
2011/12 2012/13 2013/14
Budget Actual Budget Actual Budget Actual
Office of the City Manager 252 344 257 345 257 347
Office of the Executive Mayor … … 102 105 150 174
Office of the Speaker … … 187 172 169 222
Corporate and Shared Services 2,530 3,322 782 793 1,613 1,688
Environmental Management 1,352 1,313 1,570 1,427 636 713
Financial Services 396 446 507 639 454 463
Health and Social Development 325 208 243 240 254 264
Housing and Human Settlement 988 980 815 984 867 749
Metro Police Services 1,105 1,008 1,195 1,199 1,503 1,582
Regional Service Delivery … … 2,806 2,966 3,042 3,131
Infrastructure Services: Electricity 10,266 9,753 8,279 7,739 8,248 8,425
Infrastructure Services: Water & Sanitation … … 3,260 2,992 3,304 3,361
Transport 2,121 1,869 2,444 2,420 2,802 2,595
Others18
993 1,359 1,813 1,911 2,184 2,227
Total allocated expenditure 20,327 20,601 24,261 23,932 25,483 25,938
Contingency expenditure 0 0 0 0 0 0
Composition variance (%)19
12.1% 6.6% 3.0%
Sources: Consolidated AFS: Audited for FY 2011/12 and FY 2012/13, and unaudited for FY
2013/14.
Analysis of CoT budget outturns indicates that expenditure in new plant and equipment as well as
repairs and maintenance by the electricity and water and sanitation departments retained the largest
share in the budget. Budget execution nonetheless fluctuated over the last three years in the two
departments. The Metro Police Department and Social Services; in turn, spent more in FY 2013/14
only, whereas expenditure in roads and transport had fallen short of the estimate, most sharply in FY
2013/14. Likewise, expenditure in bulk purchases and new inventories (the single largest and fastest
growing item in the budget) fell short of the estimate across most departments. Hence CoT has been
able to neutralize any sharp and sudden fluctuations in the composition of expenditure, thus
preserving the credibility of the overall budget over the last three financial years.
Dimension rating = B
(ii) The average amount of expenditure actually charged to the contingency vote over the last three
years
There is no contingency vote in the Municipality’s budget.
16 Data exclude debt service obligations (referred to as finance costs in the budget classification), externally
aided development expenditures do not apply. 17 For FY 2011/12, Office of City Manager includes Office of the Executive Manager and Office of the
Speaker. Corporate and Shared Services include Regional Service Delivery and Infrastructure Services include Water and Sanitation. 18 Data include Office of City Planning; City Strategy and Performance Management; Communications,
Marketing and Events; Emergency Services; ICT Management; Legal Services; Macro Economic Planning; Office of the Chief Audit Executive; Office of the Chief Whip; Research and Innovation; and Sport and Recreation. 19 See ANNEX D for calculations.

26
Dimension rating = A
PI-2 Scoring Method M1
Composition of expenditure out- turn compared to original approved budget
B+
(i) Extent of the variance in expenditure composition of primary expenditure during the last three years, excluding contingency items
B Variance in expenditure composition exceeded 12.8% in 2011/12, 6.2% in 2012/13 and 3.2% in 2013/14.
(ii) The average amount of expenditure actually charged to the contingency vote over the last three years.
A There is no contingency vote in CoT’s budget.
PI-3 Aggregate revenue out-turn compared to original approved budget
The main sources of own revenue for CoT are property taxes (21%) collected by the Department of
Financial Services and utilities income (58%), budgeted for by the Departments of Electricity and
Water and Sanitation, respectively.
(i) Actual domestic revenue compared to domestic revenue in the originally approved budget
Actual domestic revenue (as a percentage of originally budgeted revenue) was 101.6% in FY
2011/12, 95.9% in FY 2012/13 and 95.6% in FY 2013/14 (Table 3.4). This is attributed to accurate
revenue projections and effective revenue collection systems for both property taxes and service
charges.
Table 3.4: Comparison of budgeted and actual own revenue 1/
(In millions of Rands, unless otherwise indicated)
Budget item 2011/12 2012/13 2013/14
Bud’t Act’l % Bud’t Act’l % Bud’t Actu’l %
Tax revenue
3,461
3,391
98.0%
3,722
3,999
107.5%
4,464
4,432
99.3%
Non-tax revenue Of which: Electricity sales Water fees
12,407
7,463 2,026
12,738
7,524 1,955
102.7%
100.8% 96.5%
13,845
8,989 2,138
12,852
8,131 2,285
92.8%
90.5% 106.9%
14,780
8,916 2,589
13,974
8,314 2,431
94.5%
93.2% 93.9%
Total
15,868
16,129
101.6%
17,567
16,851
95.9%
19,244
18,406
95.6%
Sources: Audited Consolidated AFS for FY 2011/12 and FY 2012/13; and unaudited Consolidated
AFS for FY 2013/14.
1/ Excludes capital transfers.
PI-3 Scoring Method M1
Actual domestic revenue compared to domestic revenue in the originally approved budget.
B Actual own revenues varied between 96% and 102%% of budgeted revenues over the last three financial years.

27
PI-4: Stock and monitoring of expenditure payment arrears
Bills due by the municipality were not always paid within 30 days of receiving an invoice, as required
by section 65(2)(e) of the MFMA and consequently, arrears were incurred throughout the year. It
cannot be necessarily attributed to shortage of funds, but usually to payments and invoices authorized
irregularly or improperly by line departments.
(i) Stock of expenditure payment arrears (as a percentage of actual total expenditure for the
corresponding fiscal year) and any recent change in the stock)
The stock of expenditure payment arrears comprises various payables to trade creditors and
taxpayers – these are accounted for, among others, as “Trade creditors/payables”, “Debtors with
credit balances” and “Other creditors” and are reported in the annual financial statements. Through
the SAP accounting software, line departments record and monitor expenditure commitments
(approved payments or “Releases”) against available cash resources within the financial plans
authorized for each department Sections 48 and 140 of the MFMA specify that an expenditure
payment is considered in arrears when an authorized payment is due more than 30 days. Table 3.5
shows the balances of unpaid bills to the private sector, which summarize all invoices overdue more
than 30 days and accumulated over the last three years.
Table 3.5: Expenditure payment arrears, at end June, 2012, 2013 and 2014 1/
(In millions of Rands, unless otherwise indicated)
2011/12 2012/13 2013/14
Trade creditors 2,753 3,001 2,567
Debtors with credit balances 542 614 666
Other creditors 424 585 676
VAT payable 282 92 46
Total 4,001 4,292 3,955
% of total budget % of total assets
18.7% 15.4%
17.2% 14.3%
14.7% 12.3%
Sources: Consolidated AFS: Audited for FY 2011/12 and FY 2012/13; and unaudited for FY
2013/14.
1/ Data excludes payments received in advance, retentions, and accrued leave pay, among others
Dimension rating = D
(ii) Availability of data for monitoring the stock payment arrears
As noted above, all payment arrears are compiled manually on a creditor-by-creditor basis, not
classified by department, comprising outstanding balances (from 31 to over 120 days). These consist
of payments overdue by the Municipality to suppliers and contractors (grouped as trade creditors in
the accounting system). Evidence could not be gathered on the existence a comprehensive analysis
of arrears by end of June summarized by vendors and warning of unpaid invoices of more than 30,
60, 90 and 120 days accumulated over the year. The common practice is that unpaid invoices
accumulated to the end of June are cleared within sixty days after end of the financial year, and no
further invoices are allowed into the (old year’s) system.
Dimension rating = D

28
PI-4 Scoring Method M1
Stock and monitoring of expenditure payment arrears
D
(i) Stock of expenditure payment arrears (as a percentage of actual total expenditure for the corresponding fiscal year) and any recent change in the stock)
D The stock of arrears exceeds 10% of total expenditure.
(ii) Availability of data for monitoring the stock payment arrears
D There is no evidence suggesting one comprehensive ad hoc or routine exercise has been generated over the past two years, including an age analysis for all relevant payable categories.
3.2 Comprehensiveness and transparency
This group of indicators examines the extent to which the structure and presentation of information in
the budget provides a comprehensive and clear picture of the municipality’s intentions with respect to
the management of the financial resources for which it is accountable. In particular, these indicators
describe the extent to which such information is: complete (i.e. comprises the totality of public
finances); easy to understand; and, made available to the general public in an accessible manner.
These indicators cover important aspects of comprehensiveness and transparency in public finances,
such as the timely and clear flow of fiscal information between levels of government, and information
on the activities of the CoT, and its municipal entities. They look into what information is available
and whether it is sufficiently transparent to allow the management of potential fiscal risks for the public
purse.
PI-5: Budget classification
The National Treasury has the responsibility for compiling whole-of-government accounts, including
consolidated local government information for national policy and other purposes. This information is
obtained from all municipalities, each of which operates according to their own organisational
structure: hence it is necessary for the National Treasury to specify a national standard for the
collection of local government budget and financial information. One of the key benefits of requiring
municipalities to budget and report according to GFS categories is to inform national reporting and
benchmarking, using a wholly standardized format, hence allowing an improved understanding of the
contribution of the local government sphere.
According to National Treasury, the budget formats prescribed in the Municipal Budget and Reporting
Regulations go a long way to identify the categories of municipal information required in developing
their budgets. The next step is to ensure that the detailed information captured in the implementation
of the budget is properly and credibly aligned. Although the local government sphere has its own
peculiarities, the success achieved at the National and Provincial levels by implementing a Standard
Chart of Accounts could be equally beneficial for Local Government in improving data quality,
achieving a greater level of standardization and uniform data sets. These are critical for ‘whole-of-
government’ reporting.
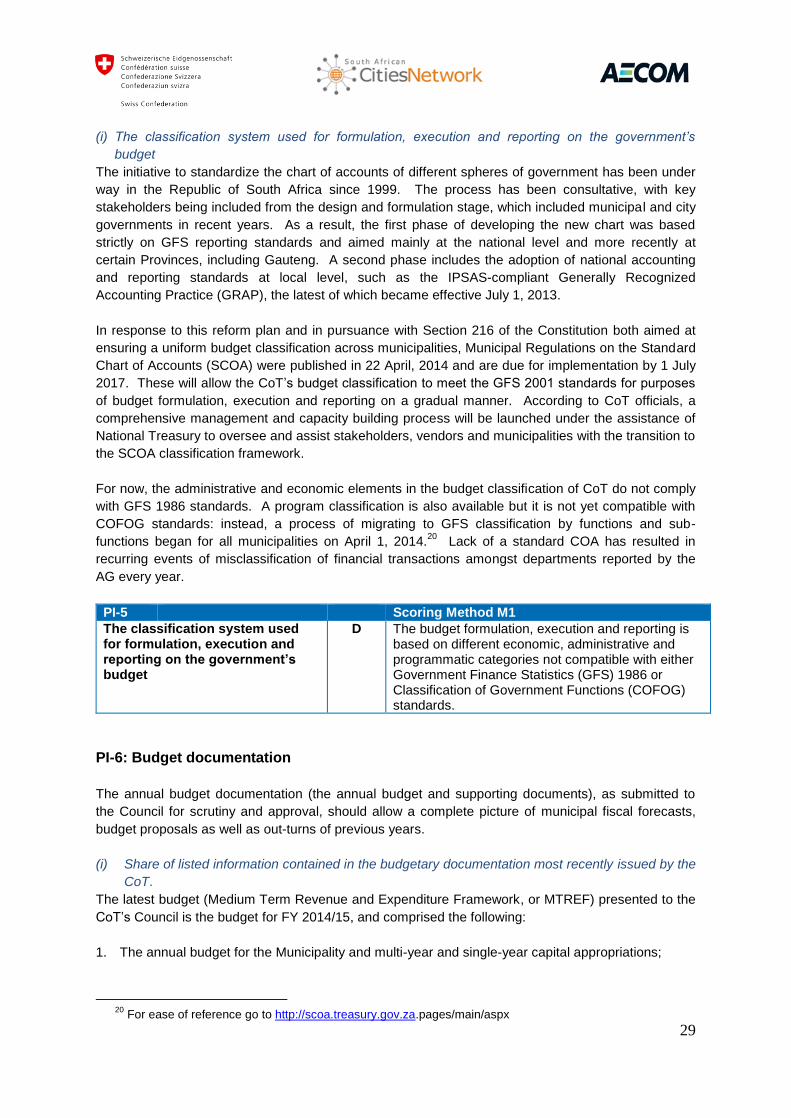
29
(i) The classification system used for formulation, execution and reporting on the government’s
budget
The initiative to standardize the chart of accounts of different spheres of government has been under
way in the Republic of South Africa since 1999. The process has been consultative, with key
stakeholders being included from the design and formulation stage, which included municipal and city
governments in recent years. As a result, the first phase of developing the new chart was based
strictly on GFS reporting standards and aimed mainly at the national level and more recently at
certain Provinces, including Gauteng. A second phase includes the adoption of national accounting
and reporting standards at local level, such as the IPSAS-compliant Generally Recognized
Accounting Practice (GRAP), the latest of which became effective July 1, 2013.
In response to this reform plan and in pursuance with Section 216 of the Constitution both aimed at
ensuring a uniform budget classification across municipalities, Municipal Regulations on the Standard
Chart of Accounts (SCOA) were published in 22 April, 2014 and are due for implementation by 1 July
2017. These will allow the CoT’s budget classification to meet the GFS 2001 standards for purposes
of budget formulation, execution and reporting on a gradual manner. According to CoT officials, a
comprehensive management and capacity building process will be launched under the assistance of
National Treasury to oversee and assist stakeholders, vendors and municipalities with the transition to
the SCOA classification framework.
For now, the administrative and economic elements in the budget classification of CoT do not comply
with GFS 1986 standards. A program classification is also available but it is not yet compatible with
COFOG standards: instead, a process of migrating to GFS classification by functions and sub-
functions began for all municipalities on April 1, 2014.20
Lack of a standard COA has resulted in
recurring events of misclassification of financial transactions amongst departments reported by the
AG every year.
PI-5 Scoring Method M1
The classification system used for formulation, execution and reporting on the government’s budget
D The budget formulation, execution and reporting is based on different economic, administrative and programmatic categories not compatible with either Government Finance Statistics (GFS) 1986 or Classification of Government Functions (COFOG) standards.
PI-6: Budget documentation
The annual budget documentation (the annual budget and supporting documents), as submitted to
the Council for scrutiny and approval, should allow a complete picture of municipal fiscal forecasts,
budget proposals as well as out-turns of previous years.
(i) Share of listed information contained in the budgetary documentation most recently issued by the
CoT.
The latest budget (Medium Term Revenue and Expenditure Framework, or MTREF) presented to the
CoT’s Council is the budget for FY 2014/15, and comprised the following:
1. The annual budget for the Municipality and multi-year and single-year capital appropriations;
20
For ease of reference go to http://scoa.treasury.gov.za.pages/main/aspx

30
2. The financial position, cash flow budget, cash-backed reserve/accumulated surplus, and asset
management position;
3. The financial impact of municipal entities;
4. Proposed tariffs for property owners and electricity, supply of water, sanitation and refuse removal
services effective 1 July 2014;
5. Request for approval requested to enter the capital market for funding the capital programme for
FY 2014/15 to an amount not exceeding R.1.5 billion per financial year of the MTREF, in terms of
Section 46 of MFMA;
6. Request for approval to incur short-term debt as and when required according to the cash flow
position of the CoT for the total amount not exceeding R.1,5 billion at any time;
7. Authorization to sign all necessary agreements;
8. Determination notice on the proposed annual property tax rate and electricity, water, sanitation,
and refuse removal tariffs;
9. Request for approval to amend the Budget Policy;
10. Request for no amendments regarding the objections and representations received on the tabled
2014/15 MTREF and proposed tariffs; and
11. Request for approval to authorize the Business Plan for Municipal Entities.
Table 3.6: Information in Budget Documentation
Documentary Requirement Fulfilled Documents for Evaluation
1. Macroeconomic assumptions, including aggregate growth, inflation and interest rate estimates, at the very least.
Yes Relevant macroeconomic assumptions and growth rates, including the consumer price index, the municipal cost index, key service tariffs, and salary increases, among others.
2. Fiscal deficit defined according to GFS or other internationally defined standards.
Yes Fiscal deficit is presented in a form compatible to GFS standards.
3. Deficit financing, describing anticipated composition
No Surplus is usually the norm.
4. Debt stock, including details at least for the beginning of current year
Yes The information is available.
5. Financial Assets, including details at least for the beginning of the current year
Yes The information forms part of the Section on CoT’s financial position (Table A6: Consolidated Budgeted Financial Position).
6. Prior year’s budget out-turns, presented in the same format as the budget proposal
Yes Forms part of Table A2: Consolidated Budgeted Financial Performance (revenue and expenditure by standard classification),
7. Current year’s budget (either the revised budget or the estimated out-turn).
Yes Table A3: Consolidated Budgeted Financial Performance (revenue and expenditure by municipal vote), Table A4: Consolidated Budgeted Financial Performance (revenue and expenditure), Table A5: Consolidated Budgeted Capital Expenditure by vote, standard classification and funding, and Table A7: Consolidated Budgeted Cash Flows.
8. Summarized budget data for both revenue and expenditure according to the main heads of the classifications used (ref. PI-5), including data for the current and previous year.
Yes Forms part of Table A1: Consolidated Budget Summary.
9. Explanation of the budget implications of new policy initiatives with estimates of the budgetary impact of all major
Yes Forms part of Statement of tariff setting, which includes property rates, electricity services, water and sewerage and sanitation
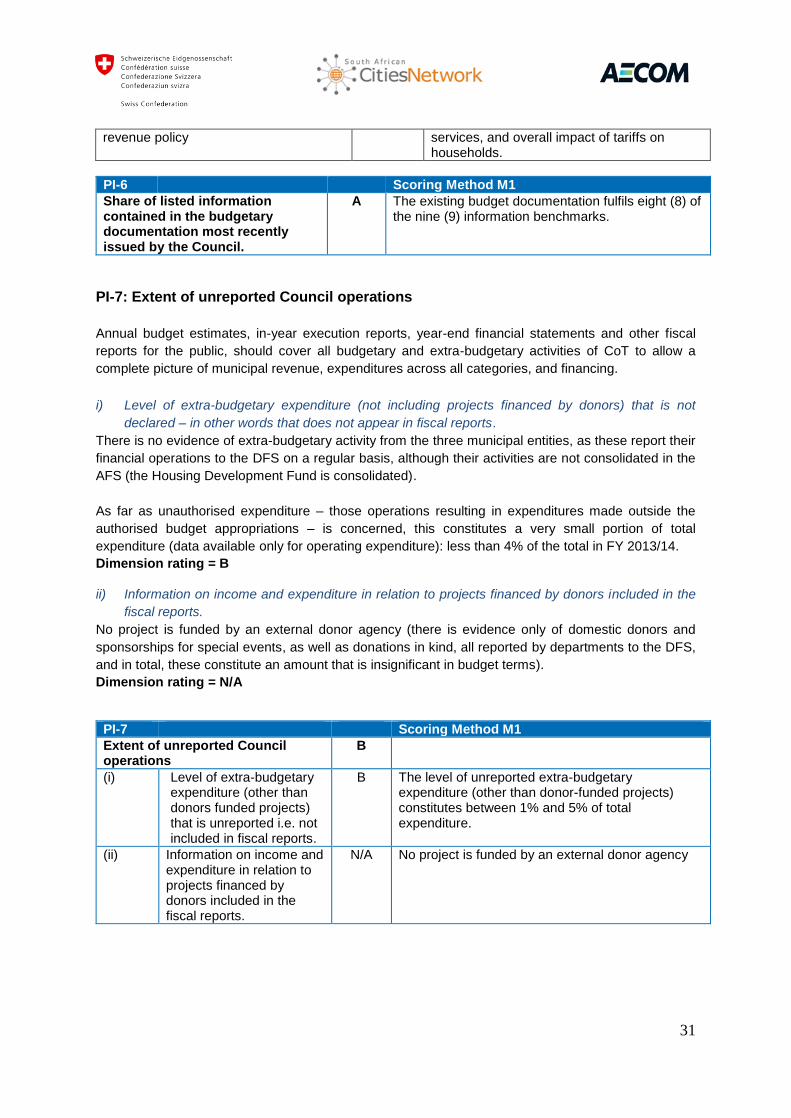
31
revenue policy services, and overall impact of tariffs on households.
PI-6 Scoring Method M1
Share of listed information contained in the budgetary documentation most recently issued by the Council.
A The existing budget documentation fulfils eight (8) of the nine (9) information benchmarks.
PI-7: Extent of unreported Council operations
Annual budget estimates, in-year execution reports, year-end financial statements and other fiscal
reports for the public, should cover all budgetary and extra-budgetary activities of CoT to allow a
complete picture of municipal revenue, expenditures across all categories, and financing.
i) Level of extra-budgetary expenditure (not including projects financed by donors) that is not
declared – in other words that does not appear in fiscal reports.
There is no evidence of extra-budgetary activity from the three municipal entities, as these report their
financial operations to the DFS on a regular basis, although their activities are not consolidated in the
AFS (the Housing Development Fund is consolidated).
As far as unauthorised expenditure – those operations resulting in expenditures made outside the
authorised budget appropriations – is concerned, this constitutes a very small portion of total
expenditure (data available only for operating expenditure): less than 4% of the total in FY 2013/14.
Dimension rating = B ii) Information on income and expenditure in relation to projects financed by donors included in the
fiscal reports.
No project is funded by an external donor agency (there is evidence only of domestic donors and
sponsorships for special events, as well as donations in kind, all reported by departments to the DFS,
and in total, these constitute an amount that is insignificant in budget terms).
Dimension rating = N/A
PI-7 Scoring Method M1
Extent of unreported Council operations
B
(i) Level of extra-budgetary expenditure (other than donors funded projects) that is unreported i.e. not included in fiscal reports.
B The level of unreported extra-budgetary expenditure (other than donor-funded projects) constitutes between 1% and 5% of total expenditure.
(ii) Information on income and expenditure in relation to projects financed by donors included in the fiscal reports.
N/A No project is funded by an external donor agency

32
PI-8: Intergovernmental Fiscal Relations
As there are no sub-national elected governments in CoT, this indicator does not apply (NA).
i) Transparent systems based on regulations governing horizontal allocations between sub-national
governments of unconditional and conditional transfers from the government (budgeted and real
allocations) of CoT.
ii) Timely provision of reliable information to sub-national governments on the allocations to be
made to them by government for the following year.
iii) Degree to which consolidated general government fiscal data (at least on income and
expenditure) is collected and made available, broken down by sectoral categories.
PI-8 Scoring Method M2
Intergovernmental Fiscal Relations NA
(i) Transparent systems based on regulations governing horizontal allocations between sub-national governments of unconditional and conditional transfers from the (central) government (budgeted and real allocations) of CoT.
NA
(ii) Timely provision of reliable information to sub-national governments on the allocations to be made to them by (central) government for the following year.
NA
(iii) Degree to which consolidated general government fiscal data (at least on income and expenditure) is collected and made available, broken down by sectoral categories.
NA
PI-9: Oversight of aggregate fiscal risk
As with other municipalities, CoT has established a number of ‘entities’ to perform certain related
functions: there are three such bodies, incorporated under the term of the relevant Companies Acts
and these are the Housing Company Tshwane; the Sandspruit Works Association; and, the Tshwane
Economic Development Agency.
(i) Extent of Council monitoring of municipal entities
There is a host of capacity challenges relating to accounting and reporting confronted by Municipal
Entities (MEs) in general. They nonetheless, manage to report to the Treasury on a quarterly basis,
according to a budgeting and financial reporting format agreed beforehand. The parent department
monitors the activities of individual municipal entities on a quarterly basis and the responsibility of
consolidating the reports on an annual basis and monitoring the evolving of the overall financial
situation resides solely under the Group Governance and Strategy Unit.
Dimension rating = B
(ii) Extent of Council monitoring of SN governments’ fiscal position
Dimension (ii) is not applicable as there is no second tier of government in CoT.
Dimension rating = NA
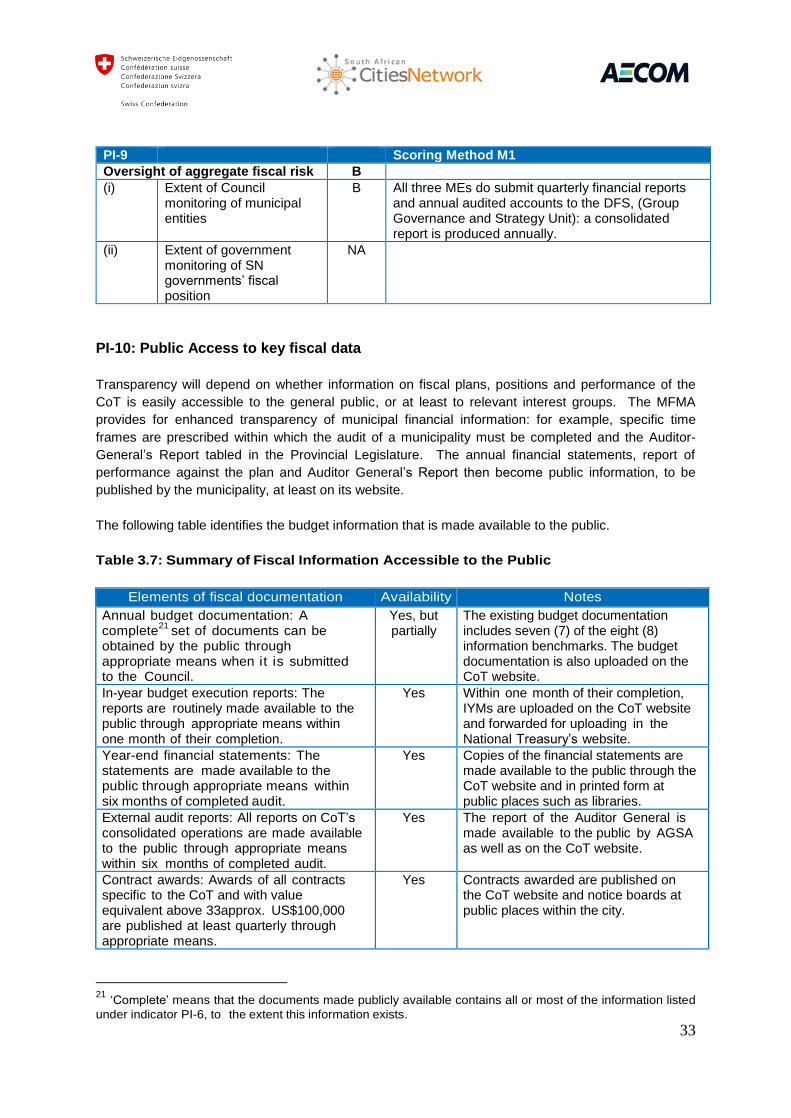
33
PI-9 Scoring Method M1
Oversight of aggregate fiscal risk B
(i) Extent of Council monitoring of municipal entities
B All three MEs do submit quarterly financial reports and annual audited accounts to the DFS, (Group Governance and Strategy Unit): a consolidated report is produced annually.
(ii) Extent of government monitoring of SN governments’ fiscal position
NA
PI-10: Public Access to key fiscal data
Transparency will depend on whether information on fiscal plans, positions and performance of the
CoT is easily accessible to the general public, or at least to relevant interest groups. The MFMA
provides for enhanced transparency of municipal financial information: for example, specific time
frames are prescribed within which the audit of a municipality must be completed and the Auditor-
General’s Report tabled in the Provincial Legislature. The annual financial statements, report of
performance against the plan and Auditor General’s Report then become public information, to be
published by the municipality, at least on its website.
The following table identifies the budget information that is made available to the public.
Table 3.7: Summary of Fiscal Information Accessible to the Public
Elements of fiscal documentation Availability Notes
Annual budget documentation: A complete
21 set of documents can be
obtained by the public through appropriate means when it is submitted to the Council.
Yes, but partially
The existing budget documentation includes seven (7) of the eight (8) information benchmarks. The budget documentation is also uploaded on the CoT website.
In-year budget execution reports: The reports are routinely made available to the public through appropriate means within one month of their completion.
Yes Within one month of their completion, IYMs are uploaded on the CoT website and forwarded for uploading in the National Treasury’s website.
Year-end financial statements: The statements are made available to the public through appropriate means within six months of completed audit.
Yes Copies of the financial statements are made available to the public through the CoT website and in printed form at public places such as libraries.
External audit reports: All reports on CoT’s consolidated operations are made available to the public through appropriate means within six months of completed audit.
Yes The report of the Auditor General is made available to the public by AGSA as well as on the CoT website.
Contract awards: Awards of all contracts specific to the CoT and with value equivalent above 33approx. US$100,000 are published at least quarterly through appropriate means.
Yes Contracts awarded are published on the CoT website and notice boards at public places within the city.
21 ‘Complete’ means that the documents made publicly available contains all or most of the information listed
under indicator PI-6, to the extent this information exists.
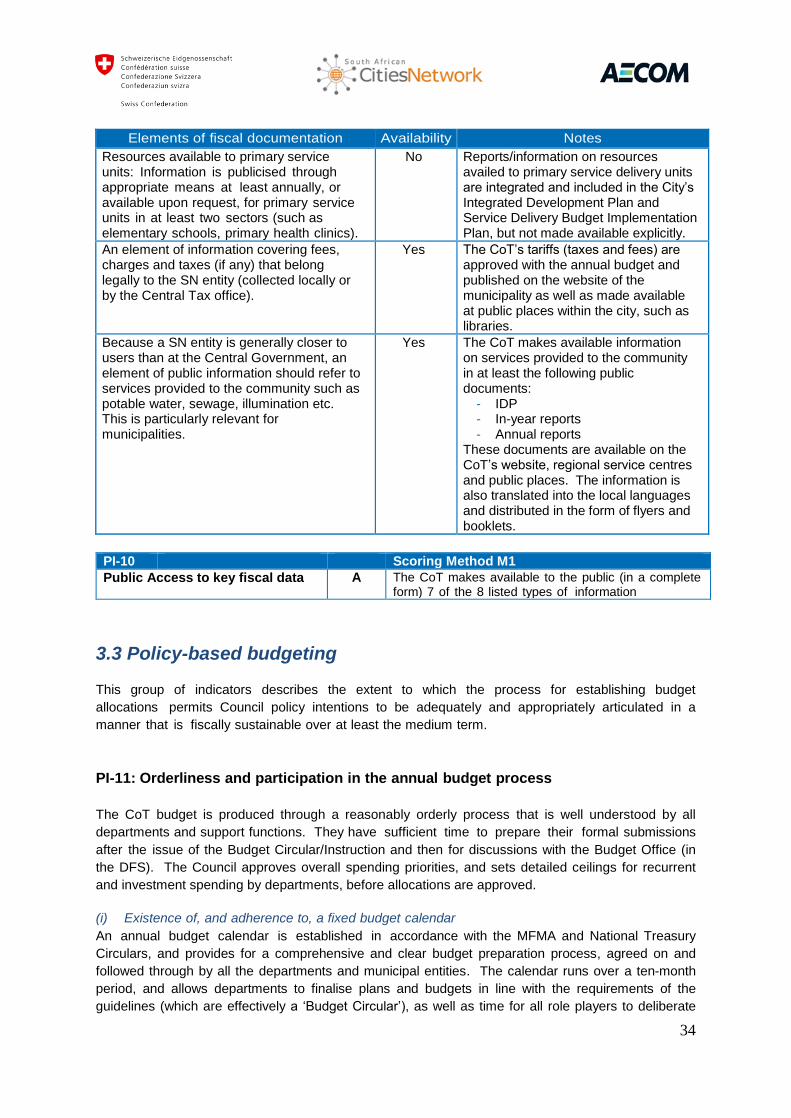
34
Elements of fiscal documentation Availability Notes
Resources available to primary service units: Information is publicised through appropriate means at least annually, or available upon request, for primary service units in at least two sectors (such as elementary schools, primary health clinics).
No Reports/information on resources availed to primary service delivery units are integrated and included in the City’s Integrated Development Plan and Service Delivery Budget Implementation Plan, but not made available explicitly.
An element of information covering fees, charges and taxes (if any) that belong legally to the SN entity (collected locally or by the Central Tax office).
Yes The CoT’s tariffs (taxes and fees) are approved with the annual budget and published on the website of the municipality as well as made available at public places within the city, such as libraries.
Because a SN entity is generally closer to users than at the Central Government, an element of public information should refer to services provided to the community such as potable water, sewage, illumination etc. This is particularly relevant for municipalities.
Yes The CoT makes available information on services provided to the community in at least the following public documents:
- IDP - In-year reports - Annual reports
These documents are available on the CoT’s website, regional service centres and public places. The information is also translated into the local languages and distributed in the form of flyers and booklets.
PI-10 Scoring Method M1
Public Access to key fiscal data A The CoT makes available to the public (in a complete form) 7 of the 8 listed types of information
3.3 Policy-based budgeting
This group of indicators describes the extent to which the process for establishing budget
allocations permits Council policy intentions to be adequately and appropriately articulated in a
manner that is fiscally sustainable over at least the medium term.
PI-11: Orderliness and participation in the annual budget process
The CoT budget is produced through a reasonably orderly process that is well understood by all
departments and support functions. They have sufficient time to prepare their formal submissions
after the issue of the Budget Circular/Instruction and then for discussions with the Budget Office (in
the DFS). The Council approves overall spending priorities, and sets detailed ceilings for recurrent
and investment spending by departments, before allocations are approved.
(i) Existence of, and adherence to, a fixed budget calendar
An annual budget calendar is established in accordance with the MFMA and National Treasury
Circulars, and provides for a comprehensive and clear budget preparation process, agreed on and
followed through by all the departments and municipal entities. The calendar runs over a ten-month
period, and allows departments to finalise plans and budgets in line with the requirements of the
guidelines (which are effectively a ‘Budget Circular’), as well as time for all role players to deliberate

35
(both internally and externally – National and Provincial Departments, Entities and NGOs), and
ultimately for the Council to approve the budget before the fiscal year commences.
The general shape of an annual budget calendar has been established in compliance with the
MFMA and National Treasury Circulars. Section 68 of the MFMA prescribes that the Accounting
Officer of the municipality must assist and support the Mayor to comply with the prescripts of
Chapters 4 and 7 of the MFMA to prepare the municipality’s budget.
The budget preparation process consists of the following phases:
Phase 1: Tabling Budget for Consultation
Phase 2: Publication of Budget Tabled for Consultation
Phase 3: Submission of Tabled Budget
Phase 4: Submission of Entities’ Budget to Municipality
Phase 5: Consideration of Budget for Approval
Phase 6: Publication of Approved Budget
Phase 7: Submission of Approved Budget
Phase 8: Approval of Entities’ Budget
Phase 9: Submission and Publication of Entities’ Budget
CoT’s budget preparation timetable below, covers in more detail each of these phases. Since
Departments actively participate in this process the Departmental ceilings are communicated in the
process leading up to the approval of the budget. The Departmental ceilings are confirmed and
communicated with the approval of the budget at least one month before the commencement of the
new financial year.
Table 3.8: Critical dates for the 2014/15 CoT Budget Process
Approval of IDP and Budget Process Plan 29 August 2013
Stakeholder and Outreach Participation August 2013 and April 2014
On-going Strategic Discussions by Departments, Regions and
Entities September 2013
Strategic Mayoral Lekgotla October 2013
Intergovernmental Alignment October to December 2013
Issuing of budget and tariffs guidelines November 2013
Development and Submission of Business Plans and Departmental
SDBIPs
1st Draft 15 November 2013,
2nd
Draft 15 January 2013
Mid-year Review and Adjustments Budget January 2014
Budget Steering Committee Hearings 5 to 7 February 2014
Budget Lekgotla 21 to 23 February 2014
Finalisation and Updating of Draft Documents 23 February to March 2014
Tabling of Draft Plans 27 March 2014
Public Consultation and Outreach March and April 2014
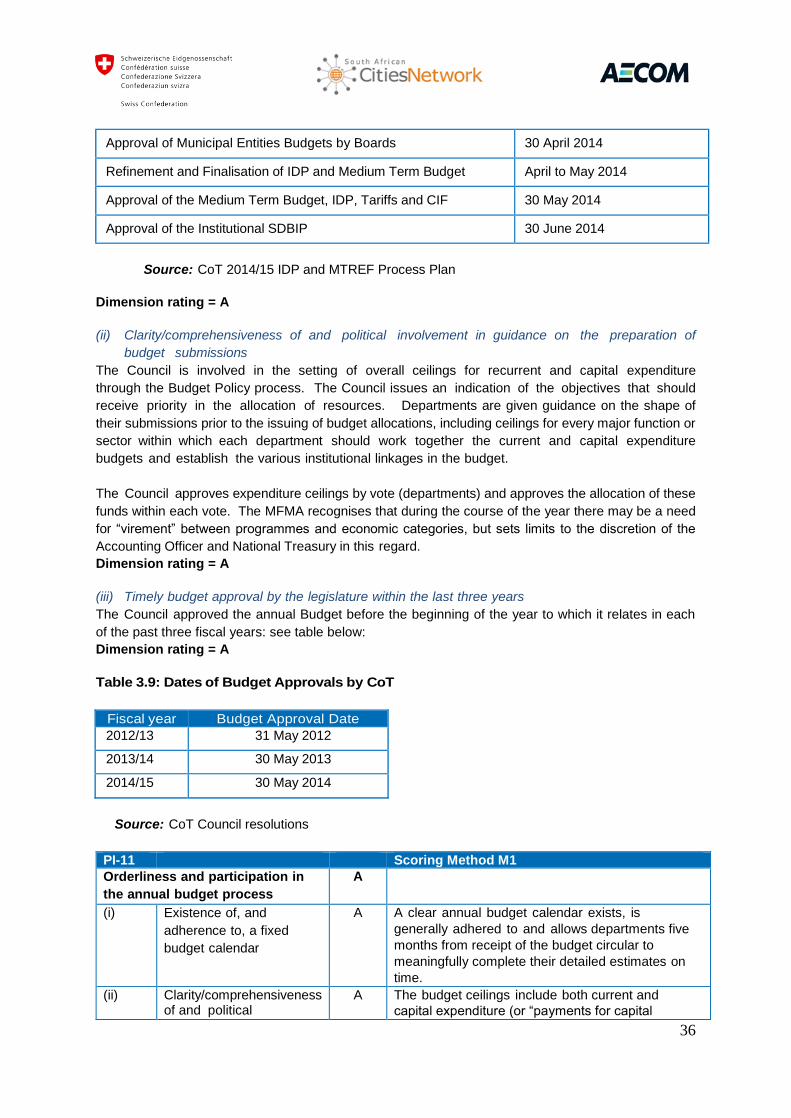
36
Approval of Municipal Entities Budgets by Boards 30 April 2014
Refinement and Finalisation of IDP and Medium Term Budget April to May 2014
Approval of the Medium Term Budget, IDP, Tariffs and CIF 30 May 2014
Approval of the Institutional SDBIP 30 June 2014
Source: CoT 2014/15 IDP and MTREF Process Plan
Dimension rating = A
(ii) Clarity/comprehensiveness of and political involvement in guidance on the preparation of
budget submissions
The Council is involved in the setting of overall ceilings for recurrent and capital expenditure
through the Budget Policy process. The Council issues an indication of the objectives that should
receive priority in the allocation of resources. Departments are given guidance on the shape of
their submissions prior to the issuing of budget allocations, including ceilings for every major function or
sector within which each department should work together the current and capital expenditure
budgets and establish the various institutional linkages in the budget.
The Council approves expenditure ceilings by vote (departments) and approves the allocation of these
funds within each vote. The MFMA recognises that during the course of the year there may be a need
for “virement” between programmes and economic categories, but sets limits to the discretion of the
Accounting Officer and National Treasury in this regard.
Dimension rating = A
(iii) Timely budget approval by the legislature within the last three years
The Council approved the annual Budget before the beginning of the year to which it relates in each
of the past three fiscal years: see table below:
Dimension rating = A
Table 3.9: Dates of Budget Approvals by CoT
Fiscal year Budget Approval Date
2012/13 31 May 2012
2013/14 30 May 2013
2014/15 30 May 2014
Source: CoT Council resolutions
PI-11 Scoring Method M1
Orderliness and participation in
the annual budget process
A
(i) Existence of, and
adherence to, a fixed
budget calendar
A A clear annual budget calendar exists, is
generally adhered to and allows departments five
months from receipt of the budget circular to
meaningfully complete their detailed estimates on
time.
(ii) Clarity/comprehensiveness of and political
A The budget ceilings include both current and
capital expenditure (or “payments for capital
37
involvement in guidance on the preparation of budget submissions
assets”) approved by the Council, at administrative
unit level, together with general guidance on
expenditure priorities.
(iii) Timely budget approval by
the legislature within the
last three years
A The CoT Council has, during the past three fiscal years, approved the budget before the start of the fiscal year.
PI-12: Multi-year perspective in fiscal planning, expenditure policy and budgeting
Expenditure policy decisions have multi-year implications, and must be aligned with the availability of
resources over a medium-term perspective. Therefore, multi-year fiscal forecasts of revenue,
medium term expenditure aggregates for mandatory expenditure and potential deficit financing
(including reviews of debt sustainability involving both external and domestic debt) should be the
foundation for policy changes.
CoT is aware of the socio-economic challenges faced by the country, including the negative effects of
unemployment, poverty, the need for housing and other basic human development and infrastructure
needs. In response to these needs, the South African Government set out 5 key priorities, namely,
(1) Education; (2) Job creation, (3) Health, (4) Crime Prevention, and (5) Rural Development and
Land Reform.
CoT has allocated sizable domestic resources in its budget to address these challenges, firmly guided
by the Outcome-based approach adopted at the national level since 2010/11. CoT reemphasized its
commitment to ensure that its budget is informed and addresses government priorities as reflected in
the New Growth Path, the 2009 Medium Term Strategic Framework and the National Planning
Commission’s ‘Twelve Outcomes’ forming the basis of Government’s strategic and policy priorities.
This strategic framework comprises a range of output targets that form the basis for budget
preparation. Departments and municipal entities are expected to maintain a portfolio of evidence to
show the extent of the achievement of performance targets: these will be presented for audit by the
AGSA.
Table 3.10: Government’s Twelve Outcomes
1 Improved quality of basic education
2 A long and healthy life for all South Africans
3 All people in South Africa are and feel safe
4 Decent employment through inclusive growth
5 A skilled and capable workforce to support an inclusive growth path
6 An efficient, competitive and responsive economic infrastructure network
7 Vibrant, equitable and sustainable rural communities with food security for all
8 Sustainable human settlements and improved quality of household life
9 A responsive accountable, effective and efficient local government system
10 Environmental assets and natural resources that are well protected and continually enhanced
11 Create a better South Africa and contribute to a better and safer Africa and World
12 An efficient, effective and development oriented public service and an empowered, fair and
inclusive citizenship
Source: National Planning Commission.
38
These outcomes involve responsibilities shared by several stakeholders, not only across the three
spheres of government, but also business and NGOs within the municipal area, as well as the different
departments within CoT. Cluster committees are responsible for coordination and collaboration, and
for monitoring implementation. Individual departments and municipal entities are responsible for
specific outputs, programmes and projects that contribute to these shared goals and objectives. The
IDP, SDBIP and MTREF process is designed to achieve an allocation of fiscal resources between
programmes that is consistent with a balanced and cost-effective promotion of these outcomes.
Departments and entities are required to set out their roles and responsibilities relating to the
outcomes as part of their SDBIP and budget submissions.
In preparing these plans and submissions, departments and public entities are expected to set out
the outputs and performance indicators and targets relevant to programmes and sub-
programmes (other than administrative programmes). This must be considered when
reprioritising the budget in the preparation of revised MTREF baseline estimates. Departments
must reflect their performance measures as agreed upon per sector and the performance targets
set out in their SDBIP for the upcoming financial year. By means of the formal functional Committee
on Municipal Accounts (COMA), agreement must be reached between departments and the Council
on the relevant (non-financial) outputs, performance indicators and targets to be included in
departmental and entity submissions.
Guidance on strategic and annual planning and on performance information is outlined in the
Local Government: Municipal Planning and Performance Management Regulations, 2001.
(i) Multi-year fiscal forecasts and functional allocations
Annual budget ceilings are prepared for administrative, program and main economic categories, for
the next budget year and a period of three years, on a rolling basis. However, the municipal
budget process is unable to align the performance and structures of relevant programs and activities
across strategic sectors in the resource envelope. The substantial amount of budget information
available in the system would ideally ease the way towards a sector-wide approach. This would
enable intertwining the various budget items throughout the life of a capital formation project to
the achievement of a result for the sector, regardless of the executing agencies and service
delivery units involved.
Dimension rating = A
(ii) Scope and frequency of debt sustainability analysis
The CoT for every year during the period under review conducted an extensive analysis of its financial
position, financial performance and cash flow included with the annual financial statements and Auditor
General’s report. The analysis of financial position amongst things other focuses on the measurement
of liquidity, liability and sustainability, while the cash flow analysis focuses on the measurement of cash
and debt.
The analysis includes all the different ratios compared to the norm for local government. Where there
are deviations from the norm it is explained in the report by the Chief Financial Officer. Furthermore,
the notes to the annual financial statements include detail information on for example the different
liabilities and financial instruments.
Dimension rating = A (iii) Existence of sector strategies with multi-year costing of recurrent and investment expenditure
The CoT adopted ‘Vision 2055’, supported by a short-term implementation strategy, linked to the
Mayoral term. This is further complimented by the annual revision and update of the IDP, SDBIP (in

39
effect, a ‘sector strategy’) and MTREF. The IDP includes programmes that are further “unpacked” in
the SDBIP where all the projects each department plans to implement to support the programmes are
listed. The resources for the implementation of these projects are largely funded in the annual
budget.
The multi-year costing of recurrent and investment expenditure for the programmes only becomes
visible if costs of the different projects contributing to the programme are extracted and added up.
Although CoT officials stated that costing of certain capital programmes and projects is carried out
during the planning stage, no evidence was available, and there is no meaningful costing of
development plans which could determine the extent of financing and serve to determine and
prioritise a medium- to long-term capital investment plan and better guide the projection of the
recurrent resources required across sectors and departments, as part of the MTREF and annual
budgeting processes. There is no costing of expenditure activities carried out between and within
programmes, as the law allows for only limited movement of funds between programmes once the
budget has been approved. Cost estimates for each programme are the key information inputs into
the budget process. Without these inputs it is becoming difficult to provide the essential data both
for analysis of budget submissions and, once approved, for populating the financial management
systems through which transactions are recorded against approved allocations. One example of
weak sector linkages is observed within the human settlements budget, particularly in regards to
the provision of accompanying infrastructure and basic services.
Dimension rating = C
(iv) Linkages between investment budgets and forward expenditure estimates
A SDBIP and a MTREF are prepared and reviewed annually by every department responsible for the
building and equipping of new economic and social infrastructure within CoT. Every department
attempts to link capital projects to the estimate of operating and maintenance expenses, but this
process is cumbersome and inefficient, according to executing departments, and largely weakened
due to deficient project and contract management.
The process is impaired by the departments not being able to prevent and control capital projects
from running into further delays in implementation, commonly attributed to local capacity
constraints and deficient economic planning and technical design. This not only results in
major overrun costs to the budget but in significant imprecision as to the amount of staffing and
other resources required to operate those new public assets as part of the calculation of forward
estimates in the MTREF process.
Dimension rating = C
PI-12 Scoring Method M2
Multi-year perspective in fiscal
planning, expenditure policy and
budgeting
B
(i) Multi-year fiscal forecasts and functional allocations
A Annual budget ceilings are prepared for
administrative, program and main economic
categories, and for the next budget year and a
period of three years on a rolling basis.
Programmatic structures in the budget represent
the functional allocations.
(ii) Scope and frequency of debt sustainability analysis
A Each year, CoT conducts an extensive analysis of its financial position, including the measurement of cash and debt. Any deviations from established norms are explained in the CFO’s report.
40
PI-12 Scoring Method M2
(iii) Existence of sector strategies with multi-year costing of recurrent and investment expenditure
C Costed strategies cover more sectors but are
inconsistent with aggregate fiscal forecasts.
(iv) Linkages between investment budgets and forward expenditure estimates
C Public works and infrastructure plans exist for the responsible line departments and a budget is allocated for the provision of operating and maintenance. The problem for the most part lies on the capital projects planned for delivery being loosely tied to the forward operating and maintenance expenditure estimates.
3.4 Predictability and control in budget execution
This group of indicators considers the extent to which managers of budget agencies are able, in
practice, to collect revenue as well as commit and make expenditures consistent with their budget
allocations and agreed cash flow projections. The extent to which revenue collection and
expenditure control arrangements are effective without unnecessarily constraining the effectiveness
of service delivery are also assessed.
Among other things, the group covers two critical aspects of PFM systems: payroll and procurement
controls. Since compensation of employees represents a large portion of CoT’s budget, it is imperative
that effective and efficient payroll controls are in place. Likewise, since a major component of
expenditure relies on procurement arrangements, it is imperative that procurement arrangements
are clear, fair and transparent and that they facilitate efficient expenditures rather than hinder
them. Both the payroll and procurement systems are potential sources of corruption if control
arrangements are weak or poorly managed.
PI-13: Transparency of Taxpayer Obligations and Liabilities
The only form of taxation available to CoT’s is property rates, which comprise approximately 20% of
total own revenue: see Table 3.10 below.
Table 3.11: Composition of CoT’s Own Revenue, including taxes (Property Rates)
Revenue Source 2011/12 2012/13 2013/14 2011/12 2012/13 2013/14
R’000 % of total
Property rates 3,391 3,999 4,432 21.0% 23.7% 24.1%
Service charges - electricity revenue
7,524 8,131 8,314 46.6% 48.3% 45.2%
Service charges - water revenue 1,955 2,285 2,431 12.1% 13.6% 13.2%
Service charges - sanitation revenue
525 597 663 3.3% 3.5% 3.6%
Service charges - refuse revenue 480 503 768 3.0% 3.0% 4.2%
Service charges - other 196 126 136 1.2% 0.8% 0.7%
Rental of facilities and equipment 100 106 113 0.6% 0.6% 0.6%
Interest earned - external investments
52 63 52 0.3% 0.4% 0.3%
Interest earned - outstanding debtors
266 277 327 1.6% 1.6% 1.8%
Fines 4 4 4 0.0% 0.0% 0.0%
Licences and permits 52 59 56 0.3% 0.3% 0.3%
Transfers recognised – operational 1/
1,162 962 1,045 9.8% 4.2% 6.0%

41
Revenue Source 2011/12 2012/13 2013/14 2011/12 2012/13 2013/14
R’000 % of total
Total 16,129 16,851 18,406 100.0% 100.0% 100.0%
Sources: CoT’s Annual Financial Statements FY2011/12 to FY2013/14.
1/ Own revenue and transfers recognized combined equal the “Revenue by Source” utilised for this analysis in
every financial year, which exclude “Capital transfers and contributions”. The analysis observed a discrepancy in
the operating revenue due to the basis used by the Group Chief Financial Officer in the annual financial
statements to explain the overall operating results, namely, the “Revenue by Vote” (which equals additional
revenues in about 12% not identified by the PEFA assessors).
(i) Clarity and comprehensiveness of tax liabilities
The Municipal Property Rates Act (No. 6 of 2004) empowers municipalities to raise taxes on
designated properties within their boundaries. Tax rates for different types of properties are included
in CoT’s tariff policy, which is approved annually with the budget and is publicly available on the
municipality’s website and at public places such as regional community centres and libraries.
Individual Ratepayers are notified of their liability and receive monthly accounts.
Dimension rating = A
(ii) Taxpayer access to information on tax liabilities and administrative procedures
Arrangements about procedures, liability for and appeals against property rates are detailed in the
Municipal Property Rates Act and the City’s annual tariff policy, which is available from CoT’s website
as well as public offices around the city, community centres and libraries.
The administrative procedures for some tax liabilities are not regularly available and generally lack the
detailed steps that must be followed. The procedures do not include a complete list of all the
supporting documents that rate payers are required to submit when registering for their tax liabilities.
Dimension rating = C
(iii) Existence and functioning of a tax appeals mechanism
Once Council approves CoT’s tariff policy (with the annual budget), the tariffs are captured on the
consolidated account billing system. Given the large volume of accounts and huge number of possible
exceptions, the billing system cannot cater for the exceptions. This causes erroneous charges on
ratepayers’ accounts and because it is incorrect the ratepayers involved do not pay for them, often
leading to incorrect actions such as disconnections and even legal action.
Ratepayers’ tax appeals must be presented to the City’s customer services unit and only as a last
resort may be directed to the relevant line department for investigation and correction.
Dimension rating = C
PI-13 Scoring Method M2
Transparency of Taxpayer
Obligations and Liabilities
B
(i) Clarity and comprehensiveness of tax liabilities
A Legislation and policy for the property rates are
comprehensive and clear. In general, these
obligations and liabilities are published to the
general public.
(ii) Taxpayer access to information on tax
C The availability and comprehensiveness of the
administrative procedures for property rates are

42
PI-13 Scoring Method M2
liabilities and administrative procedures
limited.
(iii) Existence and functioning of a tax appeals mechanism
C A tax appeal system of administrative procedures exists, but needs substantial redesign to be fair, transparent and effective.
PI-14: Effectiveness of measures for taxpayer registration and tax assessment
(i) Controls in the taxpayer registration system
The CoT’s tax receipts are in the form of property rates (PI-13 above).
The owner of a property (business or residential) is liable to pay rates on the property, and, as the
registration process does not automatically coincide with an application for water and electricity
services, there is no control measure built into the system that requires the system operator to double
check whether the applicant for these services has also to register for property tax. Similarly, a
clearance certificate is required when a property is sold, but there is no follow-up to ensure that the
new owner actually registers for property rates. Registration for sanitation services and refuse
removal are linked to the registration for property rates. Should a new owner not register for property
rates, sanitation and refuse removal services generally continue, thus contributing to the accumulation
of debts.
The CoT occasionally performs checks on ratepayers’ accounts, including verification of ownership
when discrepancies are identified, followed-up and corrected.
Dimension rating = C
(ii) Effectiveness of penalties for non-compliance with registration and declaration obligations
In terms of the Municipality’s by-laws, tariff policy as well as credit control and debt collection policy,
penalties may be charged for failure to register for property rates. The penalties are incurred
automatically from the date of non-compliance and remain on the billing system until settled. The
amount of such penalties is based on a formula and is considered to be high enough to serve as a
deterrent. The Municipality however has limited capacity to follow-up on defaulters and it is only
occasional checks on ratepayers’ accounts that result in compliance.
Dimension rating = C
(iii) Planning and monitoring of tax audit and fraud investigation programmes
CoT’s Internal Audit Unit prepares risk-based audit plans. Except for the periodic checks on
ratepayers’ accounts for compliance to tax liabilities, there has not been a tax audit or fraud
prevention investigation during the three years under review.
Dimension rating = D
PI-14 Scoring Method M2
Effectiveness of measures for taxpayer registration and tax assessment
D+
(i) Controls in the taxpayer registration system
C Ratepayers are registered in a database system for
individual purposes, which are not fully and
consistently linked. There are no linkages between
the various registration functions, but are
supplemented by occasional surveys of potential
43
PI-14 Scoring Method M2
ratepayers.
(ii) Effectiveness of penalties for non-compliance with registration and declaration obligations
C The provision for penalties against possible defaulters
for rates and taxes and financial rules exist, but
effectiveness is generally lacking due to weak
administrative and internal control systems.
(iii) Planning and monitoring of tax audit and fraud investigation programmes
D An audit of rates and taxes has not taken place during the period under review.
PI-15: Effectiveness in collection of tax payments
(i) Collection ratio for gross tax arrears, being the percentage of tax arrears at the beginning of a
fiscal year, which was collected during that fiscal year (average of the last two fiscal years)
Note 22 to the (Audited) Consolidated Financial Statements for 2012/13 and 2013/14 provide data on
debtors, which show overall collection rates of 94% on all types of revenues, and that in total debtors
are increased by 12% in the last completed year. However, the data does not allow the calculation
required by this dimension to be completed.
Dimension rating = NR
(ii) Effectiveness of transfer of tax collections to the Treasury by the revenue administration
The CoT endeavours to make the payment of rates as convenient as possible for ratepayers, and has
partnered with various credible institutions that have large footprints across the Municipality to receive
tax revenues on its behalf. These revenues received by other institutions are paid over into the CoT’s
bank accounts on a daily basis. Ratepayers may also pay rates and taxes by means of electronic
funds transfer directly into the CoT’s accounts at all the major commercial banks.
Dimension rating = A
(iii) Frequency of complete accounts reconciliation between tax assessments, collections, arrears
records and receipts by the Treasury
Although CoT uses the SAP system for billing, not all the Modules have been implemented, which
results in payments made by ratepayers not being credited to their accounts automatically. The DFS
has implemented a procedure whereby an electronic file from the daily receipts in each bank account
is prepared and the information transferred to SAP on a daily basis. This electronic file and interface
makes provision for exception reports e.g. a payment reference that cannot be matched with the SAP
unique account electronically. The exceptions are then investigated and resolved to ensure the
payment is allocated to the correct account. The CoT’s credit control and debt collection policy
stipulates that any payments received will first be utilised for any arrears due, beginning with the
oldest. However complete reconciliation of tax assessments, collections, arrears and transfers to the
CoT Treasury takes place annually with the compilation of the annual financial statements.
Dimension rating = C
PI-15 Scoring Method M1
Effectiveness in collection of tax payments
NR
(i) Collection ratio for gross tax arrears, being the percentage of tax arrears at the beginning of a fiscal year, which was collected during that fiscal
NR The average debt collection ratio in respect of
property rates in the two most recent fiscal years was
above 90%.
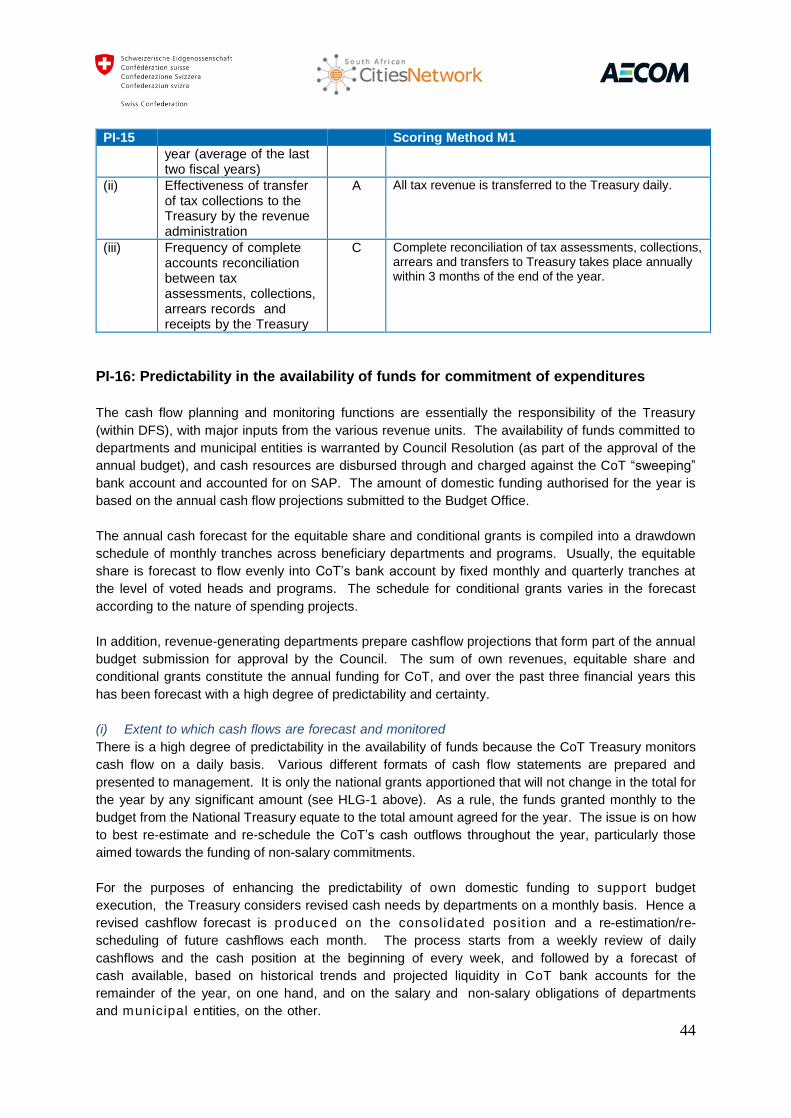
44
PI-15 Scoring Method M1
year (average of the last two fiscal years)
(ii) Effectiveness of transfer of tax collections to the Treasury by the revenue administration
A All tax revenue is transferred to the Treasury daily.
(iii) Frequency of complete accounts reconciliation between tax assessments, collections, arrears records and receipts by the Treasury
C Complete reconciliation of tax assessments, collections, arrears and transfers to Treasury takes place annually within 3 months of the end of the year.
PI-16: Predictability in the availability of funds for commitment of expenditures
The cash flow planning and monitoring functions are essentially the responsibility of the Treasury
(within DFS), with major inputs from the various revenue units. The availability of funds committed to
departments and municipal entities is warranted by Council Resolution (as part of the approval of the
annual budget), and cash resources are disbursed through and charged against the CoT “sweeping”
bank account and accounted for on SAP. The amount of domestic funding authorised for the year is
based on the annual cash flow projections submitted to the Budget Office.
The annual cash forecast for the equitable share and conditional grants is compiled into a drawdown
schedule of monthly tranches across beneficiary departments and programs. Usually, the equitable
share is forecast to flow evenly into CoT’s bank account by fixed monthly and quarterly tranches at
the level of voted heads and programs. The schedule for conditional grants varies in the forecast
according to the nature of spending projects.
In addition, revenue-generating departments prepare cashflow projections that form part of the annual
budget submission for approval by the Council. The sum of own revenues, equitable share and
conditional grants constitute the annual funding for CoT, and over the past three financial years this
has been forecast with a high degree of predictability and certainty.
(i) Extent to which cash flows are forecast and monitored
There is a high degree of predictability in the availability of funds because the CoT Treasury monitors
cash flow on a daily basis. Various different formats of cash flow statements are prepared and
presented to management. It is only the national grants apportioned that will not change in the total for
the year by any significant amount (see HLG-1 above). As a rule, the funds granted monthly to the
budget from the National Treasury equate to the total amount agreed for the year. The issue is on how
to best re-estimate and re-schedule the CoT’s cash outflows throughout the year, particularly those
aimed towards the funding of non-salary commitments.
For the purposes of enhancing the predictability of own domestic funding to support budget
execution, the Treasury considers revised cash needs by departments on a monthly basis. Hence a
revised cashflow forecast is produced on the consolidated posit ion and a re-estimation/re-
scheduling of future cashflows each month. The process starts from a weekly review of daily
cashflows and the cash position at the beginning of every week, and followed by a forecast of
cash available, based on historical trends and projected liquidity in CoT bank accounts for the
remainder of the year, on one hand, and on the salary and non-salary obligations of departments
and municipal entities, on the other.
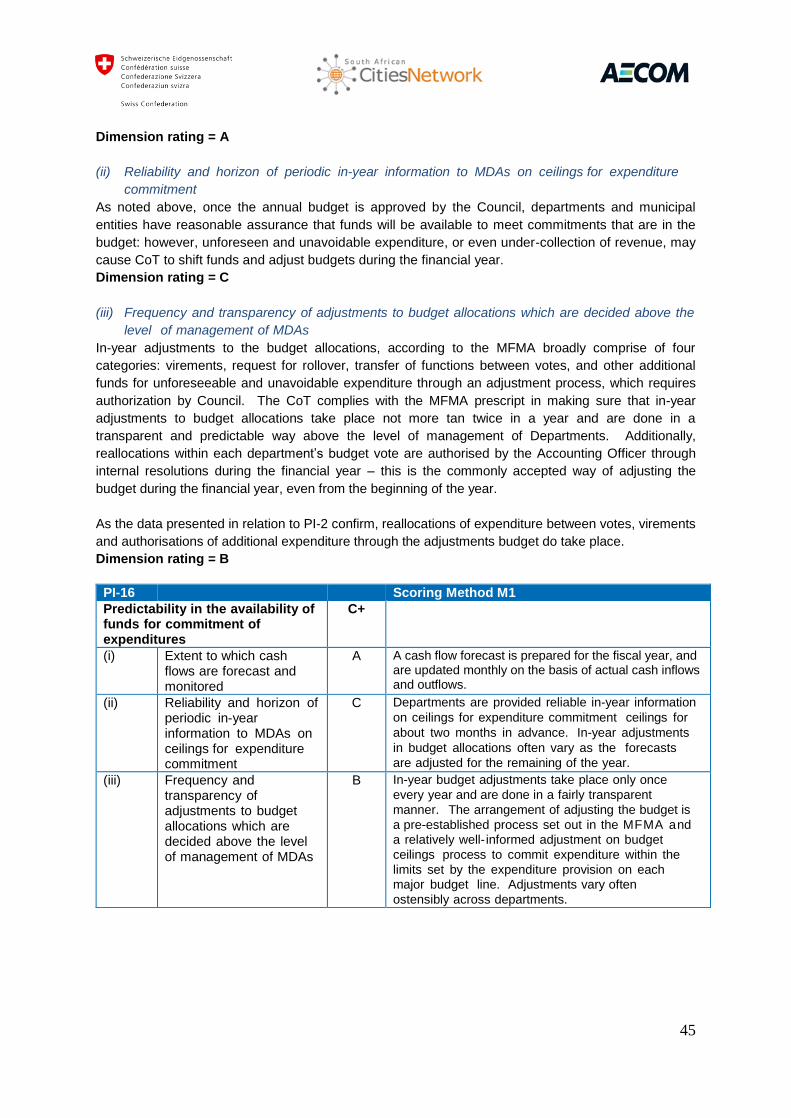
45
Dimension rating = A
(ii) Reliability and horizon of periodic in-year information to MDAs on ceilings for expenditure
commitment
As noted above, once the annual budget is approved by the Council, departments and municipal
entities have reasonable assurance that funds will be available to meet commitments that are in the
budget: however, unforeseen and unavoidable expenditure, or even under-collection of revenue, may
cause CoT to shift funds and adjust budgets during the financial year.
Dimension rating = C
(iii) Frequency and transparency of adjustments to budget allocations which are decided above the
level of management of MDAs
In-year adjustments to the budget allocations, according to the MFMA broadly comprise of four
categories: virements, request for rollover, transfer of functions between votes, and other additional
funds for unforeseeable and unavoidable expenditure through an adjustment process, which requires
authorization by Council. The CoT complies with the MFMA prescript in making sure that in-year
adjustments to budget allocations take place not more tan twice in a year and are done in a
transparent and predictable way above the level of management of Departments. Additionally,
reallocations within each department’s budget vote are authorised by the Accounting Officer through
internal resolutions during the financial year – this is the commonly accepted way of adjusting the
budget during the financial year, even from the beginning of the year.
As the data presented in relation to PI-2 confirm, reallocations of expenditure between votes, virements
and authorisations of additional expenditure through the adjustments budget do take place.
Dimension rating = B
PI-16 Scoring Method M1
Predictability in the availability of funds for commitment of expenditures
C+
(i) Extent to which cash flows are forecast and monitored
A A cash flow forecast is prepared for the fiscal year, and are updated monthly on the basis of actual cash inflows and outflows.
(ii) Reliability and horizon of periodic in-year information to MDAs on ceilings for expenditure commitment
C Departments are provided reliable in-year information
on ceilings for expenditure commitment ceilings for
about two months in advance. In-year adjustments
in budget allocations often vary as the forecasts
are adjusted for the remaining of the year.
(iii) Frequency and transparency of adjustments to budget allocations which are decided above the level of management of MDAs
B In-year budget adjustments take place only once
every year and are done in a fairly transparent
manner. The arrangement of adjusting the budget is
a pre-established process set out in the MFMA and
a relatively well- informed adjustment on budget
ceilings process to commit expenditure within the
limits set by the expenditure provision on each
major budget line. Adjustments vary often
ostensibly across departments.

46
PI-17: Recording and management of cash balances, debt and guarantees
Municipalities are allowed to contract loans to finance its programmes and projects in line with IDPs,
the SDBIP and the MTREF. This contracting of loans must be in line with the overall financial position
and based on sound financial management.
The CoT’s approach is to present the overall financial position of the Municipality to Council on a
monthly basis, and the option of contracting loans is considered only once a year with a holistic view
of the City’s financial position. The City’s policy is not to provide guarantees
(i) Quality of debt data recording and reporting
In line with Chapter 6 of the MFMA the CoT does not incur debt without a Council Resolution signed
by the Mayor. Once the debt agreement (in accordance with the resolution) has been approved, the
debt is recorded in a register. The information in the register enables the CoT to comply with all
monthly financial reporting requirements of the MFMA, including GRAP disclosures in the AFS.
Dimension rating = A
(ii) Extent of consolidation of the government’s cash balances
The availability of funds committed to departments and municipal entities is included in the approved
budget and cash resources are disbursed through and charged against the CoT “sweeping” bank
account and accounted for on SAP. The revenues received by other institutions (PI-15) are paid over
into CoT’s bank accounts on a daily basis. Ratepayers may also pay rates and taxes by means of
electronic funds transfer directly into the CoT’s bank accounts with all major commercial banks.
These bank accounts are consolidated on a daily basis.
Dimension rating = A
(iii) Systems for contracting loans and issuance of guarantees
The CoT has taken a policy decision not to issue guarantees. Council approval for contracting loans,
considering the overall financial position of the municipality, is sought only once a year and covers the
limits of total debt.
Dimension rating = B
PI-17 Scoring Method M2
Recording and management of cash balances, debt and guarantees
A
(i) Quality of debt data recording and reporting
A Debt records are complete, updated and reconciled on a monthly basis with data considered of high integrity. Comprehensive management and statistical reports are produced monthly.
(ii) Extent of consolidation of the government’s cash balances
A All cash balances are calculated daily and consolidated.
(iii) Systems for contracting loans and issuance of guarantees
B CoT doesn’t issue guarantees and its contracting of
loans are made within limits for total debt, and always approved by Council.
PI-18: Effectiveness of payroll controls
Personnel costs account for the largest component of operating expenditure in municipalities in the
Republic of South Africa. At an aggregate level, about 30 per cent of the total municipal operating

47
budget gets spent on the remuneration of personnel. This rate varies among municipalities, depending
on the extent to which they may have outsourced some of their service delivery functions, or whether
they are responsible for the large revenue generating functions or not. In CoT the remuneration of
personnel averaged 26,3 per cent of the total operating budget (see Table 2.2), which is below the
ceiling set by the Restructuring Grant, although there is a corresponding increase in CoT’s vacancy
rates, which indicates the decline in employment resulted from a deliberate policy of not filling certain
positions when they became vacant due to normal staff turnover and retirements. This was one of the
measures adopted by CoT to improve its cash flow situation.
However, the extent to which this expenditure represents value for money for the communities
municipalities serve remains in question. This is why measuring and managing the performance of
municipalities, and by implication, the performance of municipal employees, is critical. The Municipal
Systems Amendment Act (2011) came into effect on 5 July 2011. This Act seeks to address the
appointment and competencies of municipal managers and managers directly accountable to the
municipal manager (S57 managers), regulating the employment of municipal employees who have
been dismissed or are subject to disciplinary processes by other municipalities, regulating the duties,
remuneration, benefits and other terms and conditions of employment for municipal managers and S57
managers.
(i) Degree of integration and reconciliation between personnel records and payroll data
The CoT uses a manual system whereby HR Support Managers placed within the departments
maintain personnel records for dispatch to the head office where the personnel database is updated
before the payroll can be updated. Although heads of department are required the certify the
correctness of the personnel records of their staff every month, the manual system and the large
number of employees makes the reconciliation of personnel records and the payroll data close to
impossible.
Dimension rating = D
(ii) Timeliness of changes to personnel records and the payroll
The fact that the CoT uses a manual system to update personnel records and the payroll complicates
the possibility to measure how long it takes for these records to be updated on the payroll. The only
measure is the large amount of retroactive transactions on the payroll.
Dimension rating = D
(iii) Internal control of changes to personnel records and the payroll
The use of the manual system to update personnel records increases the risk to the integrity of the
data. The fact that promotions are not aligned to any performance management structure or scaled up
to specific professional and technical qualifications across the salary system is a cause for concern
and internal controls for promoting personnel is a potential area for improvement. The CoT uses
exception reports and maintains additional internal controls to prevent payment errors.
Dimension rating = C
(iv) Existence of payroll audits to identify control weaknesses and/or ghost workers
CoT’s salary bill for the past three fiscal years represents on average 22% of total expenditure. All
departments make use of a monthly payroll certification that is reported to the head office. Attendance
of personnel is for the most part subject to improvement although management information on this
could not be provided. The OAG conducts a complete Payroll Audit each year and no adverse
comments were included in the report.
Dimension rating = A
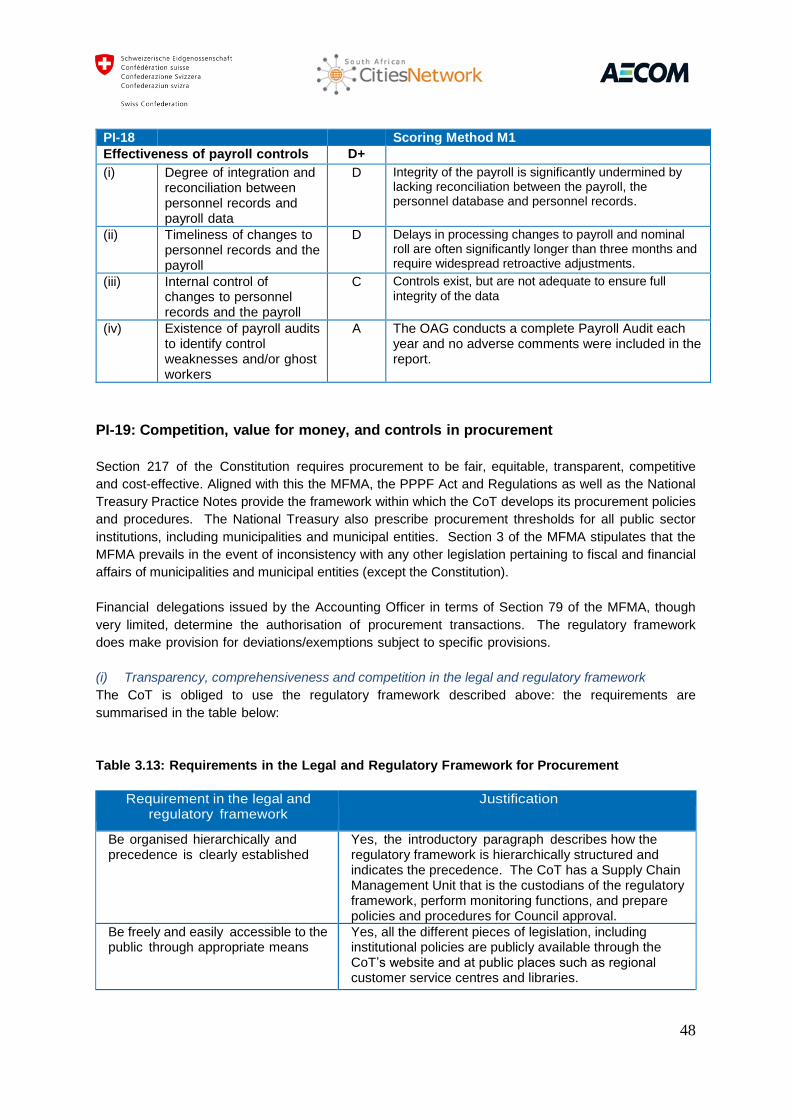
48
PI-18 Scoring Method M1
Effectiveness of payroll controls D+
(i) Degree of integration and reconciliation between personnel records and payroll data
D Integrity of the payroll is significantly undermined by lacking reconciliation between the payroll, the personnel database and personnel records.
(ii) Timeliness of changes to personnel records and the payroll
D Delays in processing changes to payroll and nominal roll are often significantly longer than three months and require widespread retroactive adjustments.
(iii) Internal control of changes to personnel records and the payroll
C Controls exist, but are not adequate to ensure full
integrity of the data
(iv) Existence of payroll audits to identify control weaknesses and/or ghost workers
A The OAG conducts a complete Payroll Audit each year and no adverse comments were included in the report.
PI-19: Competition, value for money, and controls in procurement
Section 217 of the Constitution requires procurement to be fair, equitable, transparent, competitive
and cost-effective. Aligned with this the MFMA, the PPPF Act and Regulations as well as the National
Treasury Practice Notes provide the framework within which the CoT develops its procurement policies
and procedures. The National Treasury also prescribe procurement thresholds for all public sector
institutions, including municipalities and municipal entities. Section 3 of the MFMA stipulates that the
MFMA prevails in the event of inconsistency with any other legislation pertaining to fiscal and financial
affairs of municipalities and municipal entities (except the Constitution).
Financial delegations issued by the Accounting Officer in terms of Section 79 of the MFMA, though
very limited, determine the authorisation of procurement transactions. The regulatory framework
does make provision for deviations/exemptions subject to specific provisions.
(i) Transparency, comprehensiveness and competition in the legal and regulatory framework
The CoT is obliged to use the regulatory framework described above: the requirements are
summarised in the table below:
Table 3.13: Requirements in the Legal and Regulatory Framework for Procurement
Requirement in the legal and regulatory framework
Justification
Be organised hierarchically and precedence is clearly established
Yes, the introductory paragraph describes how the regulatory framework is hierarchically structured and indicates the precedence. The CoT has a Supply Chain Management Unit that is the custodians of the regulatory framework, perform monitoring functions, and prepare policies and procedures for Council approval.
Be freely and easily accessible to the public through appropriate means
Yes, all the different pieces of legislation, including institutional policies are publicly available through the CoT’s website and at public places such as regional customer service centres and libraries.

49
Requirement in the legal and regulatory framework
Justification
Apply to all procurement undertaken using government funds
Yes, the regulatory framework described above applies to all procurement where public funds are used. This regulatory framework also comes under scrutiny when CoT is audited every year.
Make open competitive procurement the default method of procurement and define clearly the situations in which other methods can be used and how this is to be justified
Yes, the regulatory framework provides clear and specific thresholds that apply to different open methods of procurement. The policies also include specific prescripts and control measures where deviations from the legislation are justified to be approved by Accounting Officers, reported and disclosed. There may be some improvements and refinement required if the Auditor-General’s report on irregular expenditure is considered.
Provide for public access to all of the following procurement information: government procurement plans, bidding opportunities, contract awards, and data on resolution of procurement complaints
No, bidding opportunities and contracts awarded are advertised in the local media and on the CoT’s website. Although departments prepare procurement plans before the start of every financial year, these plans are not made available publicly.
Provide for an independent administrative procurement review process for handling procurement complaints by participants prior to contract signature
No, the CoT does not have an independent procurement complaints body. No no-contract signing period is prescribed between award and signature. Applications for access to information are generally dealt with outside of the procurement process, unless flaws are dealt with through the judicial system.
CoT generally has a centralised approach to procurement and the system of financial delegation
generally requires some improvement. This leads to a lack of transparency within departments that
filters down to projects and cost centres, and ultimately to suppliers. In turn it affects the competition
and the figures in support of large amounts of irregular expenditure emphasise this.
Dimension rating = B
(ii) Use of competitive procurement methods
Sizeable amounts of irregular expenditure appear in the Auditor General’s Reports for each of the last
three fiscal years. Yet CoT officials could not provide information on the justification for deviating from
competitive procurement methods. There is no established process and/or system to record cases
where departments deviated from the procurement policy and process.
Dimension rating = D
(iii) Public access to complete, reliable and timely procurement information
CoT does not make procurement plans available to the general public. Only open tenders above the
threshold of R30,000 are advertised. The local media, CoT website and public places are used as the
recognised media of communication. Contract awards are also advertised on the website.
Dimension rating = C
(iv) Existence of an independent administrative procurement complaints system
Officials in CoT’s Supply Chain Management Unit handles all queries related to procurement. These
officials, however, do not necessarily have knowledge and experience of the regulatory framework and

50
challenges that the different departments face. Further, they are not independent and do not have any
authority to suspend the procurement process or issue decisions that are binding on all parties.
Dimension rating = D
PI-19 Scoring Method M2
Competition, value for money, and controls in procurement
D+
(i) Transparency, comprehensiveness and competition in the legal and regulatory framework
B CoT meets four of the six criteria for the legal and
regulatory framework for procurement.
(ii) Use of competitive procurement methods
D Reliable data on deviations with reasons, from open
competition, could not be provided.
(iii) Public access to complete, reliable and timely procurement information
C The CoT makes bidding opportunities and contracts awarded public.
(iv) Existence of an independent administrative procurement complaints system
D CoT does not have an independent procurement
complaints review body.
PI-20: Effectiveness of internal controls for non-salary expenditure
Various sections of the MFMA and the Treasury Regulations provide the framework for internal
controls over expenditure and cash management, and S60 stipulates that the Municipal Manager is to
be the Accounting Officer: she/he is responsible for ensuring that expenditure is appropriately
incurred, paid for, accurately reported and recorded.
The Financial Management & Accounting Procedures Manual issued in April 2003 sets out the
accounting policies and procedures adopted within the CoT, although some of these procedures may
be out-dated. While the majority of procedures are complied with, both internal audit and Auditor
General reports (over the years) note incidences of under or over expenditure by departments as well
as irregularities due to non-compliance with internal controls (rules and procedures): evidence which
raises concerns on the application of controls in some transactions.
(i) Effectiveness of expenditure commitment controls
Commitment ceilings apply for the whole year, and each department is required to submit an annual
pro-forma cashflow statement. Procurement plans are also produced, but these are not precisely
linked to cashflow projections. Expenditure commitment begins with the issuance of a purchase order
by the head of unit within a department, which is then approved by the Accounting Officer: this can
only happen after the Council has approved the annual budget and it has been loaded into the
accounting system. The SAP software used across CoT has an in-built control mechanism that limits
commitments to the approved budget. Expenditure spikes are typically experienced in the final
months of the financial year, particularly in respect of CAPEX. Nevertheless, each year the Council is
requested to approve significant amounts of unauthorised expenditure (2013/14 R896m,
approximately 4% of budgeted expenditure).
Dimension rating = C
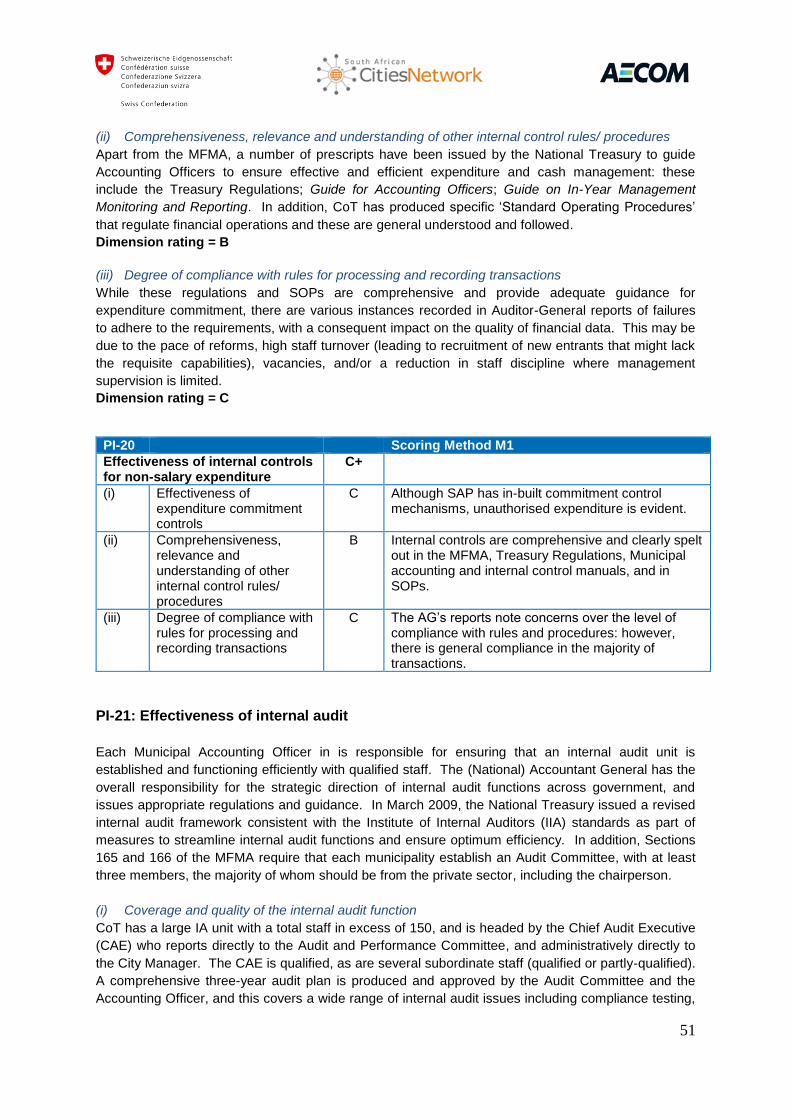
51
(ii) Comprehensiveness, relevance and understanding of other internal control rules/ procedures
Apart from the MFMA, a number of prescripts have been issued by the National Treasury to guide
Accounting Officers to ensure effective and efficient expenditure and cash management: these
include the Treasury Regulations; Guide for Accounting Officers; Guide on In-Year Management
Monitoring and Reporting. In addition, CoT has produced specific ‘Standard Operating Procedures’
that regulate financial operations and these are general understood and followed.
Dimension rating = B
(iii) Degree of compliance with rules for processing and recording transactions
While these regulations and SOPs are comprehensive and provide adequate guidance for
expenditure commitment, there are various instances recorded in Auditor-General reports of failures
to adhere to the requirements, with a consequent impact on the quality of financial data. This may be
due to the pace of reforms, high staff turnover (leading to recruitment of new entrants that might lack
the requisite capabilities), vacancies, and/or a reduction in staff discipline where management
supervision is limited.
Dimension rating = C
PI-20 Scoring Method M1
Effectiveness of internal controls for non-salary expenditure
C+
(i) Effectiveness of expenditure commitment controls
C Although SAP has in-built commitment control mechanisms, unauthorised expenditure is evident.
(ii) Comprehensiveness, relevance and understanding of other internal control rules/ procedures
B Internal controls are comprehensive and clearly spelt out in the MFMA, Treasury Regulations, Municipal accounting and internal control manuals, and in SOPs.
(iii) Degree of compliance with rules for processing and recording transactions
C The AG’s reports note concerns over the level of compliance with rules and procedures: however, there is general compliance in the majority of transactions.
PI-21: Effectiveness of internal audit
Each Municipal Accounting Officer in is responsible for ensuring that an internal audit unit is
established and functioning efficiently with qualified staff. The (National) Accountant General has the
overall responsibility for the strategic direction of internal audit functions across government, and
issues appropriate regulations and guidance. In March 2009, the National Treasury issued a revised
internal audit framework consistent with the Institute of Internal Auditors (IIA) standards as part of
measures to streamline internal audit functions and ensure optimum efficiency. In addition, Sections
165 and 166 of the MFMA require that each municipality establish an Audit Committee, with at least
three members, the majority of whom should be from the private sector, including the chairperson.
(i) Coverage and quality of the internal audit function
CoT has a large IA unit with a total staff in excess of 150, and is headed by the Chief Audit Executive
(CAE) who reports directly to the Audit and Performance Committee, and administratively directly to
the City Manager. The CAE is qualified, as are several subordinate staff (qualified or partly-qualified).
A comprehensive three-year audit plan is produced and approved by the Audit Committee and the
Accounting Officer, and this covers a wide range of internal audit issues including compliance testing,

52
IT-based systems audit, payroll and procurement: the plans focuses attention of systemic issues. The
audit methodology is informed by IIA standards and practices, and a large proportion of the staff
compliment is actively pursuing professional qualifications.
Dimension rating = B
(ii) Frequency and distribution of reports
Sections 60 and 61 of the MFMA define the general responsibilities of an Accounting Officer, and
state that she/he is responsible for ensuring that all internal controls and internal audit systems are in
place in order to provide an environment of efficient, effective and transparent financial risk
management. The internal audit unit produces quarterly internal audit reports within two weeks of the
end of each quarter, and raises issues of concern such as systemic failures, non-adherence to
compliance rules and regulations. Quarterly reports are distributed to the Audit Committee, the
Accounting Officer, the head of the relevant department, the CFO and the Auditor-General (who is
represented on the Audit Committee).
Dimension rating = A
(iii) Extent of management response to internal audit findings
The establishment of an Audit Committee (which has 11 members) is designed to ensure that audit
findings and recommendations are implemented (S166 of the MFMA). However, there is little
evidence of follow up to the recommendations in the reports issued by internal audit, except to note
that the Auditor-General – who does not rely on work of internal audit – normally follow up on the
recommendations during the external audit process (the Auditor-General's annual report also reflects
a slow management response to audit findings and recommendations).
Dimension rating = C
PI-21 Scoring Method M1
Effectiveness of internal audit C+
(i) Coverage and quality of the internal audit function
B Internal audit is operational, and focuses on processes. Internal audit manuals and procedures follow Institute of Internal Audit (IIA) standards.
(ii) Frequency and distribution of reports
A At the conclusion of each audit, a report is sent to the auditee, the CFO, and the Municipal Manager. In addition, a quarterly report is prepared for the Audit Committee, and this is copied to the Auditor-General.
(iii) Extent of management response to internal audit findings
C Management response to audit findings is limited, and not all managers respond to queries raised.

53
3.5 Accounting, recording and reporting
The indicators in this group deal with a number of accounting issues, all of which are closely
prescribed in the MFMA and associated regulations: the evidence gathered demonstrates that the
various prescriptions are followed.
PI-22: Timeliness and regularity of accounts reconciliation
Reliable reporting of financial information requires constant checking and verification of the recording
practices of accountants. This is an important part of internal control and a foundation for good
quality information for management and for external reports. Timely and frequent reconciliation of
data from different sources is fundamental for data reliability. Two critical types of reconciliation are:
(i) reconciliation of accounting data held in CoT’s books, with bank account data held by commercial
banks, and (ii) regularity of reconciliation and clearance of suspense accounts and advances.
(i) Regularity of bank reconciliations
Section 7 of the MFMA provides the legal framework for the banking arrangements of Municipalities,
and these are supplemented by Treasury Regulations that include a requirement that each
Accounting Officer ensures a daily reconciliation of movement in cash and bank balances.
As part of the ‘Section 71’ Reports required by the MFMA, the National Treasury prepares and
publishes a statement of national revenue and expenditure as well as that of loans, extraordinary
payments & receipts and closing cash balances.
CoT has 38 Bank accounts: 35 for revenue, two (‘Main Accounts’) for revenue and expenditure, and
one for expenditure. Of these, a number are ‘ring-fenced’ for e.g. specific grants received from
National Government. All these core accounts are reconciled daily, and the others accounts (which
are immaterial or dormant) are reconciled at the end of the financial year.
Dimension rating = A
(ii) Regularity of reconciliation and clearance of suspense accounts and advances
Suspense accounts mainly result from advances to employees for official travel or to carry out official
duties, and according to Section 17.1 of the Treasury Regulations the Accounting Officer is to ensure
that all advances are acquitted and reconciled monthly to allow for the preparation of monthly financial
statements, by way of proper allocation of each element to the proper cost centre.
Suspense accounts and advances can be divided as follows:
Cash advances to staff, which are acquitted monthly;
Departmental suspense accounts, which are reconciled monthly and 30 days after the end of the
financial years to allow for the preparation of the AFS;
Suspense accounts for unallocated receipts, which are reconciled each month.
Dimension rating = A
PI-22 Scoring Method M2
Timeliness and regularity of accounts reconciliation
A
(i) Regularity of Bank reconciliations
A All Municipal bank accounts are reconciled daily.
(ii) Regularity of reconciliation and clearance of suspense
A Cash advance to staff are acquitted monthly. Suspense accounts are reconciled each month. At

54
PI-22 Scoring Method M2
accounts and advances the end of the FY, all departmental suspense accounts are reconciled within 30 day.
PI-23: Availability of information on resources received by service delivery units
The SAP software and chart of accounts are capable of and do actually capture financial information
on resources in both cash and kind to the level of service delivery units such as primary health clinics.
In addition, the monthly, quarterly and annual financial and performance evaluation reports prepared
by Provinces – which include data from their Municipalities – are submitted electronically to the
National Treasury and consolidated into reports (“Provincial Budgets and Expenditure Reports”) that
detail the resources received and expended by primary service delivery units.
PI-23 Scoring Method M1
Availability of information on resources received by service delivery units
A The SAP software and the chart of accounts allow financial information on resources in cash and kind, to be captured at the level of, for example, primary health clinics.
PI-24: Quality and timeliness of in-year budget reports
The ability to monitor budget execution requires timely and regular information on actual budget in
relation to outcome; this information should be available both to the DFS, to monitor performance, and
if necessary to identify new actions to get the budget back on track, and to spending departments to
manage the operations for which they are accountable. The division of responsibility between the
DFS and spending departments in the preparation of the reports will depend on the type of accounting
and payment system in operation. At it’s most basic, the role of the DFS may simply be to
consolidate the reports provided by departments from their accounting records.
The regulatory framework governing in-year budget execution reports is specified in Section 71 of the
MFMA. Each municipality must furnish these reports to the Provincial Treasury within 10 days of the
close of the preceding month: these reports are then published in the Government Gazette. The
reports provide information on the current period and year to date, and compare budgets to actuals
showing variations, in a standardised reporting format prescribed by the National Treasury. The
format for the monthly management statements prepared by departments for submission to DFS
contains all the necessary information required in this indicator: i.e. original budget, approved
supplementary allocations, reallocations, expenditure-to-date, outstanding commitments, total spent
and committed, projected expenditure to end-of –year and projected percentage variance. The data
itself is presented as in the budget i.e. by vote and item of expenditure (economic).
(i) Scope of reports in terms of coverage and compatibility with budget estimates
Ideally, an accounting system should be able to produce accurate and comprehensive reports that are
consistent with the budget at both the commitment and payment stages: however, the SAP system
used in CoT does not include expenditure commitments in these reports.
Dimension rating = C

55
(ii) Timeliness of the issue of reports
Over the assessment period, the monthly and quarterly in-year budget execution reports produced by
CoT did meet the reporting deadline set out in the MFMA: i.e. within 10 days of the end of the period.
Dimension rating = A
(iii) Quality of information
As noted in PI-22, the reconciliation of cashbooks and general ledger entries to the bank statements
is evidenced and a fundamental process for the preparation of monthly and quarterly financial reports.
The SAP application that runs across the Municipality facilitates the recording and reconciliation of
financial data. In spite of these measures, the Auditor General noted concerns about data accuracy –
including material misstatements – in the annual audit reports for each of the last three fiscal years:
while this comment relates to the annual financial statements submitted for audit, it brings into
question the accuracy of the monthly and quarterly in-year budget execution reports.
Dimension rating = C
PI-24 Scoring Method M1
Quality and timeliness of in-year budget reports
C+
(i) Scope of reports in terms of coverage and compatibility with budget estimates
C In-year budget execution reports (‘S71’) are prepared in accordance with the standardised reporting format specified in the MFMA and allow for easy budget analysis; however, the only payments are captured, not commitments.
(ii) Timeliness of the issue of reports
A In-year budget reports are prepared on a monthly basis in accordance with the MFMA and submitted within 10 working days of the month end to the Executive Mayor, the National Treasury (in electronic format), and on a quarterly basis to Council: they are also published on the website.
(iii) Quality of information C The Auditor General has raised concerns about the quality of financial information; they do not compromise the general usefulness of the financial information.
PI-25: Quality and timeliness of annual financial statements
Accounting and reporting arrangements are governed by the MFMA, the Treasury Regulations 2005,
the Guidelines for Implementing the Economic Reporting Format (ERF), the Departmental Financial
Reporting Framework Guide (2012) and annual Report Guides. The (National) Office of the
Accountant General prescribes government accounting policies and practices to ensure compliance
with the standards of Generally Recognized Accounting Practice (GRAP), issued by the Accounting
Standards Board.
The latest annual financial statements are for FY 2013/14, and include an executive summary, a
review of operating results, the report of the Auditor General, consolidated statements of financial
performance, financial position, changes in net assets, and cash flow, plus accounting policies, and
notes to the accounts: the statements are prepared on an accrual-basis.
(i) Completeness of the financial statements
The CoT accounts show revenue and expenditure in the same detail as in the budget (both original
and (mid-year) adjustments budget), as well as details of all assets and liabilities – all in accordance

56
with statements of GRAP. Comparisons are made with the previous year, and previous year data are
adjusted for changes in responsibilities.
Dimension rating = A
(ii) Timeliness of submission of financial statements
The Chief Financial Officer prepares the financial statements and submits them to the Auditor General
within two months of the year end as required by the MFMA: i.e. by 31 August.
Dimension rating = A
(iii) Accounting Standards used
The Financial Statements of CoT are produced in accordance with the various standards issued by
the Accounting Standards Board and approved for implementation by the Minister of Finance: any
deviations from these requirements are disclosed in the AFS.
Dimension rating = A
PI-25 Scoring Method M1
Quality and timeliness of annual financial statements
A
(i) Completeness of the financial statements
A The annual Consolidated Financial Statements include full information on revenue, expenditure, financial assets, and liabilities.
(ii) Timeliness of submission of the financial statements
A Consolidated Financial Statements are submitted to the Auditor General within 2 months of the end of the fiscal year, in accordance with the MFMA.
(iii) Accounting standards used
A Tshwane’s AFS disclose and observe the financial reporting standards of the Accounting Standards Board of South Africa, based on IPSAS.
3.6 External scrutiny and audit
The indicators in this group are concerned with the extent to which oversight arrangements – mostly
at the end of the budget cycle – are in place and effective.
PI-26: Scope, nature and follow-up of external audit
Public sector auditing is a crucial element of an effective accountability framework. Key elements of
an effective external audit function include whether external audit: (i) is adequately empowered – i.e.
authority exists to obtain necessary information and the scope of audit covers the full public sector; (ii)
adheres to appropriate auditing standards (INTOSAI, IFAC) and focuses on significant and systemic
PFM issues in its reports; and (iii) covers the full range of financial audit, including reliability of
financial statements, regularity of transactions and functioning of the internal control system.
The Office of the Auditor-General of South Africa (AGSA) derives its independence, powers and
mandate from the Constitution (Section 188) and the Public Audit Act 2004 (PAA), and is required to
audit all thee spheres of government. In the case of Municipalities, the Auditor-General audits and
reports on their financial and performance statements, as well as majority-owned companies receiving
funds from the Municipal budget: audit reports are submitted to the Municipal Council.
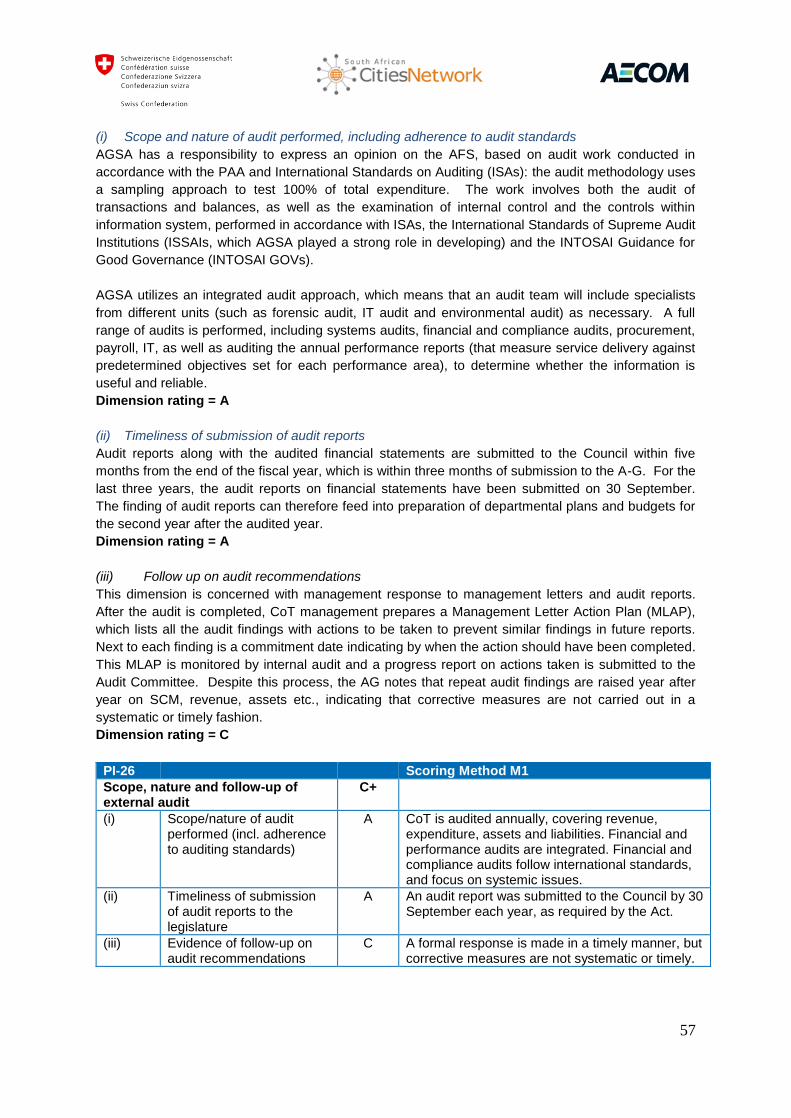
57
(i) Scope and nature of audit performed, including adherence to audit standards
AGSA has a responsibility to express an opinion on the AFS, based on audit work conducted in
accordance with the PAA and International Standards on Auditing (ISAs): the audit methodology uses
a sampling approach to test 100% of total expenditure. The work involves both the audit of
transactions and balances, as well as the examination of internal control and the controls within
information system, performed in accordance with ISAs, the International Standards of Supreme Audit
Institutions (ISSAIs, which AGSA played a strong role in developing) and the INTOSAI Guidance for
Good Governance (INTOSAI GOVs).
AGSA utilizes an integrated audit approach, which means that an audit team will include specialists
from different units (such as forensic audit, IT audit and environmental audit) as necessary. A full
range of audits is performed, including systems audits, financial and compliance audits, procurement,
payroll, IT, as well as auditing the annual performance reports (that measure service delivery against
predetermined objectives set for each performance area), to determine whether the information is
useful and reliable.
Dimension rating = A
(ii) Timeliness of submission of audit reports
Audit reports along with the audited financial statements are submitted to the Council within five
months from the end of the fiscal year, which is within three months of submission to the A-G. For the
last three years, the audit reports on financial statements have been submitted on 30 September.
The finding of audit reports can therefore feed into preparation of departmental plans and budgets for
the second year after the audited year.
Dimension rating = A
(iii) Follow up on audit recommendations
This dimension is concerned with management response to management letters and audit reports.
After the audit is completed, CoT management prepares a Management Letter Action Plan (MLAP),
which lists all the audit findings with actions to be taken to prevent similar findings in future reports.
Next to each finding is a commitment date indicating by when the action should have been completed.
This MLAP is monitored by internal audit and a progress report on actions taken is submitted to the
Audit Committee. Despite this process, the AG notes that repeat audit findings are raised year after
year on SCM, revenue, assets etc., indicating that corrective measures are not carried out in a
systematic or timely fashion.
Dimension rating = C
PI-26 Scoring Method M1
Scope, nature and follow-up of external audit
C+
(i) Scope/nature of audit performed (incl. adherence to auditing standards)
A CoT is audited annually, covering revenue, expenditure, assets and liabilities. Financial and performance audits are integrated. Financial and compliance audits follow international standards, and focus on systemic issues.
(ii) Timeliness of submission of audit reports to the legislature
A An audit report was submitted to the Council by 30 September each year, as required by the Act.
(iii) Evidence of follow-up on audit recommendations
C A formal response is made in a timely manner, but corrective measures are not systematic or timely.

58
PI-27: Legislative (Council) scrutiny of the annual budget law
(i) Scope of the legislature’s (Council’s) scrutiny
The budget approval process is detailed in PI-11, above, and as can be seen, committee hearings
begin in February. Draft proposals are tabled in March before a period of stakeholder consultation.
The committee reports and stakeholder comments are then reported to the Council, which then
reviews the details of revenue and expenditure estimates, a medium term expenditure framework, a
medium term sector and fiscal policies including the impact of the changes in the new tax policy
proposals, and adopts the budget before the start of the financial year. The overall time available for
the full Council to the review the budget (which has comprehensive documentation, as can be seen in
PI-6) is approximately three months.
Dimension rating = A
(ii) Extent to which the legislature’s (Council’s) procedures are well-established and respected
The CoT Council has clear organisation and set of rules (‘Standing Orders’, issued in compliance with
the requirements of the MFMA) and these are adhered to: the time available, firstly for committee
reports and stakeholder comments, then for the full Council review allow for meaningful inputs to be
made in the debates, which are public and the media report on them.
Dimension rating = A
(iii) Adequacy of time for the legislature (Council) to provide a response to budget proposals
The Member of the Mayoral Committee for Finance tables the main original budget estimates in
March each year. These estimates are reviewed, and the head of each Council department is invited
to provide clarifications where necessary. The approved submissions are finally presented as
Appropriations, which are passed by Council resolution before the start of the financial year (on 1st
July), which means that the Council has had a period of three months to review the budget
documents and expenditure estimates.
Dimension rating = A
(iv) Rules for in-year amendments to the budget without ex-ante approval by the legislature (Council)
Clear rules exist for in-year amendments to the budget without the ex-ante approval of the Council are
defined in the MFMA, and the reports of the Auditor-General note no deviation from these
requirements. These adjustments are presented in January to the Council.
Dimension rating = A
PI-27 Scoring Method M1
Legislative scrutiny of the annual budget law
A
(i) Scope of the Council’s scrutiny
A The Council review covers the details of revenue and expenditure estimates, a medium term expenditure framework, a medium term sector and fiscal policies including the impact of the changes in the new tax policy proposals.
(ii) Extent to which the Council’s procedures are well-established and respected
A The Council’s powers are set out in the MFMA. The Standing Orders are adhered to.
(iii) Adequacy of time for the Council to provide a response to budget proposals (time allowed in practice for all stages combined)
A The Council is involved both at the beginning and at the end of the budget preparation. The combined time available to review the budget documentation is in excess of three months.
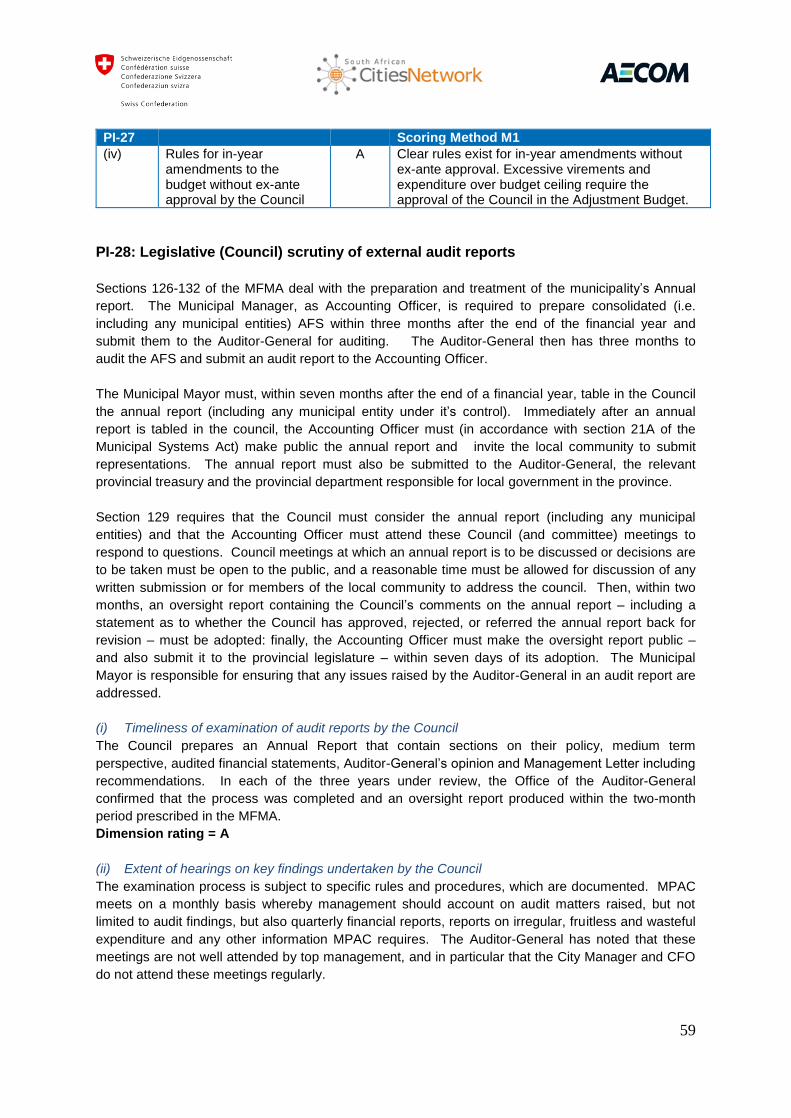
59
PI-27 Scoring Method M1
(iv) Rules for in-year amendments to the budget without ex-ante approval by the Council
A Clear rules exist for in-year amendments without ex-ante approval. Excessive virements and expenditure over budget ceiling require the approval of the Council in the Adjustment Budget.
PI-28: Legislative (Council) scrutiny of external audit reports
Sections 126-132 of the MFMA deal with the preparation and treatment of the municipality’s Annual
report. The Municipal Manager, as Accounting Officer, is required to prepare consolidated (i.e.
including any municipal entities) AFS within three months after the end of the financial year and
submit them to the Auditor-General for auditing. The Auditor-General then has three months to
audit the AFS and submit an audit report to the Accounting Officer.
The Municipal Mayor must, within seven months after the end of a financial year, table in the Council
the annual report (including any municipal entity under it’s control). Immediately after an annual
report is tabled in the council, the Accounting Officer must (in accordance with section 21A of the
Municipal Systems Act) make public the annual report and invite the local community to submit
representations. The annual report must also be submitted to the Auditor-General, the relevant
provincial treasury and the provincial department responsible for local government in the province.
Section 129 requires that the Council must consider the annual report (including any municipal
entities) and that the Accounting Officer must attend these Council (and committee) meetings to
respond to questions. Council meetings at which an annual report is to be discussed or decisions are
to be taken must be open to the public, and a reasonable time must be allowed for discussion of any
written submission or for members of the local community to address the council. Then, within two
months, an oversight report containing the Council’s comments on the annual report – including a
statement as to whether the Council has approved, rejected, or referred the annual report back for
revision – must be adopted: finally, the Accounting Officer must make the oversight report public –
and also submit it to the provincial legislature – within seven days of its adoption. The Municipal
Mayor is responsible for ensuring that any issues raised by the Auditor-General in an audit report are
addressed.
(i) Timeliness of examination of audit reports by the Council
The Council prepares an Annual Report that contain sections on their policy, medium term
perspective, audited financial statements, Auditor-General’s opinion and Management Letter including
recommendations. In each of the three years under review, the Office of the Auditor-General
confirmed that the process was completed and an oversight report produced within the two-month
period prescribed in the MFMA. Dimension rating = A
(ii) Extent of hearings on key findings undertaken by the Council
The examination process is subject to specific rules and procedures, which are documented. MPAC
meets on a monthly basis whereby management should account on audit matters raised, but not
limited to audit findings, but also quarterly financial reports, reports on irregular, fruitless and wasteful
expenditure and any other information MPAC requires. The Auditor-General has noted that these
meetings are not well attended by top management, and in particular that the City Manager and CFO
do not attend these meetings regularly.
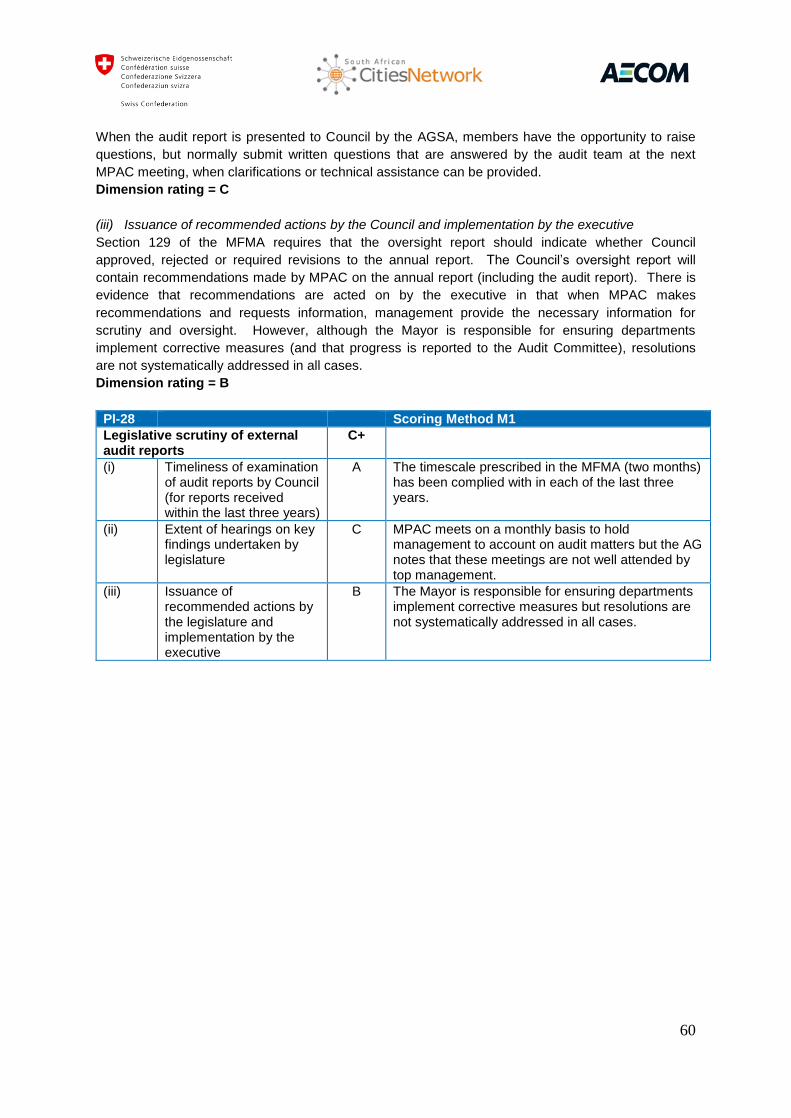
60
When the audit report is presented to Council by the AGSA, members have the opportunity to raise
questions, but normally submit written questions that are answered by the audit team at the next
MPAC meeting, when clarifications or technical assistance can be provided.
Dimension rating = C
(iii) Issuance of recommended actions by the Council and implementation by the executive
Section 129 of the MFMA requires that the oversight report should indicate whether Council
approved, rejected or required revisions to the annual report. The Council’s oversight report will
contain recommendations made by MPAC on the annual report (including the audit report). There is
evidence that recommendations are acted on by the executive in that when MPAC makes
recommendations and requests information, management provide the necessary information for
scrutiny and oversight. However, although the Mayor is responsible for ensuring departments
implement corrective measures (and that progress is reported to the Audit Committee), resolutions
are not systematically addressed in all cases.
Dimension rating = B
PI-28 Scoring Method M1
Legislative scrutiny of external audit reports
C+
(i) Timeliness of examination of audit reports by Council (for reports received within the last three years)
A The timescale prescribed in the MFMA (two months) has been complied with in each of the last three years.
(ii) Extent of hearings on key findings undertaken by legislature
C MPAC meets on a monthly basis to hold management to account on audit matters but the AG notes that these meetings are not well attended by top management.
(iii) Issuance of recommended actions by the legislature and implementation by the executive
B The Mayor is responsible for ensuring departments implement corrective measures but resolutions are not systematically addressed in all cases.
61
4. Government reform process
Introduction
The Government of South Africa has a continuing agenda of PFM reform. Current programmes are
focused on areas of weakness that have been identified by the National Treasury and development
partners. Major objectives are to: (1) improve procurement and human resource management
processes, internal controls, and systems; (2) better integrate cash planning to procurement and
performance plans, and cash and debt management to a commitments calendar and contractor
management and deliverables; (3) adoption of a comprehensive commitment control framework, so as
to enable departments and service delivery units non-salary expenditures to better align within the
available budget resources allocated for the remainder of the year; (4) consolidate and strengthen the
country’s public procurement system; and (5) overall capacity building and training programmes
targeting both finance officials and line managers.
Section 6(2) of the PFMA prescribes that the National Treasury must determine uniform treasury
norms and standards. To this end the reforms implemented by the CoT mainly consist of
reforms that are designed and planned on a national basis for implementation across all
spheres of government; and
CoT-specific reforms that are, in line with the National Treasury reforms, designed, planned
and implemented by the CoT itself.
Reforms
The CoT has bought into and participates in the PFM reforms formulated, inducted and overseen by
the NT. Broadly speaking, the South African PFM reform programme consists of the following
pillars:
a) Safer financial sector. The NT issued a policy document that aims to improve the
regulation and stability of the financial sector in South Africa. This is believed to serve as an
enabler of economic growth, job creation, infrastructure development and sustainable
development. The policy document focuses on four priorities, namely, financial stability;
consumer protection and market conduct; expanding access through financial inclusion; and
combating financial crime.
b) Refining the Medium Term Expenditure Framework (MTEF) Guidelines. The NT
continuously refines the MTEF guidelines. Although they are guidelines for the medium term,
they are issued annually for each new MTEF. The CoT uses these MTEF guidelines to align
its own priorities before departments are requested to make their budget inputs.
c) Framework for Strategic Plans and Annual Performance Plans. In August 2010, the NT
issued a framework for strategic plans and annual performance plans for national and provincial
government. This framework, amongst other things, requires national and provincial governments
to align their new infrastructure plans with local government IDPs. The CoT in its IDP and budget
preparation process ensures that national and provincial government are consulted to align the
programmes and projects of the different spheres (see budget calendar in PI-11).
62
The increased emphasis on the reporting on performance against the plan, including the
auditing thereof since 2011/12, has resulted in the NT more closely scrutinising performance
reports. In CoT, the Corporate Services Department performs this function to ensure greater
linkages between plans, budgets and performance reports.
d) Uniform Programme and Budget Structures. The Guide for the Format of the Estimates of
Revenue and Expenditure is updated annually and forms the basis for communicating an
institution’s budget to a wide range of stakeholders, which include the citizens of CoT, the
general public of the country, researchers and the international community. It further provides
valuable insight into the priority areas of CoT, focuses on resource allocation and attempts to
capture the main outputs these funds are buying. The standardised format provides a basis to
compare information. It aims to establish a degree of stability, while at the same time
focusing on improving the quality and consistency of budget documents across government.
The format gives a snapshot of the socio-economic and demographic profile of CoT in the
context of government priorities. It provides an overview of the CoT budget, budget process
and discusses current and anticipated medium term budget trends. The overview of Revenue
and Expenditure offers a detailed analysis of the CoT’s receipt and payment performance,
covering infrastructure and transfers to municipal entities.
Estimates of Revenue and Expenditure allows departments to compile and communicate their
budgets, provides current and anticipated medium term budget trends, provides an overview
of departmental estimates based on the standardised budget and programme structures for
a particular sector, focuses on strategic service delivery and gives a high level overview of
performance measures and targets.
e) Standard Chart of Accounts. In line with section 216 of the Constitution, as well as the MFMA,
that prescribes generally recognized accounting practice and uniform expenditure classifications
and to enable the NT to, in accordance with the PFMA, compile national accounts incorporating
all three spheres of government, the NT in 2013 initiated a project for a standard chart of
accounts to ensure uniformity and quality of information. The CoT actively participates in this
project.
Public sector capacity building
The NT has embarked on a comprehensive public sector capacity building exercise that consists of
var ious initiatives. The three initiatives described below are relevant to the CoT:
a) Municipal Finance Management Technical Assistance Programme. The Municipal
Finance Management Technical Assistance Programme (MFMTAP) seeks to assist in the
strengthening of operational capacity in municipalities. It provides technical assistance in
implementing municipal financial management reforms. Through the programme, advisors are
placed in municipalities. Additionally, roving advisors are allocated to provincial treasuries to
assist provinces in performing their role in respect of the MFMA. Currently the area of supply
chain management is being targeted while expert consultants are placed in municipalities to
update policies and streamline processes, not only to ensure compliance to legislation, but
also to ensure that the supply chain management process does not impact negatively on
service delivery.

63
b) Financial Management Improvement Programme III. FMIP III provides a national
perspective to address financial management capacity constraints in the public sector. The
challenges include scarce skills; high levels of vacancies and staff turnover; a lack of suitable
education, training and development programmes; limited knowledge management; ineffective
performance management; non-adherence to legislation; poor audit results; and an absence
of effective partnerships. The strategy sets out the four strategic objectives listed below to
address these challenges:
Support the development of an enabling environment;
Enhance organisational capacity;
Develop and empower a corps of competent and committed high-performance employees;
Create an environment that enables and sustains mutually beneficial stakeholder
relationships.
This capacity development programme is essentially geared towards building financial
management capacity. It draws on the successes and lessons learnt from FMIP II, as well as
the conceptual tools that emanated from the feasibility study for this continuous capacity
development programme for PFM and focuses on six areas, namely:
An enabling PFM institutional environment developed and maintained within the three
spheres of government.
Enhanced organisational PFM capacity developed within the three spheres of government.
An empowered and sustained PFM corps of competent and committed employees
throughout the three spheres of government.
An environment to sustain mutually beneficial stakeholder relationships within the PFM
domain.
Increased PFM capacity within Provincial Governments.
Increased PFM capacity within Local Governments.
c) Municipal Finance Management Programme. The Minister of Finance issued a regulation in
2007 that prescribes minimum competency levels for accounting officers, chief financial officers,
senior managers in line departments, finance officials and supply chain management officials
within local government. This is the basis of the MFMP that aims to build capacity and assist
these managers and officials to meet these minimum competency levels. To date approximately
7,500 managers and officials have successfully completed the programme.
64
Annexes
ANNEX A Documents consulted ANNEX B People interviewed ANNEX C Responsibilities assigned to Municipalities by the Constitution ANNEX D Calculations for PI-1 & 2 ANNEX E Summary of ratings

65
ANNEX A
DOCUMENTS CONSULTED
1 Legislation and Regulations
Acts Constitution of the Republic 1996
Public Finance Management Act 1999, and Amendment Act 1999 Municipal Finance Management Act 2003 Intergovernmental Fiscal Relations Act 1997 Municipal Structures Act 1998, and Amendment Act, 2003 Municipal Systems Act 2000, and Amendment Act 2003 Municipal Property Rates Act 2004 Intergovernmental Relations Framework Act 2005 Municipal Fiscal Powers and Functions Act 2007 Division of Revenue Act 2014
Regulations
Municipal Regulations on SCOA 2014 Municipal Regulations on SCM 2005 Municipal Regulations on Debt Disclosure 2007 Municipal Investment Regulations 2005 DORA Schedules (various)
Circulars issued under MFMA
– 1, 2, 13, 54, 55, 56, 57, 58, 60, 61, 62, 63, 65, 66, 67, 68, 69, 70, 71, 72, 73, 74 2 City of Tshwane Metropolitan Municipality
AFS:- 2011-12 & 2012-13 audited; 2013-14 (unaudited) Consolidated AFS:- 2011-12 & 2012-13 audited; 2013-14 (unaudited) Annual Report:- 2011-12; 2012-13 Adopted Budget:- 2011-12; 2012-13; 2013-14; 2014-15 IPD:- 2012-13; 2014-15 ‘Section 71’ reports (various) Accounting Policies SDBIP:- 2011-12; 2012-13; 2013-14; 2014-15
3 Office of the Auditor General
Audit reports on City of Tshwane Metropolitan Municipality:- 2011-12; 2012-13 4 Other
Review Of The Local Government Equitable Share Formula (presentation and report to Parliament, 19 February 2013)

66
ANNEX B
OFFICIALS INTERVIEWED
Division Contact Person
Revenue
Ronny Shilenge
Chris Thipe
Mishack Ngobeni
Mathoto Mabitje
Supply Chain Management Bongani Mntambo
Moroka Kaotsane
Treasury and Support Services Antoinette van Zyl
Max van Heerden
Expenditure Tommy Ngwenya
Budget Office Jonathan Patrick
Larry van Zyl
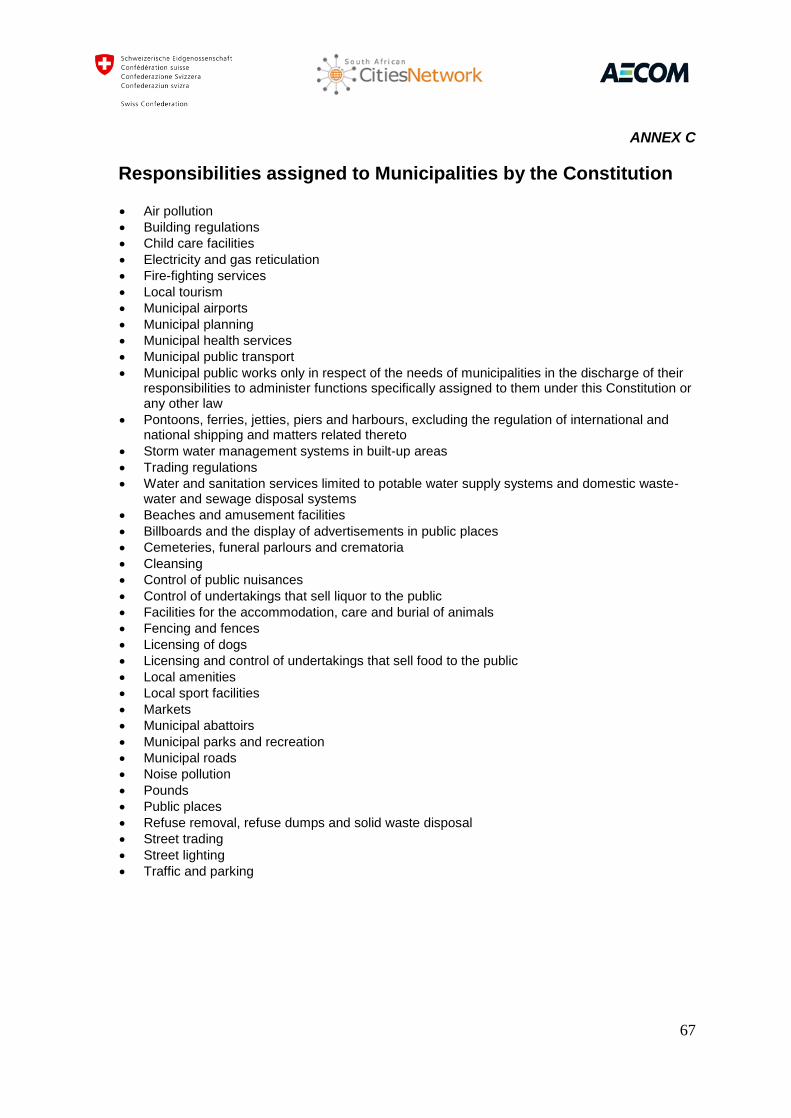
67
ANNEX C
Responsibilities assigned to Municipalities by the Constitution
Air pollution
Building regulations
Child care facilities
Electricity and gas reticulation
Fire-fighting services
Local tourism
Municipal airports
Municipal planning
Municipal health services
Municipal public transport
Municipal public works only in respect of the needs of municipalities in the discharge of their responsibilities to administer functions specifically assigned to them under this Constitution or any other law
Pontoons, ferries, jetties, piers and harbours, excluding the regulation of international and national shipping and matters related thereto
Storm water management systems in built-up areas
Trading regulations
Water and sanitation services limited to potable water supply systems and domestic waste-water and sewage disposal systems
Beaches and amusement facilities
Billboards and the display of advertisements in public places
Cemeteries, funeral parlours and crematoria
Cleansing
Control of public nuisances
Control of undertakings that sell liquor to the public
Facilities for the accommodation, care and burial of animals
Fencing and fences
Licensing of dogs
Licensing and control of undertakings that sell food to the public
Local amenities
Local sport facilities
Markets
Municipal abattoirs
Municipal parks and recreation
Municipal roads
Noise pollution
Pounds
Public places
Refuse removal, refuse dumps and solid waste disposal
Street trading
Street lighting
Traffic and parking
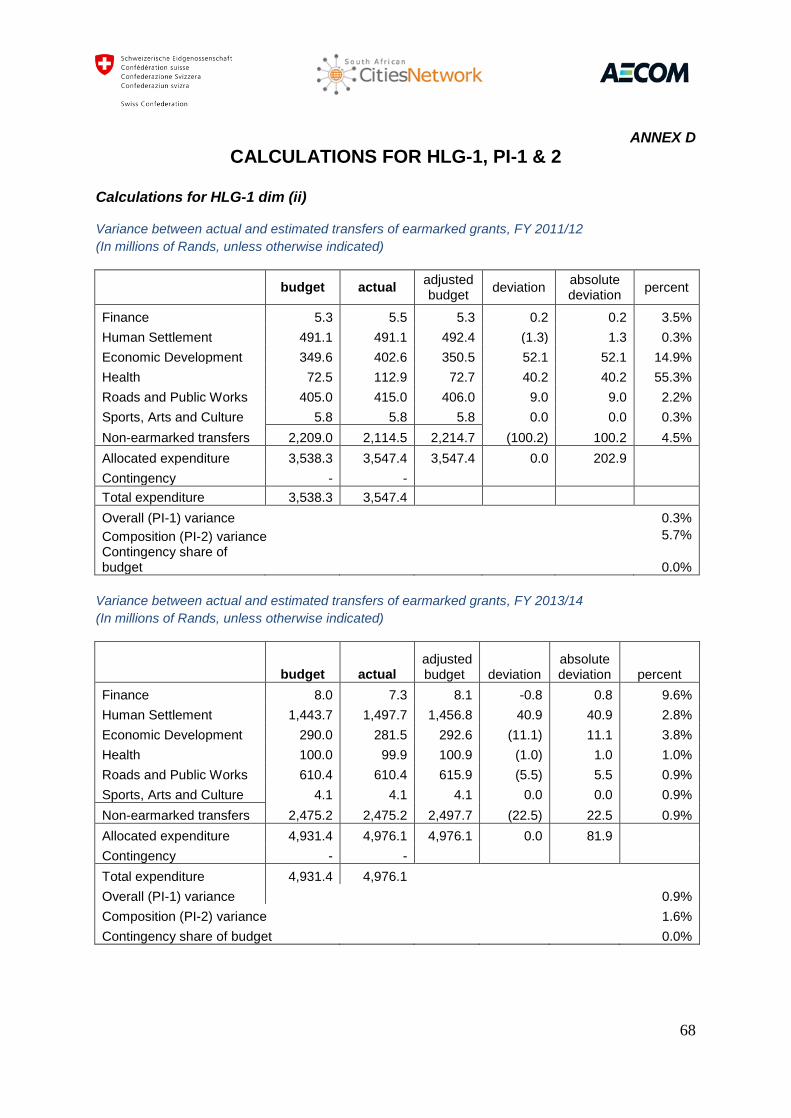
68
ANNEX D
CALCULATIONS FOR HLG-1, PI-1 & 2 Calculations for HLG-1 dim (ii)
Variance between actual and estimated transfers of earmarked grants, FY 2011/12
(In millions of Rands, unless otherwise indicated)
budget actual
adjusted budget
deviation absolute deviation
percent
Finance 5.3 5.5 5.3 0.2 0.2 3.5%
Human Settlement 491.1 491.1 492.4 (1.3) 1.3 0.3%
Economic Development 349.6 402.6 350.5 52.1 52.1 14.9%
Health 72.5 112.9 72.7 40.2 40.2 55.3%
Roads and Public Works 405.0 415.0 406.0 9.0 9.0 2.2%
Sports, Arts and Culture 5.8 5.8 5.8 0.0 0.0 0.3%
Non-earmarked transfers 2,209.0 2,114.5 2,214.7 (100.2) 100.2 4.5%
Allocated expenditure 3,538.3 3,547.4 3,547.4 0.0 202.9 Contingency - -
Total expenditure 3,538.3 3,547.4 Overall (PI-1) variance
0.3%
Composition (PI-2) variance 5.7%
Contingency share of budget
0.0%
Variance between actual and estimated transfers of earmarked grants, FY 2013/14
(In millions of Rands, unless otherwise indicated)
budget actual
adjusted budget deviation
absolute deviation percent
Finance 8.0 7.3 8.1 -0.8 0.8 9.6%
Human Settlement 1,443.7 1,497.7 1,456.8 40.9 40.9 2.8%
Economic Development 290.0 281.5 292.6 (11.1) 11.1 3.8%
Health 100.0 99.9 100.9 (1.0) 1.0 1.0%
Roads and Public Works 610.4 610.4 615.9 (5.5) 5.5 0.9%
Sports, Arts and Culture 4.1 4.1 4.1 0.0 0.0 0.9%
Non-earmarked transfers 2,475.2 2,475.2 2,497.7 (22.5) 22.5 0.9%
Allocated expenditure 4,931.4 4,976.1 4,976.1 0.0 81.9 Contingency - -
Total expenditure 4,931.4 4,976.1 Overall (PI-1) variance
0.9%
Composition (PI-2) variance
1.6%
Contingency share of budget
0.0%
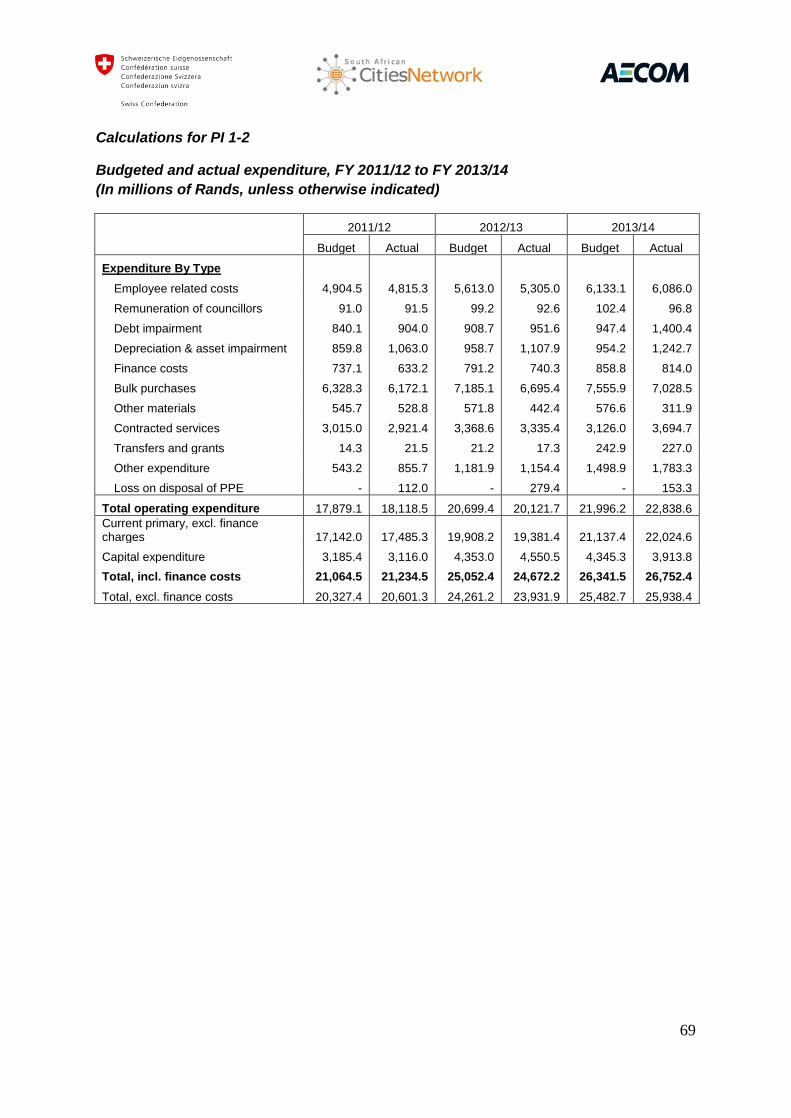
69
Calculations for PI 1-2
Budgeted and actual expenditure, FY 2011/12 to FY 2013/14
(In millions of Rands, unless otherwise indicated)
2011/12 2012/13 2013/14
Budget Actual Budget Actual Budget Actual
Expenditure By Type
Employee related costs 4,904.5 4,815.3 5,613.0 5,305.0 6,133.1 6,086.0
Remuneration of councillors 91.0 91.5 99.2 92.6 102.4 96.8
Debt impairment 840.1 904.0 908.7 951.6 947.4 1,400.4
Depreciation & asset impairment 859.8 1,063.0 958.7 1,107.9 954.2 1,242.7
Finance costs 737.1 633.2 791.2 740.3 858.8 814.0
Bulk purchases 6,328.3 6,172.1 7,185.1 6,695.4 7,555.9 7,028.5
Other materials 545.7 528.8 571.8 442.4 576.6 311.9
Contracted services 3,015.0 2,921.4 3,368.6 3,335.4 3,126.0 3,694.7
Transfers and grants 14.3 21.5 21.2 17.3 242.9 227.0
Other expenditure 543.2 855.7 1,181.9 1,154.4 1,498.9 1,783.3
Loss on disposal of PPE - 112.0 - 279.4 - 153.3
Total operating expenditure 17,879.1 18,118.5 20,699.4 20,121.7 21,996.2 22,838.6
Current primary, excl. finance charges 17,142.0 17,485.3 19,908.2 19,381.4 21,137.4 22,024.6
Capital expenditure 3,185.4 3,116.0 4,353.0 4,550.5 4,345.3 3,913.8
Total, incl. finance costs 21,064.5 21,234.5 25,052.4 24,672.2 26,341.5 26,752.4
Total, excl. finance costs 20,327.4 20,601.3 24,261.2 23,931.9 25,482.7 25,938.4

70
Composition of budget execution by vote, FY 2011/12
(In millions of Rands, unless otherwise indicated)
budget actual
adjusted budget
deviation absolute deviation
percent
Office of the City Manager 252.4 344.2 255.8 88.4 88.4 34.6%
Office of the Executive Manager - - - - - -
Office of the Speaker - - - - - -
Corporate and Shared Services 2,529.6 3,321,6 2,546.7 757.9 757.9 29.6%
Environmental Management 1,351.9 1,312.9 1,370.1 -57.2 57.2 4.2%
Financial Services 396.2 445.7 401.5 44.2 44.2 11.0%
Health and Social Development 325.3 207.7 329.7 -122.0 122.0 37.0%
Housing and Human Settlement 987.6 980.3 1,000.9 -20.6 20.6 2.1%
Metro Police Services 1,104.9 1,007.9 1,119.8 -111.9 111.9 10.0%
Regional Service Delivery - - - - - -
Service Infrastructure: Electricity* 10,265.9 9,753.2 10,404.2 -651.0 651.0 6.3%
Service Infrastructure: Water and Sanitation - - - - - -
Transport 2,120.5 1,868.6 2,149.1 -280.5 280.5 13.1%
Others 993.1 1,359.2 1,006.5 352.7 352.7 35.0%
Allocated expenditure 20,327.4 20,601.3 20,601.3 - 2,486.4
Contingency - - Total expenditure 20,327.4 20,601.3
Overall (PI-1) variance
1.3%
Composition (PI-2) variance 12.1%
Contingency share of budget
0.0%
*Includes water and sanitation
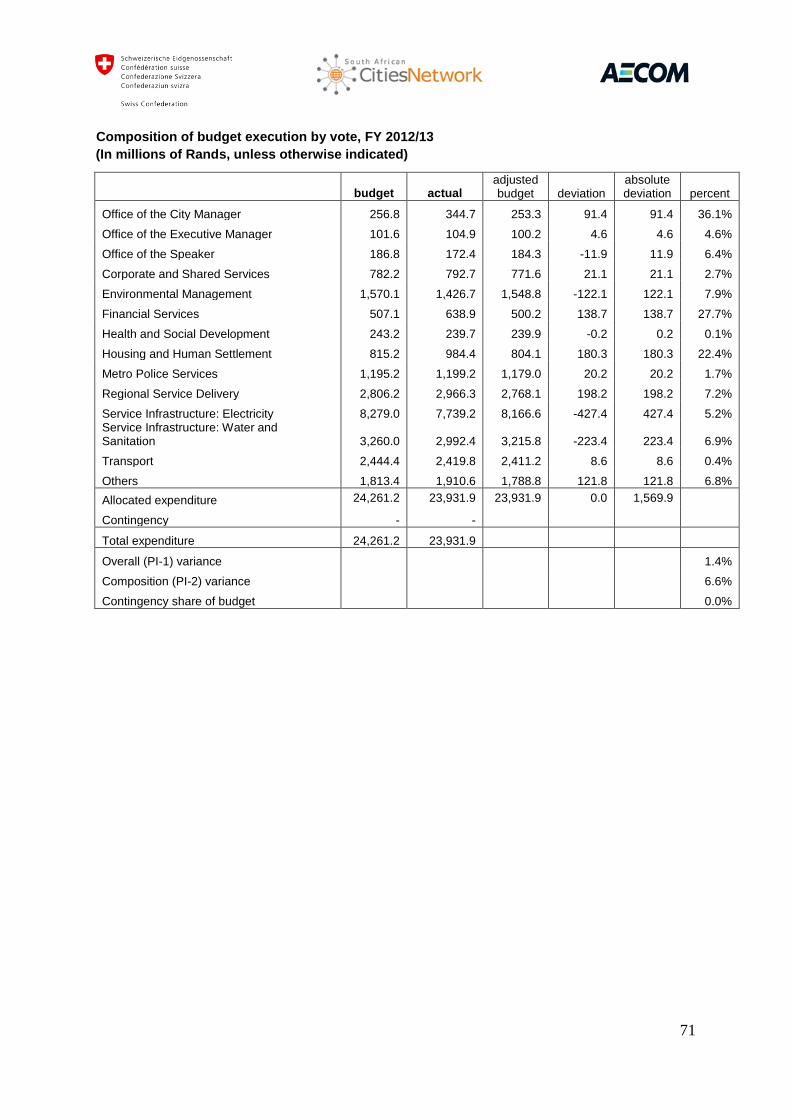
71
Composition of budget execution by vote, FY 2012/13
(In millions of Rands, unless otherwise indicated)
budget actual adjusted budget deviation
absolute deviation percent
Office of the City Manager 256.8 344.7 253.3 91.4 91.4 36.1%
Office of the Executive Manager 101.6 104.9 100.2 4.6 4.6 4.6%
Office of the Speaker 186.8 172.4 184.3 -11.9 11.9 6.4%
Corporate and Shared Services 782.2 792.7 771.6 21.1 21.1 2.7%
Environmental Management 1,570.1 1,426.7 1,548.8 -122.1 122.1 7.9%
Financial Services 507.1 638.9 500.2 138.7 138.7 27.7%
Health and Social Development 243.2 239.7 239.9 -0.2 0.2 0.1%
Housing and Human Settlement 815.2 984.4 804.1 180.3 180.3 22.4%
Metro Police Services 1,195.2 1,199.2 1,179.0 20.2 20.2 1.7%
Regional Service Delivery 2,806.2 2,966.3 2,768.1 198.2 198.2 7.2%
Service Infrastructure: Electricity 8,279.0 7,739.2 8,166.6 -427.4 427.4 5.2% Service Infrastructure: Water and Sanitation 3,260.0 2,992.4 3,215.8 -223.4 223.4 6.9%
Transport 2,444.4 2,419.8 2,411.2 8.6 8.6 0.4%
Others 1,813.4 1,910.6 1,788.8 121.8 121.8 6.8%
Allocated expenditure 24,261.2 23,931.9 23,931.9 0.0 1,569.9
Contingency - -
Total expenditure 24,261.2 23,931.9
Overall (PI-1) variance
1.4%
Composition (PI-2) variance
6.6%
Contingency share of budget
0.0%
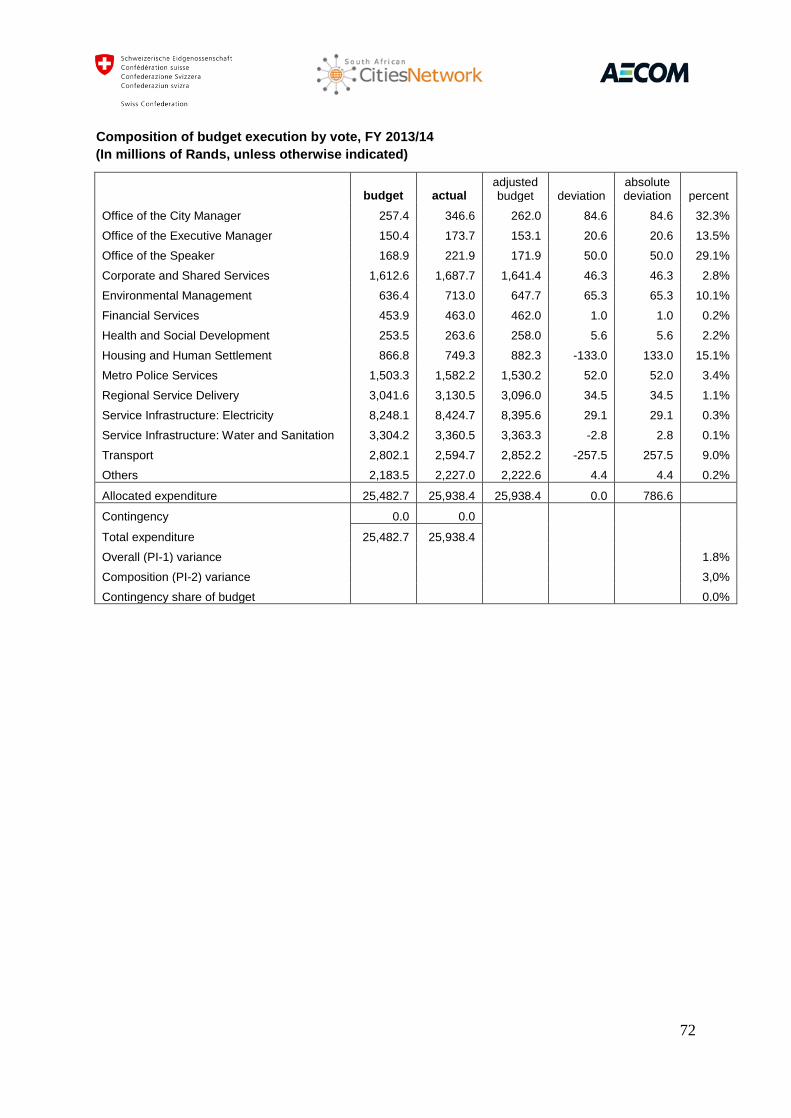
72
Composition of budget execution by vote, FY 2013/14
(In millions of Rands, unless otherwise indicated)
budget actual adjusted budget deviation
absolute deviation percent
Office of the City Manager 257.4 346.6 262.0 84.6 84.6 32.3%
Office of the Executive Manager 150.4 173.7 153.1 20.6 20.6 13.5%
Office of the Speaker 168.9 221.9 171.9 50.0 50.0 29.1%
Corporate and Shared Services 1,612.6 1,687.7 1,641.4 46.3 46.3 2.8%
Environmental Management 636.4 713.0 647.7 65.3 65.3 10.1%
Financial Services 453.9 463.0 462.0 1.0 1.0 0.2%
Health and Social Development 253.5 263.6 258.0 5.6 5.6 2.2%
Housing and Human Settlement 866.8 749.3 882.3 -133.0 133.0 15.1%
Metro Police Services 1,503.3 1,582.2 1,530.2 52.0 52.0 3.4%
Regional Service Delivery 3,041.6 3,130.5 3,096.0 34.5 34.5 1.1%
Service Infrastructure: Electricity 8,248.1 8,424.7 8,395.6 29.1 29.1 0.3%
Service Infrastructure: Water and Sanitation 3,304.2 3,360.5 3,363.3 -2.8 2.8 0.1%
Transport 2,802.1 2,594.7 2,852.2 -257.5 257.5 9.0%
Others 2,183.5 2,227.0 2,222.6 4.4 4.4 0.2%
Allocated expenditure 25,482.7 25,938.4 25,938.4 0.0 786.6
Contingency 0.0 0.0
Total expenditure 25,482.7 25,938.4
Overall (PI-1) variance
1.8%
Composition (PI-2) variance
3,0%
Contingency share of budget
0.0%
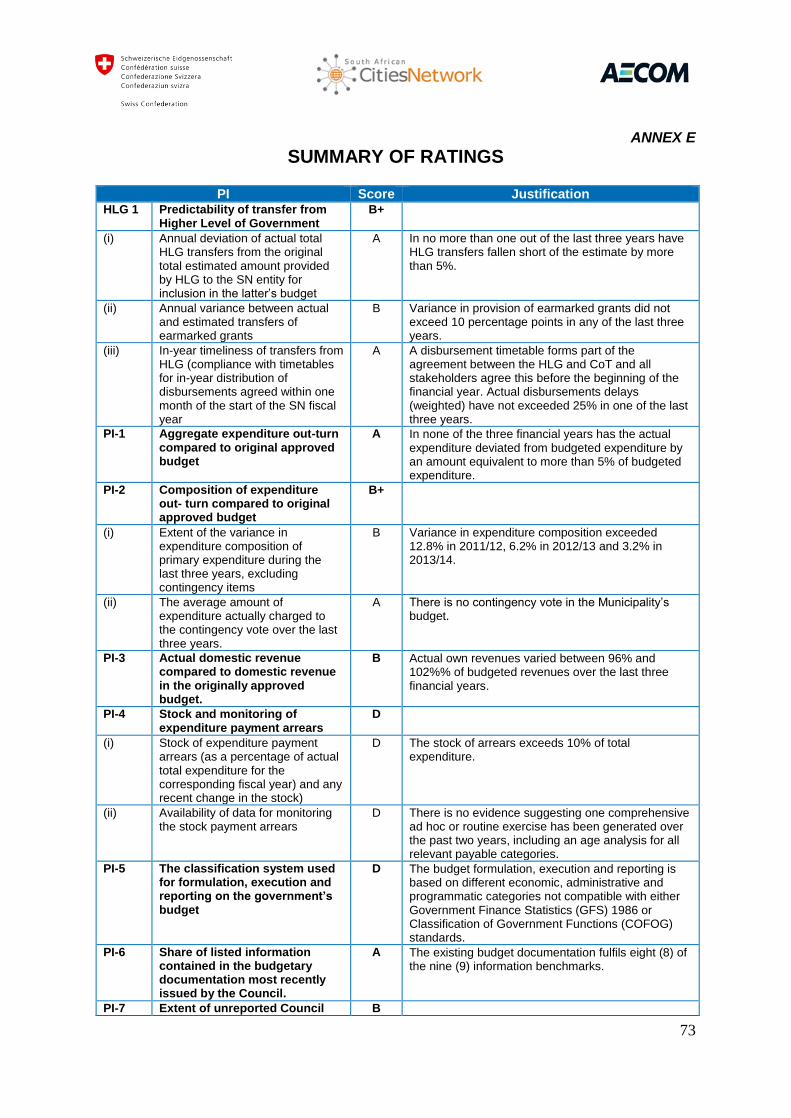
73
ANNEX E
SUMMARY OF RATINGS
PI Score Justification HLG 1 Predictability of transfer from
Higher Level of Government B+
(i) Annual deviation of actual total HLG transfers from the original total estimated amount provided by HLG to the SN entity for inclusion in the latter’s budget
A In no more than one out of the last three years have HLG transfers fallen short of the estimate by more than 5%.
(ii) Annual variance between actual and estimated transfers of earmarked grants
B Variance in provision of earmarked grants did not exceed 10 percentage points in any of the last three years.
(iii) In-year timeliness of transfers from HLG (compliance with timetables for in-year distribution of disbursements agreed within one month of the start of the SN fiscal year
A A disbursement timetable forms part of the agreement between the HLG and CoT and all stakeholders agree this before the beginning of the financial year. Actual disbursements delays (weighted) have not exceeded 25% in one of the last three years.
PI-1 Aggregate expenditure out-turn compared to original approved budget
A In none of the three financial years has the actual expenditure deviated from budgeted expenditure by an amount equivalent to more than 5% of budgeted expenditure.
PI-2 Composition of expenditure out- turn compared to original approved budget
B+
(i) Extent of the variance in expenditure composition of primary expenditure during the last three years, excluding contingency items
B Variance in expenditure composition exceeded 12.8% in 2011/12, 6.2% in 2012/13 and 3.2% in 2013/14.
(ii) The average amount of expenditure actually charged to the contingency vote over the last three years.
A There is no contingency vote in the Municipality’s budget.
PI-3 Actual domestic revenue compared to domestic revenue in the originally approved budget.
B Actual own revenues varied between 96% and 102%% of budgeted revenues over the last three financial years.
PI-4 Stock and monitoring of expenditure payment arrears
D
(i) Stock of expenditure payment arrears (as a percentage of actual total expenditure for the corresponding fiscal year) and any recent change in the stock)
D The stock of arrears exceeds 10% of total expenditure.
(ii) Availability of data for monitoring the stock payment arrears
D There is no evidence suggesting one comprehensive ad hoc or routine exercise has been generated over the past two years, including an age analysis for all relevant payable categories.
PI-5 The classification system used for formulation, execution and reporting on the government’s budget
D The budget formulation, execution and reporting is based on different economic, administrative and programmatic categories not compatible with either Government Finance Statistics (GFS) 1986 or Classification of Government Functions (COFOG) standards.
PI-6 Share of listed information contained in the budgetary documentation most recently issued by the Council.
A The existing budget documentation fulfils eight (8) of the nine (9) information benchmarks.
PI-7 Extent of unreported Council B

74
operations
(i) Level of extra-budgetary expenditure (other than donors funded projects) which is unreported i.e. not included in fiscal reports.
B The level of unreported extra-budgetary expenditure (other than donor-funded projects) constitutes between 1% and 5% of total expenditure.
(ii) Information on income and expenditure in relation to projects financed by donors included in the fiscal reports.
NA
PI-8 Intergovernmental Fiscal Relations
NA
PI-9 Oversight of aggregate fiscal risk
B
(i) Extent of Council monitoring of municipal entities
B All three MEs do submit quarterly financial reports and annual audited accounts to the DFS, and scarce evidence on the consolidated suggests that monitoring of inherent fiscal risks by the CoT is incomplete and/or weak.
(ii) Extent of government monitoring of SN governments’ fiscal position
NA
PI-10 Public Access to key fiscal data A The Council makes available to the public (in a complete form) 5 of the 6 listed types of information.
PI-11 Orderliness and participation in the annual budget process
A
(i) Existence of, and adherence to, a fixed budget calendar
A A clear annual budget calendar exists, is generally adhered to and allows Departments five months from receipt of the budget circular to meaningfully complete their detailed estimates on time.
(ii) Clarity/comprehensiveness of and political involvement in guidance on the preparation of budget submissions
A The budget ceilings include both current and capital expenditure (or “payments for capital assets”) approved by the Council, at administrative unit level, together with general guidance on expenditure priorities.
(iii) Timely budget approval by the legislature within the last three years
A The CoT Council has, during the past three fiscal years, approved the budget before the start of the fiscal year.
PI-12 Multi-year perspective in fiscal planning, expenditure policy and budgeting
B
(i) Multi-year fiscal forecasts and functional allocations
A Setting of annual budget ceilings by the Municipality is prepared for administrative, program and main economic categories, and for the next budget year and a period of three years on a rolling basis. Programmatic structures in the budget represent the functional allocations.
(ii) Scope and frequency of debt sustainability analysis
A Each year, CoT conducts an extensive analysis of its financial position, including the measurement of cash and debt. Any deviations from established norms are explained in the CFO’s report.
(iii) Existence of sector strategies with multi-year costing of recurrent and investment expenditure
C Costed strategies cover more sectors but are inconsistent with aggregate fiscal forecasts.
(iv) Linkages between investment budgets and forward expenditure estimates
C Public works and infrastructure plans exist for the responsible line departments and a budget is allocated for the provision of operating and maintenance. The problem for the most part lies on the capital projects planned for delivery being loosely tied to the forward operating and maintenance expenditure estimates.
PI-13 Transparency of Taxpayer Obligations and Liabilities
B

75
(i) Clarity and comprehensiveness of tax liabilities
A Legislation and procedures for the major own tax revenues i.e. electricity service charges and property rates are comprehensive and clear. In general, these obligations and liabilities are published to the general public.
(ii) Taxpayer access to information on tax liabilities and administrative procedures
C Taxpayers have access to comprehensive, user
friendly and up-to-date information on tax liabilities.
The availability and comprehensiveness of the
administrative procedures for some own tax
revenues are limited.
(iii) Existence and functioning of a tax appeals mechanism
C A tax appeal system of administrative procedures exists, but needs substantial redesign to be fair, transparent and effective.
PI-14 Effectiveness of measures for taxpayer registration and tax assessment
D+
(i) Controls in the taxpayer registration system
C Ratepayers are registered in a database system for individual purposes, which are not fully and consistently linked. There are no linkages between the various registration functions, but are supplemented by occasional surveys of potential ratepayers.
(ii) Effectiveness of penalties for non-compliance with registration and declaration obligations
C The provision for penalties against possible defaulters for rates and taxes and financial rules exist, but effectiveness is generally lacking due to weak administrative and internal control systems.
(iii) Planning and monitoring of tax audit and fraud investigation programmes
D An audit of rates and taxes has not taken place during the period under review.
PI-15 Effectiveness in collection of tax payments
NR
(i) Collection ratio for gross tax arrears, being the percentage of tax arrears at the beginning of a fiscal year, which was collected during that fiscal year (average of the last two fiscal years)
NR The data required to rate this dimension is not available.
(ii) Effectiveness of transfer of tax collections to the Treasury by the revenue administration
A All tax revenue is transferred to the Treasury daily.
(iii) Frequency of complete accounts reconciliation between tax assessments, collections, arrears records and receipts by the Treasury
A Complete reconciliation of tax assessments, collections, arrears and transfers to Treasury takes place daily.
PI-16 Predictability in the availability of funds for commitment of expenditures
C+
(i) Extent to which cash flows are forecast and monitored
A A cash flow forecast is prepared for the fiscal year, and are updated monthly on the basis of actual cash inflows and outflows.
(ii) Reliability and horizon of periodic in-year information to MDAs on ceilings for expenditure commitment
C Departments are provided reliable in-year information on ceilings for expenditure commitment ceilings for about two months in advance. In-year adjustments in budget allocations often vary as the forecasts are adjusted for the remaining of the year.
(iii) Frequency and transparency of adjustments to budget allocations which are decided above the level of management of MDAs
B In-year budget adjustments take place only once every year and are done in a fairly transparent manner. The arrangement of adjusting the budget is a pre-established process set out in the MFMA and a relatively well informed adjustment on budget ceilings process to commit expenditure within the limits set by the expenditure provision on each

76
major budget line. Adjustments vary often ostensibly across departments.
PI-17 Recording and management of cash balances, debt and guarantees
A
(i) Quality of debt data recording and reporting
A Debt records are complete, updated and reconciled
on a monthly basis with data considered of high
integrity. Comprehensive management and
statistical reports are produced monthly.
(ii) Extent of consolidation of the government’s cash balances
A All cash balances are calculated daily and
consolidated.
(iii) Systems for contracting loans and issuance of guarantees
B CoT doesn’t issue guarantees and its contracting of
loans are made within limits for total debt, and
always approved by Council.
PI-18 Effectiveness of payroll controls
D+
(i) Degree of integration and reconciliation between personnel records and payroll data
D Integrity of the payroll is significantly undermined by
lacking reconciliation between the payroll, the
personnel database and personnel records.
(ii) Timeliness of changes to personnel records and the payroll
D Delays in processing changes to payroll and
nominal roll are often significantly longer than three
months and require widespread retroactive
adjustments.
(iii) Internal control of changes to personnel records and the payroll
C Controls exist, but are not adequate to ensure full integrity of the data
(iv) Existence of payroll audits to identify control weaknesses and/or ghost workers
A The OAG conducts a complete Payroll Audit each year and no adverse comments were included in the report.
PI-19 Competition, value for money, and controls in procurement
D+
(i) Transparency, comprehensiveness and competition in the legal and regulatory framework
B CoT meets four of the six criteria for the legal and regulatory framework for procurement.
(ii) Use of competitive procurement methods
D Reliable data on deviations with reasons, from open competition, could not be provided.
(iii) Public access to complete, reliable and timely procurement information
C The CoT makes bidding opportunities and contracts awarded public.
(iv) Existence of an independent administrative procurement complaints system
D CoT does not have an independent procurement complaints review body.
PI-20 Effectiveness of internal controls for non-salary expenditure
C+
(i) Effectiveness of expenditure commitment controls
C Although SAP has in-built commitment control mechanisms, unauthorised expenditure is evident.
(ii) Comprehensiveness, relevance and understanding of other internal control rules/ procedures
B Internal controls are comprehensive and clearly spelt out in the MFMA, Treasury Regulations, Municipal accounting and internal control manuals, and in SOPs.
(iii) Degree of compliance with rules for processing and recording transactions
C The AG’s reports note concerns over the level of compliance with rules and procedures: however, there is general compliance in the majority of transactions.
PI-21 Effectiveness of internal audit C+
(i) Coverage and quality of the internal audit function
B Internal audit is operational, and focuses on processes. Internal audit manuals and procedures follow Institute of Internal Audit (IIA) standards.
(ii) Frequency and distribution of reports
A At the conclusion of each audit, a report is sent to the auditee, the CFO, and the Municipal Manager. In addition, a quarterly report is prepared for the Audit Committee, and this is copied to the Auditor-General.

77
(iii) Extent of management response to internal audit findings
C Management response to audit findings is limited, and not all managers respond to queries raised.
PI-22 Timeliness and regularity of accounts reconciliation
A
(i) Regularity of Bank reconciliations A All Municipal bank accounts are reconciled daily.
(ii) Regularity of reconciliation and clearance of suspense accounts and advances
A Cash advance to staff are acquitted monthly. Suspense accounts are reconciled each month. At the end of the financial year, all departmental suspense accounts are reconciled 30 days after the end of the fiscal year to allow for preparation of annual financial statements.
PI-23 Availability of information on resources received by service delivery units
A The SAP software and the chart of accounts allow financial information on resources in cash and kind, to be captured at the level of, for example, primary health clinics.
PI-24 Quality and timeliness of in-year budget reports
C+
(i) Scope of reports in terms of coverage and compatibility with budget estimates
C In-year budget execution reports (‘S71’) are prepared in accordance with the standardised reporting format specified in the MFMA and allow for easy budget analysis; however, the only payments are captured, not commitments.
(ii) Timeliness of the issue of reports A In-year budget reports are prepared on a monthly basis in accordance with the MFMA and submitted within 10 working days of the month end to the Executive Mayor, the National Treasury (in electronic format), and on a quarterly basis to Council: they are also published on the website.
(iii) Quality of information C The Auditor General has raised concerns about the quality of financial information; they do not compromise the general usefulness of the financial information.
PI-25 Quality and timeliness of annual financial statements
A
(i) Completeness of the financial statements
A The annual Consolidated Financial Statements include full information on revenue, expenditure, financial assets, and liabilities.
(ii) Timeliness of submission of the financial statements
A Consolidated Financial Statements are submitted to the Auditor General within 2 months of the end of the fiscal year, in accordance with the MFMA.
(iii) Accounting standards used A Tshwane’s AFS disclose and observe the financial reporting standards of the Accounting Standards Board of South Africa, based on IPSAS.
PI-26 Scope, nature and follow-up of external audit
C+
(i) Scope/nature of audit performed (incl. adherence to auditing standards)
A CoT is audited annually, covering revenue, expenditure, assets and liabilities. Financial and performance audits are integrated. Financial and compliance audits follow international standards, and focus on systemic issues.
(ii) Timeliness of submission of audit reports to the legislature
A An audit report was submitted to the Council by 30 September each year, as required by the Act.
(iii) Evidence of follow-up on audit recommendations
C A formal response is made in a timely manner, but corrective measures are not systematic or timely.
PI-27 Legislative scrutiny of the annual budget law
A
(i) Scope of the Council’s scrutiny A The Council review covers the details of revenue and expenditure estimates, a medium term expenditure framework, a medium term sector and fiscal policies including the impact of the changes in the new tax policy proposals.
(ii) Extent to which the Council’s procedures are well-established
A The Council’s powers are set out in the MFMA. The Standing Orders are adhered to.

78
and respected
(iii) Adequacy of time for the Council to provide a response to budget proposals (time allowed in practice for all stages combined)
A The Council is involved both at the beginning and at the end of the budget preparation. The combined time available to review the budget documentation is three months.
(iv) Rules for in-year amendments to the budget without ex-ante approval by the Council
A Clear rules exist for in-year amendments without ex-ante approval. Excessive virements and expenditure over budget ceiling require the approval of the Council in the Adjustment Budget.
PI-28 Legislative scrutiny of external audit reports
C+
(i) Timeliness of examination of audit reports by Council (for reports received within the last three years)
A The timescale prescribed in the MFMA (two months) has been complied with in each of the last three years.
(ii) Extent of hearings on key findings undertaken by legislature
C MPAC meets on a monthly basis to hold management to account on audit matters but the Auditor-General has noted that these meetings are not well attended by top management.
(iii) Issuance of recommended actions by the legislature and implementation by the executive
B The Mayor is responsible for ensuring that a department implements corrective measures, and that progress is reported to the Audit Committee.